
An Optimization-Driven Analysis Pipeline to Uncover Biomarkers and Signaling Paths: Cervix Cancer

Abstract
:
1. Introduction
2. Method
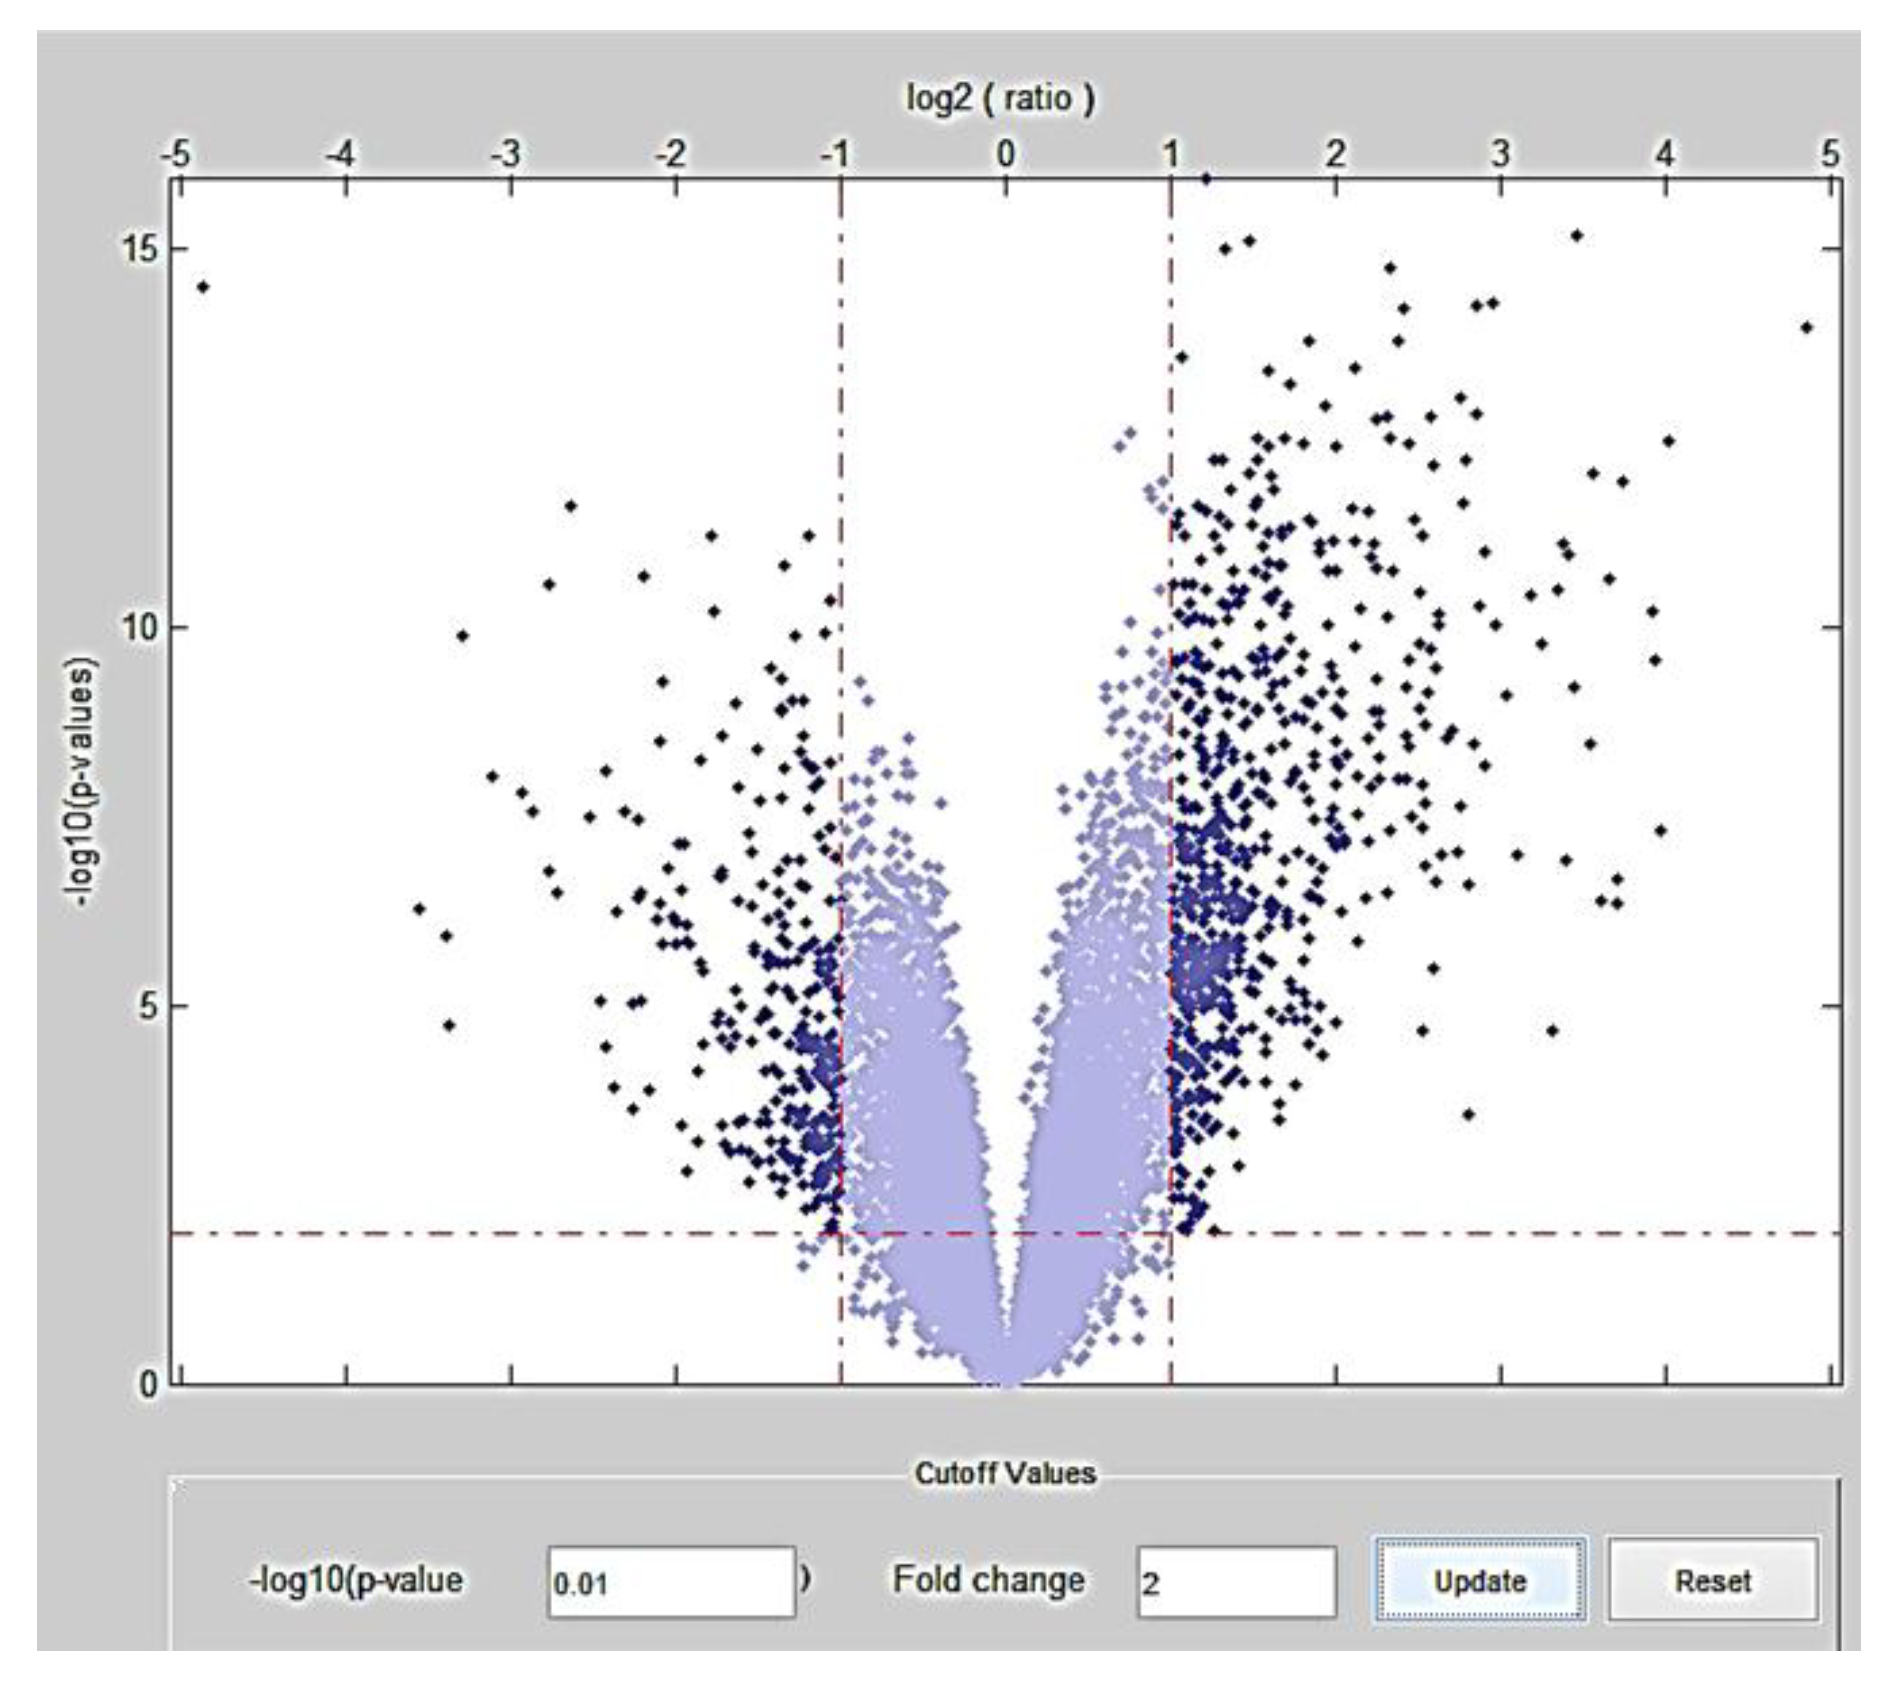
2.1. Stage 1: Meta-Analysis for Detection of Highly Differentially Expressed Genes
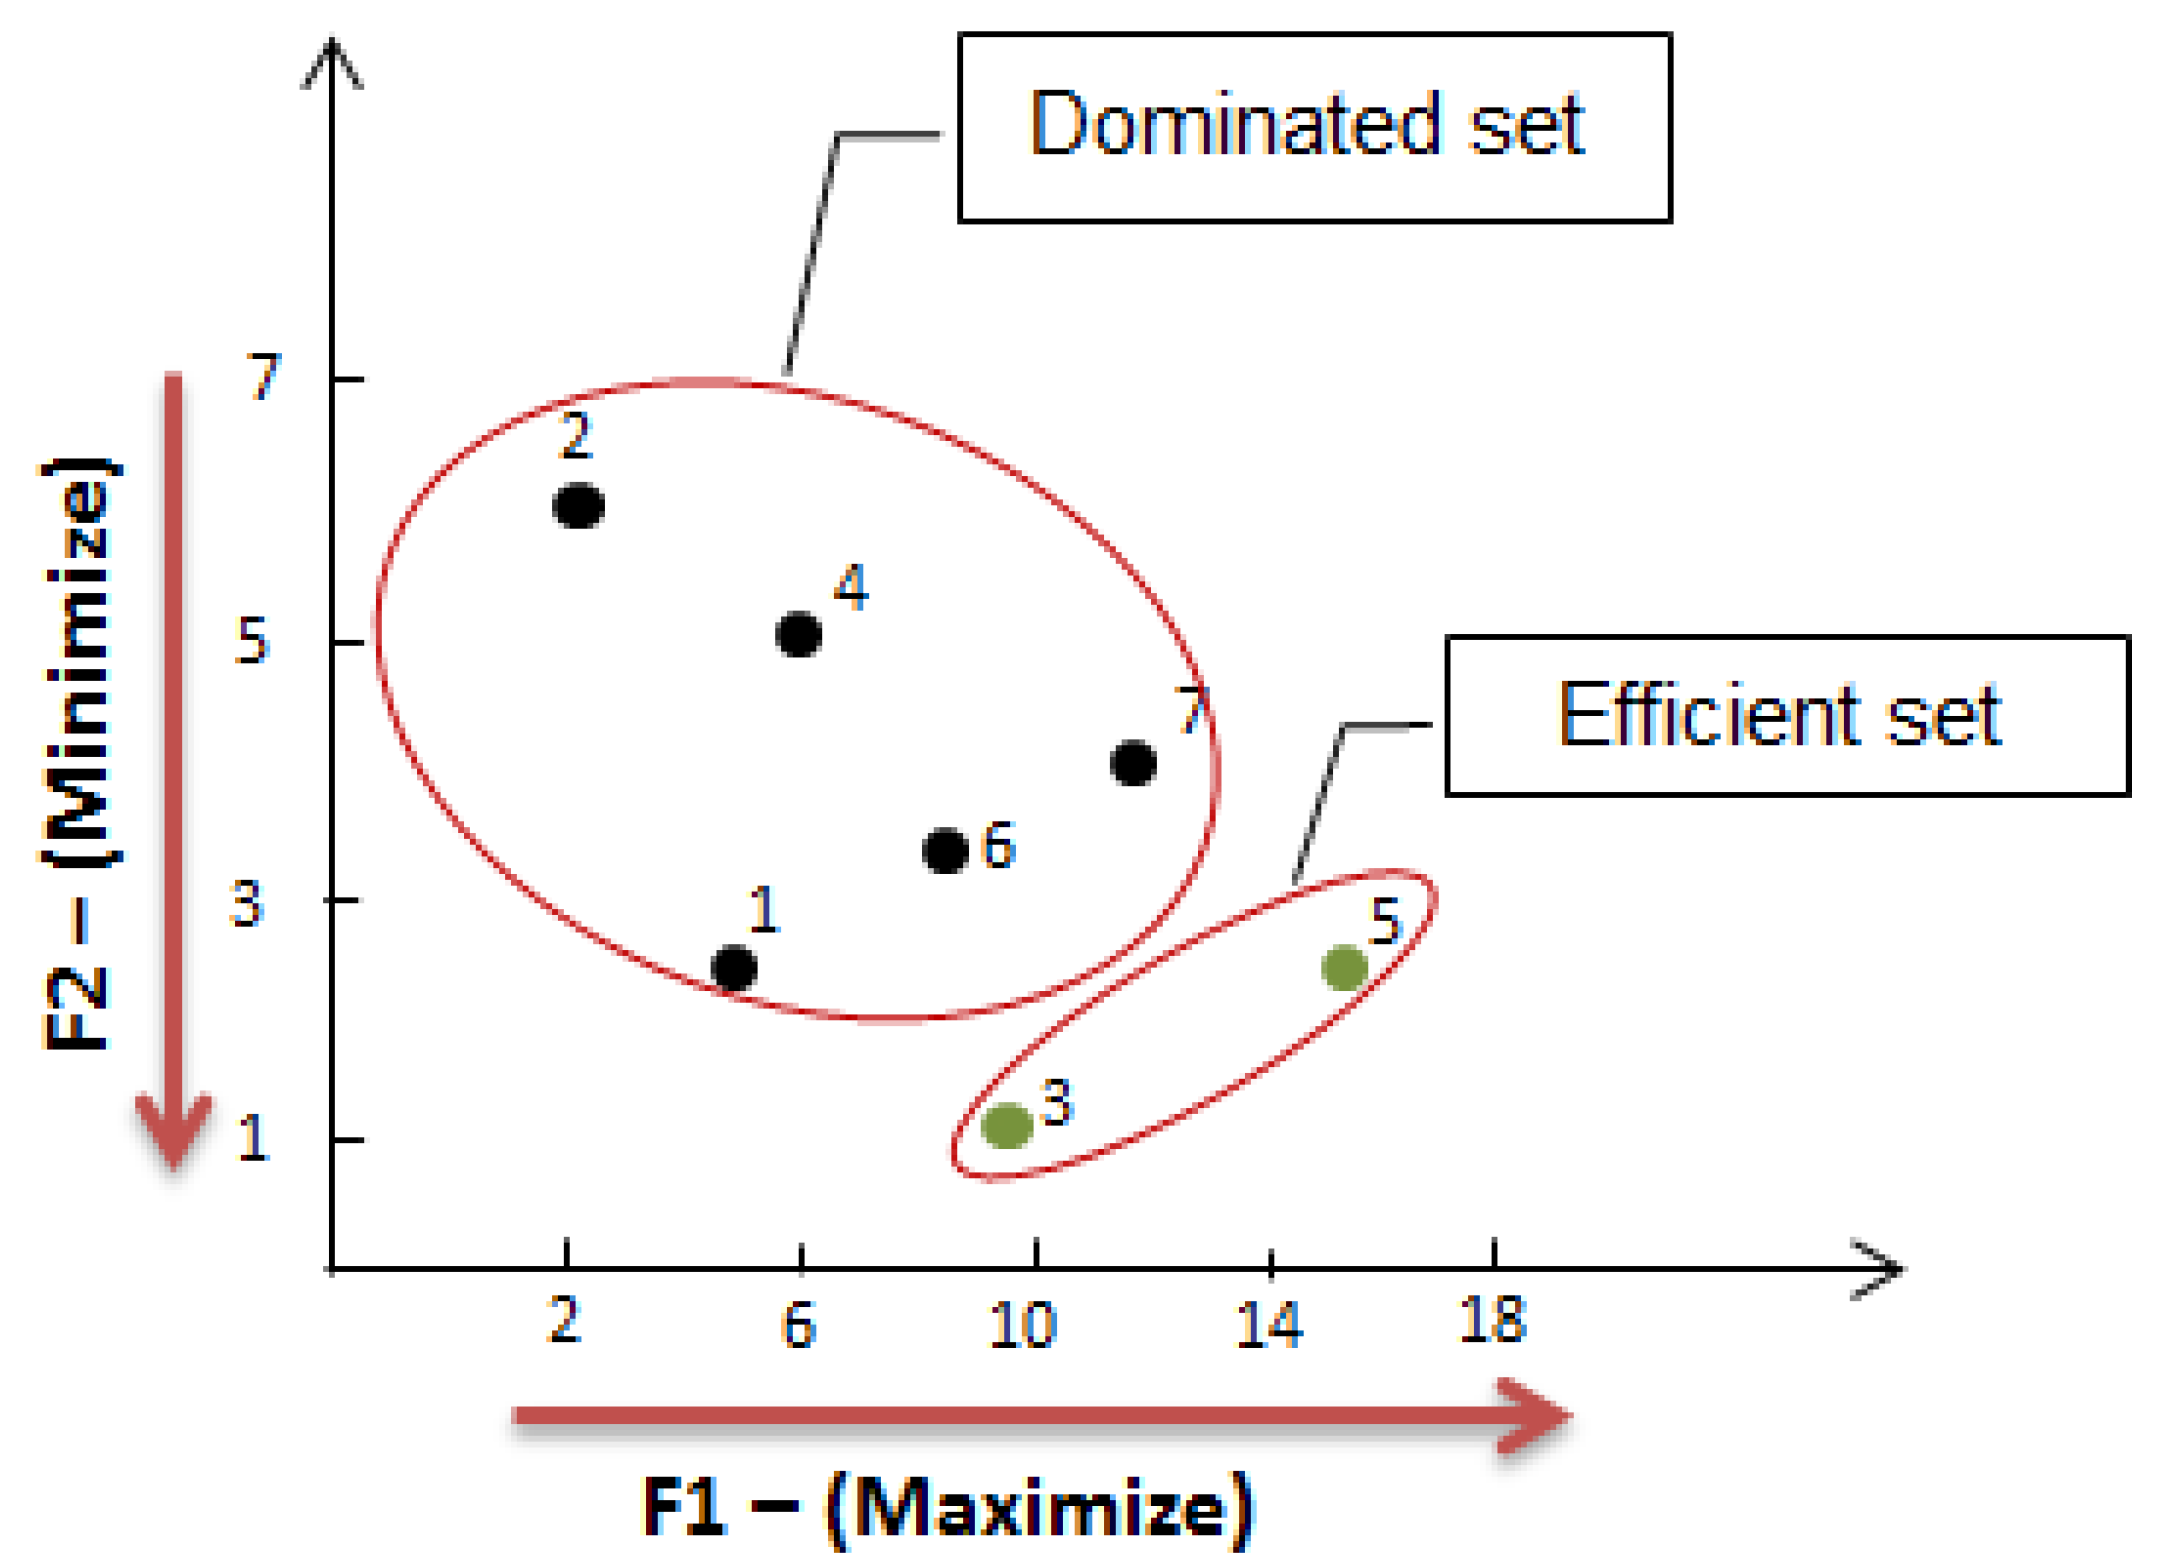
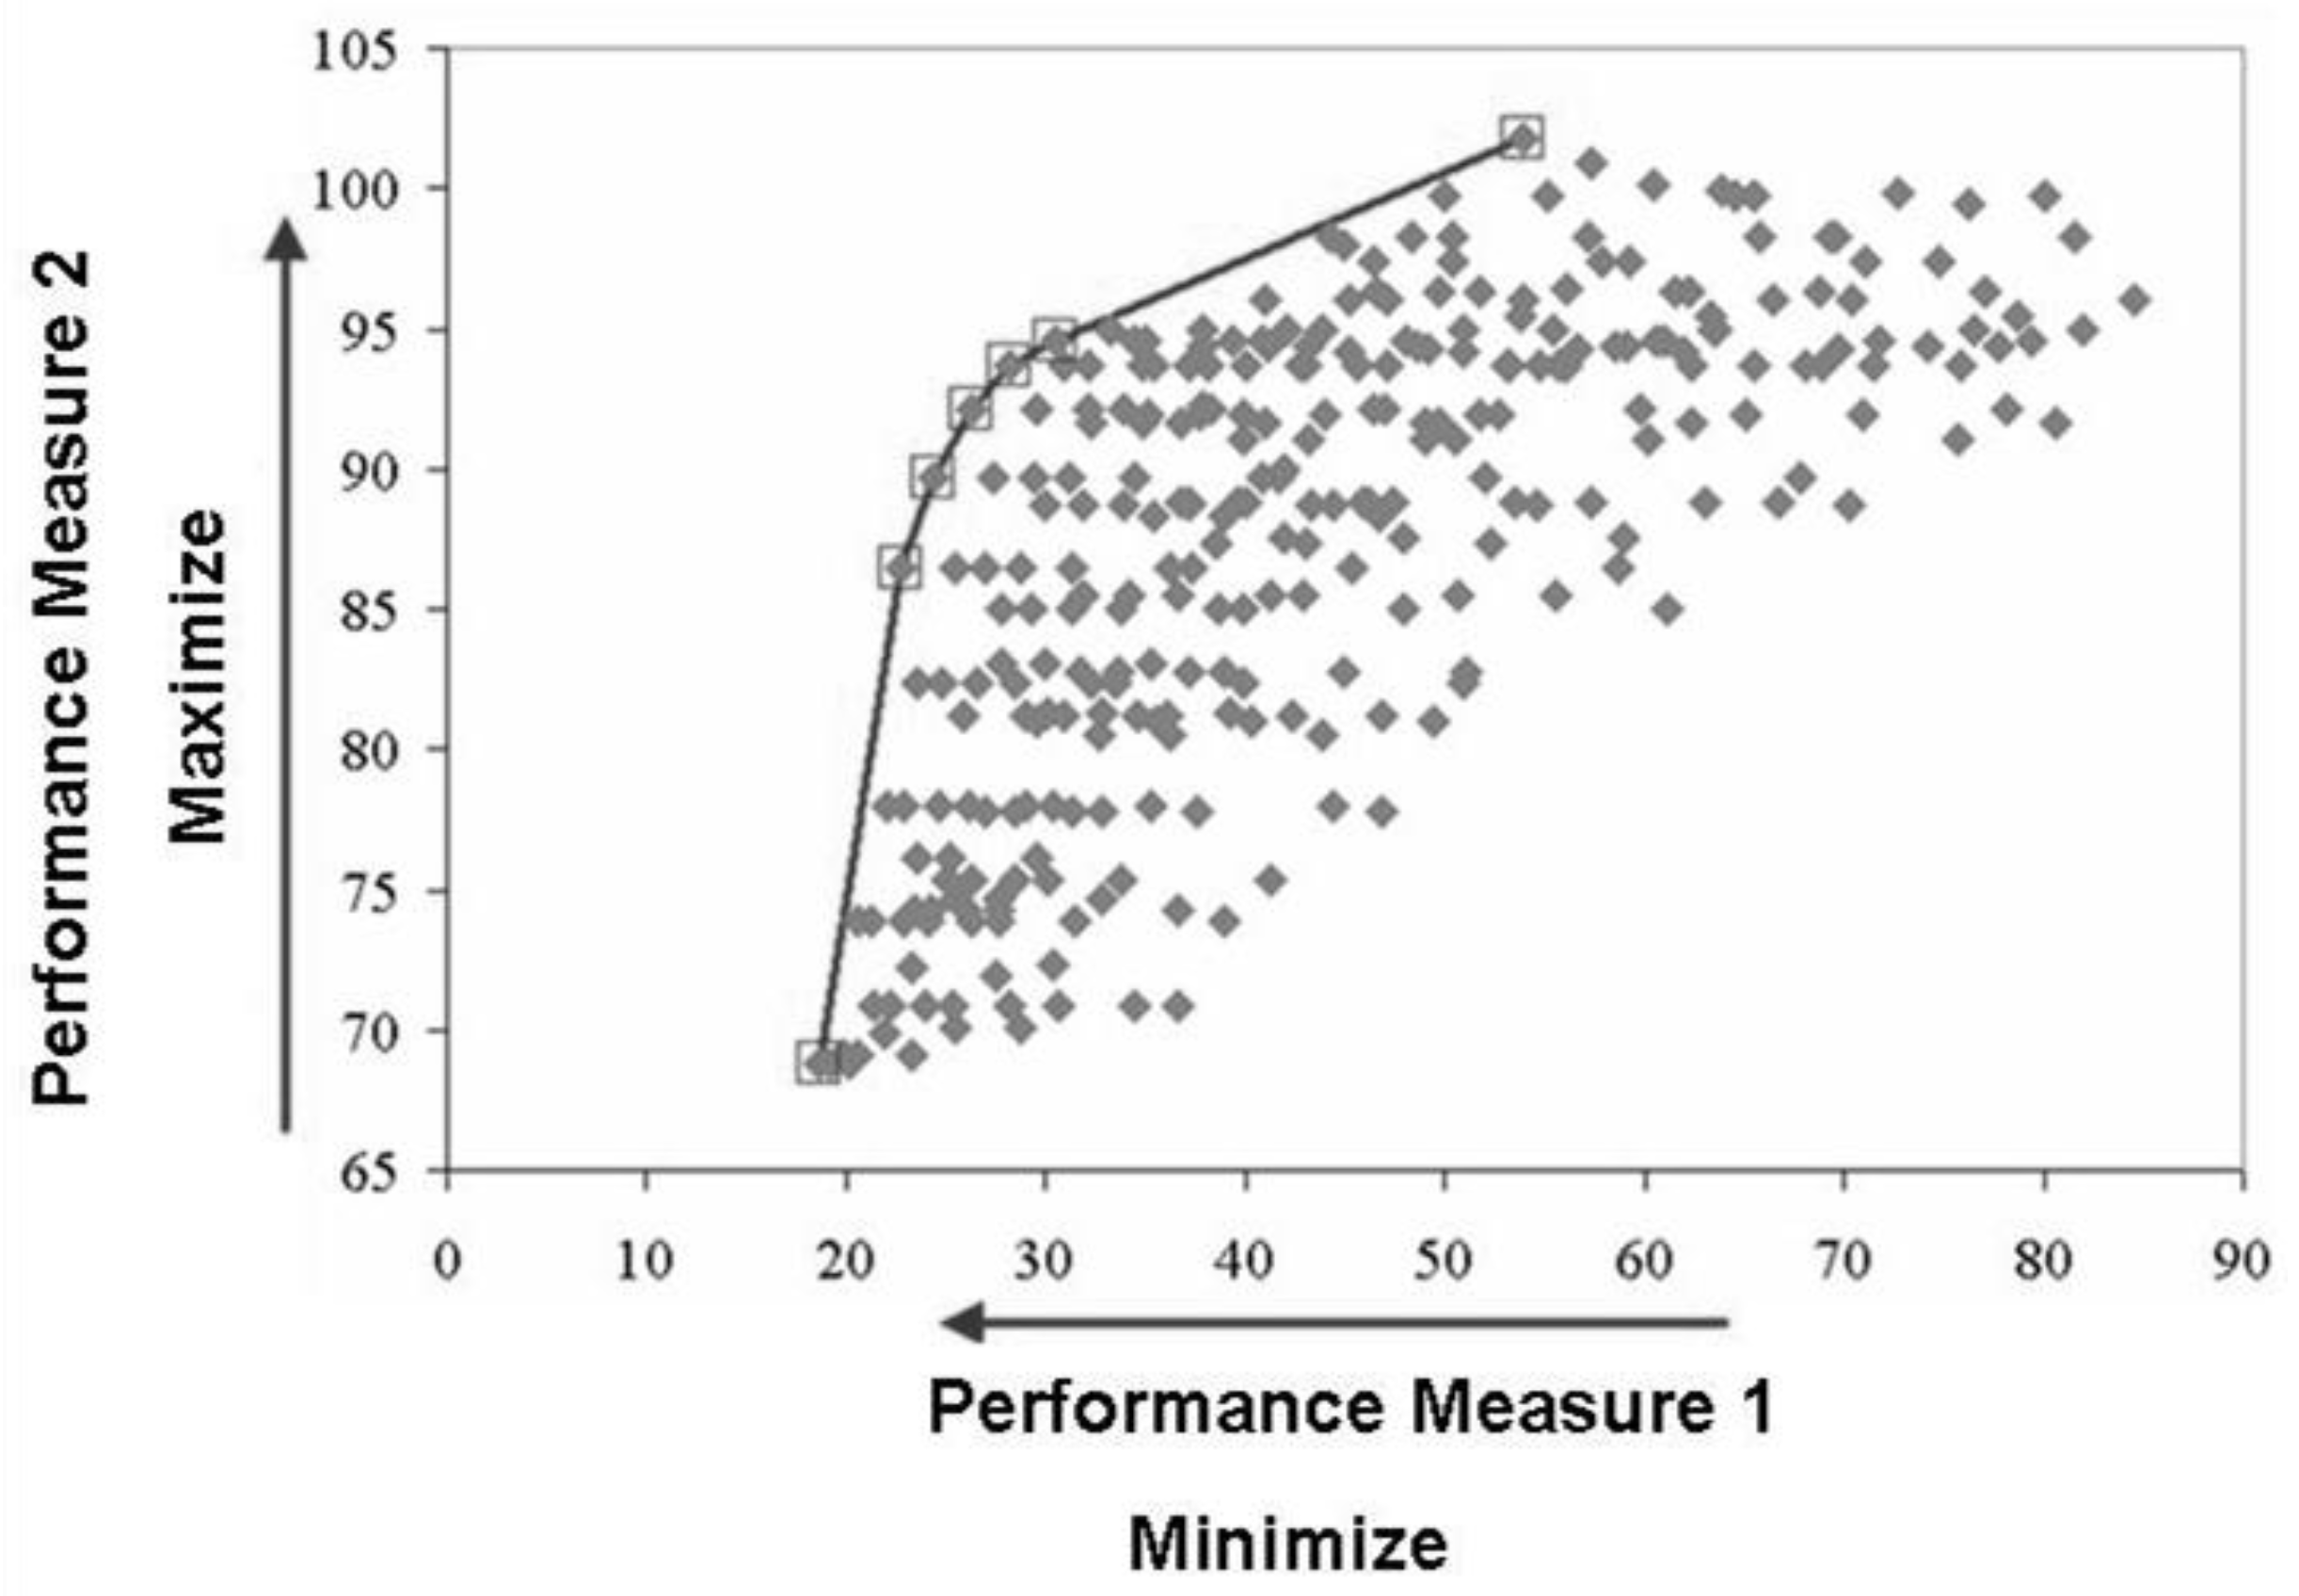
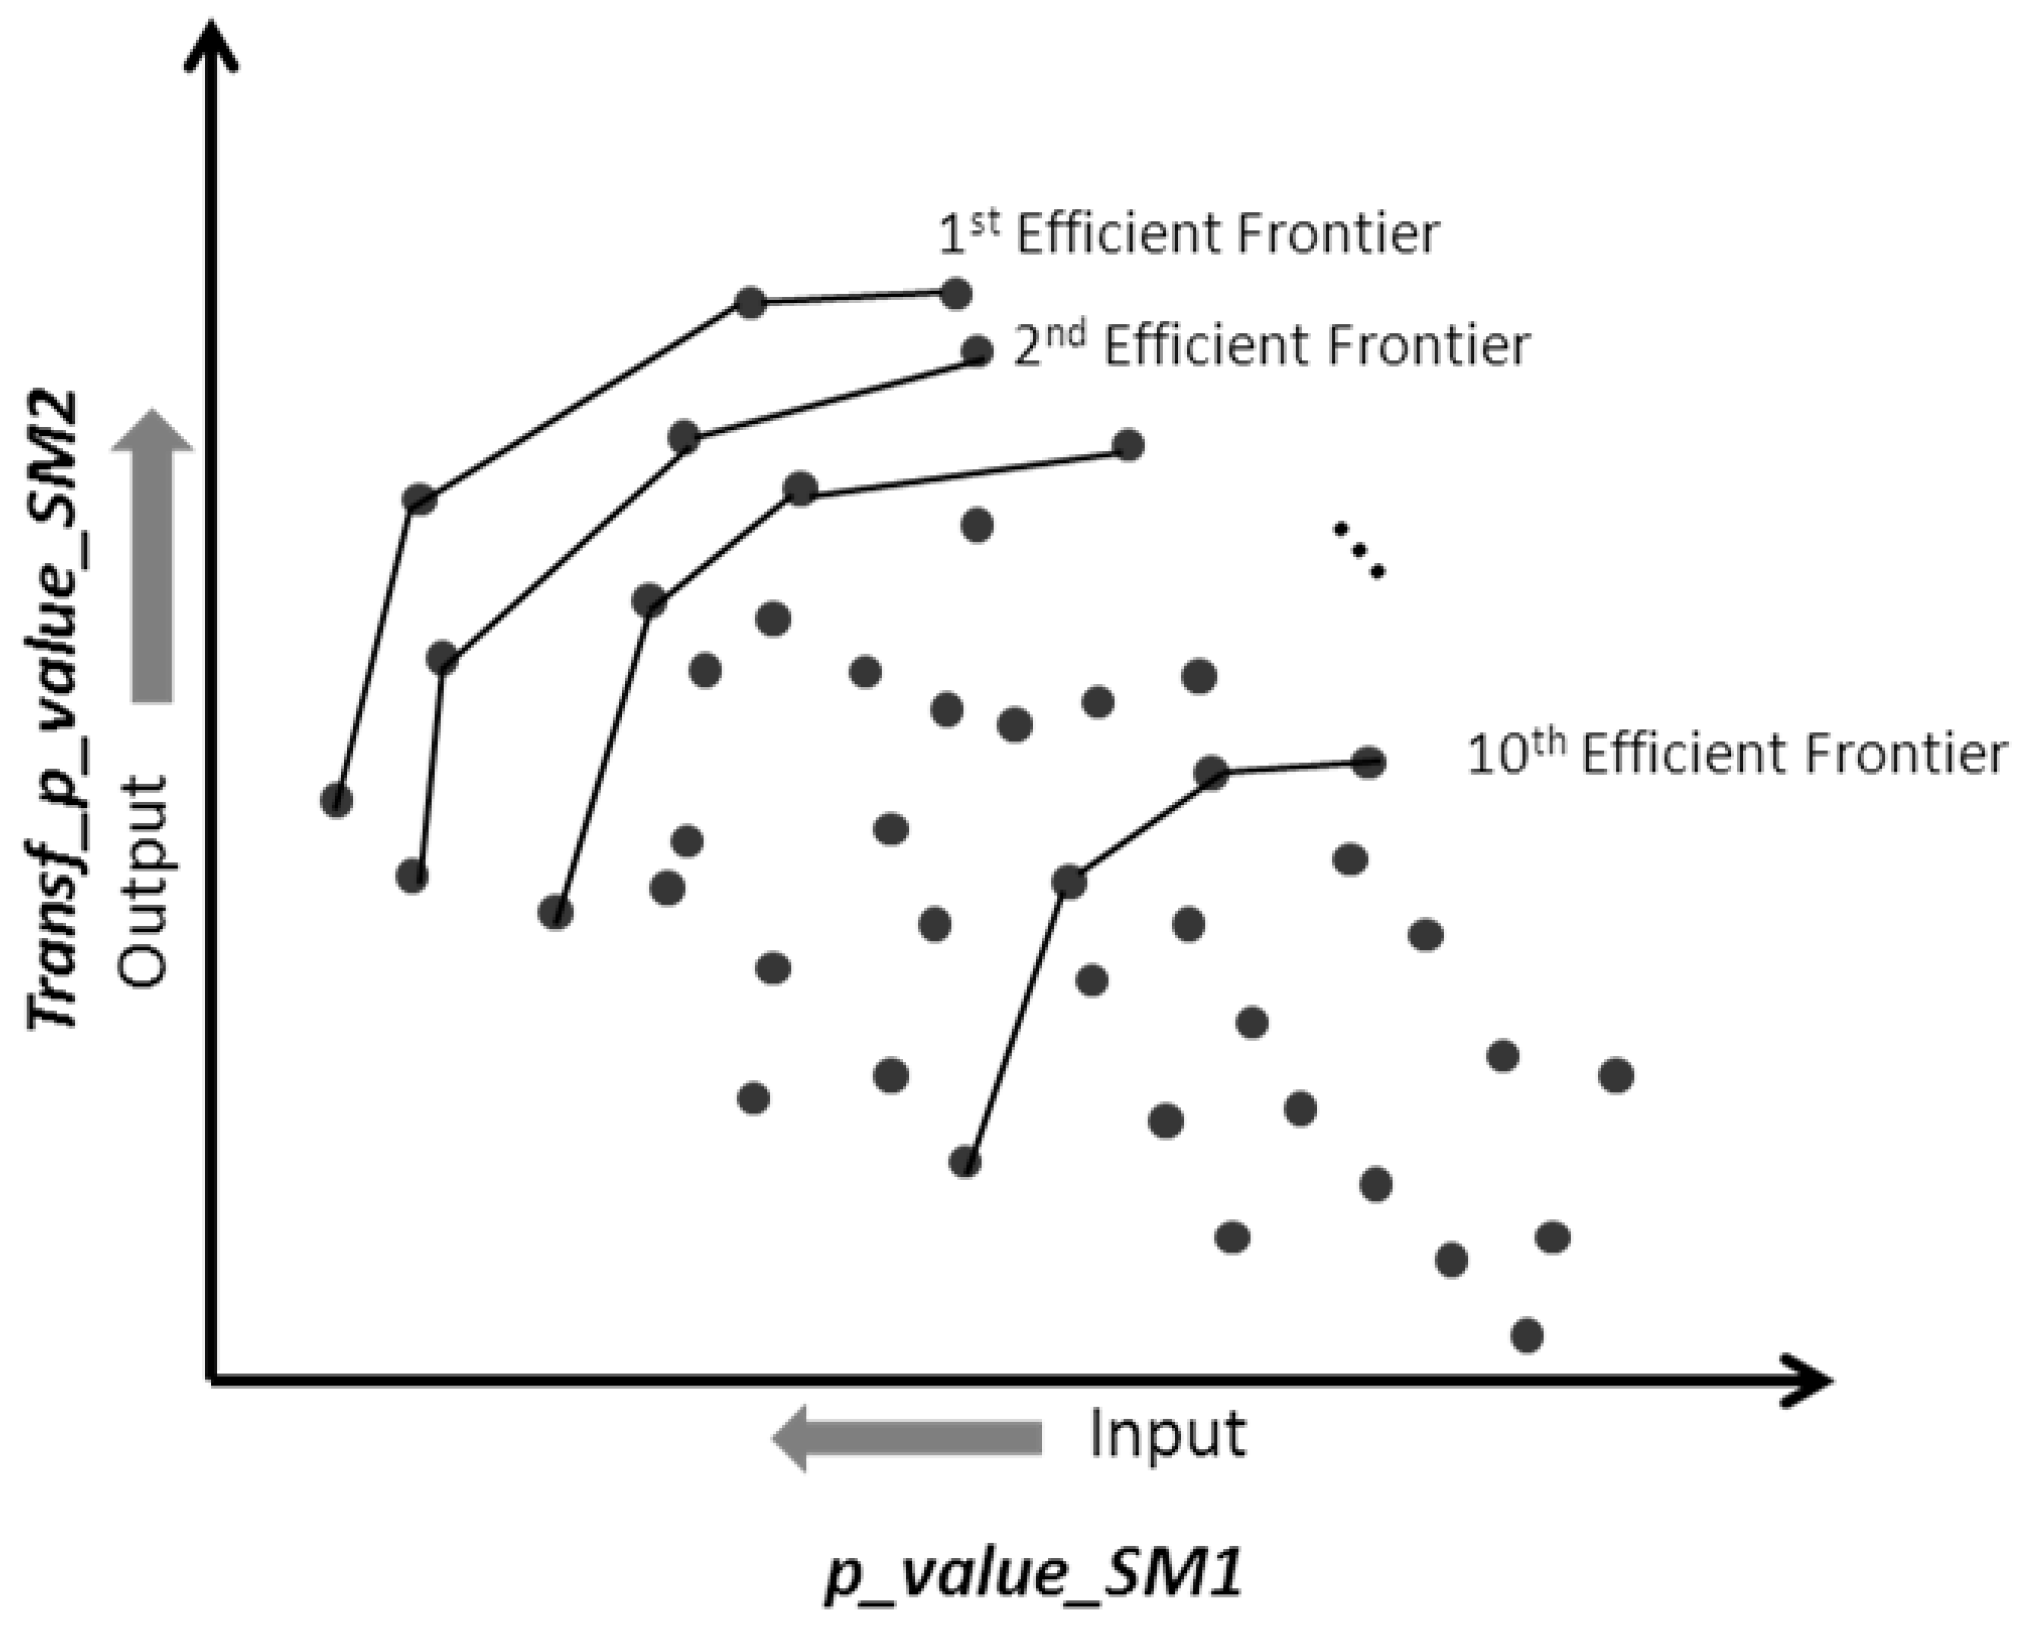
2.2. Multiple Criteria Optimization
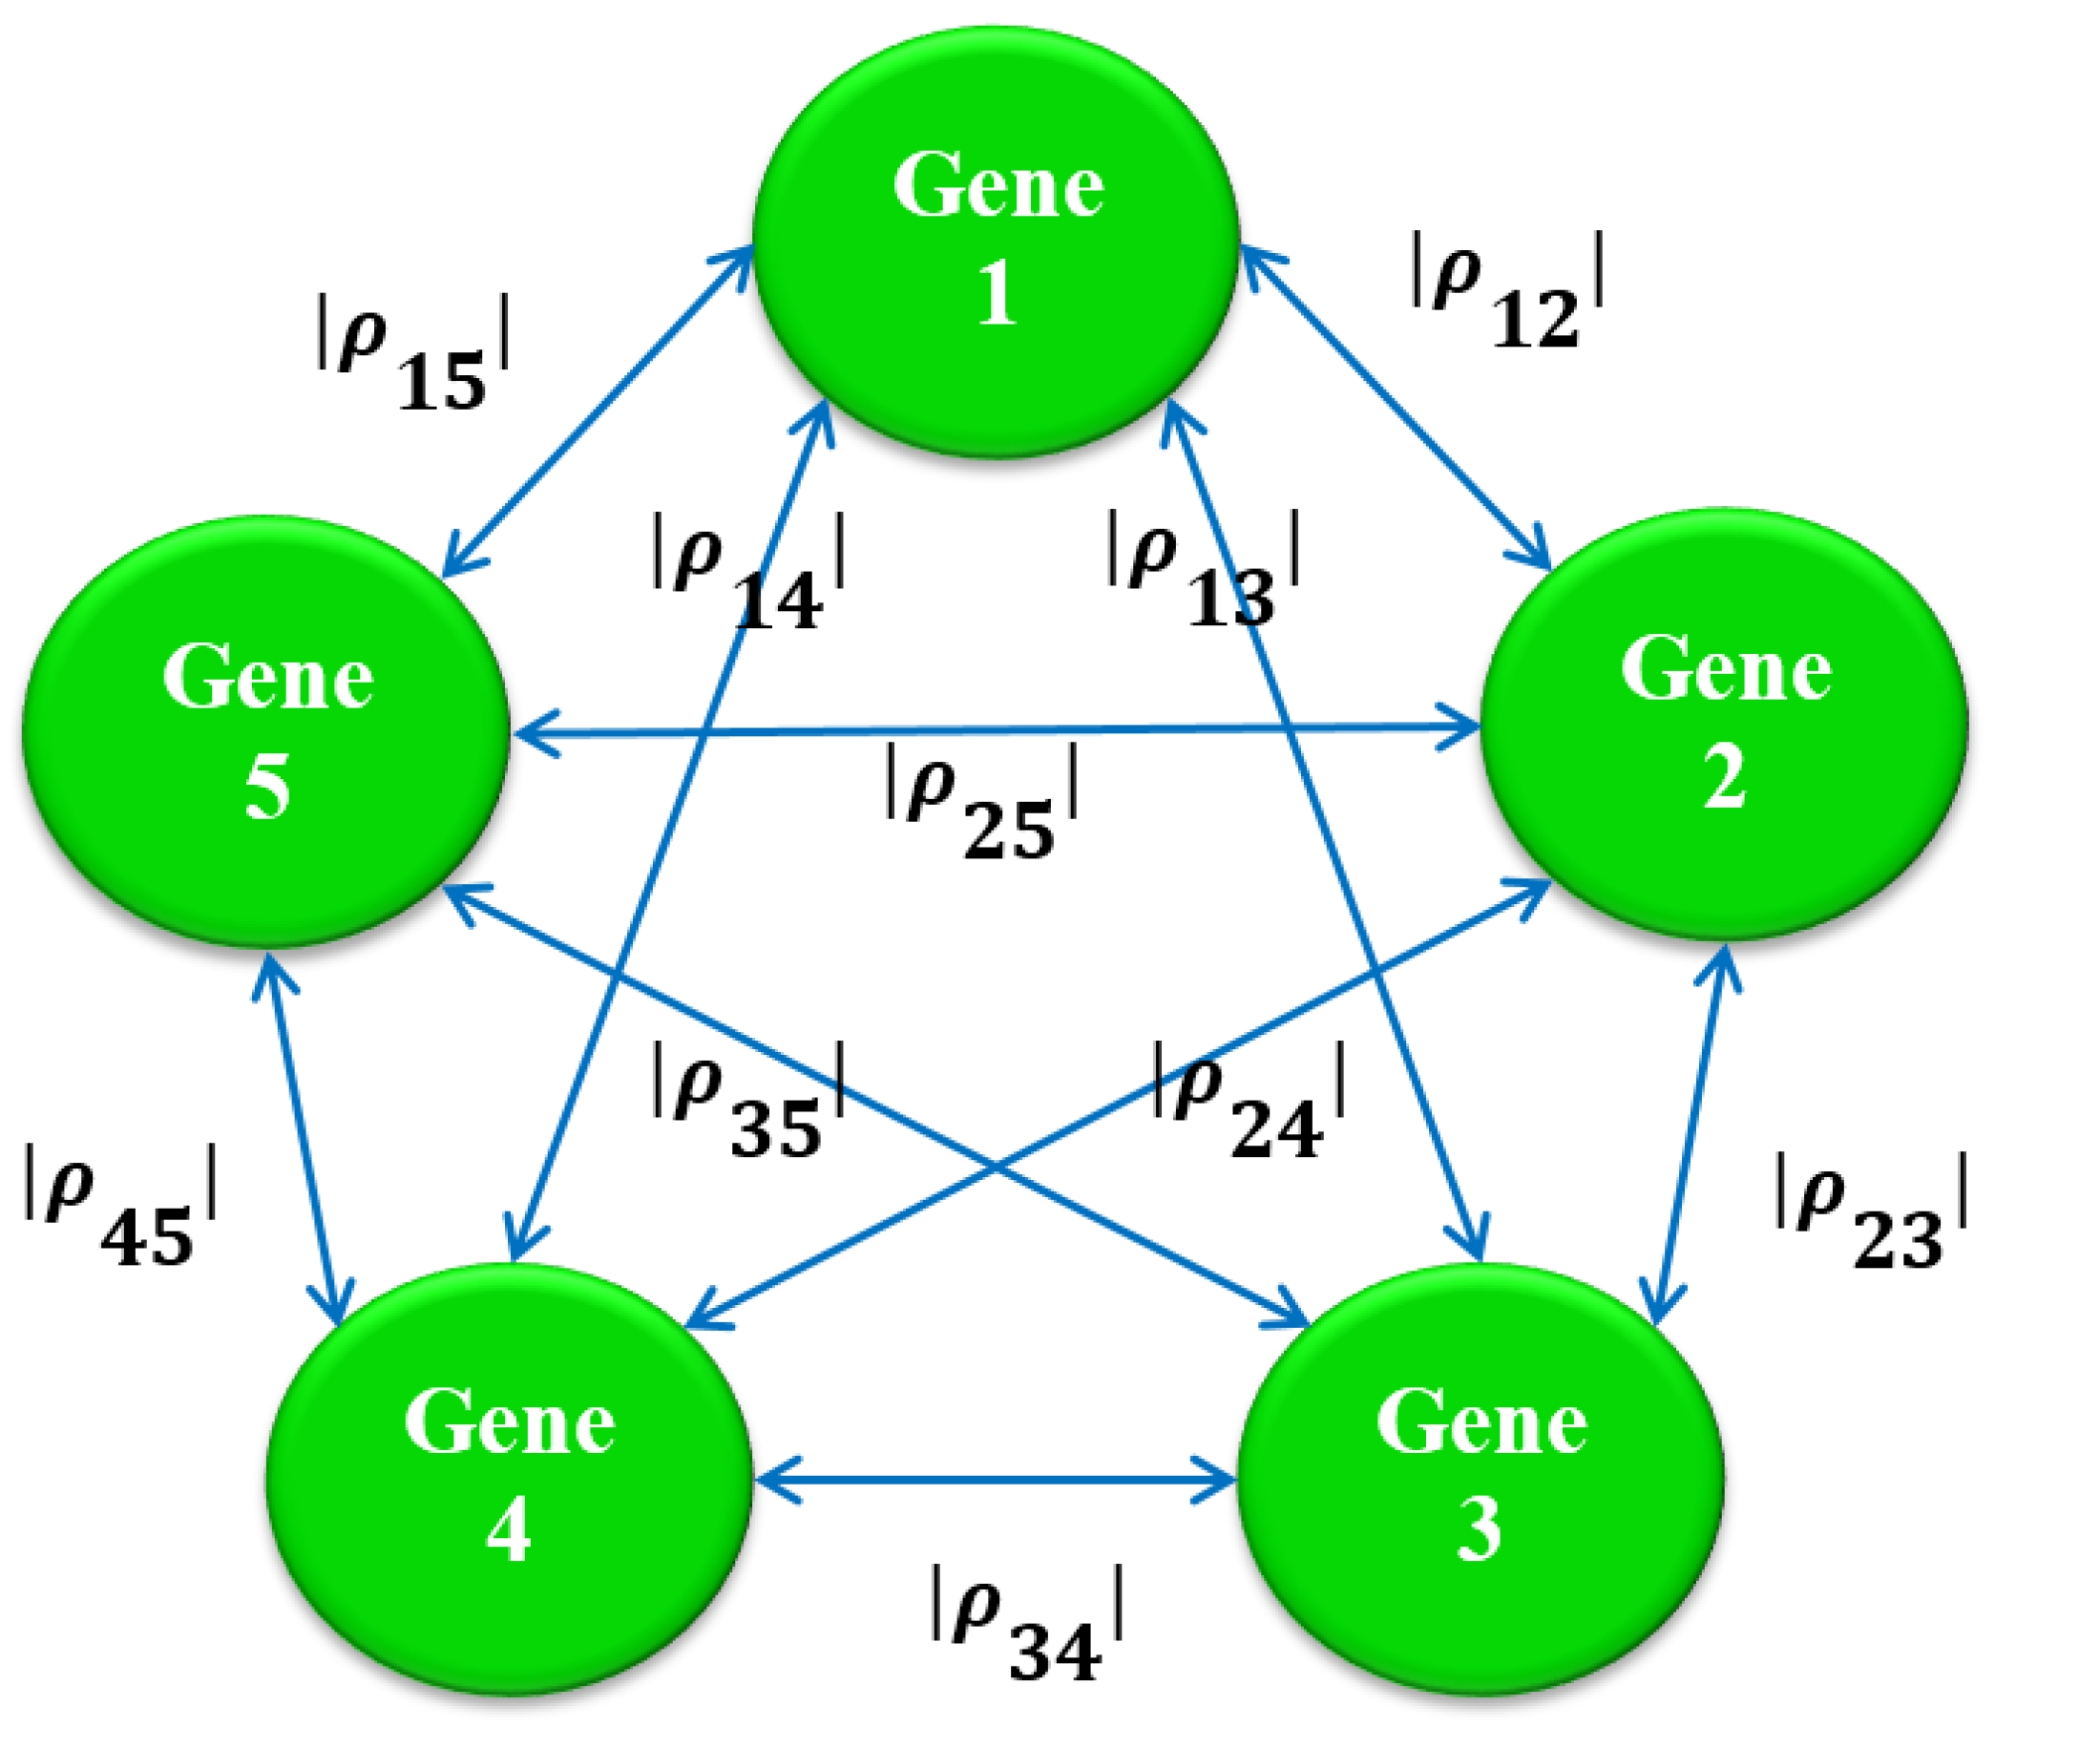
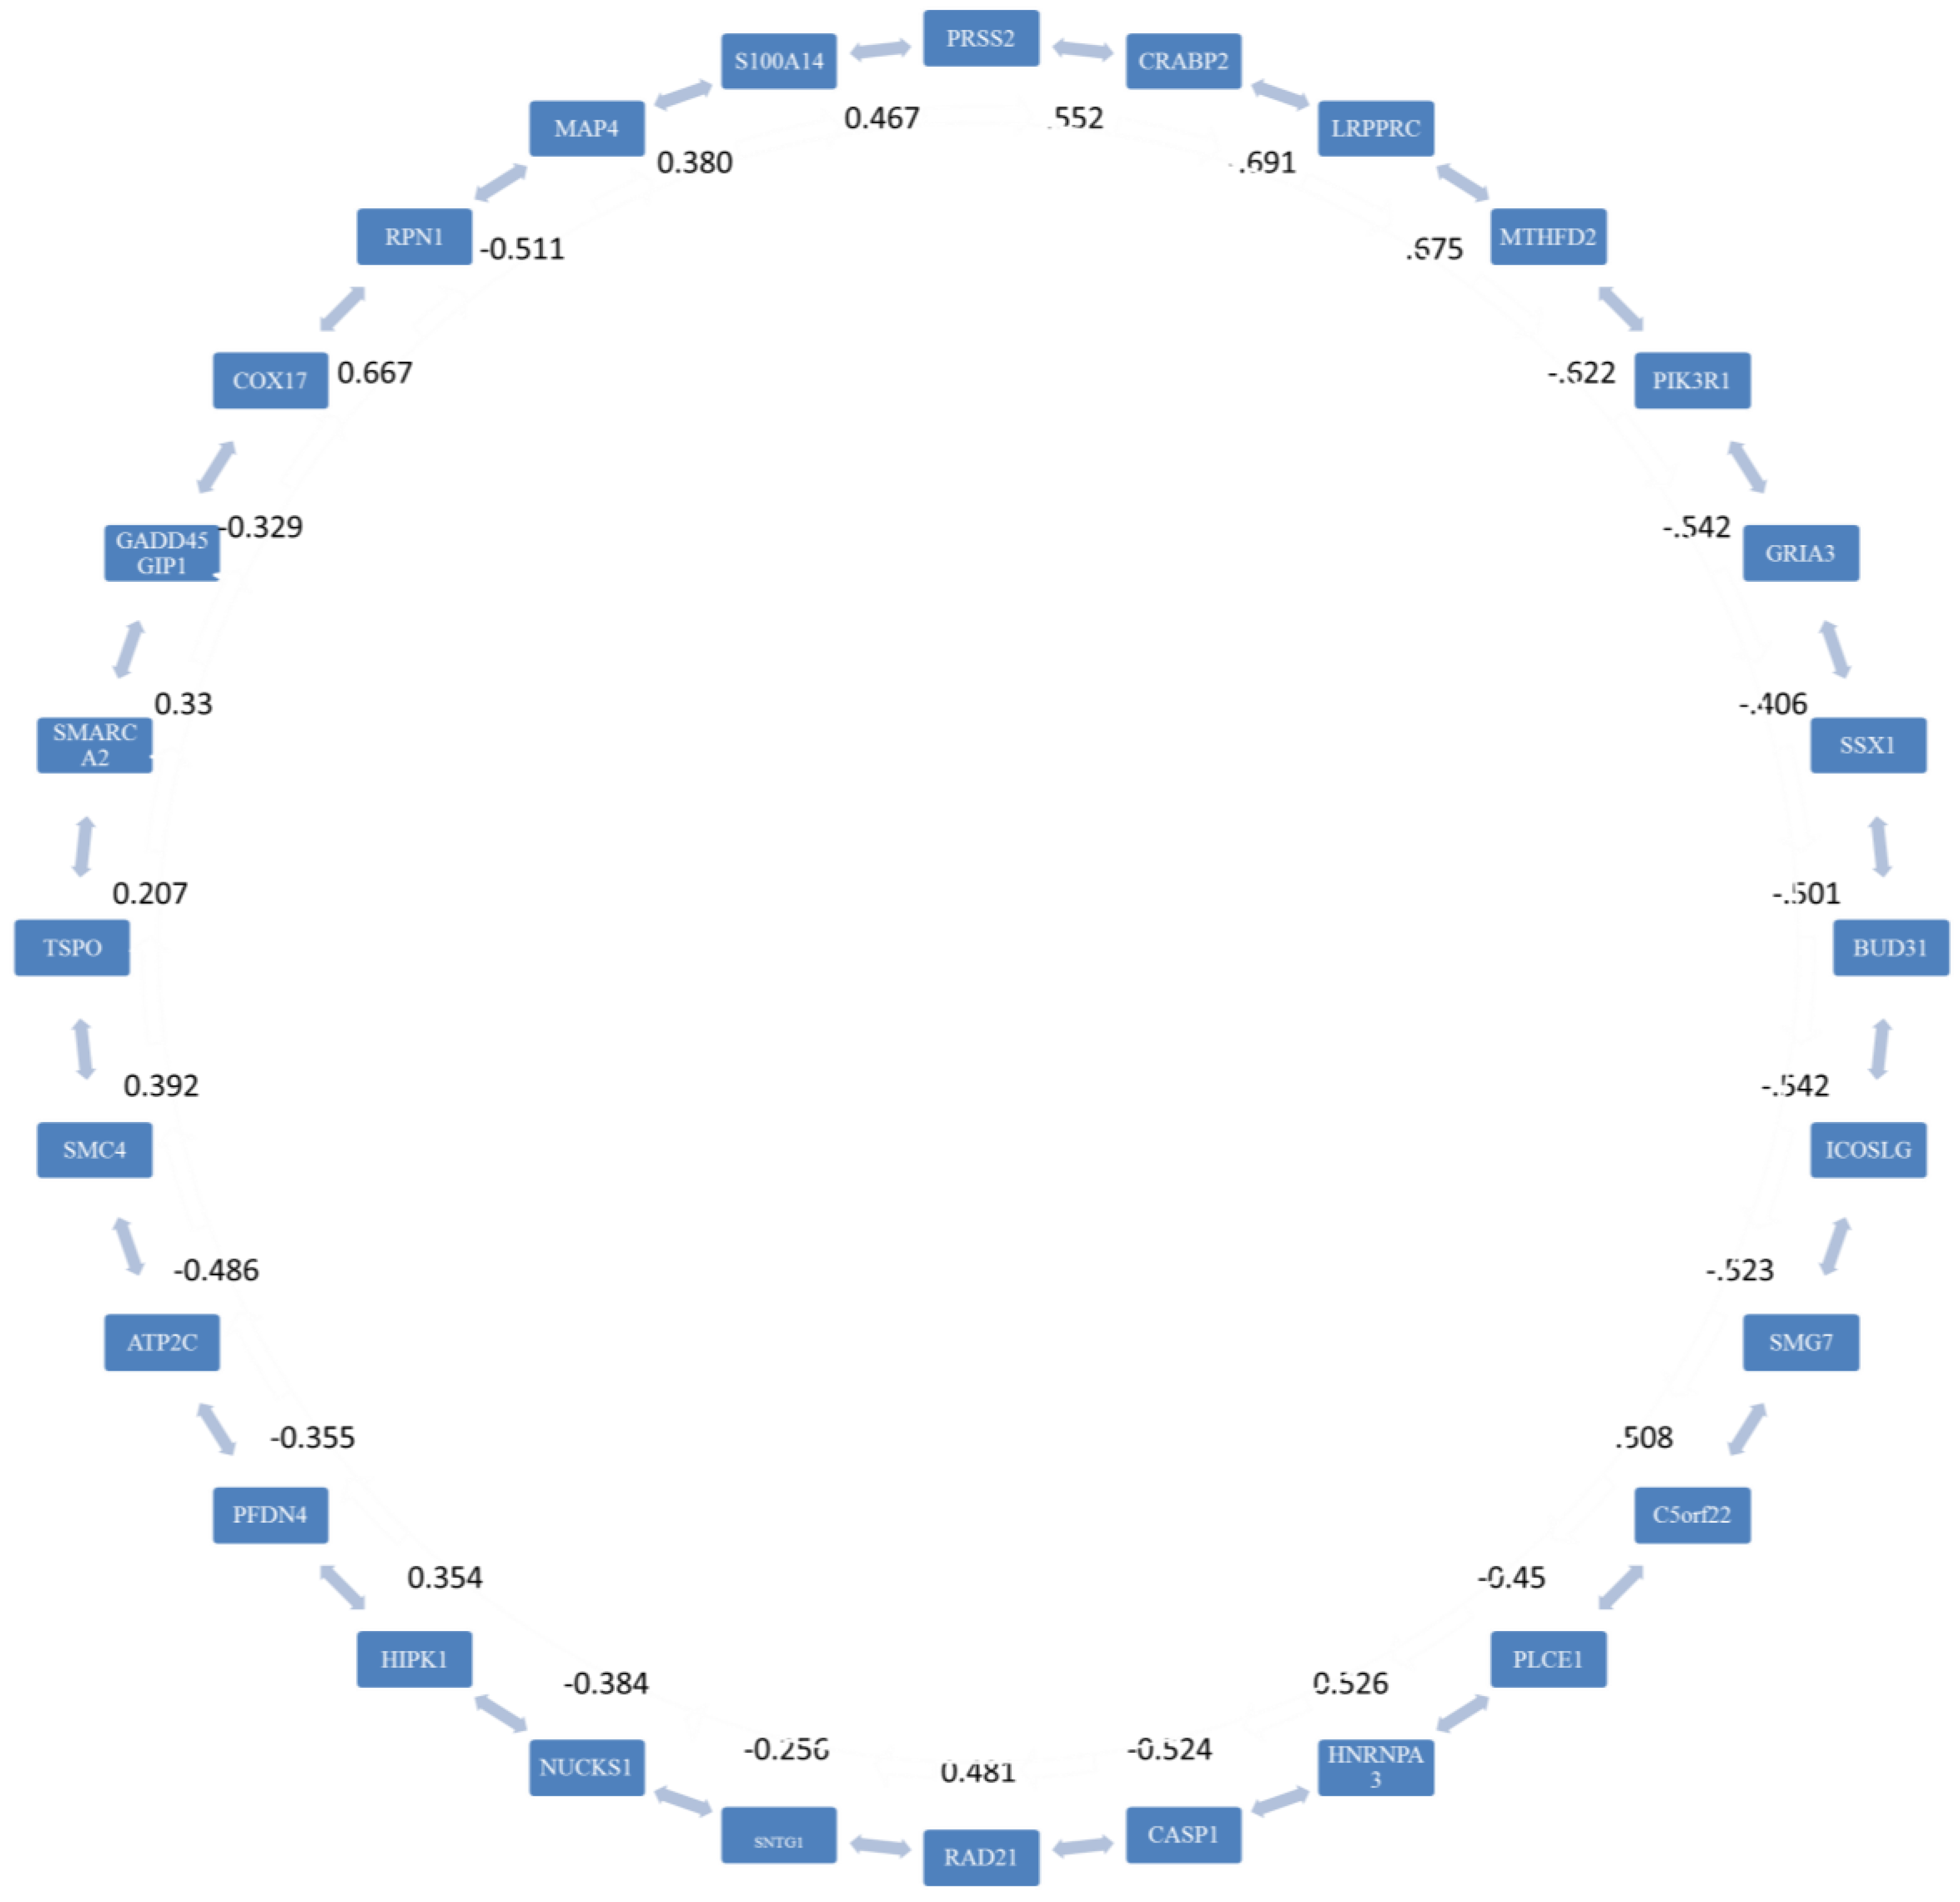
2.3. Stage 2: Finding the Most Correlated Path
3. Results for Cervix Cancer
3.1. Stage 1

| Gene Probe | Gene Name | Sign of expression change from healthy tissues to cancer tissues | Examples of cancer types where the gene is involved | Reference | |
|---|---|---|---|---|---|
| Database 1 [8] | Database 2 [9] | ||||
| 202575_at | CRABP2 | - | - | Head and Neck, Breast | [11,12] |
| 205402_x_at | PRSS2 | - | - | Colorectal, Gastric Tumorigenesis | [13,14] |
| 218677_at | S100A14 | - | - | Esophageal squamous cell carcinoma cells, oral squamous cell carcinoma | [15,16] |
| 202096_s_at | TSPO | - | - | Thyroid, Breast | [17,18] |
| 212249_at | PIK3R1 | - | - | Endometrial, Colorectal | [19,20] |
| 212567_s_at | MAP4 | - | - | Breast, non small cell lung carcinomas | [21,22] |
| 211366_x_at | CASP1 | - | - | Cervical squamous carcinoma cells | [23] |
| 212889_x_at | GADD45GIP1 | - | - | SKOV3 and HeLa cell lines | [24] |
| 206626_x_at | SSX1 | - | - | Prostate, multiple myeloma | [25,26] |
| 213450_s_at | ICOSLG | - | - | Metastatic melanoma, ductal pancreatic adenocarcinoma | [27,28] |
| 220405_at | SNTG1 | - | - | ||
| 208032_s_at | GRIA3 | - | - | Pancreatic | [29] |
| 205690_s_at | BUD31 | - | - | ||
| 206543_at | SMARCA2 | - | - | Prostate, Skin | [30,31] |
| 212291_at | HIPK1 | + | + | Acute myeloid leukemia | [32,33] |
| 211615_s_at | LRPPRC | + | + | Lung adenocarcinoma cell lines, oesophageal squamous cell carcinoma, stomach, colon, mammary and endometrial adenocarcinoma, and lymphoma | [34] |
| 222027_at | NUCKS1 | + | + | Breast | [35] |
| 205362_s_at | PFDN4 | + | + | Colorectal | [36] |
| 211929_at | HNRNPA3 | + | + | Non-small cell lung cancer | [37] |
| 203738_at | C5orf22 | + | + | ||
| 201794_s_at | SMG7 | + | + | ||
| 200607_s_at | RAD21 | + | + | Breast | [38] |
| 201011_at | RPN1 | + | + | Hematologic malignancies | [39] |
| 201761_at | MTHFD2 | + | + | Bladder, breast | [40,41] |
| 203880_at | COX17 | + | + | Non-small cell lung cancer | [42] |
| 212255_s_at | ATP2C1 | + | + | Breast, Cervical | [43,44] |
| 205112_at | PLCE1 | + | + | Gastric adenocarcinoma, colorectal | [45,46] |
| 201663_s_at201664_at | SMC4 | + | + | Breast, cervical | [9,47,48] |
3.2. Stage 2
| Number of Genes | Adjacent Genes |
|---|---|
| 5 | (CRABP2 with PRSS2) and (S100A14 with TSPO) |
| 10 | (PIK3R1 with MAP4) and (GADD45GIP1 with ICOSLG) |
| 15 | (SSX1 with BUD31), (ICOSLG with SNTG1), and (S100A14 with TSPO) |
| 20 | (LRPPRC with C5orf22) and (S100A14 with TSPO) |
| 25 | (S100A14 with TSPO), (SSX1 with GRIA3), (LRPPRC with MTHFD2), (RAD21 with BUD31), and (RPN1 with COX17) |
| 28 | (LRPPRC with MTHFD2) and (RPN1 with COX17) |
| Gene | Location |
|---|---|
| HIPK1 | 1p13.2 |
| NUCKS1 | 1q32.1 |
| SMG7 | 1q25.3 |
| CRABP2 | 1q21.3 |
| S100A14 | 1q21.1 |
| HNRNPA3 | 2q31.2 |
| LRPPRC | 2p21 |
| MTHFD2 | 2p13.1 |
| SMC4 | 3q26.1 |
| ATP2C | 3q22.1 |
| RPN1 | 3q21.3 |
| MAP4 | 3p21.31 |
| COX17 | 3q13.33 |
| C5orf22 | 5p13.3 |
| PIK3R1 | 5q13.1 |
| BUD31 | 7q22.1 |
| PRSS2 | 7q34 |
| SNTG1 | 8q11.21 |
| RAD21 | 8q24.11 |
| SSX1 | Xp11.23 |
| GRIA3 | Xq25 |
| PFDN4 | 20q13.2 |
| CASP1 | 11q22.3 |
| PLCE1 | 10q23.33 |
| ICOSLG | 21q22.3 |
| GADD45G | 19p13.2 |
| SMARCA2 | 9p22.3 |
| TSPO | 22q13.31 |
4. Conclusions
Acknowledgments
Author Contributions
Appendix A
| p-value | Fold change | Differentially expressed genes (number) | Number of genes Overexpressed | Number of genes Underexpressed |
|---|---|---|---|---|
| 10−2 | 2 | 934 | 645 | 289 |
| 10−2 | 8 | 29 | 23 | 6 |
| 10−2 | 24 | 2 | 1 | 1 |
| 10−7 | 2 | 649 | 516 | 133 |
| 10−7 | 8 | 27 | 22 | 5 |
| 10−7 | 24 | 2 | 1 | 1 |
| 10−12 | 2 | 130 | 121 | 9 |
| 10−12 | 8 | 12 | 11 | 1 |
| 10−12 | 24 | 2 | 1 | 1 |
Appendix B
Part 1
#!/opt/python2.6/bin/python
# Import Comma Separated Value Library ...
import csv
import sys
import urllib2
# Open file to be read
ifile  = open('results.csv', "rb")
# Create the reader object (in order to read from CSV file)
reader = csv.reader(ifile)
# Create file to be output
ofile  = open('details.csv', 'w')
# Create writer in order to write to output file
writer = csv.writer(ofile, delimiter=',', quotechar='"', quoting=csv.QUOTE_MINIMAL)
# Function in charge of extracting each genes in the database file
def detailPathwayExtractor():
        for row in reader:
                if (len(row)==1):
                        path=row[1]
                        try:
                                url_to_go_to = "http://rest.kegg.jp/get/" + path
                                print url_to_go_to
                                handle = urllib2.urlopen(url_to_go_to)
#read contenent
                                content = handle.read()
                                for row_of_file in content.split("\n"):
                                        if row_of_file.split() != []:
                                                print row_of_file.split()
                                                writer.writerow(row_of_file.split())
# Run the pathway extractor function
                        except IOError:
                                print "can't open file"
detailPathwayExtractor()
# Close both opened files
ifile.close()
ofile.close()
|
Part 2
#!/opt/python2.6/bin/python
# Import Comma Separated Value Library ...
import csv
import sys
import urllib2
# Open file to be read
ifile  = open('test.csv', "rb")
# Create the reader object (in order to read from CSV file)
reader = csv.reader(ifile)
# Create file to be output
ofile  = open('results.csv', 'w')
# Create writer in order to write to output file
writer = csv.writer(ofile, delimiter=',', quotechar='"', quoting=csv.QUOTE_MINIMAL)
# Function in charge of extracting each genes in the database file
def pathwayExtractor():
        for row in reader:
                if (len(row)==4):
                        HSA=row[3]
                        try:
                                url_to_go_to = "http://rest.kegg.jp/link/pathway/hsa:" + HSA
                                print url_to_go_to
                                handle = urllib2.urlopen(url_to_go_to)
#read contenent
                                content = handle.read()
                                for row_of_file in content.split("\n"):
                                        if row_of_file.split() != []:
                                                print row_of_file.split()
                                                writer.writerow(row_of_file.split())
# Run the pathway extractor function
                        except IOError:
                                print "can't open file"
pathwayExtractor()
# Close both opened files
ifile.close()
ofile.close()
|
Part 3
#!/opt/python2.6/bin/python
# Import Comma Separated Value Library
import csv
import sys
import urllib2
# Open file to be read
ifile  = open('results.csv', "rb")
# Create the reader object (in order to read from CSV file)
reader = csv.reader(ifile)
# Create file to be output
ofile  = open('details.csv', 'w')
# Create writer in order to write to output file
writer = csv.writer(ofile, delimiter=',', quotechar='"', quoting=csv.QUOTE_MINIMAL)
# Function in charge of extracting each genes in the database file
def detailPathwayExtractor():
        for row in reader:
                if (len(row)==1):
                        path=row[1]
                        try:
                                url_to_go_to = "http://rest.kegg.jp/get/" + path
                                print url_to_go_to
                                handle = urllib2.urlopen(url_to_go_to)
#read contenent
                                content = handle.read()
                                for row_of_file in content.split("\n"):
                                        if row_of_file.split() != []:
                                                print row_of_file.split()
                                                writer.writerow(row_of_file.split())
# Run the pathway extractor function
                        except IOError:
                                print "can't open file"
detailPathwayExtractor()
# Close both opened files
ifile.close()
ofile.close()
|
Conflicts of Interest
References
- Fierro, A.C.; Vandenbussche, F.; Engelen, K.; Van de Peer, Y.; Marchal, K. Meta analysis of gene expression data within and across species. Curr. Genomics 2008, 9, 525–534. [Google Scholar] [CrossRef] [PubMed]
- Owzar, K.; Barry, W.T.; Jung, S.H. Statistical considerations for analysis of microarray experiments. Clin. Transl. Sci. 2011, 4, 466–477. [Google Scholar] [CrossRef] [PubMed]
- Sánchez-Peña, M.L.; Isaza, C.E.; Pérez-Morales, J.; Rodríguez-Padilla, C.; Castro, J.M.; Cabrera-Ríos, M. Identification of potential biomarkers from microarray experiments using multiple criteria optimization. Cancer Medicine 2013, 2, 253–265. [Google Scholar] [CrossRef] [PubMed]
- Watts-Oquendo, E.; Sánchez-Peña, M.; Isaza, C.E.; Cabrera-Ríos, M. Potential colon cancer biomarker search using more than two performance measures in a multiple criteria optimization approach. P. R. Health Sci. J. 2012, 31, 59–63. [Google Scholar] [PubMed]
- Charnes, A.; Cooper, W.W.; Lewin, A.Y.; Seiford, L.M. Data Envelopment Analysis: Theory, Methodology and Applications; Kluwer Academic Publishers: Boston, MA, USA, 1993. [Google Scholar]
- National Human Genome Research Institute. National Institute of Health. Available online: http://www.genome.gov/27530687 (accessed on 10 February 2014).
- Kumari, S.; Nie, J.; Chen, H.S.; Ma, H.; Stewart, R.; Li, X.; Lu, M.Z.; Taylor, W.M.; Wei, H. Evaluation of gene association methods for coexpression network construction and biological knowledge discovery. PLoS ONE 2012, 7, e50411. [Google Scholar] [CrossRef] [PubMed]
- Ahuja, R.K.; Magnanti, T.L.; Orlin, J.B. Network Flows: Theory, Algorithms, and Applications; Prentice Hall: Upper Saddle River, NJ, USA, 1993. [Google Scholar]
- Zhai, Y.; Kuick, R.; Nan, B.; Ota, I.; Weiss, S.J.; Trimble, C.L.; Fearon, E.R.; Cho, K.R. Gene Expression Analysis of Preinvasive and Invasive Cervical Squamous Cell Carcinomas Identifies HOXC10 as a Key Mediator of Invasion. Cancer Res. 2007, 67, 10163–10172. [Google Scholar] [CrossRef] [PubMed]
- Scotto, L.; Narayan, G.; Nandula, S.V.; Arias-Pulido, H.; Subramaniyam, S.; Schneider, A.; Kaufmann, A.M.; Wright, J.D.; Pothuri, B.; Mansukhani, M.; et al. Identification of copy number gain and overexpressed genes on chromosome arm 20q by an integrative genomic approach in cervical cancer: Potential role in progression. Gene Chromosome. Canc. 2008, 47, 755–765. [Google Scholar] [CrossRef]
- Calmon, M.F.; Rodrigues, R.V.; Kaneto, C.M.; Moura, R.P.; Silva, S.D.; Mota, L.D.; Pinheiro, D.G.; Torres, C.; de Carvalho, A.F.; Cury, P.M.; et al. Epigenetic silencing of CRABP2 and MX1 in head and neck tumors. Neoplasia 2009, 11, 1329–1339. [Google Scholar] [CrossRef] [PubMed]
- Geiger, T.; Madden, S.F.; Gallagher, W.M.; Cox, J.; Mann, M. Proteomic portrait of human breast cancer progression identifies novel prognostic markers. Cancer Res. 2012, 72, 2428–2439. [Google Scholar] [CrossRef] [PubMed]
- Williams, S.J.; Gotley, D.C.; Antalis, T.M. Human trypsinogen in colorectal cancer. Int. J. Cancer 2001, 93, 67–73. [Google Scholar] [CrossRef] [PubMed]
- Rajkumar, T.; Vijayalakshmi, N.; Gopal, G.; Sabitha, K.; Shirley, S.; Raja, U.M.; Ramakrishnan, S.A. Identification and validation of genes involved in gastric tumorigenesis. Cancer Cell Int. 2010, 10, 45. [Google Scholar] [CrossRef] [PubMed]
- Chen, H.; Yuan, Y.; Zhang, C.; Luo, A.; Ding, F.; Ma, J.; Yang, S.; Tian, Y.; Tong, T.; Zhan, Q.; Liu, Z. Involvement of S100A14 Protein in Cell Invasion by Affecting Expression and Function of Matrix Metalloproteinase (MMP)-2 via p53-dependent Transcriptional Regulation. J. Biol. Chem. 2012, 287, 17109–17119. [Google Scholar] [CrossRef] [PubMed]
- Sapkota, D.; Bruland, O.; Costea, D.E.; Haugen, H.; Vasstrand, E.N.; Ibrahim, S.O. S100A14 regulates the invasive potential of oral squamous cell carcinoma derived cell-lines in vitro by modulating expression of matrix metalloproteinases, MMP1 and MMP9. Eur. J. Cancer 2011, 47, 600–610. [Google Scholar] [CrossRef] [PubMed]
- Klubo-Gwiezdzinska, J.; Jensen, K.; Bauer, A.; Patel, A.; Costello, J.; Burman, K.; Wartofsky, L.; Hardwick, M.J.; Vasko, V.V. The expression of translocator protein in human thyroid cancer and its role in the response of thyroid cancer cells to oxidative stress. J. Endocrinol. 2012, 214, 207–216. [Google Scholar] [CrossRef] [PubMed]
- Mukherjee, S.; Das, S.K. Translocator protein (TSPO) in breast cancer. Curr. Mol. Med. 2012, 12, 443–457. [Google Scholar] [PubMed]
- Cheung, L.W.; Hennessy, B.T.; Li, J.; Yu, S.; Myers, A.P.; Djordjevic, B.; Lu, Y.; Stemke-Hale, K.; Dyer, M.D.; Zhang, F.; et al. High Frequency of PIK3R1 and PIK3R2 Mutations in Endometrial Cancer Elucidates a Novel Mechanism for Regulation of PTEN Protein Stability. Cancer Discov. 2011, 1, 170–185. [Google Scholar] [CrossRef] [PubMed]
- Nowakowska-Zajdel, E.; Mazurek, U.; Ziółko, E.; Niedworok, E.; Fatyga, E.; Kokot, T.; Muc-Wierzgoń, M. Analysis of expression profile of gene encoding proteins of signal cascades activated by insulin-like growth factors in colorectal cancer. Int. J. Immunopathol. Pharmacol. 2011, 24, 781–787. [Google Scholar] [PubMed]
- Chen, X.; Wu, J.; Lu, H.; Huang, O.; Shen, K. Measuring β-tubulin III, Bcl-2, and ERCC1 improves pathological complete remission predictive accuracy in breast cancer. Cancer Sci. 2012, 103, 262–268. [Google Scholar] [CrossRef] [PubMed]
- Cucchiarelli, V.; Hiser, L.; Smith, H.; Frankfurter, A.; Spano, A.; Correia, J.J.; Lobert, S. Beta-tubulin isotype classes II and V expression patterns in nonsmall cell lung carcinomas. Cell Motil. Cytoskeleton 2008, 65, 675–685. [Google Scholar] [CrossRef] [PubMed]
- Arany, I.; Ember, I.A.; Tyring, S.K. All-trans-retinoic acid activates caspase-1 in a dose-dependent manner in cervical squamous carcinoma cells. Anticancer Res. 2003, 23, 471–473. [Google Scholar] [PubMed]
- Nakayama, K.; Nakayama, N.; Wang, T.L.; Shih, I.M. NAC-1 controls cell growth and survival by repressing transcription of Gadd45GIP1, a candidate tumor suppressor. Cancer Res. 2007, 67, 8058–8064. [Google Scholar] [CrossRef] [PubMed]
- Smith, H.A.; Cronk, R.J.; Lang, J.M.; McNeel, D.G. Expression and immunotherapeutic targeting of the SSX family of cancer-testis antigens in prostate cancer. Cancer Res. 2011, 71, 6785–6795. [Google Scholar] [CrossRef] [PubMed]
- Van Duin, M.; Broyl, A.; de Knegt, Y.; Goldschmidt, H.; Richardson, P.G.; Hop, W.C.; van der Holt, B.; Joseph-Pietras, D.; Mulligan, G.; Neuwirth, R.; et al. Cancer testis antigens in newly diagnosed and relapse multiple myeloma: Prognostic markers and potential targets for immunotherapy. Haematologica 2011, 96, 1662–1669. [Google Scholar] [CrossRef] [PubMed]
- Fu, T.; He, Q.; Sharma, P. The ICOS/ICOSL pathway is required for optimal antitumor responses mediated by anti-CTLA-4 therapy. Cancer Res. 2011, 71, 5445–5454. [Google Scholar] [CrossRef] [PubMed]
- Tjomsland, V.; Spångeus, A.; Sandström, P.; Borch, K.; Messmer, D.; Larsson, M. Semi mature blood dendritic cells exist in patients with ductal pancreatic adenocarcinoma owing to inflammatory factors released from the tumor. PLoS ONE 2010, 5, e13441. [Google Scholar] [CrossRef] [PubMed] [Green Version]
- Ripka, S.; Riedel, J.; Neesse, A.; Griesmann, H.; Buchholz, M.; Ellenrieder, V.; Moeller, F.; Barth, P.; Gress, T.M.; Michl, P. Glutamate receptor GRIA3—Target of CUX1 and mediator of tumor progression in pancreatic cancer. Neoplasia 2010, 12, 659–667. [Google Scholar] [CrossRef] [PubMed]
- Sun, A.; Tawfik, O.; Gayed, B.; Thrasher, J.B.; Hoestje, S.; Li, C.; Li, B. Aberrant expression of SWI/SNF catalytic subunits BRG1/BRM is associated with tumor development and increased invasiveness in prostate cancers. Prostate 2007, 67, 203–213. [Google Scholar] [CrossRef] [PubMed]
- Moloney, F.J.; Lyons, J.G.; Bock, V.L.; Huang, X.X.; Bugeja, M.J.; Halliday, G.M. Hotspot mutation of Brahma in non-melanoma skin cancer. J. Invest. Dermatol. 2009, 129, 1012–1015. [Google Scholar] [CrossRef] [PubMed]
- Mougeot, J.L.; Bahrani-Mougeot, F.K.; Lockhart, P.B.; Brennan, M.T. Microarray analyses of oral punch biopsies from acute myeloid leukemia (AML) patients treated with chemotherapy. Oral Surg. Oral Med. Oral Pathol. Oral Radiol. Endod. 2011, 112, 446–452. [Google Scholar] [CrossRef] [PubMed]
- Aikawa, Y.; Nguyen, L.A.; Isono, K.; Takakura, N.; Tagata, Y.; Schmitz, M.L.; Koseki, H.; Kitabayashi, I. Roles of HIPK1 and HIPK2 in AML1- and p300-dependent transcription, hematopoiesis and blood vessel formation. EMBO J. 2006, 25, 3955–3965. [Google Scholar] [CrossRef] [PubMed]
- Tian, T.; Ikeda, J.I.; Wang, Y.; Mamat, S.; Luo, W.; Aozasa, K.; Morii, E. Role of leucine-rich pentatricopeptide repeat motif-containing protein (LRPPRC) for anti-apoptosis and tumourigenesis in cancers. Eur. J. Cancer 2012, 48, 2462–2473. [Google Scholar] [CrossRef] [PubMed]
- Ziółkowski, P.; Gamian, E.; Osiecka, B.; Zougman, A.; Wiśniewski, J.R. Immunohistochemical and proteomic evaluation of nuclear ubiquitous casein and cyclin-dependent kinases substrate in invasive ductal carcinoma of the breast. J. Biomed. Biotechnol. 2009, 2009, 919645. [Google Scholar] [CrossRef] [PubMed]
- Miyoshi, N.; Ishii, H.; Mimori, K.; Nishida, N.; Tokuoka, M.; Akita, H.; Sekimoto, M.; Doki, Y.; Mori, M. Abnormal expression of PFDN4 in colorectal cancer: A novel marker for prognosis. Ann. Surg. Oncol. 2010, 17, 3030–3036. [Google Scholar] [CrossRef] [PubMed]
- Boukakis, G.; Patrinou-Georgoula, M.; Lekarakou, M.; Valavanis, C.; Guialis, A. Deregulated expression of hnRNP A/B proteins in human non-small cell lung cancer: Parallel assessment of protein and mRNA levels in paired tumour/non-tumour tissues. BMC Cancer 2010, 10, 434. [Google Scholar] [CrossRef] [PubMed]
- Atienza, J.M.; Roth, R.B.; Rosette, C.; Smylie, K.J.; Kammerer, S.; Rehbock, J.; Ekblom, J.; Denissenko, M.F. Suppression of RAD21 gene expression decreases cell growth and enhances cytotoxicity of etoposide and bleomycin in human breast cancer cells. Mol. Cancer Ther. 2005, 4, 361–368. [Google Scholar] [PubMed]
- Shimizu, S.; Suzukawa, K.; Kodera, T.; Nagasawa, T.; Abe, T.; Taniwaki, M.; Yagasaki, F.; Tanaka, H.; Fujisawa, S.; Johansson, B.; et al. Identification of breakpoint cluster regions at 1p36.3 and 3q21 in hematologic malignancies with t(1;3)(p36;q21). Genes Chromosome. Canc. 2000, 27, 229–238. [Google Scholar] [CrossRef]
- Andrew, A.S.; Gui, J.; Sanderson, A.C.; Mason, R.A.; Morlock, E.V.; Schned, A.R.; Kelsey, K.T.; Marsit, C.J.; Moore, J.H.; Karagas, M.R. Bladder cancer SNP panel predicts susceptibility and survival. Hum. Genet. 2009, 125, 527–539. [Google Scholar] [CrossRef] [PubMed]
- Xu, X.; Qiao, M.; Zhang, Y.; Jiang, Y.; Wei, P.; Yao, J.; Gu, B.; Wang, Y.; Lu, J.; Wang, Z.; et al. Quantitative proteomics study of breast cancer cell lines isolated from a single patient: Discovery of TIMM17A as a marker for breast cancer. Proteomics 2010, 10, 1374–1390. [Google Scholar] [CrossRef] [PubMed]
- Suzuki, C.; Daigo, Y.; Kikuchi, T.; Katagiri, T.; Nakamura, Y. Identification of COX17 as a therapeutic target for non-small cell lung cancer. Cancer Res. 2003, 63, 7038–7041. [Google Scholar] [PubMed]
- Grice, D.M.; Vetter, I.; Faddy, H.M.; Kenny, P.A.; Roberts-Thomson, S.J.; Monteith, G.R. Golgi calcium pump secretory pathway calcium ATPase 1 (SPCA1) is a key regulator of insulin-like growth factor receptor (IGF1R) processing in the basal-like breast cancer cell line MDA-MB-231. J. Biol. Chem. 2010, 285, 37458–37466. [Google Scholar] [CrossRef] [PubMed]
- Wilting, S.M.; de Wilde, J.; Meijer, C.J.; Berkhof, J.; Yi, Y.; van Wieringen, W.N.; Braakhuis, B.J.; Meijer, G.A.; Ylstra, B.; Snijders, P.J.; et al. Integrated genomic and transcriptional profiling identifies chromosomal loci with altered gene expression in cervical cancer. Genes Chromosomes Cancer 2008, 47, 890–905. [Google Scholar] [CrossRef] [PubMed]
- Wang, M.; Zhang, R.; He, J.; Qiu, L.; Li, J.; Wang, Y.; Sun, M.; Yang, Y.; Wang, J.; Yang, J.; et al. Potentially functional variants of PLCE1 identified by GWASs contribute to gastric adenocarcinoma susceptibility in an eastern Chinese population. PLoS ONE 2012, 7, e31932. [Google Scholar] [CrossRef] [PubMed]
- Danielsen, S.A.; Cekaite, L.; Ågesen, T.H.; Sveen, A.; Nesbakken, A.; Thiis-Evensen, E.; Skotheim, R.I.; Lind, G.E.; Lothe, R.A. Phospholipase C isozymes are deregulated in colorectal cancer--insights gained from gene set enrichment analysis of the transcriptome. PLoS ONE 2011, 6, e24419. [Google Scholar] [CrossRef] [PubMed]
- Chang, H.; Jeung, H.C.; Jung, J.J.; Kim, T.S.; Rha, S.Y.; Chung, H.C. Identification of genes associated with chemosensitivity to SAHA/taxane combination treatment in taxane-resistant breast cancer cells. Breast Cancer Res. Treat. 2011, 125, 55–63. [Google Scholar] [CrossRef] [PubMed]
- Kulawiec, M.; Safina, A.; Desouki, M.M.; Still, I.; Matsui, S.; Bakin, A.; Singh, K.K. Tumorigenic transformation of human breast epithelial cells induced by mitochondrial DNA depletion. Cancer Biol. Ther. 2008, 7, 1732–1743. [Google Scholar] [CrossRef] [PubMed]
- KEGG: Kyoto Encyclopedia of Genes and Genomes. Available online: http://www.genome.jp/kegg/ (accessed on 12 April 2015).
- Rebhan, M.; Chalifa-Caspi, V.; Prilusky, J.; Lancet, D. GeneCards: A novel functional genomics compendium with automated data mining and query reformulation support. Bioinformatics 1998, 14, 656–664. [Google Scholar] [CrossRef] [PubMed]
- Wang, J.; Tai, L.S.; Tzang, C.H.; Fong, W.F.; Guan, X.Y.; Yang, M. 1p31, 7q21 and 18q21 chromosomal aberrations and candidate genes in acquired vinblastine resistance of human cervical carcinoma KB cells. Oncol. Rep. 2008, 19, 1155–1164. [Google Scholar] [PubMed]
- Lee, M.; Nam, E.S.; Jung, S.H.; Kim, S.Y.; Lee, S.J.; Yoon, J.H.; Lee, N.W.; Jeon, S.; Choi, J.S.; Cho, C.H.; et al. 1p36.22 region containing PGD gene is frequently gained in human cervical cancer. J. Obstet. Gynaecol. Res. 2014, 40, 545–553. [Google Scholar] [CrossRef] [PubMed]
- Wilting, S.M.; Steenbergen, R.D.; Tijssen, M.; van Wieringen, W.N.; Helmerhorst, T.J.; van Kemenade, F.J.; Bleeker, M.C.; van de Wiel, M.A.; Carvalho, B.; Meijer, G.A.; et al. Chromosomal signatures of a subset of high-grade premalignant cervical lesions closely resemble invasive carcinomas. Cancer Res. 2009, 69, 647–655. [Google Scholar] [CrossRef] [PubMed]
- Cortés-Gutiérrez, E.I.1.; Dávila-Rodríguez, M.I.; Muraira-Rodríguez, M.; Said-Fernández, S.; Cerda-Flores, R.M. Association between the stages of cervical cancer and chromosome 1 aneusomy. Cancer Genet. Cytogenet. 2005, 159, 44–47. [Google Scholar] [CrossRef] [PubMed]
- Kozlowski, L.; Filipowski, T.; Rucinska, M.; Pepinski, W.; Janica, J.; Skawronska, M.; Poznanski, J.; Wojtukiewicz, M.Z. Loss of heterozygosity on chromosomes 2p, 3p, 18q21.3 and 11p15.5 as a poor prognostic factor in stage II and III (FIGO) cervical cancer treated by radiotherapy. Neoplasma 2006, 53, 440–443. [Google Scholar]
- Rao, P.H.; Arias-Pulido, H.; Lu, X.Y.; Harris, C.P.; Vargas, H.; Zhang, F.F.; Narayan, G.; Schneider, A.; Terry, M.B.; Murty, V.V. Chromosomal amplifications, 3q gain and deletions of 2q33-q37 are the frequent genetic changes in cervical carcinoma. BMC Cancer 2004, 4, 5. [Google Scholar] [CrossRef] [PubMed] [Green Version]
- Edelmann, J.; Richter, K.; Hänel, C.; Hering, S.; Horn, L.C. X chromosomal and autosomal loss of heterozygosity and microsatellite instability in human cervical carcinoma. Int. J. Gynecol. Cancer 2006, 16, 1248–1253. [Google Scholar] [CrossRef] [PubMed]
- Thomas, L.K.; Bermejo, J.L.; Vinokurova, S.; Jensen, K.; Bierkens, M.; Steenbergen, R.; Bergmann, M.; von Knebel Doeberitz, M.; Reuschenbach, M. Chromosomal gains and losses in human papillomavirus-associated neoplasia of the lower genital tract—A systematic review and meta-analysis. Eur. J. Cancer 2014, 50, 85–98. [Google Scholar] [CrossRef] [PubMed]
- Wright, T.C.; Compagno, J.; Romano, P.; Grazioli, V.; Verma, Y.; Kershnar, E.; Tafas, T.; Kilpatrick, M.W. Amplification of the 3q chromosomal region as a specific marker in cervical cancer. Am. J. Obstet. Gynecol. 2015. [Google Scholar] [CrossRef]
- Policht, F.A.; Song, M.; Sitailo, S.; O'Hare, A.; Ashfaq, R.; Muller, C.Y.; Morrison, L.E.; King, W.; Sokolova, I.A. Analysis of genetic copy number changes in cervical disease progression. BMC Cancer 2010, 10, 432. [Google Scholar] [CrossRef] [PubMed]
- Luhn, P.; Houldsworth, J.; Cahill, L.; Schiffman, M.; Castle, P.E.; Zuna, R.E.; Dunn, S.T.; Gold, M.A.; Walker, J.; Wentzensen, N. Chromosomal gains measured in cytology samples from women with abnormal cervical cancer screening results. Gynecol. Oncol. 2013, 130, 595–600. [Google Scholar] [CrossRef] [PubMed]
- Lando, M.; Wilting, S.M.; Snipstad, K.; Clancy, T.; Bierkens, M.; Aarnes, E.K.; Holden, M.; Stokke, T.; Sundfør, K.; Holm, R.; et al. Identification of eight candidate target genes of the recurrent 3p12-p14 loss in cervical cancer by integrative genomic profiling. J. Pathol. 2013, 230, 59–69. [Google Scholar] [CrossRef] [PubMed]
- Johnson, L.G.; Schwartz, S.M.; Malkki, M.; Du, Q.; Petersdorf, E.W.; Galloway, D.A.; Madeleine, M.M. Risk of cervical cancer associated with allergies and polymorphisms in genes in the chromosome 5 cytokine cluster. Cancer Epidemiol. Biomarkers Prev. 2011, 20, 199–207. [Google Scholar] [CrossRef] [PubMed]
- Scotto, L.; Narayan, G.; Nandula, S.V.; Subramaniyam, S.; Kaufmann, A.M.; Wright, J.D.; Pothuri, B.; Mansukhani, M.; Schneider, A.; Arias-Pulido, H.; et al. Integrative genomics analysis of chromosome 5p gain in cervical cancer reveals target over-expressed genes, including Drosha. Mol. Cancer 2008, 7, 58. [Google Scholar] [CrossRef] [PubMed]
- Huang, F.Y.; Chiu, P.M.; Tam, K.F.; Kwok, Y.K.; Lau, E.T.; Tang, M.H.; Ng, T.Y.; Liu, V.W.; Cheung, A.N.; Ngan, H.Y. Semi-quantitative fluorescent PCR analysis identifies PRKAA1 on chromosome 5 as a potential candidate cancer gene of cervical cancer. Gynecol. Oncol. 2006, 103, 219–225. [Google Scholar] [CrossRef] [PubMed]
- Schrevel, M.; Gorter, A.; Kolkman-Uljee, S.M.; Trimbos, J.B.; Fleuren, G.J.; Jordanova, E.S. Molecular mechanisms of epidermal growth factor receptor overexpression in patients with cervical cancer. Mod. Pathol. 2011, 24, 720–728. [Google Scholar] [CrossRef] [PubMed]
- Thein, A.; Trková, M.; Fox, M.; Parrington, J. The application of comparative genomic hybridization to previously karyotyped cervical cancer cell lines. Cancer Genet. Cytogenet. 2000, 116, 59–65. [Google Scholar] [CrossRef] [PubMed]
- Mian, C.; Bancher, D.; Kohlberger, P.; Kainz, C.; Haitel, A.; Czerwenka, K.; Stani, J.; Breitenecker, G.; Wiener, H. Fluorescence in situ hybridization in cervical smears: Detection of numerical aberrations of chromosomes 7, 3, and X and relationship to HPV infection. Gynecol. Oncol. 1999, 75, 41–46. [Google Scholar] [CrossRef] [PubMed]
- Ferber, M.J.; Eilers, P.; Schuuring, E.; Fenton, J.A.; Fleuren, G.J.; Kenter, G.; Szuhai, K.; Smith, D.I.; Raap, A.K.; Brink, A.A. Positioning of cervical carcinoma and Burkitt lymphoma translocation breakpoints with respect to the human papillomavirus integration cluster in FRA8C at 8q24.13. Cancer Genet. Cytogenet. 2004, 154, 1–9. [Google Scholar] [CrossRef] [PubMed]
- Sokolova, I.; Algeciras-Schimnich, A.; Song, M.; Sitailo, S.; Policht, F.; Kipp, B.R.; Voss, J.S.; Halling, K.C.; Ruth, A.; King, W.; et al. Chromosomal biomarkers for detection of human papillomavirus associated genomic instability in epithelial cells of cervical cytology specimens. J. Mol. Diagn. 2007, 9, 604–611. [Google Scholar] [CrossRef] [PubMed]
- Bhattacharya, N.; Singh, R.K.; Mondal, S.; Roy, A.; Mondal, R.; Roychowdhury, S.; Panda, C.K. Analysis of molecular alterations in chromosome 8 associated with the development of uterine cervical carcinoma of Indian patients. Gynecol. Oncol. 2004, 95, 352–362. [Google Scholar] [CrossRef] [PubMed]
- Seng, T.J.; Low, J.S.; Li, H.; Cui, Y.; Goh, H.K.; Wong, M.L.; Srivastava, G.; Sidransky, D.; Califano, J.; Steenbergen, R.D.; et al. The major 8p22 tumor suppressor DLC1 is frequently silenced by methylation in both endemic and sporadic nasopharyngeal, esophageal, and cervical carcinomas, and inhibits tumor cell colony formation. Oncogene 2007, 26, 934–944. [Google Scholar] [CrossRef] [PubMed]
- Dellas, A.; Torhorst, J.; Gaudenz, R.; Mihatsch, M.J.; Moch, H. DNA copy number changes in cervical adenocarcinoma. Clin. Cancer Res. 2003, 9, 2985–2991. [Google Scholar] [PubMed]
- Marzano, R.; Corrado, G.; Merola, R.; Sbiroli, C.; Guadagni, F.; Vizza, E.; Del Nonno, F.; Carosi, M.; Galati, M.M.; Sperduti, I.; Cianciulli, A.M. Analysis of chromosomes 3, 7, X and the EGFR gene in uterine cervical cancer progression. Eur. J. Cancer 2004, 40, 1624–1629. [Google Scholar] [CrossRef] [PubMed]
- Hopman, A.H.; Smedts, F.; Dignef, W.; Ummelen, M.; Sonke, G.; Mravunac, M.; Vooijs, G.P.; Speel, E.J.; Ramaekers, F.C. Transition of high-grade cervical intraepithelial neoplasia to micro-invasive carcinoma is characterized by integration of HPV 16/18 and numerical chromosome abnormalities. J. Pathol. 2004, 202, 23–33. [Google Scholar] [CrossRef] [PubMed]
- Tabach, Y.; Kogan-Sakin, I.; Buganim, Y.; Solomon, H.; Goldfinger, N.; Hovland, R.; Ke, X.S.; Oyan, A.M.; Kalland, K.H.; Rotter, V.; et al. Amplification of the 20q chromosomal arm occurs early in tumorigenic transformation and may initiate cancer. PLoS One 2011, 6, e14632. [Google Scholar] [CrossRef] [PubMed]
- Lorenzetto, E.; Brenca, M.; Boeri, M.; Verri, C.; Piccinin, E.; Gasparini, P.; Facchinetti, F.; Rossi, S.; Salvatore, G.; Massimino, M.; et al. YAP1 acts as oncogenic target of 11q22 amplification in multiple cancer subtypes. Oncotarget 2014, 5, 2608–2621. [Google Scholar] [PubMed]
- Kehrmann, A.; Truong, H.; Repenning, A.; Boger, R.; Klein-Hitpass, L.; Pascheberg, U.; Beckmann, A.; Opalka, B.; Kleine-Lowinski, K. Complementation of non-tumorigenicity of HPV18-positive cervical carcinoma cells involves differential mRNA expression of cellular genes including potential tumor suppressor genes on chromosome 11q13. Cancer Genet. 2013, 206, 279–292. [Google Scholar] [CrossRef] [PubMed]
- Mazumder Indra, D.; Mitra, S.; Roy, A.; Mondal, R.K.; Basu, P.S.; Roychoudhury, S.; Chakravarty, R.; Panda, C.K. Alterations of ATM and CADM1 in chromosomal 11q22.3–23.2 region are associated with the development of invasive cervical carcinoma. Hum. Genet. 2011, 130, 735–748. [Google Scholar] [CrossRef] [PubMed]
- Huang, K.F.; Lee, W.Y.; Huang, S.C.; Lin, Y.S.; Kang, C.Y.; Liou, C.P.; Tzeng, C.C. Chromosomal gain of 3q and loss of 11q often associated with nodal metastasis in early stage cervical squamous cell carcinoma. J. Formos. Med. Assoc. 2007, 106, 894–902. [Google Scholar] [CrossRef] [PubMed]
- Rizvi, M.M.; Alam, M.S.; Mehdi, S.J.; Ali, A.; Batra, S. Allelic loss of 10q23.3, the PTEN gene locus in cervical carcinoma from Northern Indian population. Pathol. Oncol. Res. 2012, 18, 309–313. [Google Scholar] [CrossRef] [PubMed]
- Wang, S.; Li, Y.; Han, F.; Hu, J.; Yue, L.; Yu, Y.; Zhang, Y.; He, J.; Zheng, H.; Shi, S.; Fu, X.; Wu, H. Identification and characterization of MARVELD1, a novel nuclear protein that is down-regulated in multiple cancers and silenced by DNA methylation. Cancer Lett. 2009, 282, 77–86. [Google Scholar] [CrossRef] [PubMed]
- Poignée, M.; Backsch, C.; Beer, K.; Jansen, L.; Wagenbach, N.; Stanbridge, E.J.; Kirchmayr, R.; Schneider, A.; Dürst, M. Evidence for a putative senescence gene locus within the chromosomal region 10p14-p15. Cancer Res. 2001, 61, 7118–7121. [Google Scholar] [PubMed]
- Amiel, A.; Kolodizner, T.; Fishman, A.; Gaber, E.; Klein, Z.; Beyth, Y.; Fejgin, M.D. Replication pattern of the p53 and 21q22 loci in the premalignant and malignant stages of carcinoma of the cervix. Cancer 1998, 83, 1966–1971. [Google Scholar] [CrossRef] [PubMed]
- Simpson, S.; Woodworth, C.D.; DiPaolo, J.A. Altered expression of Erg and Ets-2 transcription factors is associated with genetic changes at 21q22.2–22.3 in immortal and cervical carcinoma cell lines. Oncogene 1997, 14, 2149–2157. [Google Scholar] [CrossRef] [PubMed]
- Lennerz, J.K.; Perry, A.; Mills, J.C.; Huettner, P.C.; Pfeifer, J.D. Mucoepidermoid carcinoma of the cervix: another tumor with the t(11;19)-associated CRTC1-MAML2 gene fusion. Am. J. Surg. Pathol. 2009, 33, 835–843. [Google Scholar] [CrossRef] [PubMed]
- Miyai, K.; Furugen, Y.; Matsumoto, T.; Iwabuchi, K.; Hirose, S.; Kinoshita, K.; Fujii, H. Loss of heterozygosity analysis in uterine cervical adenocarcinoma. Gynecol. Oncol. 2004, 94, 115–120. [Google Scholar] [CrossRef] [PubMed]
- Engelmark, M.T.; Ivansson, E.L.; Magnusson, J.J.; Gustavsson, I.M.; Wyöni, P.I.; Ingman, M.; Magnusson, P.K.; Gyllensten, U.B. Polymorphisms in 9q32 and TSCOT are linked to cervical cancer in affected sib-pairs with high mean age at diagnosis. Hum. Genet. 2008, 123, 437–443. [Google Scholar] [CrossRef] [PubMed]
- Jee, K.J.; Kim, Y.T.; Kim, K.R.; Aalto, Y.; Knuutila, S. Amplification at 9p in cervical carcinoma by comparative genomic hybridization. Anal. Cell Pathol. 2001, 22, 159–163. [Google Scholar] [CrossRef] [PubMed]
© 2015 by the authors; licensee MDPI, Basel, Switzerland. This article is an open access article distributed under the terms and conditions of the Creative Commons Attribution license (http://creativecommons.org/licenses/by/4.0/).
Share and Cite
Lorenzo, E.; Camacho-Caceres, K.; Ropelewski, A.J.; Rosas, J.; Ortiz-Mojer, M.; Perez-Marty, L.; Irizarry, J.; Gonzalez, V.; Rodríguez, J.A.; Cabrera-Rios, M.; et al. An Optimization-Driven Analysis Pipeline to Uncover Biomarkers and Signaling Paths: Cervix Cancer. Microarrays 2015, 4, 287-310. https://doi.org/10.3390/microarrays4020287
Lorenzo E, Camacho-Caceres K, Ropelewski AJ, Rosas J, Ortiz-Mojer M, Perez-Marty L, Irizarry J, Gonzalez V, Rodríguez JA, Cabrera-Rios M, et al. An Optimization-Driven Analysis Pipeline to Uncover Biomarkers and Signaling Paths: Cervix Cancer. Microarrays. 2015; 4(2):287-310. https://doi.org/10.3390/microarrays4020287
Chicago/Turabian StyleLorenzo, Enery, Katia Camacho-Caceres, Alexander J. Ropelewski, Juan Rosas, Michael Ortiz-Mojer, Lynn Perez-Marty, Juan Irizarry, Valerie Gonzalez, Jesús A. Rodríguez, Mauricio Cabrera-Rios, and et al. 2015. "An Optimization-Driven Analysis Pipeline to Uncover Biomarkers and Signaling Paths: Cervix Cancer" Microarrays 4, no. 2: 287-310. https://doi.org/10.3390/microarrays4020287