Article

Genetic Predisposition and Disease Expression of Bipolar Disorder Reflected in Shape Changes of the Anterior Limbic Network

1
Department of Biomedical Imaging and Radiological Sciences, National Yang-Ming University, Taipei 11221, Taiwan
2
Institute of Biophotonics, National Yang-Ming University, Taipei 11221, Taiwan
3
Brain Research Center, National Yang-Ming University, Taipei 11221, Taiwan
4
The Neurological Institute, Taipei Municipal Gan-Dau Hospital, Taipei 11260, Taiwan
5
Department of Neurology, Taipei Veterans General Hospital, Taipei 11217, Taiwan
6
Department of Psychiatry, Taipei Veterans General Hospital, Taipei 11217, Taiwan
7
Department of Medical Education and Research, Taipei Veterans General Hospital, Taipei 11217, Taiwan
8
Division of Psychiatry, Faculty of Medicine, National Yang-Ming University, Taipei 11221, Taiwan
9
Department of Psychiatry, Cheng-Hsin General Hospital, Taipei 11220, Taiwan
10
Institute of Brain Science, National Yang-Ming University, Taipei 11221, Taiwan
*
Authors to whom correspondence should be addressed.
Brain Sci. 2019, 9(9), 240; https://doi.org/10.3390/brainsci9090240
Submission received: 29 July 2019 / Revised: 13 September 2019 / Accepted: 16 September 2019 / Published: 19 September 2019

Abstract

:
Bipolar disorder (BD) is a genetically and phenotypically complex psychiatric disease. Although previous studies have suggested that the relatives of BD patients have an increased risk of experiencing affective disturbances, most relatives who have similar genotypes may not manifest the disorder. We aim to identify the neuroimaging alterations—specifically, the cortical folding structures of the anterior limbic network (ALN)—in BD patients and their siblings, compared to healthy controls. The shared alterations in patients and their siblings may indicate the hereditary predisposition of BD, and the altered cortical structures unique to BD patients may be a probe of BD expression. High-resolution, T1-weighted magnetic resonance images for 17 euthymic patients with BD, 17 unaffected siblings of BD patients, and 22 healthy controls were acquired. We categorized the cortical regions within the ALN into sulcal and gyral areas, based on the shape index, followed by the measurement of the folding degree, using the curvedness. Our results revealed that the changes in cortical folding in the orbitofrontal and temporal regions were associated with a hereditary predisposition to BD. Cortical folding structures in multiple regions of the ALN, particularly in the striatal–thalamic circuit and anterior cingulate cortex, could be used to differentiate BD patients from healthy controls and unaffected siblings. We concluded that the cortical folding structures of ALN can provide potential biomarkers for clinical diagnosis of BD and differentiation from the unaffected siblings.

1. Introduction

Bipolar disorder (BD) is a genetically and phenotypically complex psychiatric disease [1,2]. Previous studies have suggested that the unaffected relatives of patients with BD have an increased risk of experiencing affective disturbances than relatives of healthy controls [2,3,4]. Although genetic factors strongly influence the development of BD [5,6,7], most relatives of patients with BD (approximately 60%) who have similar genotypes will not manifest the disorder [8]. An alternative method of examining disease expression of BD is comparing the phenotypes unique to BD patients with those of unaffected relatives and healthy controls. The shared alterations present in both patients with BD and their unaffected relatives, but not present in healthy controls, could be associated with a hereditary predisposition to BD.
Neuroimaging studies based on magnetic resonance imaging (MRI) have been widely used to reveal changes in brain structure associated with disease expression and hereditary predisposition to BD. Meta-analysis studies of structural MRI have demonstrated that reduced volumes of the prefrontal lobe, anterior cingulate cortex, insula, and corpus callosum, as well as increased volumes in the globus pallidus and the lateral ventricles were associated with BD disease expression [9,10,11,12]. Recent studies have further reported that unaffected relatives may have similar changes in brain structure as BD patients. Changes in brain structure associated with hereditary predisposition to BD include changes in the volume of gray matter (GM) in the right inferior frontal gyrus, anterior cingulate cortex, left insula, and striatum [13,14,15,16,17,18,19]. Relatives genetically likely to have BD exhibited small white matter (WM) volumes and impaired WM connectivity in the frontal, temporal–parietal, and parietal regions [14,17,20,21]. The findings of these volumetric studies suggest that changes in the regions of the anterior limbic network (ALN)—i.e., the prefrontal, medial temporal, and subcortical regions—can be a potential marker for disease expression and hereditary predisposition to BD. However, in the majority of previous studies, researchers have detected local changes in the concentration of neuronal cells or cortical volume by using voxel-based morphometric or cortical thickness analysis. The macroscopic alterations in cortical folding structures associated with disease expression and hereditary predisposition to BD have been less explored.
The cortical folding structure is considered to be the substrate for mental state, intelligence, and cognitive functions that distinguish humans from other mammalian species [22,23]. Although the mechanism of cortical folding is unclear, previous studies have provided several hypotheses to explain cortical folding, including a consequence of lateral expansion of GM within the restricted space of the skull [24], tension of WM that connects various cortical regions [25], and the relation between the thickness of the supragranular (i.e., cortical layers I–III) and infragranular (i.e., cortical layers V–VI) layers [23]. Previous research on changes in cortical volume, declines in WM microstructures, and fiber integrity [14,15,16,17,18,19,20,21] have indicated that the cortical folding structures of patients with BD and their unaffected relatives may be disrupted. Several reports have proposed altered folding structures in the prefrontal cortex of patients with BD, measured by the gyrification index or sulcal index [26,27]. Researchers have also observed several cognitive deficits, such as deficits in response inhibition, executive control, verbal memory, and sustained attention, in families that are hereditarily predisposed to BD [28,29,30,31,32]. These findings suggest that the affected cortical structures may be related to the ALN [33]. In this study, we hypothesize that changes in cortical folding structures involved in the ALN could reflect disease expression and hereditary predisposition to BD.
To confirm our hypothesis, we investigated the differences in cortical folding structures between patients with BD, their unaffected siblings, and healthy controls, by using shape index (SI) as well as curvedness (CVD), which is a surfaced-based morphometric method [34,35,36,37]. We have applied this approach to examine fetal brain development [34], and differentiate patients with remitting depression from those with non-remitting depression before medication treatment [36]. The purpose of this study was to determine the following: (1) the brain regions associated with hereditary predisposition to BD, based on the changes in cortical folding structures occurring in patients with BD and their unaffected relatives, but not in healthy controls; (2) the brain regions associated with disease expression of BD, based on the changes in cortical folding structures occurring in patients with BD, but not in unaffected relatives or healthy controls; and (3) the brain regions associated with an absence of BD diagnosis, based on the changes in cortical folding structures occurring in unaffected relatives, but not in patients with BD or healthy controls.

2. Materials and Methods

2.1. Participants

The Institutional Review Board of Taipei Veterans General Hospital approved this study (protocol No. V100E6-002). Overall, 56 participants were recruited with written informed consent, including 17 euthymic patients with bipolar I disorder, 17 unaffected siblings of patients with BD, and 22 healthy controls from Taipei Veterans General Hospital. Clinical psychiatrists confirmed the BD diagnosis in the 17 patients in the BD group (mean age: 42.9 years; 11 males), according to the fourth edition of the Diagnostic and Statistical Manual of Mental Disorders (DSM-IV), and confirmed that the patients had no comorbidities, including schizophrenia, obsessive-compulsive spectrum disorders, and post-traumatic stress disorder. All patients with BD met the criteria for euthymic state, which includes a score of less than 7 on both the Hamilton Depression Rating Scale and Young Mania Rating Scale on the day of imaging. Medication that patients with BD used before their participation in this study included mood stabilizers, atypical antipsychotics, and hypnotic medications. The 17 unaffected siblings (mean age: 42.6 years; 8 males), as well as 22 age- and gender-matched healthy controls (mean age: 42.1 years; 13 males), all underwent the same diagnostic evaluation to confirm the absence of psychiatric illness. All participants were right-handed and had no history of neurological or physical disorders, alcohol or drug dependence, or electroconvulsive therapy. Table 1 lists the demographic and clinical details of all the participants.

2.2. Imaging Data Acquisition and Preprocessing

Three-dimensional, T1-weighted images for each participant were acquired at Taipei Veterans General Hospital by using a Discovery MR750 3T system (GE Healthcare, Chicago, IL, USA), with a rapid acquisition gradient echo. All the participants were instructed to close their eyes, hold still, and relax during the acquisition. The image parameters were repitition time (TR) = 12.2 ms, echo time (TE) = 5.2 ms, flip angle = 12°, field of view (FOV) = 256 × 256 × 168 mm3, matrix size = 256 × 256 × 168, slice thickness = 1 mm, and voxel size = 1 × 1 × 1 mm3.
The skull-stripping and intensity non-uniformity correction on the T1-weighted images were performed using a hybrid watershed algorithm [38], as well as nonparametric, nonuniform intensity normalization [39] implemented by the Freesurfer software (http://surfer.nmr.mgh.harvard.edu). The brain tissue was then further segmented into GM, WM, and cerebrospinal fluid (CSF) areas by using the Statistical Parametric Mapping 12 package (http://www.fil.ion.ucl.ac.uk/spm).

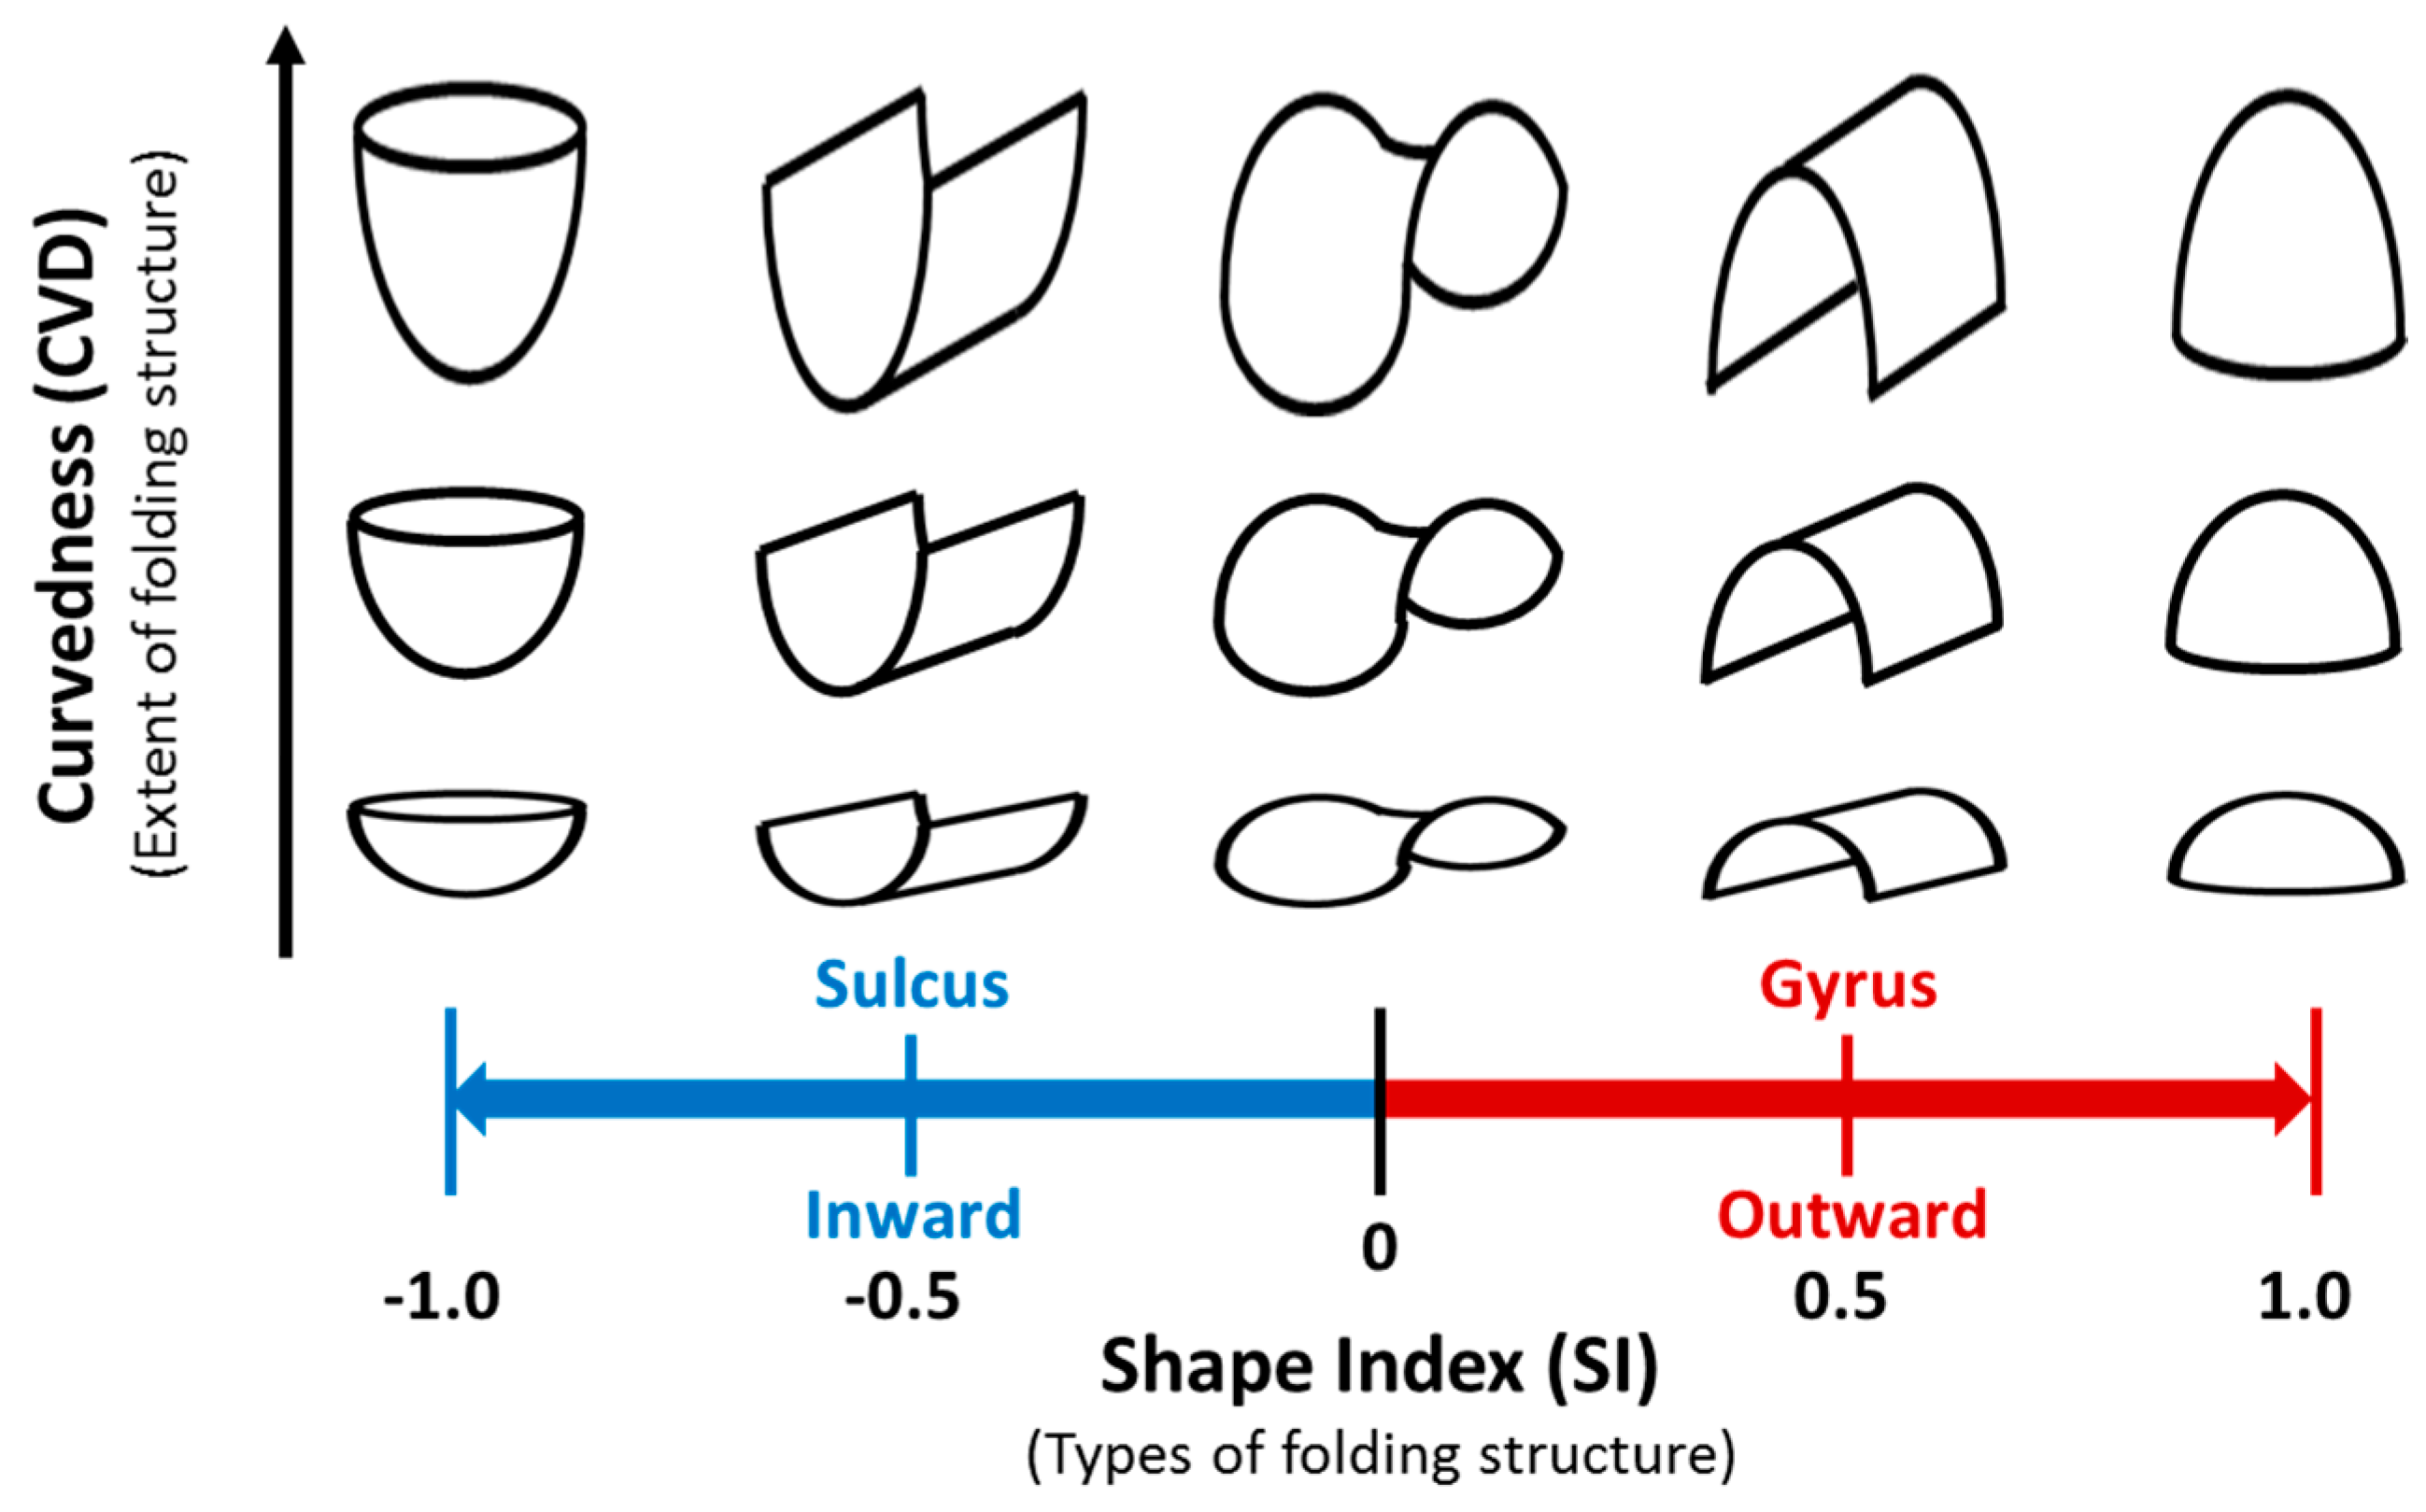
2.3. Cortical Surface Extraction and Shape Analysis

We extracted the GM–WM boundary (i.e., the inner cortical surface), in order to estimate the cortical morphology. The reason that we extracted the inner cortical surface, rather than the outer cortical surface (GM–CSF boundary), was to decrease partial volume errors, which occur frequently on the highly folded outer surface. Additionally, the outer cortical surface contour is difficult to precisely identify when the brain becomes increasingly folded, forming the classical “T” shape [40]. Therefore, we applied cortical shape analysis on the inner cortical surface, in order to obtain consistent and reliable calculations.
Regarding the shape analysis of the cortical folding structure, shape index (SI) and curvedness (CVD) are derived from the polar system of principal curvatures, which includes the maximal (k1) and minimal curvature (k2) [41]. We used the DIPimage toolbox (http://www.diplib.org) to calculate the principal curvatures directly from the binary volume image (i.e., we used the one and zero intensity to represent the volume of WM and other background voxels, respectively), without reconstructing the surface [42]. The SI and CVD from various combinations of k1 and k2 were computed as follows:
SI = 2 π a r c t a n k 2 + k 1 k 2 k 1 ( k 2 k 1 )
CVD = ( k 1 2 + k 2 2 2 ) 1 / 2
The SI values range between −1 and 1, whereas the CVD values are always positive, representing the extent of the folding structure (Figure 1).
The surface areas were further separated into two categories—namely, the gyral surface (an outward structure with SI > 0) and the sulcal surface (an inward structure with SI < 0; Figure 1). The separation between the gyral and sulcal surfaces can effectively evaluate morphological changes in brain development [34] and degeneration [36]. To investigate the cortical shape changes of the ALN, we calculated the mean CVD values of the gyral and sulcal surfaces separately in the orbital frontal cortex, anterior temporal cortex, anterior cingulate cortex, hippocampus, parahippocampal gyrus, amygdala, thalamus, and striatum [43] (covering 14 regions of the Anatomical Automatic Labeling atlas [44]) in each hemisphere.

2.4. Statistical Analysis for Group Comparison

We examined the group differences in the mean CVD values of cortical regions within the ALN using one-way analysis of variance statistics (p < 0.05). We conducted a post-hoc, pairwise t-tests (patients with BD vs. healthy controls, patients with BD vs. unaffected siblings, and unaffected siblings vs. healthy controls) with Bonferroni correction for multiple comparisons.

3. Results

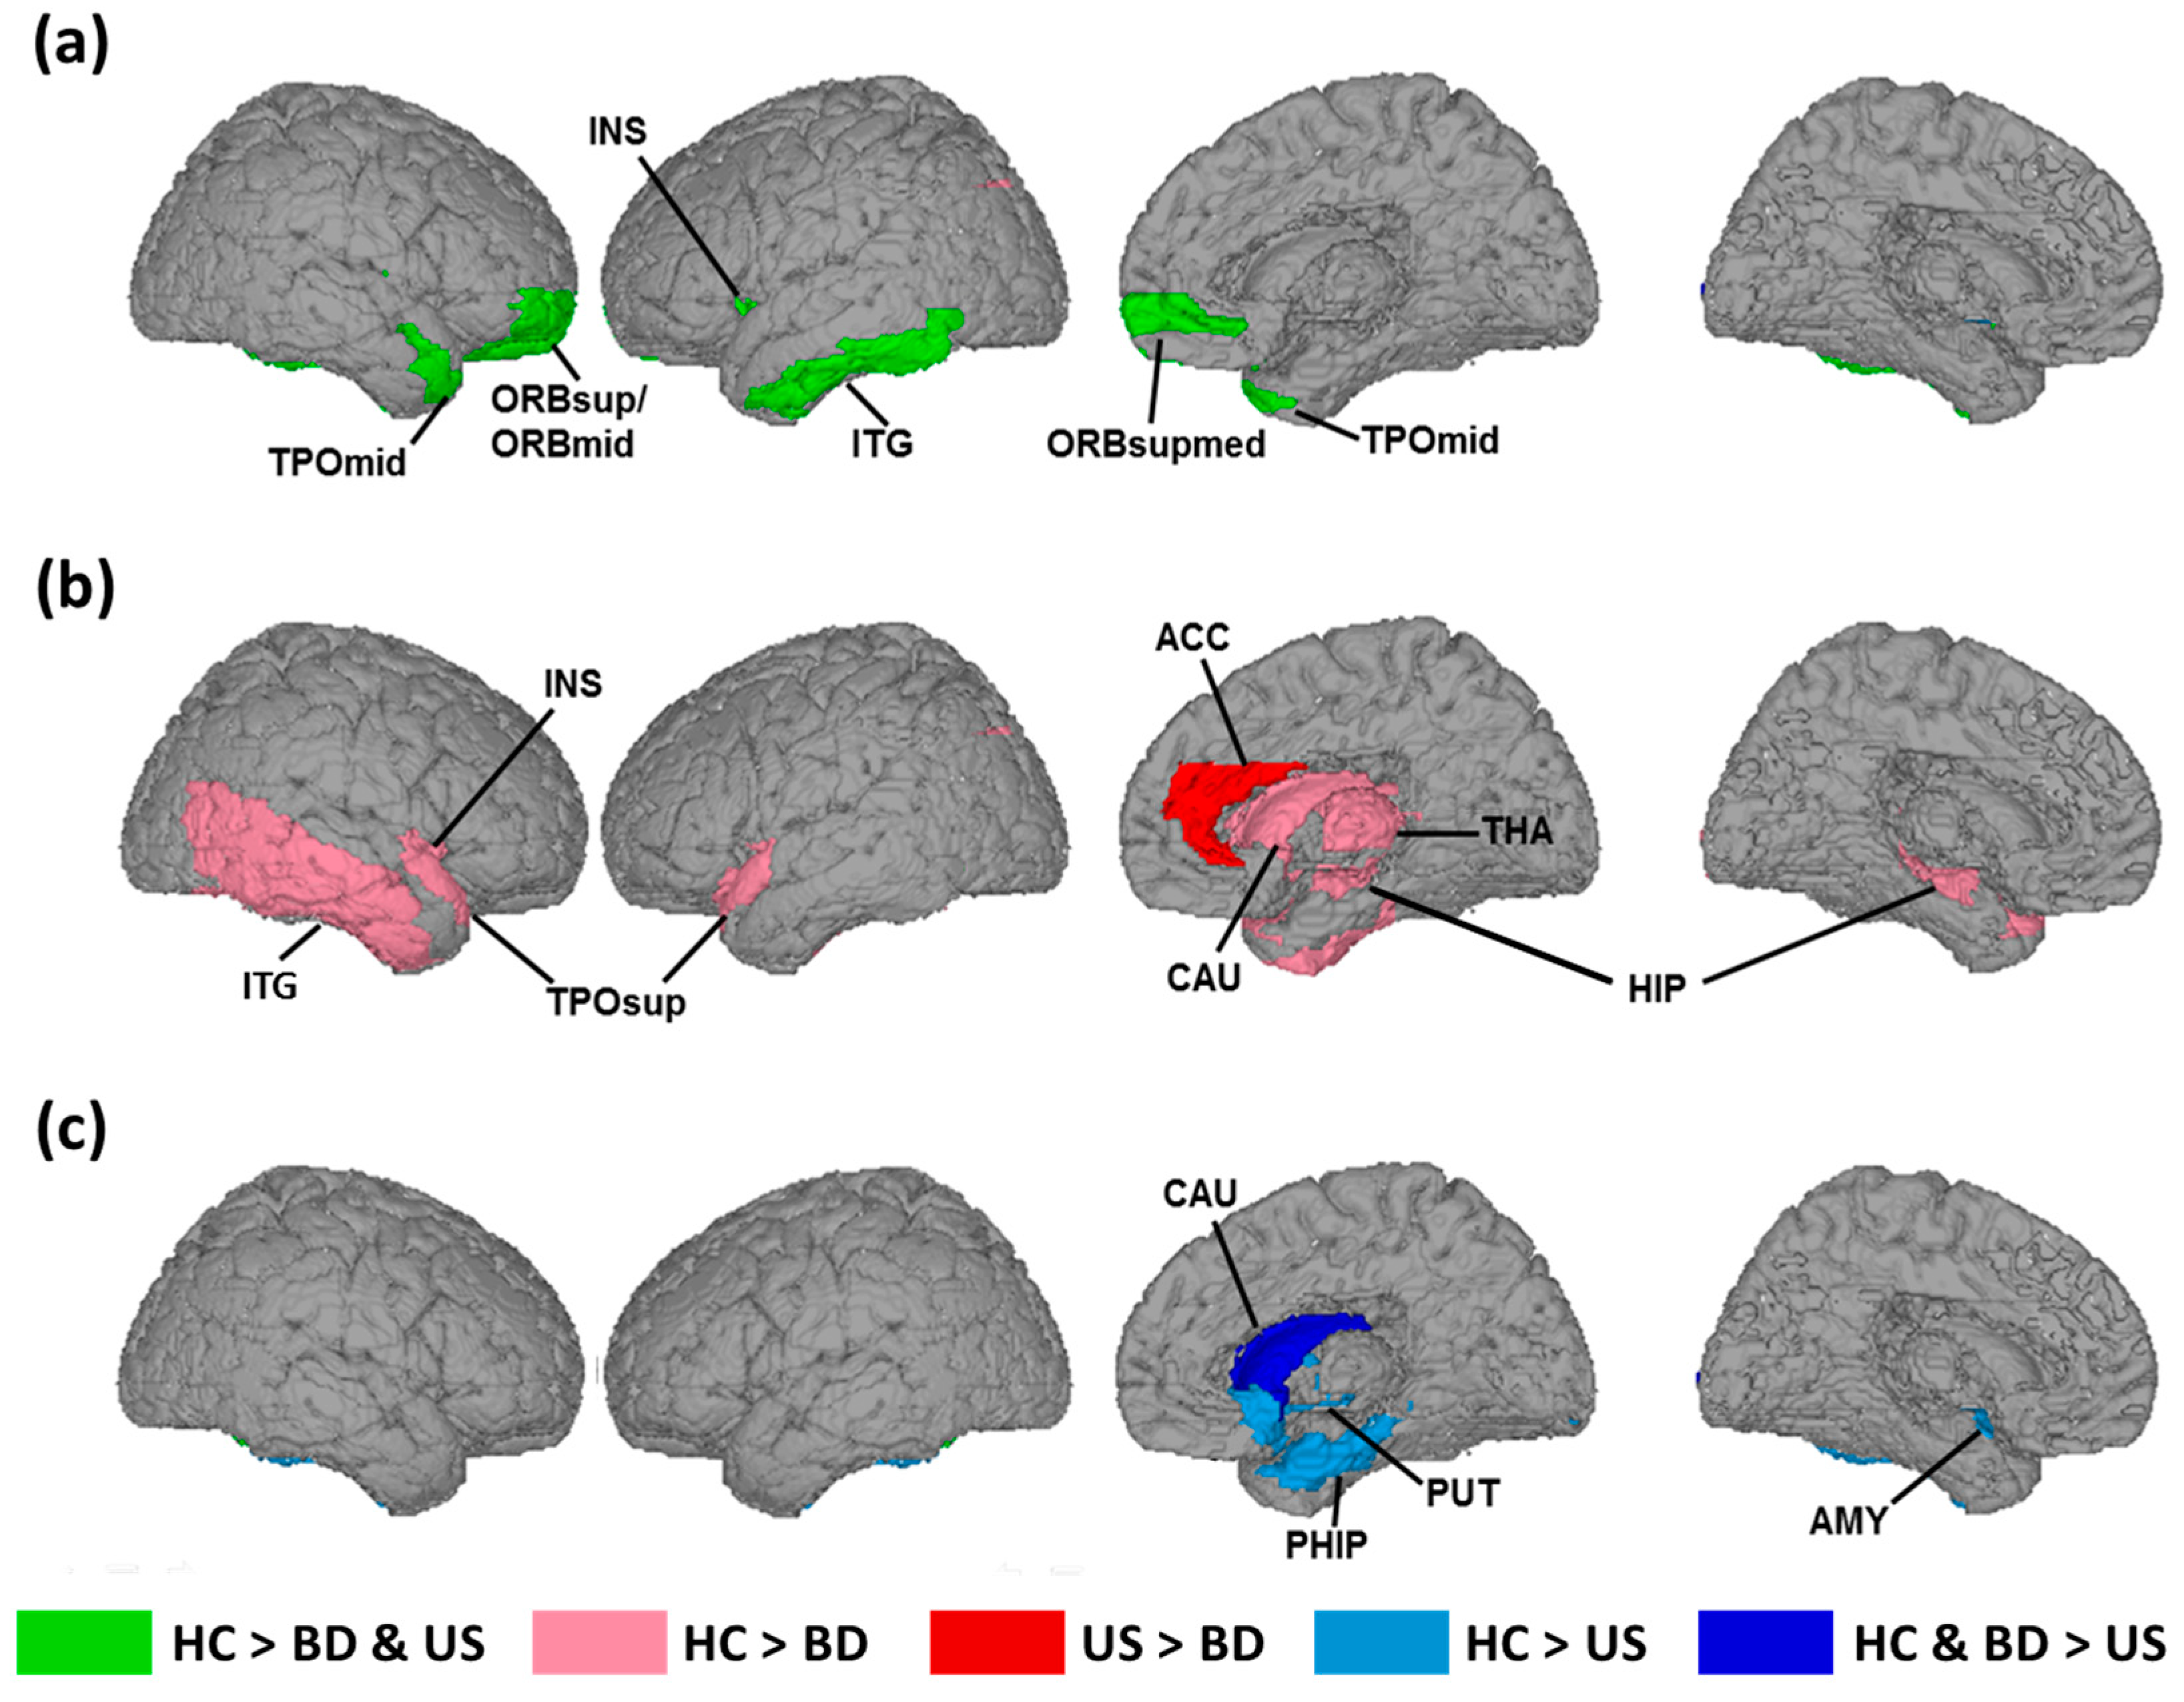
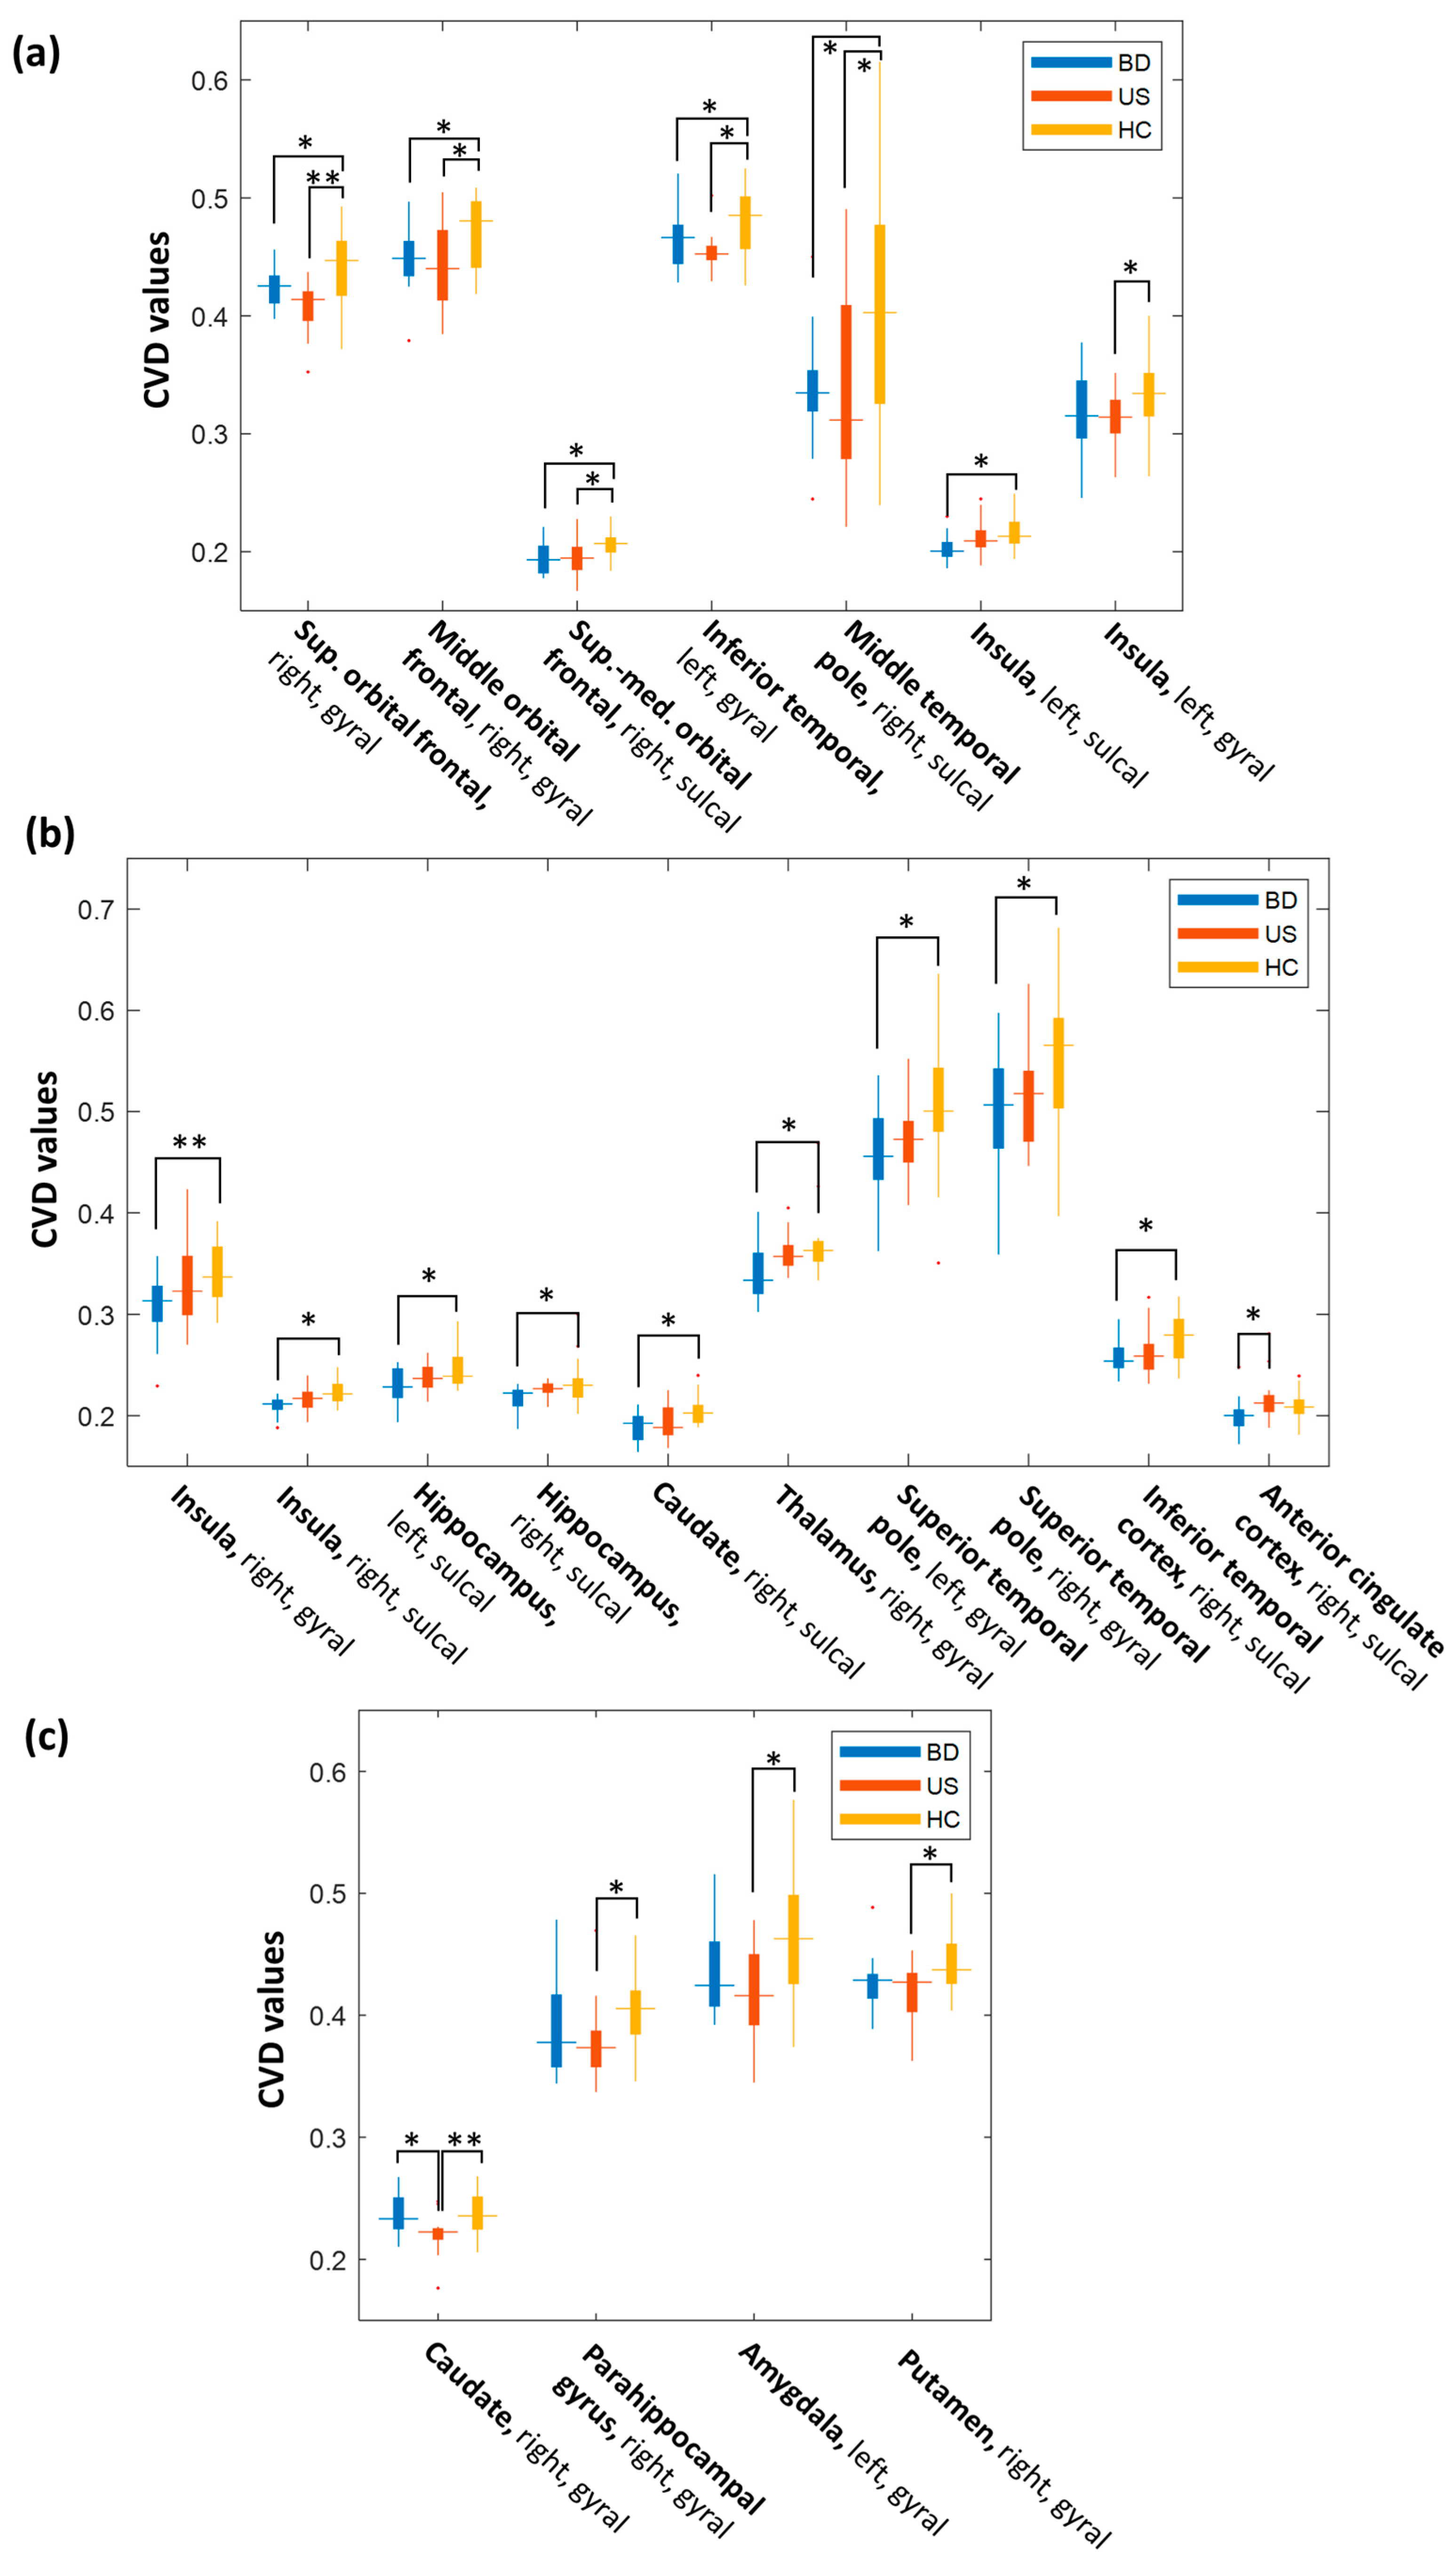
3.1. Changes in the Cortical Folding associated with Hereditary Predisposition to Bipolar Disorder

The multiple comparison tests (p < 0.05 with Bonferroni correction) demonstrated that both the patients with BD and unaffected siblings exhibited significantly lower CVD values in the orbitofrontal and temporal regions than did the healthy controls (Figure 2a, Table 2, and Figure 3a). Specifically, the CVD values of the patients with BD and unaffected siblings decreased significantly on the right superior and middle orbitofrontal gyral surfaces, as well as on the right superior-medial orbitofrontal sulcal surface. In the temporal region, we observed significantly lower CVD values on the left inferior temporal gyral surface in BD patients and unaffected siblings, compared to the healthy controls.
We also observed that the patients with BD and unaffected siblings exhibited decreased CVD values in the same brain region, but in different surface categories. In the left insula, we observed significantly low CVD values on the sulcal surfaces of the patients with BD, but on the gyral surfaces of the unaffected siblings.

3.2. Changes in Cortical Folding associated with Disease Expression of BD

The patients with BD also exhibited significantly lower CVD values in the several regions of the ALN than did the healthy controls (Figure 2b, Table 3, and Figure 3b). Specifically, patients with BD exhibited disruption in the cortical folding structures of the right insula, bilateral hippocampus, right caudate, right thalamus, bilateral superior temporal poles, and right inferior temporal gyrus. The majority of changes in the cortical folding structures of patients with BD occurred on the sulcal surfaces. However, the CVD values of these regions did not statistically differ from those of the unaffected siblings.
We observed that the CVD value of the sulcal surface of the anterior cingulate cortex of patients with BD was significantly lower than that of the unaffected siblings.

3.3. Changes in Cortical Folding Associated with the Absence of Bipolar Disorder Diagnosis

We observed significant cortical folding changes uniquely associated with the absence of a clinical diagnosis of BD in the unaffected siblings in the right caudate gyral surfaces (Figure 2c, Table 4, and Figure 3c). The unaffected siblings exhibited lower CVD values in these two regions than did the healthy controls and the patients with BD.
Compared with the healthy controls, the unaffected siblings exhibited significantly lower CVD values on several gyral surfaces of the ALN, including the right parahippocampus, left amygdala, and right putamen.

4. Discussion

This study investigated the differences in the cortical folding structures of ALN between patients with BD, unaffected siblings, and healthy controls, by using combined SI and CVD analysis. We found that cortical folding changes in the orbitofrontal and temporal regions were associated with a hereditary predisposition to BD. Furthermore, disease expression of BD was associated with the disruption of folding structures in the striatal–thalamic circuit and the anterior cingulate cortex, compared to the healthy controls and unaffected siblings.

4.1. Neurobiological Basis of Changes in Cortical Folding Structure

Previous studies have reported the BD-related changes in cortical folding structures [45]. McIntoch et al. demonstrated that patients with BD exhibited reduced folding complexity in the prefrontal cortex, by using a gyrification index to determine the degree of gyral convolution [26]. Penttilä et al. discovered decreased sulcal patterns in the right prefrontal regions of patients with BD by using a sulcal index, which was the ratio between the sulcal area and total outer cortex area [27,46]. Our findings supplement previous studies on folding changes in patients with BD, to reveal associations between cortical folding structures, hereditary predisposition, and disease expression of BD. Our results also indicate that disease expression of BD could disrupt the cortical folding structures within the ALN. Previous studies have suggested that genetic and environmental factors cause variations in the fetal-to-childhood folding formation process [22,47,48]. The results of our research on both patients with BD and unaffected siblings confirm that the hereditary predisposition and familial risk for BD could alter the cortical folding patterns of ALN.
Measuring cortical folding structures provides macroscopic information on the underlying architectures of the brains of patients with BD and unaffected relatives, which cannot be obtained by examining local GM and WM changes alone. Although several hypotheses have proposed explanations for the mechanisms underlying cortex folding, previous studies have suggested that folding patterns may be influenced by multiple factors [22]. Mota et al. proposed that cortical folding is driven by WM connectivity, and is affected by the fraction of cortical neurons connected through the WM and the average cross-sectional area of the axons in the WM [24]. Accordingly, disruptions in folding cortices (i.e., reduced CVD or flattened sulcogyral patterns) may be related to impaired WM connectivity [20,21,49], as well as the decreased cortical volume and thickness connected through WM [14,17,20,21].

4.2. Changes in Cortical Folding Associated with Hereditary Predisposition to Bipolar Disorder

The patients with BD and the unaffected siblings presented disruptions in the cortical folding structures in the orbitofrontal and temporal regions that were not present in the healthy controls (Figure 2a, Table 2, and Figure 3a). Previous studies on twins and families have reported that the structures of these regions are highly heritable [50,51]. The orbitofrontal and temporal regions are not only the components of the ALN, but also resemble the regions in the default mode network that are involved in internal mentation, as well as in emotional and self-referential processing [52,53]. The abnormality of functional connections within the default mode network was identified in the BD patients, as well as in their unaffected first-degree relatives, based on an functional magnetic resonance imaging (fMRI) study [54]. The decline in cortical folding structures in these regions could result in the functional changes of mental representation associated with hereditary predisposition to BD.
We also observed significant folding changes in the left insula of patients with BD. The insula integrates interoception and sensory afferents to generate subjective emotions, and regulates homeostasis and mental states [55,56]. The volume of the left insula could be an indication of emotional dysregulation related to the hereditary predisposition to BD [16,17]. In this study, we observed flattening on the sulcal surfaces of the left insula of patients with BD, as well as on the gyral surfaces of the left insula of the unaffected siblings. Our results support the finding that changes in surface morphology occur mainly in the sulcal areas in patients with BD [27,46].

4.3. Changes in Cortical Folding Associated with Disease Expression of Bipolar Disorder

The patients with BD exhibited more affected ALN regions, including the insula, hippocampus, temporal regions, and the striatal–thalamic circuit, such as the caudate and thalamus (Figure 2b, Table 3, and Figure 3b). The striatum–thalamic circuit is the core of the ALN, and regulates socioemotional behaviors related to changes in a person’s emotions, relations with others, and self-concept [33,43]. The temporal regions involved in emotional regulation and reward processing modulate the striatal and frontal regions [57,58]. The results of our previous fMRI study on the functional connectivity of various regions of the brain demonstrated alterations in the striatal–thalamic connectivity of patients with BD [59]. We observed fewer differences in altered ALN regions between unaffected siblings and healthy controls than between patients with BD and healthy controls. In particular, the striatal and thalamic regions exhibited no significant changes between unaffected siblings and healthy controls. Our results suggest that a higher number of affected ALN regions and the involvement of the striatal–thalamic circuit could be associated with disease expression of BD.
We observed significant folding differences in the right anterior cingulate cortex between patients with BD and the unaffected siblings (Figure 2b, Table 3, and Figure 3b). The anterior cingulate cortex is central to integrating emotional and cognitive information for supporting emotional regulation, attention and executive functions, error detection, and working memory [60,61]. Fornito et al. showed that the morphology of the anterior cingulate cortex is associated with executive functions [62]. Furthermore, Tissier et al. proposed that the sulcal pattern of the anterior cingulate cortex may contribute to the function of inhibitory control [63]. Several studies have reported that abnormalities in the anterior cingulate cortex are associated with the affective and cognitive deficits of patients with BD [64,65,66]. A previous study has also suggested that structural alteration of the anterior cingulate cortex is a risk marker of psychosis, which can appear in patients with bipolar I disorder [67] and their relatives [68]. Fornito et al. demonstrated that high-risk individuals who developed a psychotic episode exhibited thinning of the anterior cingulate cortex [67]. In our BD group, more than half of patients (approximately 64.7%) had previously presented with psychotic symptoms (Table 1), resulting in significant changes in the cortical morphology of the anterior cingulate cortex. Based on our results, disruptions in the folding structure of the anterior cingulate cortex in family members hereditarily predisposed to BD could indicate psychotic and cognitive symptoms associated with disease expression of BD.

4.4. Cortical Folding Structures Associated with an Absence of Diagnosis for Unaffected Siblings

The unaffected siblings exhibited significantly decreased CVD in several regions of the ALN, compared with healthy controls (Figure 2c, Table 4, and Figure 3c). These changes in the ALN occurred mainly in the circuit composed of the amygdala, parahippocampus, and subcortical structures. The amygdala, parahippocampus, and striatum are subserved in emotional perception, regulation, expression, and memory [69,70,71]. Several functional studies have indicated that unaffected relatives of patients with BD exhibit hyperactivity of the amygdala and putamen when watching emotional faces [70,72]. Two previous structural studies have reported volumetric changes in the amygdala and hippocampus of unaffected relatives of patients with BD [73,74]. The results of our study support the findings of these studies, and provide information on potential structural substrates associated with facial emotional processing that unaffected relatives of patients with BD might lack.

4.5. Further Considerations

Several concerns regarding this study should be mentioned. First, the shared and unique folding changes in the patients with BD and unaffected siblings that did not occur in the healthy controls could be caused by genetic–environmental interactions, rather than a genetic susceptibility. The second concern is that we are unable to assess the actual degree of risk for developing BD in the unaffected siblings of patients with BD. The mean age (42.6 years) of the unaffected siblings in this study was close to the late onset age of BD (40–45 years) [27,75]. Follow-up examination of the folding abnormalities in the younger unaffected siblings could be useful for actually predicting BD onset. The third concern is the medications that the patients with BD used before their participation in this study. Previous studies have demonstrated that the administration of mood stabilizers, such as lithium carbonate and valproic acid, over 2 to 6 months may increase the volume of prefrontal, hippocampal, and cingulate GM volumes, which may cause a neurotrophic effect [76,77]. In our study, two patients with BD took lithium carbonate, and 13 patients took valproic acid. However, the duration of medication use prior to participation in the study was less than 1 month. Therefore, we assumed that the medications may have a minor effect on our results. Finally, this study only included a small cohort of patients with BD and their siblings, due to the difficulty in enrolling participants that matched all the inclusion criteria (i.e., patients with euthymic status and with no comorbidities, including schizophrenia, obsessive-compulsive spectrum disorders, and post-traumatic stress disorder). With these rigorous inclusion criteria, we believe that this study can provide meaningful preliminary results to facilitate subsequent studies on this field. However, because of the limited sample size of this study, we did not apply the correction of multiple comparisons for the brain regions, which typically demands a larger number of participants to obtain a significant change. Accordingly, our exploratory analyses should be replicated on an independent and larger sample size to confirm the findings.

5. Conclusions

This study investigated the differences in cortical folding structures for BD patients and their unaffected siblings, compared with healthy controls, by using combined SI and CVD analysis. The folding structures in the orbitofrontal and temporal regions of the ALN are associated with a hereditary predisposition to BD. On the other hand, disease expression of BD is associated with disrupted folding structures in the ALN regions, especially the striatal–thalamic circuit and the anterior cingulate cortex. Our results demonstrate that cortical folding structures can reflect hereditary predisposition and disease expression of BD.

Author Contributions

Conceptualization, C.-F.L., Y.-T.W., P.-S.W., and C.-T.L.; methodology, C.-F.L., Y.-T.W., C.-W.J., and S.T.; software, C.-F.L. and S.T.; validation, C.-F.L., Y.-T.W., and S.T.; formal analysis, C.-F.L. and S.T.; investigation, C.-F.L., Y.-T.W., S.T., P.-S.W., and C.-T.L.; resources, T.-P.S., P.-C.T., Y.-T.W., and C.-T.L.; data curation, T.-P.S., P.C.T., and C.-T.L.; writing—original draft preparation, C.-F.L. and S.T.; writing—review and editing, C.-F.L., Y.-T.W., S.T. P.-S.W., and C.-T.L.; supervision, T.-P.S., Y.-T.W., and C.-T.L.; project administration, T.-P.S., Y.-T.W., and C.-T.L.; funding acquisition, C.-F.L., Y.-T.W., and C.-T.L.

Funding

This work was supported by the Ministry of Science and Technology, Taiwan (MOST106-2314-B-010-058-MY2, MOST106-2221-E-010-016-MY3, and MOST106-2221-E-010-010-MY2). The funding sources had no role in the design and conduct of the study; in the collection, management, analysis, or interpretation of the data; in the preparation, review, or approval of the manuscript; and in the decision to submit the manuscript for publication.

Conflicts of Interest

The authors declare no conflict of interest.

References

  1. Goes, F.S.; Pirooznia, M.; Parla, J.S.; Kramer, M.; Ghiban, E.; Mavruk, S.; Chen, Y.-C.; Monson, E.T.; Willour, V.L.; Karchin, R. Exome sequencing of familial bipolar disorder. JAMA Psychiatry 2016, 73, 590–597. [Google Scholar] [CrossRef] [PubMed]
  2. Smoller, J.W.; Finn, C.T. Family, twin, and adoption studies of bipolar disorder. Am. J. Med. Genet. Part C 2003, 123, 48–58. [Google Scholar] [CrossRef] [PubMed]
  3. Goodwin, F.; Jamison, K. Manic-Depressive Illness. Bipolar Disorders and Recurrent Depression, 2nd ed.; Oxford University Press: New York, NY, USA, 2007. [Google Scholar]
  4. Heun, R.; Maier, W. The distinction of bipolar II disorder from bipolar I and recurrent unipolar depression: Results of a controlled family study. Acta Psychiatr. Scand. 1993, 87, 279–284. [Google Scholar] [CrossRef] [PubMed]
  5. Cardno, A.G.; Marshall, E.J.; Coid, B.; Macdonald, A.M.; Ribchester, T.R.; Davies, N.J.; Venturi, P.; Jones, L.A.; Lewis, S.W.; Sham, P.C. Heritability estimates for psychotic disorders: The Maudsley twin psychosis series. Arch. Gen. Psychiatry 1999, 56, 162–168. [Google Scholar] [CrossRef] [PubMed]
  6. Martinez, D.; Millischer, V.; Michelon, L.; Camilo, C.; Brentani, H.; Esteban, N.; Krieger, J.; Pereira, A.; Lavebratt, C.; Schalling, M. High Heritability of Telomere Length In Families With Bipolar Disorder. Eur. Neuropsychopharmacol. 2017, 27, S387. [Google Scholar] [CrossRef]
  7. Stahl, E.A.; Breen, G.; Forstner, A.J.; McQuillin, A.; Ripke, S.; Trubetskoy, V.; Mattheisen, M.; Wang, Y.; Coleman, J.R.; Gaspar, H.A. Genome-wide association study identifies 30 loci associated with bipolar disorder. Nat. Genet. 2019, 51, 793. [Google Scholar] [CrossRef] [PubMed]
  8. Shih, R.A.; Belmonte, P.L.; Zandi, P.P. A review of the evidence from family, twin and adoption studies for a genetic contribution to adult psychiatric disorders. Int. Rev. Psychiatry 2004, 16, 260–283. [Google Scholar] [CrossRef] [PubMed]
  9. Hibar, D.; Westlye, L.T.; Doan, N.T.; Jahanshad, N.; Cheung, J.; Ching, C.R.; Versace, A.; Bilderbeck, A.; Uhlmann, A.; Mwangi, B. Cortical abnormalities in bipolar disorder: An MRI analysis of 6503 individuals from the ENIGMA Bipolar Disorder Working Group. Mol. Psychiatry 2018, 23, 932. [Google Scholar] [CrossRef]
  10. Arnone, D.; Cavanagh, J.; Gerber, D.; Lawrie, S.M.; Ebmeier, K.P.; McIntosh, A.M. Magnetic resonance imaging studies in bipolar disorder and schizophrenia: Meta-analysis. Br. J. Psychiatry 2009, 195, 194–201. [Google Scholar] [CrossRef]
  11. Kempton, M.J.; Geddes, J.R.; Ettinger, U.; Williams, S.R.; Grasby, P.M. Meta-analysis, database, and meta-regression of 98 structural imaging studies in bipolar disorder. Arch. Gen. Psychiatry 2008, 65, 1017–1032. [Google Scholar] [CrossRef]
  12. Ellison-Wright, I.; Bullmore, E. Anatomy of bipolar disorder and schizophrenia: A meta-analysis. Schizophr. Res. 2010, 117, 1–12. [Google Scholar] [CrossRef] [PubMed]
  13. Frangou, S. Neuroimaging Markers of Risk, Disease Expression, and Resilience to Bipolar Disorder. Curr. Psychiatry Rep. 2019, 21, 52. [Google Scholar] [CrossRef] [PubMed]
  14. McDonald, C.; Bullmore, E.T.; Sham, P.C.; Chitnis, X.; Wickham, H.; Bramon, E.; Murray, R.M. Association of genetic risks for schizophrenia and bipolar disorder with specific and generic brain structural endophenotypes. Arch. Gen. Psychiatry 2004, 61, 974. [Google Scholar] [CrossRef] [PubMed]
  15. Hajek, T.; Cullis, J.; Novak, T.; Kopecek, M.; Blagdon, R.; Propper, L.; Stopkova, P.; Duffy, A.; Hoschl, C.; Uher, R. Brain structural signature of familial predisposition for bipolar disorder: Replicable evidence for involvement of the right inferior frontal gyrus. Biol. Psychiatry 2013, 73, 144–152. [Google Scholar] [CrossRef] [PubMed]
  16. Kempton, M.J.; Haldane, M.; Jogia, J.; Grasby, P.M.; Collier, D.; Frangou, S. Dissociable Brain Structural Changes Associated with Predisposition, Resilience, and Disease Expression in Bipolar Disorder. J. Neurosci. 2009, 29, 10863–10868. [Google Scholar] [CrossRef] [PubMed]
  17. Matsuo, K.; Kopecek, M.; Nicoletti, M.; Hatch, J.; Watanabe, Y.; Nery, F.; Zunta-Soares, G.; Soares, J. New structural brain imaging endophenotype in bipolar disorder. Mol. Psychiatry 2011, 17, 412–420. [Google Scholar] [CrossRef] [PubMed]
  18. McIntosh, A.M.; Job, D.E.; Moorhead, T.W.J.; Harrison, L.K.; Forrester, K.; Lawrie, S.M.; Johnstone, E.C. Voxel-based morphometry of patients with schizophrenia or bipolar disorder and their unaffected relatives. Biol. Psychiatry 2004, 56, 544–552. [Google Scholar] [CrossRef]
  19. Noga, J.T.; Vladar, K.; Torrey, E.F. A volumetric magnetic resonance imaging study of monozygotic twins discordant for bipolar disorder. Psychiatry Res. 2001, 106, 25–34. [Google Scholar] [CrossRef]
  20. Chaddock, C.A.; Barker, G.J.; Marshall, N.; Schulze, K.; Hall, M.H.; Fern, A.; Walshe, M.; Bramon, E.; Chitnis, X.A.; Murray, R.; et al. White matter microstructural impairments and genetic liability to familial bipolar I disorder. Br. J. Psychiatry 2009, 194, 527–534. [Google Scholar] [CrossRef] [Green Version]
  21. Sprooten, E.; Sussmann, J.E.; Clugston, A.; Peel, A.; McKirdy, J.; Moorhead, T.W.J.; Anderson, S.; Shand, A.J.; Giles, S.; Bastin, M.E.; et al. White Matter Integrity in Individuals at High Genetic Risk of Bipolar Disorder. Biol. Psychiatry 2011, 70, 350–356. [Google Scholar] [CrossRef]
  22. Zilles, K.; Palomero-Gallagher, N.; Amunts, K. Development of cortical folding during evolution and ontogeny. Trends Neurosci. 2013, 36, 275–284. [Google Scholar] [CrossRef] [PubMed]
  23. Kriegstein, A.; Noctor, S.; Martínez-Cerdeño, V. Patterns of neural stem and progenitor cell division may underlie evolutionary cortical expansion. Nat. Rev. Neurosci. 2006, 7, 883–890. [Google Scholar] [CrossRef] [PubMed]
  24. Mota, B.; Herculano-Houzel, S. How the cortex gets its folds: An inside-out, connectivity-driven model for the scaling of mammalian cortical folding. Front. Neuroanat. 2012, 6, 3. [Google Scholar] [CrossRef] [PubMed]
  25. Van Essen, D.C. A tension-based theory of morphogenesis and compact wiring in the central nervous system. Nature 1997, 385, 313–318. [Google Scholar] [CrossRef] [PubMed]
  26. McIntosh, A.; Moorhead, T.; McKirdy, J.; Hall, J.; Sussmann, J.; Stanfield, A.; Harris, J.; Johnstone, E.; Lawrie, S. Prefrontal gyral folding and its cognitive correlates in bipolar disorder and schizophrenia. Acta Psychiatr. Scand. 2009, 119, 192–198. [Google Scholar] [CrossRef] [PubMed]
  27. Penttilä, J.; Cachia, A.; Martinot, J.L.; Ringuenet, D.; Wessa, M.; Houenou, J.; Galinowski, A.; Bellivier, F.; Gallarda, T.; Duchesnay, E. Cortical folding difference between patients with early-onset and patients with intermediate-onset bipolar disorder. Bipolar Disord. 2009, 11, 361–370. [Google Scholar] [CrossRef] [PubMed]
  28. Moreno, M.P.V.; Bücker, J.; Burke, K.P.; Czepielewski, L.S.; Santos, B.T.; Fijtman, A.; Passos, I.C.; Kunz, M.; Bonnin, C.D.M.; Vieta, E. Cognitive performance and psychosocial functioning in patients with bipolar disorder, unaffected siblings, and healthy controls. Braz. J. Psychiatry 2016, 38, 275–280. [Google Scholar] [CrossRef] [PubMed] [Green Version]
  29. Trivedi, J.K.; Goel, D.; Dhyani, M.; Sharma, S.; Singh, A.P.; Sinha, P.K.; Tandon, R. Neurocognition in first-degree healthy relatives (siblings) of bipolar affective disorder patients. Psychiatry Clin. Neurosci. 2008, 62, 190–196. [Google Scholar] [CrossRef] [PubMed]
  30. Kulkarni, S.; Jain, S.; Janardhan Reddy, Y.; Kumar, K.J.; Kandavel, T. Impairment of verbal learning and memory and executive function in unaffected siblings of probands with bipolar disorder. Bipolar Disord. 2010, 12, 647–656. [Google Scholar] [CrossRef]
  31. Bora, E.; Yucel, M.; Pantelis, C. Cognitive endophenotypes of bipolar disorder: A meta-analysis of neuropsychological deficits in euthymic patients and their first-degree relatives. J. Affect. Disord. 2009, 113, 1–20. [Google Scholar] [CrossRef]
  32. Arts, B.; Jabben, N.; Krabbendam, L.; Van Os, J. Meta-analyses of cognitive functioning in euthymic bipolar patients and their first-degree relatives. Psychol. Med. 2008, 38, 771–786. [Google Scholar] [CrossRef] [PubMed]
  33. Adler, C.M.; DelBello, M.P.; Strakowski, S.M. Brain network dysfunction in bipolar disorder. CNS Spectr. 2006, 11, 312. [Google Scholar] [CrossRef] [PubMed]
  34. Hu, H.-H.; Chen, H.-Y.; Hung, C.-I.; Guo, W.-Y.; Wu, Y.-T. Shape and curvedness analysis of brain morphology using human fetal magnetic resonance images in utero. Brain Struct. Funct. 2012, 218, 1–12. [Google Scholar] [CrossRef] [PubMed]
  35. Lu, C.-F.; Wang, P.-S.; Lao, Y.-L.; Wu, H.-M.; Soong, B.-W.; Wu, Y.-T. Medullo-ponto-cerebellar white matter degeneration altered brain network organization and cortical morphology in multiple system atrophy. Brain Struct. Funct. 2014, 219, 947–958. [Google Scholar] [CrossRef] [PubMed]
  36. Liao, Y.-L.; Wang, P.-S.; Lu, C.-F.; Hung, C.-I.; Li, C.-T.; Lin, C.-P.; Hsieh, J.-C.; Su, T.-P.; Wu, Y.-T. Cortical Shape and Curvedness Analysis of Structural Deficits in Remitting and Non-Remitting Depression. PLoS ONE 2013, 8, e68625. [Google Scholar] [CrossRef]
  37. Awate, S.P.; Yushkevich, P.A.; Song, Z.; Licht, D.J.; Gee, J.C. Cerebral cortical folding analysis with multivariate modeling and testing: Studies on gender differences and neonatal development. Neuroimage 2010, 53, 450–459. [Google Scholar] [CrossRef] [PubMed] [Green Version]
  38. Segonne, F.; Dale, A.; Busa, E.; Glessner, M.; Salat, D.; Hahn, H.; Fischl, B. A hybrid approach to the skull stripping problem in MRI. Neuroimage 2004, 22, 1060–1075. [Google Scholar] [CrossRef]
  39. Sled, J.G.; Zijdenbos, A.P.; Evans, A.C. A nonparametric method for automatic correction of intensity nonuniformity in MRI data. IEEE Trans. Med. Imaging 1998, 17, 87–97. [Google Scholar] [CrossRef]
  40. Li, K.; Guo, L.; Li, G.; Nie, J.; Faraco, C.; Cui, G.; Zhao, Q.; Miller, L.S.; Liu, T. Gyral folding pattern analysis via surface profiling. Neuroimage 2010, 52, 1202–1214. [Google Scholar] [CrossRef] [Green Version]
  41. Koenderink, J.J.; van Doorn, A.J. Surface shape and curvature scales. Image Vis. Comput. 1992, 10, 557–564. [Google Scholar] [CrossRef]
  42. Thirion, J.-P.; Gourdon, A. Computing the differential characteristics of isointensity surfaces. Comput. Vis. Image Underst. 1995, 61, 190–202. [Google Scholar] [CrossRef]
  43. Rajmohan, V.; Mohandas, E. The limbic system. Indian J. Psychiatry 2007, 49, 132. [Google Scholar] [CrossRef] [PubMed]
  44. Tzourio-Mazoyer, N.; Landeau, B.; Papathanassiou, D.; Crivello, F.; Etard, O.; Delcroix, N.; Mazoyer, B.; Joliot, M. Automated Anatomical Labeling of Activations in SPM Using a Macroscopic Anatomical Parcellation of the MNI MRI Single-Subject Brain. NeuroImage 2002, 15, 273–289. [Google Scholar] [CrossRef] [PubMed]
  45. Sarrazin, S.; Cachia, A.; Hozer, F.; McDonald, C.; Emsell, L.; Cannon, D.M.; Wessa, M.; Linke, J.; Versace, A.; Hamdani, N. Neurodevelopmental subtypes of bipolar disorder are related to cortical folding patterns: An international multicenter study. Bipolar Disord. 2018, 20, 721–732. [Google Scholar] [CrossRef] [PubMed]
  46. Penttilä, J.; Paillère-Martinot, M.-L.; Martinot, J.-L.; Ringuenet, D.; Wessa, M.; Houenou, J.; Gallarda, T.; Bellivier, F.; Galinowski, A.; Bruguière, P. Cortical folding in patients with bipolar disorder or unipolar depression. J. Psychiatry Neurosci. 2009, 34, 127. [Google Scholar] [PubMed]
  47. Rogers, J.; Kochunov, P.; Zilles, K.; Shelledy, W.; Lancaster, J.; Thompson, P.; Duggirala, R.; Blangero, J.; Fox, P.T.; Glahn, D.C. On the genetic architecture of cortical folding and brain volume in primates. Neuroimage 2010, 53, 1103–1108. [Google Scholar] [CrossRef] [PubMed] [Green Version]
  48. Dubois, J.; Benders, M.; Cachia, A.; Lazeyras, F.; Leuchter, R.H.-V.; Sizonenko, S.; Borradori-Tolsa, C.; Mangin, J.; Hüppi, P.S. Mapping the early cortical folding process in the preterm newborn brain. Cereb. Cortex 2008, 18, 1444–1454. [Google Scholar] [CrossRef] [PubMed]
  49. Frazier, J.A.; Breeze, J.L.; Papadimitriou, G.; Kennedy, D.N.; Hodge, S.M.; Moore, C.M.; Howard, J.D.; Rohan, M.P.; Caviness, V.S.; Makris, N. White matter abnormalities in children with and at risk for bipolar disorder. Bipolar Disord. 2007, 9, 799–809. [Google Scholar] [CrossRef]
  50. Peper, J.S.; Brouwer, R.M.; Boomsma, D.I.; Kahn, R.S.; Pol, H.; Hilleke, E. Genetic influences on human brain structure: A review of brain imaging studies in twins. Hum. Brain Mapp. 2007, 28, 464–473. [Google Scholar] [CrossRef]
  51. Wright, I.C.; Sham, P.; Murray, R.M.; Weinberger, D.R.; Bullmore, E.T. Genetic Contributions to Regional Variability in Human Brain Structure: Methods and Preliminary Results. Neuroimage 2002, 17, 256–271. [Google Scholar] [CrossRef]
  52. Raichle, M.E.; MacLeod, A.M.; Snyder, A.Z.; Powers, W.J.; Gusnard, D.A.; Shulman, G.L. A default mode of brain function. Proc. Natl. Acad. Sci. USA 2001, 98, 676–682. [Google Scholar] [CrossRef] [PubMed] [Green Version]
  53. Andrews-Hanna, J.R.; Reidler, J.S.; Sepulcre, J.; Poulin, R.; Buckner, R.L. Functional-Anatomic Fractionation of the Brain’s Default Network. Neuron 2010, 65, 550–562. [Google Scholar] [CrossRef] [PubMed]
  54. Meda, S.A.; Gill, A.; Stevens, M.C.; Lorenzoni, R.P.; Glahn, D.C.; Calhoun, V.D.; Sweeney, J.A.; Tamminga, C.A.; Keshavan, M.S.; Thaker, G.; et al. Differences in Resting-State Functional Magnetic Resonance Imaging Functional Network Connectivity Between Schizophrenia and Psychotic Bipolar Probands and Their Unaffected First-Degree Relatives. Biol. Psychiatry 2012, 71, 881–889. [Google Scholar] [CrossRef] [PubMed] [Green Version]
  55. Uddin, L.Q.; Nomi, J.S.; Hébert-Seropian, B.; Ghaziri, J.; Boucher, O. Structure and function of the human insula. J. Clin. Neurophysiol. 2017, 34, 300. [Google Scholar] [CrossRef] [PubMed]
  56. Uddin, L.Q. Salience processing and insular cortical function and dysfunction. Nat. Rev. Neurosci. 2015, 16, 55. [Google Scholar] [CrossRef] [PubMed]
  57. Kelley, A.E.; Baldo, B.A.; Pratt, W.E. A proposed hypothalamic–thalamic–striatal axis for the integration of energy balance, arousal, and food reward. J. Comp. Neurol. 2005, 493, 72–85. [Google Scholar] [CrossRef] [PubMed]
  58. Olson, I.R.; Plotzker, A.; Ezzyat, Y. The Enigmatic temporal pole: A review of findings on social and emotional processing. Brain 2007, 130, 1718–1731. [Google Scholar] [CrossRef]
  59. Teng, S.; Lu, C.-F.; Wang, P.-S.; Li, C.-T.; Tu, P.-C.; Hung, C.-I.; Su, T.-P.; Wu, Y.-T. Altered Resting-State Functional Connectivity of Striatal-Thalamic Circuit in Bipolar Disorder. PLoS ONE 2014, 9, e96422. [Google Scholar] [CrossRef]
  60. Carter, C.S.; Braver, T.S.; Barch, D.M.; Botvinick, M.M.; Noll, D.; Cohen, J.D. Anterior cingulate cortex, error detection, and the online monitoring of performance. Science 1998, 280, 747–749. [Google Scholar] [CrossRef]
  61. Bush, G.; Luu, P.; Posner, M.I. Cognitive and emotional influences in anterior cingulate cortex. Trends Cogn. Sci. 2000, 4, 215–222. [Google Scholar] [CrossRef]
  62. Fornito, A.; Yücel, M.; Wood, S.; Stuart, G.W.; Buchanan, J.-A.; Proffitt, T.; Anderson, V.; Velakoulis, D.; Pantelis, C. Individual differences in anterior cingulate/paracingulate morphology are related to executive functions in healthy males. Cereb. Cortex 2004, 14, 424–431. [Google Scholar] [CrossRef] [PubMed]
  63. Tissier, C.; Linzarini, A.; Allaire-Duquette, G.; Mevel, K.; Poirel, N.; Dollfus, S.; Etard, O.; Orliac, F.; Peyrin, C.; Charron, S. Sulcal Polymorphisms of the IFC and ACC Contribute to Inhibitory Control Variability in Children and Adults. eNeuro 2018, 5. [Google Scholar] [CrossRef] [PubMed]
  64. Strakowski, S.; Delbello, M.; Adler, C. The functional neuroanatomy of bipolar disorder: A review of neuroimaging findings. Mol. Psychiatry 2005, 10, 105–116. [Google Scholar] [CrossRef] [PubMed]
  65. Zimmerman, M.E.; DelBello, M.P.; Getz, G.E.; Shear, P.K.; Strakowski, S.M. Anterior cingulate subregion volumes and executive function in bipolar disorder. Bipolar Disord. 2006, 8, 281–288. [Google Scholar] [CrossRef]
  66. Drevets, W.C.; Savitz, J.; Trimble, M. The subgenual anterior cingulate cortex in mood disorders. CNS Spectr. 2008, 13, 663. [Google Scholar] [CrossRef]
  67. Fornito, A.; Whittle, S.; Wood, S.J.; Velakoulis, D.; Pantelis, C.; Yücel, M. The influence of sulcal variability on morphometry of the human anterior cingulate and paracingulate cortex. Neuroimage 2006, 33, 843–854. [Google Scholar] [CrossRef]
  68. Sanches, M.; Amorim, E.; Mwangi, B.; Zunta-Soares, G.B.; Soares, J.C. Smaller left anterior cingulate cortex in non-bipolar relatives of patients with bipolar disorder. Braz. J. Psychiatry 2019, 41, 254–256. [Google Scholar] [CrossRef] [Green Version]
  69. Surguladze, S.A.; Marshall, N.; Schulze, K.; Hall, M.-H.; Walshe, M.; Bramon, E.; Phillips, M.L.; Murray, R.M.; McDonald, C. Exaggerated neural response to emotional faces in patients with bipolar disorder and their first-degree relatives. Neuroimage 2010, 53, 58–64. [Google Scholar] [CrossRef]
  70. LaBar, K.S.; Cabeza, R. Cognitive neuroscience of emotional memory. Nat. Rev. Neurosci. 2006, 7, 54–64. [Google Scholar] [CrossRef]
  71. Phillips, M.L.; Drevets, W.C.; Rauch, S.L.; Lane, R. Neurobiology of emotion perception I: The neural basis of normal emotion perception. Biol. Psychiatry 2003, 54, 504–514. [Google Scholar] [CrossRef]
  72. Brotman, M.; Guyer, A.; Lawson, E.; Horsey, S.; Rich, B.; Dickstein, D.; Pine, D.; Leibenluft, E. Facial emotion labeling deficits in children and adolescents at risk for bipolar disorder. Am. J. Psychiatry 2008, 165, 385–389. [Google Scholar] [CrossRef] [PubMed]
  73. Boccardi, M.; Almici, M.; Bresciani, L.; Caroli, A.; Bonetti, M.; Monchieri, S.; Gennarelli, M.; Frisoni, G.B. Clinical and medial temporal features in a family with mood disorders. Neurosci. Lett. 2010, 468, 93–97. [Google Scholar] [CrossRef] [PubMed]
  74. Ladouceur, C.D.; Almeida, J.R.C.; Birmaher, B.; Axelson, D.A.; Nau, S.; Kalas, C.; Monk, K.; Kupfer, D.J.; Phillips, M.L. Subcortical Gray Matter Volume Abnormalities in Healthy Bipolar Offspring: Potential Neuroanatomical Risk Marker for Bipolar Disorder? J. Am. Acad. Child Adolesc. Psychiatry 2008, 47, 532–539. [Google Scholar] [CrossRef] [PubMed] [Green Version]
  75. Bellivier, F.; Golmard, J.-L.; Rietschel, M.; Schulze, T.G.; Malafosse, A.; Preisig, M.; McKeon, P.; Mynett-Johnson, L.; Henry, C.; Leboyer, M. Age at onset in bipolar I affective disorder: Further evidence for three subgroups. Am. J. Psychiatry 2003, 160, 999–1001. [Google Scholar] [CrossRef] [PubMed]
  76. Yucel, K.; Taylor, V.H.; McKinnon, M.C.; MacDonald, K.; Alda, M.; Young, L.T.; MacQueen, G.M. Bilateral hippocampal volume increase in patients with bipolar disorder and short-term lithium treatment. Neuropsychopharmacology 2008, 33, 361–367. [Google Scholar] [CrossRef] [PubMed]
  77. Monkul, E.S.; Matsuo, K.; Nicoletti, M.A.; Dierschke, N.; Hatch, J.P.; Dalwani, M.; Brambilla, P.; Caetano, S.; Sassi, R.B.; Mallinger, A.G.; et al. Prefrontal gray matter increases in healthy individuals after lithium treatment: A voxel-based morphometry study. Neurosci. Lett. 2007, 429, 7–11. [Google Scholar] [CrossRef] [PubMed] [Green Version]
Figure 1. An illustrated diagram of the shape index (SI) and curvedness (CVD). The SI is a measure to describe the types of folding structures, with values ranged from −1 (the inward or sulcal structure) to 1 (the outward or gyral structure); the CVD, on the other hand, measures the extent of a specific folding structure.
Brainsci 09 00240 g001
Figure 2. A summarized diagram of brain regions, with significant differences in CVD values between BD patients, unaffected siblings, and healthy controls. (a) Significant differences in both BD patients and unaffected siblings, compared with healthy controls; (b) significant differences in BD patients compared with healthy controls and unaffected siblings; (c) significant differences in unaffected siblings, compared with healthy controls and BD patients. HC: healthy controls; BD: bipolar disorder; US: unaffected siblings; ORBsup: superior orbital frontal gyrus; ORBmid: middle orbital frontal gyrus; ORBsupmed: superior-medial orbital frontal gyrus; TPOsup: superior temporal pole; TPOmid: middle temporal pole; ITG: inferior temporal gyrus; ACC: anterior cingulate cortex; INS: insula; HIP: hippocampus; PHIP: parahippocampal gyrus; CAU: caudate; PUT: putamen; THA: thalamus; AMY: amygdala.
Brainsci 09 00240 g002
Figure 3. Boxplots for illustrating the group differences in CVD values between BD patients, unaffected siblings, and healthy controls. (a) Significant differences in both BD patients and unaffected siblings compared with healthy controls (as listed in Table 2); (b) significant differences in BD patients compared with healthy controls and unaffected siblings (as listed in Table 3); (c) significant differences in unaffected siblings compared with healthy controls and BD patients (as listed in Table 4).
Brainsci 09 00240 g003
Table 1. Demographic and clinical details of study cohorts.
Bipolar I Patients (BD)Unaffected Siblings (US)Healthy Controls (HC)p-Value
Number of subjects171722
Gender (male/female)11/68/913/90.566 a
Age (years)42.9 ± 10.642.6 ± 11.242.1 ± 10.60.970 b
HAMD3.3 ± 2.80.7 ± 1.01.1 ± 1.4<0.001 b
YMARS2.4 ± 2.50.6 ± 1.80.2 ± 0.70.001 b
Duration of illness (years)17.3 ± 9.9----
Onset age (years)25.5 ± 11.5----
Past manic episodes (times)5.8 ± 6.6----
Past depressive episodes (times)4.1 ± 3.4----
Number of subjects who had psychosis (%)11 (64.7%)----
GM volumes (cm3)577.6 ± 56.4562.3 ± 44.6569.0 ± 53.80.692 b
WM volumes (cm3)509.5 ± 56.3497.8 ± 54.7506.3 ± 56.80.819 b
GM + WM volumes (cm3)1087.0 ± 108.41060.0 ± 85.61075.2 ± 106.10.738 b
HAMD: Hamilton Depression Rating Scale, 17 items; YMARS: Young Mania Rating Scale; GM: gray matter; WM: white matter; a Pearson Chi-Square test; b One-way analysis of variance (ANOVA).
Table 2. Significant difference of curvedness (CVD) values in both BD patients and unaffected siblings, compared with healthy controls.
Cortical RegionSurface CategoryCVD in BDCVD in USCVD in HCPairwise p-Value
BD < HC and US < HC
Superior orbital frontal cortex, rightGyral0.424 ± 0.0160.408 ± 0.0220.444 ± 0.031BD vs. HC 0.048 *
US vs. HC < 0.001 *
BD vs. US 0.228
Middle orbital frontal cortex, rightGyral0.448 ± 0.0280.442 ± 0.0370.473 ± 0.029BD vs. HC 0.047 *
US vs. HC 0.011 *
BD vs. US 1.000
Superior-medial orbital frontal cortex, rightSulcal0.194 ± 0.0140.195 ± 0.0140.206 ± 0.011BD vs. HC 0.011 *
US vs. HC 0.022 *
BD vs. US 1.000
Inferior temporal cortex, leftGyral0.463 ± 0.0240.454 ± 0.0160.482 ± 0.026BD vs. HC 0.033 *
US vs. HC 0.001 *
BD vs. US 0.843
Middle temporal pole, rightSulcal0.336 ± 0.0470.340 ± 0.0840.405 ± 0.010BD vs. HC 0.033 *
US vs. HC 0.048 *
BD vs. US 1.000
Insula, leftSulcal0.204 ± 0.0110.212 ± 0.0140.215 ± 0.013BD vs. HC 0.032 *
US vs. HC 1.000
BD vs. US 0.197
Insula, leftGyral0.319 ± 0.0320.312 ± 0.0240.339 ± 0.034BD vs. HC 0.152
US vs. HC 0.026 *
BD vs. US 1.000
US: unaffected siblings; HC: healthy controls. * A significant difference between two groups (p < 0.05 after Bonferroni correction).
Table 3. Significant differences in CVD values of BD patients, compared with healthy controls and unaffected siblings.
Cortical RegionSurface CategoryCVD in BDCVD in USCVD in HCPairwise p-Value
BD < HC
Insula, rightGyral0.308 ± 0.0340.327 ± 0.0410.340 ± 0.029BD vs. HC 0.020 *
US vs. HC 0.774
BD vs. US 0.355
Insula, rightSulcal0.210 ± 0.0090.216 ± 0.0130.223± 0.012BD vs. HC 0.003 *
US vs. HC 0.200
BD vs. US 0.374
Hippocampus, leftSulcal0.228 ± 0.0190.238 ± 0.0120.244 ± 0.016BD vs. HC 0.008 *
US vs. HC 0.657
BD vs. US 0.243
Hippocampus, rightSulcal0.217 ± 0.0140.226 ± 0.0080.233 ± 0.022BD vs. HC 0.011 *
US vs. HC 0.574
BD vs. US 0.334
Caudate, rightSulcal0.189 ± 0.0150.194 ± 0.0170.205 ± 0.014BD vs. HC 0.006 *
US vs. HC 0.068
BD vs. US 1.000
Thalamus, rightGyral0.340 ± 0.0280.361 ± 0.0180.367 ± 0.030BD vs. HC 0.009 *
US vs. HC 1.000
BD vs. US 0.083
Superior temporal pole, leftGyral0.461 ± 0.0480.484 ± 0.0390.506 ± 0.070BD vs. HC 0.045 *
US vs. HC 0.251
BD vs. US 1.000
Superior temporal pole, rightGyral0.500 ± 0.0620.515 ± 0.0500.554 ± 0.066BD vs. HC 0.022 *
US vs. HC 0.152
BD vs. US 1.000
Inferior temporal cortex, rightSulcal0.258 ± 0.0190.263 ± 0.0230.279 ± 0.026BD vs. HC 0.018 *
US vs. HC 0.104
BD vs. US 1.000
BD < US
Anterior cingulate cortex, rightSulcal0.201 ± 0.0170.216 ± 0.0220.210 ± 0.013BD vs. HC 0.262
US vs. HC 0.883
BD vs. US 0.033 *
US: unaffected siblings; HC: healthy controls. * A significant difference between two groups (p < 0.05 after Bonferroni correction).
Table 4. Significant differences in CVD values in unaffected siblings, compared with healthy controls and BD patients.
Cortical RegionSurface CategoryCVD in BDCVD in USCVD in HCPairwise p-Value
US < HC and US < BD
Caudate, rightGyral0.237 ± 0.0160.220 ± 0.0160.238 ± 0.017BD vs. HC 1..000
US vs. HC 0.004 *
BD vs. US 0.014 *
US < HC
Parahippocampal gyrus, rightGyral0.386 ± 0.0360.377 ± 0.0320.405 ± 0.031BD vs. HC 0.249
US vs. HC 0.036 *
BD vs. US 1.000
Amygdala, leftGyral0.436 ± 0.0360.421 ± 0.0370.461 ± 0.052BD vs. HC 0.225
US vs. HC 0.016 *
BD vs. US 0.918
Putamen, rightGyral0.426 ± 0.0230.419 ± 0.0250.442 ± 0.024BD vs. HC 0.136
US vs. HC 0.013 *
BD vs. US 1.000
US: unaffected siblings; HC: healthy controls. * A significant difference between two groups (p < 0.05 after Bonferroni correction).

