A Brain-Computer-Interface for the Detection and Modulation of Gamma Band Activity

Abstract
:1. Introduction
2. Materials and Methods
2.1. Volunteers
2.2. BCI Method
2.2.1. Technical Setup
2.2.2. Online Data Processing

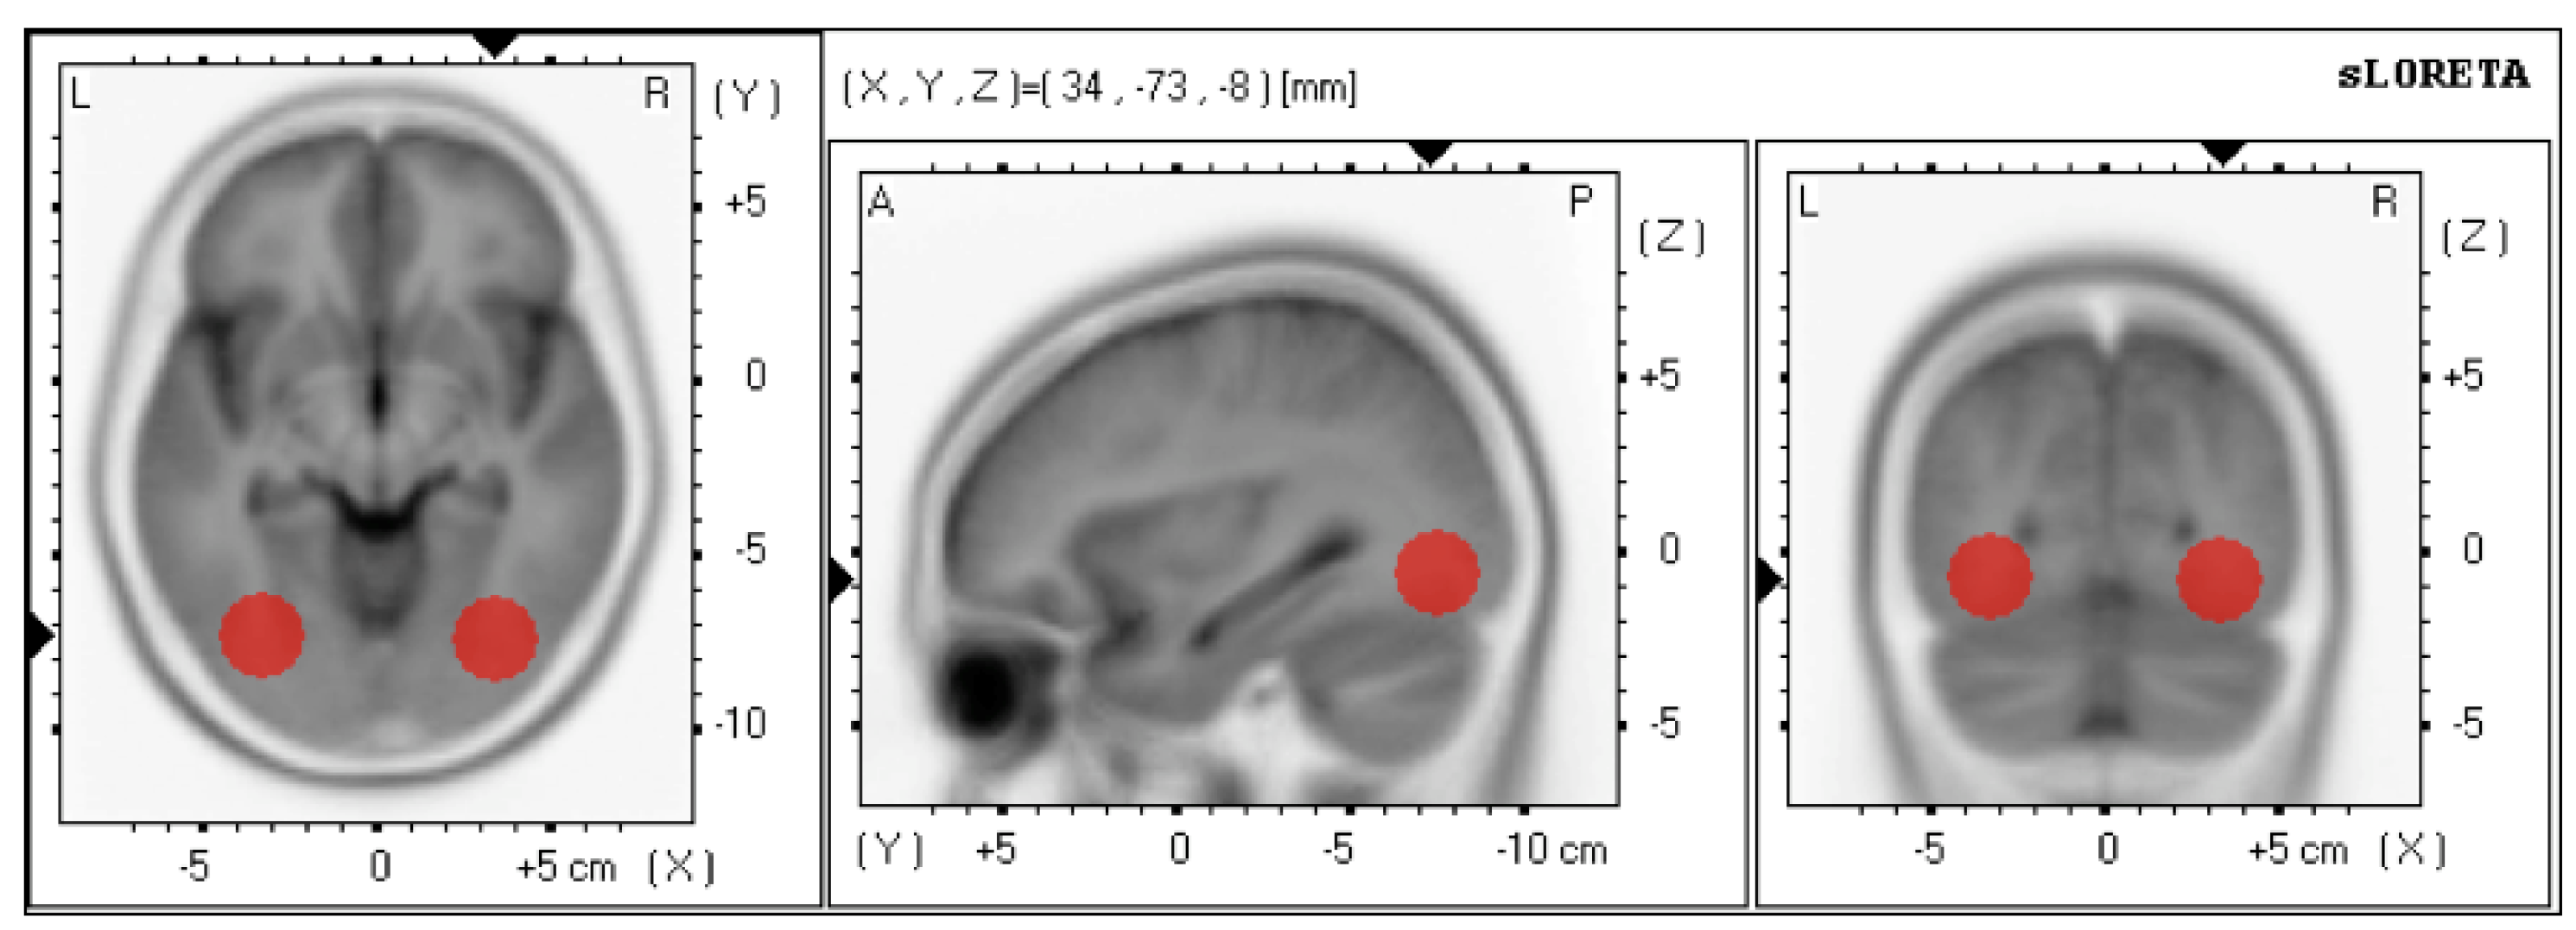
2.2.3. Online Source Localization

2.2.4. Artifact Detection Filters

| Artifacts | Type | Detection | Channels | Feedback information |
|---|---|---|---|---|
| Eye artifacts | Eye blinks | Signal threshold | VEOG | Integrated in upper bar (feedback period) |
| Horizontal eye movement | Signal threshold | HEOG | Integrated in upper bar (feedback period) | |
| Vertical eye movement | Signal threshold | VEOG | Integrated in upper bar (feedback period) | |
| Microsaccades | Signal threshold | REOG | Success display | |
| Gamma band specific artifacts | Neural source of gamma activity | Variable threshold = gamma band activity in ROI channels | VEOG HEOG | Integrated in upper bar (feedback period) |
| Muscle artifacts | Neck muscle activity | Threshold = mean 70–80 Hz activity during passive baseline | N | Integrated in below bar (feedback period) |
| Jaw clenching | Threshold = mean 70–80 Hz activity during passive baseline | T7 T8 | Integrated in below bar (feedback period) |
2.2.4.1. EOG
2.2.4.2. Microsaccades
2.2.4.3. EMG
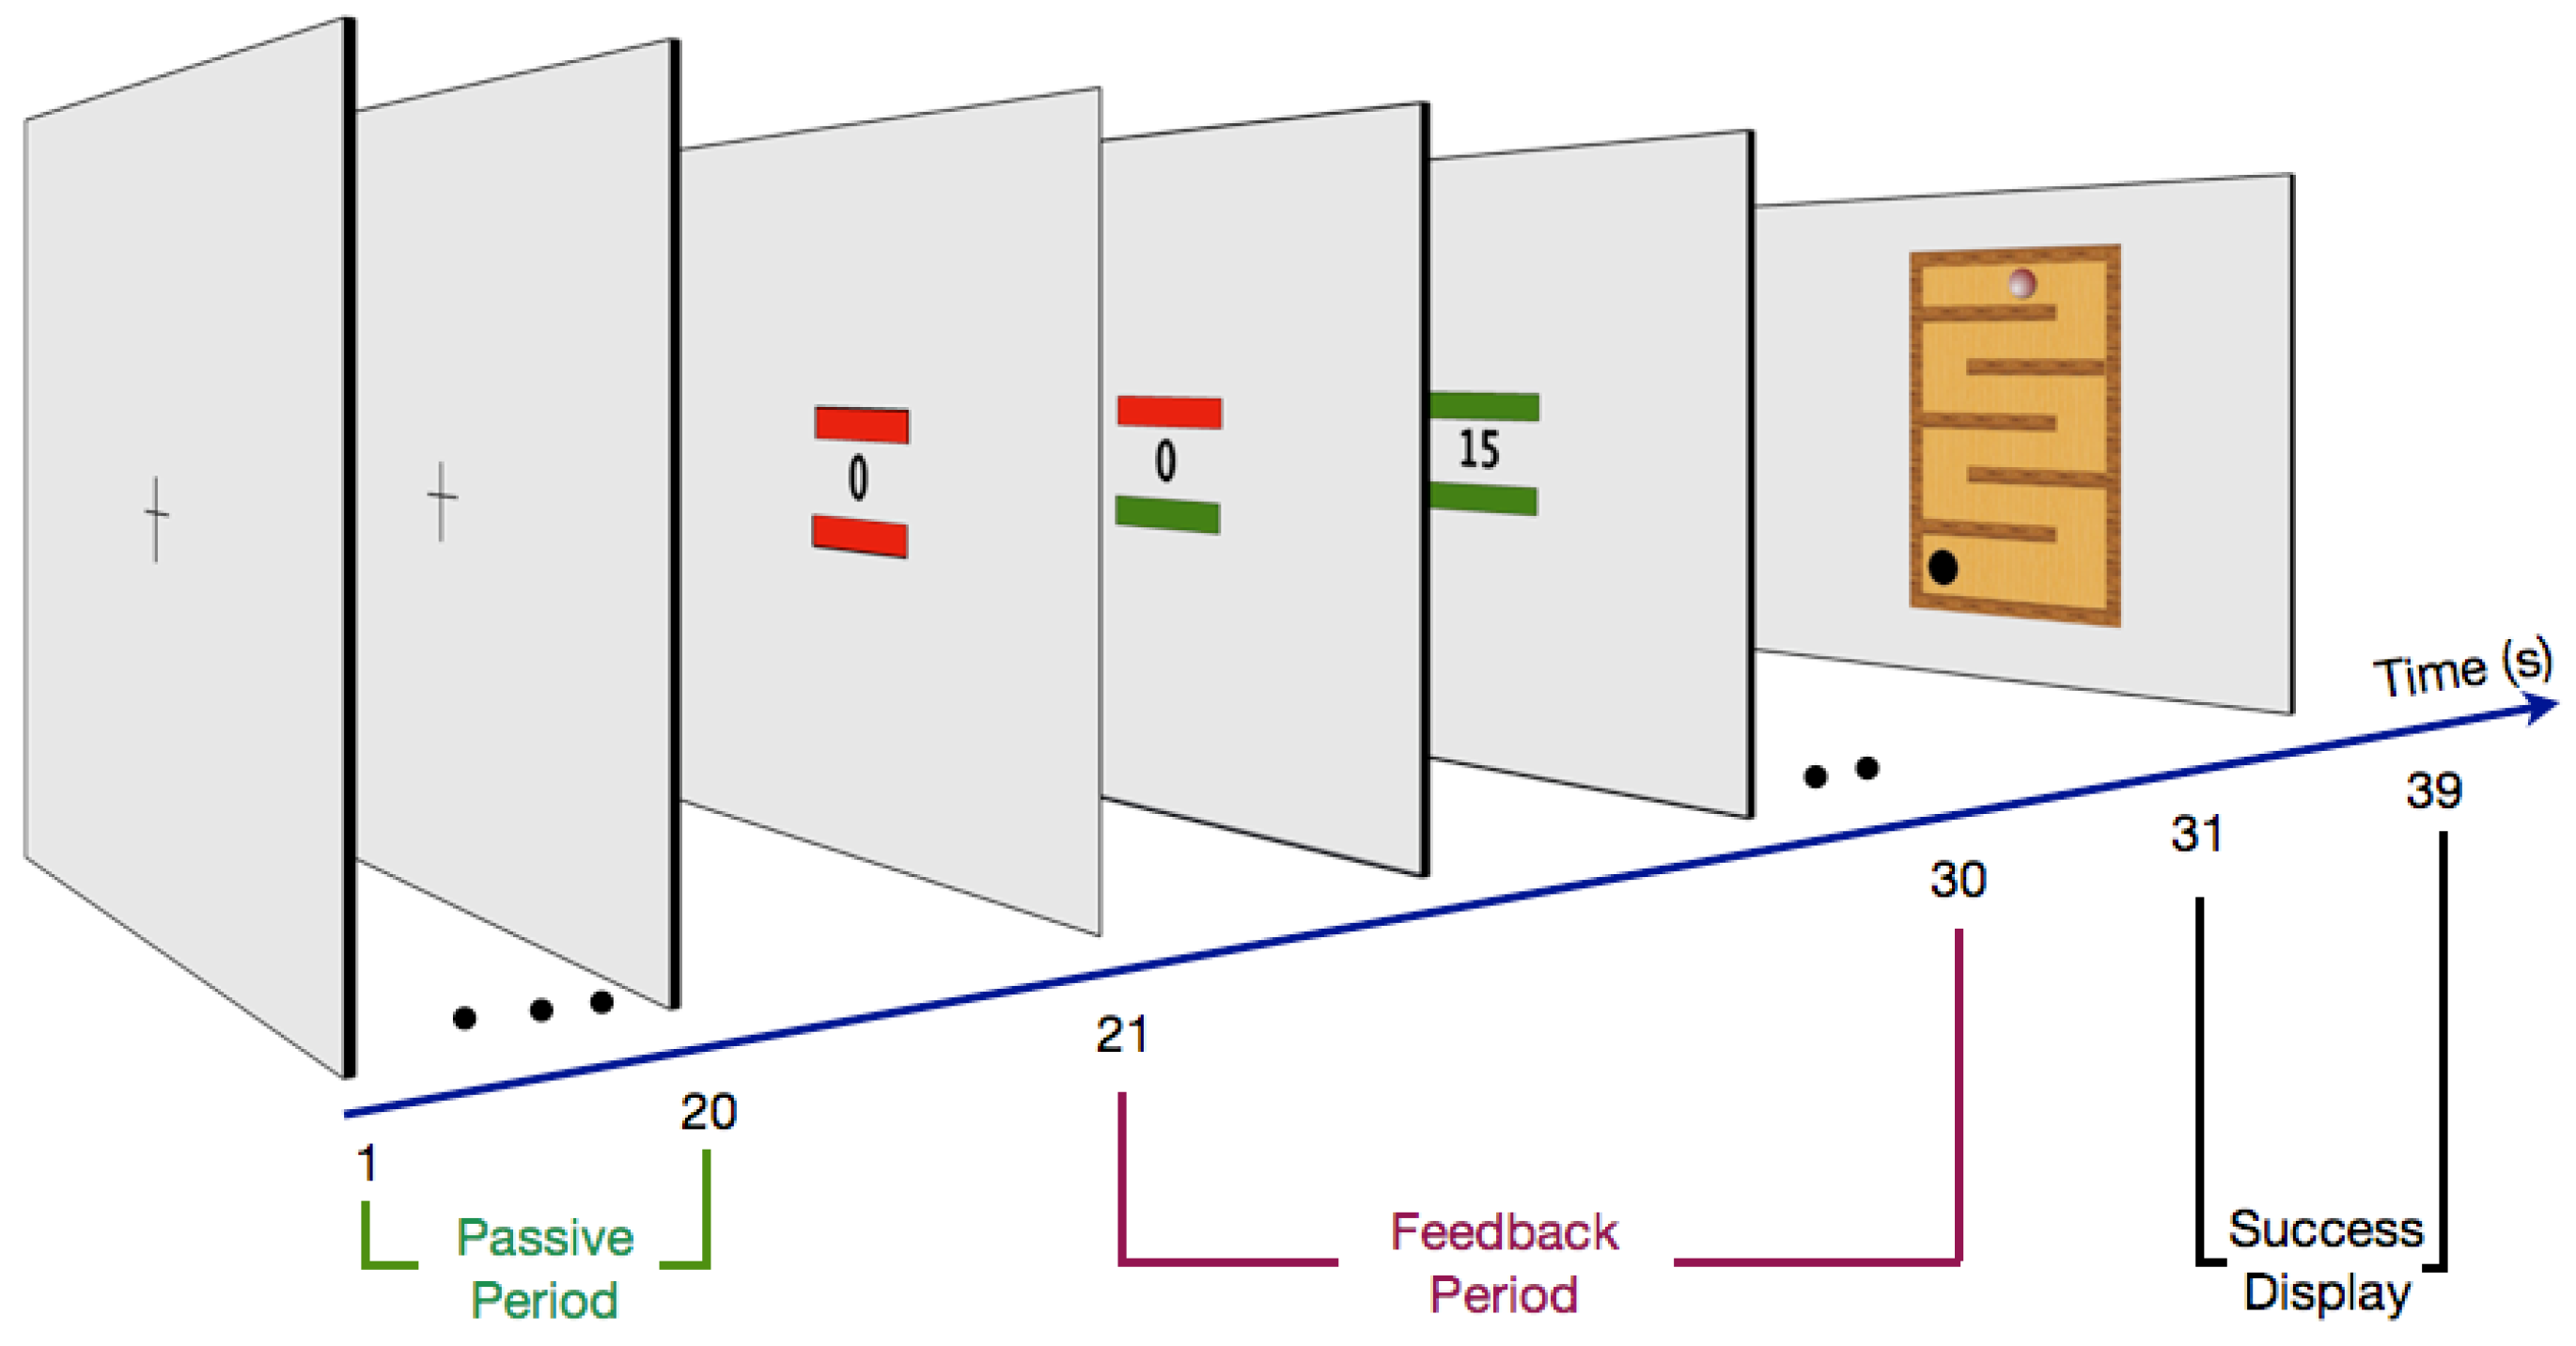
2.3. Procedure
2.3.1. Passive Period
2.3.2. Feedback Period
2.3.3. Success Display
2.4. Offline Data Analysis
3. Results
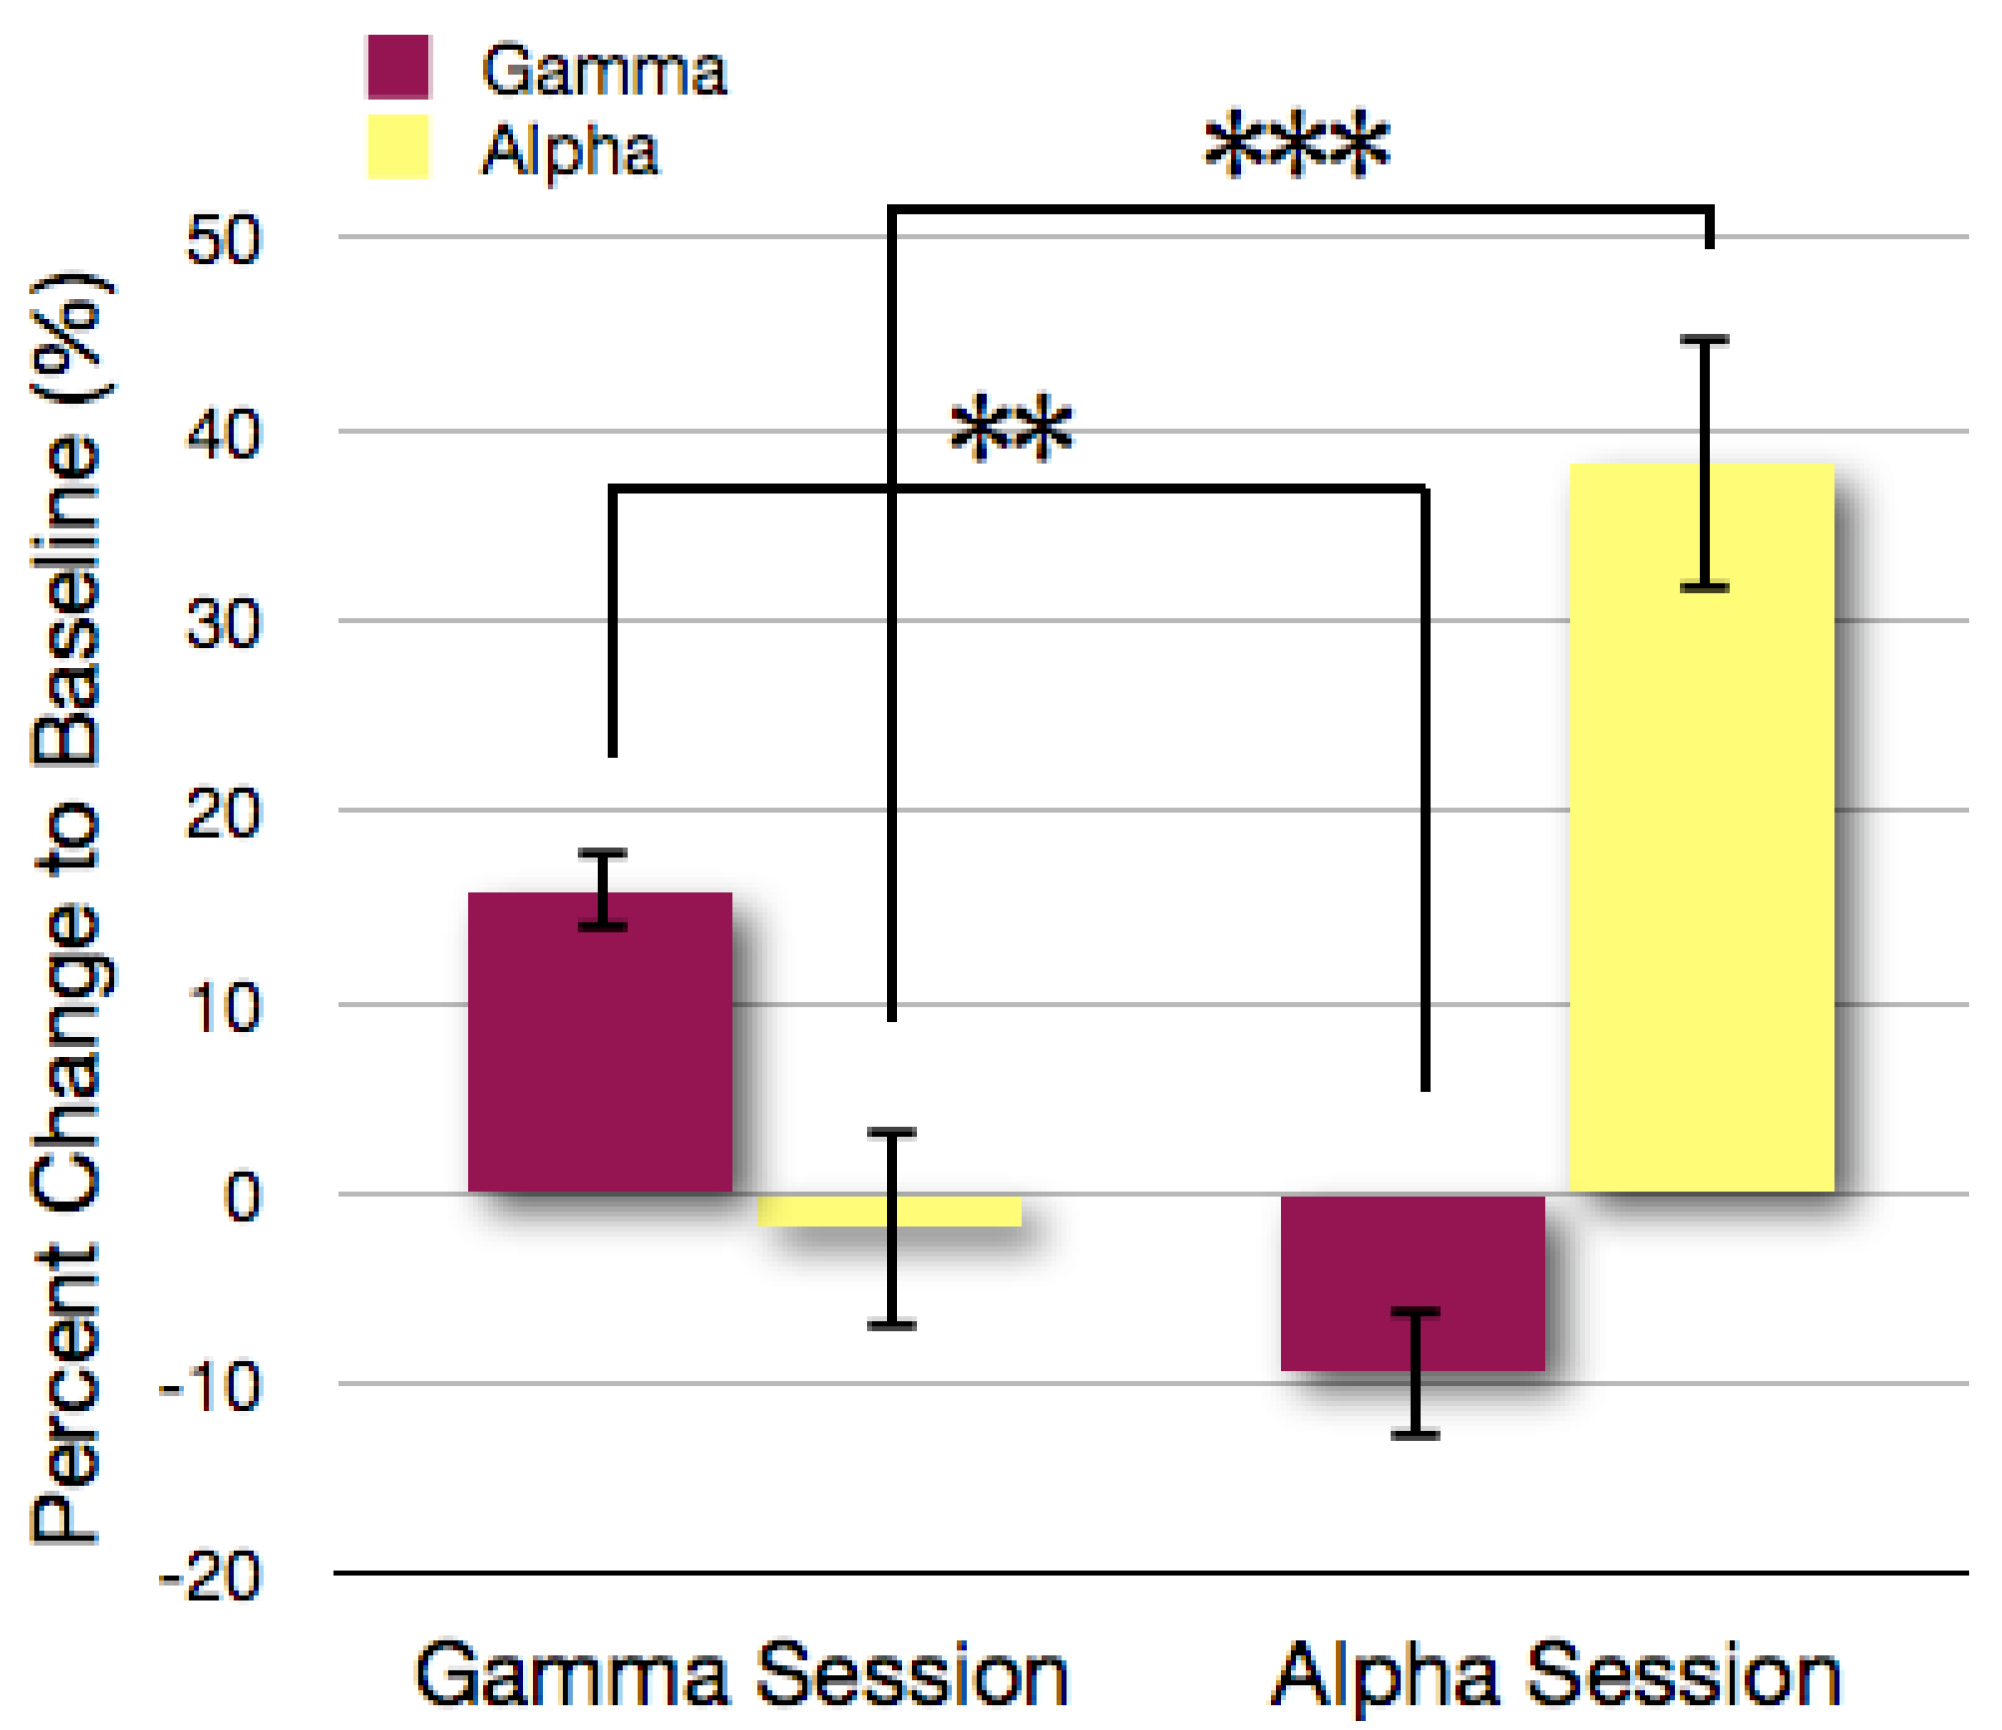
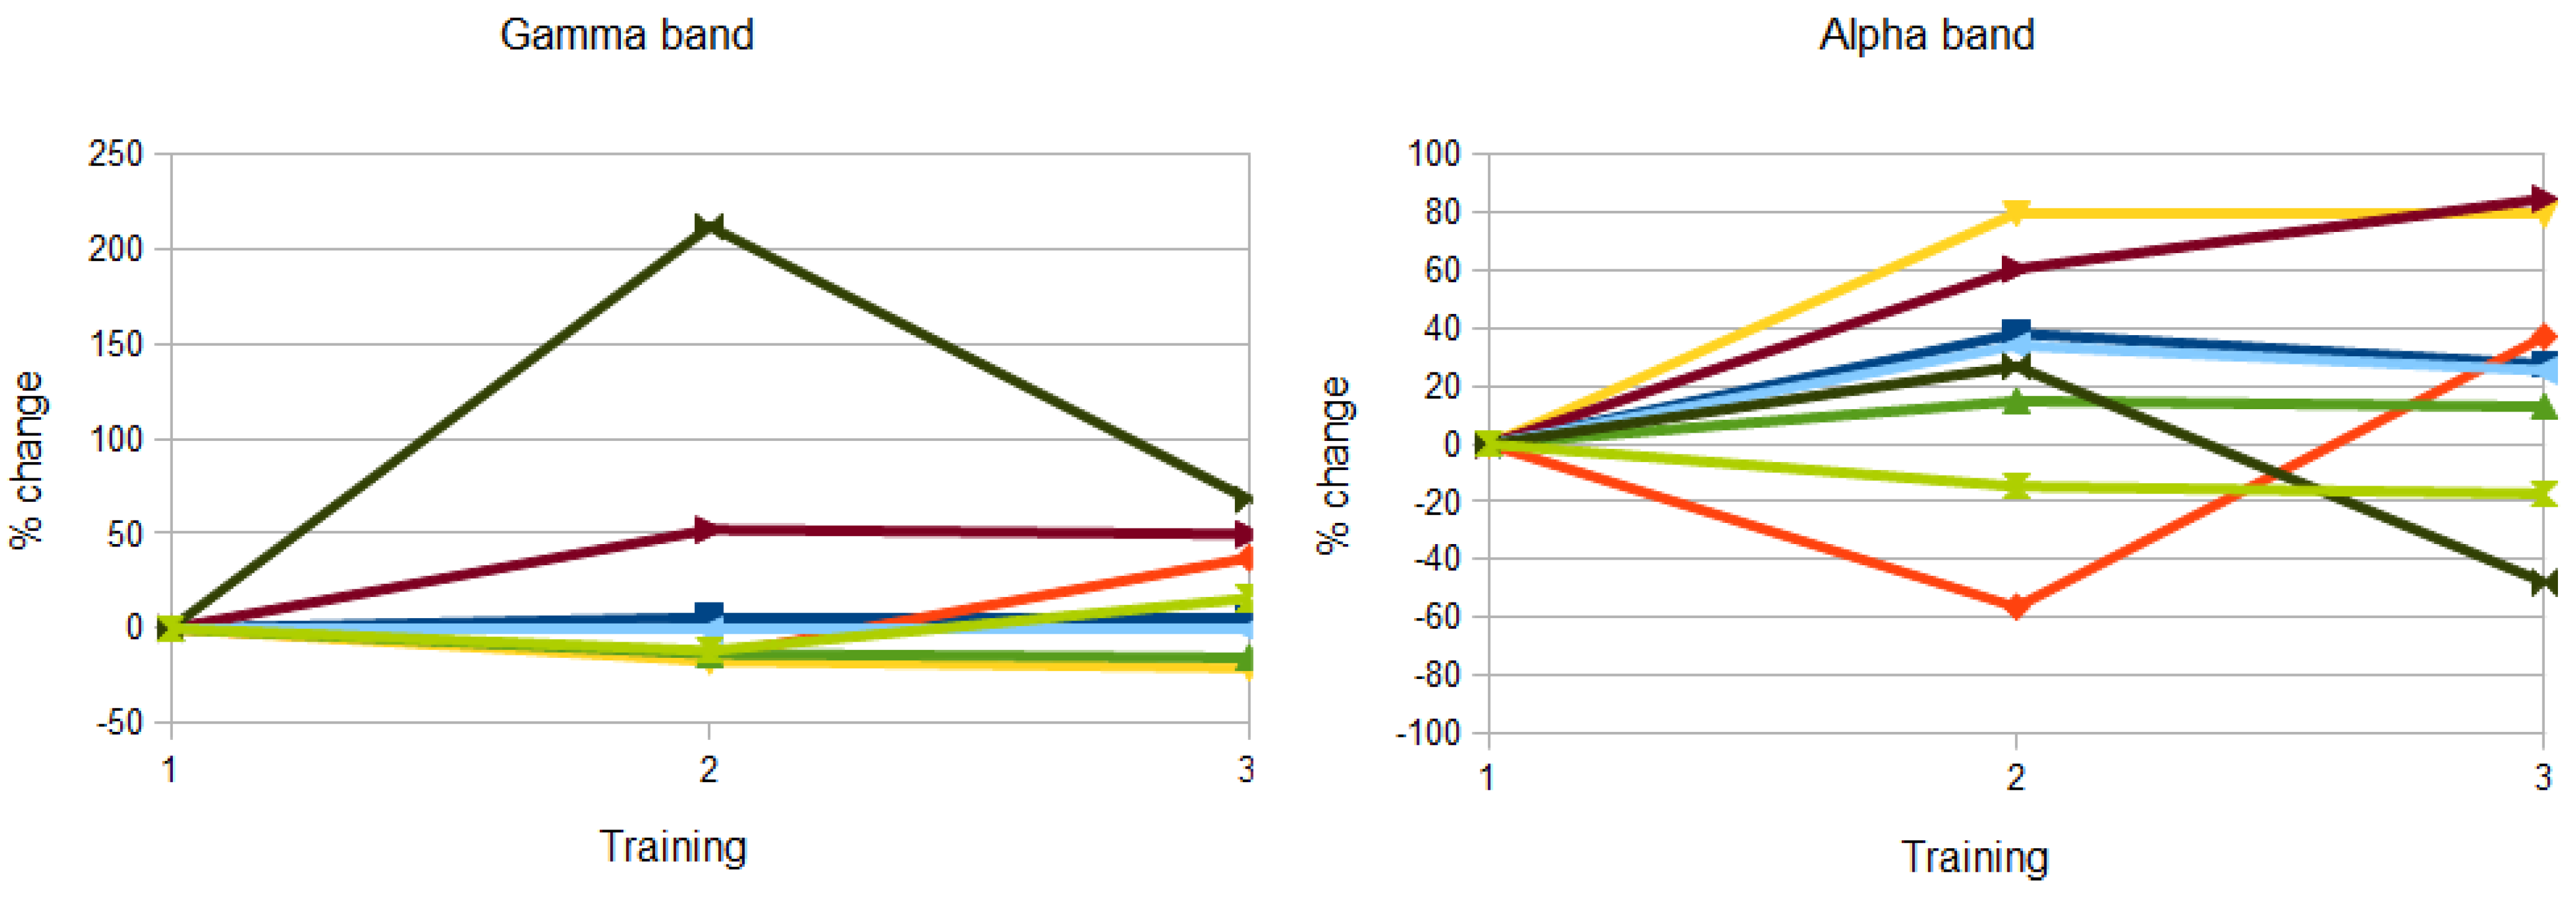
3.1. Analysis of Gamma and Alpha Activity in the ROIs
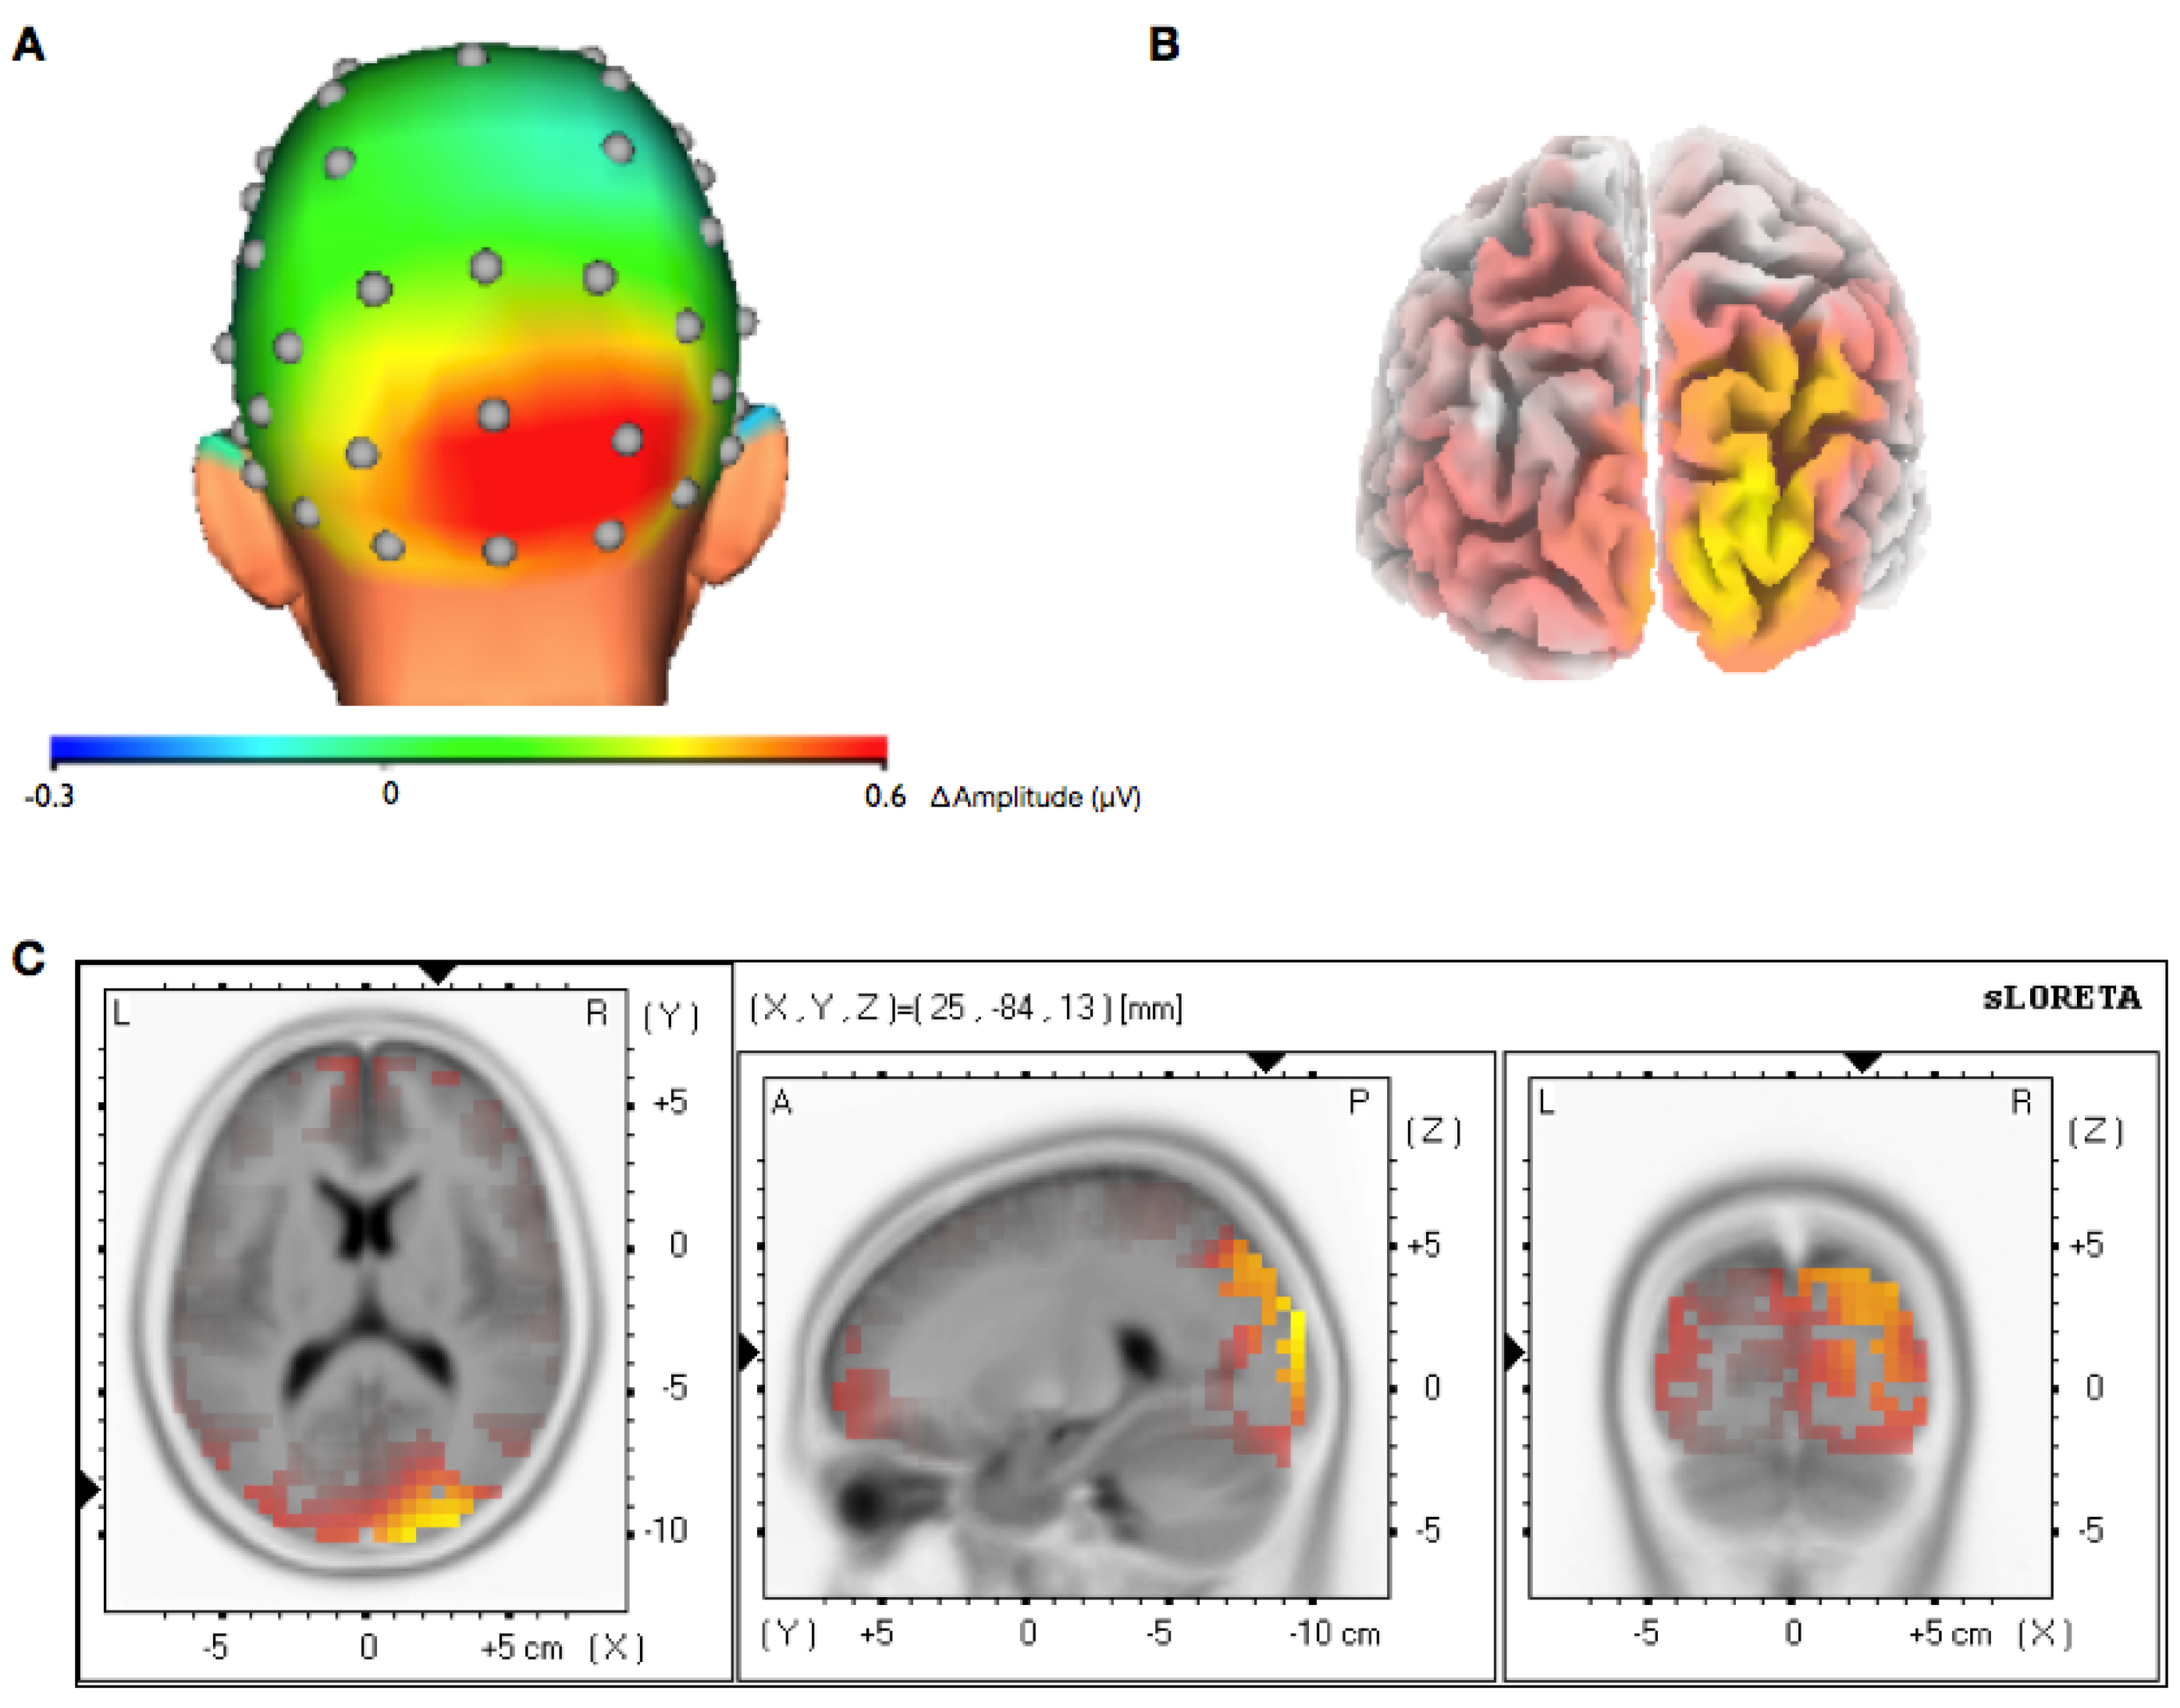
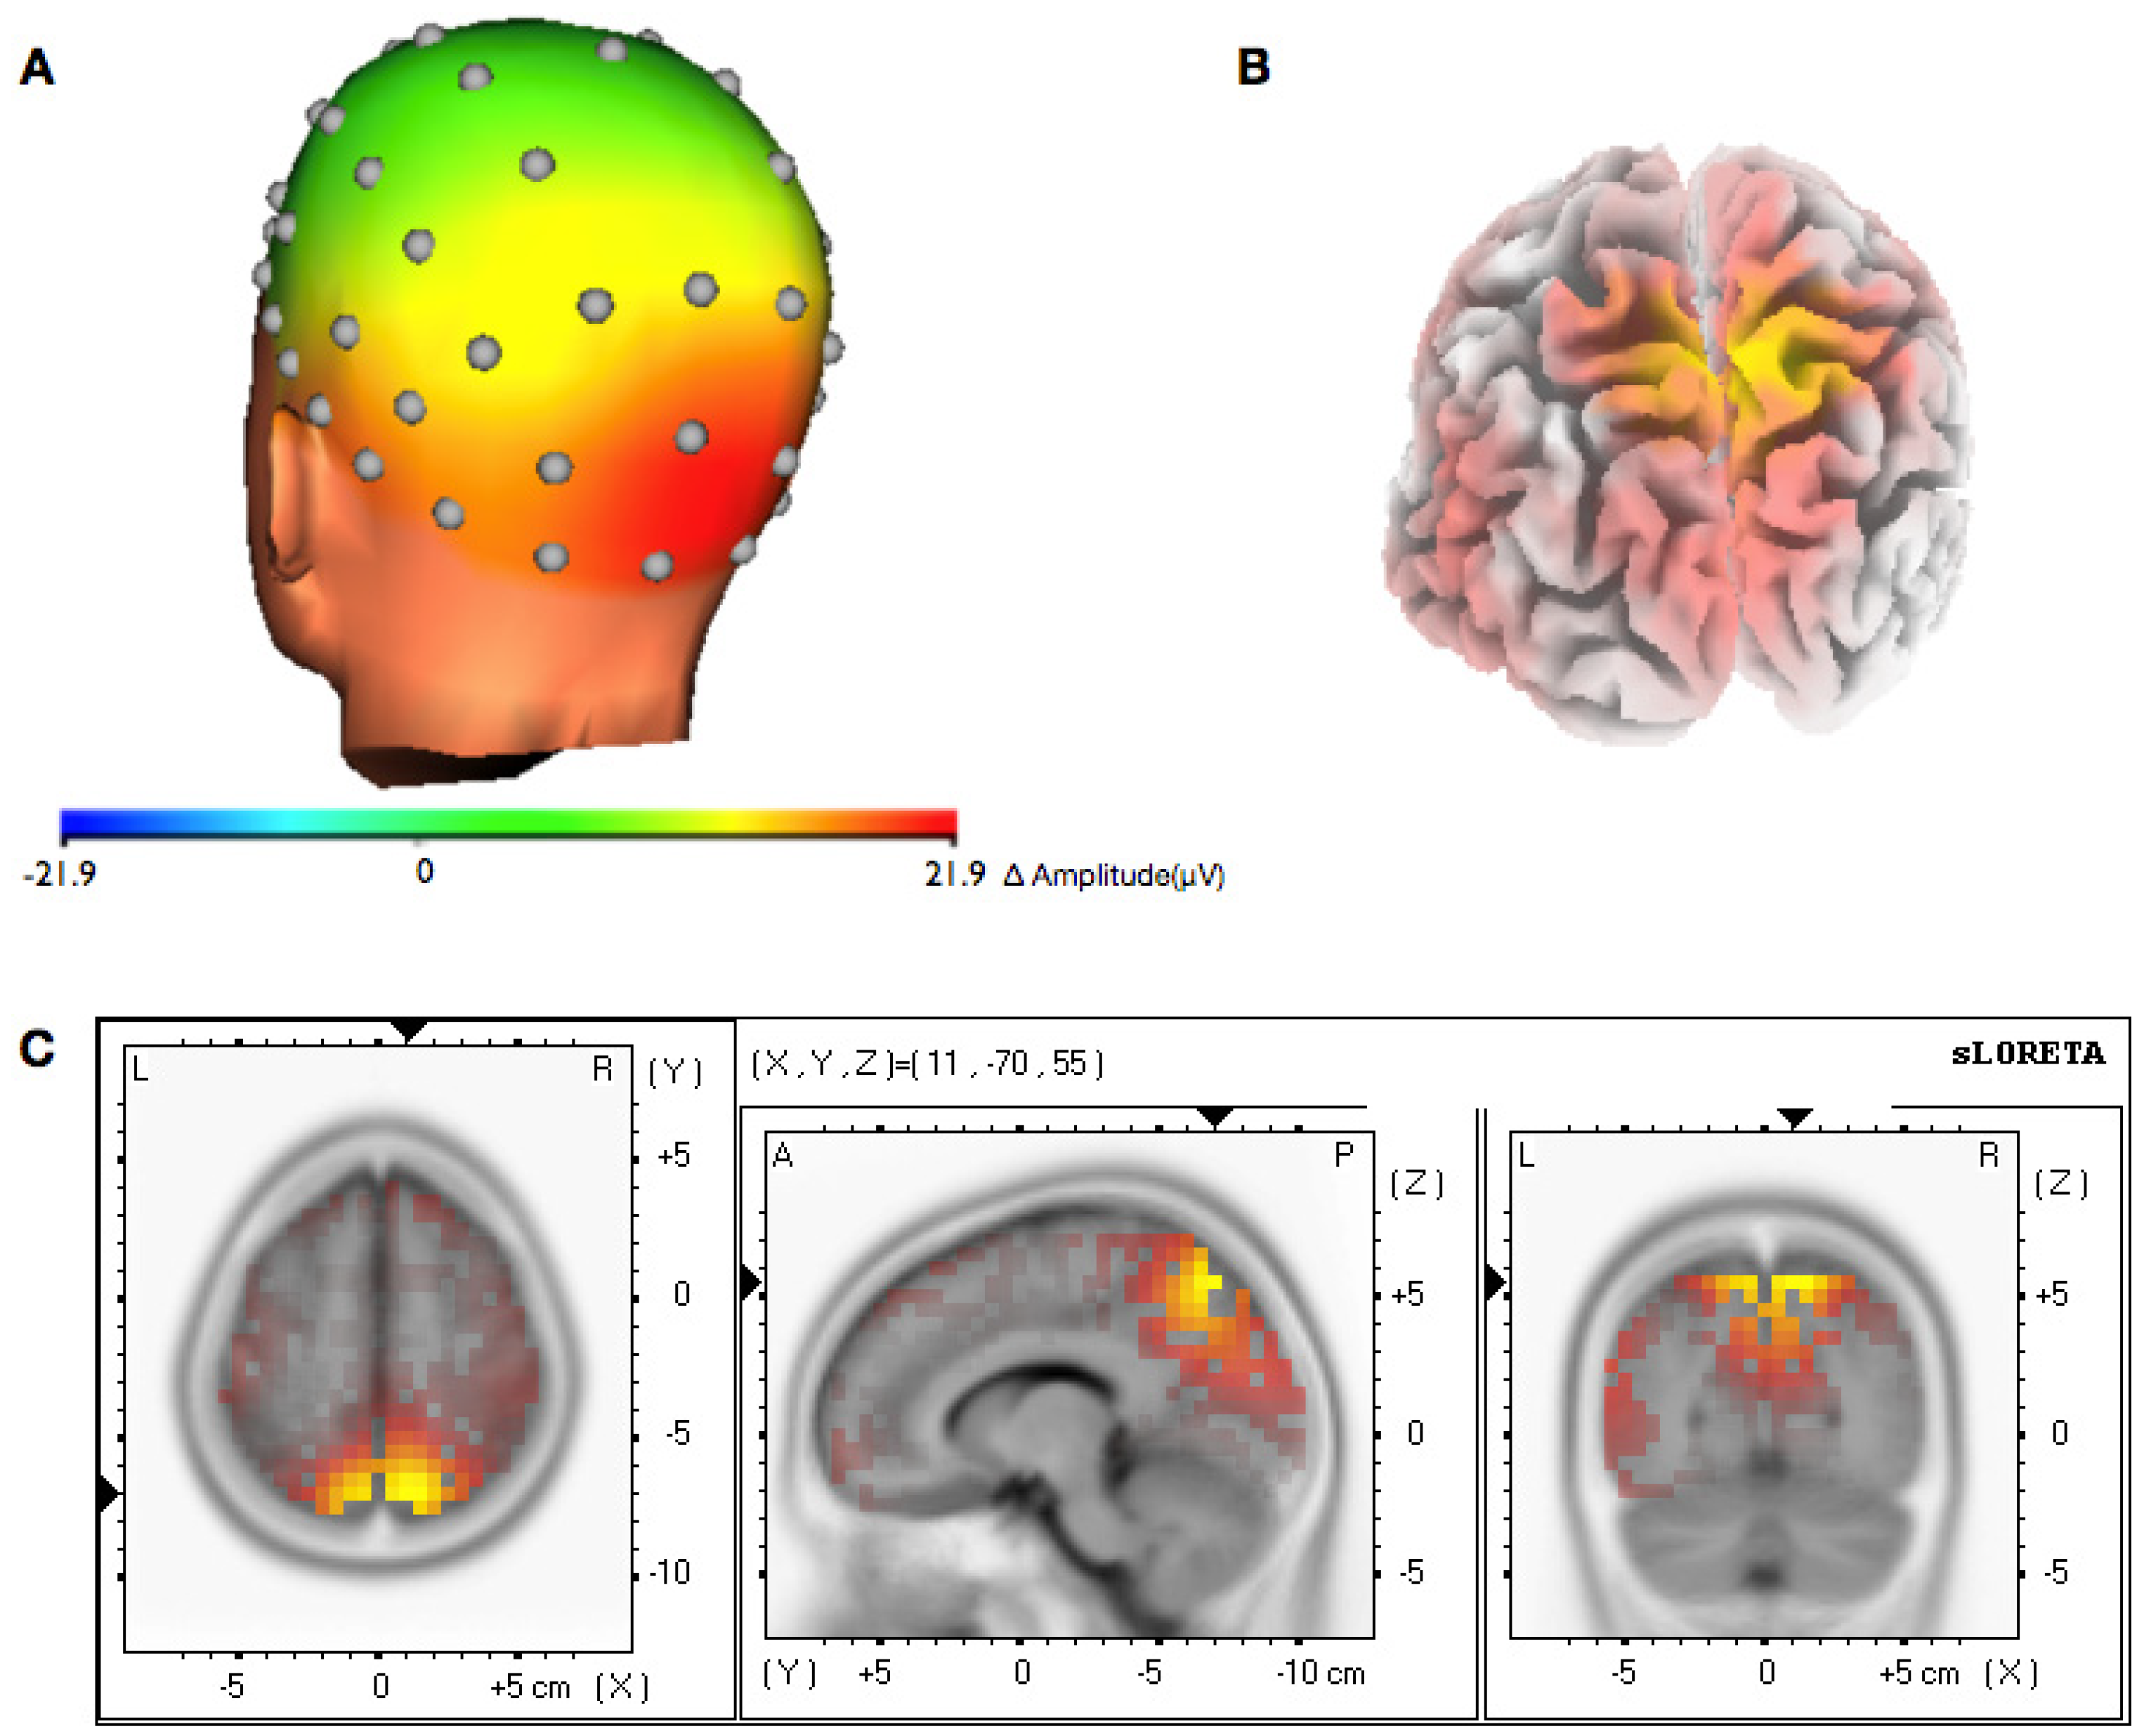
3.2. Topographical Analysis of BCI Training


3.3. Analysis of Efficiency of Artifact Control
4. Discussion
Acknowledgments
Conflicts of Interest
References
- Kelly, S.P.; Lalor, E.C.; Finucane, C.; McDarby, G.; Reilly, R.B. Visual spatial attention control in an independent brain-computer interface. IEEE Trans. Biomed. Eng. 2005, 52, 1588–1596. [Google Scholar] [CrossRef]
- Middendorf, M.; McMillan, G.; Calhoun, G.; Jones, K.S. Brain-computer interfaces based on the steady-state visual-evoked response. IEEE Trans. Rehabil. Eng. 2000, 8, 211–214. [Google Scholar] [CrossRef]
- Donchin, E.; Spencer, K.M.; Wijesinghe, R. The mental prosthesis: Assessing the speed of a P300-based brain-computer interface. IEEE Trans. Rehabil. Eng. 2000, 8, 174–179. [Google Scholar] [CrossRef]
- Pfurtscheller, G.; Brunner, C.; Schlogl, A.; Lopes da Silva, F.H. Mu rhythm (de)synchronization and EEG single-trial classification of different motor imagery tasks. Neuroimage 2006, 31, 153–159. [Google Scholar] [CrossRef]
- Wolpaw, J.R.; McFarland, D.J. Control of a two-dimensional movement signal by a noninvasive brain-computer interface in humans. Proc. Natl. Acad. Sci. USA 2004, 101, 17849–17854. [Google Scholar] [CrossRef]
- Birbaumer, N.; Ghanayim, N.; Hinterberger, T.; Iversen, I.; Kotchoubey, B.; Kubler, A.; Perelmouter, J.; Taub, E.; Flor, H. A spelling device for the paralysed. Nature 1999, 398, 297–298. [Google Scholar] [CrossRef]
- Lubar, J.F.; Shouse, M.N. EEG and behavioral changes in a hyperkinetic child concurrent with training of the sensorimotor rhythm (SMR): A preliminary report. Biofeedback Self Regul. 1976, 1, 293–306. [Google Scholar] [CrossRef]
- Fox, D.J.; Tharp, D.F.; Fox, L.C. Neurofeedback: An alternative and efficacious treatment for Attention Deficit Hyperactivity Disorder. Appl. Psychophysiol. Biofeedback 2005, 30, 365–373. [Google Scholar] [CrossRef]
- Sterman, M.B.; Egner, T. Foundation and practice of neurofeedback for the treatment of epilepsy. Appl. Psychophysiol. Biofeedback 2006, 31, 21–35. [Google Scholar] [CrossRef]
- Tallon-Baudry, C.; Bertrand, O. Oscillatory gamma activity in humans and its role in object representation. Trends Cogn. Sci. 1999, 3, 151–162. [Google Scholar] [CrossRef]
- Fries, P.; Reynolds, J.H.; Rorie, A.E.; Desimone, R. Modulation of oscillatory neuronal synchronization by selective visual attention. Science 2001, 291, 1560–1563. [Google Scholar] [CrossRef]
- Miltner, W.H.; Braun, C.; Arnold, M.; Witte, H.; Taub, E. Coherence of gamma-band EEG activity as a basis for associative learning. Nature 1999, 397, 434–436. [Google Scholar] [CrossRef]
- Rose, M.; Buchel, C. Neural coupling binds visual tokens to moving stimuli. J. Neurosci. 2005, 25, 10101–10104. [Google Scholar] [CrossRef]
- Wyart, V.; Tallon-Baudry, C. How ongoing fluctuations in human visual cortex predict perceptual awareness: Baseline shift versus decision bias. J. Neurosci. 2009, 29, 8715–8725. [Google Scholar] [CrossRef]
- Cardin, J.A.; Carlen, M.; Meletis, K.; Knoblich, U.; Zhang, F.; Deisseroth, K.; Tsai, L.H.; Moore, C.I. Driving fast-spiking cells induces gamma rhythm and controls sensory responses. Nature 2009, 459, 663–667. [Google Scholar] [CrossRef]
- Romei, V.; Gross, J.; Thut, G. On the role of prestimulus alpha rhythms over occipito-parietal areas in visual input regulation: Correlation or causation? J. Neurosci. 2010, 30, 8692–8697. [Google Scholar] [CrossRef] [Green Version]
- Kanai, R.; Chaieb, L.; Antal, A.; Walsh, V.; Paulus, W. Frequency-dependent electrical stimulation of the visual cortex. Curr. Biol. 2008, 18, 1839–1843. [Google Scholar] [CrossRef]
- Mensh, B.; Werfel, J.; Seung, H. BCI Competition 2003—Data set Ia: Combining gamma-band power with slow cortical potentials to improve single-trial classification of electroencephalographic signals. IEEE Trans. Biomed. Eng. 2004, 51, 1052–1056. [Google Scholar] [CrossRef]
- Palaniappan, R. Utilizing gamma band to improve mental task based brain-computer interface design. IEEE Trans. Neural Syst. Rehabil. Eng. 2006, 14, 299–303. [Google Scholar] [CrossRef]
- Grosse-Wentrup, M.; Scholkopf, B. High gamma-power predicts performance in sensorimotor-rhythm brain-computer interfaces. J. Neural Eng. 2012, 9. [Google Scholar] [CrossRef]
- Salari, N.; Buchel, C.; Rose, M. Functional dissociation of ongoing oscillatory brain States. PLoS One 2012, 7, e38090. [Google Scholar] [CrossRef]
- Yuval-Greenberg, S.; Tomer, O.; Keren, A.S.; Nelken, I.; Deouell, L.Y. Transient induced gamma-band response in EEG as a manifestation of miniature saccades. Neuron 2008, 58, 429–441. [Google Scholar] [CrossRef]
- Tallon-Baudry, C.; Bertrand, O.; Henaff, M.A.; Isnard, J.; Fischer, C. Attention modulates gamma-band oscillations differently in the human lateral occipital cortex and fusiform gyrus. Cereb. Cortex 2005, 15, 654–662. [Google Scholar]
- Vernon, D.; Egner, T.; Cooper, N.; Compton, T.; Neilands, C.; Sheri, A.; Gruzelier, J. The effect of training distinct neurofeedback protocols on aspects of cognitive performance. Int. J. Psychophysiol. 2003, 47, 75–85. [Google Scholar] [CrossRef]
- Hanslmayr, S.; Sauseng, P.; Doppelmayr, M.; Schabus, M.; Klimesch, W. Increasing individual upper alpha power by neurofeedback improves cognitive performance in human subjects. Appl. Psychophysiol. Biofeedback 2005, 30, 1–10. [Google Scholar] [CrossRef]
- Gruzelier, J.; Egner, T.; Vernon, D. Validating the efficacy of neurofeedback for optimising performance. Prog. Brain Res. 2006, 159, 421–431. [Google Scholar] [CrossRef]
- Malach, R.; Reppas, J.B.; Benson, R.R.; Kwong, K.K.; Jiang, H.; Kennedy, W.A.; Ledden, P.J.; Brady, T.J.; Rosen, B.R.; Tootell, R.B. Object-related activity revealed by functional magnetic resonance imaging in human occipital cortex. Proc. Natl. Acad. Sci. USA 1995, 92, 8135–8139. [Google Scholar] [CrossRef]
- Rose, M.; Schmid, C.; Winzen, A.; Sommer, T.; Buchel, C. The functional and temporal characteristics of top-down modulation in visual selection. Cereb. Cortex 2005, 15, 1290–1298. [Google Scholar]
- Congedo, M.; Lubar, J.F.; Joffe, D. Low-resolution electromagnetic tomography neurofeedback. IEEE Trans. Neural Syst. Rehabil. Eng. 2004, 12, 387–397. [Google Scholar] [CrossRef]
- Pascual-Marqui, R.D.; Michel, C.M.; Lehmann, D. Low resolution electromagnetic tomography: A new method for localizing electrical activity in the brain. Int. J. Psychophysiol. 1994, 18, 49–65. [Google Scholar] [CrossRef]
- Krishnaveni, V.; Jayaraman, S.; Anitha, L.; Ramadoss, K. Removal of ocular artifacts from EEG using adaptive thresholding of wavelet coefficients. J. Neural Eng. 2006, 3, 338–346. [Google Scholar] [CrossRef]
- Keren, A.S.; Yuval-Greenberg, S.; Deouell, L.Y. Saccadic spike potentials in gamma-band EEG: Characterization, detection and suppression. Neuroimage 2009, 49, 2248–2263. [Google Scholar]
- Boylan, C.; Doig, H.R. Effect of saccade size on presaccadic spike potential amplitude. Invest. Ophthalmol. Vis. Sci. 1989, 30, 2521–2527. [Google Scholar]
- Knuth, D.E. The Art of Computer Programming, Volume 2: Seminumerical Algorithms., 3rd ed; Addison-Wesley: Reading, MA, USA, 1997. [Google Scholar]
- Welford, B.P. Note on a method for calculating corrected sums of squares and products. Technometrics 1962, 4, 419–420. [Google Scholar] [CrossRef]
- Pascual-Marqui, R.D. Standardized low-resolution brain electromagnetic tomography (sLORETA): Technical details. Methods Find. Exp. Clin. Pharmacol. 2002, 24 (Suppl. D), 5–12. [Google Scholar]
- Talairach, J.; Tournoux, P. Co-Planar Stereotaxic Atlas of the Human Brain; Thieme: Stuttgart, Germany, 1988. [Google Scholar]
- Fuchs, M.; Kastner, J.; Wagner, M.; Hawes, S.; Ebersole, J.S. A standardized boundary element method volume conductor model. Clin. Neurophysiol. 2002, 113, 702–712. [Google Scholar] [CrossRef]
- Jurcak, V.; Tsuzuki, D.; Dan, I. 10/20, 10/10, and 10/5 systems revisited: Their validity as relative head-surface-based positioning systems. Neuroimage 2007, 34, 1600–1611. [Google Scholar] [CrossRef]
- Sirota, A.; Montgomery, S.; Fujisawa, S.; Isomura, Y.; Zugaro, M.; Buzsaki, G. Entrainment of neocortical neurons and gamma oscillations by the hippocampal theta rhythm. Neuron 2008, 60, 683–697. [Google Scholar] [CrossRef]
- Keizer, A.W.; Verment, R.S.; Hommel, B. Enhancing cognitive control through neurofeedback: A role of gamma-band activity in managing episodic retrieval. Neuroimage 2010, 49, 3404–3413. [Google Scholar] [CrossRef]
- Anderer, P.; Roberts, S.; Schlogl, A.; Gruber, G.; Klosch, G.; Herrmann, W.; Rappelsberger, P.; Filz, O.; Barbanoj, M.J.; Dorffner, G.; et al. Artifact processing in computerized analysis of sleep EEG—A review. Neuropsychobiology 1999, 40, 150–157. [Google Scholar] [CrossRef]
- McFarland, D.J.; McCane, L.M.; David, S.V.; Wolpaw, J.R. Spatial filter selection for EEG-based communication. Electroencephalogr. Clin. Neurophysiol. 1997, 103, 386–394. [Google Scholar] [CrossRef]
- Berger, H. Über das elektrenkephalogramm des menschen. Arch. Psycchiatr. Nervenkr. 1929, 87, 527–570. (in German). [Google Scholar]
- Adrian, E.D.; Matthews, B.H. The interpretation of potential waves in the cortex. J. Physiol. 1934, 81, 440–471. [Google Scholar]
- Hari, R.; Salmelin, R.; Makela, J.P.; Salenius, S.; Helle, M. Magnetoencephalographic cortical rhythms. Int. J. Psychophysiol. 1997, 26, 51–62. [Google Scholar] [CrossRef]
- Cannon, R.; Lubar, J.; Congedo, M.; Thornton, K.; Towler, K.; Hutchens, T. The effects of neurofeedback training in the cognitive division of the anterior cingulate gyrus. Int. J. Neurosci. 2007, 117, 337–357. [Google Scholar] [CrossRef]
© 2013 by the authors; licensee MDPI, Basel, Switzerland. This article is an open access article distributed under the terms and conditions of the Creative Commons Attribution license (http://creativecommons.org/licenses/by/3.0/).
Share and Cite
Salari, N.; Rose, M. A Brain-Computer-Interface for the Detection and Modulation of Gamma Band Activity. Brain Sci. 2013, 3, 1569-1587. https://doi.org/10.3390/brainsci3041569
Salari N, Rose M. A Brain-Computer-Interface for the Detection and Modulation of Gamma Band Activity. Brain Sciences. 2013; 3(4):1569-1587. https://doi.org/10.3390/brainsci3041569
Chicago/Turabian StyleSalari, Neda, and Michael Rose. 2013. "A Brain-Computer-Interface for the Detection and Modulation of Gamma Band Activity" Brain Sciences 3, no. 4: 1569-1587. https://doi.org/10.3390/brainsci3041569