Article

High-Precision 13CO2/12CO2 Isotopic Ratio Measurement Using Tunable Diode Laser Absorption Spectroscopy at 4.3 μm for Deep-Sea Natural Gas Hydrate Exploration

1
Key Laboratory of Marine Mineral Resources, Ministry of Natural Resources, Guangzhou Marine Geological Survey, Guangzhou 510760, China
2
College of Instrumentation & Electrical Engineering, Key Laboratory of Geophysical Exploration Equipment, Ministry of Education of China, Jilin University, Changchun 130026, China
*
Authors to whom correspondence should be addressed.
Appl. Sci. 2019, 9(17), 3444; https://doi.org/10.3390/app9173444
Submission received: 12 July 2019 / Revised: 16 August 2019 / Accepted: 17 August 2019 / Published: 21 August 2019
(This article belongs to the Special Issue State-of-the-art Laser Gas Sensing Technologies)

Abstract

:
For the detection of deep-sea natural gas hydrates, it is very important to accurately detect the 13CO2/12CO2 isotope ratio of dissolved gas in seawater. In this paper, a 13CO2/12CO2 isotope ratio sensor is investigated, which uses a tunable diode laser absorption spectroscopy (TDLAS) technique at 4.3 μm. The proposed sensor consists of a mid-infrared interband cascade laser (ICL) operating in continuous wave mode, a long optical path multi-pass gas cell (MPGC) of 24 m, and a mid-infrared mercury cadmium telluride (MCT) detector. Aiming at the problem of the strong absorption intensity of the two absorption lines of 13CO2 and 12CO2 being affected by temperature, a high-precision temperature control system for the MPGC was fabricated. Five different concentrations of CO2 gas were configured to calibrate the sensor, and the response linearity could reach 0.9992 for 12CO2 and 0.9996 for 13CO2. The data show that the carbon isotope measurement precision was assessed to be 0.0139‰ when the integration time was 92 s and the optical path length was 24 m. The sensor is combined with a gas–liquid separator to detect the 13CO2/12CO2 isotope ratio of CO2 gas extracted from water. Results validate the reported sensor system’s potential application in deep-sea natural gas hydrate exploration.

1. Introduction

Natural gas hydrates (NGHs) are formed on the seabed under low-temperature and high-pressure conditions [1]. Compared to traditional energy, such as coal and petroleum, NGHs as an alternative energy source have the characteristics of clean, high-efficiency, and abundant reserves. To accelerate the utilization rate of NGHs, many efforts were made in the exploration of such energy sources, and the most important thing is to accurately identify the distribution area. Stable isotope compositions of volatiles bound in the formation of NGHs are due to physical processes and chemical reactions [2,3]. Therefore, the isotope compositions can be used to identify and even quantitatively analyze the source or settlement position of NGHs.
At present, a very effective method for detecting deep-sea natural gas hydrate is measuring the gas dissolved in the seawater. The type of gas measured mainly includes carbon dioxide (CO2) and its carbon isotope ratio. So far, high-precision chemical element measured methods mainly include mass spectrometry [4], chromatography [5], flame ionization [6], etc. However, these detection methods are complex in structure and poor in long-term measurement stability, which are not suitable for detection in a complex seabed environment. Recently, the tunable diode laser absorption spectroscopy (TDLAS) [7,8,9,10,11] technique was applied in many non-contact gas detection applications, such as environmental, industrial, biology, and safety applications, as a consequence of its high sensitivity and high resolution. In 2006, Lau et al. measured the CO2 isotopic ratio under the conditions of 45 Torr and a light path length of 100.9 m using a distributed feedback laser in the absorption spectrum of 1.6 μm, achieving the precision of ±1.0‰ at 3000 ppm [12]. In 2008, AERODYNE RESEARCH, Inc. proposed a CO2 isotope monitor using a mid-infrared absorption spectroscope with optical path lengths up to 76 m to achieve 0.10‰ precision for δ13C at 1 s [13]. In the same year, Tuzson described in situ, continuous, and high-precision isotope ratio measurements of atmospheric CO2 using a quantum cascade laser-based absorption spectrometer, and achieved isotope ratios of ambient CO2 with precision of 0.03 at 100 s of integration time [14]. In 2012, Kasyutich illustrated a laser spectrometer based on a continuous-wave thermoelectrically cooled distributed feedback quantum cascade laser at 2308 cm−1 for the measurement of 13CO2/12CO2 isotopic ratio changes in exhaled breath samples. Typical short-term δ13C precisions of 1.1‰ (1 s integration time) and 0.5‰ (8 to 12 s integration time) were estimated from the Allan variance plots of recorded data [15]. In 2018, a vertical cavity surface emitting laser was utilized by Ghetti et al. in the detection of CO2 isotopic ratio collected from exhaled small samples of CO2 (0.1 L) with a resolution of about 0.2% [16]. Although these instruments achieved good carbon isotope detection performance, they cannot meet the requirement of deep-sea natural gas hydrate exploration (δ13C of ~0.01‰). Moreover, these sensing systems are bulky, which makes them unsuitable for CO2 gas detection on the seabed with compact requirements.
Compared to state-of-the-art studies, this paper presents the following: (a) a high-precision detection method for CO2 isotopes applied for deep-sea NGHs, (b) a linear optical structure combined with a multi-pass gas cell (MPGC) to overcome the challenges of a physically compact requirement for NGH exploration, (c) a high-precision temperature control system for the MPGC to improve the measurement precision of carbon isotopes, (d) a compact cylinder cell placed between the interband cascade laser (ICL) and MPGC to remove the interference from CO2 in the environment and to improve the measurement accuracy, and (e) a prototype using a mid-infrared absorption spectroscope capable of CO2 isotope detection in indoor experiments. In this study, a sensing system capable of highly precise measurements of the 13CO2/12CO2 isotope ratio of CO2 gas separated from seawater was developed. The TDLAS technique is utilized to detect the carbon isotope absorption line which is located in the strong spectrum band at 4.2 μm. The described sensor utilizes a mid-infrared ICL operating in continuous wave mode with low-temperature, long-path multi-reflection gas absorption chambers, and a mid-infrared MCT detector with high responsivity. An indoor experiment was conducted to verify the work performance and application feasibility of the proposed sensing system.
The remainder of this paper is organized as follows: Section 2 introduces the carbon isotope detection principle and absorption line selection. Section 3 presents the system design architecture that includes an optical part and electrical part. In addition, the sensor’s calibration and its response combined with a gas–liquid separator were determined in an indoor experiment, which is described in Section 4. Finally, the conclusions and future research prospects of carbon isotopic ratio measurement are illustrated in Section 5.

2. Carbon Isotope Detection Principle and Absorption Line Selection

2.1. Carbon Isotope Detection Principle

The basic principle of the TDLAS technique for carbon isotope detection is the Beer–Lambert law [17]. After passing through the MPGC filled with the measured gas, the laser measures the absorption of specific gas molecules with a given optical path length to obtain the concentration characteristics of the gas molecules. The Beer–Lambert law can be described by the following formula:
I 1 ( v ) = I 0 ( v ) e α ( v ) P C L ,
where I 0 ( v ) is the emitting light intensity of the laser, I 1 ( v ) is the light intensity after passing the measured gas, L is the effective length of the absorption optical path, P is the pressure in the cell, C is the gas concentration, and α ( ν ) is the molecular absorption coefficient. Then, α ( ν ) can be expressed as follows:
α ( v ) = S ( T ) g ( v v ) C ,
where S(T) is the absorption intensity of gas at temperature T, g ( v v ) is the absorption line function of measured gas, which relates to the concentration C and pressure P of the measured gas, and v is the initial frequency of the energy level transition of gas molecule. To improve the minimum detection limit (MDL) performance of the sensor, tunable diode laser absorption spectroscopy-wavelength modulation spectroscopy (TDLAS-WMS) was adopted to eliminate the 1/f noise caused by the ICL or external environmental disturbances [18]. The time-dependent wavelength of the ICL can be described as follows:
v = v 0 + A cos ( ω t ) ,
where v 0 is the central frequency of the emitting light, which is determined by the low-frequency component of the driving signal, and A and ω are the amplitude and frequency of the high-frequency component of the driving signal, respectively. By substituting Equation (3) into Equation (1) and expanding it in the form of a cosine Fourier series, we get
I 1 ( v ) = n = 0 A n ( v 0 ) cos ( n ω t ) ,
where An is the amplitude of each harmonic component, which can be expressed as follows [19]:
A n ( v 0 ) = I 0 ( v ) 2 n 1 C L n ! A n d n α ( v ) d v n | v = v 0 .
According to Equation (5), the amplitude of the second harmonic component is
A 2 ( v 0 ) = I 0 ( v ) C L 4 A 2 d 2 α d v 2 | v = v 0 .
Based on the above formulas, the second harmonic components at the center frequency reach maximum values, which are positively proportional to the gas concentration. In summary, TDLAS-WMS is the optimum choice to analyze the measured gas concentration, which can effectively reduce the 1/f noise, increase the signal-to-noise ratio, and improve the MDL performance of the sensor [18].
For carbon isotope detection, δ13C is defined to represent the carbon isotope ratio, shown as follows [20]:
δ C 13 = 1000 × ( [ C 13 O 2 ] / [ C 12 O 2 ] R P D B 1 )   , ,
where RPDB is the 13C/12C ratio of Pee Dee Belemnite (PDB), assumed to 0.01124 [21].
The parameters of spectral line absorption intensity are a function of temperature; therefore, when the temperature of the measured gas changes, it will bring uncertainty to the measurement results. The reason is that the temperature has different influences on the absorption intensity of the two pair lines of the carbon isotope. In the detection of isotope δ 13 C values, the effect of temperature on abundance values can be described by
Δ δ Δ T Δ E k B T 2 × 1000 ,
where Δ δ is the isotope ratio change, Δ T is the gas temperature change, B is the Boltzmann constant, k is a constant, T is the absolute temperature, and Δ E is the low energy level difference between the two absorption lines.
To reduce the effect of temperature change on carbon isotope detection, it is necessary to select absorption line pairs with low energy levels as close as possible to each other. In addition, high-stability temperature control is required for the MPGC.

2.2. Absorption Line Selection

The high-resolution transmission (HITRAN) molecular absorption database is a worldwide standard for calculating or simulating atmospheric molecular transmission and radiation [22,23]. It covers a wide spectral region from microwave to ultraviolet radiation. In the infrared band, the absorption spectra mainly comprise vibrational and rotational spectra, and each gas has multiple absorption bands. The HITRAN absorption spectra of 10 ppmv CO2 and 1% H2O at a gas pressure of 20 Torr with a 24-m effective optical path length are depicted in Figure 1.
The selection of the absorption line pair of 13CO2/12CO2 is especially critical for obtaining high sensitivity and precision. The absorption line pair was chosen at 2315.10 cm−1 and 2315.36 cm−1 with appropriate spacing, as it does not overlap with other chemical substances, such as methane or sulfuretted hydrogen. The absorption lines are strong, resulting in a better signal-to-noise ratio and avoiding the need for a larger absorption cell, which is beneficial for the miniaturization of the sensing system. Due to the similar low energy levels of absorption line pairs, the detected isotopic stability is less dependent on temperature. In particular, there is no water vapor absorption line between the line pairs; thus, the sensing system does not need to over-consider the influence of ubiquitous water vapor.
Using the selected absorption line pair, the parameters shown in Equation (8) can be determined as follows: Boltzmann constant B = 1.328 × 10⁻²³ J·K−1, Δ E = 4.76 × 102 cm−1, k = 1.9865 × 10⁻²³ J·cm, and the target temperature T = 300 K. For the target CO2 isotope δ 13 C value of 0.6‰, the temperature change amount Δ T should be less than 0.127 K. If the calculation of the MDL according to Allan variance can reach lower than ~0.01‰, it will meet the requirement of deep-sea NGH exploration.

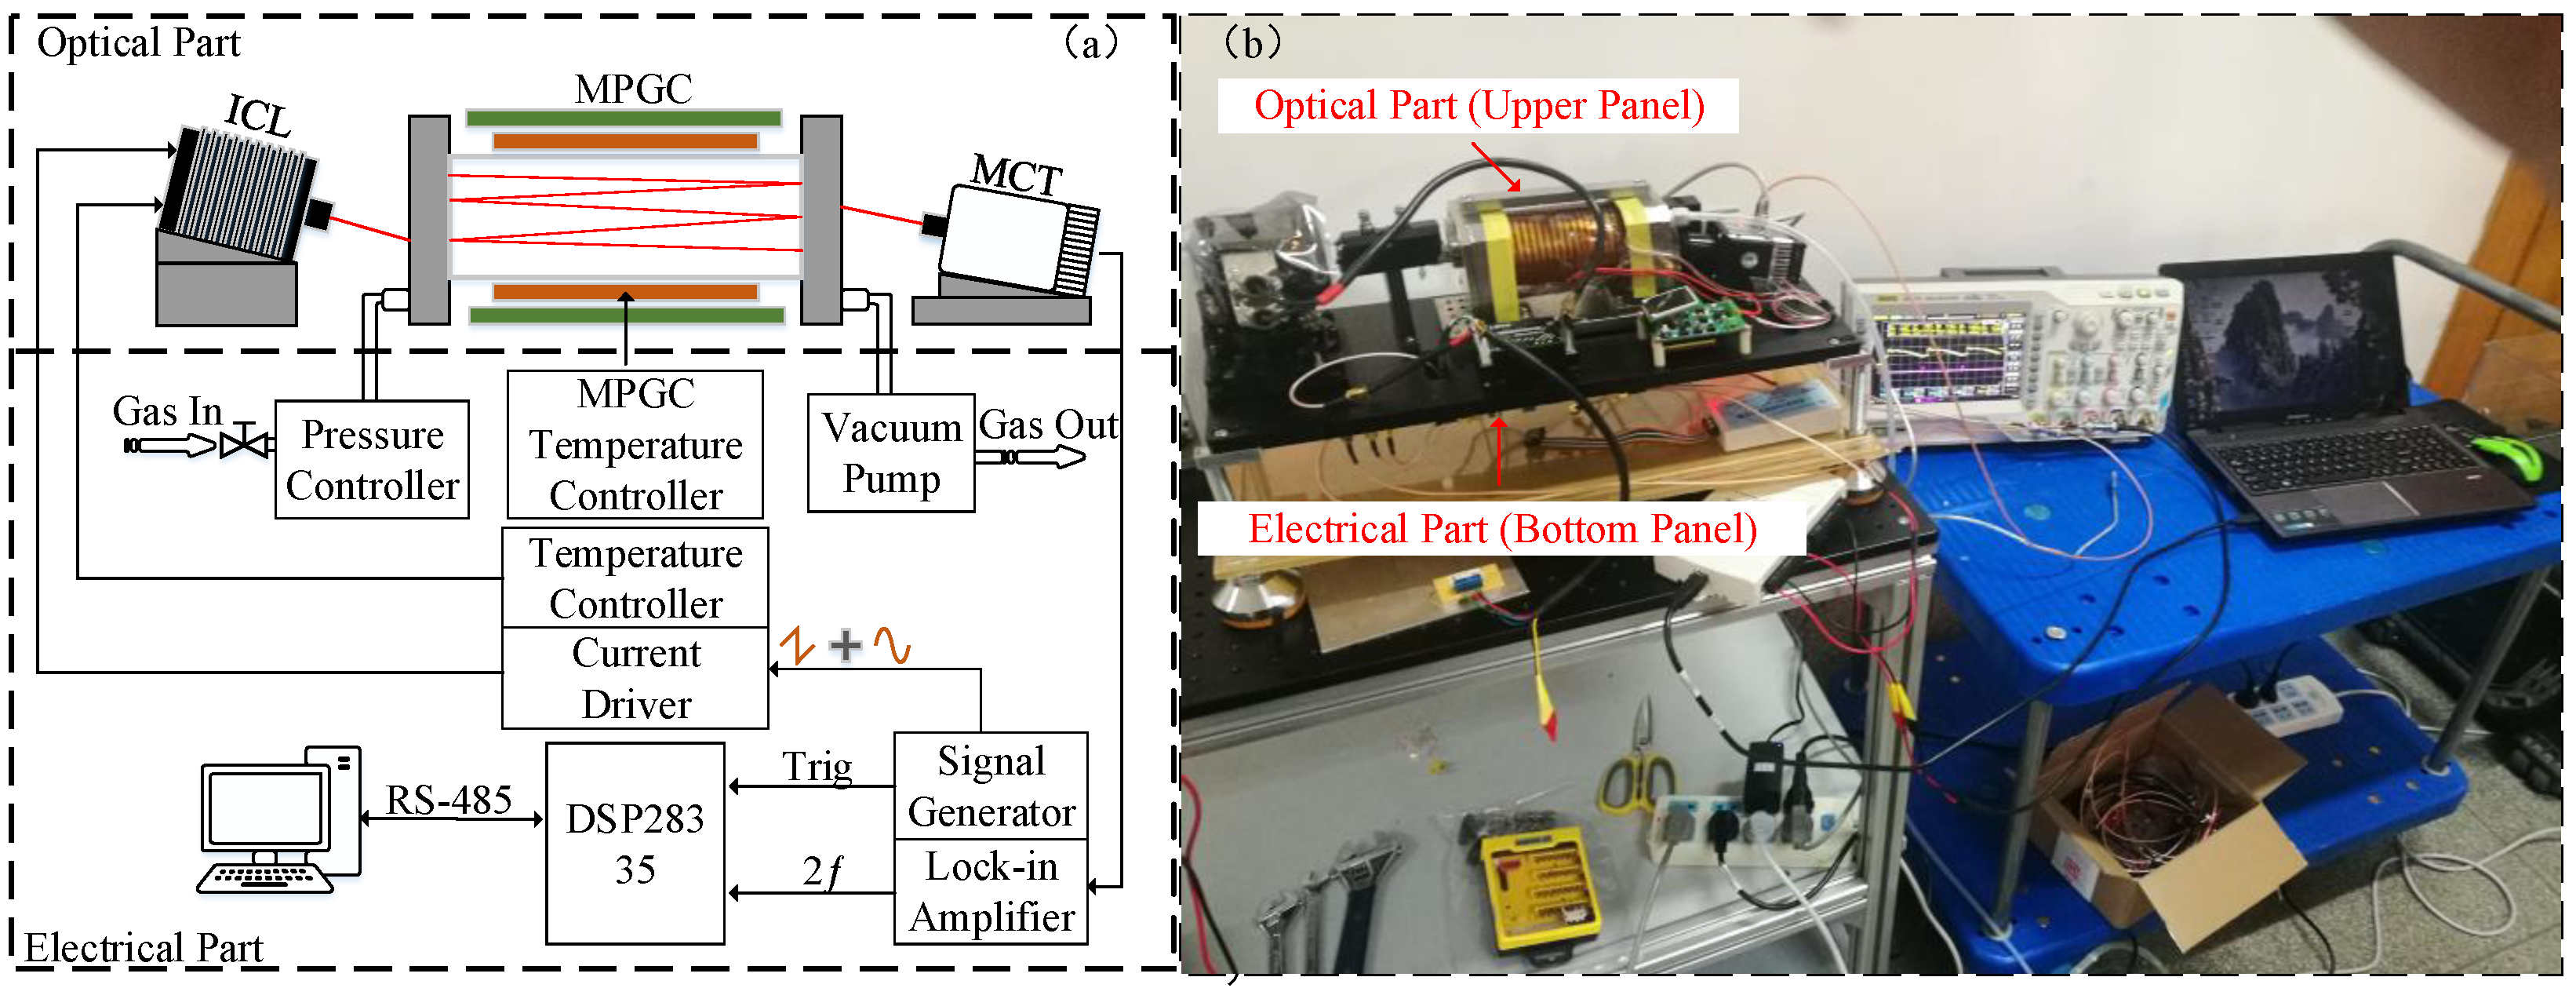
3. System Configuration

Using the above detection principle, the schematic block diagram and physical image of the sensing system are shown in Figure 2a,b, respectively.
The sensing system mainly includes an optical part and an electrical part. In the optical part, a continuous-wave ICL with a thermoelectric cooling function produced by Nanoplus was used as a luminous source. In order to meet the compact requirements of the sensing system, the physical size of the MPGC was 20 × 7.6 × 10.5 cm3, and the effective optical path was 24 m. The emitting light of the ICL enters into the MPGC (custom design multi-pass White type absorption cell) with correct position and angle, and exits to the mid-infrared MCT detector after 215 reflections in the interior of the MPGC. The mid-infrared detector (PVI-4TE-5, VIGO, Ożarów Mazowiecki, Poland) with a thermoelectric cooling function was manufactured by VIGO Systems.
In the electrical part, a self-fabricated ICL driver and temperature controller were used to replace commercial instruments, thereby reducing the size and cost of the proposed sensor. A low-power, high-performance, floating-point digital signal processor (DSP, Texas Instruments, Dallas, TX, USA) was used as the controller for the sensing system. Under the control of the DSP processor, a triangular wave signal and a sine wave signal are superimposed by an adder and supplied to a current source for scanning and modulating the ICL. The signal output from the mid-infrared MCT is demodulated using a self-developed lock-in amplifier (LIA). The DSP processor uses an analog-to-digital converter (ADC) to acquire the peak of secondary harmonic signal pairs, and then obtains the 13CO2/12CO2 isotope ratio according to the calibration curve. A pressure controller (model IQ + Flow, 4 × 3 × 1 cm3) manufactured by Bronkhorst was used to control the pressure of the MPGC at 20 Torr, while the micro-DC pump (TOPSFLO, Changsha, China) manufactured by Knf Neuberger was used to extract the separated gas into the MPGC.
As the absorption coefficient of the selected absorption line pairs to be measured can be affected by the temperature of CO2, the temperature of CO2 directly affects the accuracy and precision of the sensing system. A high-precision temperature control system for the MPGC was designed and developed in this paper. The schematic block diagram and physical image are shown in Figure 3a,b.
In terms of hardware in the circuit, a polyimide electrothermal film as a heating device and a PT1000 platinum resistor with ±0.03 °C accuracy (1/10 B Class) as a temperature sensor were used to form a closed-loop temperature control system. The precision of the temperature measurement could reach 10 mK. For software, the Ziegier–Nichols method was used to set the values of the three proportional, integral, and difference parameters (P, I, and D) [24]. Aiming to address the temperature overshoot caused by the complex structure and slow response of the controlled object, the integral separation PID control algorithm was used to rapidly control the temperature and avoid overshoot, resulting in reliable performance for the 13CO2/12CO2 isotope sensing system.

4. Indoor Experiment

4.1. System Operating Temperature Control

The experiment for the MPGC working temperature was conducted to verify the performance of the investigated temperature control system, and the experimental results are shown in Figure 4.
It can be seen from the above figure that the working temperature of the MPGC reached a stable state after 15 s with no overshoot. In the stable state, the temperature fluctuation of 0.028 K was less than 0.127 K. Before the set threshold of working temperature was reached, the PD algorithm was utilized. Then, the PID algorithm was used during the stable state. As the mentioned integral separation PID control algorithm was adopted, the working temperature of the MPGC increased quickly with no overshoot. Thus, the problem of slow recovery following heating overshoot could be avoided. As we used a polyimide electrothermal film wrapping with a cylindrical MPGC for heating, there was still a temperature gradient of 0.17 °C/cm in the radial direction of the MPGC. This is the main limitation of the sensing system for carbon isotope detection accuracy.

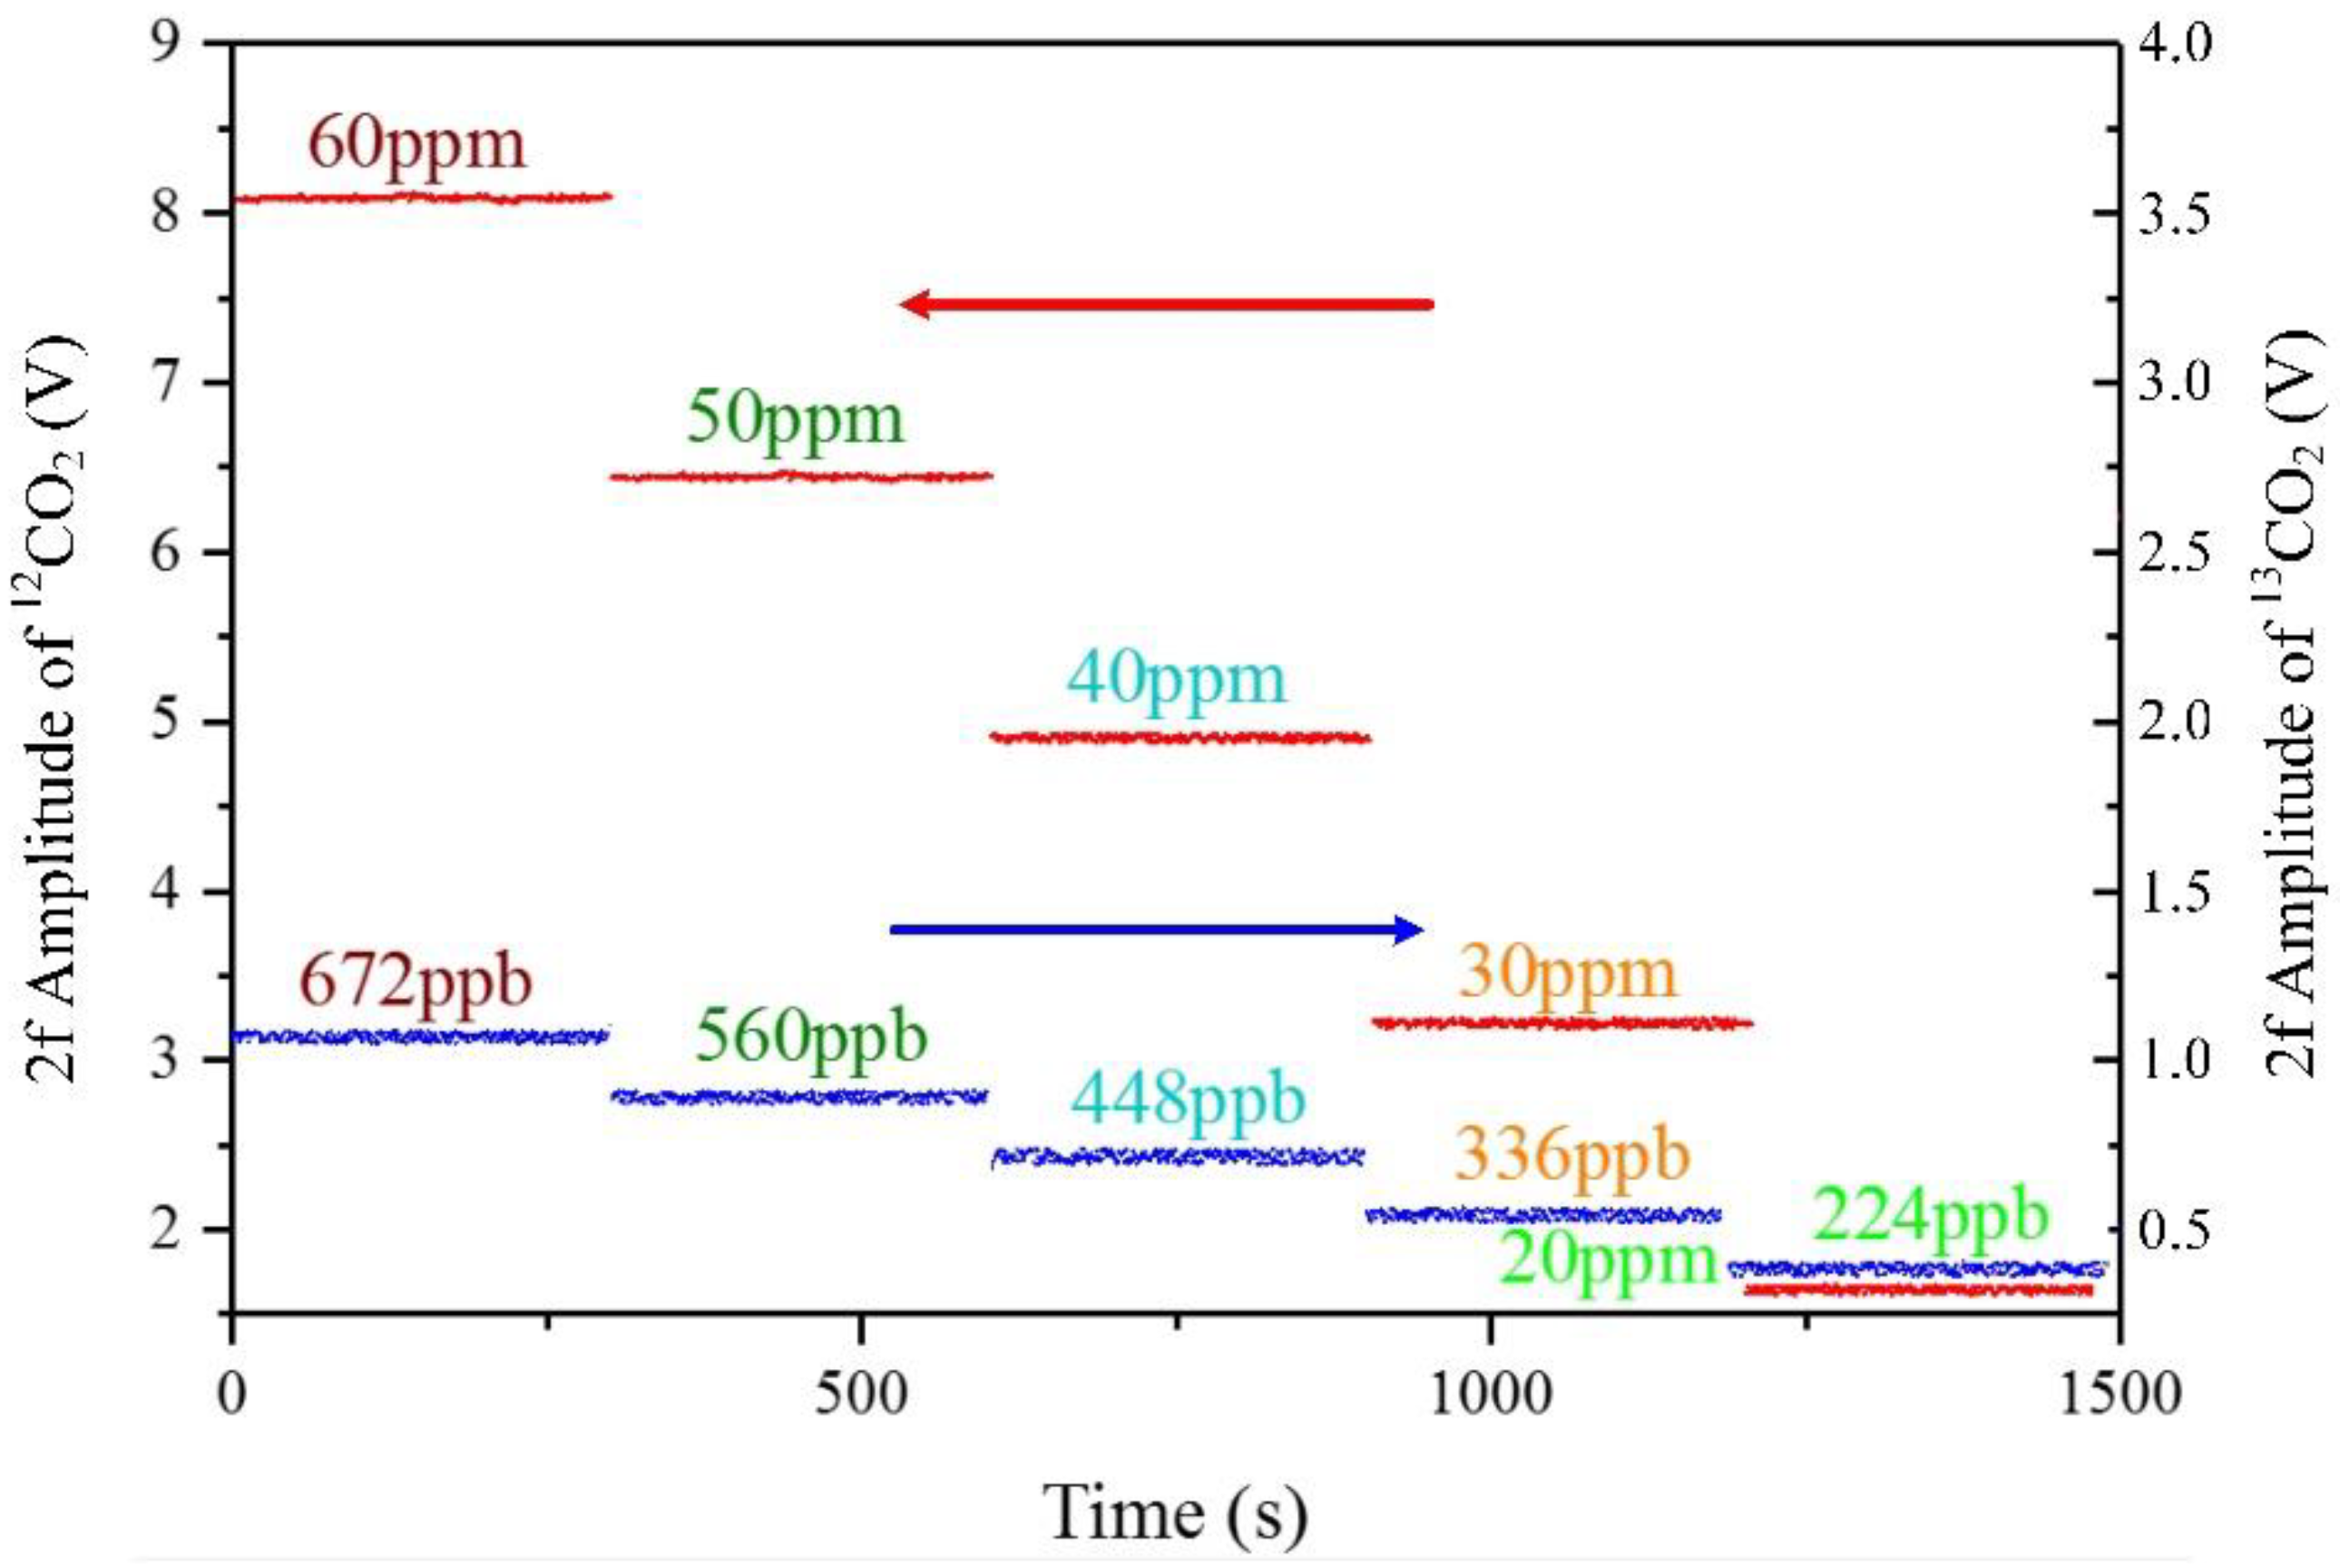
4.2. System Response

Because the sensor uses the TDLAS technique, the signal-to-noise ratio of the output signal is related to the modulation depth of the laser and the line width of the target gas molecular absorption line. In general, the optimal modulation coefficient is 2.2, that is, the modulation depth is 2.2 times the half-width at half-maximum of the absorption line peak. In the measurement, because the widths of the absorption spectral lines of 13CO2 and 12CO2 s were not consistent, the tradeoff modulation depth was 0.3 mA.
In the sensing system response experiment, the waveform of the second harmonic signal could be obtained by subtracting the background signal represented by the non-absorbent wing. Then, the relationship between the peak value of second harmonic signal and the carbon line pairs could be obtained. The second harmonic signals obtained from five different concentrations (20, 30, 40, 50, and 60 ppm) are shown in Figure 5.
As shown in the above figure, five different concentrations of CO2 gas were separately arranged using a gas dilution system with a concentration accuracy of ±1% (Environics, 4040); they were sequentially detected by the proposed carbon isotope sensing system. The peak value of the harmonic signal corresponding to different concentrations of 13CO2 and 12CO2 can be acquired to calculate the carbon isotope ratio R13.

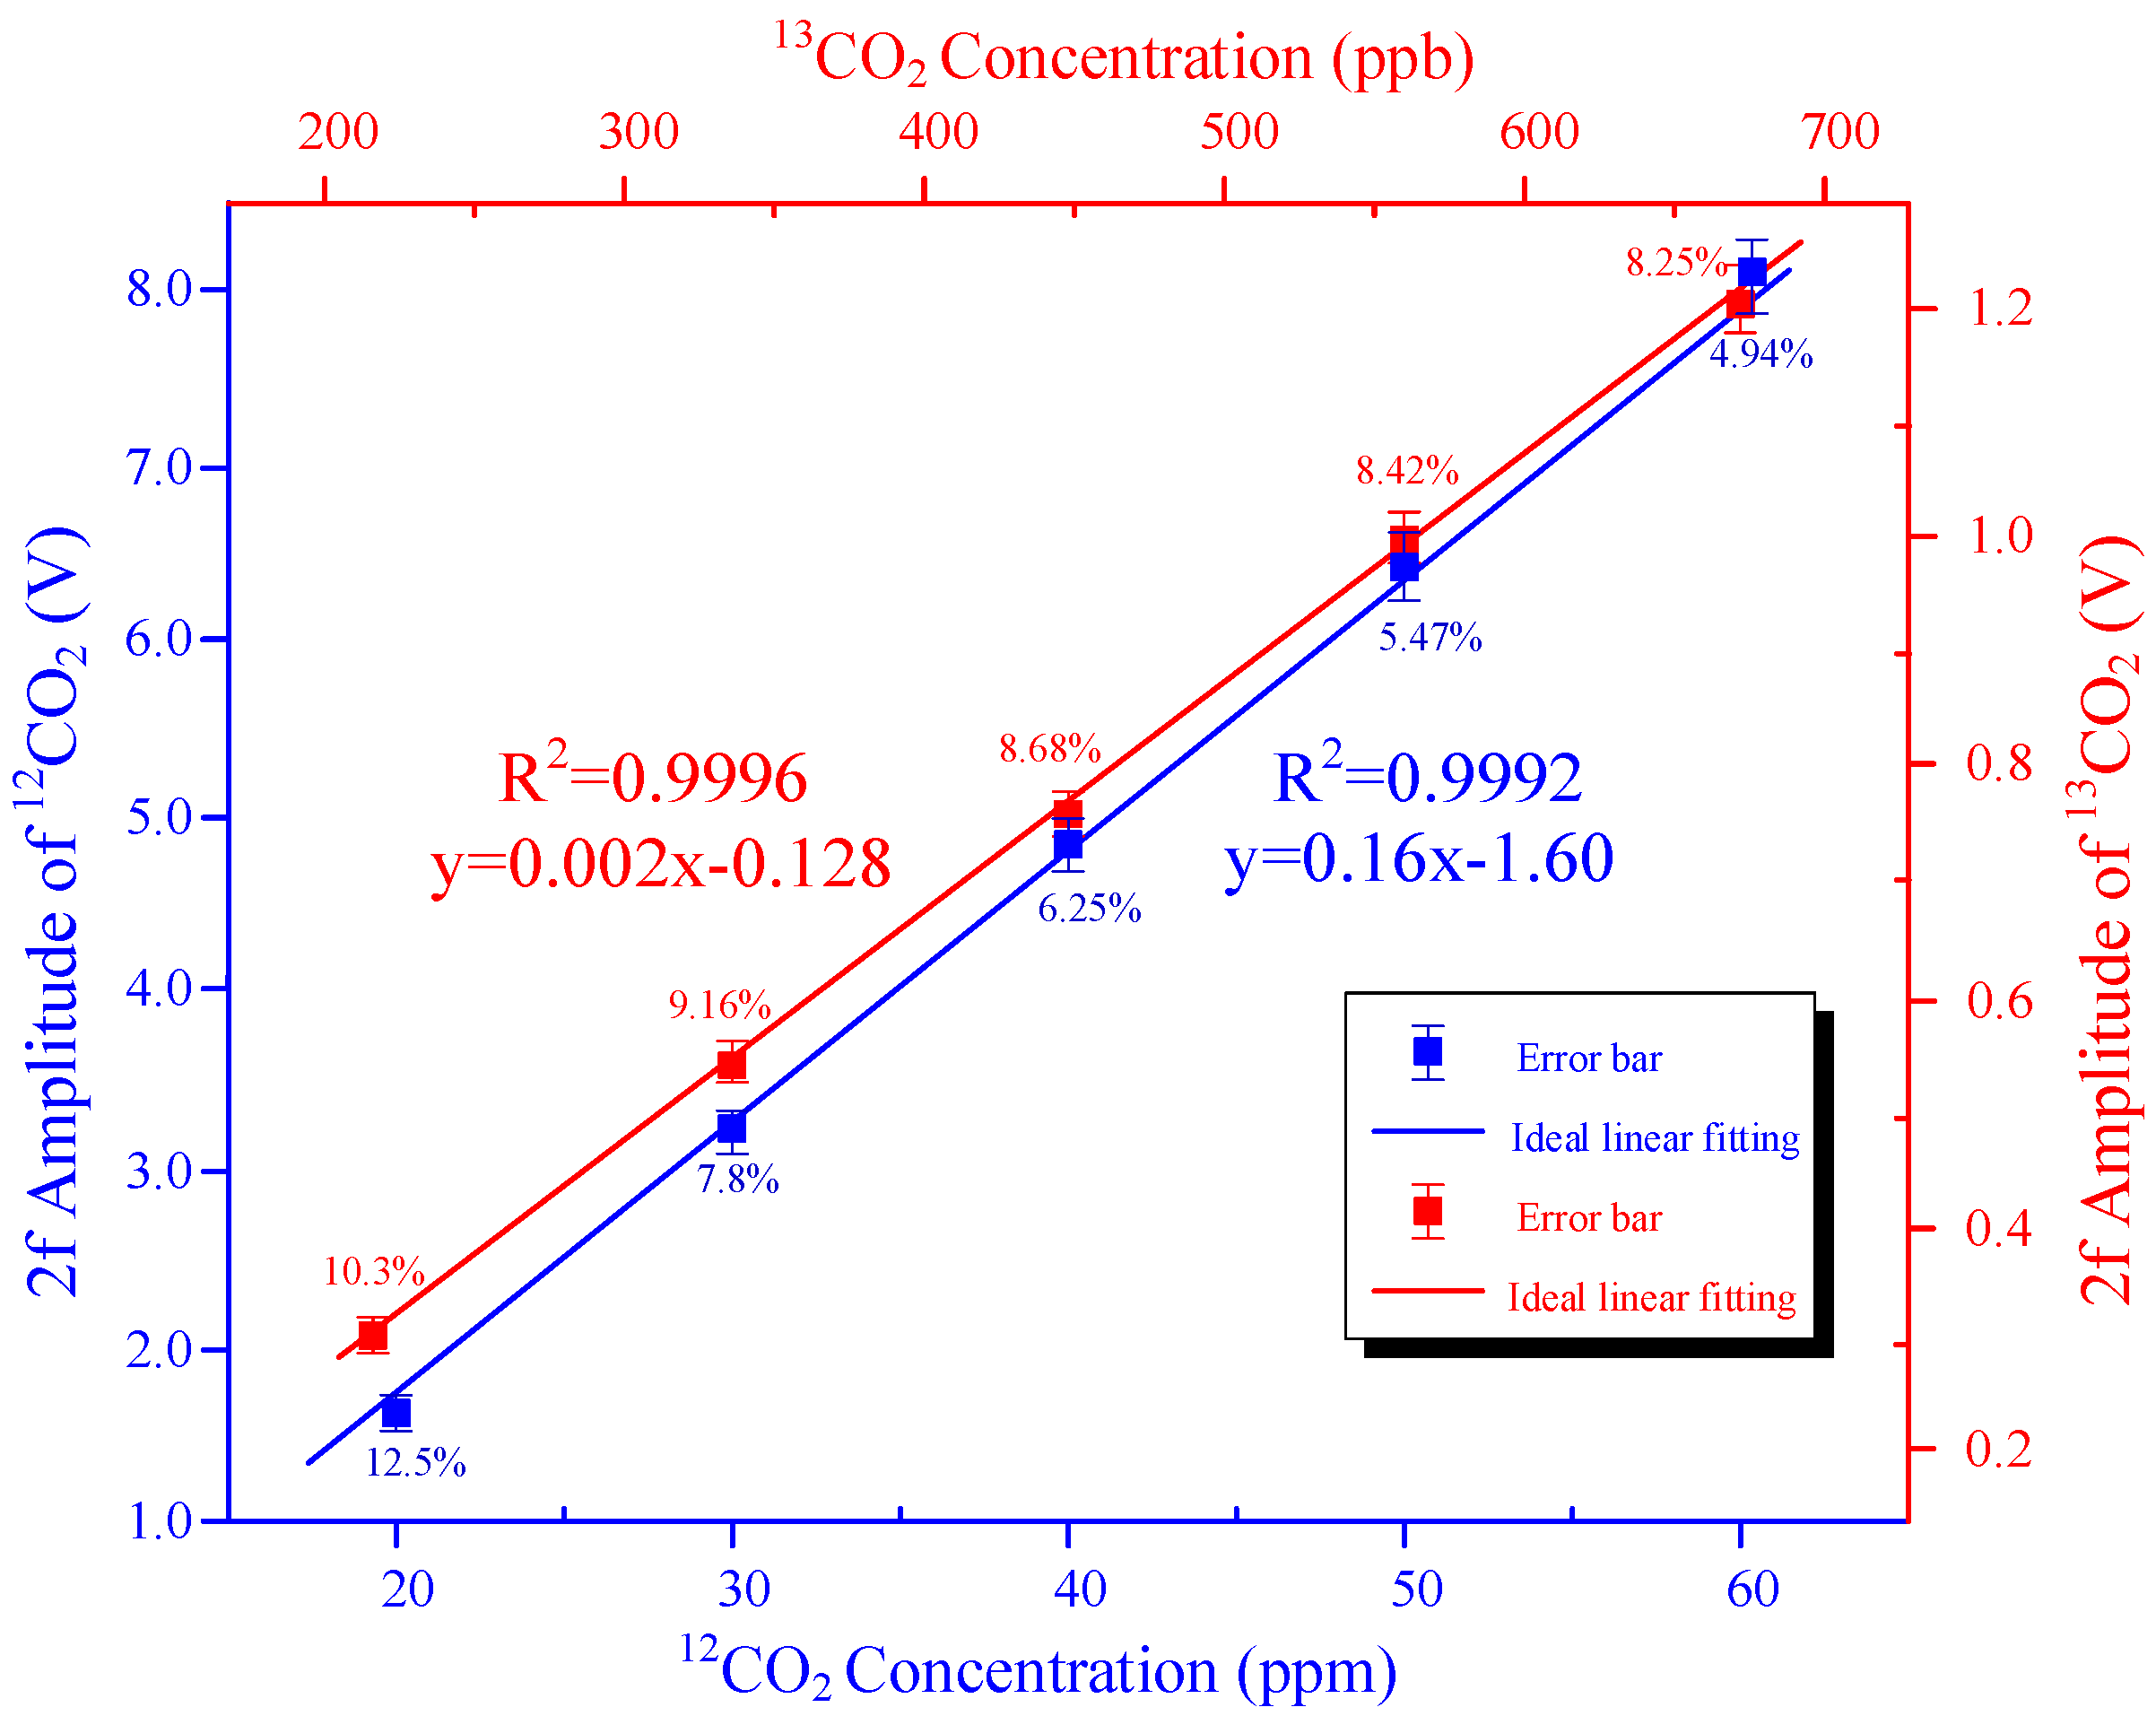
4.3. System Calibration

In order to accurately measure carbon isotopes, it is necessary to calibrate the sensing system using known concentrations of gas. The five different concentrations of CO2 (20 ppm, 30 ppm, 40 ppm, 50 ppm, and 60 ppm) configured above were pumped into the MPGC with 5 min of measurement and a constant pressure of 20 Torr. The peak values of the second harmonic signal of 13CO2 and 12CO2 are shown in Figure 6.
The five datasets were averaged firstly, and then the relationship between the average voltage and calibration concentration was obtained, as shown in Figure 7.
In Figure 7, the blue data points indicate the relationship between peak values of the second harmonic signal of 12CO2 and the corresponding concentration. On the other hand, the red data points indicate the relationship between peak values of the second harmonic signal of 13CO2 and the corresponding concentration. Using the acquired data, we can obtain the following formulas via zero-crossing linear fitting:
C 12 O 2 = 0.16 × max 2 f ( C 12 O 2 ) 1.60 ,
C 13 O 2 = 0.002 × max 2 f ( C 13 O 2 ) 0.128 ,
where max2f(12C) and max2f(13C) are the peak values of the second harmonic signals of 13CO2 and 12CO2, respectively. The values of zero crossing shown in Equations (9) and (10) were −1.60 for 12CO2 and −0.128 for 13CO2, respectively. As the output response of the sensor was calibrated by linear fitting, the response linearity could reach 0.9992 for 12CO2 and 0.9996 for 13CO2, as shown in Figure 7. Calibrated errors were inevitably introduced to the equations. For 12CO2, the range of calibrated error was between 12.5% and 4.94%. The calibration error decreased with the increase in concentration. For 13CO2, the range of calibrated error was between 10.3% and 8.25%. In addition, with the increase in concentration, the calibrated error decreased, and the trend was consistent with that of 12CO2. The above two formulas can calculate the 13CO2 and 12CO2 concentration by deriving the peak values of the second harmonic signal; thus, the carbon isotope ratio can be obtained accurately.
The stability of the pressure control could reach ~0.2%, and the precision could reach ±0.04 Torr. The stability and precision of the pressure control affects the measurement performance of the sensing system. The static gas distribution mode, which closes the valves at the front and back ends of the MPGC (sealing the MPGC) when the gas pressure in the MPGC reaches the target value, was adopted to stabilize the gas pressure and reduce calibration error.

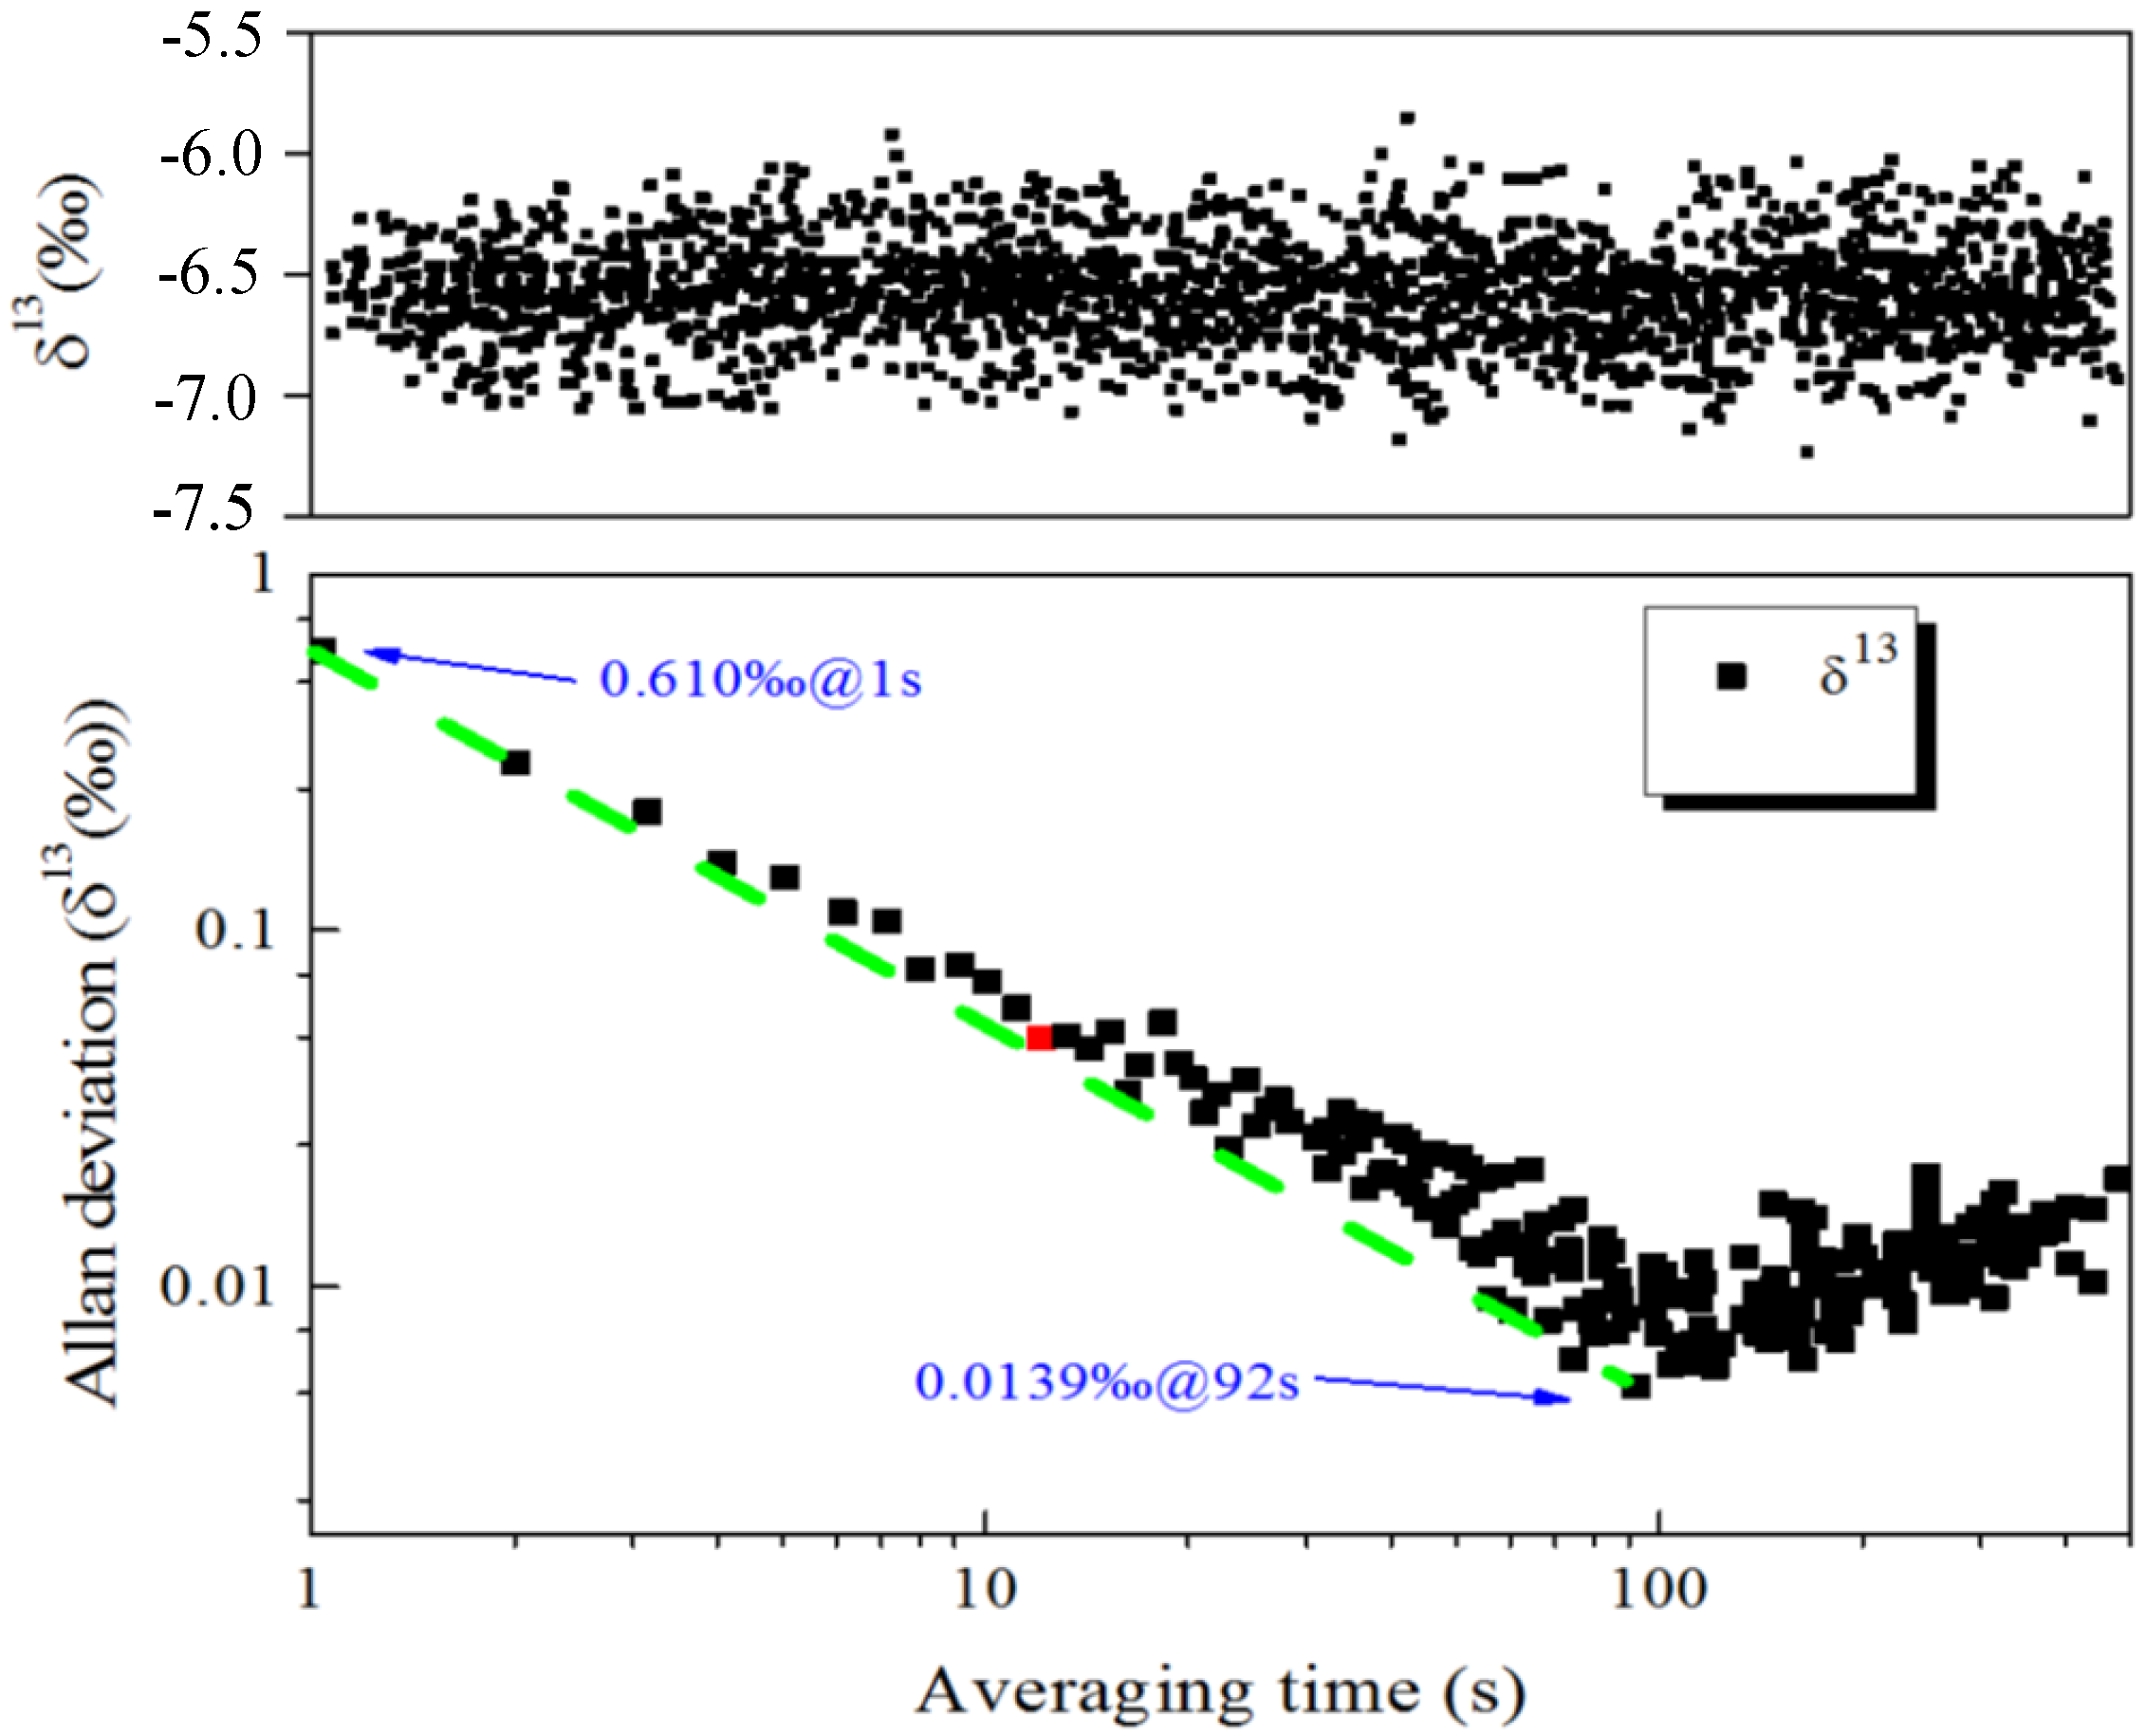
4.4. Carbon Isotope Measurement Precision

Based on the selected absorption spectrum lines of 13CO2/12CO2, the MDL concentration of the carbon isotope could reach sub-ppmv levels. Thus, the obtained performance can fully meet the requirements of NGH exploration, where the background value of CO2 concentration in seawater is several hundred ppmv. When measuring the isotope ratio of 13CO2/12CO2, the measured data drift over time. To test the measurement precision and long-term stability of the sensing system, a configured concentration of 500 ppmv CO2 was pumped into the MPGC. The Allen variance δ13C calculated from the measured data is shown in Figure 8.
The experiment results show that the precision was 0.610‰ with an integral time of 1 s. Moreover, when the integral time was increased to 92 s, the corresponding precision could be significantly reduced to 0.0139‰. Since white noise was the main component before 92 s, the precision decreased along with the increase in integral time. After 92 s, drift became the dominant source of noise, and the precision began increasing. The green dashed line in the figure describes the theoretical expectation of the system response when white noise plays a dominant role.

4.5. Working Performance with Gas–Liquid Separator

In order to test the measurement performance of the 13CO2/12CO2 isotope ratio of CO2 gas extracted from water, an experiment using the proposed sensing system connected with a gas–liquid separator was conducted. The schematic block diagram of the system configuration and the physical image are shown in Figure 9a,b.
Using the gas–liquid separator, the dissolved CO2 gas in the water was separated but had limited degassing quality. In order to meet the gas pressure requirement of 20 Torr in the MPGC, N2 was used as a supplementary gas. In the experiment, two flow controllers were used to control the flow rate of the dissolved CO2 gas and N2, at 2.5 sccm and 177.5 sccm, respectively. The separated CO2 and the N2 carrier gas formed the mixed gas that was pumped into the MPGC with two hours of measurement. The measured data are described in Figure 10.
In two hours of testing, the carbon isotope ratio of the CO2 gas separated from water was between −8.351‰ and −9.736‰, and the average value was −9.081‰; the largest fluctuation was 0.73‰, and the standard deviation was as low as 0.2‰ [25]. Since N2 carrier gas with a purity of 99.99% contained CO2 in the order of ppm, the carbon isotope ratio was constant. During the long-term experiment, there was a flow velocity fluctuation between the gas separated by the gas–liquid separator and the pure N2 carrier gas, which resulted in fluctuations of the carbon isotope ratio. The drift noise of the sensing system was not shown here.
However, these measurements were conducted using a continuous-wave mid-infrared ICL, a compact MPGC, a mid-infrared MCT detector, and optical and electrical components being exposed to air. Here, it should be noted that there is no sequestration of CO2 in exhaled air. The performances of the accuracy and precision of carbon isotope measurements were worse than the results achieved in the experimental measurement using a configured concentration of CO2. We expect that the accuracy and precision of the δ13C measurements performed in this work can be improved by adopting a cylinder cavity to seal the entire sensing system with pure nitrogen. In addition, as the temperature gradient exists in the radial direction and axial direction of the MPGC, the accuracy and precision of carbon isotope measurement deteriorated. A smaller MPGC with the same effective optical path length will be investigated, and the effect of the temperature gradient will be reduced. It is, therefore, expected that an improvement of the accuracy and precision can be achieved.

5. Discussion and Conclusions

In this paper, we reported the design and performance of a 13CO2/12CO2 isotope ratio sensor based on the TDLAS technique. The sensing system consisted of a mid-infrared ICL, a mid-infrared MCT detector, and an MPGC with a physical size of 20 × 7.6 × 10.5 cm3. The ICL with a center wavelength of 4.3 μm covered the carbon isotope absorption line pairs located at 2314.36 cm−1 and 2315.10 cm−1. In order to achieve high-precision measurements of carbon isotope ratio, a high-precision temperature control system for MPGC was fabricated. In the indoor experiment, the response linearity of the proposed system reached 0.9996%, and the MDL was as low as 0.0139‰ when the integration time was 92 s. Finally, the sensor was combined with a gas–liquid separator to measure the 13CO2/12CO2 isotope ratio of CO2 gas extracted from water. In conclusion, although the performance of the proposed sensor can meet the requirements of NGH exploration, this was only achieved in laboratory conditions, which suggests the proposed prototype of the 13CO2/12CO2 isotope sensor has potential application in deep-sea natural gas hydrate exploration. Further research is needed before the sensors can really be applied in NGH exploration. In terms of measurement technique, as 2f/1f WMS technique had a negligible absorption-independent background and was immune to the absorption-independent systematic losses. Thus, the 2f/1f WMS technique is a possible approach to reduce noise from mechanical vibration and to make the sensor more robust when applied in NGH exploration. In terms of sensors, cooling devices, antistatic devices, and shock absorption/isolation devices should be investigated. In terms of loading equipment, a cylindrical deep-sea hull that can withstand tens of mega-pascals on the sea floor is needed, as well as a mechanical fastening device and electrical interface cable.
Compared with the high-precision carbon isotope measured methods of mass spectrometry, although the mass spectrometer can achieve MDL of ppt level for single chemical elements and ppm level for isotopes, the requirements of a high vacuum and high stability make it more suitable for ultra-high-performance detection in a laboratory environment, whereas it is not suitable for application in complex environments. For chromatographic analysis, its advantages lie in the detection of a variety of chemical components, and the MDL can reach to ppm level; however, it seems inadequate to meet the MDL requirement of ppb level. As far as flame ionization is concerned, it is responsive to almost all organic materials, and the response is proportional to the number of carbon atoms; however, it is insensitive to inorganic substances such as CO2, H2O, CS2, etc. Based on the above discussion, the mid-infrared TDLAS technique can realize the MDL of ppb level for single gas components, as well as tens of ppm for isotopes, and it can be applied in complex environments.
In many practical applications, the ICL is subjected to low-frequency environmental perturbations such as thermal fluctuations and mechanical vibrations, resulting in the laser wavelength fluctuating slightly. A laser wavelength locking (LWL) technique is required to keep the operating point of the ICL constant, thereby reducing the fluctuation. Thus, the precision of the proposed sensing system can be further improved by using the LWL technique, which requires a redesign of the system structure. The stability of the system can be further improved by adding a damping and waterproof device to strengthen the antijamming capability.

Author Contributions

H.Z. performed the research. M.W., Y.L., P.W., and C.C. conceptualized the research and wrote the paper.

Funding

This research was supported by the National Key R&D Program of China (No. 2016YFC0303902, No. 2018YFC1503802), the National Natural Science Foundation of China (No. 61871199), and the Science and Technology Department of Jilin Province of China (No. 20180201022GX).

Conflicts of Interest

The authors declare no conflicts of interest.

References

  1. Edwards, N.; Mir, R.; Willoughby, E.; Schwalenberg, K.; Scholl, C. The assessment and evolution of offshore gas hydrate deposits using seafloor controlled source electromagnetic methodology. In Proceedings of the OCEANS’10 IEEE SYDNEY, Sydney, Australia, 24–27 May 2010; pp. 1–10. [Google Scholar]
  2. Hachikubo, A.; Yanagawa, K.; Tomaru, H.; Lu, H.; Matsumoto, R. Molecular and Isotopic Composition of Volatiles in Gas Hydrates and in Sediment from the Joetsu Basin, Eastern Margin of the Japan Sea. Energies 2015, 8, 4647–4666. [Google Scholar] [CrossRef] [Green Version]
  3. Kennett, J.P.; Cannariato, K.G.; Hendy, I.L.; Behl, R.J. Carbon isotopic evidence for methane hydrate instability during Quaternary interstadials. Science 2000, 288, 128–133. [Google Scholar] [CrossRef] [PubMed]
  4. Aebersold, R.; Mann, M. Mass spectrometry-based proteomics. Nature 2003, 422, 198. [Google Scholar] [CrossRef] [PubMed]
  5. Giddings, J. Dynamics of Chromatography: Principles and Theory; CRC Press: Boca Raton, FL, USA, 2017. [Google Scholar]
  6. Farajzadeh, M.; Mogaddam, M.; Aghdam, S.; Nouri, N.; Bamorrowat, M. Application of elevated temperature-dispersive liquid-liquid microextraction for determination of organophosphorus pesticides residues in aqueous samples followed by gas chromatography-flame ionization detection. Food Chem. 2016, 212, 198–204. [Google Scholar] [CrossRef] [PubMed]
  7. Wienhold, F.; Fischer, H.; Hoor, P. TRISTAR-a tracer in situ TDLAS for atmospheric research. Appl. Phys. B Lasers Opt. 1998, 67, 411–417. [Google Scholar] [CrossRef]
  8. Werle, P. A review of recent advances in semiconductor laser based gas monitors. Spectrochim. Acta Part A 1998, 54, 197–236. [Google Scholar] [CrossRef]
  9. Lins, B.; Zinn, P.; Engelbrecht, R.; Schmauss, B. Simulation-based comparison of FENBIE noise effects in wavelength modulation spectroscopy and direct absorption TDLAS. Appl. Phys. B Lasers Opt. 2010, 100, 367–376. [Google Scholar] [CrossRef]
  10. Liu, Y.; Biao, W.; Kai, Y.; Lei, C.; Yue, C.; Ning, Y. The simulation research of gas absorption process based on TDLAS. Laser J. 2017, 38, 37–40. [Google Scholar]
  11. Min, L.; Bo, F. Design of High Sensitivity Infrared Methane Detector Based on TDLAS-WMS. Laser J. 2015, 36, 75–79. [Google Scholar]
  12. Lau, S.; Salffner, K.; Löhmannsröben, H. Isotopic resolution of carbon monoxide and carbon dioxide by NIR diode laser spectroscopy. In Proceedings of the SPIE Photonics Europe, Strasbourg, France, 3–7 April 2006; pp. 538–543. [Google Scholar]
  13. Nelson, D.D.; McManus, J.B.; Herndon, S.C.; Zahniser, M.S.; Tuzson, B.; Emmenegger, L. New Method for Isotopic Ratio Measurements of Atmospheric Carbon Dioxide Using a 4.3 μm Pulsed Quantum Cascade Laser. Appl. Phys. B 2008, 90, 301–309. [Google Scholar] [CrossRef]
  14. Tuzson, B.; Mohn, J.; Zeeman, M.J.; Werner, R.A.; Eugster, W.; Zahniser, M.S.; Nelson, D.D.; McManus, J.B.; Emmenegger, L. High precision and continuous field measurements of δ13C and δ 18O in carbon dioxide with a cryogen-free QCLAS. Appl. Phys. B 2008, 92, 451. [Google Scholar] [CrossRef]
  15. Kasyutich, V.; Philip, A.M. 13CO2/12CO2 isotopic ratio measurements with a continuous-wave quantum cascade laser in exhaled breath. Infrared Phys. Technol. 2012, 55, 60–66. [Google Scholar] [CrossRef]
  16. Ghetti, A.; Cocola, L.; Tondello, G.; Galzerano, G.; Poletto, L. Performance evaluation of a TDLAS system for carbon dioxide isotopic ratio measurement in human breath. In Proceedings of the SPIE Photonics Europe, Strasbourg, France, 22–26 April 2018; p. 106800U. [Google Scholar]
  17. Chen, C.; Biao, W. Review of infrared gas technology. Laser J. 2019, 40, 1–5. [Google Scholar]
  18. Klein, A.; Witzel, O.; Ebert, V. Rapid, Time-Division Multiplexed, Direct Absorption- and Wavelength Modulation-Spectroscopy. Sensors 2014, 14, 21497–21513. [Google Scholar] [CrossRef] [PubMed] [Green Version]
  19. Wang, M.; Zhang, Y.; Liu, W.; Liu, J.; Wang, T.; Tu, X.; Gao, S.; Kan, R. Second-harmonic Detection Research with Tunable Diode Laser Absorption Spectroscope. Opt. Tech. 2005, 31, 279–285. [Google Scholar]
  20. Schaeffer, S.; Miller, J.; Vaughn, B.; White, J.; Bowling, D. Long-term field performance of a tunable diode laser absorption spectrometer for analysis of carbon isotopes of CO2 in forest air. Atmos. Chem. Phys. 2008, 8, 5263–5277. [Google Scholar] [CrossRef]
  21. Srivastava, A.; Verkouteren, R. Metrology for stable isotope reference materials: 13C/12C and 18O/16O isotope ratio value assignment of pure carbon dioxide gas samples on the Vienna PeeDee Belemnite-CO2 scale using dual-inlet mass spectrometry. Anal. Bioanal. Chem. 2018, 410, 4153–4163. [Google Scholar] [CrossRef] [PubMed]
  22. Gordon, I.; Rothman, L.; Hill, C. The HITRAN 2016 molecular spectroscopic database. J. Quant. Spectrosc. Radiat. Transf. 2017, 203, 3–69. [Google Scholar] [CrossRef]
  23. Šimečková, M.; Jacquemart, D.; Rothman, L.; Gamache, R.; Goldman, A. Einstein A-coefficients and statistical weights for molecular absorption transitions in the HITRAN database. J. Quant. Spectrosc. Radiat. Transf. 2006, 98, 130–155. [Google Scholar] [CrossRef]
  24. Åström, K.J.; Hägglund, T. Revisiting the Ziegler–Nichols step response method for PID control. J. Process Control 2004, 14, 635–650. [Google Scholar] [CrossRef]
  25. Ahn, S.; Jeffrey, A.F. Standard Errors of Mean, Variance, and Standard Deviation Estimators; EECS Department, The University of Michigan: Ann Arbor, MI, USA, 2003; pp. 1–2. [Google Scholar]
Figure 1. The high-resolution transmission (HITRAN) absorption spectra of 10 ppmv CO2 and 1% H2O at a gas pressure of 20 Torr with a 24-m effective optical path length.
Applsci 09 03444 g001
Figure 2. (a) Schematic block diagram of the sensing system including an optical part and an electrical part. (b) Gas sensor physical image including an optical part and an electrical part. MPGC: multi-pass gas cell; ICL: interband cascade laser; MCT: mercury cadmium telluride.
Applsci 09 03444 g002
Figure 3. (a) Schematic block diagram of the temperature control system for the multi-pass gas cell (MPGC), which includes a controller and hardware circuit. (b) Physical image of the temperature control system including a PT1000 temperature sensor, flexible heating film, and controlling circuit.
Applsci 09 03444 g003
Figure 4. The experimental results of the MPGC working temperature with 120 s of control time; the temperature fluctuation results are inserted.
Applsci 09 03444 g004
Figure 5. Second harmonic signals with the background absorption removed, obtained from five different concentrations (20, 30, 40, 50, and 60 ppm).
Applsci 09 03444 g005
Figure 6. Peak values of the second harmonic signal of 13CO2 and 12CO2 for five different concentration levels of 20 ppm, 30 ppm, 40 ppm, 50 ppm, and 60 ppm.
Applsci 09 03444 g006
Figure 7. Measured concentration data points and linear fitting curves of the CO2 concentration versus 2f amplitude value.
Applsci 09 03444 g007
Figure 8. Long-term measurement of a configured concentration of 500 ppmv CO2 and the measured Allan deviation analysis 13δ based on the data.
Applsci 09 03444 g008
Figure 9. (a) Schematic block diagram of system configuration, and (b) physical image of the sensing system for deployment in the detection of dissolved CO2 in water assisted by a gas–liquid separator and carrier gas.
Applsci 09 03444 g009
Figure 10. Carbon isotope measurement of mixed gas including the separated CO2 and the N2 carrier gas with two hours of measurement.
Applsci 09 03444 g010

