Reverse Engineering of Thermoregulatory Cold-Induced Vasoconstriction/Vasodilation during Localized Cooling


1
Department of Biosystems, Animal and Human Health Engineering Division, M3-BIORES: Measure, Model & Manage of Bioresponses Laboratory, KU Leuven, Kasteelpark Arenberg 30, 3001 Heverlee, Belgium
2
Department of Product Development, University of Antwerp, 2000 Antwerp, Belgium
*
Author to whom correspondence should be addressed.
Appl. Sci. 2019, 9(16), 3372; https://doi.org/10.3390/app9163372
Submission received: 10 July 2019
/
Revised: 2 August 2019
/
Accepted: 8 August 2019
/
Published: 16 August 2019
(This article belongs to the Special Issue Human Health Engineering)
Abstract
:Biological systems, in general, represent a special type of control system. The physiological processes of homeostasis, which serve to maintain the organism’s internal equilibrium against external influences, are clear forms of biological control system. An example of the homeostasis is the control of the organism thermal state or the thermoregulation. The thermoregulatory control of human skin blood flow, via vasoconstriction and vasodilation, is vital to maintaining normal body temperatures during challenges to thermal homeostasis such as localised cooling. The main objective of this paper is to reverse engineer the localised thermoregulatory cold-induced vasoconstriction/vasodilation (CIVC/CIVD) reactions using a data-based mechanistic approach. Two types of localised cooling were applied to the fingers of 33 healthy participants, namely, continuous and intermittent cooling. Modelling of the thermoregulatory cold-induced vasoconstriction/vasodilation reactions suggested two underlying processes, with one process being 10 times faster. A new term is suggested in this paper, namely, the latent heat of CIVD, which represents the amount of dissipated heat required to trigger the CIVD. Moreover, a new model for the thermoregulatory localised CIVC/CIVD reactions is proposed. The suggested new model states that, with an initial vasodilation state, the initial localised CIVC is triggered based on a certain threshold in the rate of heat dissipation from the skin to the surrounding environment.
1. Introduction
Biological systems represent a special type of control system. In all of these, control is exercised over the flows of matter and energy to maintain a range of stationarity of their existence [1]. Hence, all living organisms are equipped with numerous interconnected control systems, which serve to maintain the organism’s internal equilibrium regardless of outside influences. This condition is known as homeostasis. In the 19th century, Claude Bernard discovered the “amazing constancy” of the internal environment of the organism [2], and in 1927, Cannon named it the homeostasis [3].
An example of homeostasis is the control of an organism’s thermal state (thermoregulation system). Heat in biological systems is generated in the course of metabolic conversion and scattered by conduction, convection, radiation and evaporation [4,5,6].
The hands and feet form powerful thermoregulatory regulators in the body, serving as heat radiators (exchanger) and evaporators in hot environments and as thermal insulators in the cold [7]. Taylor et al. [8] estimated that each hand and foot can dissipate 150–220 W·m−2 through radiation and convection at rest in an ambient temperature of 27 °C, with even greater heat dissipation through sweating. Additionally, the extremities can serve as thermal sensor acting in feedback and feedforward fashion to the thermoregulation system of the body [7].
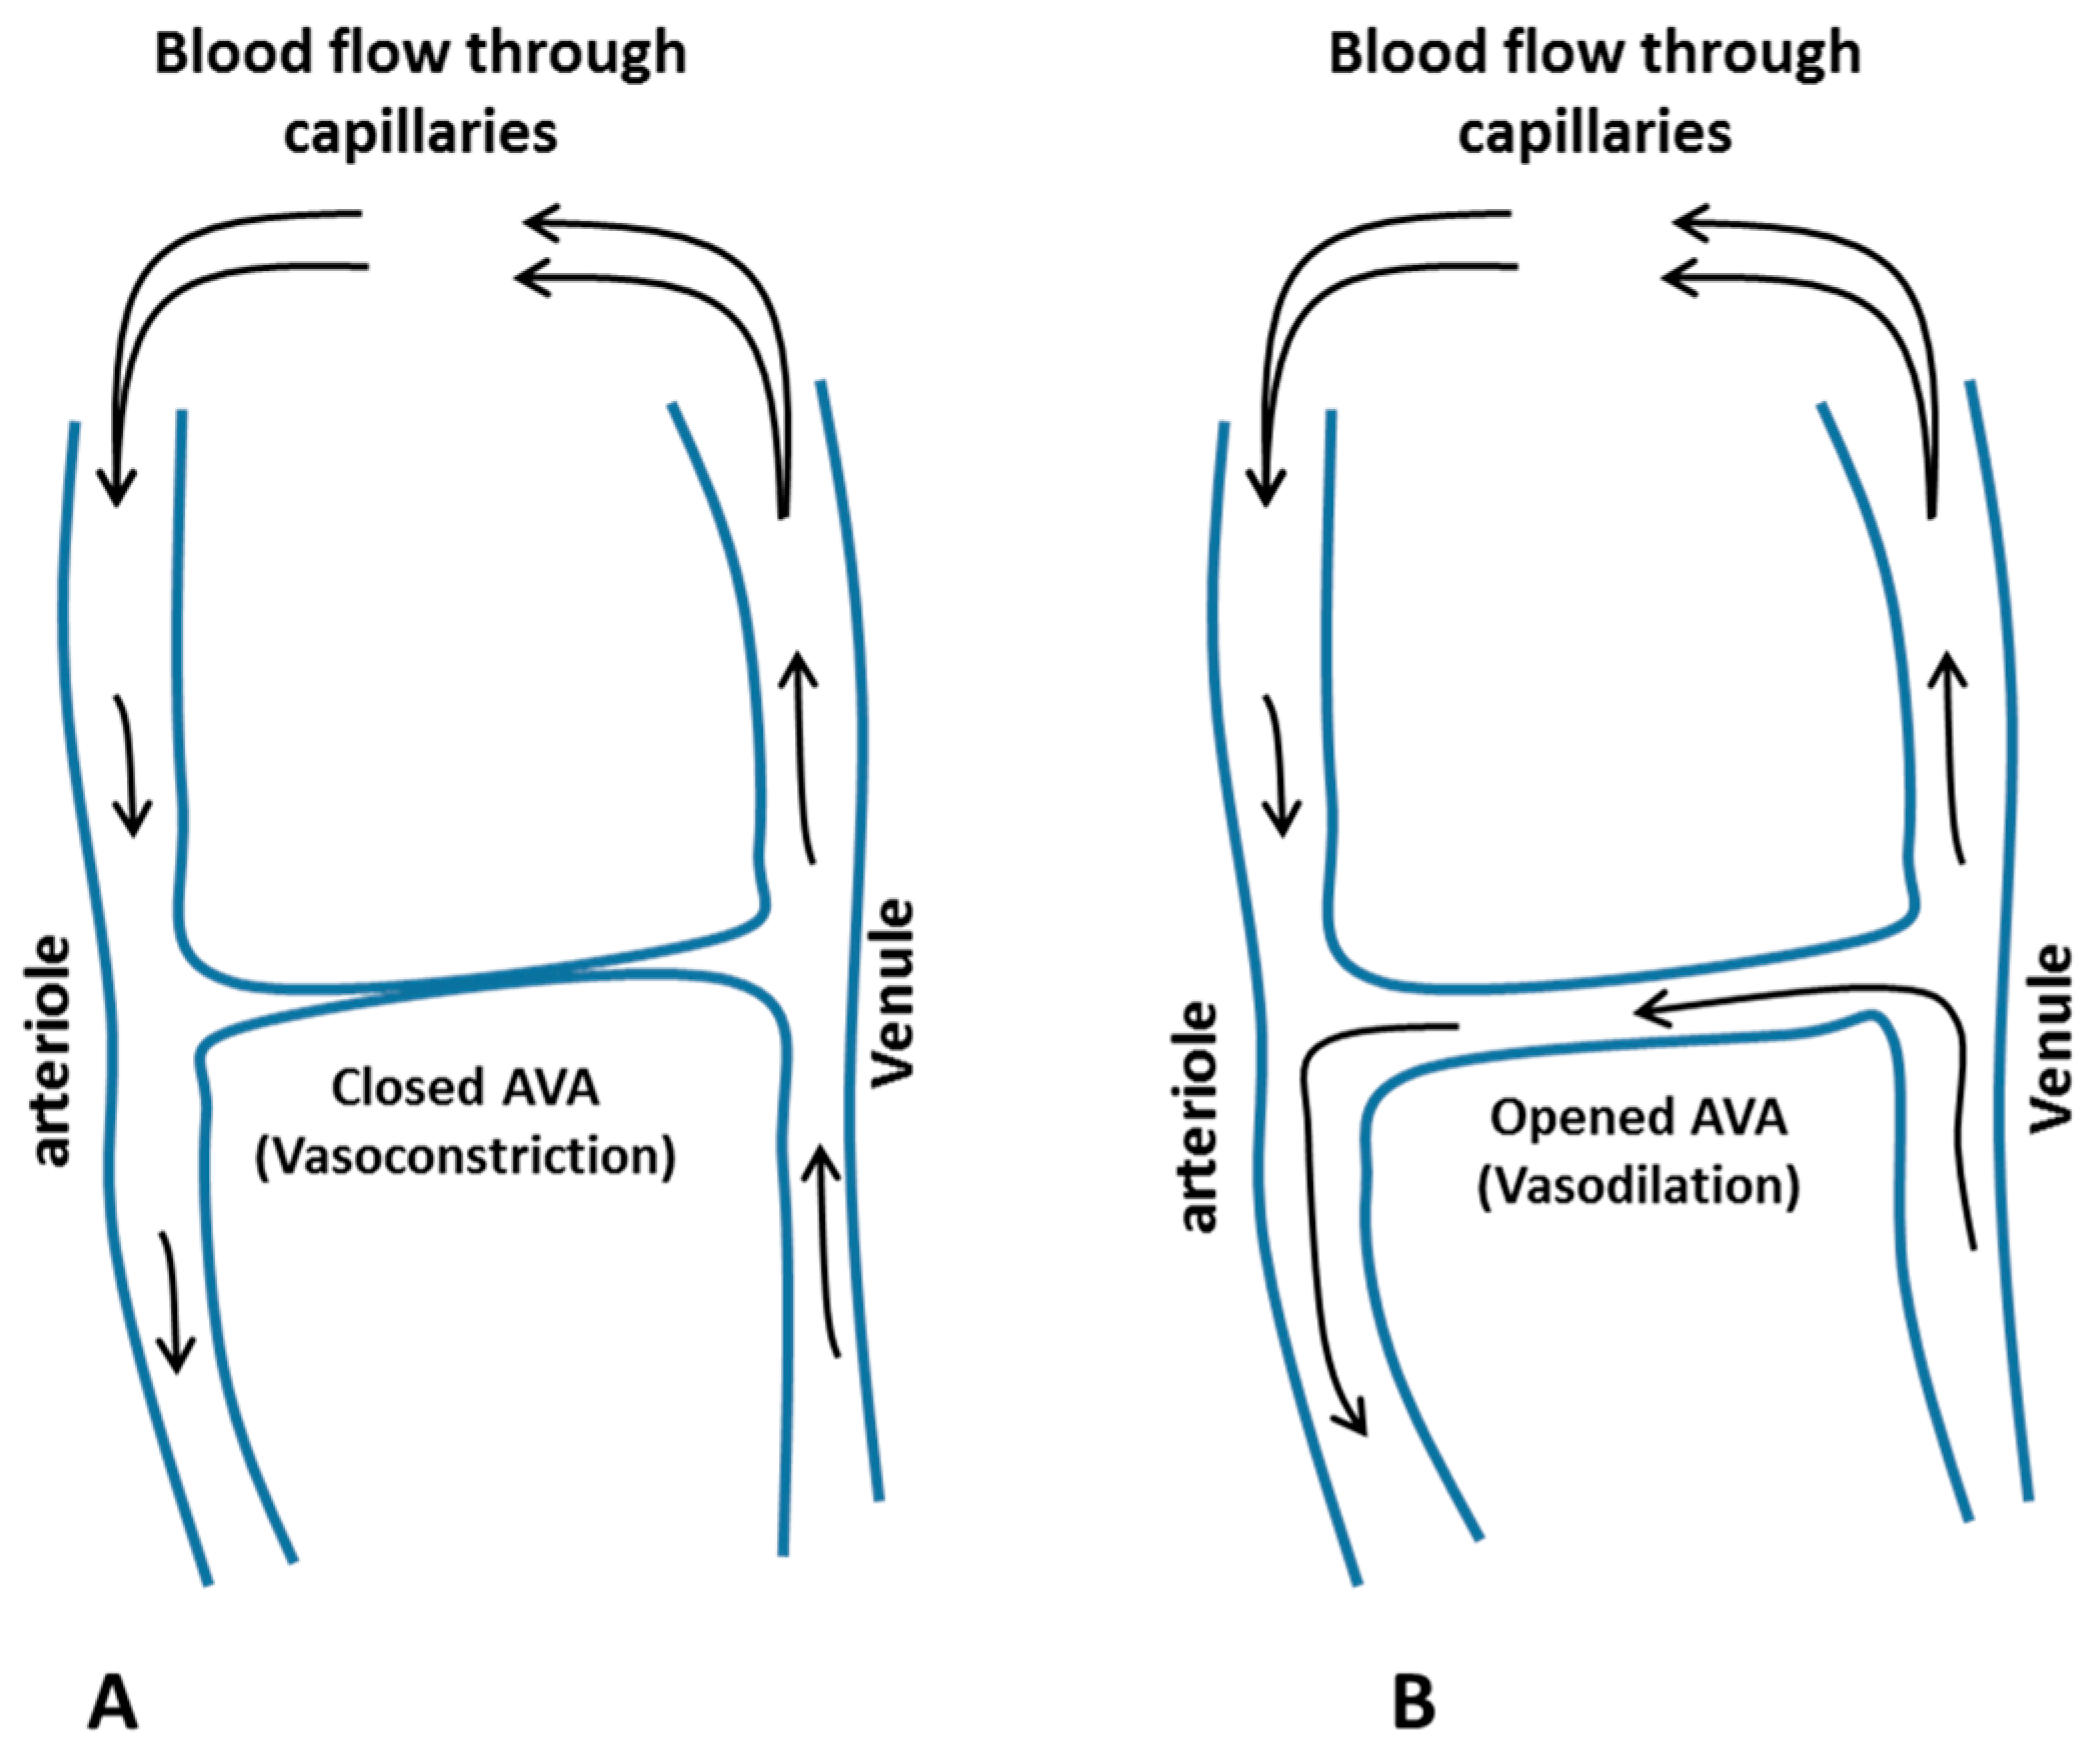
Arteriovenous anastomoses (AVAs) are direct connections between small arteries and small veins (Figure 1), with no capillary section between them. Since there is no capillary transportation, the only transport function they could possibly have is the transport of heat from the body core to surface areas containing AVAs [9].
Grant and Blond [10] investigated the role of AVA in thermoregulation. They found a relation between the number of AVAs in a body part and the change in local skin temperature due to local cold [11]. When the extremities of the hand and feet are exposed locally to a cold environment, their AVAs respond with sympathetically mediated vasoconstriction, which is termed cold-induced vasoconstriction (CIVC). CIVC reduces the blood flow to the peripheries in favour of a central pooling of blood in the torso and deep body core [7,12,13]. Due to this vasoconstriction and the high surface area-to-volume ratio, the skin temperature of the extremities tends and exponentially decreases to a level approaching that of the ambient environment. After a brief period of lowered skin blood flow and temperature, due to the CIVC, a temporary increase in blood flow and rewarming occurs. During these episodes, skin temperature can rise by as much as 10 °C, and this fall and rise can occur repeatedly in a cyclic fashion [7]. This pattern of periodic warming was first reported by Lewis [14], who labelled it the “hunting response”, due to its apparent oscillatory pattern. This response is also termed the cold-induced vasodilation (CIVD) phenomenon [15]. There is a definite variation in the occurrence, magnitude, and duration of the CIVD [16].
It was found that the CIVD occurs in about 5 to 10 min after the exposure of the hand to cold [15,17], and is initiated by the dilation of the AVAs [7,13,15,18]. Because of the elevated extremity blood flow and temperature, CIVD has generally been presumed to provide a protective function by maintaining local tissue integrity and minimizing the risk of cold injuries. However, the mechanisms underlying CIVD are unclear, yet understanding the nature of CIVD is of important occupational and clinical relevance [7]. Additionally, the review studies of Cheung et al. [7,19] have shown that it is not easy to compare different research findings due to the inconsistent methodologies in the experimental protocols, and most of the studies on CIVD are largely descriptive, lacking sufficient quantification of CIVD responses.
The current study was originated based on the findings of previous study by Youssef et. al. [20], in which the authors tried to take advantage of the CIVC reaction to prevent nail toxicity during chemotherapy. During their study [20], Youssef et al. aimed to model the CIVC responses to localized cooling for the purpose of developing a model-based controller of the finger skin temperature. However, the developed controller exhibited unpredictable disturbances, represented by abrupt increases in the skin temperature due to the CIVD reaction.
The main goal of this study it to try to understand and quantify the mechanism of CIVC and CIVD by reverse engineering the dynamic responses of the hands’ skin temperature to localised cooling using a databased mechanistic (DBM) modelling approach.
2. Materials and Methods
2.1. Controllable Active Cooling Device and Measurements (iGlove-1)
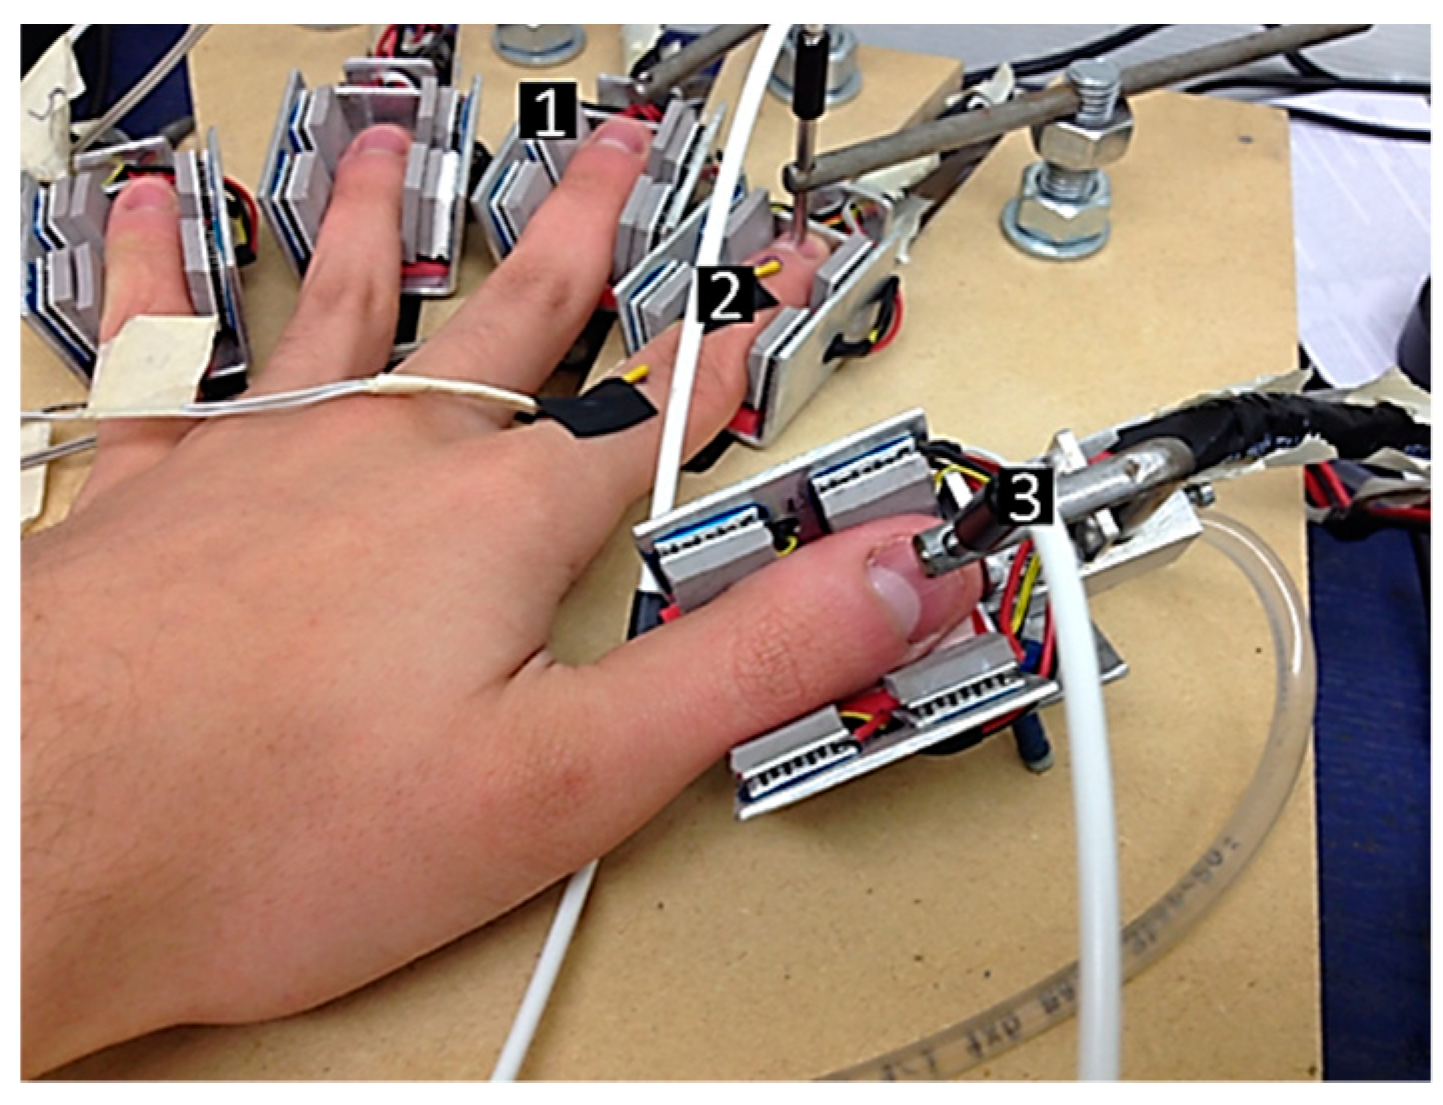
An in-house (University of Antwerp, Antwerp, Belgium) developed active localised cooling device (iGlove-1, Figure 2) was developed to investigate the possibility of localised active cooling of hand fingers [21]. The iGlove-1 device was developed in such way as to provide a stable localised low temperature (cooling) to the five fingers of the subject’s left hand. The iGlove-1 was equipped with 20 Peltier elements (two elements positioned on both sides of each finger) to apply localised cooling of the fingers. Each element had a size about 12 × 12 × 5 mm.
The iGlove-1 device consisted of a wooden construction on which the subject’s left hand can rest. The construction was equipped with five mechanically adjustable holders to ensure a good contact between the Peltier elements and the fingers of different hand sizes. The two Peltier elements located on each side of the finger (two on the fingertip and another below the first phalanx, Figure 2) were always electrically connected in series.
The iGlove-1 device was equipped with five NTC sensors (with an accuracy of ±0.1 °C) to continuously measure the temperatures of the left-hand fingers. Another 20 NTC sensors measured the temperature of the Peltier elements (one sensor for each element). A Laser Doppler blood flow meter (MoorVMS-LDF2® by Moor Instruments) was used to measure the changes in the blood flow underneath the nail bed. The blood flow measurements were performed on only two fingers, the index finger and the thumb, of the subject’s left hand as a representation of the changes in the blood flow to the five fingers.
The temperature sensors were positioned on the underside of each fingertip, while the probes of the Laser-Doppler blood flow meter were placed on the middle of the nails of the thumb and index fingers. The skin temperatures of the five fingers and that of the ambient air (in degrees Celsius, °C) were recorded, as well as the blood flow (in Perfusion Units, PU) of the thumb and the index finger, every second (for more information see [20,21,22]).
2.2. Experiments
Data from two sets of experiments were used during the course of this work. The first set (Exp.1) was conducted during a previous study [20] with the objective of designing a model-based control system for localised cooling of hand termites to avoid nail toxicity during chemotherapy. The second set (Exp.2) of experiments was conducted during the course of this study to test the effect of intermittent cooling on the CIVD phenomena.
2.2.1. Test Subjects
Data from two different sets of experiments (Table 1) was obtained from 33 participants (test subjects). During the first set of experiments (Exp.1), a homogeneous group of 11 healthy women between the ages of 35 and 55 years performed the tests. This age range was chosen for the sake of the objective of the previous study [21], since a high incidence rate of breast cancer is recorded within this age range. The second set of experiments was performed using 12 test subjects, of which six were males and six were females with an age range between 18 and 24 years old.
During the course of both sets (Exp.1 and Exp.2), all the test subjects were in healthy condition, non-smokers, having no hand injuries and with no evidence of the Perniosis or Raynaud phenomena. The absence of (excessive) alcohol consumption was ensured in all of the test subjects, starting from the evening (6–8 pm) before the test, with a normal (7–9) h of sleep during the night. During the two sets of experiments, all participants were asked to keep only light clothing (no jackets or pullovers) consisting of shirts (or sweaters) and pants (or skirts).
2.2.2. Experimental Protocol
Acclimatisation stage: for both sets of experiments (Exp.1 and Exp.2), each test subject was seated at the start of the measurements in the test room for ±30 min to acclimatise them to the continuously measured ambient air temperature (22.4 ± 0.6 °C) within the test room.
Step experiment stage: after placing the subject’s left hand fingers in their appropriate positions on the iGlove-1 device (Figure 2), for the first set of experiments, the set-point temperature on the controller of the Peltier elements was set to 20 °C for 15 min. For the next 30 min, a step-down decrease in the temperature of the Peltier element was applied by setting the controller set-point to 2 °C. These applied set-points were chosen in such way as to ensure that both the CIVC and CIVD phenomenon were triggered [20,21].
During the first set of experiments (Exp.1), for each test subject, the previous test protocol was repeated three times in three consecutive days at the same time of day, giving a total of 33 full experimental trials. The second set of experiments (Exp.2) consisted of two different phases (Figure 3).
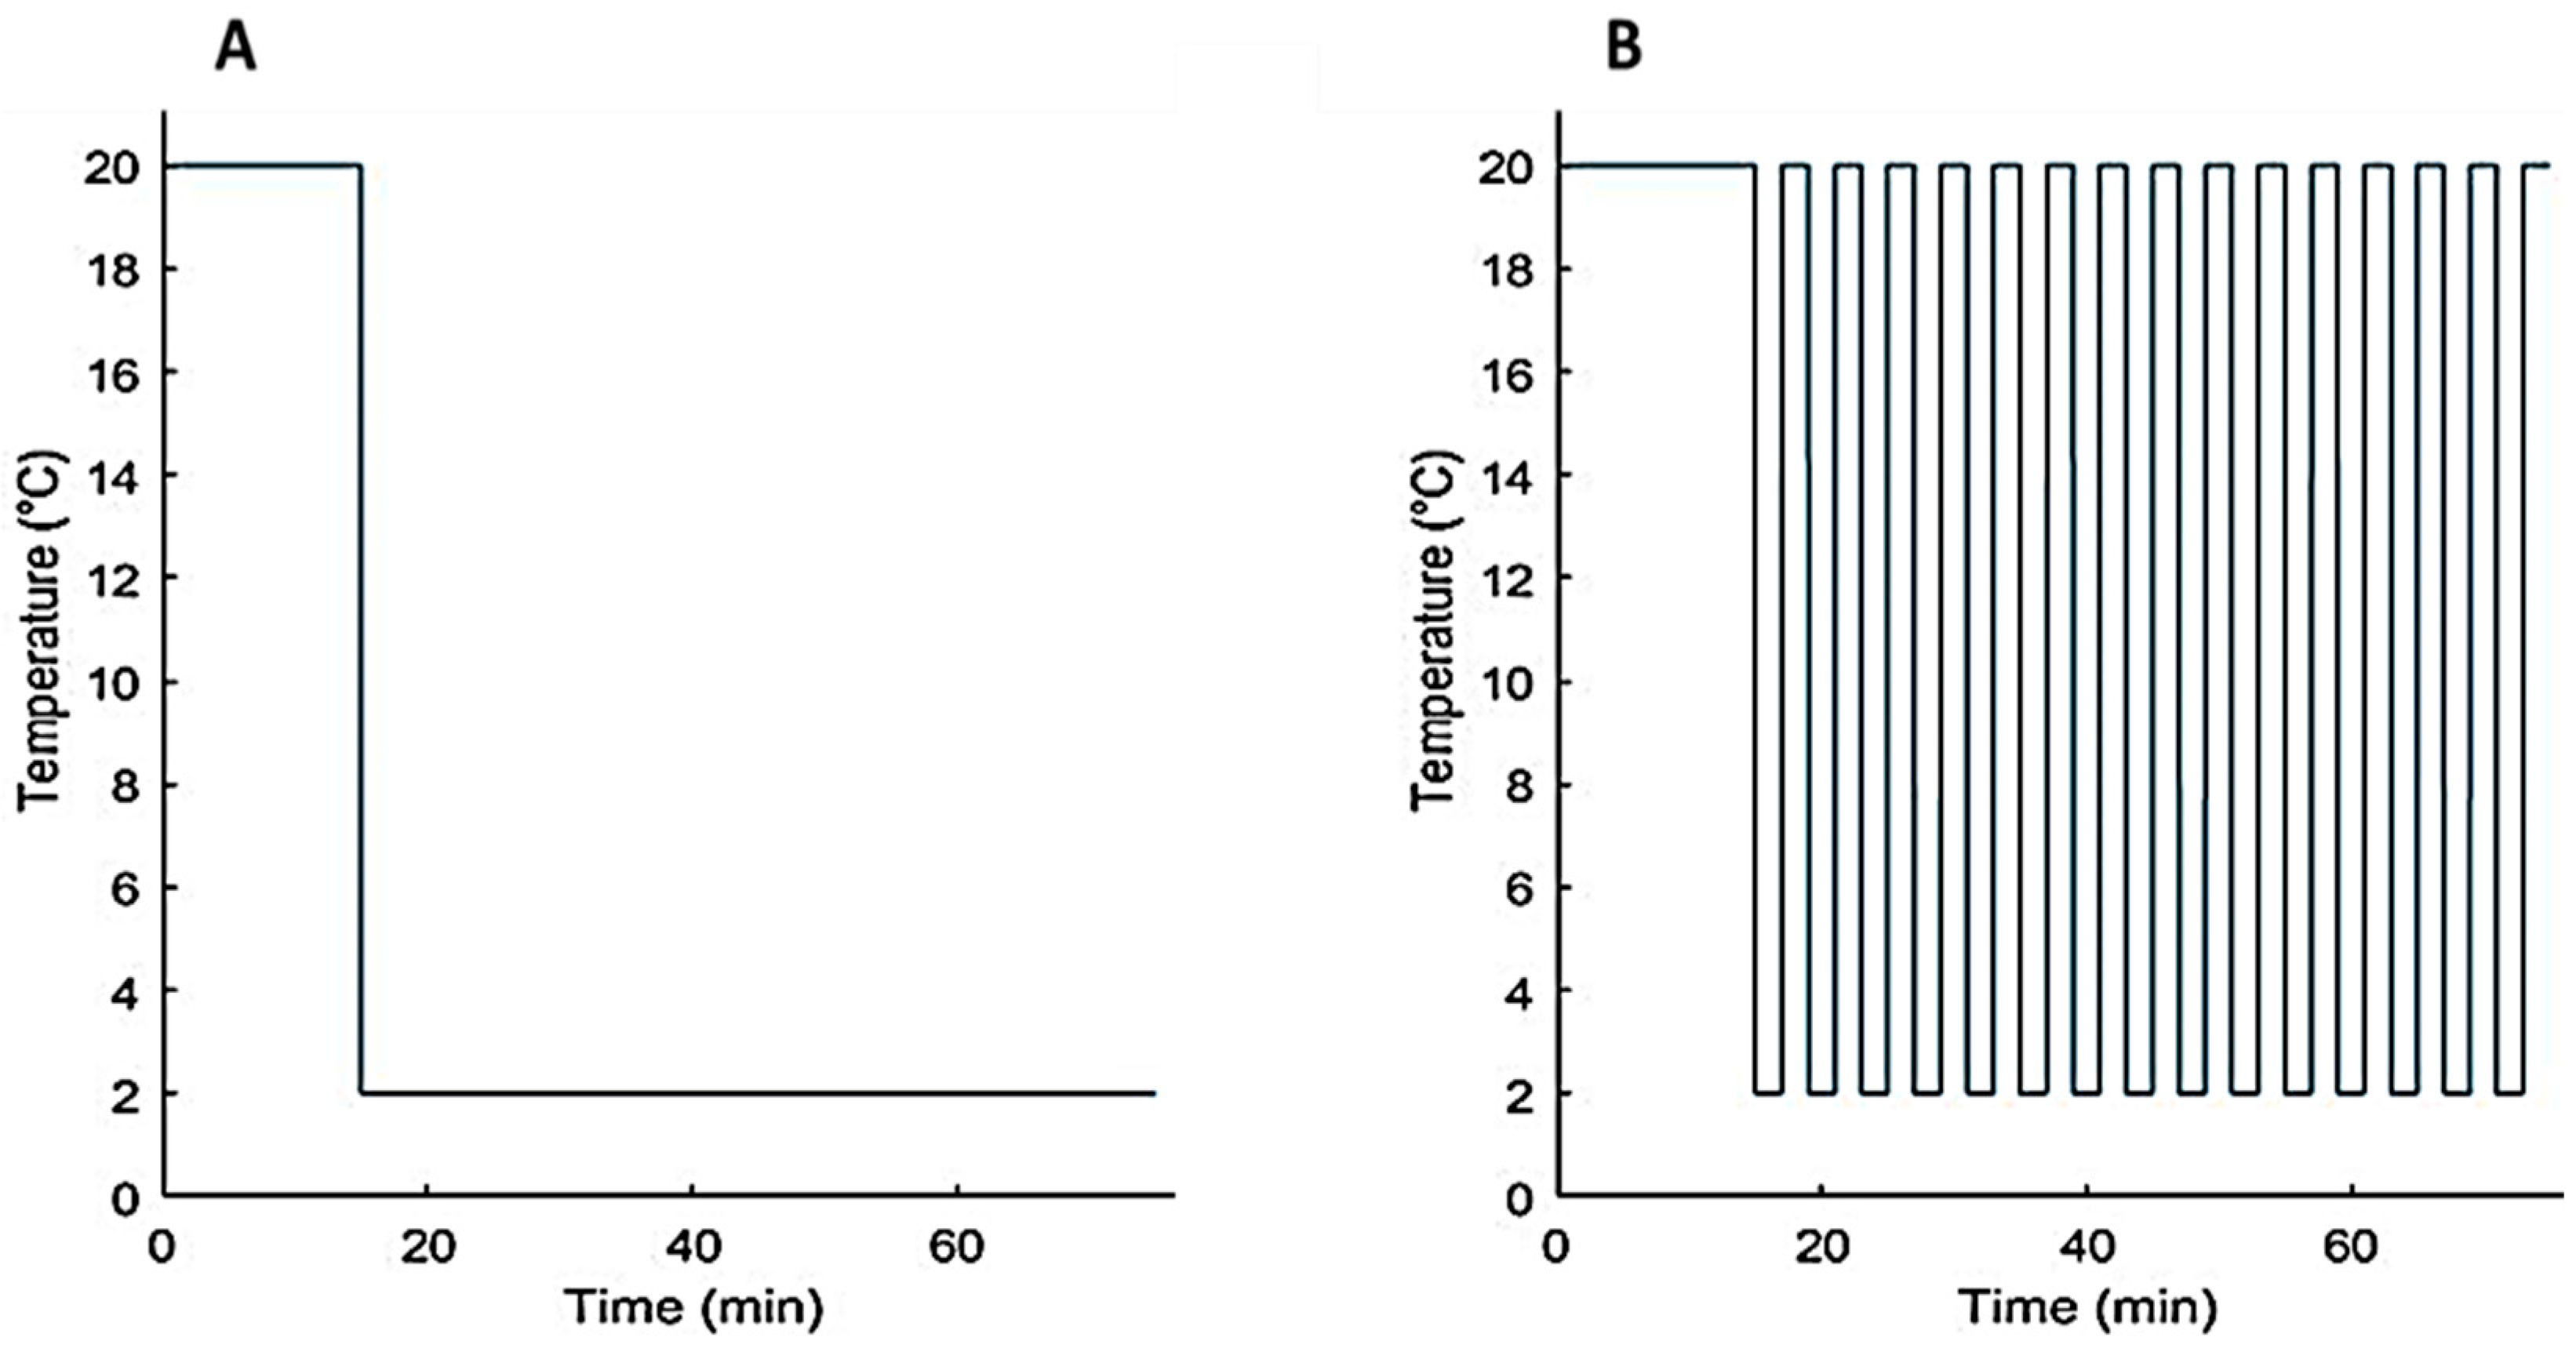
During the first experimental phase (I), the set-point temperature of the controller of the Peltier elements was set to 20 °C for 15 min. For the next 60 min, a step-down decrease in the temperature of the Peltier element was applied by setting the controller set-point to 2 °C. During the second phase (II), a pulse train (a rectangular pulse wave) of set temperatures to the Peltier elements was applied for 60 min. More specifically, we set a pulse time of 2 min, a minimum and maximum set temperatures of 2 °C and 20 °C, respectively (see Figure 3B).
2.3. System Identification and Modelling of CIVC/CIVD
Although the system under study (the finger/blood circulation) is inherently a non-linear system, the essential perturbation behaviour can often be approximated well by simple linearized Transfer Function (TF) models [20,23,24,25,26,27,28,29].
For the purposes of the present paper, the following linear, single-input, single-output (SISO) discrete-time transfer function (DTF) is considered [20],
where is the finger skin temperature (°C) and is the temperature of the Peltier elements (°C), while and are appropriately defined polynomials in the backshift operator , i.e., and is additive noise, a serially uncorrelated sequence of random variables with variance that accounts for measurement noise, modelling errors and effects of unmeasured inputs to the process (assumed to be a zero mean). For convenience, any pure time delay of samples can be accounted for by setting the leading parameters of the polynomial to zero, i.e., , ……, = 0.
A step-input was applied, as explained earlier, by suddenly decreasing the temperature of the Peltier elements from 20 to 2 °C. In practice, the transition of the input to the new steady state is taking some time (transition time). However, for convenience, in this paper the step-input was idealised and normalised by assuming that it starts from zero and changes instantaneously at a time equal to zero,
The Simplified Refined Instrumental Variable (SRIV) algorithm was utilised in the identification and estimation of the models (model parameters and model structure) [30,31].
Firstly, the appropriate model structure was identified, i.e., the most appropriate values for the triad [, , ] (see Equation (1)), where and are the number of poles and zeros, respectively. Two main statistical measures were employed to determine the most appropriate values of this triad. Namely, the coefficient of determination , based on the response error; and (Young’s Information Criterion), which provides a combined measure of model fit and parametric efficiency, with large negative values indicating a model that explains the output data well and yet avoids over-parameterisation [31,32].
3. Results and Discussion
3.1. System Identification
3.1.1. Data-Based Mechanistic Modelling of CIVC
The measured blood flow, conducted during the first set of experiments (Exp.1), showed a decreasing pattern (average drop of 400 ± 53 PU) coupled with decreased finger skin temperatures in response to the applied localized cooling (for more information see [20]).
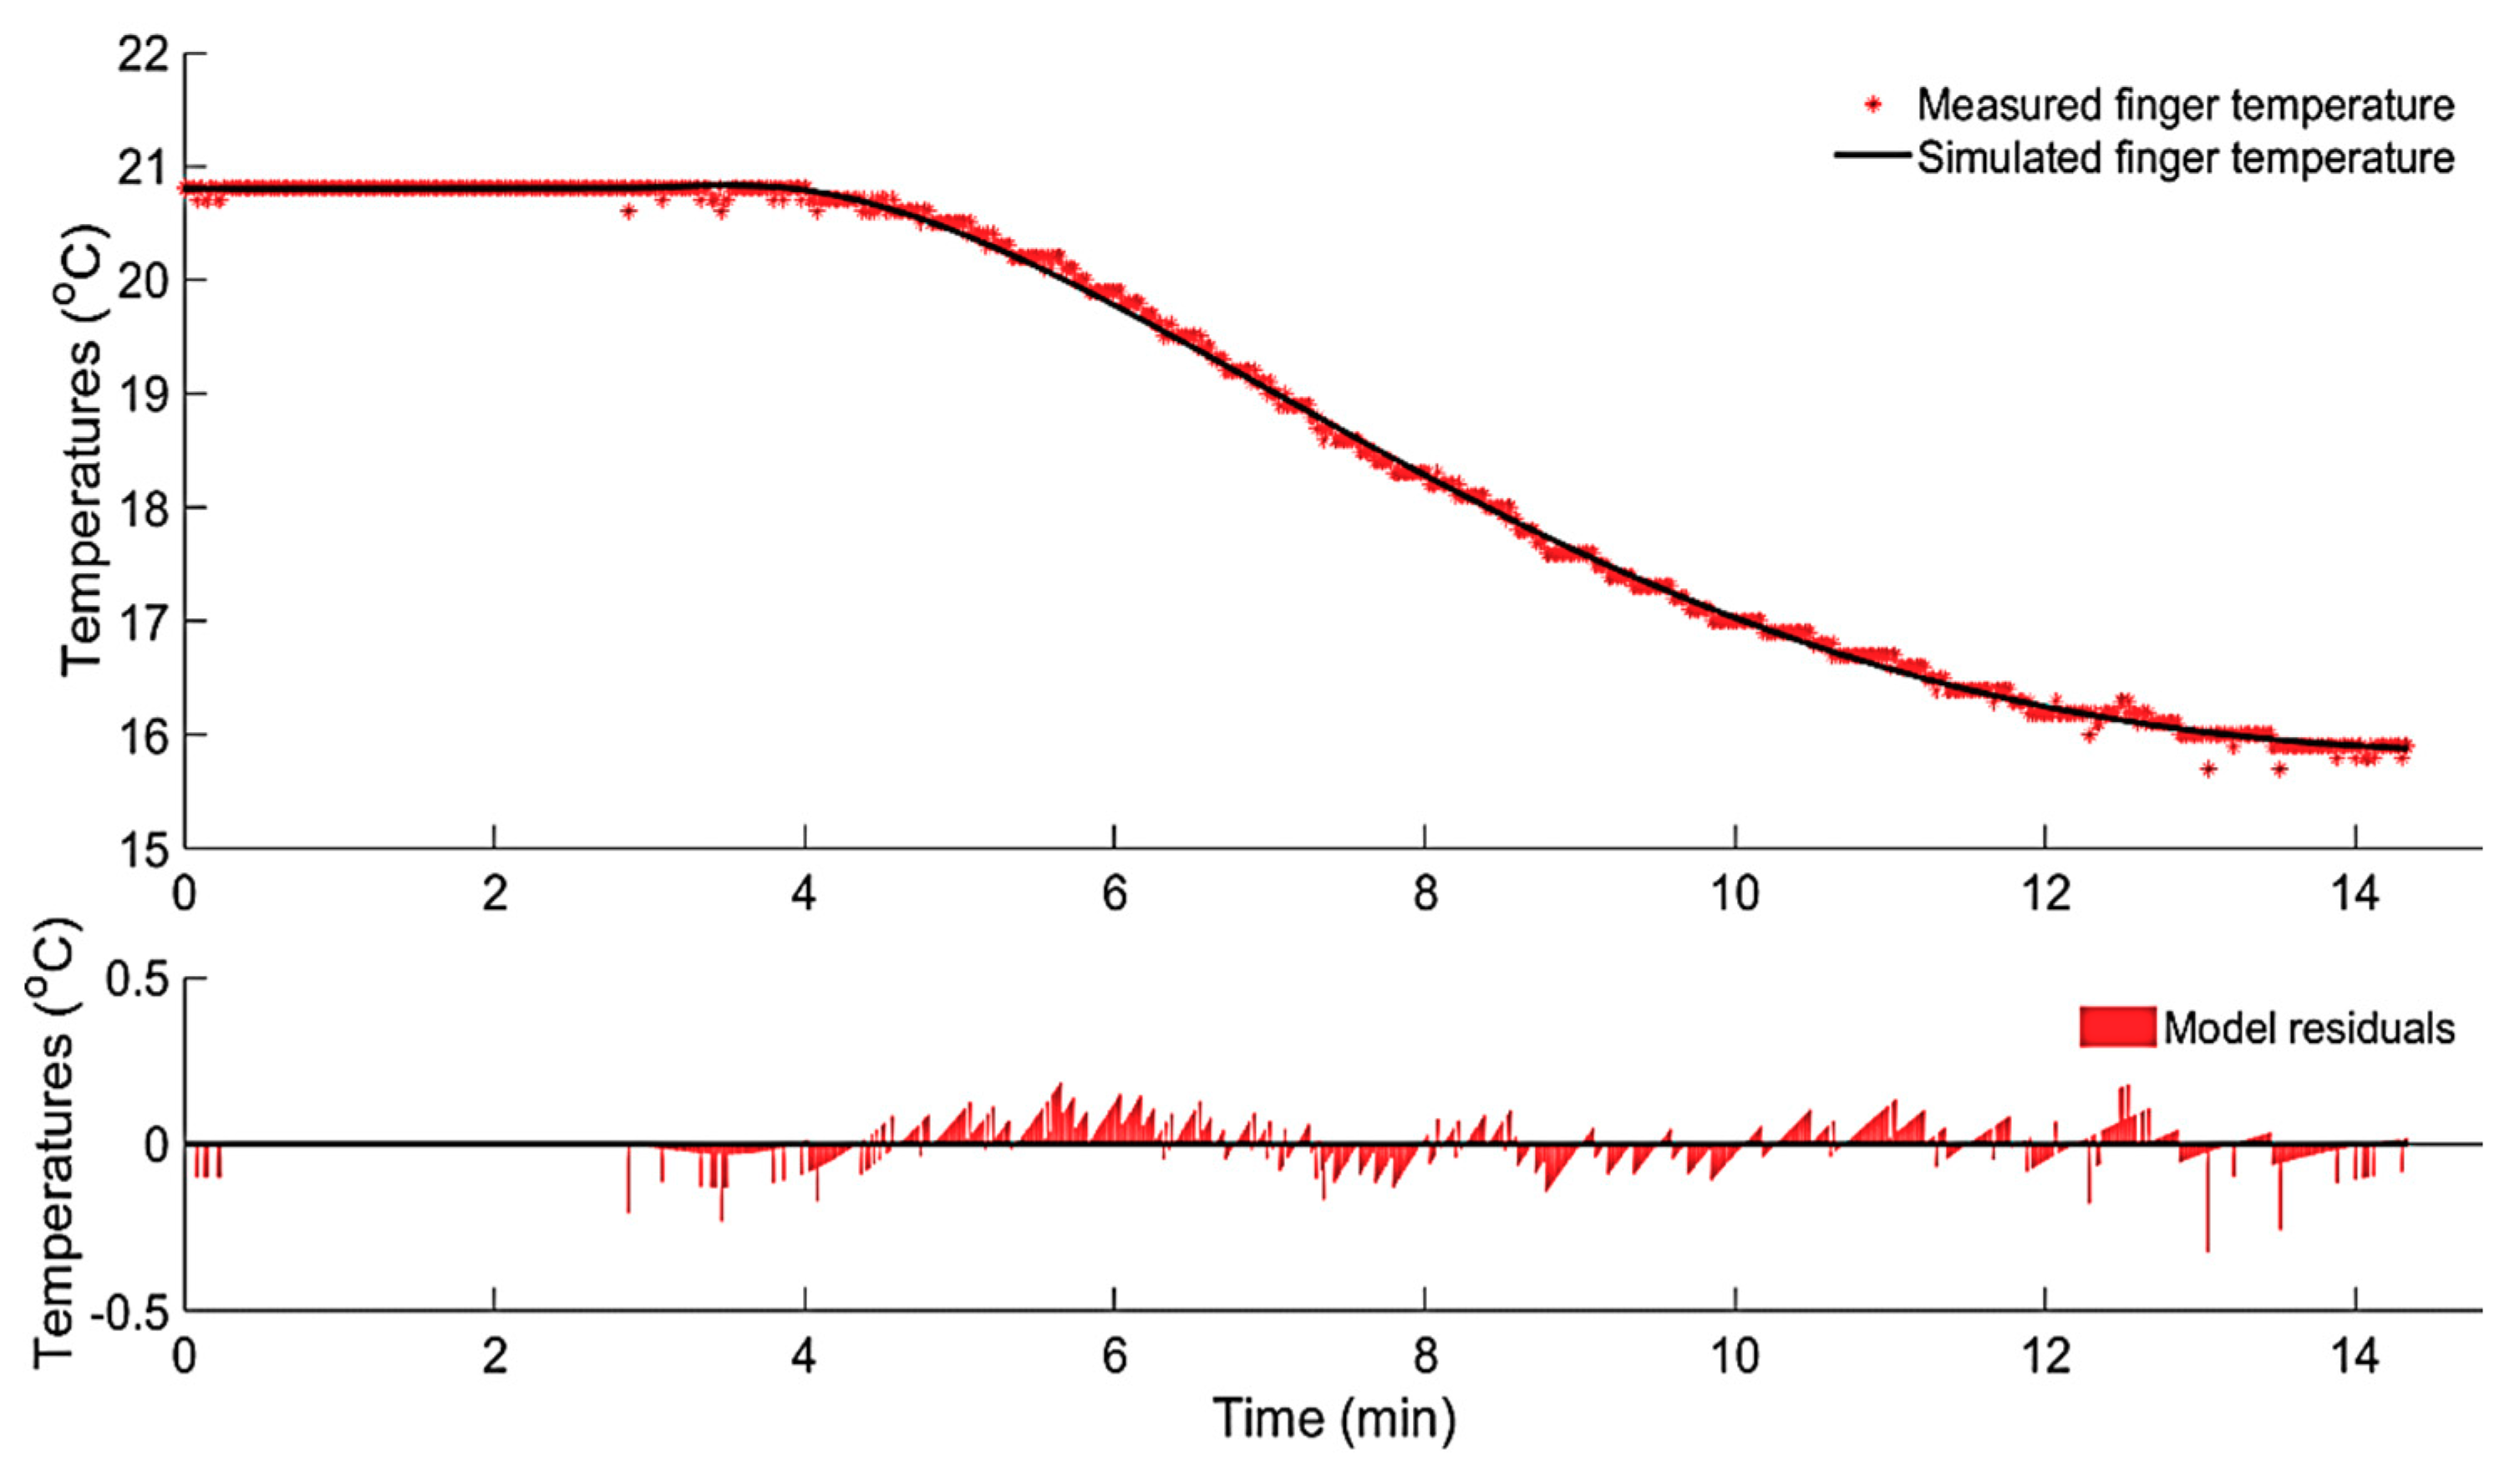
In agreement with previous study [20], the SRIV algorithm combined with and suggested that a second-order (with number of poles = 2 and zeros = 2) discrete-time TF described the dynamic responses of finger skin temperature to step-decreases in the input (Peltier element’s temperature) most accurately (i.e., = 0.91 ± 0.04 and = −11.23 ± 2.33) for all 33 test subjects. More specifically, the SRIV algorithm identified the following general discrete-time DTF model structure,
where the pure time delay () was different from test subject to another (interpersonal variation) with an average ( min) and standard deviation (SD = 1). The variations in the time delay of the model reflects the different individual biological responses to colder environment. Figure 4 shows a simulation example of the resulting model (3), showing the simulated dynamic responses of the finger skin temperature to step decrease (cooling) in the Peltier element temperature.
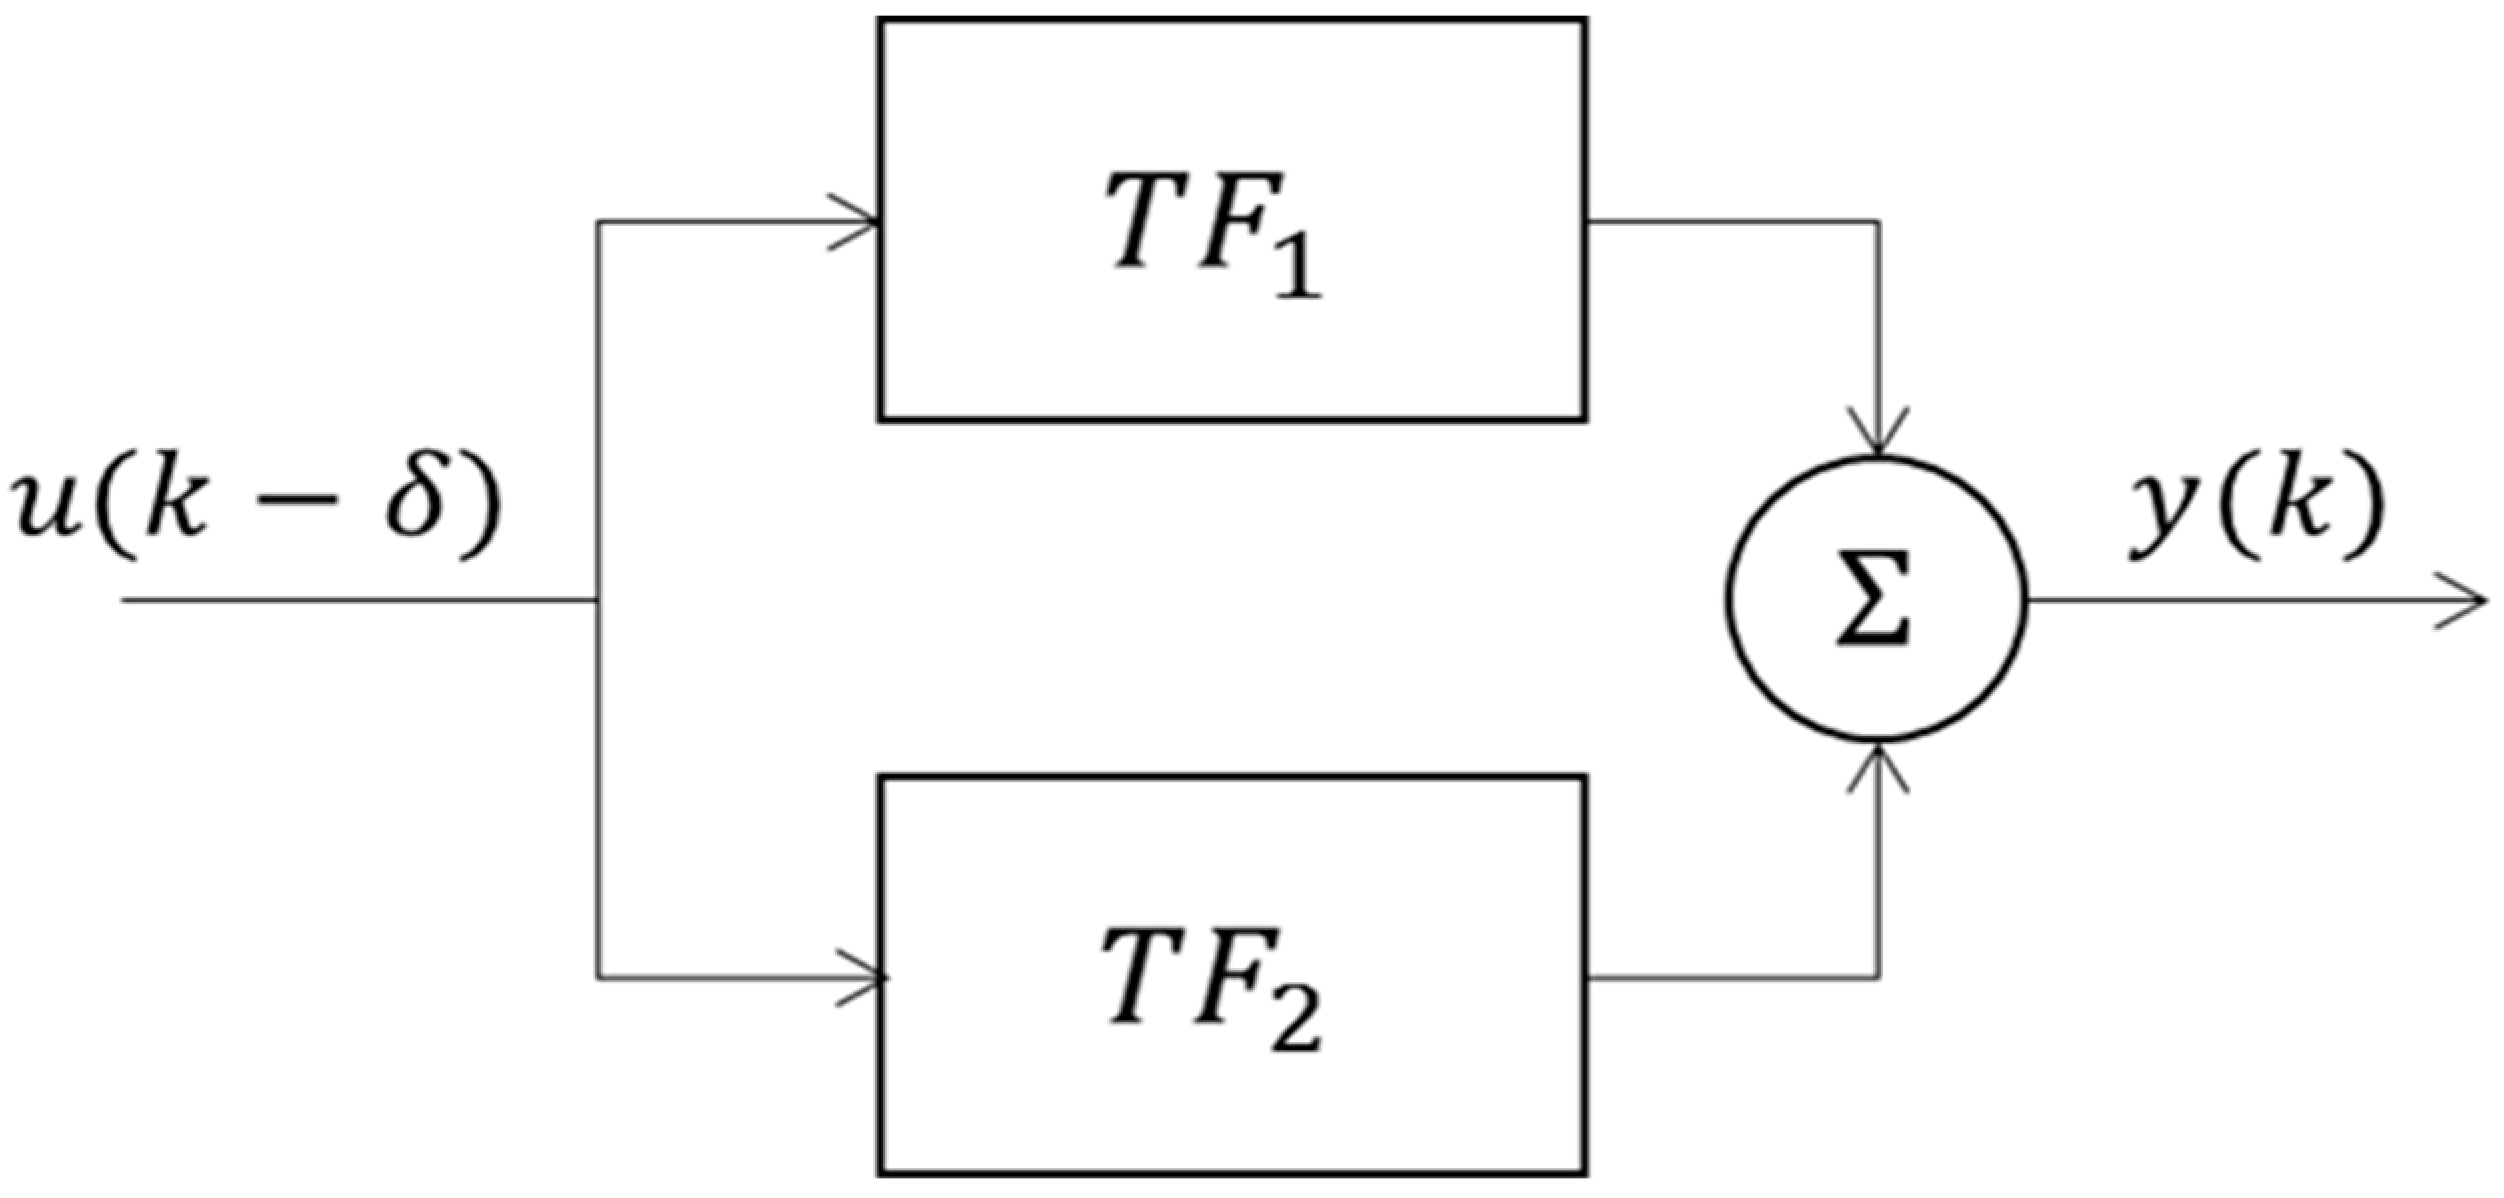
To understand the underlying mechanism of the resulting second-order system (3), describing the CIVC process, it was decomposed into two simpler first-order transfer functions (TF). These two first-order TFs can be interconnected in three well-known configurations, namely, series, parallel and feedback configurations. The results showed that the parallel configuration (Figure 5) was mathematically most suitable (average = 0.91 ± 0.01) for describing the dynamic response of the CIVC process in all test subjects. As depicted in Figure 5, the second-order system (3), representing the CIVC process, was decomposed into two first-order TFs, defined as follows:
The time constants and of and , respectively, were calculated and compared for all test subjects, where . Table 2 shows the mean and standard deviation of the calculated time constants obtained from all test-subjects during the two sets of experiments (Exp.1 and Exp.2, Phase I).
The aforementioned results suggested two parallel underlying processes taking place during the CIVC action. However, by comparing the calculated time constants, it became clear that the process represented by was, on average, 10 times faster ( 0.73 min) than the one represented by ( 7.34 min).
Physical and physiological insights into the resulting mathematical model were investigated using first principles (e.g., Fourier’s law and Newton’s law of cooling) and other mechanistic models (e.g., [12]).
The heat flow through any object, including the finger, can be described conventionally by lumped quantities such as thermal resistance (or conductance) and thermal capacitance [27]. The heat balance equation representing the heat flow (W) between the finger and the colder Peltier’s element can be given by:
where (J.°C−1) is the skin thermal capacitance, is the finger skin temperature, (W m−2 °C−1) is the convictive heat transfer coefficient of flowing blood in the superficial vein, is the cross-section area of the superficial vein, is the blood temperature, (W m−2 °C−1) is the convective heat transfer coefficient of the blood in the superficial capillaries network, (W m−2 °C−1) is the skin conductance.
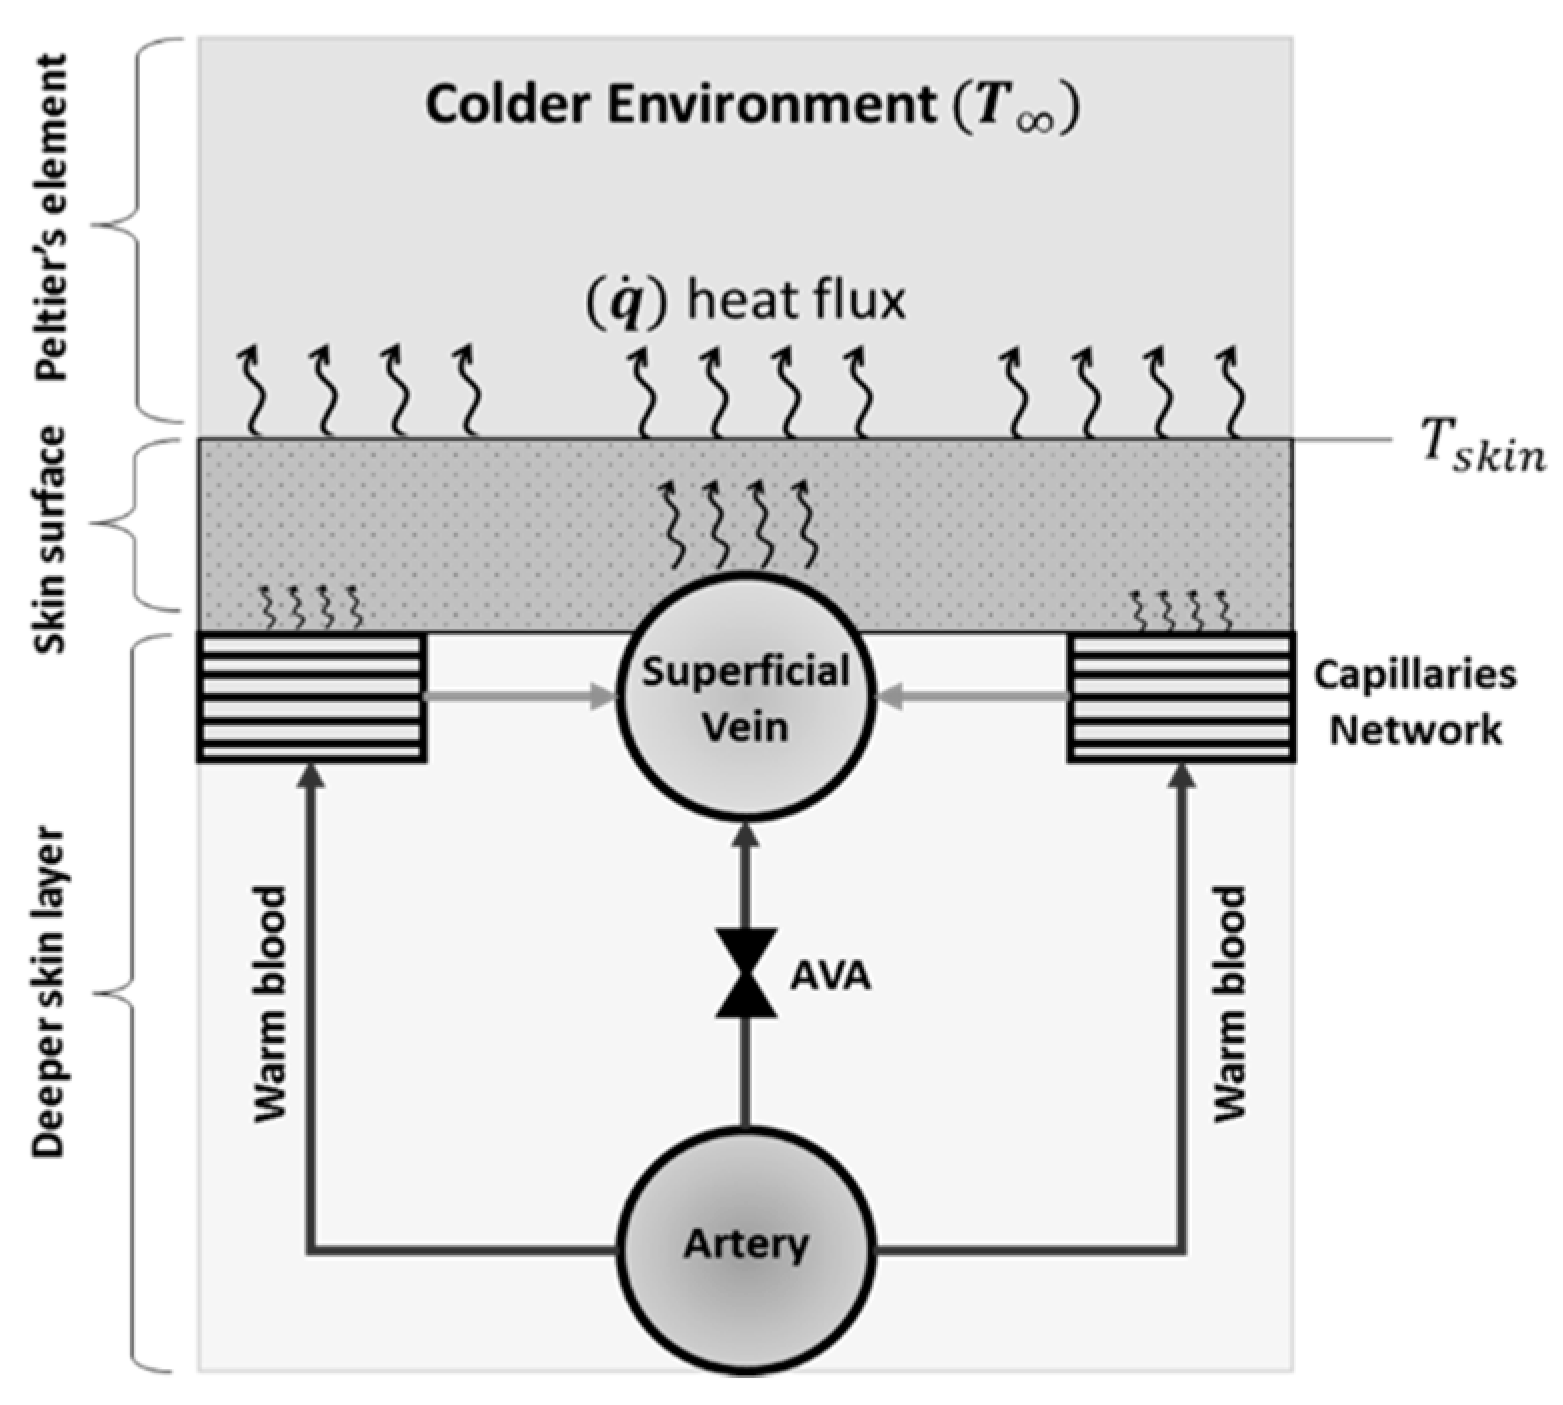
Under normal temperature (normothermia), before applying the step cooling using the Peltier’s element, there is a baseline level of vasoconstrictive tone [33], where the blood velocity fluctuates, between a high level and a very low level, with about 2–3 vasoconstrictions per minute [17]. The high level corresponds to a state when the AVAs were open. However, when the local environmental temperature (Peltier’s element temperature) drops, the AVAs close, causing the direct blood flow from the artery to the superficial vein to stop quite abruptly. Hence, the convective heat transfer () from the blood in the superficial veins (Figure 6) decreases dramatically, causing a fast reduction in the skin temperature, which can be represented by the transfer function . On the other hand, the convective heat transfer from capillaries () together with the conductive heat exchange () between the skin and colder Peltier’s element are dissipating the heat much slower. This is mainly due to the effect of skin thermal capacitance and the high resistance of the capillaries to blood flow. Hence, TF1, with the slow time constant, is suitable for describing the dynamic response of both the convective heat transfer from capillaries and conductive heat exchange between the skin and the Peltier’s element.
3.1.2. Data-Based Mechanistic Modelling of CIVD
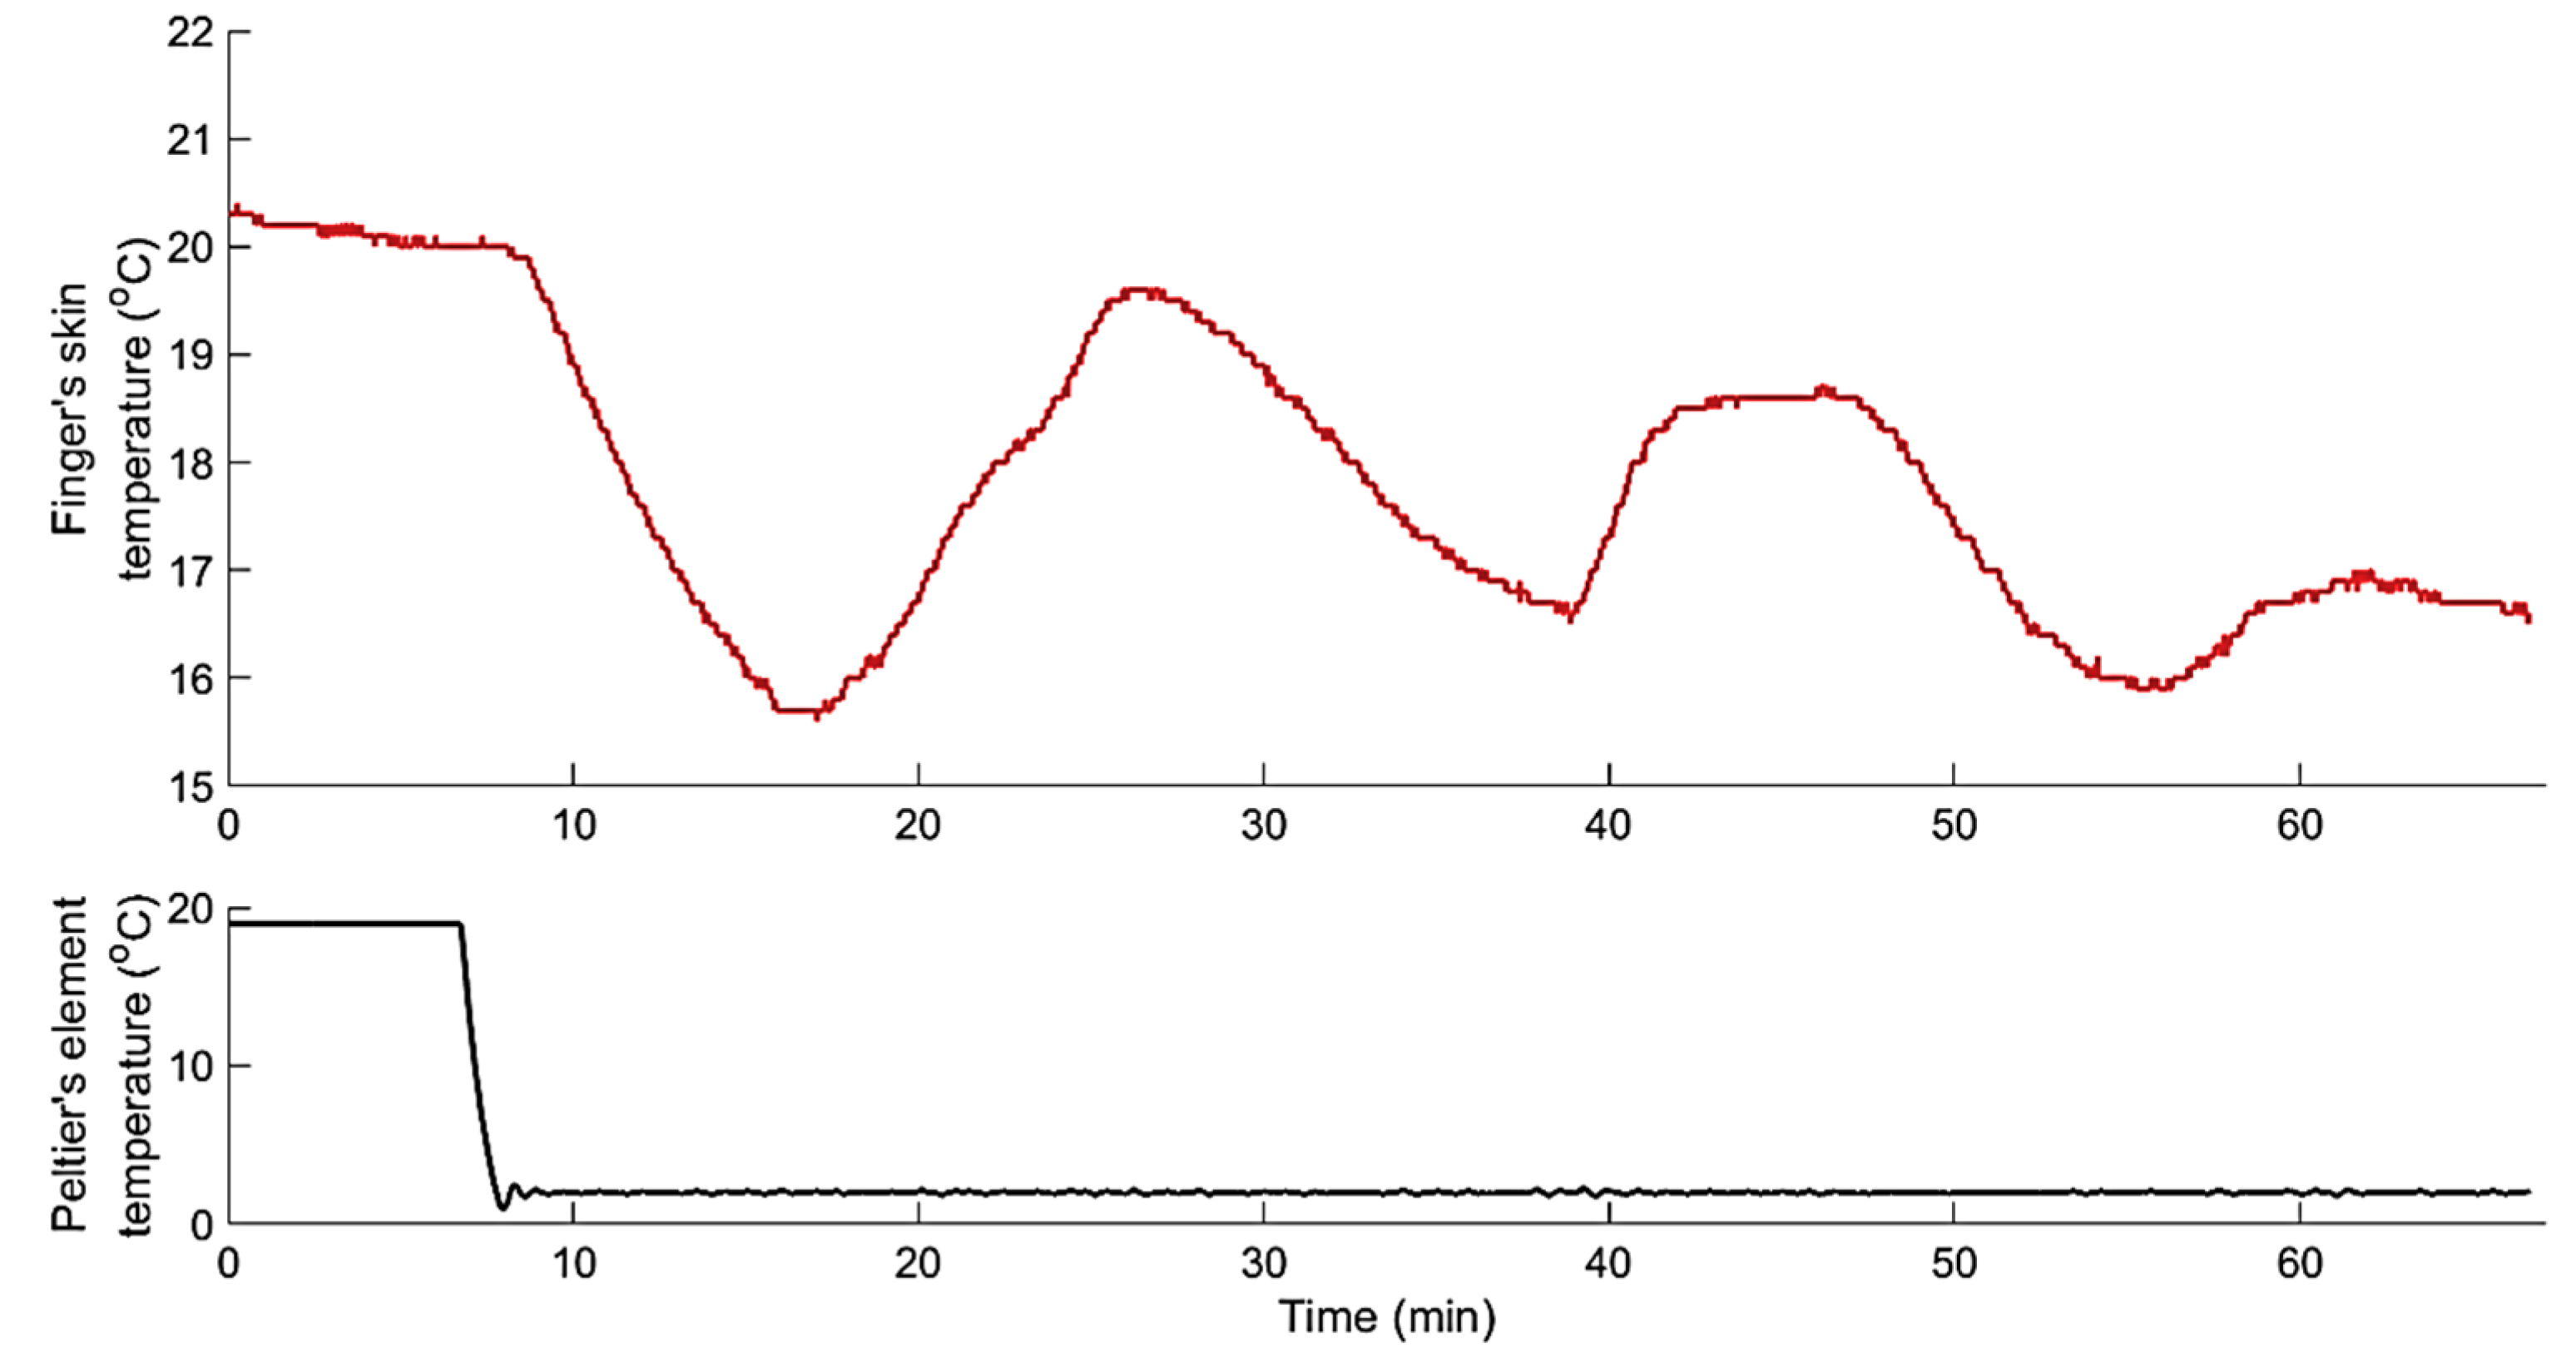
Among the 33 test subjects, 27 showed the hunting reaction with cycles of CIVC and CIVD. Figure 7 shows an example of the resulting hunting reaction to continuous localised cooling using Peltier’s element temperature at 2 °C.
Within the cooling period of 60 min, all test subjects exhibiting hunting reactions showed three consecutive cycles of CIVC/CIVD (an example is shown in Figure 7).
A second-order DTF with two poles ( = 2) and two zeroes ( = 2) was the best model structure (with average = 0.92 ± 0.04 and = −10.61 ± 3.45) to describe the CIVD response to localised cooling for all test subjects with the hunting reaction:
The structure of the identified model, represented by the triad [ = 2, = 2, ], showed an average time delay of 10.23 min (±3.50 min). In other words, for all test subjects that showing the hunting reaction, the first episode of CIVD started, on average, after 10.23 ± 3.50 min from the start of applying the localised cooling. Table 3 shows the estimation results of the identified model (6) for all test subjects showing the hunting reaction.
This relatively long time delay, compared to the CIVC case, was somehow misleading in terms of system causality, since during this lag of time between the cause (step cooling) and the modelled effect (CIVD), there was another effect, namely the CIVC. Therefore, the model input, represented by the step decrease in the Peltier’s element temperature, cannot fully explain the CIVD effect. However, the rate of heat dissipation (, Watt), from the finger to the Peltier’s elements, shows more dynamics in relation to both CIVC and CIVD. The heat dissipation rate () is calculated based on Newton’s law of cooling as follows [34]:
where is the heat transfer coefficient between the finger’s skin and Peltier’s element (=15 W m−2 °C−1, from the datasheet of the Peltier’s element) and is the total surface area of the Peltier’s elements in contact with the skin (=5.76 × 10⁻⁴ m2).
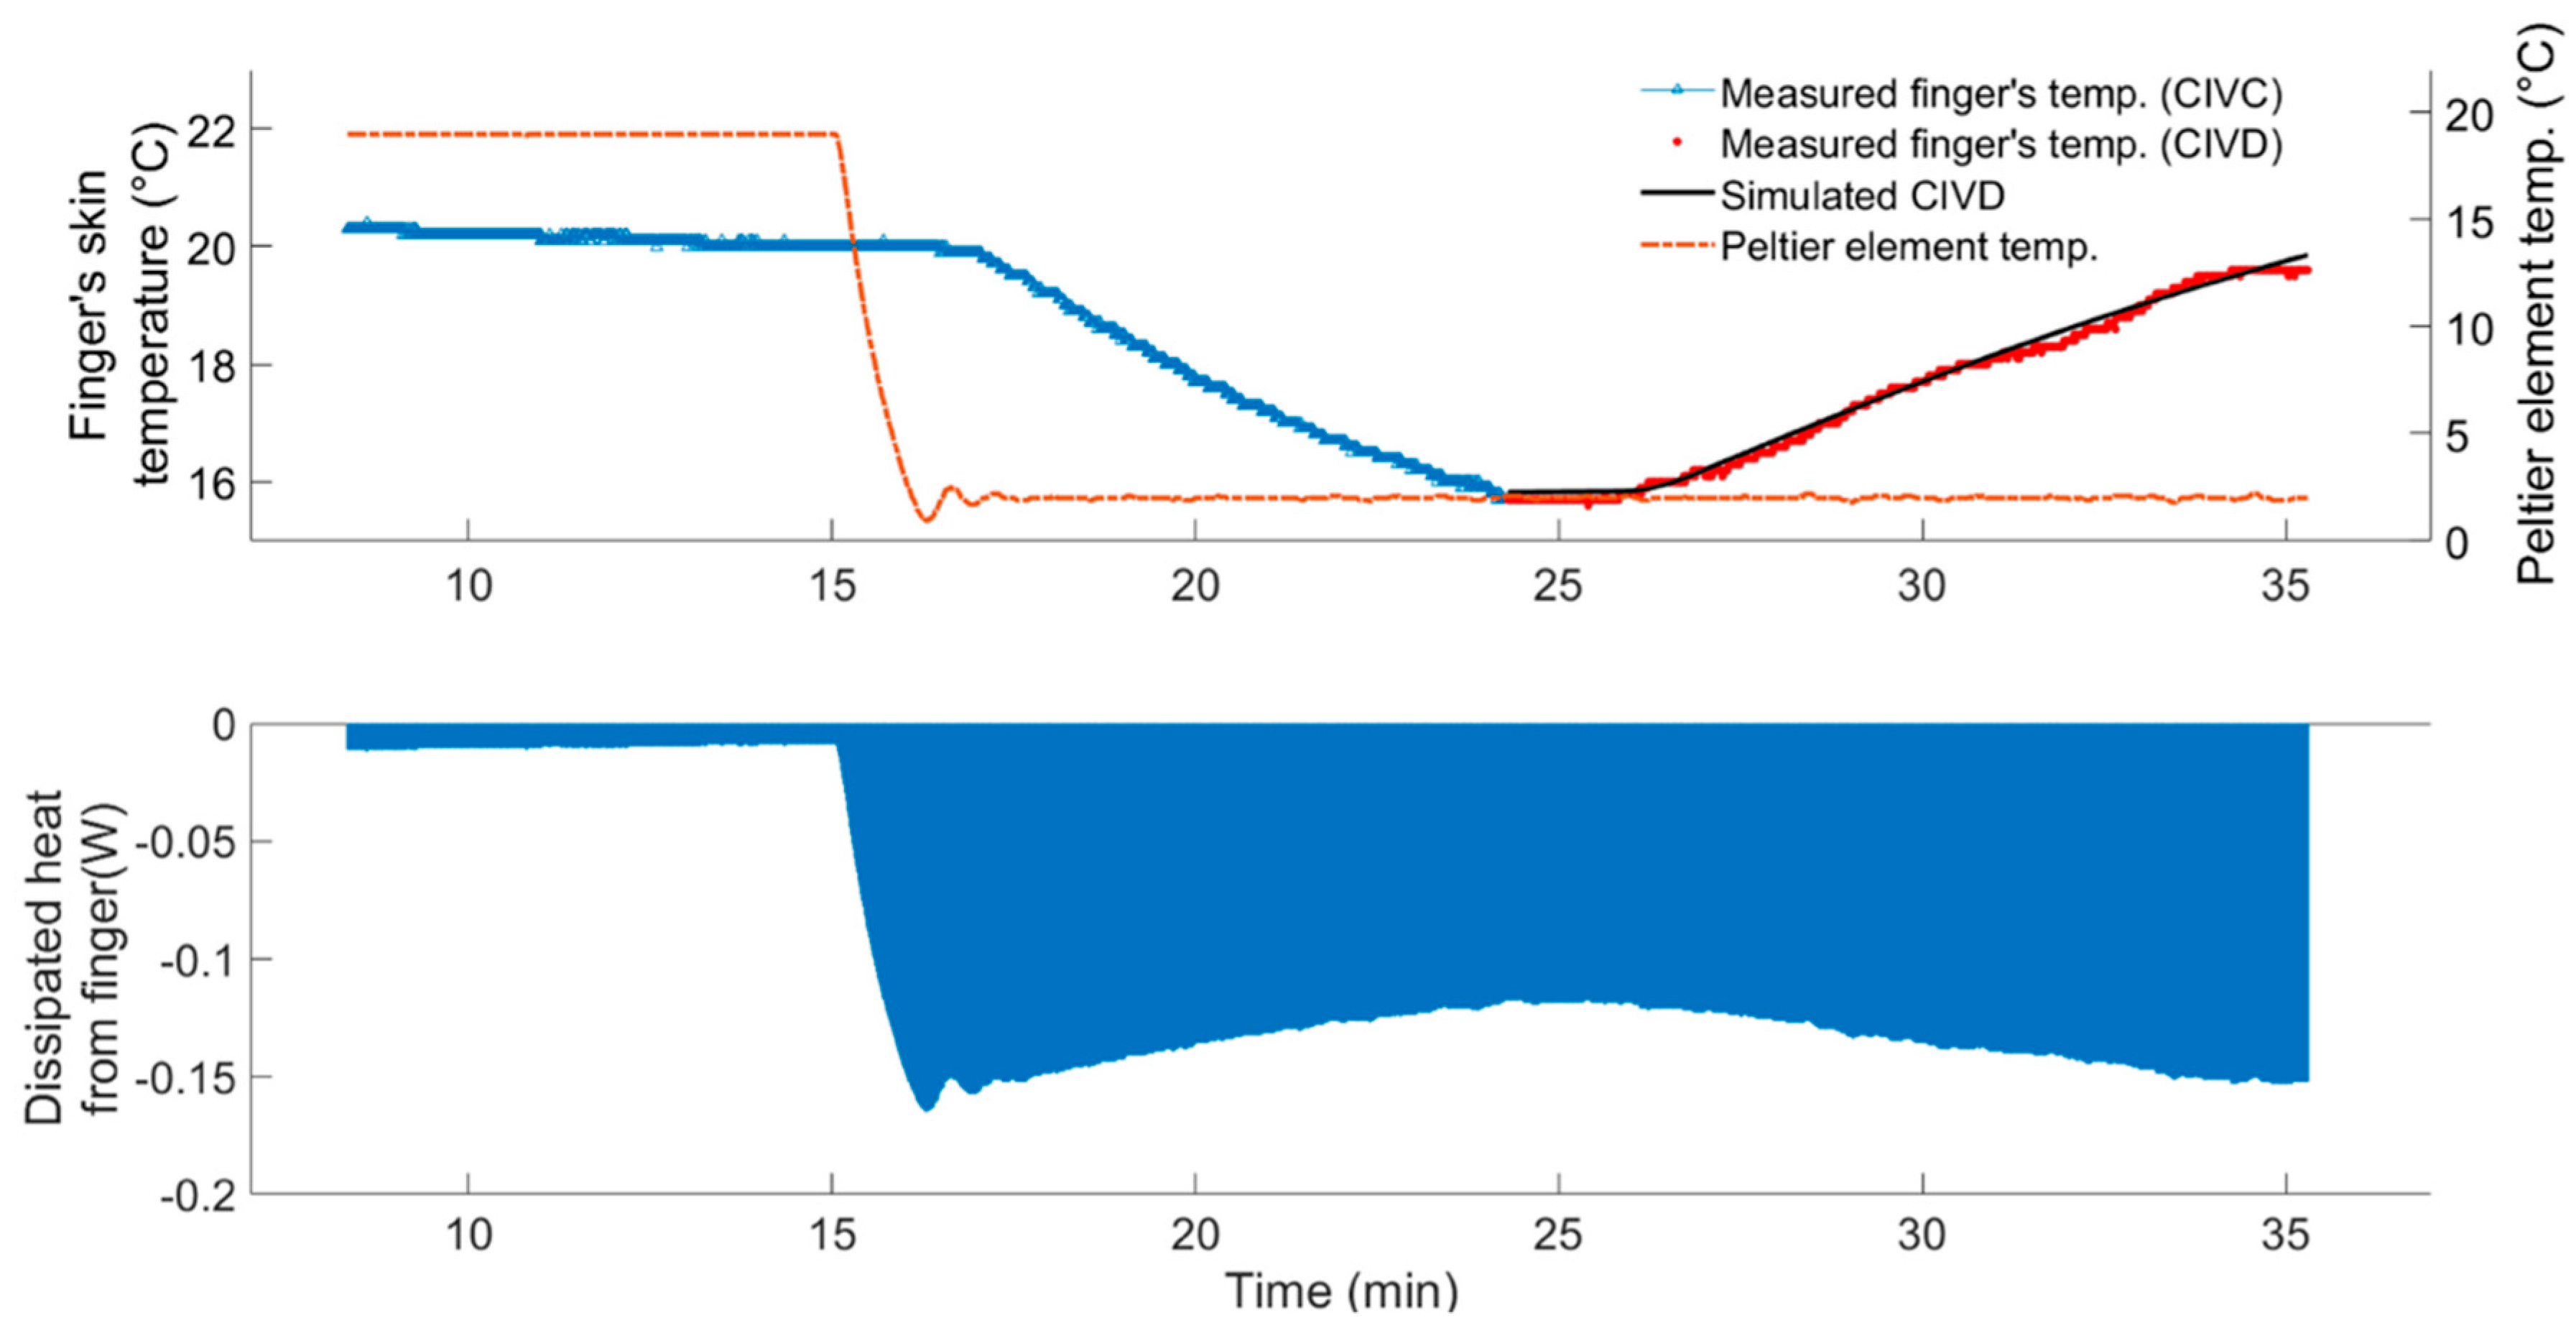
An example of the simulated finger skin temperature during the CIVD reaction using the identified second-order DTF (6) is shown in Figure 8. Additionally, Figure 8 shows the calculated dissipated heat rate () using Equation (7), while the area-under-the-curve represents the amount of the dissipated heat (, Joules) from the finger to the Peltier’s elements.
The results showed that the average amount of dissipated heat from the skin of the finger before the CIVD kick-off (termed here as latent heat for CIVD or LH-CIVD) is 102.10 (±22.36) joules. We found that there was a significant difference between the test subjects (interpersonal) that exhibited the hunting effect with respect to their latent heat for CIVD (LH-CIVD), and this at a significance level of 1%. In other words, the LH-CIVD can be considered an individual-dependent characteristic. The proposed LH-CIVD term combined three main factors that are believed to affect the thermostatic responses, namely, the rate of cooling [35], the temperature to which the skin is cooled [36], and the duration of exposure [37].
The second-order TF (6) describing the CIVD reaction was decomposed into two first-order TFs with a parallel configuration (the same as described in Figure 5) as the most mathematically suitable configuration (average = 0.93 ± 0.01). The resulting time constants and of and , respectively, were calculated and compared for all test subjects exhibiting the CIVD reaction, as shown in Table 4.
In the same fashion as with the CIVC reaction, the calculated time constants suggested two parallel responses with clear and different dynamics. The first response, represented by the first-order model , was slow ( 7.96 min) in comparison to that represented by the first-order ( 0.81 min). The fast response can be attributed to the gradual opening of the AVAs during the CIVD.
The time constants, and , for the CIVC and CIVD responses were compared by the Kruskal-Wallis test. It was found that there was no significant difference, at a significance level of 1%, in the first time constant () for both CIVC and CIVD. The same results were noticed for the second time constant ().
3.1.3. Modelling of Localized Intermittent Cooling Effect
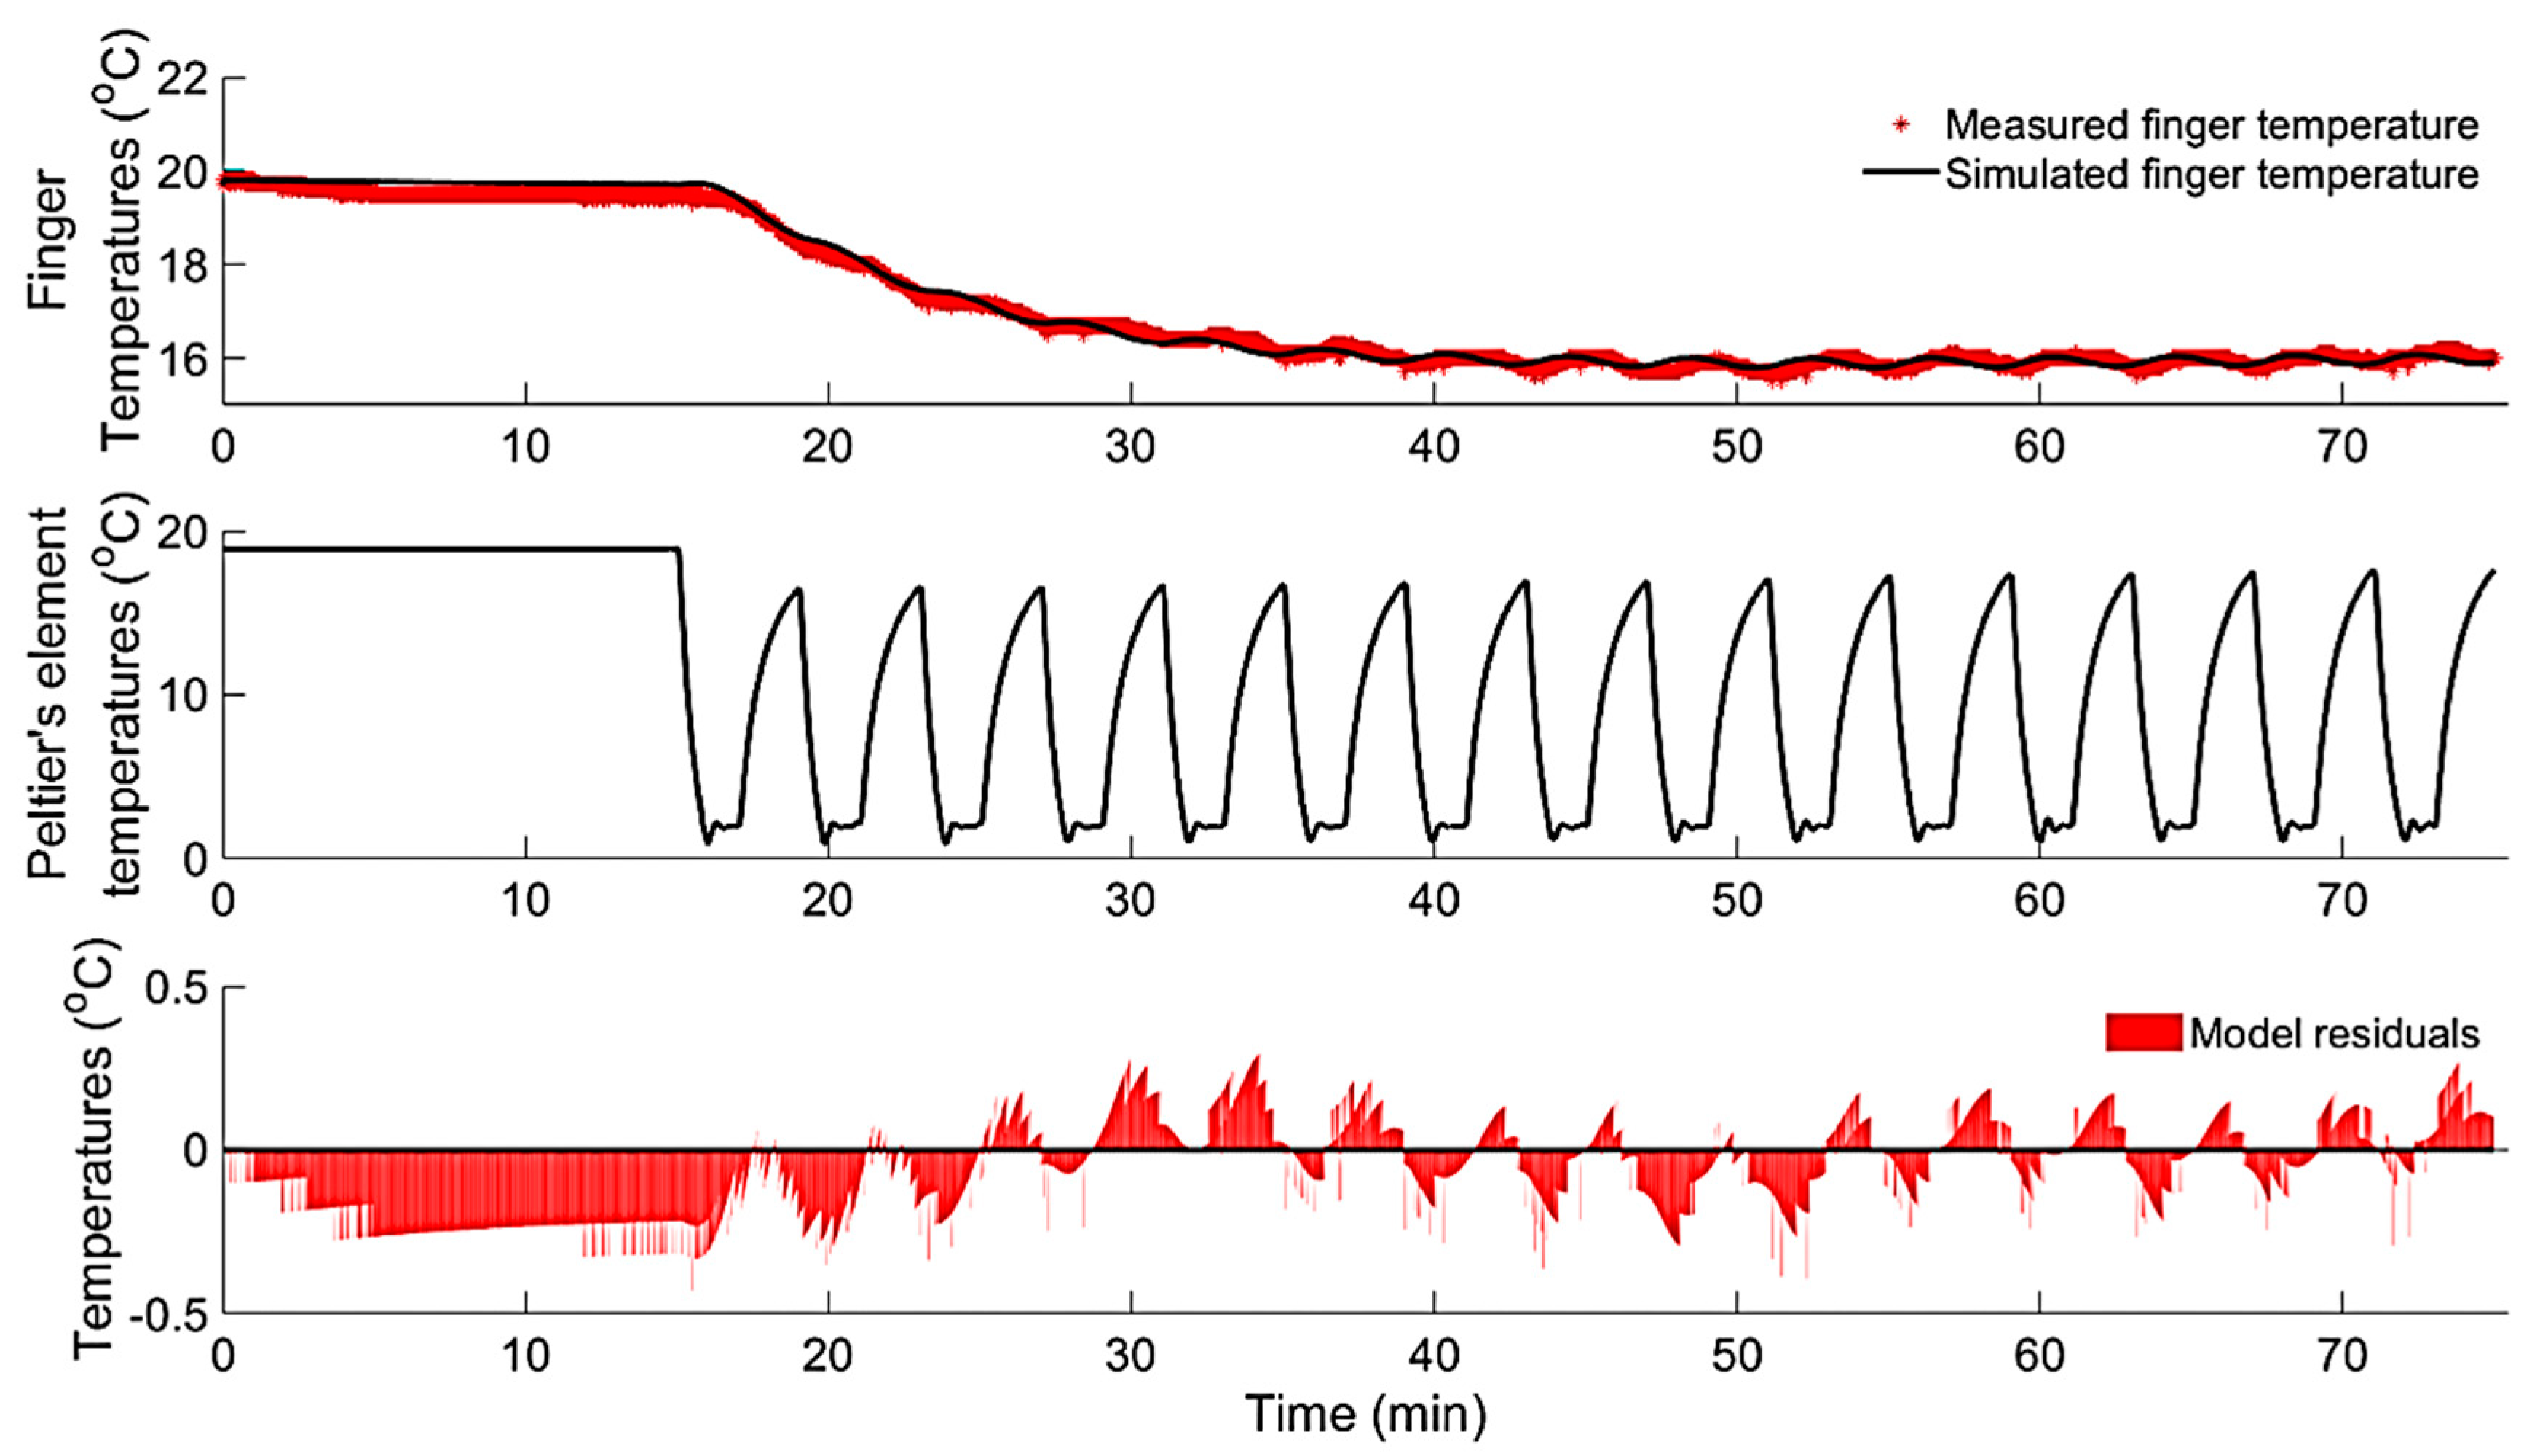
During the localised intermittent cooling (Exp.2, Phase II), none of the test subjects that showed the hunting reaction (CIVC/CIVD cycles) during the continuous cooling (Phase I) showed any episodes of CIVD. On the other hand, intermittent cooling induced an episode of CIVC, causing the finger’s temperature to drop to the same level reached during continuous cooling (on average, 16.2 ± 0.7 °C) and continued until the end of the experiment. Figure 9 shows an example of the finger’s temperature response to intermittent cooling. Additionally, a second-order (with number of poles = 2 and zeros = 2) discrete-time TF described the dynamic responses of finger skin temperature (CIVC) to a series of cooling pulses (intermittent cooling) in the input (Peltier element’s temperature) most accurately (i.e., = 0.92 ± 0.02 and = −11.67 ± 3.55) with same structure as the TF represented by (3). Table 5 shows the resulting average parameter estimates and delays from the identified DTF model describing the CIVC reaction to intermittent cooling.
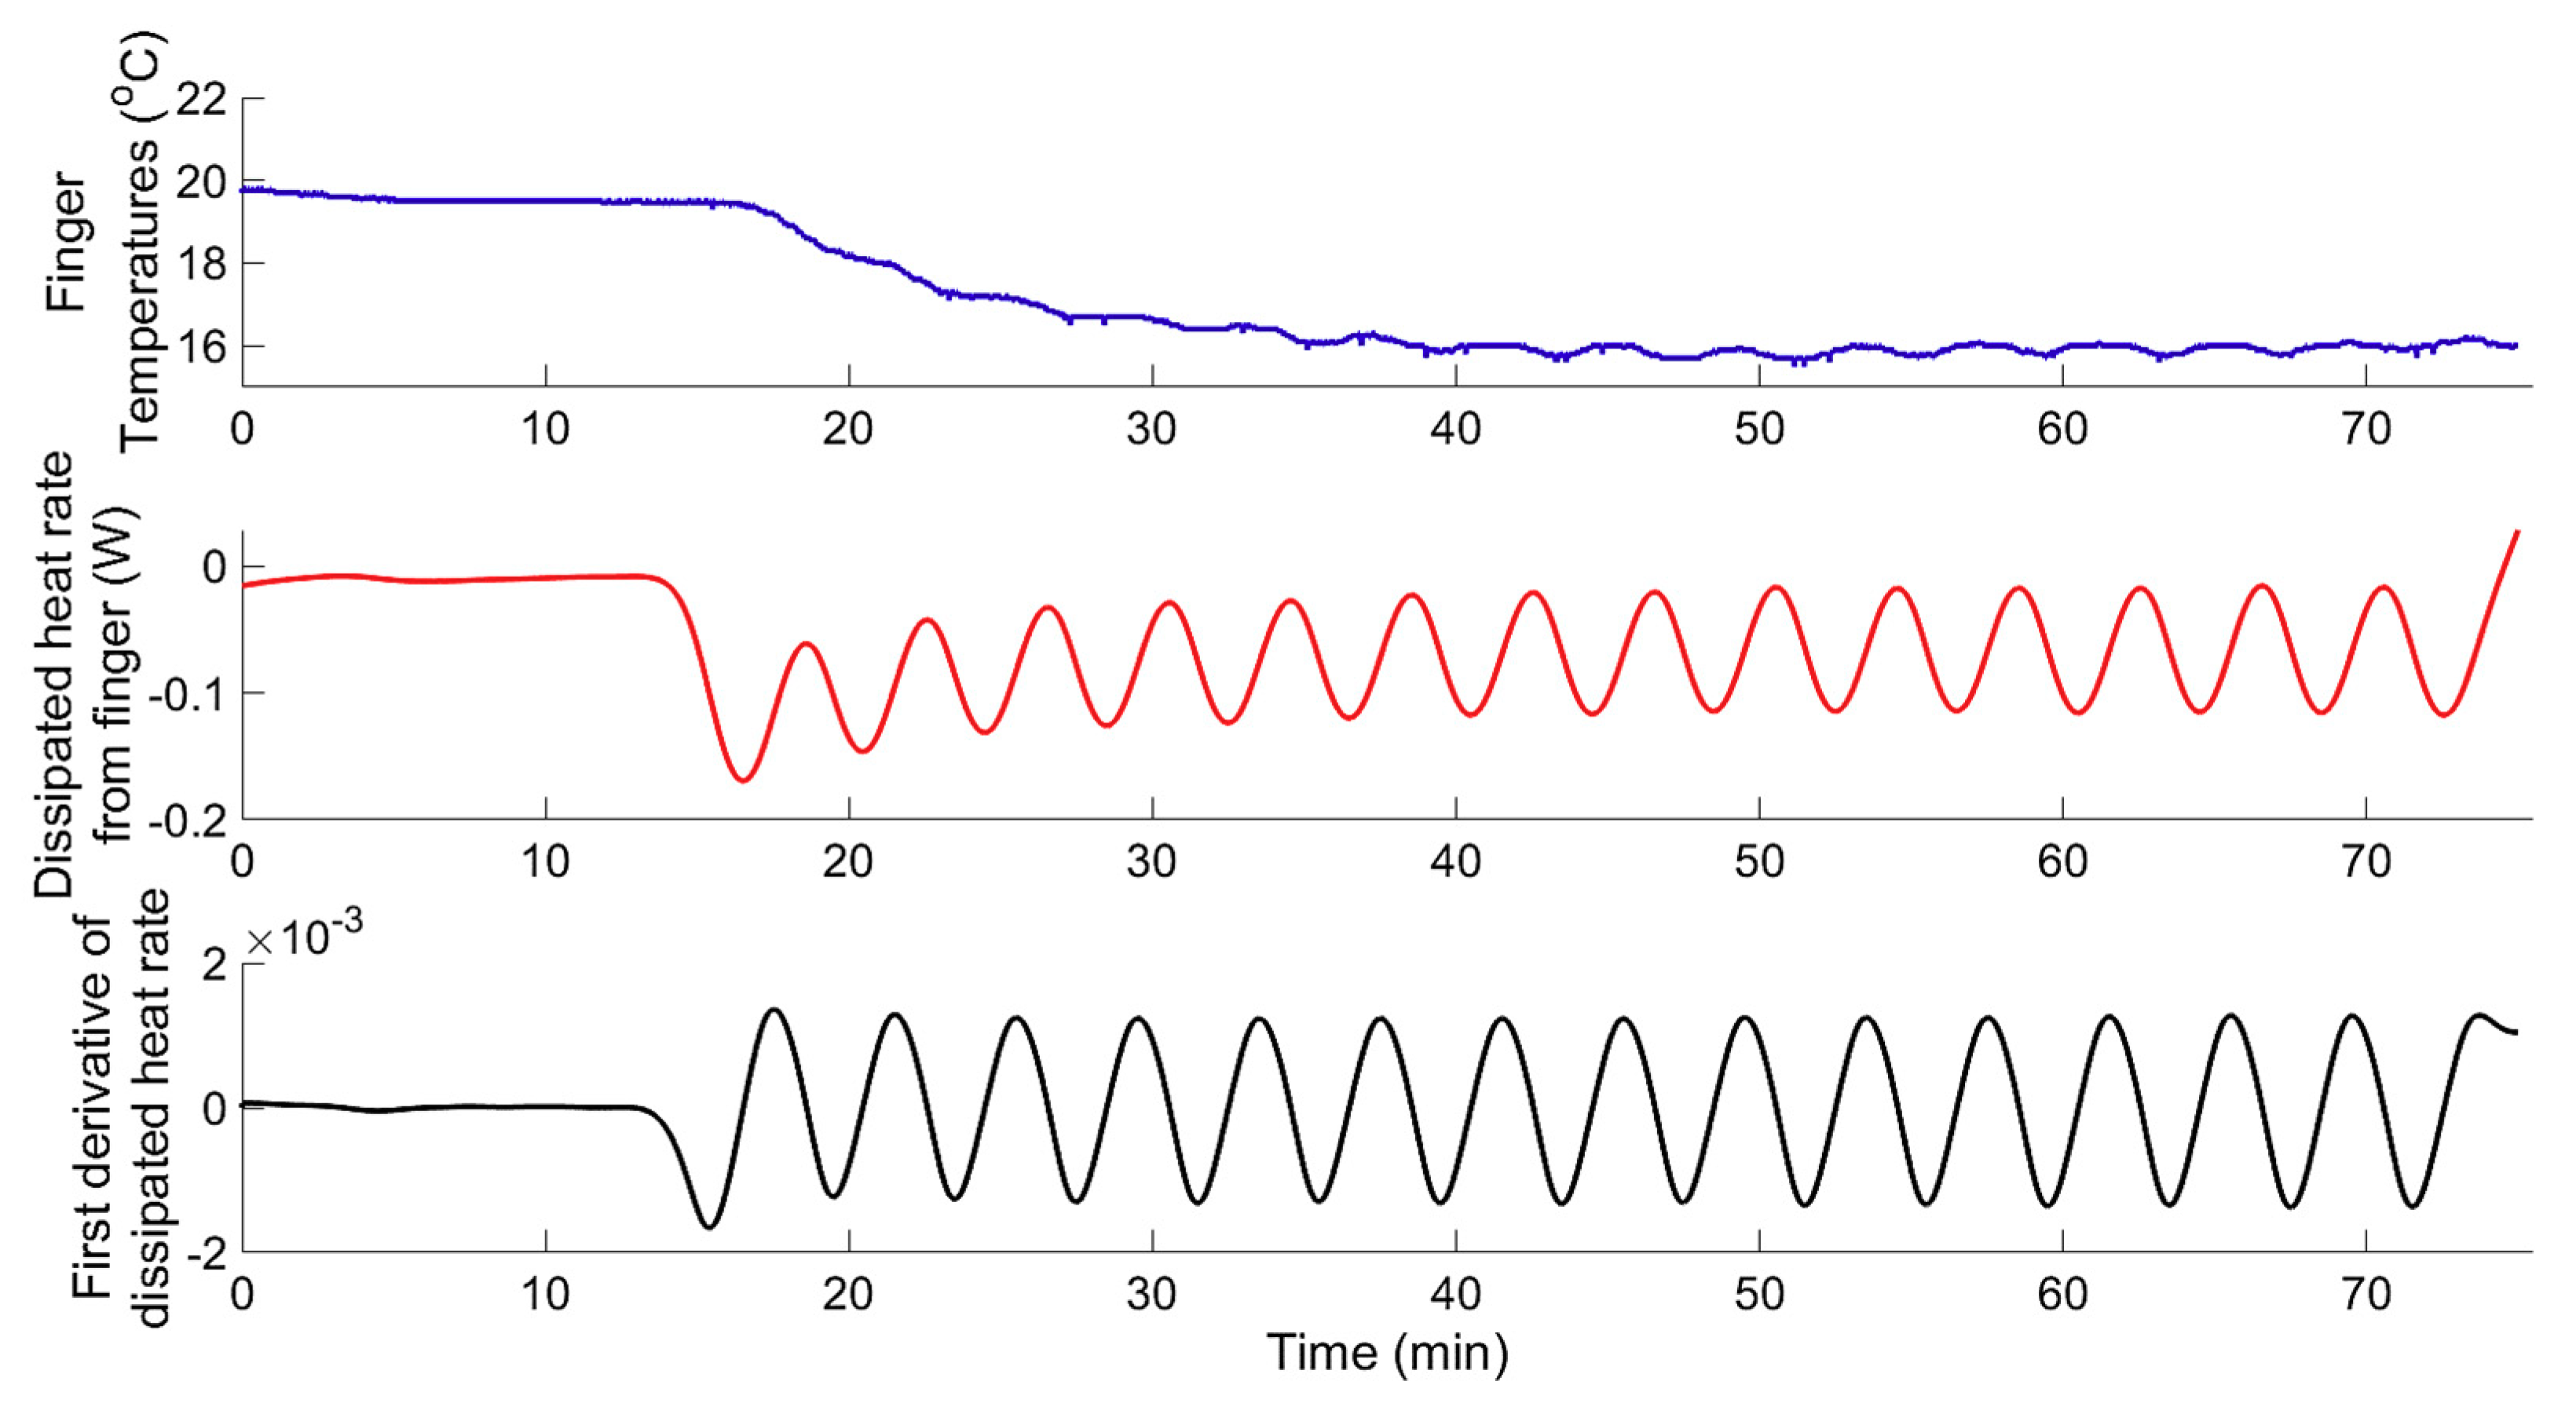
Although the finger skin temperature, under intermittent cooling, reached the same level (on average, 16.2 ± 0.7 °C) as that under continuous cooling, the intermittent cooling did not induce reheating of the fingers (i.e., CIVD). This indicates that the temperature to which the skin was cooled is not the only triggering factor for the CIVD. Additionally, it was clear that the vasodilation here (CIVD) is typically transient, which may interrupt the original vasoconstriction. The current work suggests that the rate at which the skin was cooled (rate of dissipated heat from the skin) is one of the main triggering factors, aside from the skin temperature and the duration of cooling [7,15,19,38]. The results showed that all test subjects exhibited the hunting reaction (i.e., episodes of CIVD occurred) during continuous cooling (Exp.2, phase I), when the rate of change in the dissipated heat from skin () was quasi zero (an example from one test subject is shown in Figure 10). On the other hand, for the same test subjects, under intermittent cooling (Exp.2, Phase II) the rate of change () oscillated around zero (±0.0016), and no evidence of vasodilation was noticed (an example from one test subject is shown in Figure 11).
The following section of this paper explores the different theories and mechanisms explaining the thermoregulatory CIVC/CIVD reactions.
3.2. Physiological/Mechanistic Interpretation of Thermoregulatory CIVC/CIVD Reactions
3.2.1. Mechanisms of CIVC/CIVD Reactions during Localised Cooling
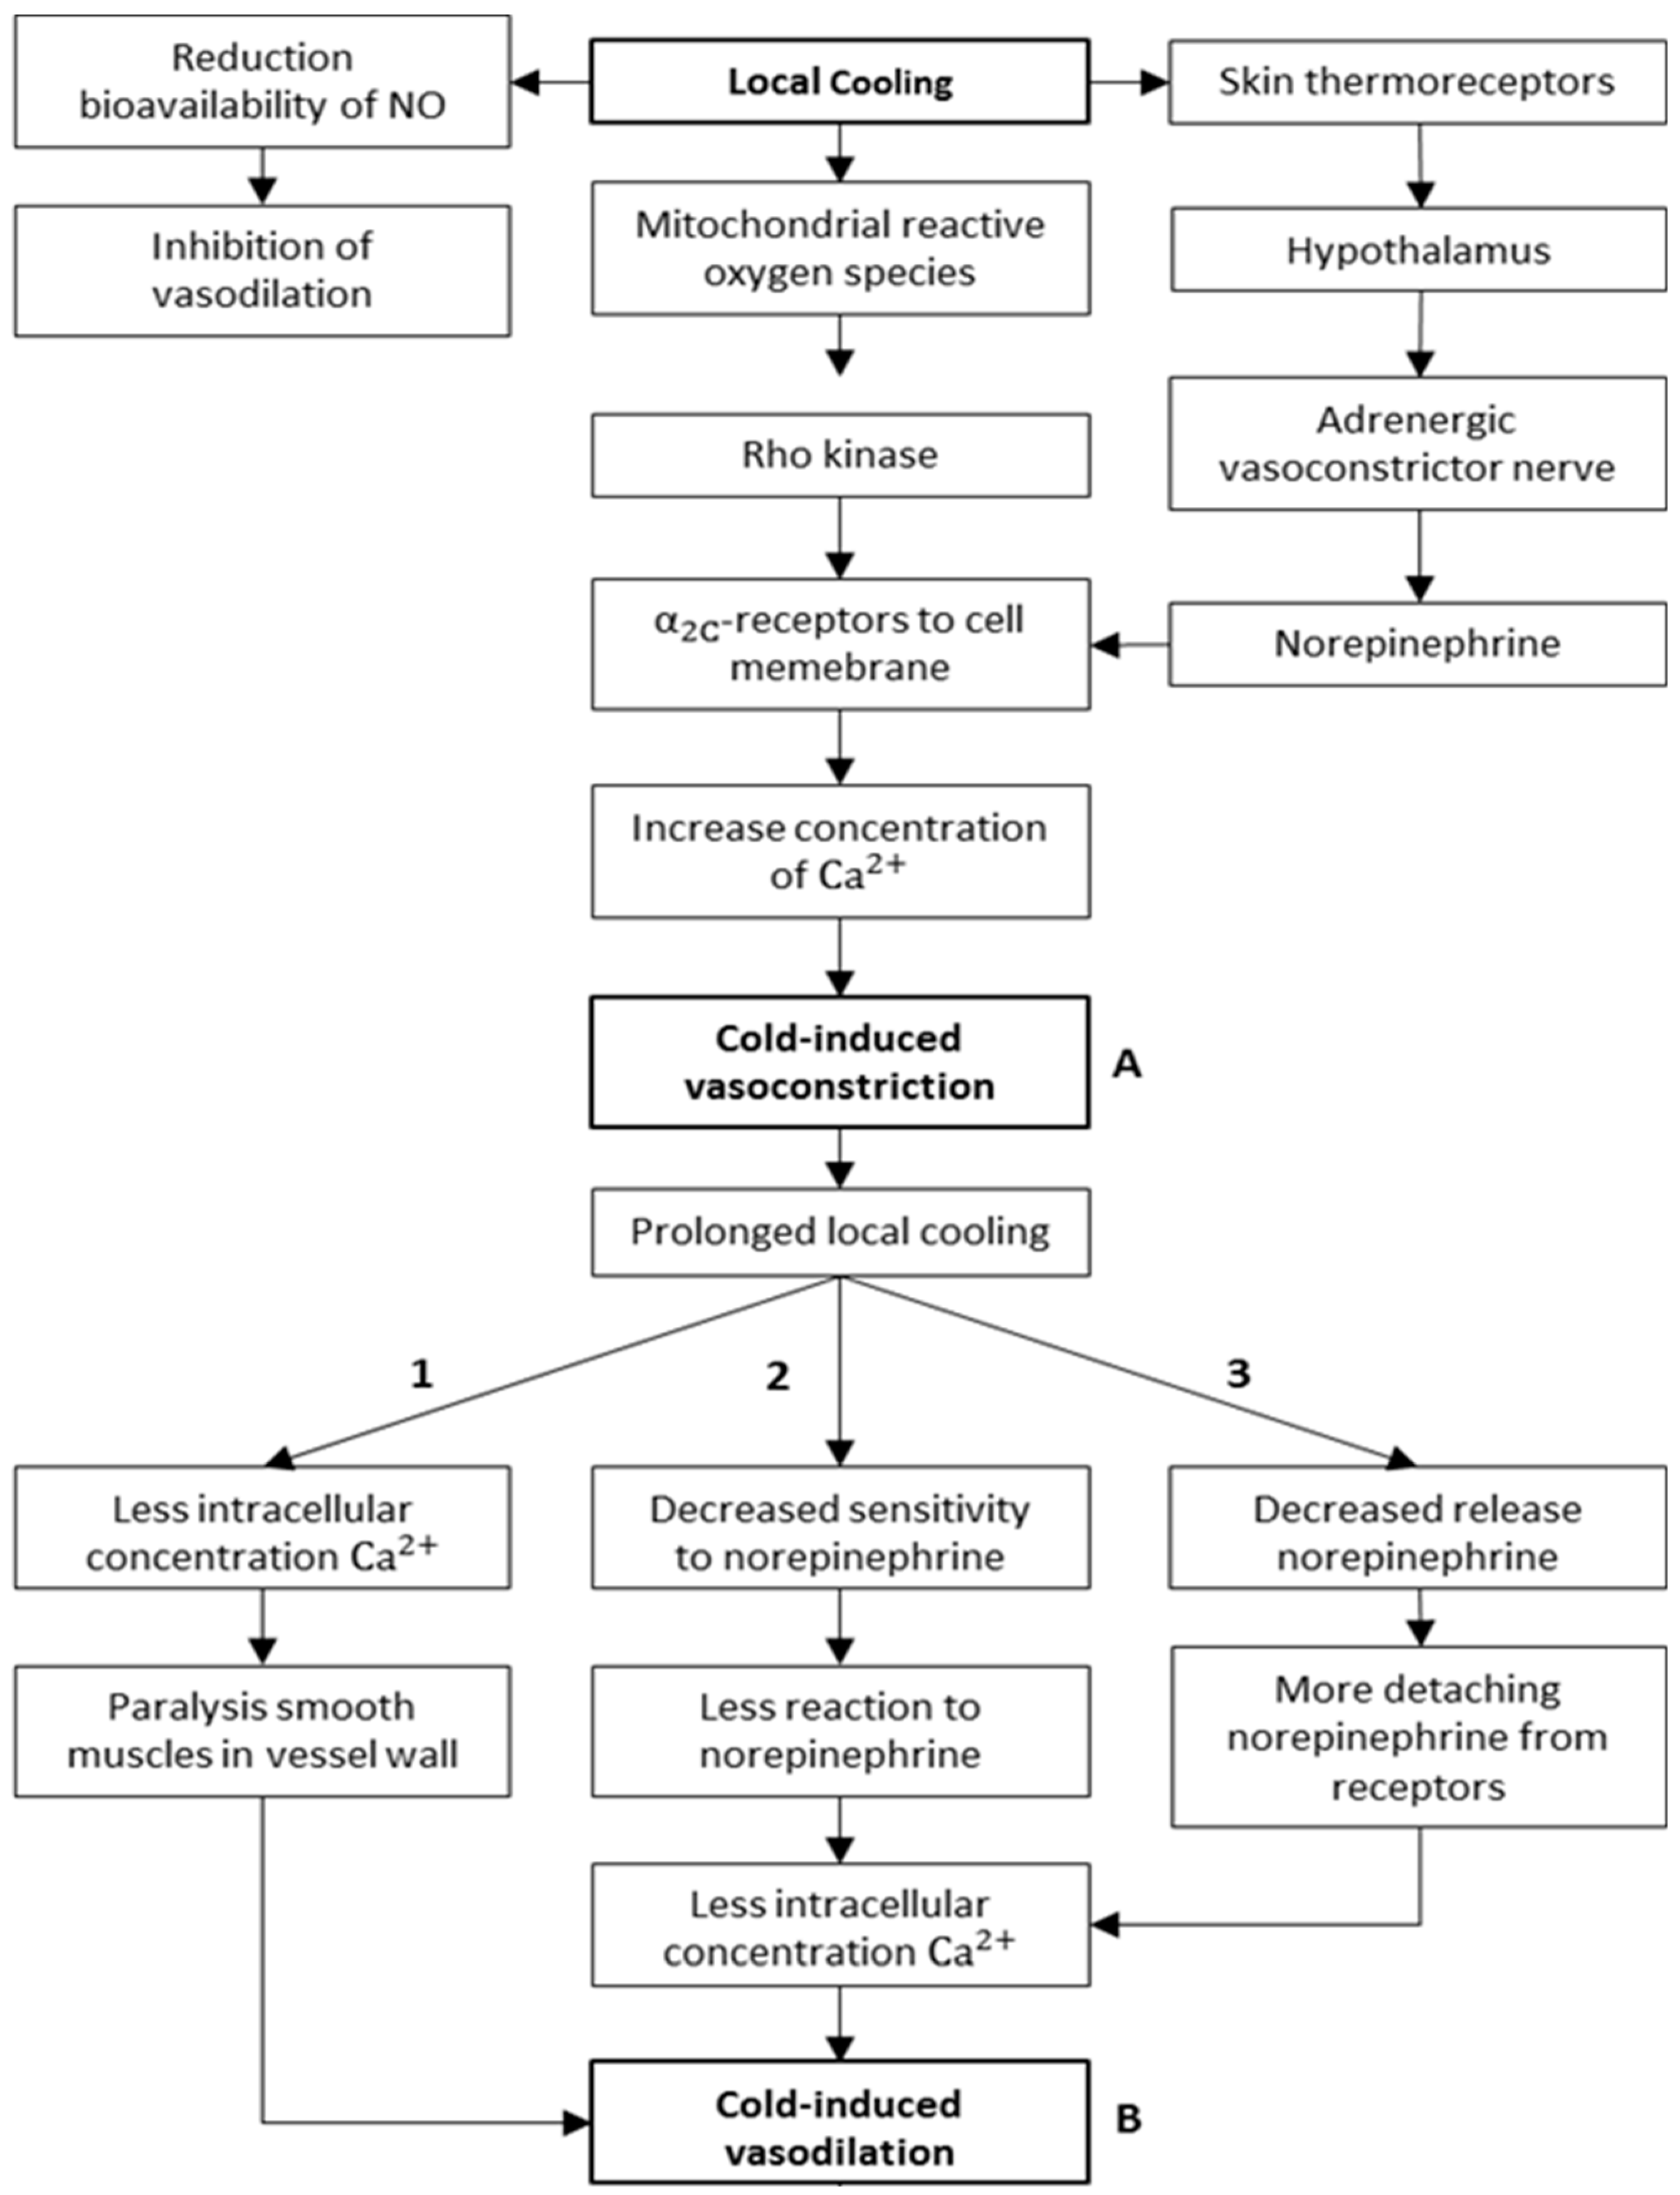
The initial response to cold exposure is a sympathetically mediated peripheral vasoconstriction, resulting in reduced local tissue temperature [11,15,39,40]. With continued cold exposure, this vasoconstriction may be interrupted, resulting in periods of vasodilation, which correspond to an increase in tissue temperature [41]. The local cooling vasoconstrictor response is dependent on intact noradrenergic cutaneous active vasoconstrictor nerves [36,39,42]. Johnson et al. [36] concluded in their work that local cooling of skin occurs in two phases (biphasic): an initial phase, which lasts for few minutes (in accordance to the aforementioned results) and a prolonged phase. The initial phase is mediated by activation of cold-sensitive afferent neurons that affect the release of norepinephrine from sympathetic cutaneous vasoconstrictor nerves. Norepinephrine then vasoconstricts skin vessels (mainly the AVAs, in this case) through post-junctional α-receptors. On the other hand, the mechanisms for the prolonged phase, which follows an initial CIVD (hunting reaction), are suggested to be non-neurogenic [36], because no manipulations altered the prolonged cutaneous vasoconstriction during prolonged local cooling. However, these mechanisms have not been defined further [36]. Additionally, prolonged local cooling also mediates an initial “non-neurogenic” vasodilation (CIVD) that competes with the initial noradrenergically mediated vasoconstriction. Several hypotheses have been postulated on the mechanism of CIVD [15]. The main hypotheses to explain the initial CIVD and prolonged CIVC are depicted in Figure 12. In the case of prolonged localised cooling, and after an initial episode of CIVC (Figure 12A), an initial CIVD might occur. Based on previous research work (e.g., [15,18,43,44]), three different mechanisms are suggested to explain this initial CIVD (Figure 12). The first hypothesized mechanism (pathway 1) states that the smooth muscles in the blood-vessel walls become paralysed, for example, by a decreased concentration of Ca2+ ions. Consequently, the paralysed smooth muscles will not be able to maintain vasoconstriction, and then vasodilation occurs. The second hypothesized mechanism (pathway 2) states that the smooth muscles become less sensitive to norepinephrine, for example, due to the resorption of the receptors from the cell membrane. The more resorption, the less norepinephrine can interact, the less the increase in intracellular Ca2+ ion concentration, and the less the constriction. The third and final hypothesized mechanism (pathway 3) states that the adrenergic vasoconstrictor nerves release less norepinephrine. Thereby, the concentration of epinephrine in the synaptic cleft decreases. The bound epinephrine will detach from the receptors due to the concentration difference (diffusion), resulting in vasodilation.
The findings of the current study do not support the first hypothesis (pathway 1), since it is clear from the case of intermittent localised cooling that the skin was cooled to the same temperature as in case of continuous cooling and yet no vasodilation evidence is recorded.
In agreement with the work of Yamazaki et al. [35], the present study suggests that the triggering of local cooling induced-vasodilation in the finger’s skin is dependent on the heat dissipation rate () or the rate of cooling as termed in [35,38].
Although the aforementioned hypotheses suggest non-neurogenic CIVD mechanisms, it is undisputed that CIVD magnitude and onset time are strongly dependent on central factors and sympathetic activity [45,46,47,48]. Mekjavic et al. [49] showed that after 13 days of immersing one hand, for 30 min daily, in 8 °C water, both the acclimated and contralateral (non-acclimated) hand decreased CIVD frequency and finger temperatures. Such observations resulted in an additional central model explaining CIVD, wherein the release of peripheral vasoconstriction serves to release excess heat from the body assuming sufficient body heat content in the core.
3.2.2. A New Model for Thermoregulatory Localised CIVC/CIVD Reactions
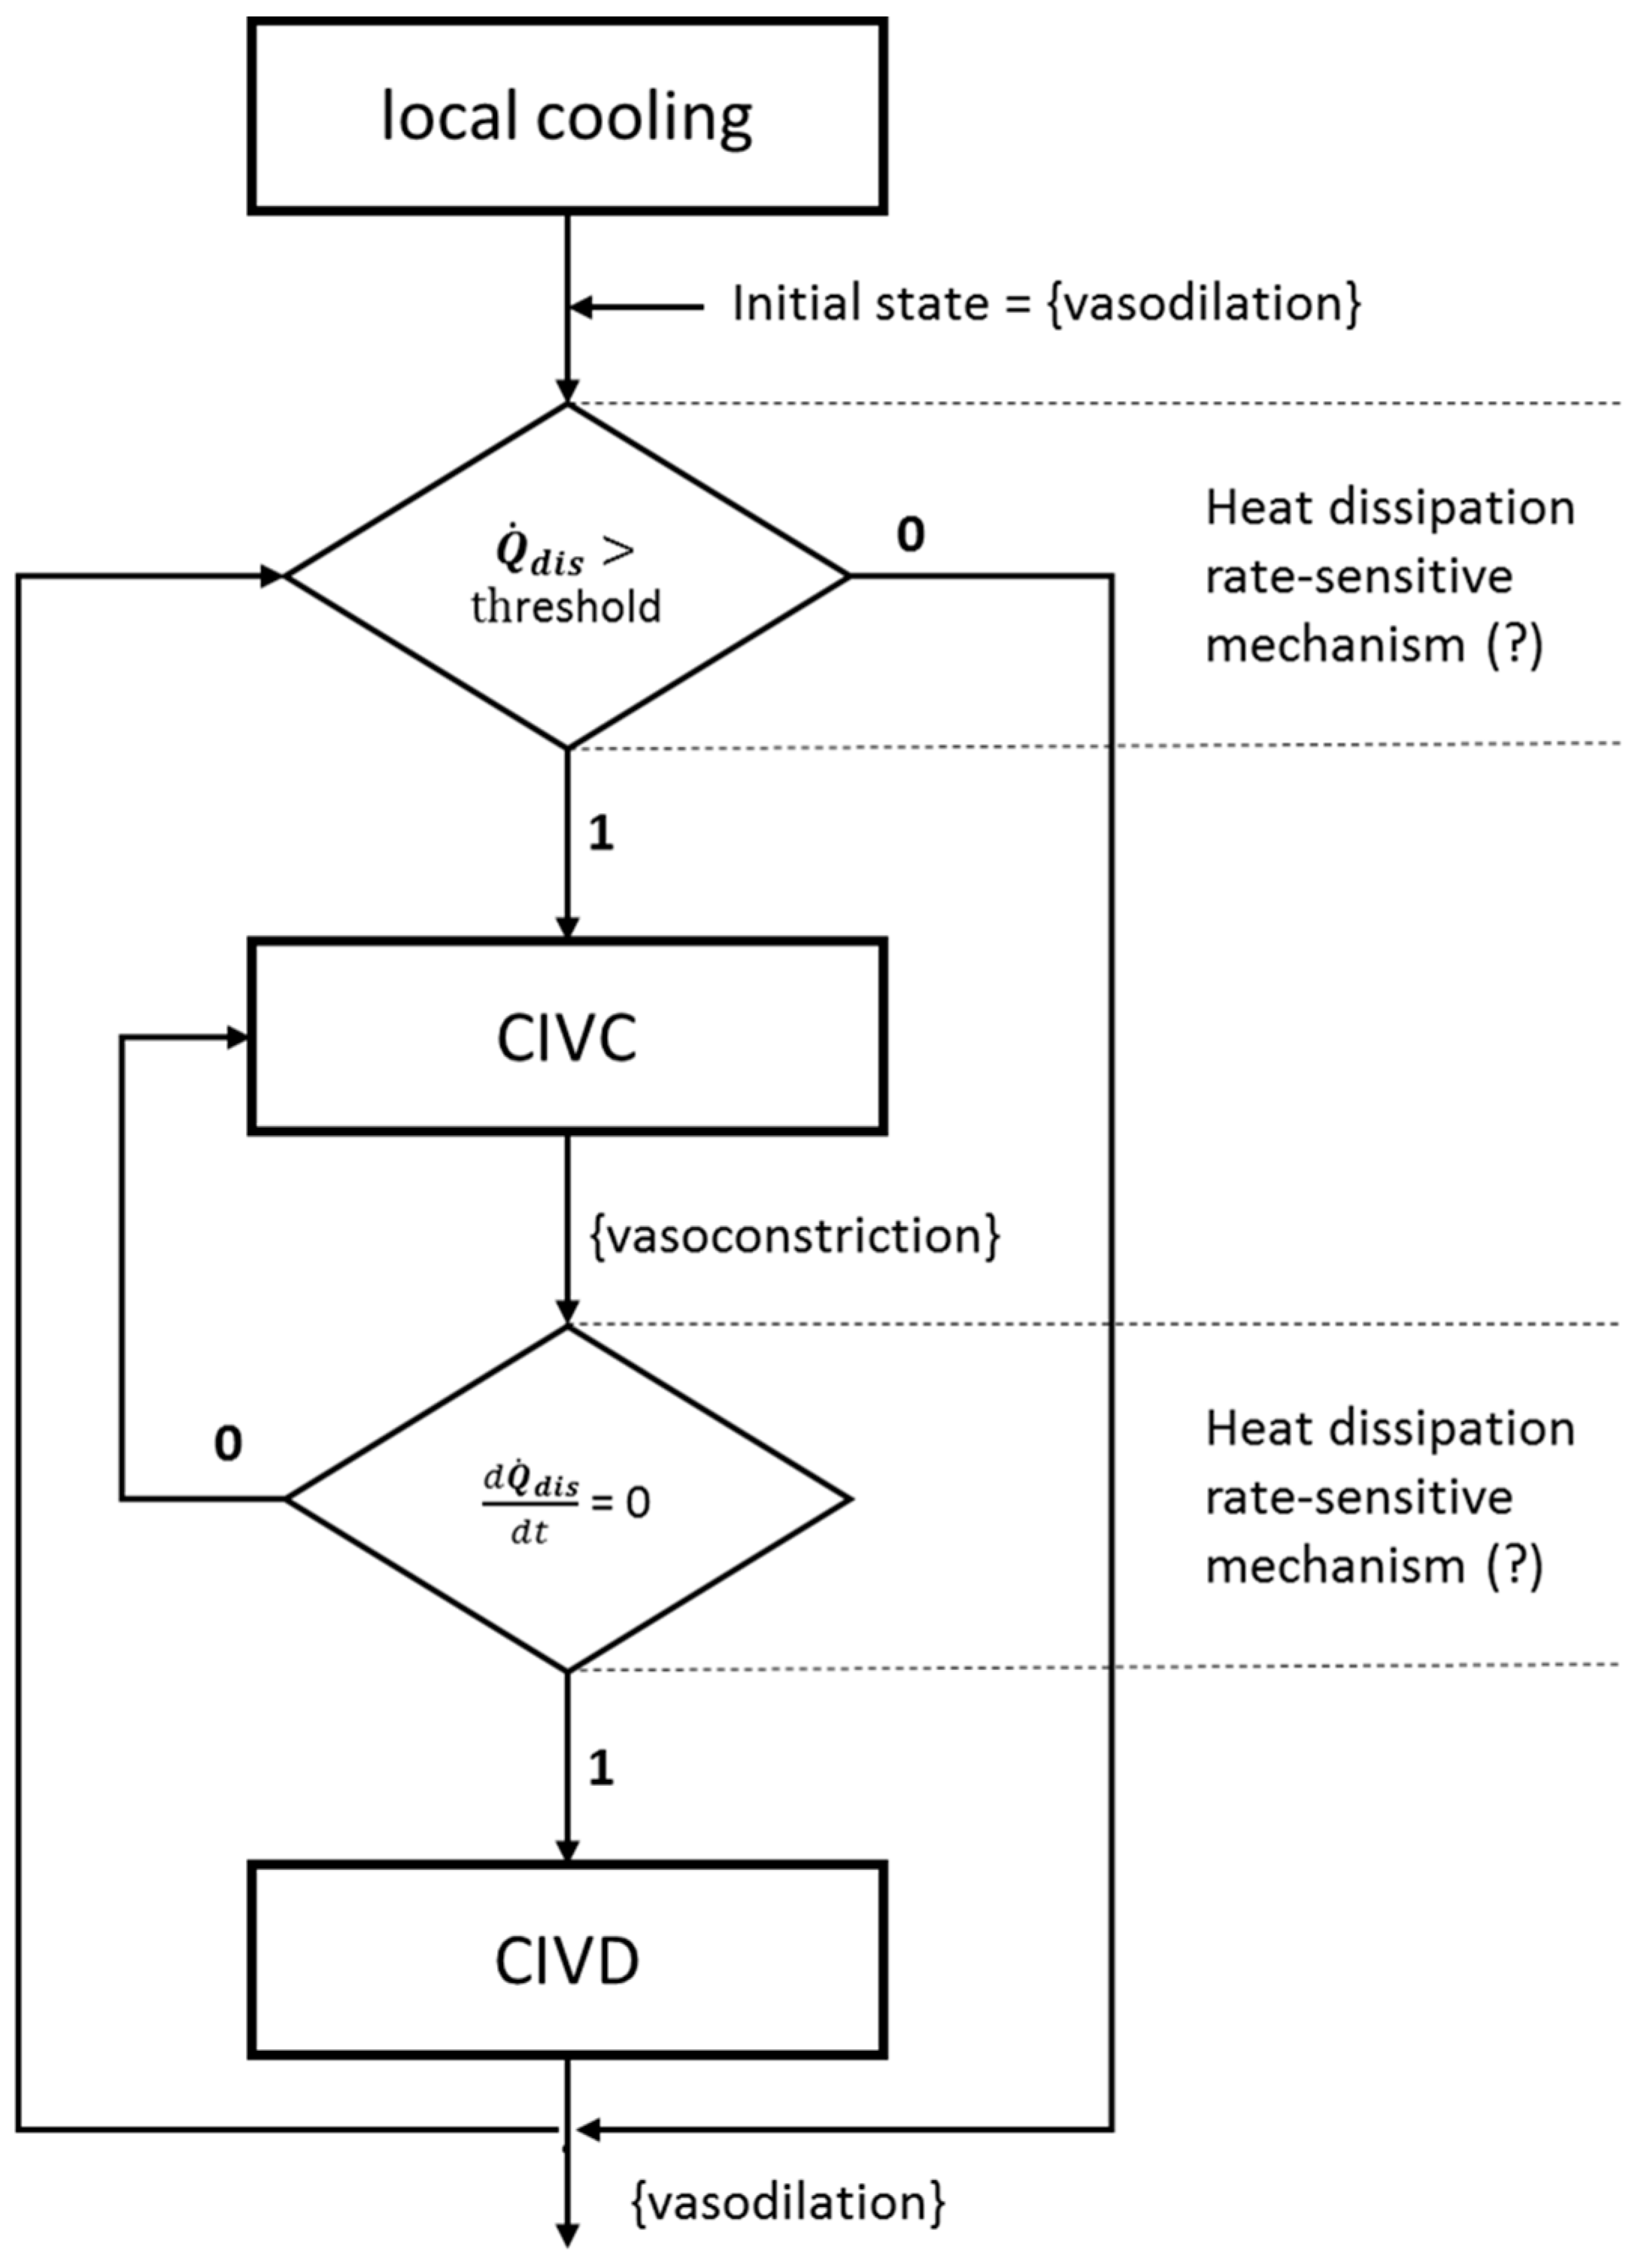
In the present paper, we suggest a new model for thermoregulatory localised CIVC/CIVD reactions. Figure 13 depicts the main workflow of the suggested CIVC/CIVD thermoregulatory model. The proposed model is based on the suggestion that there have to be rate-sensitive receptors, which are able to detect the changes in the heat dissipation rate (). This rate-sensitive mechanism, which is not yet clear, is also suggested by Yamazaki et al. [35]. It is clear from the current work and the presented results by Youssef et al. [20] that the CIVC, indicated by drop in blood flow rate (320 ± 92 PU), starts earlier (1.55 ± 21 min), before the drop in the skin temperature. This suggests that the initial CIVC is triggered not based on skin temperature threshold, but rather on a certain threshold in the rate of heat dissipation from the skin to the surrounding environment. Under normal temperature (normothermia), the blood vessels are dilated (initial state = vasodilation), with a baseline level of vasoconstrcitive tone [33]. Due to the temperature difference between skin and the environment, which is the driving force for heat flow, there is always a certain level of negative heat flux (dissipation) from the skin to the surrounding environment. Once the step-localised cooling is applied, this results in a sudden increase in the temperature difference = 18 ± 0.6 °C in the first two minutes), and consequently, a sudden increase in the heat dissipation rate ( = −0.15 ± 0.2 W in the first two minutes). If this change in the heat dissipation rate is above a certain threshold, the CIVC mechanisms are activated and vasoconstriction prevailed. Then, if the heat dissipation rate reaches a constant threshold level ( = 0), the vasoconstriction mechanism will be interrupted and revert to vasodilation. Otherwise, the vasoconstriction state is prolonged.
It should be stated here that this proposed model leaves a number of questions open for further investigation. One very important question, here, is about the nature of the rate-sensitive receptors and their working mechanism. In their work on the coding of cutaneous temperature and thermal receptors [50], Ran et. al. observed that the responses of cold-responding neurons peaked during the transient cooling phase and rapidly adapted to steady cold stimuli, suggesting that these neurons report temperature changes. In other word, cold-responding neurons report the relative drop in skin temperature (i.e., rate of temperature change ), rather than the absolute value [51].
Additionally, many questions are still open regarding the nature of thermal sensation and thermal-sensory system in relation to thermoregulation [52]. It is possible in our case to use many of the control-system terms to describe autonomic thermoregulation reactions (CIVC/CIVD), such as the regulated (controlled) variable (finger skin temperature), sensors (skin and preoptic area of the hypothalamus), integrator/controller, and effectors or actuators (blood vessels). However, a concept such as the set point in thermoregulation, and in homeostatic regulation in general, has eluded precise identification. Determination of where such a set point is precisely located, how it is consulted, and even more fundamentally, how the precise set-point value is established has been elusive [53]. Therefore, the “balance point” term [54] is suggested to be more suitable in our case, whereby the multiple pathways act independently [55]; integration (or balancing) of the independent pathways, each of which might have different thresholds of activation and inactivation, allows for a relatively well-maintained internal temperature [33,56]. The balance-point framework aids in explaining the physiology while still allowing for a negative feedback approach [53] in describing and reverse engineering the thermoregulatory reactions.
4. Conclusions
The main goal of this study was to gain more physiological and mechanistic insights into the underlying processes of thermoregulatory localised CIVC/CIVD reactions using a data-based mechanistic modelling (DBM) approach. Two types of localised cooling were applied on the fingers of 33 healthy participants (test subjects), namely, continuous and intermittent cooling, during the course of the conducted experiments. During the first set of experiments. The results showed that 27 participants out of 33 showed clear evidence of the hunting reaction (i.e., cycles of CIVC/CIVD episodes) during continuous localised cooling. Two different, yet connected, thermoregulatory reactions representing the hunting reaction, namely, CIVC and CIVD were mathematically modelled and described as two separate processes or dynamic systems using the DBM approach. A second-order discrete-time transfer function (two poles and two zeros) was the best ( = 0.91 ± 0.06 and = −11.43 ± 2.65) for mathematically representing the dynamic responses of the finger skin temperature to step localised cooling and for describing both CIVC and CIVD reactions. For both reactions, it was possible to decompose the obtained second-order system into two first-order TF systems in parallel configurations. The calculated time constants from the two first-order systems suggested two underlying processes for both CIVC and CIVD reactions, one of which is almost 10 times faster. Mechanistic and physiological insights into the suggested underlying processes suggested that the slower (with average = 7.36 min) process represents slow convective heat transfer from the capillaries and the conductive heat exchange between the skin and Peltier’s elements. On the other hand, the faster process represents the closing/opening of the AVAs during the CIVC/CIVD reactions, which causes a fast change in the convective heat transfer from the superficial veins. During the intermittent localised cooling, no test subjects of Exp.2 (in total 12) showed any episodes of CIVD, although the skin temperature reached the same level (16.2 ± 0.7 °C) as that under continuous cooling. A new term is suggested in this paper, namely, the latent heat of CIVD (LH-CIVD), which represents the amount of dissipated heat required to trigger the CIVD. It should be stated here that the identified models are limited to the presented methodology of localized cooling. Additionally, in future investigations, interpersonal variations (e.g., physiological and anthropometric variations) should be considered and studied. Moreover, the present work suggested a new model for the thermoregulatory localised CIVC/CIVD reactions. The new model suggested states that, with an initial vasodilation state, the initial localised CIVC is triggered not based on skin temperature threshold, but rather on a certain threshold in the rate of heat dissipation from the skin to the surrounding environment.
Author Contributions
Conceptualisation, A.Y. and J.-M.A.; methodology, A.Y. and A.V.; software, A.Y. and A.V.; validation, A.Y.; formal analysis, A.Y. and A.V.; investigation, A.Y. and A.V.; resources, G.D.B and J-N.A.; data curation, A.Y. and A.V.; writing—original draft preparation, A.Y. and A.V.; writing—review and editing, A.Y. and J.-M.A.; visualisation, A.Y.; supervision, J.-M.A. and A.Y.; project administration, J.-M.A.; funding acquisition, J.-M.A.
Funding
This research received no external funding.
Conflicts of Interest
The authors declare no conflict of interest.
References
- Novosel’tsev, V.N. Homeostasis and health: Analysis from a standpoint of the control theory. Autom. Remote Control 2012, 73, 841–851. [Google Scholar] [CrossRef]
- Bernard, C. De la Physiologie Générale; Librairie Hachette Et: Paris, France, 1872. [Google Scholar]
- Cannon, W.B. The Wisdom of the Body; W.W. Norton: New York, NY, USA, 1939. [Google Scholar]
- Ivanov, K.P. The development of the concepts of homeothermy and thermoregulation. J. Therm. Biol. 2006, 31, 24–29. [Google Scholar] [CrossRef]
- Ivanov, K. Restoration of vital activity of cooled animals without rewarming the body. Eur. J. Appl. Physiol. 2009, 105, 5–12. [Google Scholar] [CrossRef] [PubMed]
- Turner, J.S. On the thermal capacity of a bird’s egg warmed by a brood patch. Physiol. Zool. 1997, 70, 470–480. [Google Scholar] [CrossRef] [PubMed]
- Cheung, S.S. Responses of the hands and feet to cold exposure. Temperature 2015, 2, 105–120. [Google Scholar] [CrossRef] [PubMed]
- Taylor, N.A.S.; Machado-Moreira, C.A.; van den Heuvel, A.M.J.; Caldwell, J.N. Hands and feet: Physiological insulators, radiators and evaporators. Eur. J. Appl. Physiol. 2014, 114, 2037–2060. [Google Scholar] [CrossRef] [PubMed]
- Walløe, L. Arterio-venous anastomoses in the human skin and their role in temperature control. Temp. (Austin. Tex.) 2016, 3, 92–103. [Google Scholar] [CrossRef] [PubMed]
- Grant, R.T.; Bland, E. Observations on arterio venous anastomoses in human skin and in the bird’s foot with special reference to the reaction to cold. Heart 1931, 15, 385–411. [Google Scholar]
- Heus, R.; Daanen, H.A.M.; Havenith, G. Physiological criteria for functioning of hands in the cold. Appl. Ergon. 1995, 26, 5–13. [Google Scholar] [CrossRef]
- Karaki, W.; Ghaddar, N.; Ghali, K.; Kuklane, K.; Holmér, I.; Vanggaard, L. Human thermal response with improved AVA modeling of the digits. Int. J. Therm. Sci. 2013, 67, 41–52. [Google Scholar] [CrossRef]
- Rida, M.; Karaki, W.; Ghaddar, N.; Ghali, K.; Hoballah, J. A new mathematical model to simulate AVA cold-induced vasodilation reaction to local cooling. Int. J. Biometeorol. 2014, 58, 1905–1918. [Google Scholar] [CrossRef] [PubMed]
- Lewis, T. Observations upon the reactions of the vessels of the human skin to cold. Heart 1930, 15, 177–208. [Google Scholar]
- Daanen, H.A.M. Finger cold-induced vasodilation: A review. Eur. J. Appl. Physiol. 2003, 89, 411–426. [Google Scholar] [CrossRef] [PubMed]
- Teichner, W.H. Individual Thermal and Behavioral Factors in Cold-Induced Vasodilation. Psychophysiology 1966, 2, 295–304. [Google Scholar] [CrossRef]
- Bergersen, T.K.; Hisdal, J.; Walløe, L. Perfusion of the human finger during cold-induced vasodilatation. Am. J. Physiol. 1999, 276, R731–R737. [Google Scholar] [CrossRef] [PubMed]
- Lee, J.Y.; Bakri, I.; Matsuo, A.; Tochihara, Y. Cold-induced vasodilation and vasoconstriction in the finger of tropical and temperate indigenes. J. Therm. Biol. 2013, 38, 70–78. [Google Scholar] [CrossRef]
- Cheung, S.S.; Daanen, H.A.M. Dynamic Adaptation of the Peripheral Circulation to Cold Exposure. Microcirculation 2012, 19, 65–77. [Google Scholar] [CrossRef]
- Youssef, A.; D’Haene, M.; Vleugels, J.; de Bruyne, G.; Aerts, J.-M. Localised Model-Based Active Controlling of Blood Flow During Chemotherapy to Prevent Nail Toxicity and Onycholysis. J. Med. Biol. Eng. 2018, 39, 139–150. [Google Scholar] [CrossRef]
- Bladt, L.; De Clercq, J.; Janssens, T.; Van Hulle, J.; Vleugels, J.; Aerts, J.M.; De Bruyne, G. Cold-induced vasoconstriction for preventing onycholysis during cancer treatment. Extrem. Physiol. Med. 2015, 4, A60. [Google Scholar] [CrossRef]
- Steckel, J.; Goethijn, F.; de Bruyne, G. A research platform using active local cooling directed at minimizing the blood flow in human fingers. In Proceedings of the 7th International Conference on Pervasive Computing Technologies for Healthcare and Workshops, Venice, Italy, 5–8 May 2013; pp. 81–84. [Google Scholar]
- Aerts, J.M.; Berckmans, D.; Saevels, P.; Decuypere, E.; Buyse, J. Modelling the static and dynamic responses of total heat production of broiler chickens to step changes in air temperature and light intensity. Br. Poult. Sci. 2000, 41, 651–659. [Google Scholar] [CrossRef]
- Young, P.C. Control and Dynamic Systems: Advances in Theory and Applications; Leondes, C.T., Ed.; New Academic Press Inc Elsevier Science: New York, NY, USA, 1989. [Google Scholar]
- Young, P.C. Data-based mechanistic modelling of environmental, ecological, economic and engineering systems. Environ. Model. Softw. 1998, 13, 105–122. [Google Scholar] [CrossRef]
- Youssef, A.; Dekock, J.; Ozcan, S.E.; Berckmans, D. Data-Based Approach to Model the Dynamic Behaviour of Greenhouse Temperature. Acta Hortic. 2011, 893, 931–938. [Google Scholar] [CrossRef]
- Youssef, A.; Exadaktylos, V.; Berckmans, D. Modelling and quantification of the thermoregulatory responses of the developing avian embryo: Electrical analogies of a physiological system. J. Therm. Biol. 2014, 44, 14–19. [Google Scholar] [CrossRef] [PubMed]
- Youssef, A.; Exadaktylos, V.; Ozcan, S.E.; Berckmans, D. Proportional-Integral-Plus (PIP) Control System for Individual Thermal Zones in a Small Ventilated Space. ASHRAE Trans. 2011, 117, 48–56. [Google Scholar]
- Youssef, A.; Yen, H.; Özcan, S.E.; Berckmans, D. Data-based mechanistic modelling of indoor temperature distributions based on energy input. Energy Build. 2011, 43, 2965–2972. [Google Scholar] [CrossRef]
- Young, P.C.; Jakeman, A. Refined instrumental variable methods of recursive time-series analysis Part III. Extensions. Int. J. Control 1980, 31, 741–764. [Google Scholar] [CrossRef]
- Young, P.C. Recursive Estimation and Time-Series Analysis: An Introduction for the Student and Practitioner; Springer: Heidelberg, Berlin, 2011. [Google Scholar]
- Young, P.C.; Chotai, A.; Tych, W. Identification, Estimation and Control of Continuous-Time Systems Described by Delta Operator Models; Kluwer Academic Publishers: Dordrecht, the Netherlands, 1991. [Google Scholar]
- Tansey, E.A.; Johnson, C.D. Recent advances in thermoregulation. Adv. Physiol. Educ. 2015, 39, 139–148. [Google Scholar] [CrossRef]
- Lienhard, J.H. A Heat Transfer Textbook; Phlogiston Press: Cambridge, MA, USA, 2001. [Google Scholar]
- Yamazaki, F.; Sone, R.; Zhao, K.; Alvarez, G.E.; Kosiba, W.A.; Johnson, J.M. Rate dependency and role of nitric oxide in the vascular response to direct cooling in human skin. J. Appl. Physiol. 2006, 100, 42–50. [Google Scholar] [CrossRef] [Green Version]
- Johnson, J.M.; Yen, T.C.; Zhao, K.; Kosiba, W.A. Sympathetic, sensory, and nonneuronal contributions to the cutaneous vasoconstrictor response to local cooling. Am. J. Physiol. Circ. Physiol. 2005, 288, H1573–H1579. [Google Scholar] [CrossRef] [Green Version]
- Nuzzaci, G.; Evangelisti, A.; Righi, D.; Giannico, G.; Nuzzaci, I. Is There Any Relationship between Cold-Induced Vasodilatation and Vasomotion? Microvasc. Res. 1999, 57, 1–7. [Google Scholar] [CrossRef]
- Sheppard, L.W.; Vuksanović, V.; McClintock, P.V.E.; Stefanovska, A. Oscillatory dynamics of vasoconstriction and vasodilation identified by time-localized phase coherence. Phys. Med. Biol. 2011, 56, 3583–3601. [Google Scholar] [CrossRef] [PubMed] [Green Version]
- Kellogg, D.L. In vivo mechanisms of cutaneous vasodilation and vasoconstriction in humans during thermoregulatory challenges. J. Appl. Physiol. 2006, 100, 1709–1718. [Google Scholar] [CrossRef] [PubMed]
- Johnson, J.M.; Minson, C.T.; Kellogg, D.L. Cutaneous vasodilator and vasoconstrictor mechanisms in temperature regulation. Compr. Physiol. 2014, 4, 33–89. [Google Scholar] [PubMed]
- Castellani, J.W.; O’Brien, C. Peripheral Vasodilation Responses to Prevent Local Cold Injuries. In Prevention of Cold Injuries; RTO: Neuilly-sur-Seine, France, 2005; pp. KN2-1–K2-14. [Google Scholar]
- Pérgola, P.E.; Kellogg, D.L.; Johnson, J.M.; Kosiba, W.A.; Solomon, D.E. Role of sympathetic nerves in the vascular effects of local temperature in human forearm skin. Am. J. Physiol. 1993, 265, H785–H792. [Google Scholar] [CrossRef] [PubMed]
- Sendowski, I.; Sarourey, G.; Besnard, Y.; Bittel, J. Cold induced vasodilatation and cardiovascular responses in humans during cold water immersion of various upper limb areas. Eur. J. Appl. Physiol. Occup. Physiol. 1997, 75, 471–477. [Google Scholar] [CrossRef]
- Keramidas, M.E.; Musizza, B.; Kounalakis, S.N.; Mekjavic, I.B. Enhancement of the finger cold-induced vasodilation response with exercise training. Eur. J. Appl. Physiol. 2010, 109, 133–140. [Google Scholar] [CrossRef]
- Flouris, A.D.; Westwood, D.A.; Mekjavic, I.B.; Cheung, S.S. Effect of body temperature on cold induced vasodilation. Eur. J. Appl. Physiol. 2008, 104, 491–499. [Google Scholar] [CrossRef]
- Flouris, A.D.; Cheung, S.S. Thermal Basis of Finger Blood Flow Adaptations During Abrupt Perturbations in Thermal Homeostasis. Microcirculation 2011, 18, 56–62. [Google Scholar] [CrossRef]
- Flouris, A.D.; Cheung, S.S. Influence of thermal balance on cold-induced vasodilation. J. Appl. Physiol. 2009, 106, 1264–1271. [Google Scholar] [CrossRef] [Green Version]
- Daanen, H.A.; Ducharme, M.B. Finger cold-induced vasodilation during mild hypothermia, hyperthermia and at thermoneutrality. Aviat. Space Environ. Med. 1999, 70, 1206–1210. [Google Scholar]
- Mekjavic, I.B.; Dobnikar, U.; Kounalakis, S.N.; Musizza, B.; Cheung, S.S. The trainability and contralateral response of cold-induced vasodilatation in the fingers following repeated cold exposure. Eur. J. Appl. Physiol. 2008, 104, 193–199. [Google Scholar] [CrossRef] [PubMed]
- Ran, C.; Hoon, M.A.; Chen, X. The coding of cutaneous temperature in the spinal cord. Nat. Neurosci. 2016, 19, 1201–1209. [Google Scholar] [CrossRef] [PubMed]
- Vandewauw, I.; Voets, T. Heat is absolute, cold is relative. Nat. Neurosci. 2016, 19, 1188–1189. [Google Scholar] [CrossRef] [PubMed]
- Kobayashi, S. Temperature receptors in cutaneous nerve endings are thermostat molecules that induce thermoregulatory behaviors against thermal load. Temp. (Austin. Tex.) 2015, 2, 346–351. [Google Scholar] [CrossRef] [PubMed] [Green Version]
- Tan, C.L.; Cooke, E.K.; Leib, D.E.; Lin, Y.C.; Daly, G.E.; Zimmerman, C.A.; Knight, Z.A. Warm-Sensitive Neurons that Control Body Temperature. Cell 2016, 167, 47–59. [Google Scholar] [CrossRef] [PubMed]
- Romanovsky, A.A. Thermoregulation: Some concepts have changed. Functional architecture of the thermoregulatory system. Am. J. Physiol. Integr. Comp. Physiol. 2007, 292, R37–R46. [Google Scholar] [CrossRef]
- McAllen, R.M.; Tanaka, M.; Ootsuka, Y.; McKinley, M.J. Multiple thermoregulatory effectors with independent central controls. Eur. J. Appl. Physiol. 2010, 109, 27–33. [Google Scholar] [CrossRef] [PubMed]
- Fealey, R.D. Interoception and autonomic nervous system reflexes thermoregulation. Handb. Clin. Neurol. 2013, 117, 79–88. [Google Scholar]
Figure 1.
Schematic diagram showing the effect of a closed (A) and an open (B) arteriovenous anastomoses on the blood flow during cold-induced vasoconstriction and cold-induced vasodilation, respectively.
Figure 1.
Schematic diagram showing the effect of a closed (A) and an open (B) arteriovenous anastomoses on the blood flow during cold-induced vasoconstriction and cold-induced vasodilation, respectively.
Figure 2.
The iGlove-1-controlled cooling device for the left hand. (1) Peltier cooling elements; (2) NTC temperature sensor to measure the finger skin temperature; (3) one probe of the blood flow Laser Doppler meter.
Figure 2.
The iGlove-1-controlled cooling device for the left hand. (1) Peltier cooling elements; (2) NTC temperature sensor to measure the finger skin temperature; (3) one probe of the blood flow Laser Doppler meter.
Figure 3.
The different set temperature of the Peltier elements for (A) experimental phase (I) and (B) phase (II) of the second set of experiments.
Figure 3.
The different set temperature of the Peltier elements for (A) experimental phase (I) and (B) phase (II) of the second set of experiments.
Figure 4.
A simulation example of the second-order DTF (3) that represents the finger’s temperature response (CIVC reaction) to the step decrease in Peltier element temperature (cooling).
Figure 4.
A simulation example of the second-order DTF (3) that represents the finger’s temperature response (CIVC reaction) to the step decrease in Peltier element temperature (cooling).
Figure 5.
The parallel configuration of the interconnection between the two first-order TFs resulting from the decomposition of the second-order system (Equation (3)).
Figure 5.
The parallel configuration of the interconnection between the two first-order TFs resulting from the decomposition of the second-order system (Equation (3)).
Figure 6.
Schematic representation of the heat transfer between the finger and the Peltier element through three different layers, namely, deep skin layer, surface skin layer and the Peltier’s element. The AVA controls the direct flow between the artery and the surface vein.
Figure 6.
Schematic representation of the heat transfer between the finger and the Peltier element through three different layers, namely, deep skin layer, surface skin layer and the Peltier’s element. The AVA controls the direct flow between the artery and the surface vein.
Figure 7.
Dynamic response of finger skin temperature to step decrease in Peltier’s element temperature from 20 °C to 2 °C, showing an example of the hunting reaction in a test subject.
Figure 7.
Dynamic response of finger skin temperature to step decrease in Peltier’s element temperature from 20 °C to 2 °C, showing an example of the hunting reaction in a test subject.
Figure 8.
Measured and simulated finger skin temperature during the CIVD (upper graph), the dissipated heat rate from the finger and the area-under-the-curve represents the amount of dissipated heat in joules (lower graph).
Figure 8.
Measured and simulated finger skin temperature during the CIVD (upper graph), the dissipated heat rate from the finger and the area-under-the-curve represents the amount of dissipated heat in joules (lower graph).
Figure 9.
The dynamic response (upper graph) of the finger’s temperature (CIVC) to a series of pulses in Peltier’s element temperature (middle graph). Showing the measured and simulated finger’s temperature (upper graph) using a second-order DTF and the model residuals (lower graph).
Figure 9.
The dynamic response (upper graph) of the finger’s temperature (CIVC) to a series of pulses in Peltier’s element temperature (middle graph). Showing the measured and simulated finger’s temperature (upper graph) using a second-order DTF and the model residuals (lower graph).
Figure 10.
Dynamic response of finger skin temperature (upper graph), dissipated heat rate (, middle graph), and first derivative of the dissipated heat rate (, lower graph) to localised continuous cooling obtained from test subject (s5) during the experiment (Exp.2, Phase I).
Figure 10.
Dynamic response of finger skin temperature (upper graph), dissipated heat rate (, middle graph), and first derivative of the dissipated heat rate (, lower graph) to localised continuous cooling obtained from test subject (s5) during the experiment (Exp.2, Phase I).
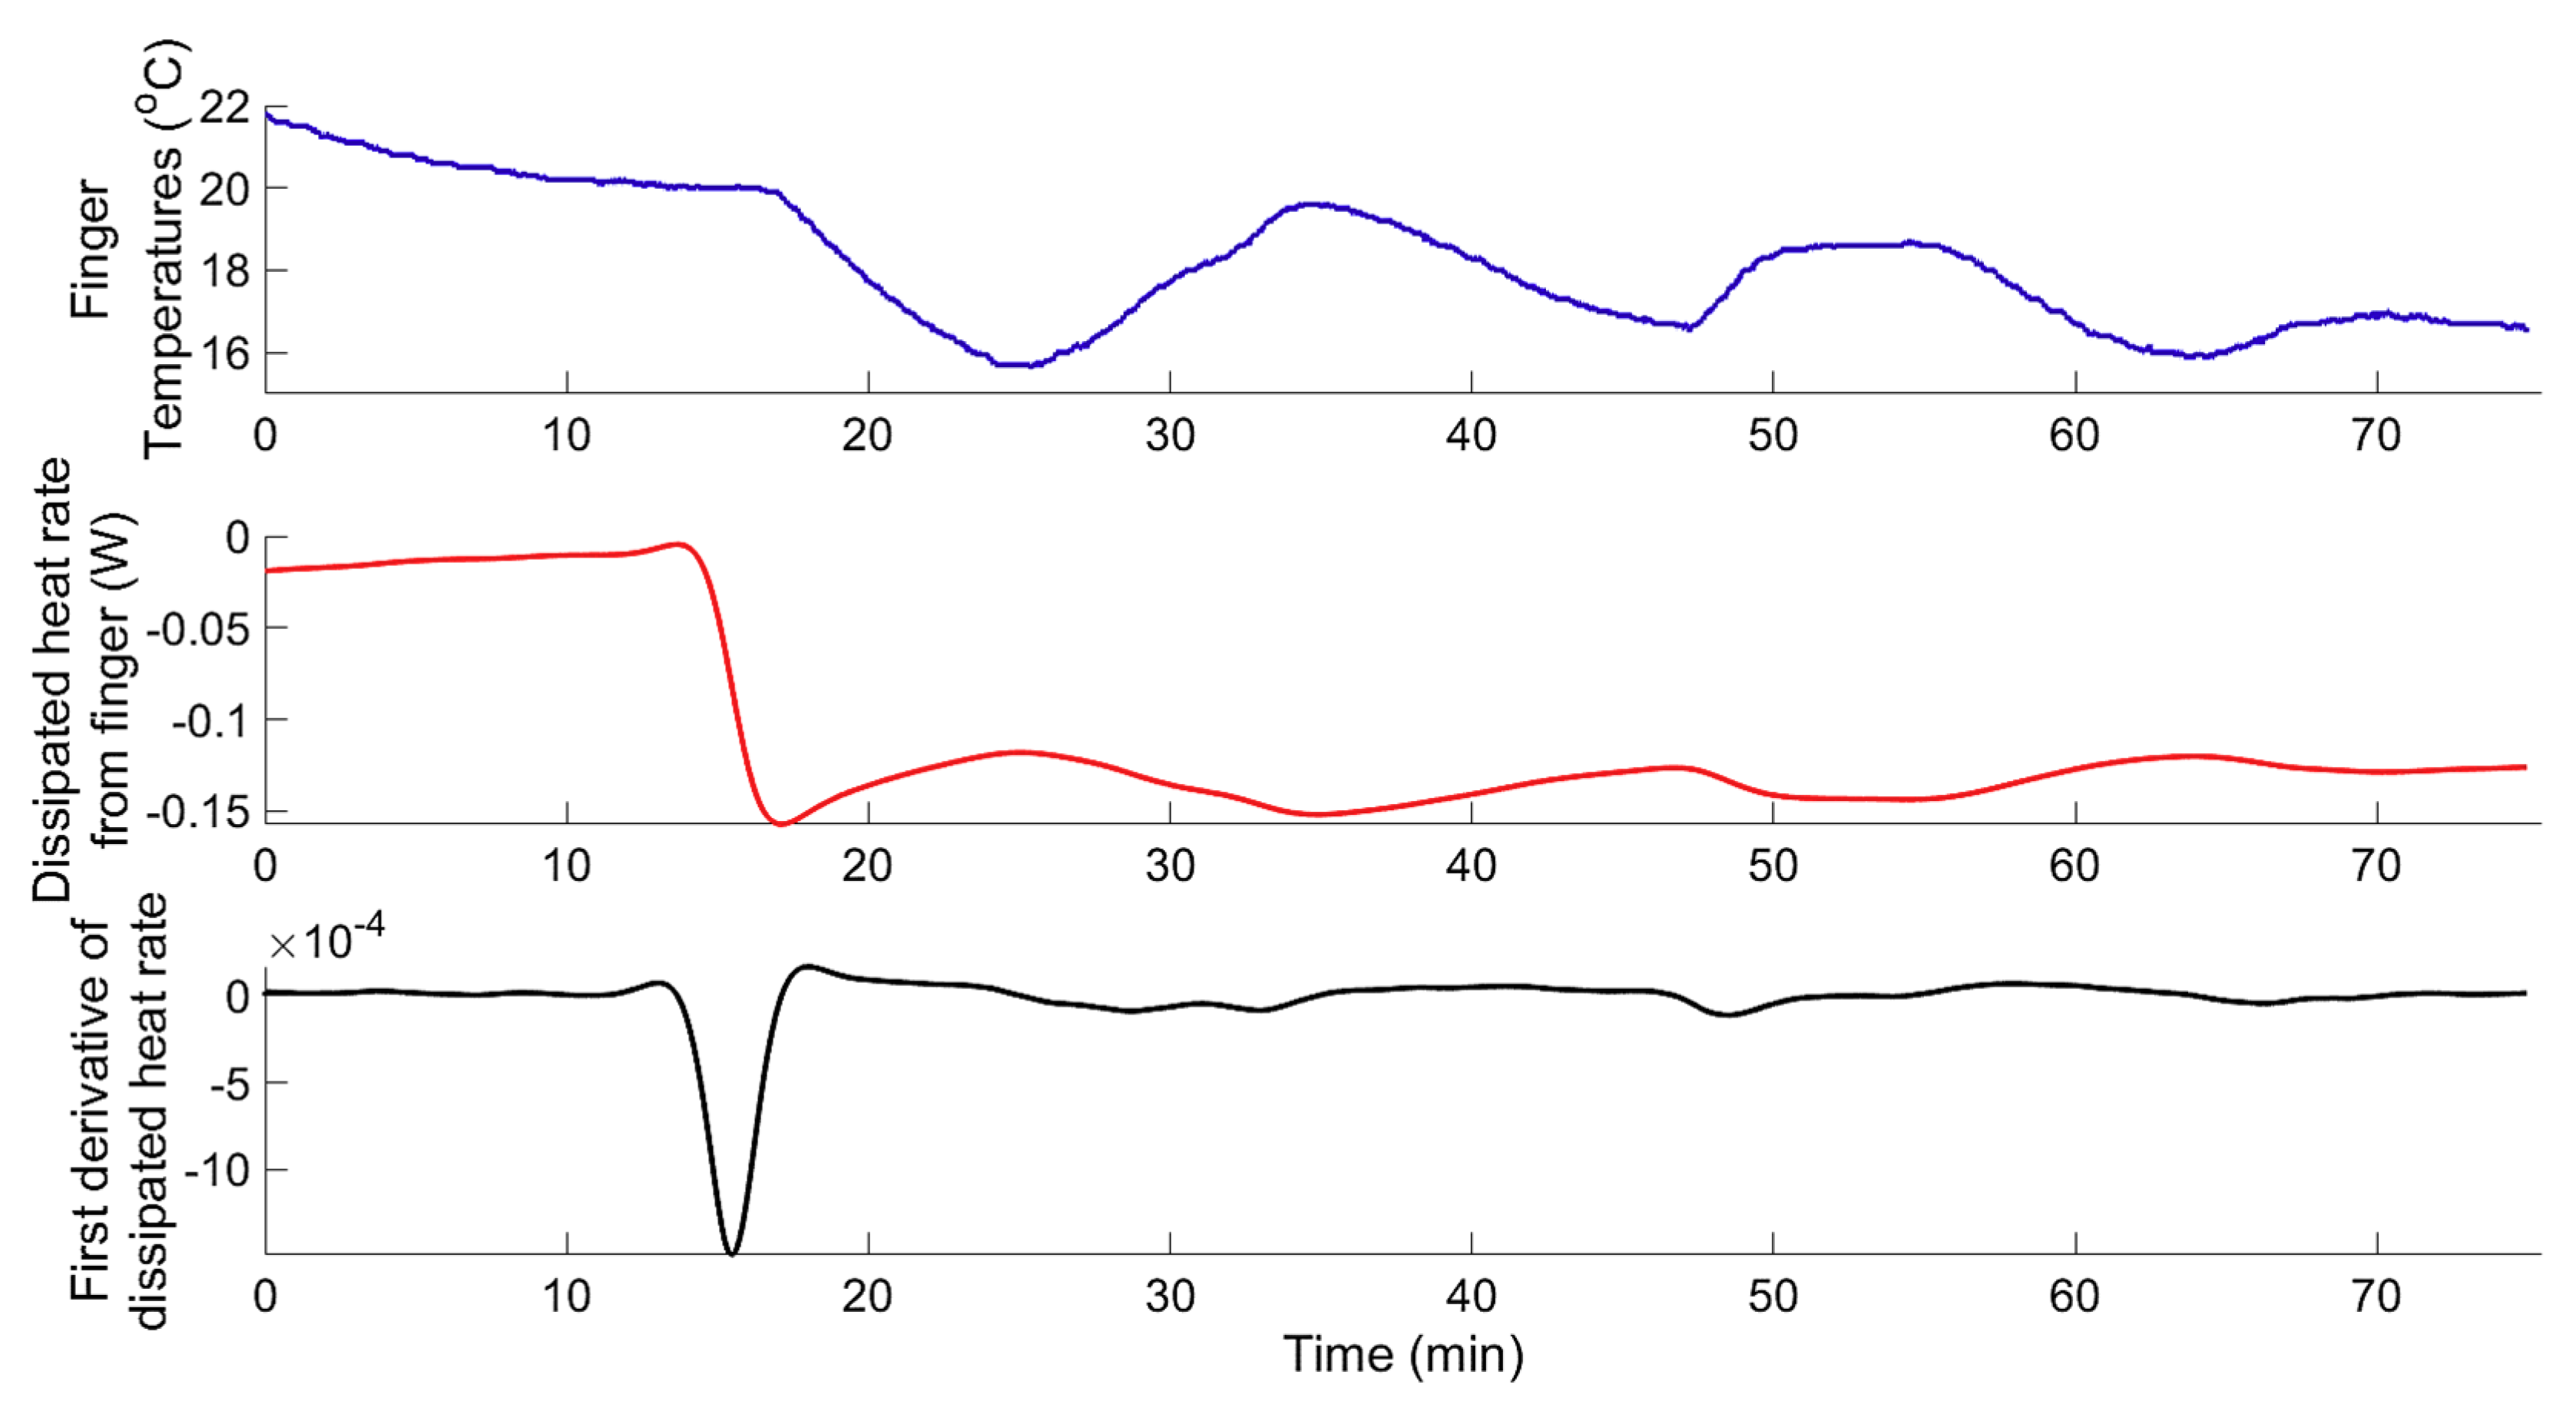
Figure 11.
Dynamic response of finger skin temperature (upper graph), dissipated heat rate (, middle graph), and first derivative of the dissipated heat rate (, lower graph) to localised intermittent cooling obtained from test subject (s5) during the experiment (Exp.2, Phase II).
Figure 11.
Dynamic response of finger skin temperature (upper graph), dissipated heat rate (, middle graph), and first derivative of the dissipated heat rate (, lower graph) to localised intermittent cooling obtained from test subject (s5) during the experiment (Exp.2, Phase II).
Figure 12.
Main hypotheses explaining the hunting reaction (with pathways 1,2 and 3 representing the three proposed hypotheses from literature to explain the initial CIVD).
Figure 12.
Main hypotheses explaining the hunting reaction (with pathways 1,2 and 3 representing the three proposed hypotheses from literature to explain the initial CIVD).
Figure 13.
Flow chart explaining the suggested model of thermoregulatory localised CIVC/CIVD reactions.
Figure 13.
Flow chart explaining the suggested model of thermoregulatory localised CIVC/CIVD reactions.

Table 1.
The number of test subjects participating in each of the conducted sets of experiments, showing the average-age and gender.
Table 1.
The number of test subjects participating in each of the conducted sets of experiments, showing the average-age and gender.
| Experiment | Number of Participants | Age | Gender | |
|---|---|---|---|---|
| M | F | |||
| Exp.1 | 11 | 44.9 (±5.84) | 0 | 11 |
| Exp.2 | 12 | 20.4 (±2.60) | 6 | 6 |
Table 2.
Mean and standard deviation of the calculated time constants, of the decomposed two first-order TF, obtained from all test subjects (33) during the two sets of experiments (Exp.1 and Exp.2, Phase I).
Table 2.
Mean and standard deviation of the calculated time constants, of the decomposed two first-order TF, obtained from all test subjects (33) during the two sets of experiments (Exp.1 and Exp.2, Phase I).
| Mean | 7.34 | 0.73 |
| Standard deviation | 3.2 | 0.56 |
Table 3.
Average and standard deviation of parameter estimates, and of the second-order DTF model describing the CIVD reaction to continuous localised cooling experiments obtained from the test-subjects that shown hunting reaction (i.e., cycles of CIVC/CIVD episodes).
Table 3.
Average and standard deviation of parameter estimates, and of the second-order DTF model describing the CIVD reaction to continuous localised cooling experiments obtained from the test-subjects that shown hunting reaction (i.e., cycles of CIVC/CIVD episodes).
| (min) | |||||||
|---|---|---|---|---|---|---|---|
| −1.989 ±0.005 | 0.980 ±0.002 | 0.0 ±0.0 | −0.0047 ±0.0010 | 0.0045 ±0.0010 | 10.23 ±3.50 | 0.92 ±0.04 | −10.61 ±3.45 |
Table 4.
Mean and standard deviation of the calculated time constants, of the decomposed two first-order TF, obtained from all test subjects with CIVD reaction during the two sets of experiments (Exp.1 and Exp.2, Phase I).
Table 4.
Mean and standard deviation of the calculated time constants, of the decomposed two first-order TF, obtained from all test subjects with CIVD reaction during the two sets of experiments (Exp.1 and Exp.2, Phase I).
| Mean | 7.96 | 0.81 |
| Standard deviation | 4.35 | 0.65 |
Table 5.
Average and standard deviation of parameter estimates, and of the identified second-order DTF model describing the CIVC reaction to the localised intermittent cooling experiment (Exp.2, Phase II).
Table 5.
Average and standard deviation of parameter estimates, and of the identified second-order DTF model describing the CIVC reaction to the localised intermittent cooling experiment (Exp.2, Phase II).
| (min) | |||||||
|---|---|---|---|---|---|---|---|
| −1.987 ±0.006 | 0.987 ±0.001 | 0.0 ±0.0 | −0.0016 ±0.0010 | 0.0018 ±0.0010 | 2.34 ±1.21 | 0.92 ±0.02 | −11.67 ±3.55 |
© 2019 by the authors. Licensee MDPI, Basel, Switzerland. This article is an open access article distributed under the terms and conditions of the Creative Commons Attribution (CC BY) license (http://creativecommons.org/licenses/by/4.0/).
Share and Cite
MDPI and ACS Style
Youssef, A.; Verachtert, A.; De Bruyne, G.; Aerts, J.-M. Reverse Engineering of Thermoregulatory Cold-Induced Vasoconstriction/Vasodilation during Localized Cooling. Appl. Sci. 2019, 9, 3372. https://doi.org/10.3390/app9163372
AMA Style
Youssef A, Verachtert A, De Bruyne G, Aerts J-M. Reverse Engineering of Thermoregulatory Cold-Induced Vasoconstriction/Vasodilation during Localized Cooling. Applied Sciences. 2019; 9(16):3372. https://doi.org/10.3390/app9163372
Chicago/Turabian StyleYoussef, Ali, Anne Verachtert, Guido De Bruyne, and Jean-Marie Aerts. 2019. "Reverse Engineering of Thermoregulatory Cold-Induced Vasoconstriction/Vasodilation during Localized Cooling" Applied Sciences 9, no. 16: 3372. https://doi.org/10.3390/app9163372
Note that from the first issue of 2016, this journal uses article numbers instead of page numbers. See further details here.