Study on Structural Robustness of Isolated Structure Based on Seismic Response


1
College of Civil and Hydraulic Engineering, Ningxia University, Yinchuan 750021, China
2
School of Civil Engineering, North Minzu University, Yinchuan 750021, China
*
Authors to whom correspondence should be addressed.
Appl. Sci. 2018, 8(9), 1686; https://doi.org/10.3390/app8091686
Submission received: 23 August 2018
/
Revised: 13 September 2018
/
Accepted: 14 September 2018
/
Published: 18 September 2018
(This article belongs to the Special Issue Emerging Construction Materials and Sustainable Infrastructure)
Abstract
:The qualitative analysis for structural robustness study subjected to severe earthquakes is unable to meet engineering requirements, and a quantitative analysis method for structural robustness is needed to be proposed. The existing analysis methods, such as Incremental Dynamic Analysis Method and Pushover method, only study the response of the structure directly from the macroscopic view, rather than focusing on the response of a single component on the structure. Especially for the construction of isolated structure, the impact of accidental bearing failure on the isolated structure and the impact of progressive collapse cannot be considered. In this paper, based on the Alternative Load Path Method, the quantitative analysis method for structural robustness analysis under earthquake is proposed. The structural robustness of some different vertical irregular isolated structures under different earthquakes is studied.
1. Introduction
Structural robustness is used to represent the ability of a structure to resist a progressive collapse due to the accidental loads. How to quantitatively analyze the robustness of the structure has been the focus of the majority of scholars in recent years. The simple and practical quantitative evaluation methods will be widely used and promoted by the engineering field.
A great deal of research has been taken to work out the quantitative evaluation method of structural robustness.
A technique termed ‘pushdown analysis’ [1,2] or ‘pull down analysis’ [3] was used to investigate the robustness of building systems by computing residual capacity of remaining structure. However, due to the particularity of the isolation bearing, the instability problem of rubber isolators can easily occur under large axial pressure, or much large displacement is concentrated at the isolation layer, and therefore, it is difficult to judge its robustness by applying vertical pushing force.
Various quantitative evaluation methods were also proposed. A novel simplified framework for progressive collapse assessment of multi-storey buildings was suggested [4,5]. The associated concepts (redundancy and vulnerability) were discussed and interpreted in the general context of robustness such that the corresponding methodologies can be compared quantitatively using a comparable scale [6]. A methodology is developed and applied to an existing precast industrial building case study, and assumed to be prone to seismic and wind hazards [7]. The dynamic response is described using a basic substructure instead of a global frame that loses a column, and a simplified model is finally developed for the prediction of the considered system’s dynamic response [8]. A new robustness definition with several robustness indicators and a framework are proposed to define more accurately the structural robustness concept of corroded reinforced concrete structures [9]. A reliability-based framework for quantifying structural robustness considering the occurrence of a major earthquake and subsequent cascading hazard events is proposed [10]. An experimental asymmetrical two-storey reduced-scale reinforced masonry shear walls (RMSW) building is tested to failure under simulated seismic loading, and the robustness indexes quantified for five key robustness indicators (drift ratio, strength, stiffness, strain energy, and residual drift ratio) can provide a means by which the system-level performance of RMSW buildings can be measured [11]. A quantitative analysis method of structural robustness is proposed based on mechanical characteristics of frame structure under earthquake, and the correctness and practicability of the method were verified with an example [12]. By using the developed pushdown methods, the reserve load carrying capacity of the damaged structure is evaluated; the robustness for resisting progressive collapse of the damaged structure is quantitatively assessed [13]. The influence of different plastic hinge models on the structural nonlinear behavior of reinforced concrete structures is studied by using different methods [14,15]. The effectiveness and robustness of a pounding tuned mass damper for vibration suppression of a submerged cylindrical pipe is studied by doing experiments [16,17]. To examine a structure in terms of its robustness, basics for the development of measures to quantify structural robustness are formulated, and a quantitative description of the robustness is proposed [18].
Some other scholars try to use other means to enhance the robustness of the structure [19,20,21], but whether the robustness of the original structure is really enhanced or not, and the extent of structural robustness enhancement are both difficult to evaluate and measure.
There are many methods for structural robustness evaluations, but they are difficult to meet the engineering requirements [22,23,24,25], because of the complex computation process and lack of practicability. Therefore, it is urgent to establish quantitative analysis indexes and methods of structural robustness. The existing common analytical methods, such as Incremental Dynamic Analysis Method and Pushover Method analyze the overall structure from the macro point of view directly, without focusing on individual components of the response and its failure on the overall structure of adverse effects. Both the Department of Defense (DoD) (2005) [23] and the General Services Administration (GSA) (2003) [26] employ the Alternate Path Method to resist progressive collapse of building structures. It does not need to consider the type of triggering event when the Alternate Path Method is used, so the methodology is always applied to the models with some columns removed. In order to evaluate the structural robustness quantitatively, this paper starts with the damage risk and importance degree of individual components, associating the damage of the members with the collapse of the whole structure. The typical structures collapse mode-vertical progressive collapse is analyzed. The corresponding quantitative analysis method of vertical collapse resistance robustness is put forward, and the method is applied to different vertical irregular base isolation structure models. The structural robustness of the rubber isolation bearing failure is analyzed.
2. Quantitative Evaluation Method of Structural Collapse Robustness
In this paper, the quantitative evaluation method of structural robustness under earthquake is proposed, based on the component importance coefficient and the component vulnerability coefficient. The component importance coefficient, the component vulnerability coefficient, and the robustness coefficient of the structure are obtained by the two coefficients, and the robustness of the structure is quantitatively evaluated.
2.1. Component Importance Coefficient
The component importance coefficient is used to reflect the degree of influence of the loss of bearing capacity of individual members on the bearing capacity of the original structure under extreme conditions, and the determination of component importance coefficient is the basis for calculating the structural robustness coefficient.
Without consideration of horizontal loads such as wind and earthquake, this study considers the coupling effects of various loads during structural collapse. Therefore, the degree of influence of the failure of the column under the coupling action and the failure of the rubber isolation bearing on the total energy distribution of the structure is taken as the evaluation index of the importance coefficient. The concrete calculation method is expressed as:
where is the component importance coefficient; Which is used to show the effect of the failure of i-th frame column on the total strain energy of the structure; is the stiffness matrix of the i-th frame column; and are the displacement vectors of the i-th frame column before and after initial failure.
The Element Stiffness Matrix of the i-th Bottom Column:
Since the bottom end of the column is connected with the foundation, the displacements generated at the bottom end of the column before and after the failure are too small to be compared with the displacement of the top end, and so the displacement vector of the bottom end node can be written as:
Substituting Equation (4) into Equation (2), a formula to calculate the contribution of the base column to the total energy distribution of the structure is obtained:
2.2. Component Vulnerability Coefficient
The existing studies are mainly aimed at studying the vulnerability of the entire structure under severe earthquakes. Structural vulnerability not only depends on the layout of the structure, the performance of building materials, but also depends on the strength of the key components of the structure.
Compared with structural vulnerability, component vulnerability is used to reflect the probability of failure of components under external loadings. For a single member, if the load effect caused by a certain load is significantly less than the resistance of the component, the damage risk of the component under this loading is relatively low, the component vulnerability coefficient is also small; on the other side, this load increases the risk of damage to the component is large, and the corresponding vulnerability coefficient is greater.
In the process of structural collapse, the axial force, shear force and bending moment load also appear together. Considering that the proposed method is too sensitive to the variation of the variables, the corresponding improvements are made. The damage coefficient is calculated as follows:
where each coefficient shown in Equation (7) can be calculated as:
where , and are the shear force, bending moment and axial force respectively.
and are the ultimate load-carrying capacity of the normal section and the ultimate load-carrying capacity of the axial compression under pure pressure, respectively, when the element is purely bent. The calculation method is shown in Equation (8):
is the shearing capacity of oblique section of pure shears, and the calculation method is based on the relationship between shear force and external load. The concrete calculation is shown in Equations (9) and (10). In general, the shear capacity is calculated according to Equation (9). When the members are subjected to concentrated loads, or subjected to complex loads but the shearing force caused by the concentrated load at the bearing portion is more than 75% of the total shear value, the shear bearing capacity of the member can be calculated according to Equation (10):
In the bottom frame, when a frame column loses its bearing capacity, the adjacent frame column is changed from the original axial compression state to the eccentric compression state. When the longitudinal reinforcement of the tension zone is produced, the calculation methods of ultimate load-carrying capacity and ultimate load-carrying capacity are shown in Equations (11) and (12), respectively:
where and are the axial compressive strength and the axial tensile strength, respectively; and are the tensile strength of longitudinal reinforcement and stirrup; is the total cross-sectional area of stirrups in the same section; is the cross-section effective height; is the section width; is the relative height of the compression zone of the section.
2.3. Structural Robustness Coefficient
The component vulnerability coefficient reflects the damage risk of structural members under load, while the component importance coefficient reflects the effect of different component failure on the original structure response. The two are not necessarily related to each other, but they are different from the focus of the performance of the structure and the link between the components. Therefore, when evaluation of the robustness of the structure of the two together is considered, the evaluation of the structural robustness is also considered. Based on this idea, a quantitative evaluation method of structural robustness was proposed which comprehensively considers the vulnerability coefficient and importance coefficient of components. However, the robustness calculation method is easily affected by the small variation of the variables; therefore, a further simplification is considered in this paper:
where is structural robustness coefficient; and are the vulnerability coefficient and the importance coefficient respectively; is the entire number of components to be analyzed. According to the above analysis, it can be seen that when the structure is under heavy loading, the vulnerability coefficient of each component is small, which means the component is not easily destroyed, and the importance coefficient of the corresponding component is also small, which means the damage of the component to the whole structure and the robustness of the entire structure under heavy loading will be strengthened, and the probability of the failure of the structure will be reduced.
3. Model Analysis of Vertical Irregular Structure
3.1. Model Design
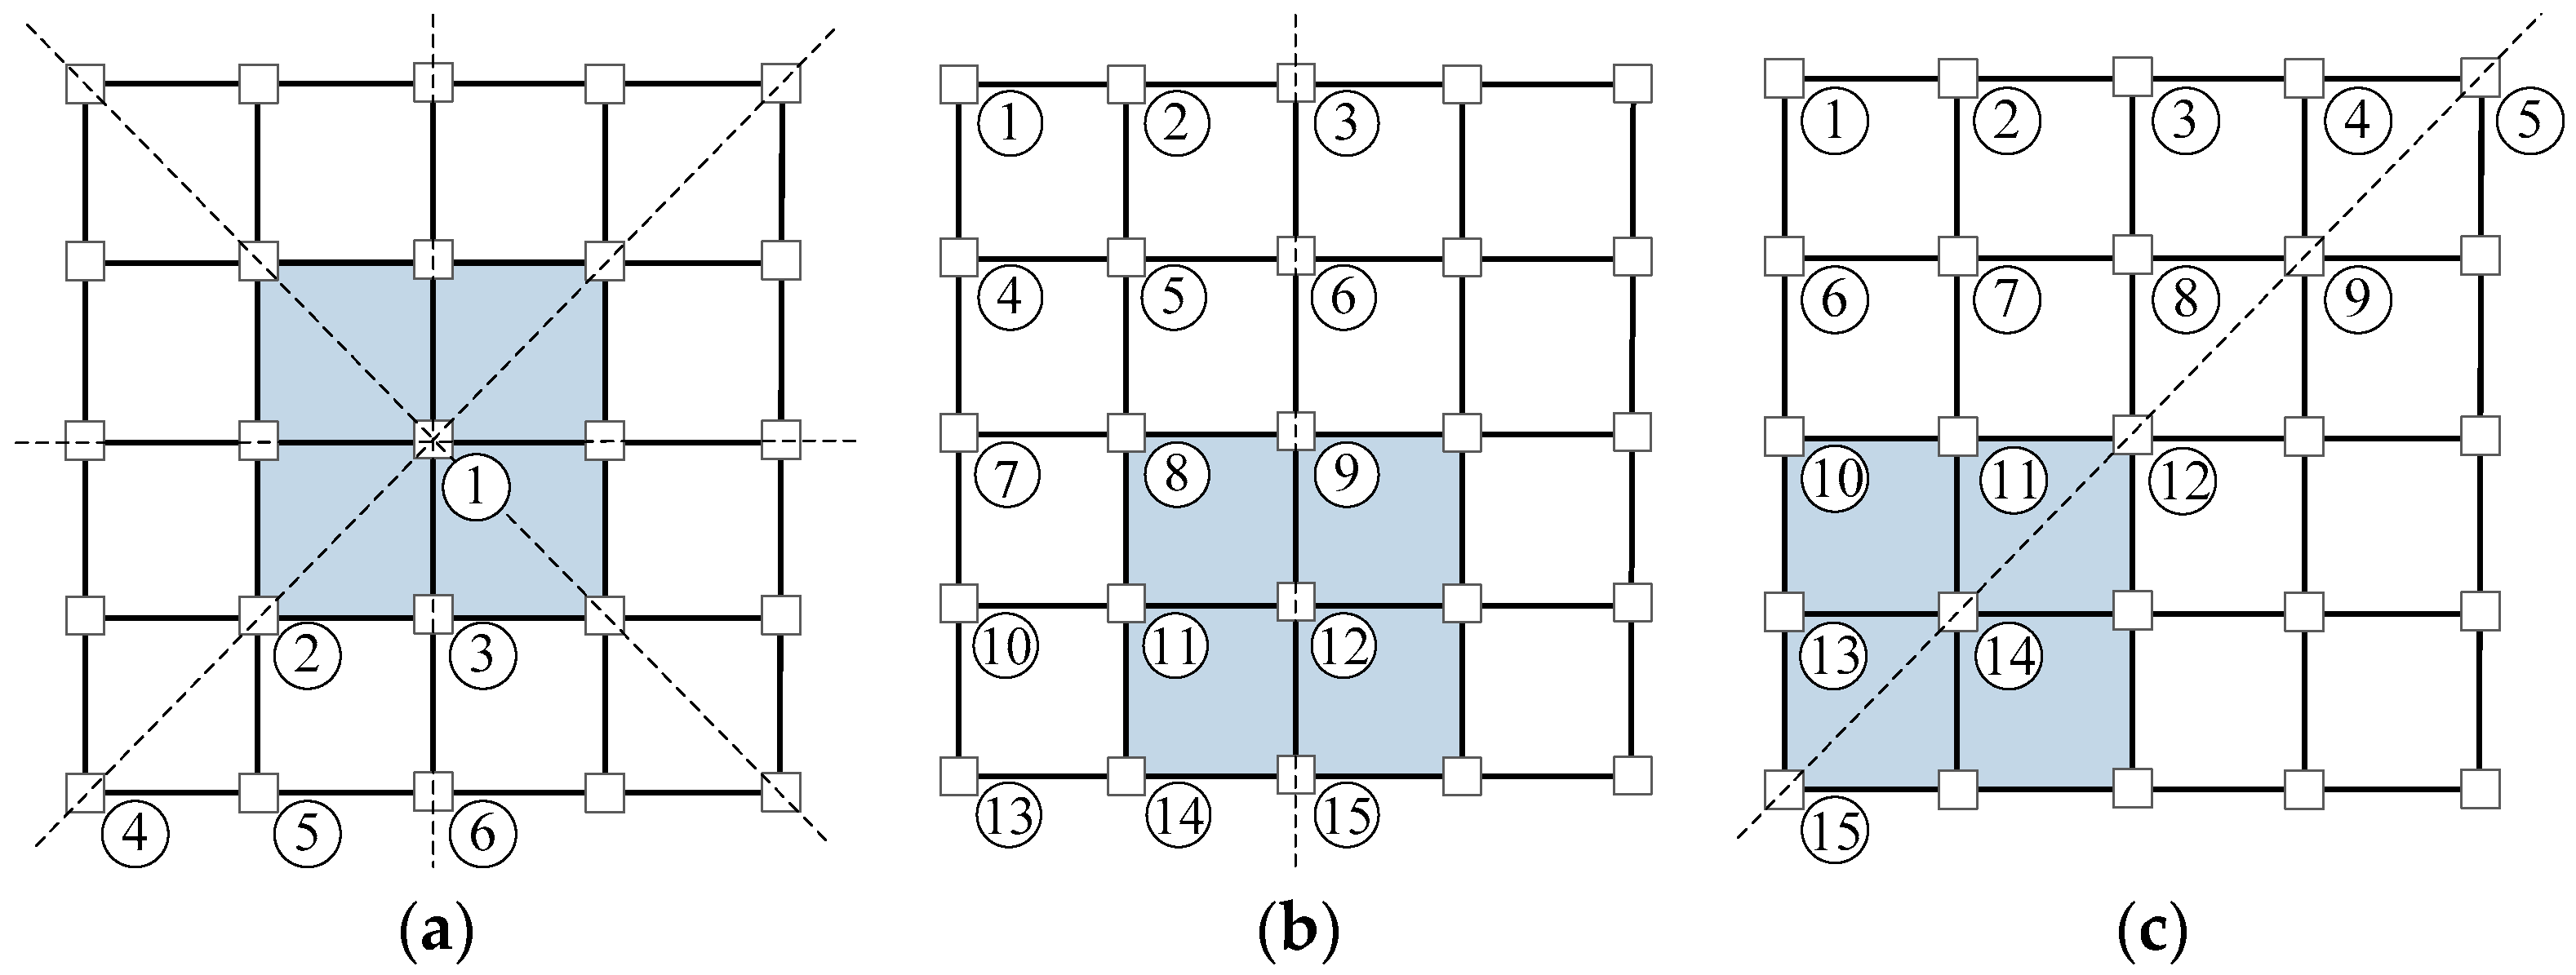
Based on the difference of the relative position of the upper tower and the lower podium, three typical models of the vertical irregular irregularities are designed, which are model A, Model B and Model C, respectively. Model podium and tower are three layers, podium and tower are 4 spans and 2 spans. The column spacing is 6 m. The bottom layer is 3.6 m high, and the rest layers are all 3.3 m high. We adopt C30 concrete and HRB400 to construct beams, columns and reinforced longitudinal members. The frame-column section of the 1st–3rd floor of the tower is 550 mm × 550 mm, the other columns of the frame is 500 mm × 500 mm, the frame beam is 550 mm × 300 mm, seismic isolation beam for the 650 mm × 300 mm. The 3D plots of structures and structural plane information are shown in Figure 1 and Figure 2, respectively, the shaded area in the figure is used to indicate the location of the upper tower.
To study the structure robustness to against progressive collapse of the bottom frame column and isolation bearing after failure, the analysis object needs to include all the bottom frame columns and all the isolation bearings, but considering the symmetry of the model plane layout, in order to avoid double counting, the model is simplified in terms of the symmetry characteristic: the model A is a plane bidirectional symmetry model, and the original structure is divided into 8 symmetrical axes Parameters of the same part to analyze; Model B is a plane symmetric model, which is divided into two parts with the same parameters by the symmetry axis, and part of them is studied. The model C is symmetrically distributed along its plane diagonally across all conditions, as well as only part of its model. The initial failure cases of bottom columns and isolation bearing are numbered, as shown in Figure 3.
3.2. Base Isolated Structure Model Design
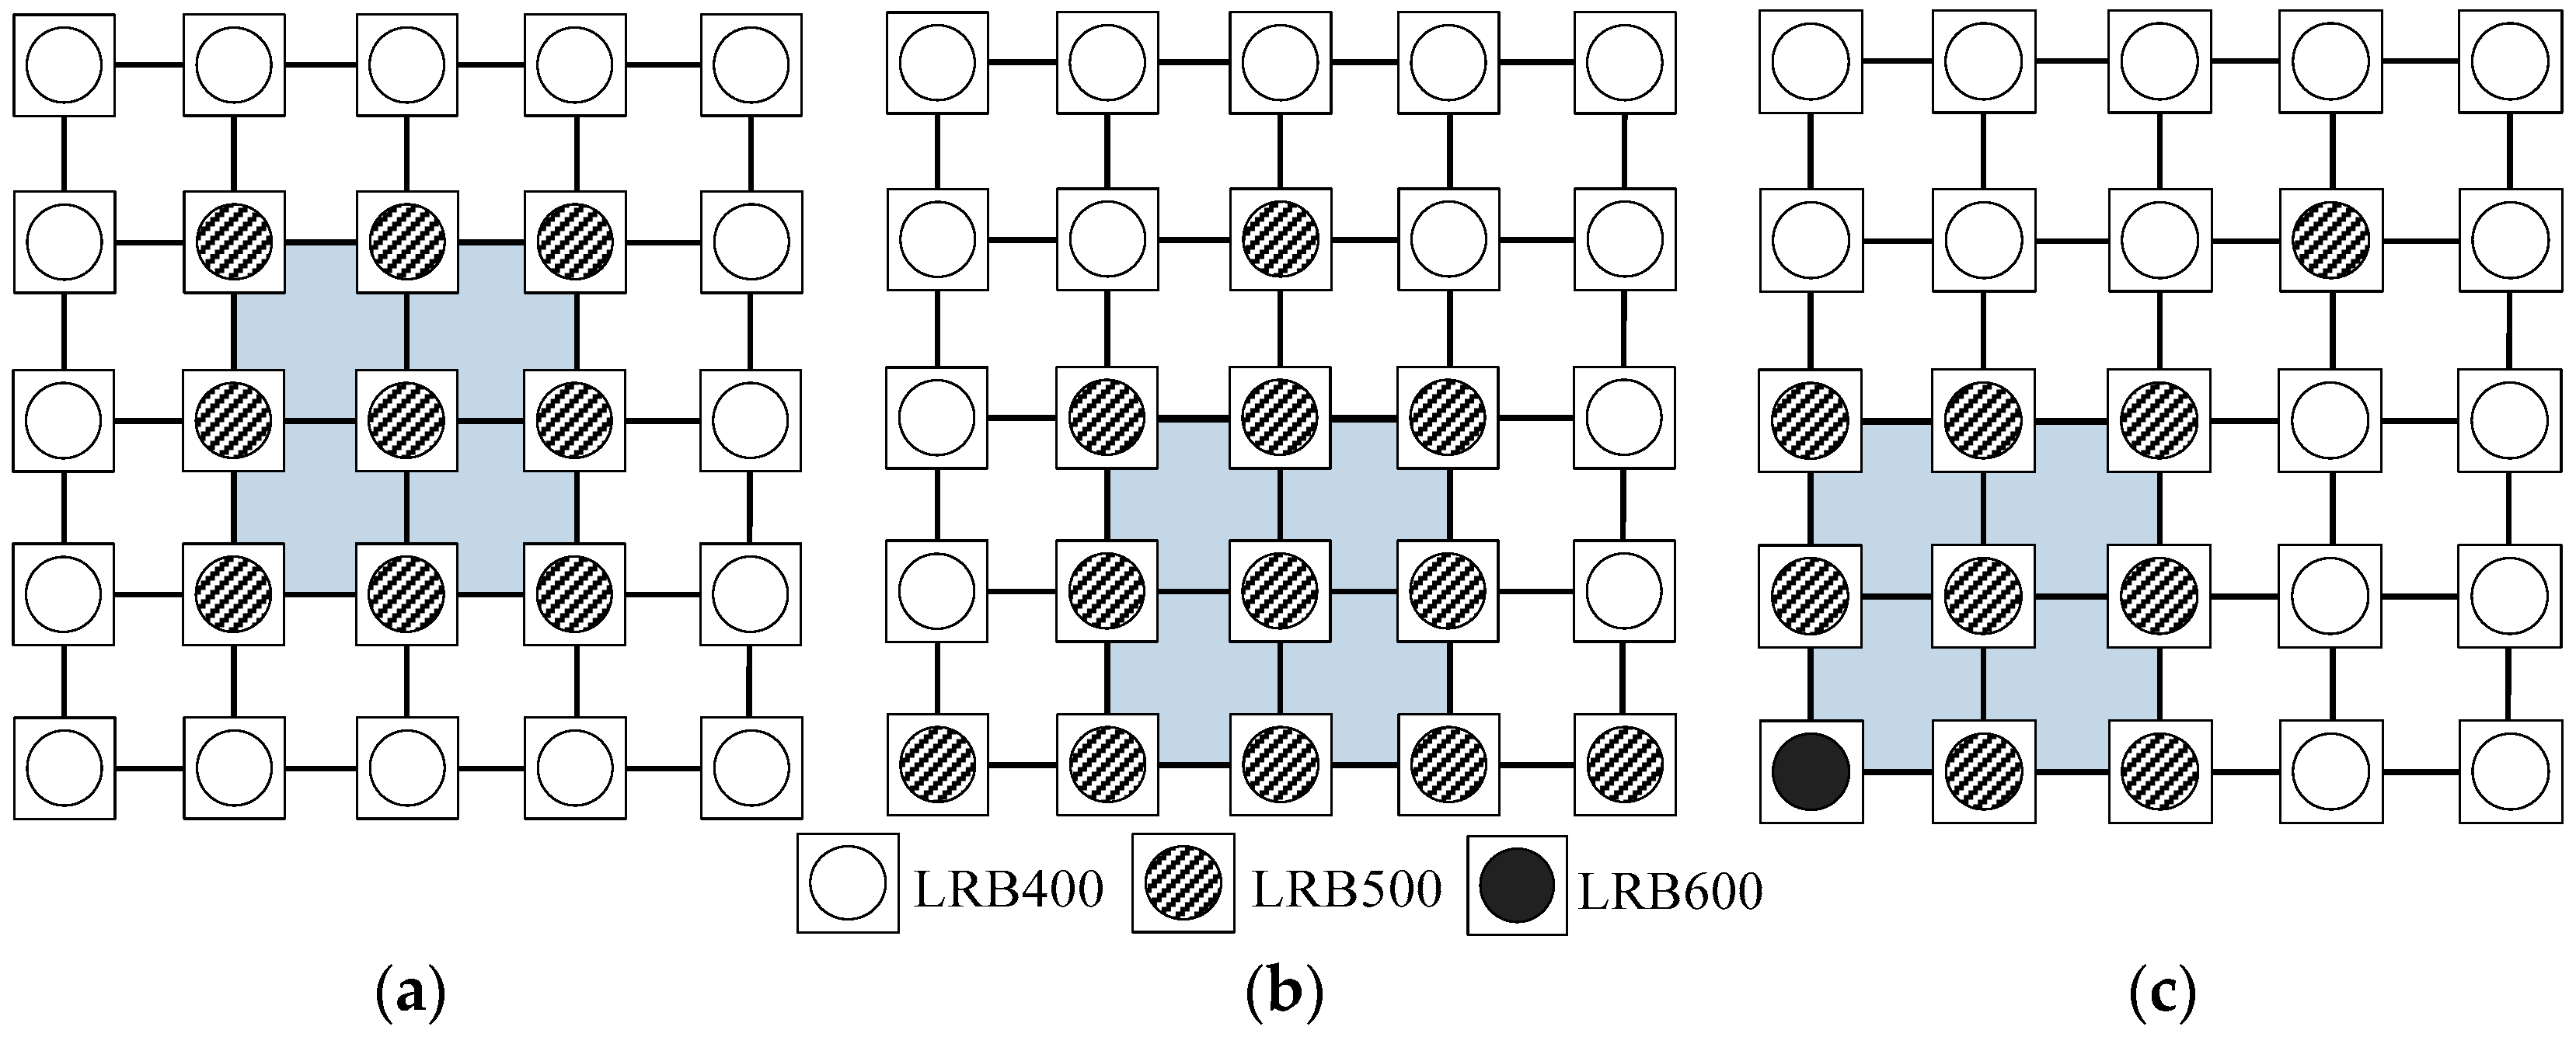
Because the model is the base isolation structure, special seismic isolation design is needed to select the appropriate type of isolation bearing, and to determine the rational form of isolation bearing layout. The layout of the seismic isolation bearings is shown in Figure 2. The rubber isolation bearing pressure stress limit is 12 MPa, the specific parameters of the bearing are summarized in Table 1.
When the stiffness center of the isolation layer does not coincide with that of the upper structure, it is necessary to consider the torsional coupling effect of the structure. The severe torsional effect can also cause damage to the bearing away from the center and even endanger the safety of the whole structure. The results show that, regardless of whether the center of the upper structure deviates from the center of mass, as long as the isolation center coincides with the center of gravity of the upper structure, it can no longer pay much attention to the torsion effect of the isolation layer. Therefore, controlling the eccentricity of isolation structure is also an important link in the design of isolation structure. The eccentricity of three kinds of vertical irregularly isolated structures is calculated respectively, as shown in Table 2.
It can be seen from Table 2 that the eccentricity ratios of the three models are small in both directions. It is indicated that the center of the isolation structure coincides with the center of the upper structure, and the structure will not show significant tensional coupling effects under the horizontal earthquake. Therefore, the bearing layout is reasonable.
3.3. Finite Element Model
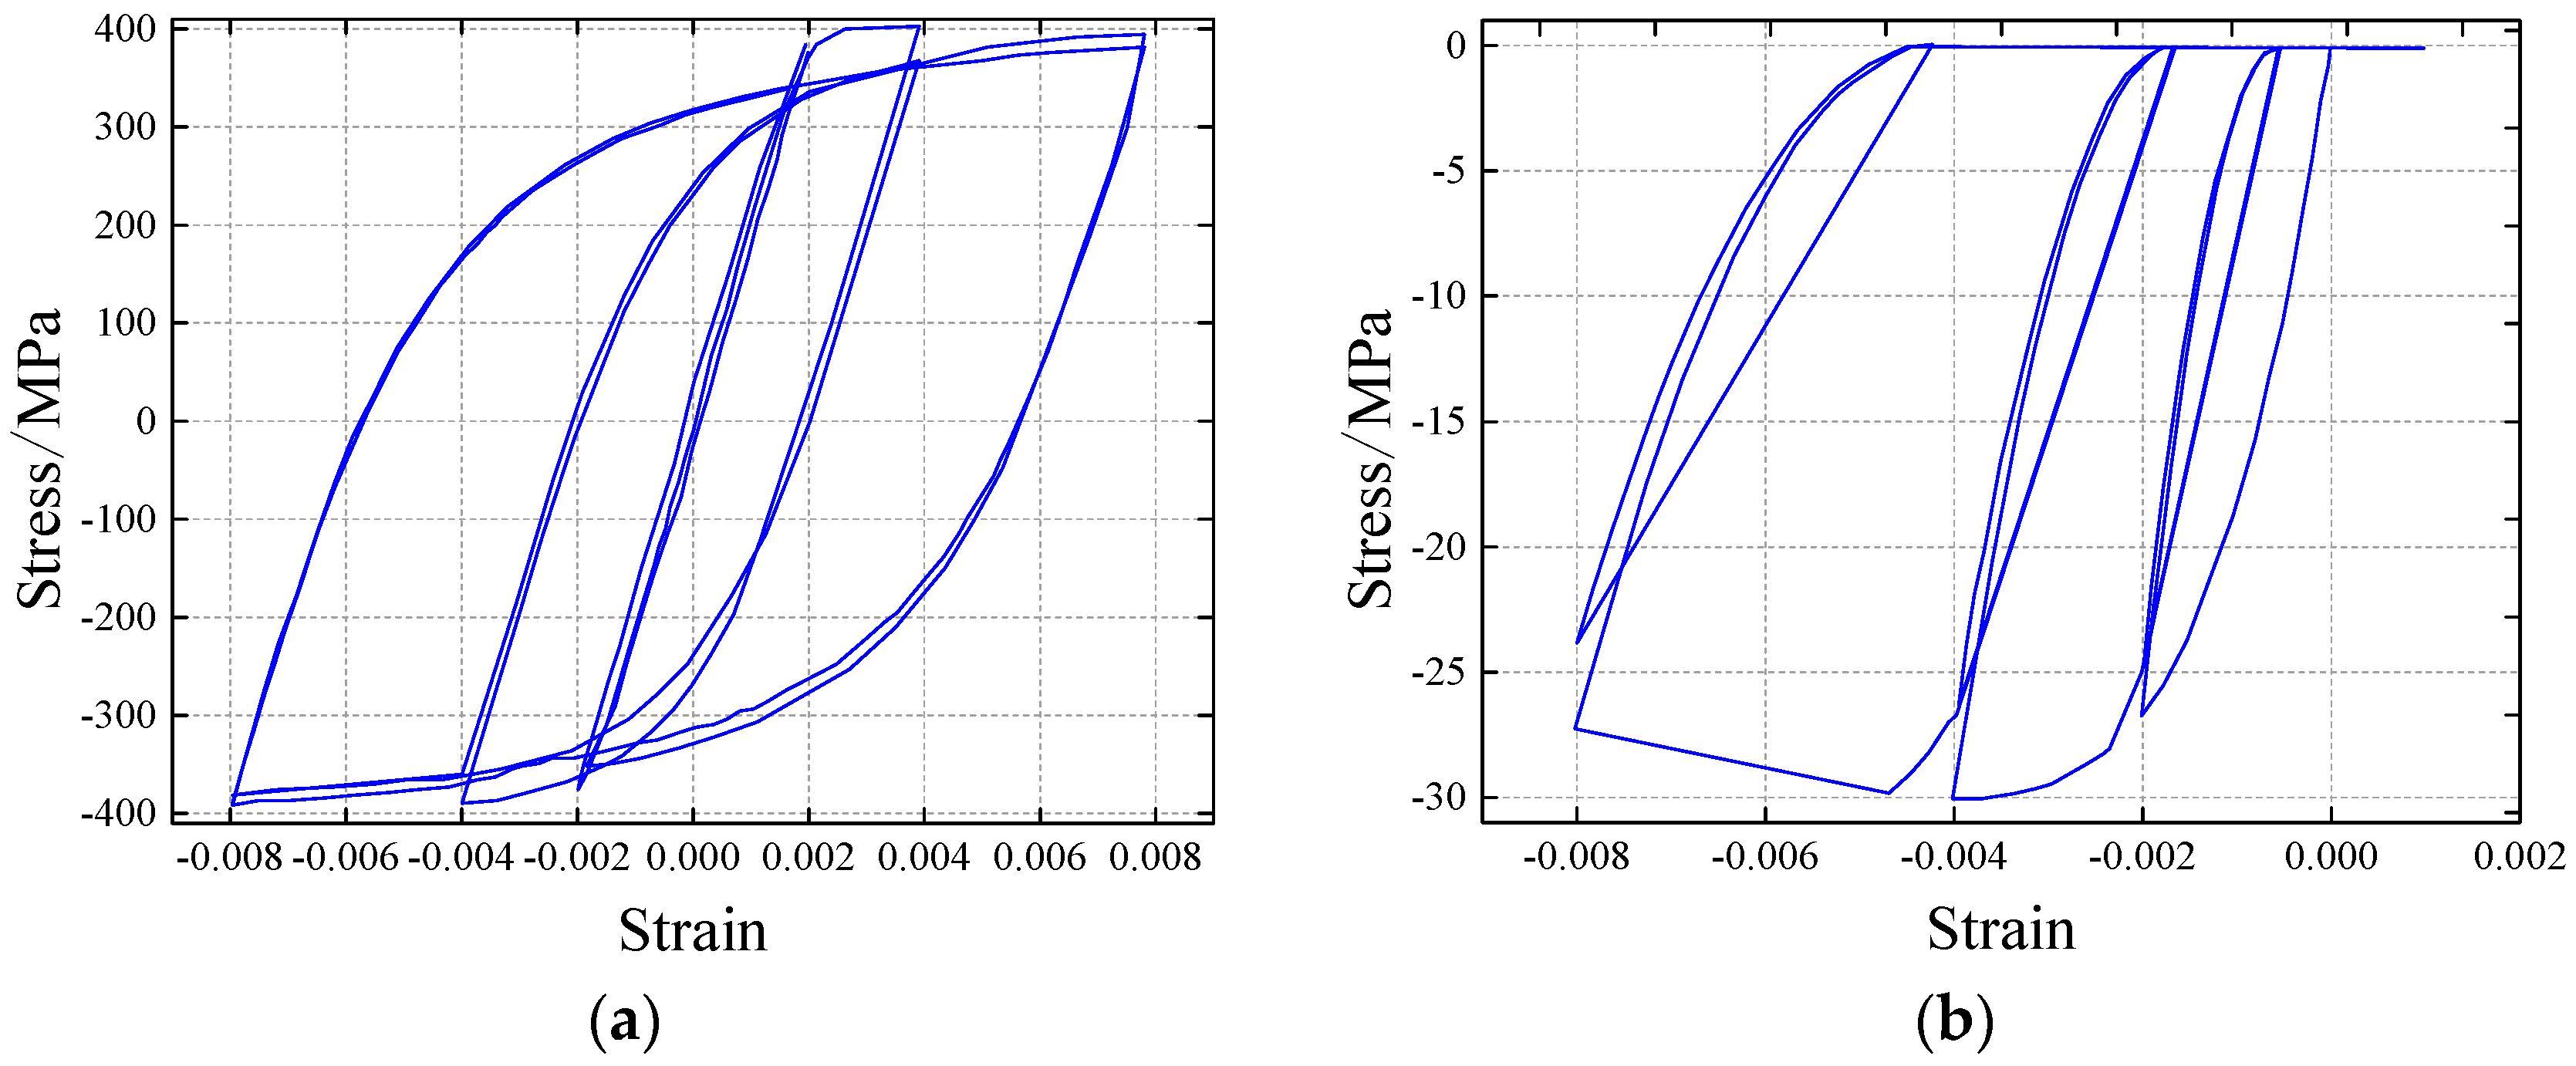
The finite element models were established by using the software SeismoStruct [27]. The accuracy and efficiency of the software were both high and non-linear, and the calculated data could be monitored in real-time during the whole processing. In this section, the Mander concrete model and the Menegotto–Pinto model [27] are used to simulate the concrete and the steel bar, respectively. The stress–strain curves are shown in Figure 4. The bilinear follow-up model is used to simulated lead-rubber isolating bearings, the force-displacement loop is shown in Figure 5.
In the SeismoStruct software, the so-called fiber approach to represent the cross-section behavior is used, where each fiber is associated with a uniaxial stress–strain relationship. The sectional stress–strain state of beam-column elements is then obtained through the integration of the nonlinear uniaxial stress–strain response of the individual fibers in which the section has been subdivided. Distributed inelasticity frame elements can be implemented with two different finite elements (FE) formulations: the classical displacement-based (DB) ones, and the more recent force-based (FB) formulations. In a DB approach the displacement field is imposed, meanwhile in a FB element equilibrium is strictly satisfied and no restraints are placed to the development of inelastic deformations throughout the member. The inform FB formulation is always exact, since it does not depend on the assumed sectional constitutive behavior. In fact, it does not restrain in any way the displacement field of the element. In this sense the formulation can be regarded as always “exact”, the only approximation being introduced by the discrete number of the controlling sections along the element that are used for the numerical integration. In summary, the frame structures of this paper are simulated by using the firm FB element.
4. Seismic Response Analysis of Structures Based on Seismic Response
In the process of seismic design of the structure, it is usually necessary to ensure that the appearance of the plastic hinge in the frame beam precedes the frame column, that is, the “strong column weak beam”, so that the frame column as little as possible plastic hinge, to prevent the emergence of plastic frame due to more plastic column failure occurred in a progressive collapse [28]. In addition to the seismic structure of the rubber structure, it is necessary to ensure that the isolation bearing is still safe and reliable under the earthquake.
However, due to the small horizontal stiffness of the isolation layer, in the use of spare load path method for analysis, for the isolation bearing, it is difficult to avoid lateral movement and rotation, thus affecting the analysis results.
Considering that the seismic isolation structure is mainly used to reduce the damage degree of the upper structure, the seismic response of the upper structure under the same earthquake is one of the main technical indexes. Therefore, based on the standby load path method, the robust analysis of the isolated structure is quantitatively analyzed by the seismic response of the superstructure.
4.1. Analysis Methods and Procedures
In order to study the robustness of the frame structure under the horizontal seismic effects, the internal force and the horizontal seismic response of the frame under earthquake effects are analyzed.
In order to analyze the damage degree of each component under different intensity earthquakes and its influence on the robustness of the structure, three different intensity of ground motions were set up for analysis, which are, the number of seismic accelerations, the design of basic seismic acceleration and rare earthquake acceleration, respectively.
When the importance coefficient of the component is analyzed, the difference of the seismic response between the original structure and the remaining structure is determined by introducing the alternate load path method, and the influence of the corresponding component failure on the seismic response of the original structure is obtained. The alternate load path method cannot only be modeled when the existing building is repaired [29,30,31], but also for structural qualitative or quantitative robustness assessment [28,32,33].
The concrete steps are as follows: Firstly, the seismic action of different strength is applied to the original structure, and the corresponding vulnerability coefficient is determined according to the internal force and bearing capacity of each member and according to Section 2.2. At the same time, the response value of the original structure under different intensity earthquakes is calculated. Secondly, the seismic response is applied to the remaining structures corresponding to each working condition, and the response under different intensity seismic excitation is determined. Then, the component importance coefficient is calculated by Section 2.1. Finally, the structural robustness coefficient is solved by using the calculated component vulnerability coefficient and component importance coefficient.
4.2. Selection of Ground Motion Records
There is a strong uncertainty in the ground motion, and the effect of this uncertainty on the structural response is even greater than the uncertainty of the structure itself [34,35,36], so it is necessary to ensure the rationality and accuracy of the dynamic time history analysis, and the ground motion record must first be properly selected. The uncertainty of the ground motion is mainly due to the spectral characteristics of the ground motion record, the holding time and the peak value, and the number of the ground motion records.
How to select the ground motion record and the choice of what kind of ground motion records will directly determine the accuracy of the analysis results. At present, there are two main methods of selecting ground motions for domestic and foreign scholars: the selection method based on design response spectrum, and the seismic record selection method of seismic station and information. This paper focuses on the analysis of the robustness of the structure by seismic excitation. The seismic action is only used as external excitation. As a result, three ground motion records were selected from the far field recorded and near field recorded in ATC-63, as shown in Table 3.
5. Structural Robustness Analysis of Isolated Bearing Failure
In this paper, the seismic response of three vertical irregularly isolated structures under earthquake excitation is analyzed. The component importance coefficient and the component vulnerability coefficient of the initial failure component corresponding to each working condition are calculated, and the structural robustness is studied on the basis of this.
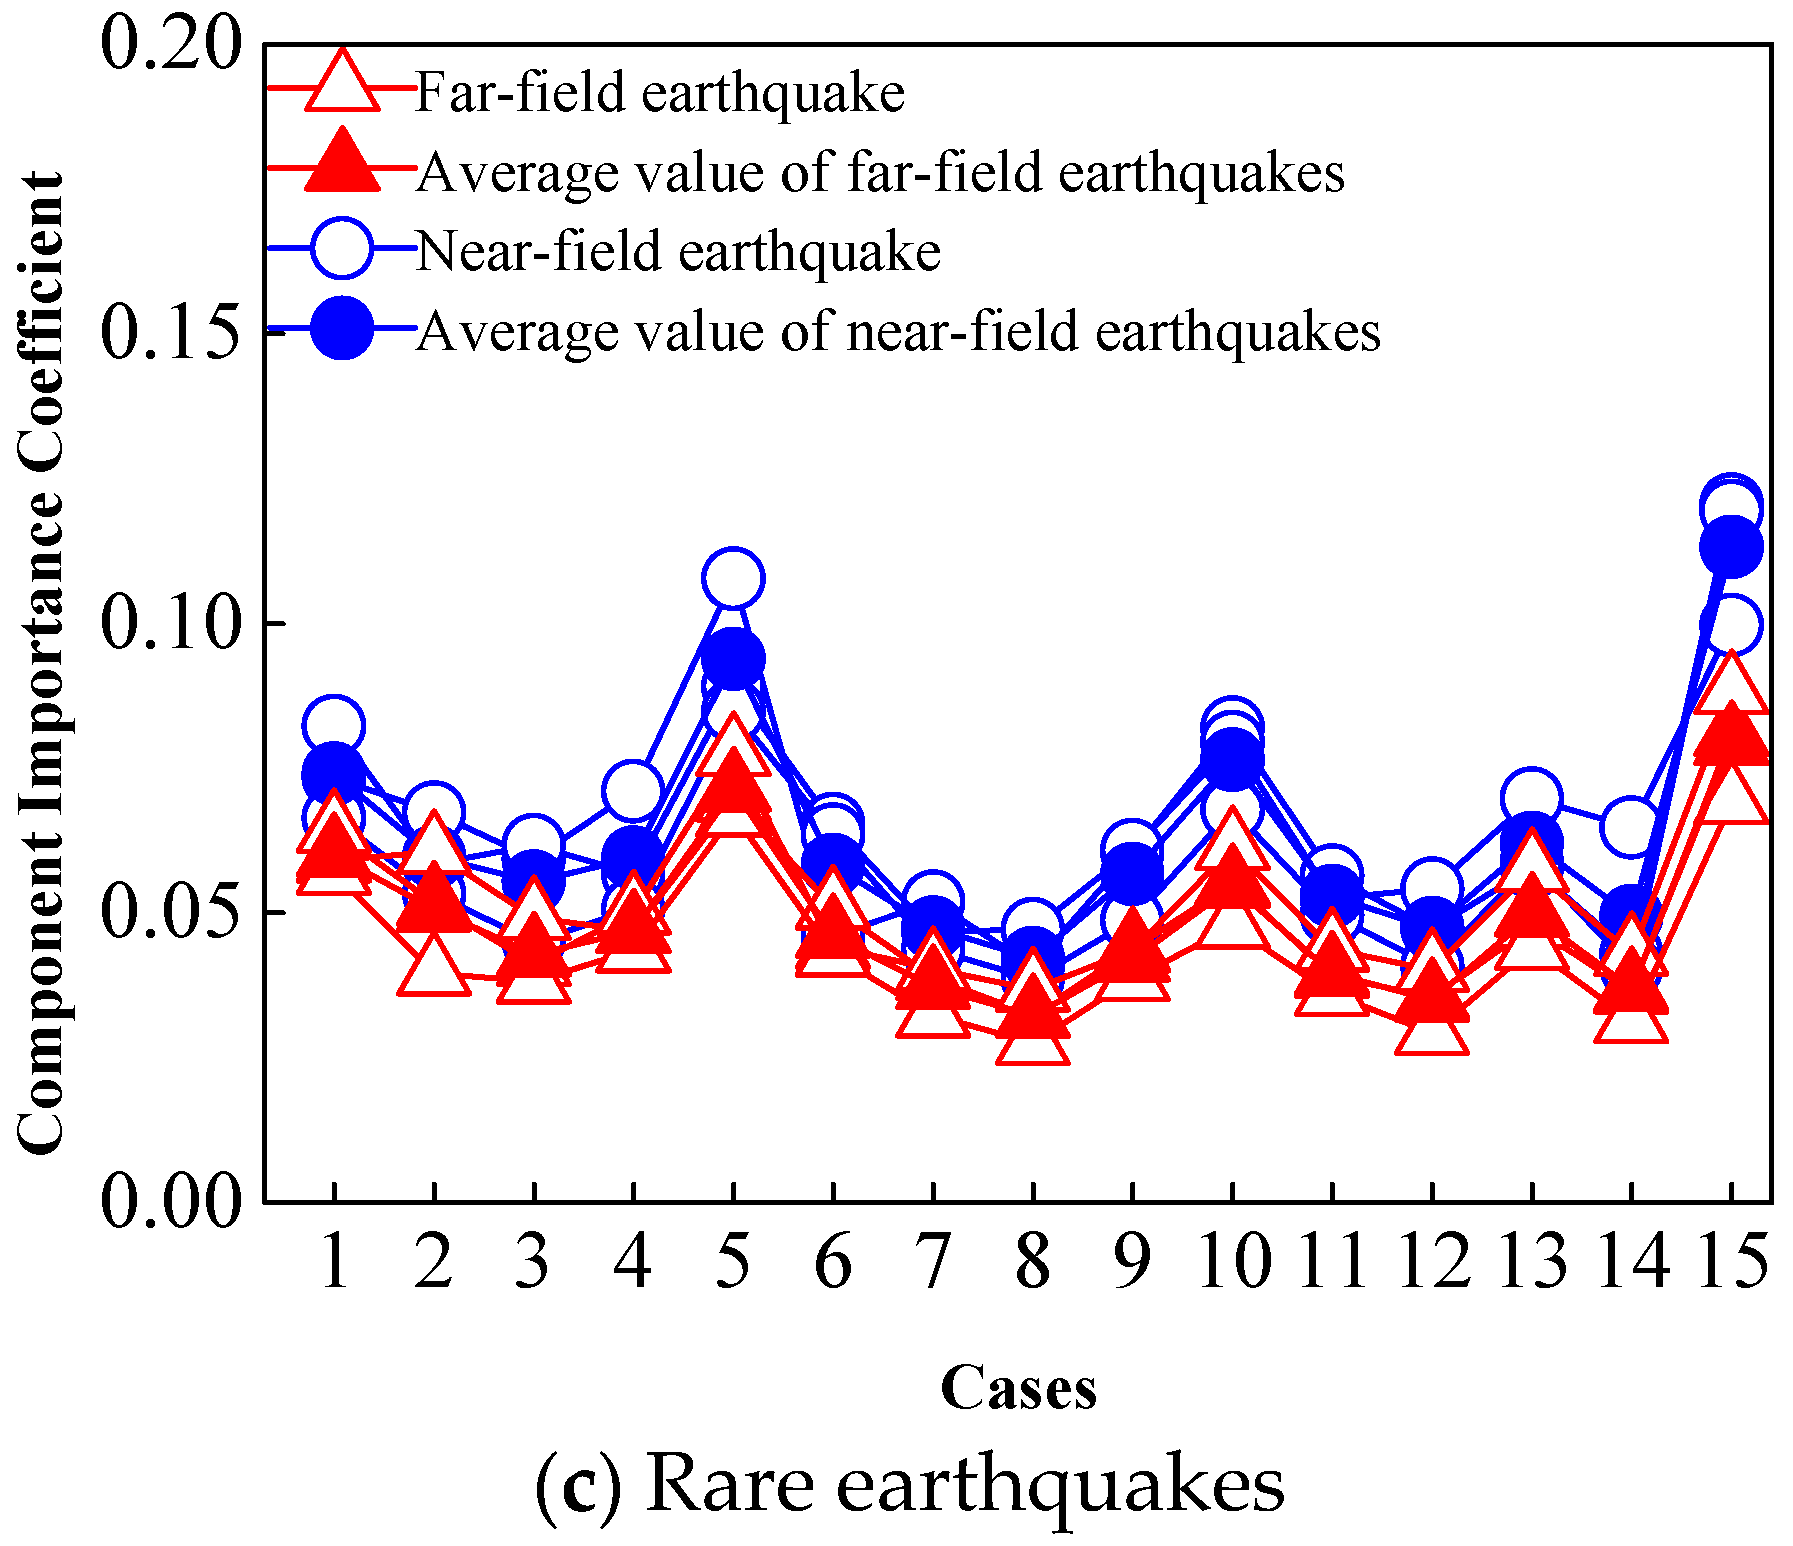
5.1. Component Importance Coefficient
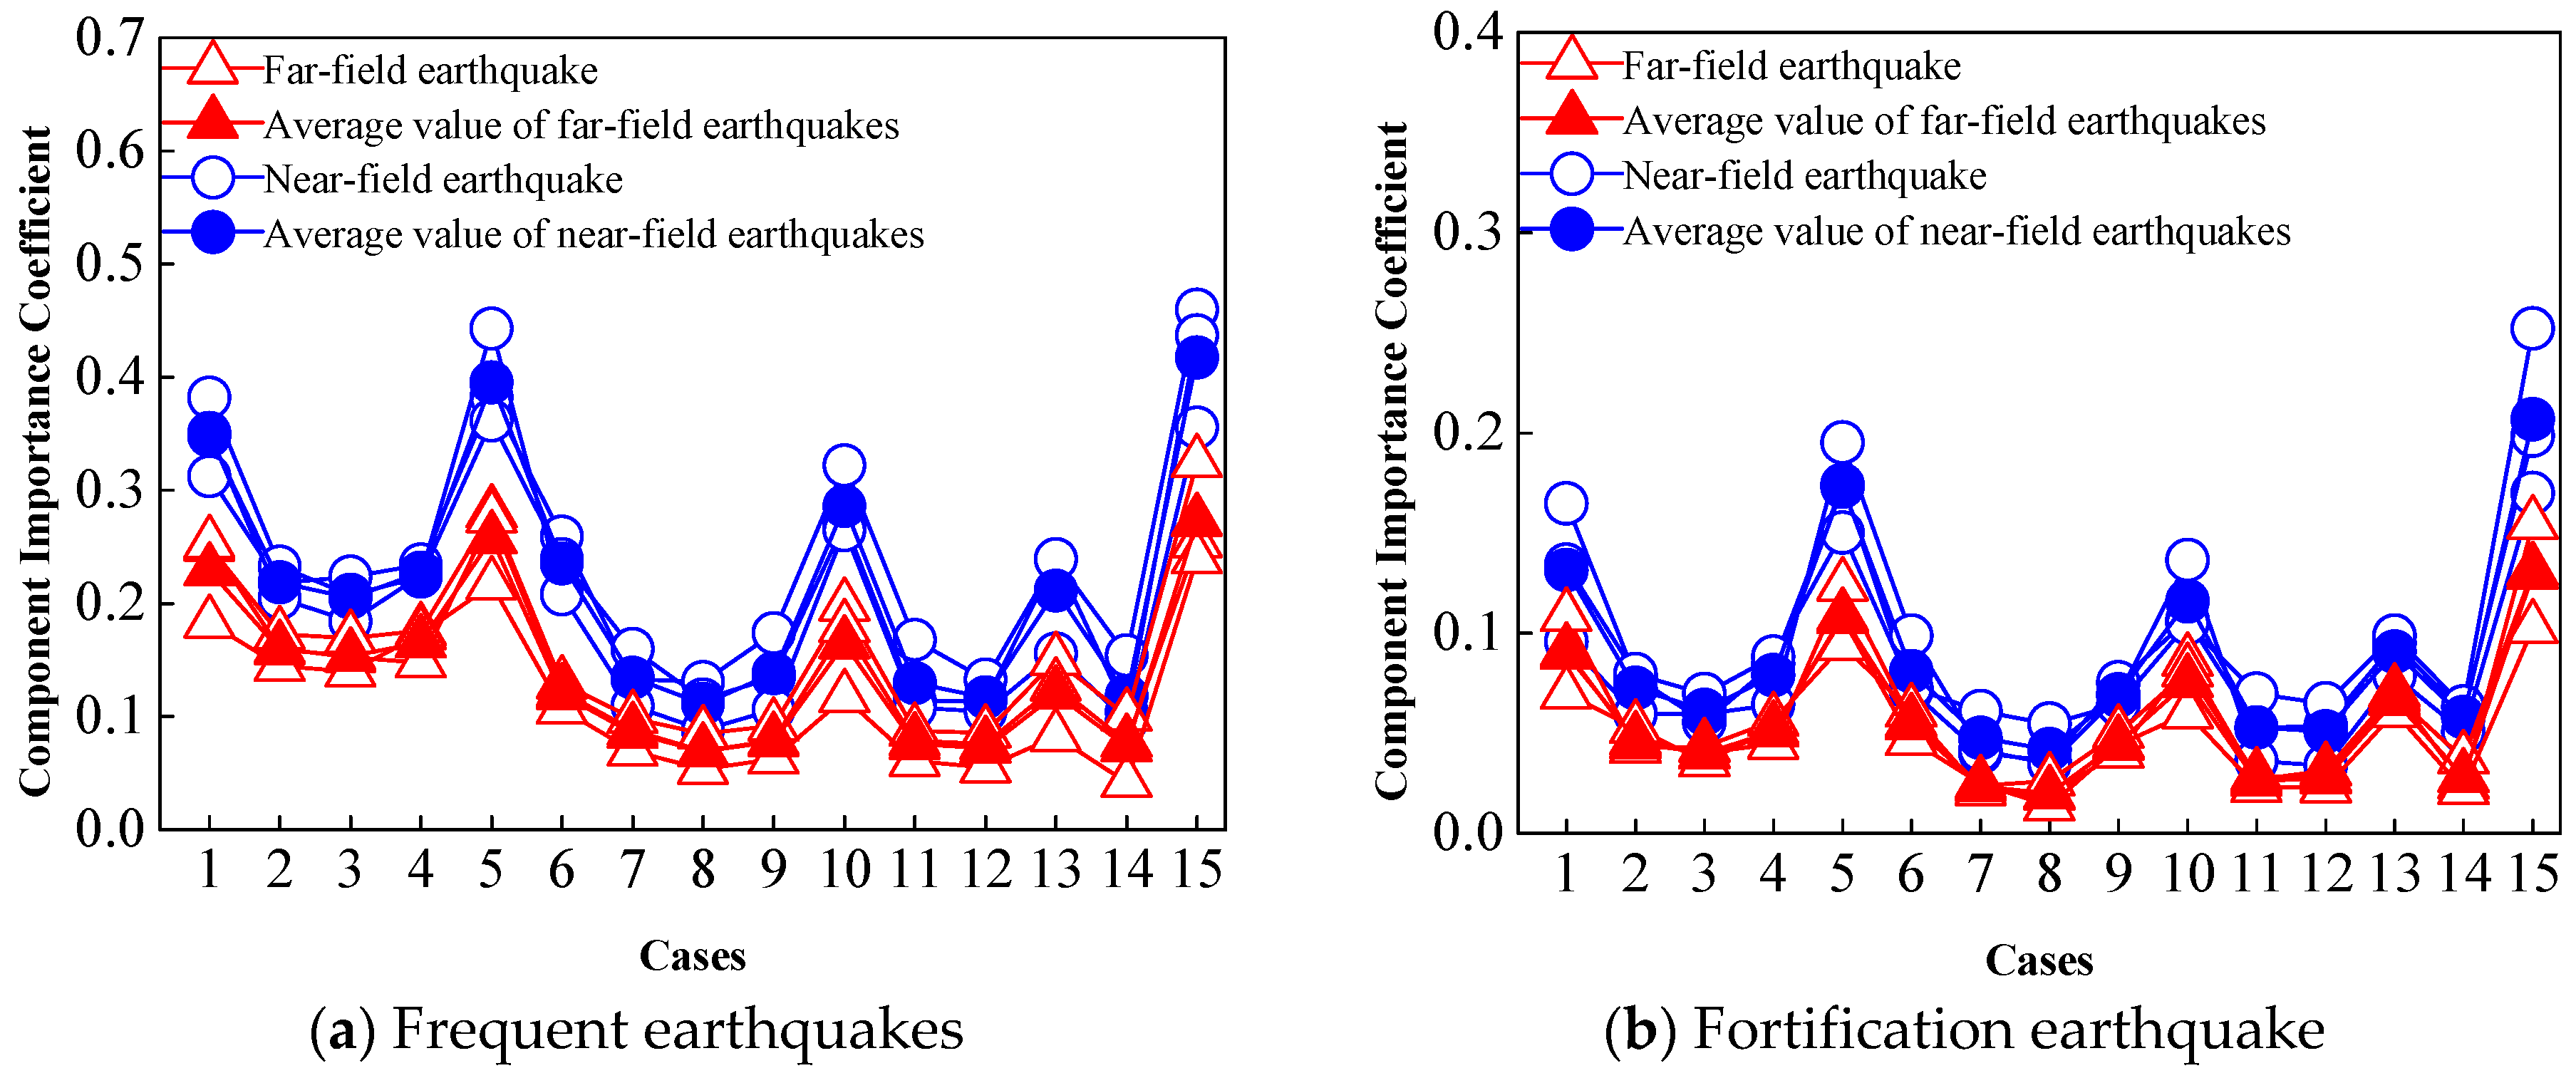
Figure 6, Figure 7 and Figure 8 model A, model B and model C rubber isolation bearing failure with the importance of the coefficient curve. It can be seen from the figures that the importance coefficient of the component increases with the increase of the earthquake intensity. It is found that with the initial failure, there is a certain deviation between the center of the structure and the center of gravity, and the “eccentric” isolated structure will have different degree of torsion under the earthquake.
Moreover, when the intensity of the seismic action increases, the torsional effect of the structure increases, which leads to some differences in the seismic response between the remaining structure and the original structure, reflected by the component importance coefficient. Therefore, the greater the importance coefficient of the component is obtained, the greater the effect of the failure of the component on the seismic response of the original structure may have. In addition, it can be seen from the figure in the near-field seismic effect of component that the importance coefficient is generally slightly larger than the far-field seismic action of the component importance coefficient, which also shows that the near-field seismic excitation under the remaining structure of the center of gravity and the deviation from the heart caused by the torsion effect is more significant.
It is found that the seismic isolation bearing with high importance coefficient is mainly distributed in the area far from the isolation layer. The main reason is that the failure of these isolation bearings will cause the isolation layer between the heart and the center of mass to produce a certain spacing, so that the remaining structure encountered when the earthquake occurred when the phenomenon of torsional coupling. The large number of bearings, the torsion effect caused by the failure of a single bearing is no longer significant with the increase of the overall translational effect of the structure under earthquake excitation.
In addition, the three models in the largest component of the importance of the main component of the bearing is mainly distributed away from the isolation layer of the tower of the tower near the lower part of the tower bearing area, such as bearing 4 of Model A, bearing 4 of and bearing 13 of Model B, and bearing 15 of Model C. The failure of these bearings of the upper mass leads to the destruction of the load transfer path of the inertial force of the upper mass, which also causes a large deviation between the center of the isolation layer and the center of mass of the upper structure, resulting in the complex force of the restraining bearing, and then have a detrimental effect on the shock absorbing effect of the isolated structure. Therefore, it is the main reason for the distance between the heart and the superstructure of the isolation layer to be controlled during the design stage of the isolation design. Therefore, it is necessary to reduce or avoid the unfavorable factors that affect the cushioning effect.
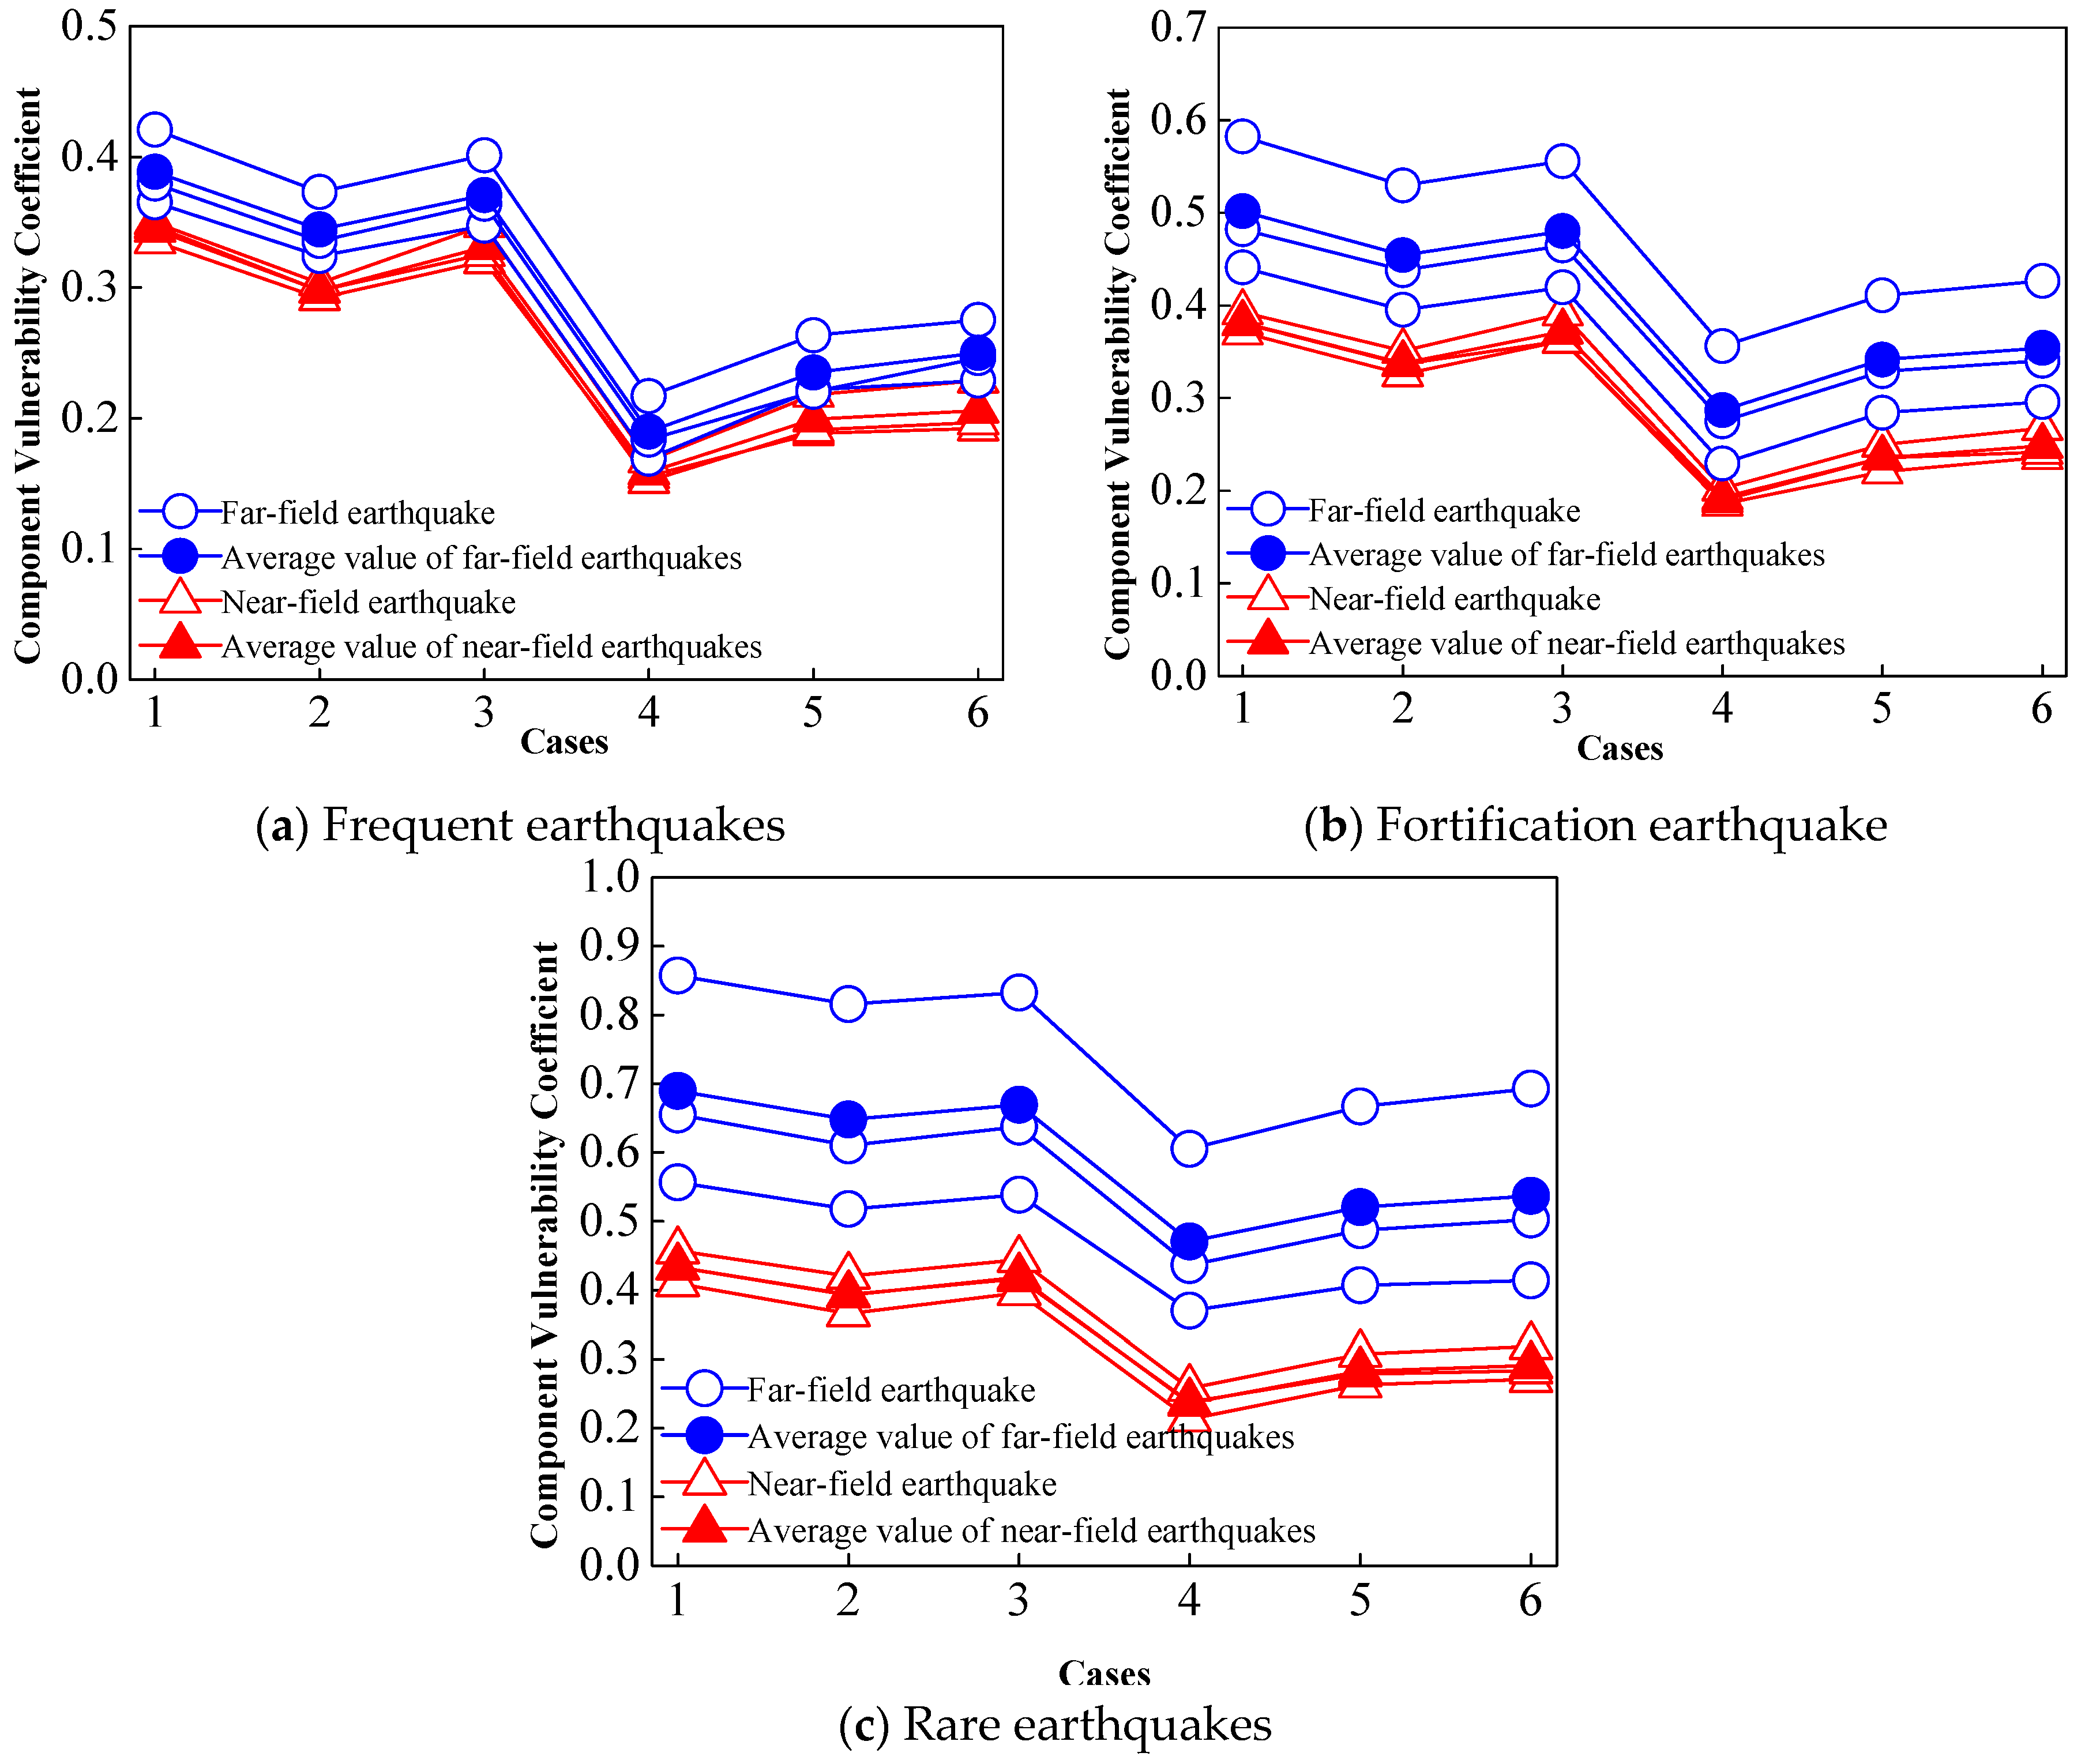
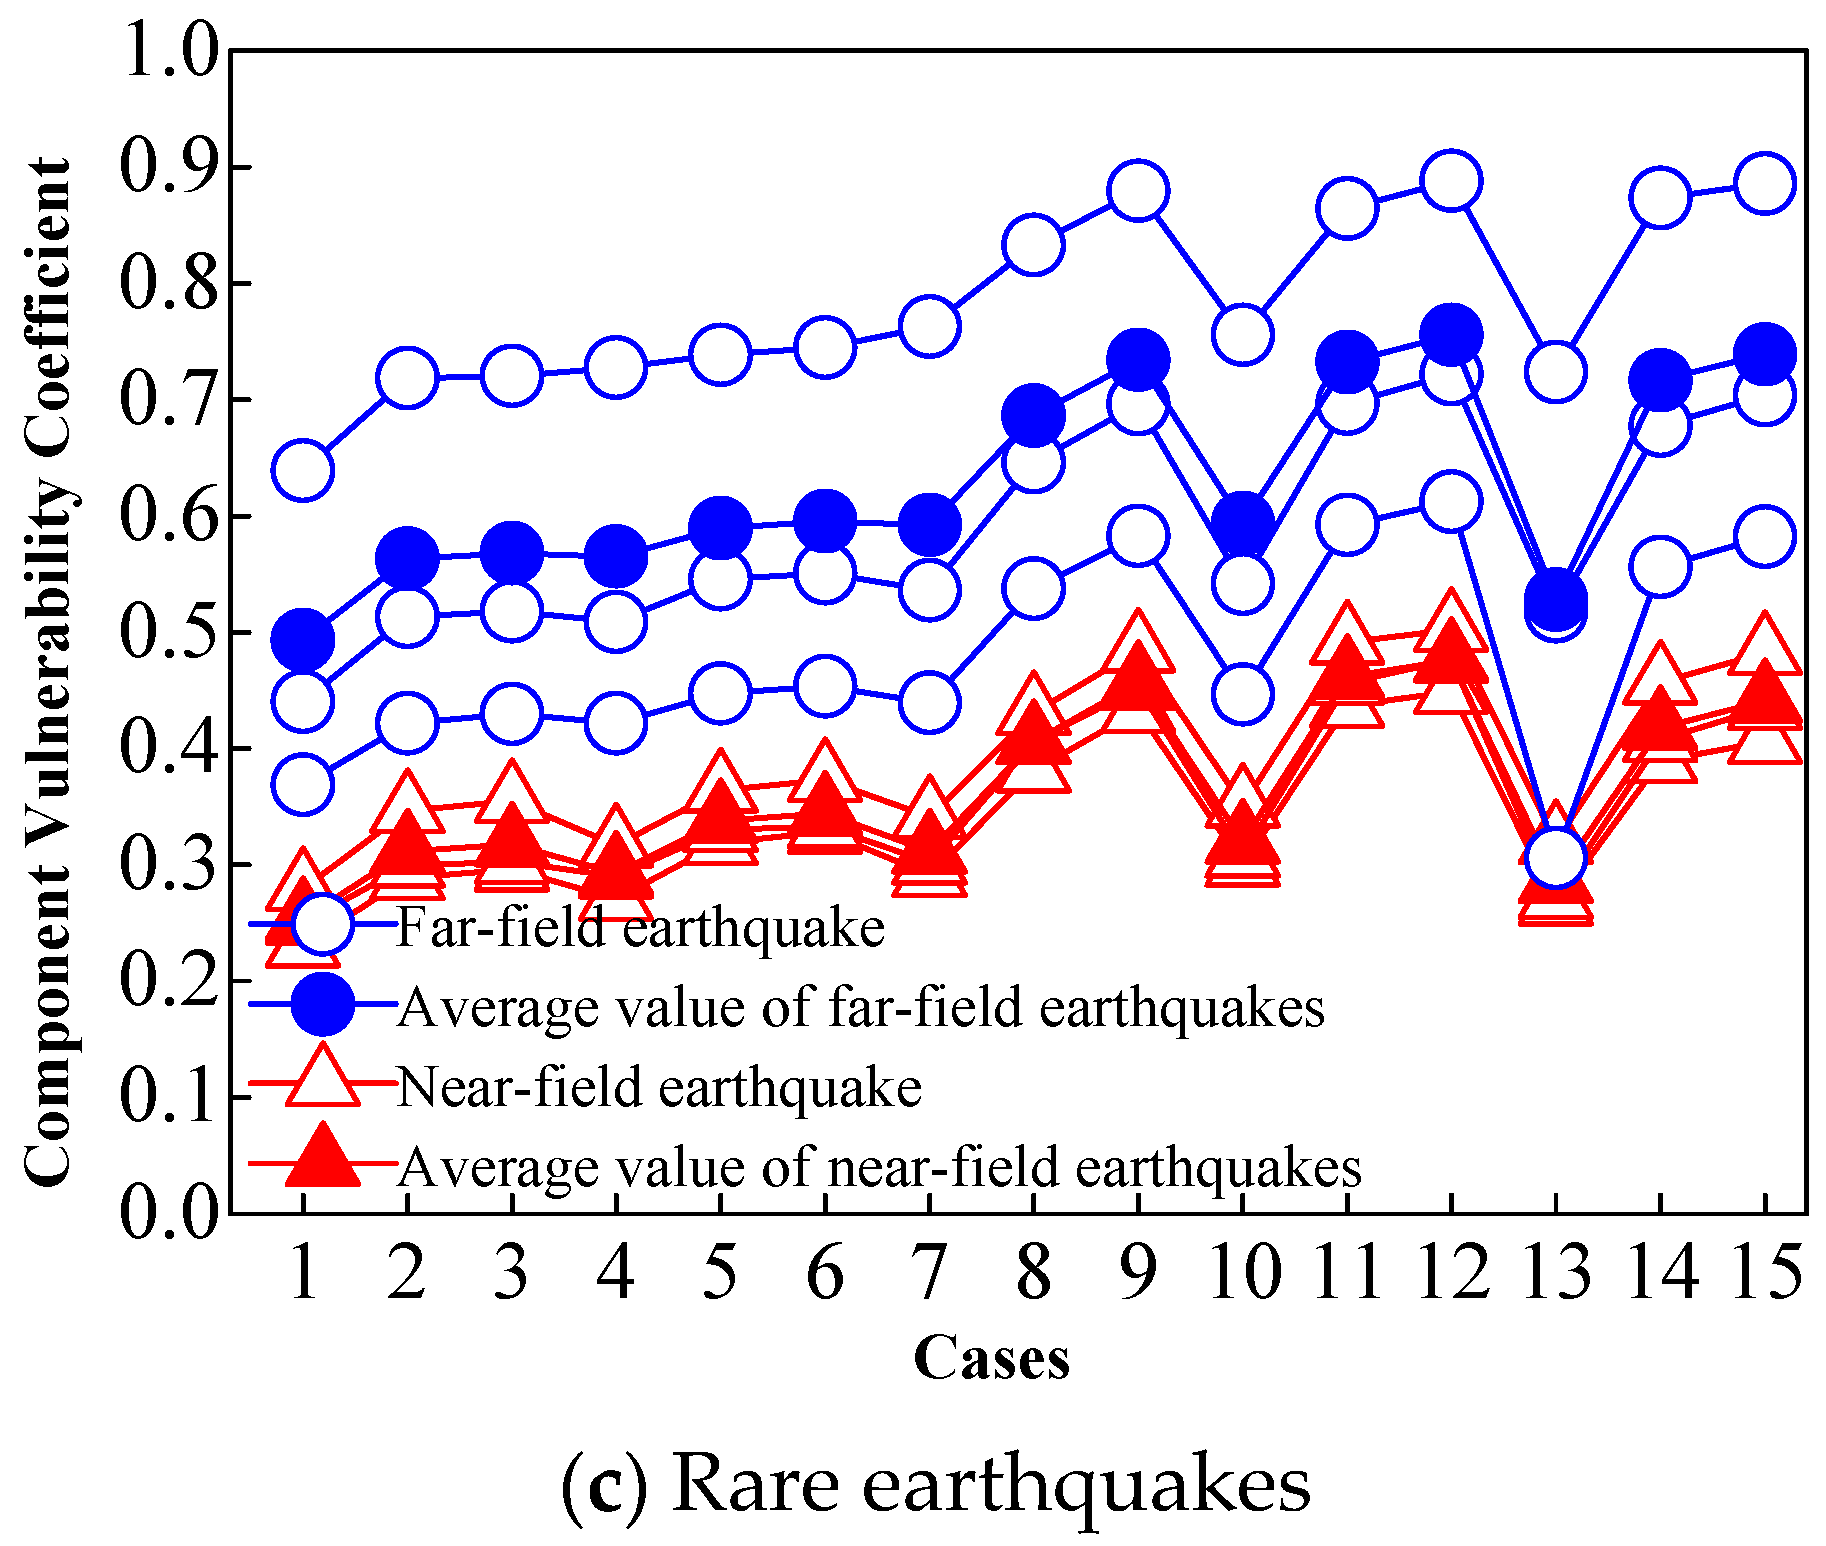
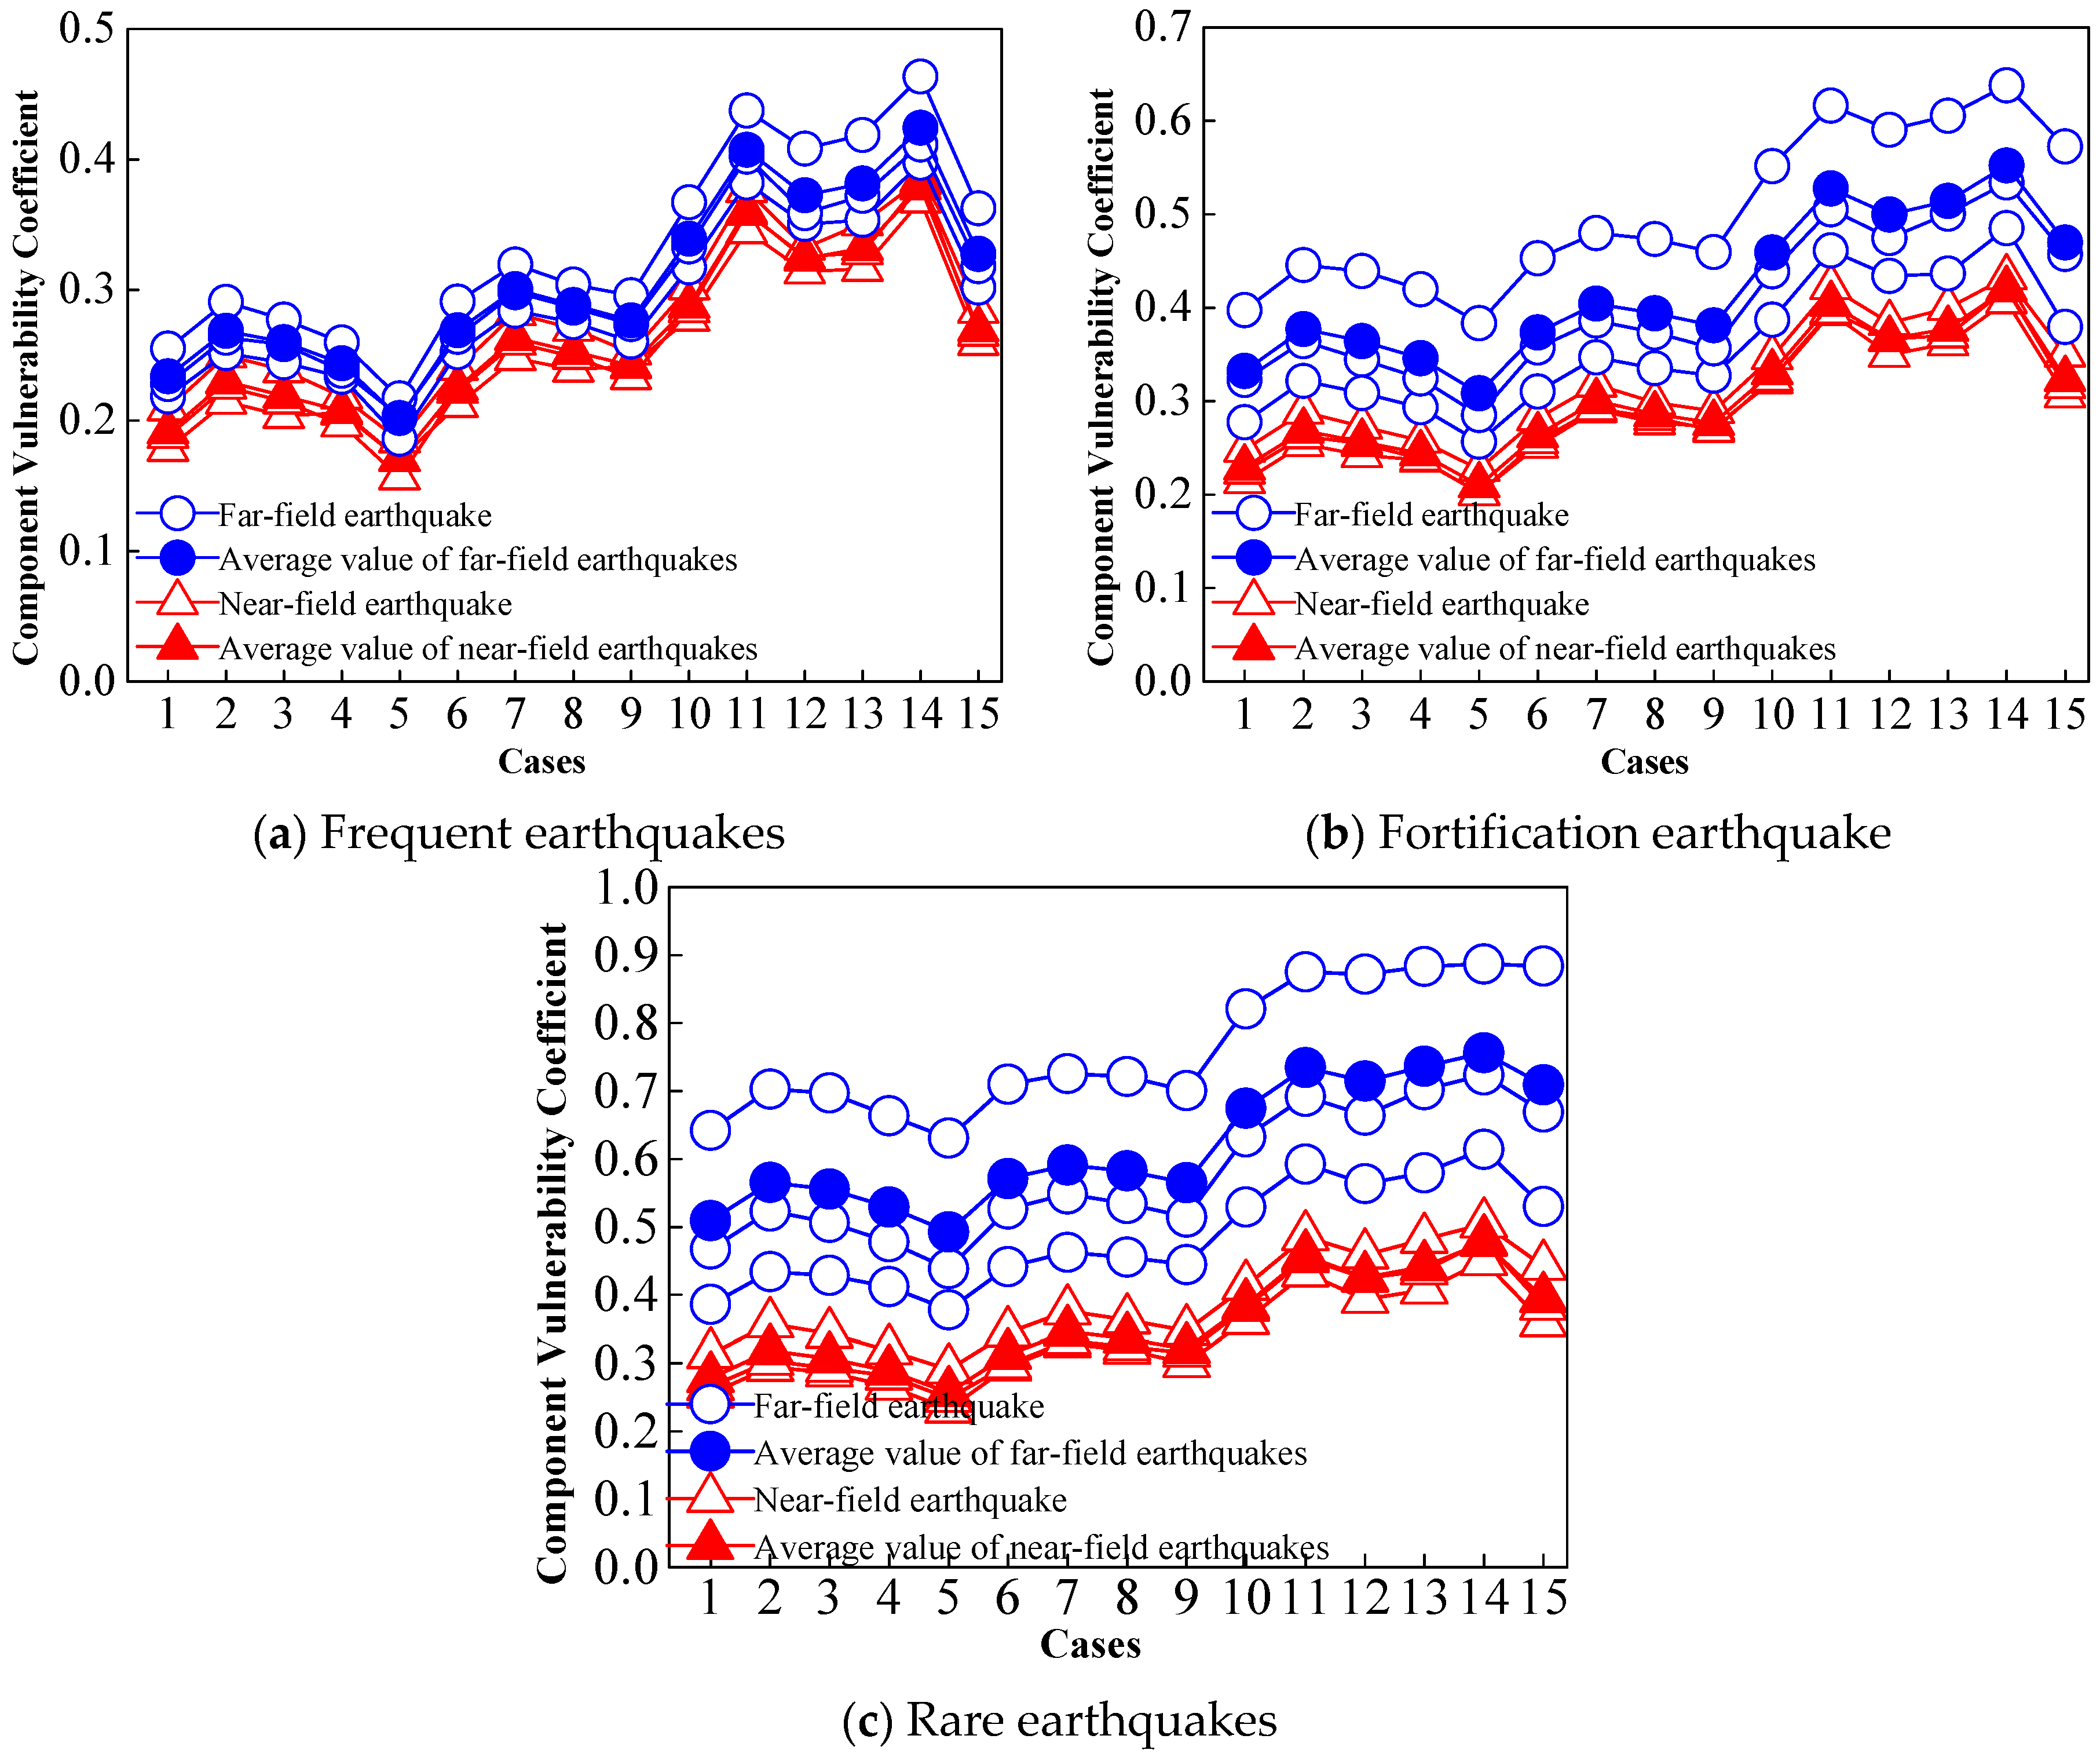
5.2. Component Vulnerability Coefficient
Figure 9, Figure 10 and Figure 11 show the vulnerability coefficient curves of the initial failure isolation bearing in each condition under earthquake action. It can be seen that the vulnerability coefficient of the same seismic bearing under the near-field earthquake is larger than that of the far-field seismic action, and the gap between the two is increasing with the increase of the seismic action intensity. This is mainly caused by the near-field seismic characteristics, such as the speed of large pulse, the rupture of the directional effect caused by the near-field ground vibration of these unique properties are usually leading to the structure of the more serious damage and damage the main reason.
The vulnerability coefficient of the isolation bearing is related to the plane position of the bearing, and the vulnerability coefficient of the bottom of the tower is better than that of the underpinning bearing, and the vulnerability coefficient of the bearing is generally larger than that of the bearing and the vulnerability of the bearing is larger than that of the angular bearing. It indicates that the risk of damage in the bearing is the largest, the vulnerability coefficient of the bearing is generally larger than that of the bearing and the vulnerability is larger than that of the bearing, which indicates that the risk of damage in the bearing is the largest. Especially when the impact of individual near-field earthquake is used, the bearing vulnerability coefficient will be significantly increased, and this time making the entire isolation structure becomes unsafe.
This is because when a certain isolation bearing by the internal force is over its carrying capacity and damage or even failure, the load will be assigned to the surrounding bearing, and the internal force of these bearings will also increase significantly and the same may be destroyed, and then appear similar to the failure of the failure mode, endanger the entire isolation layer and the structure of the security.
Therefore, for the larger vulnerability of the isolation bearing should be set to protect the corresponding measures to reduce the risk of accidental failure. On the other hand, in the design of the isolation structure, due to the calculation of the dynamic time history analysis, results are usually due to differences in the selection of ground vibration records have a greater difference. Therefore, under the condition of permissible conditions, it is necessary to select more different types of ground motion records in combination with the conditions of the site and the basic period of the structure, so as to ensure the safe and reliable operation of the structure under earthquake action.
5.3. Structural Robustness Coefficient
Based on the importance coefficient and vulnerability coefficient of the isolated bearing, the structural robustness coefficient is calculated. In order to visualize the relationship between the structural robustness coefficient and the external seismic stimulus, the three-dimensional curve is plotted, as shown in Figure 12.
Figure 11 shows that the structural robustness coefficients of the three models is decreased with the increase of the seismic excitation, and the structural robustness coefficient of the near-field earthquake is generally smaller than the structural robustness coefficient of the far-field seismic action. The structural robustness coefficient of model A is the largest under the same intensity earthquake, and the structural robustness coefficient of model C is the smallest, which indicates that the structural robustness depends not only on its own characteristics, such as arrangement form, construction measures, but also related to external action.
As a key component connecting the upper structure and the lower structure or foundation, the normal operation of the isolation bearing has a significant effect on the structure. Therefore, In the process of structural design and construction, the compressive bearing capacity, horizontal displacement, anti-overturning capacity, the tensile performance under rare earthquakes, and the connection structure should be strictly controlled in order to ensure its long-term, safe and reliable serviceability.
6. Conclusions
Through the above analysis, the following conclusions can be drawn:
- (1)
- The robustness of vertical irregularly isolated structures can be quantitatively analyzed using the method proposed in this paper. Although it cannot make an absolute quantitative evaluation for one structure, the relative superiority of building schemes can be evaluated.
- (2)
- The robustness of the structure is not dependent on the nature of the structure itself, but also with the external load of the structure, and the structural robustness decreases with the outward enhancement of the external function. It is possible to improve the structural robustness to different extent by rationally arranging the structure, improving the bearing capacity of each component, reducing the external effect, and reducing the adverse effect of the component failure on the original structure.
- (3)
- It is important to ensure that the safety work of the isolated bearings is effective against the overall structure. It is suggested that reasonable protection measures should be set for the isolated bearings with high risk of extreme accident load, that is, the vulnerability coefficient is larger, and the potential risk of isolation bearing with large component importance coefficient should be eliminated or reduced.
Author Contributions
W.Y. and C.B. are co-first authors. C.B. and X.M. analyzed the data. C.B. and W.Y. wrote the paper, W.Y. and S.Z. revised and finalized the paper.
Acknowledgments
This research was funded by: [Natural Science Foundation of China] grant number [No. 51468054 and 51608283]; [The Project of Key Research and Development of Ningxia Province] grant number [No. 2016KJHM38 and 2018BEG03009]; [Ningxia Higher Education Research Project] grant number [No. NGY2016150]; ([Natural Science Foundation of Ningxia] grant number [No. 2018AAC03121]; [Project of Excellent Paper of Ningxia University (Natural science)]; [Ningxia Higher Education School First-class Discipline Construction Funding Project] grant number [No. NXYLXK2017A03]. The authors are grateful for this financial support.
Conflicts of Interest
The authors declare no conflicts of interest.
References
- Khandelwal, K.; El-Tawil, S. Pushdown resistance as a measure of robustness in progressive collapse analysis. Eng. Struct. 2011, 33, 2653–2661. [Google Scholar] [CrossRef]
- Fascetti, A.; Kunnath, S.K.; Nisticò, N. Robustness evaluation of RC frame buildings to progressive collapse. Eng. Struct. 2015, 86, 242–249. [Google Scholar] [CrossRef]
- Liu, M.M.; Pirmoz, A. Energy-based pulldown analysis for assessing the progressive collapse potential of steel frame buildings. Eng. Struct. 2016, 123, 372–378. [Google Scholar] [CrossRef]
- Izzuddin, B.A.; Vlassis, A.G.; Elghazouli, A.Y.; Nethercot, D.A. Progressive collapse of multi-storey buildings due to sudden column loss—Part I: Simplified assessment framework. Eng. Struct. 2008, 30, 1308–1318. [Google Scholar] [CrossRef] [Green Version]
- Vlassis, A.G.; Izzuddin, B.A.; Elghazouli, A.Y.; Nethercot, D.A. Progressive collapse of multi-storey buildings due to sudden column loss—Part II: Application. Eng. Struct. 2008, 30, 1424–1438. [Google Scholar] [CrossRef] [Green Version]
- Brett, C.; Lu, Y. Assessment of robustness of structures: Current state of research. Front. Struct. Civ. Eng. 2013, 7, 356–368. [Google Scholar] [CrossRef] [Green Version]
- Asprone, D.; De Risi, R.; Manfredi, G. Defining structural robustness under seismic and simultaneous actions: An application to precast RC buildings. Bull. Earthq. Eng. 2016, 14, 485–499. [Google Scholar] [CrossRef]
- Comeliau, L.; Rossi, B.; Demonceau, J.F. Robustness of steel and composite buildings suffering the dynamic loss of a column. Struct. Eng. Int. 2012, 22, 323–329. [Google Scholar] [CrossRef]
- Cavaco, E.S.; Casas, J.R.; Neves, L.A.C.; Huespe, A.E. Robustness of corroded reinforced concrete structures—A structural performance approach. Struct. Infrastruct. Eng. 2013, 9, 42–58. [Google Scholar] [CrossRef]
- Ribeiro, F.L.A.; Barbosa, A.R.; Neves, L.C. Application of reliability-based robustness assessment of steel moment resisting frame structures under post-mainshock cascading events. J. Struct. Eng. 2014, 140, A4014008. [Google Scholar] [CrossRef]
- Ashour, A.; El-Dakhakhni, W.; Shedid, M. Experimental evaluation of the system-level seismic performance and robustness of an asymmetrical reinforced concrete block building. J. Struct. Eng. 2016, 142, 04016072. [Google Scholar] [CrossRef]
- Bao, C.; Du, Y.F.; Liu, Y.; Xu, T.N.; Wang, G.F. Study on seismic robustness of structure. China Earthq. Eng. J. 2015, 37, 660–666. [Google Scholar]
- Lu, D.G.; Cui, S.S.; Song, P.Y.; Chen, Z.H. Robustness assessment for progressive collapse of framed structures using pushdown analysis methods. Int. J. Reliab. Saf. 2011, 6, 15–37. [Google Scholar] [CrossRef]
- López-López, A.; Tomás, A.; Sánchez-Olivares, G. Behaviour of reinforced concrete rectangular sections based on tests complying with seismic construction requirements. Struct. Concr. 2016, 17, 656–667. [Google Scholar] [CrossRef]
- López-López, A.; Tomás, A.; Sánchez-Olivares, G. Influence of adjusted models of plastic hinges in nonlinear behaviour of reinforced concrete buildings. Eng. Struct. 2016, 124, 245–257. [Google Scholar] [CrossRef]
- Jiang, J.; Zhang, P.; Patil, D.; Li, H.; Song, G. Experimental studies on the effectiveness and robustness of a pounding tuned mass damper for vibration suppression of a submerged cylindrical pipe. Struct. Control Health Monit. 2017, 24, e2027. [Google Scholar] [CrossRef]
- Wang, H.; Song, G. Fault detection and fault tolerant control of a smart base isolation system with magneto-rheological damper. Smart Mater. Struct. 2011, 20, 085015. [Google Scholar] [CrossRef]
- Starossek, U.; Haberland, M. Measures of structural robustness—Requirements and applications. In Proceedings of the Structures Congress 2008: Crossing Borders, Vancouver, BC, Canada, 24–26 April 2008. [Google Scholar]
- Dinu, F.; Dubina, D.; Marginean, I. Improving the structural robustness of multi-story steel-frame buildings. Struct. Infrastruct. Eng. 2015, 11, 1028–1041. [Google Scholar] [CrossRef]
- Cassiano1a, D.; D’Aniello, M.; Rebelo, C.; Landolfo, R.; da Silva, L.S. Influence of seismic design rules on the robustness of steel moment resisting frames. Steel Compos. Struct. 2016, 21, 479–500. [Google Scholar] [CrossRef]
- Charmpis, D.C.; Kontogiannis, A. The cost of satisfying design requirements on progressive collapse resistance–Investigation based on structural optimisation. Struct. Infrastruct. Eng. 2016, 12, 695–713. [Google Scholar] [CrossRef]
- Starossek, U.; Asce, M.; Haberland, M. Disproportionate Collapse: Terminology and Procedures. J. Perform. Constr. Facil. 2010, 24, 519–528. [Google Scholar] [CrossRef]
- Department of Defense. Design of Buildings to Resist Progressive Collapse; Department of Defense: Washington, DC, USA, 2005.
- Starossek, U.; Haberland, M. Approaches to measures of structural robustness. Struct. Infrastruct. Eng. 2011, 7, 625–631. [Google Scholar] [CrossRef]
- Li, L.L.; Li, G.Q.; Jiang, B.; Lu, Y. Analysis of robustness of steel frames against progressive collapse. J. Constr. Steel Res. 2018, 143, 264–278. [Google Scholar] [CrossRef]
- U.S. General Services Administration. Progressive Collapse Analysis and Design Guidelines for New Federal Office Buildings and Major Modernization Projects; Central Office of the GSA: Washington, DC, USA, 2003.
- SeismoSoft. SeismoStruct—A Computer Program for Static and Dynamic Nonlinear Analysis of Framed Structures. SeismoSoft. 2013. Available online: http://www.seismosoft.com (accessed on 23 August 2018).
- Guðmundsson, G.V. Simplified Progressive Collapse Assessment of Steel-Frames Buildings due to Column Loss-Influence of Dynamic Column Damage; Imperial College London: London, UK, 2007. [Google Scholar]
- ASCE 41-06. Seismic Rehabilitation of Existing Buildings; Structural Engineering Institute of the American Society of Civil Engineers: Reston, VA, USA, 2006. [Google Scholar]
- Adam, J.M.; Parisi, F.; Sagaseta, J.; Lu, X. Research and practice on progressive collapse and robustness of building structures in the 21st century. Eng. Struct. 2018, 173, 122–149. [Google Scholar] [CrossRef]
- Huber, J.A.J.; Ekevad, M.; Girhammar, U.A.; Berg, S. Structural robustness and timber buildings—A review. Wood Mater. Sci. Eng. 2018, 13, 1–22. [Google Scholar] [CrossRef]
- Izzuddin, B.A. Mitigation of progressive collapse in multi-storey buildings. Adv. Struct. Eng. 2012, 15, 1505–1520. [Google Scholar] [CrossRef]
- Wang, T.; Zhang, L.; Zhao, H.; Chen, Q. Progressive collapse resistance of reinforced-concrete frames with specially shaped columns under loss of a corner column. Mag. Concr. Res. 2015, 68, 435–449. [Google Scholar] [CrossRef]
- Choi, E.; DesRoches, R.; Nielson, B.G. Seismic fragility of typical bridges in moderate seismic zones. Eng. Struct. 2004, 26, 187–199. [Google Scholar] [CrossRef]
- Pan, Y.; Agrawal, K.; Ghosn, M.; Alampalli, S. Seismic fragility of multi-span simply supported steel highway bridges in New York State. II: Fragility analysis, fragility curves, and fragility surfaces. J. Bridge Eng. 2010, 15, 462–471. [Google Scholar] [CrossRef]
- Gokkaya, B.U.; Baker, J.W.; Deierlein, G.G. Estimation and impacts of model parameter correlation for seismic performance assessment of reinforced concrete structures. Struct. Saf. 2017, 69, 68–78. [Google Scholar] [CrossRef]
Figure 1.
The 3D plots of structures. (a) Model A; (b) Model B; (c) Model C.

Figure 2.
Structure plane layout and distribution of cases. (a) Model A; (b) Model B; (c) Model C.

Figure 3.
Isolation bearing layout. (a) Model A; (b) Model B; (c) Model C.

Figure 4.
Stress–Strain Curve of Reinforced and Concrete. (a) Stress–strain relationship of reinforcement; (b) Stress–strain relationship of concrete.
Figure 4.
Stress–Strain Curve of Reinforced and Concrete. (a) Stress–strain relationship of reinforcement; (b) Stress–strain relationship of concrete.

Figure 5.
Force-Displacement Curve of Isolating Bearings.

Figure 6.
Component importance coefficient curves of model A.

Figure 7.
Component importance coefficient curves of model B.

Figure 8.
Component importance coefficient curves of model.


Figure 9.
Component vulnerability coefficient curves of model A.

Figure 10.
Component vulnerability coefficient curves of model B.


Figure 11.
Component vulnerability coefficient curves of model C.

Figure 12.
Curves of structural robustness coefficient.


Table 1.
Parameters of rubber isolation bearing.
| Performance Indicators | Parameters | LRB400 | LRB500 | LRB600 | |
|---|---|---|---|---|---|
| Size parameters | Exterior diameter | 420 mm | 520 mm | 620 mm | |
| Effective diameter | 400 mm | 500 mm | 600 mm | ||
| Bearing height | 130 mm | 170 mm | 185 mm | ||
| Axial parameters | Standard surface pressure | 12 MPa | 12 MPa | 12 MPa | |
| Axial stiffness/(kN·mm−1) | 1481 | 1640 | 2312 | ||
| Axial bearing capacity/kN | 1507 kN | 2356 kN | 3391 kN | ||
| lateral performance | Yield load | 40.2 kN | 62.6 kN | 90.4 kN | |
| Pre-yield shear stiffness/(kN·mm−1) | 7.180 | 8.040 | 9.260 | ||
| Post-yield stiffness/(kN·mm−1) | 100% | 0.718 | 0.801 | 0.926 | |
| 250% | 0.615 | 0.679 | 0.783 | ||
| Equivalent stiffness/(kN·mm−1) | 100% | 1.750 | 1.777 | 2.270 | |
| 250% | 0.960 | 1.406 | 1.697 | ||
| Equivalent damping ratio | 100% | 0.23 | 0.23 | 0.230 | |
| 250% | 0.170 | 0.170 | 0.170 | ||
| Ultimate performance | Maximum horizontal displacement | 220 mm | 275 mm | 330 mm | |
Table 2.
Eccentricity of the isolation layer.
| Models | Direction | Center of Mass Coordinates/m | Stiffness Center Coordinates/m | Eccentric Distance/m | Eccentricity Ratio/% |
|---|---|---|---|---|---|
| A | X | 12.000 | 12.000 | 0 | 0 |
| Y | 12.000 | 12.000 | 0 | 0 | |
| B | X | 12.000 | 12.000 | 0 | 0 |
| Y | 10.744 | 10.737 | 0.007 | 0.061 | |
| C | X | 10.744 | 10.775 | 0.031 | 0.269 |
| Y | 10.744 | 10.775 | 0.031 | 0.269 |
Table 3.
Ground Motion Record.
| No. | Earthquake Events | Earthquake Magnitude | Station Information | Ground Motion Parameters | |||
|---|---|---|---|---|---|---|---|
| Station Name | Fault Distance (km) | PGA (gal) | PGV (cm/s) | Duration (s) | |||
| acc-1 | Northridge-01 | 6.69 | CDMG24278 | 20.72 | 568.3 | 46.51 | 39.88 |
| acc-2 | Chi-chi | 7.62 | TCU095 | 45.29 | 711.6 | 56.24 | 89.97 |
| acc-3 | Loma Prieta | 6.93 | USGS 1662 | 76.97 | 259.8 | 32.03 | 39.18 |
| acc-4 | N.Palm Springs | 6.06 | USGS-5072 | 4.24 | 602.2 | 32.91 | 20.03 |
| acc-5 | Imperial Valley-06 | 6.53 | USGS-5054 | 6.20 | 686.1 | 53.86 | 27.62 |
| acc-6 | Chi-chi | 7.62 | CHY028 | 8.72 | 790.4 | 71.98 | 89.97 |
© 2018 by the authors. Licensee MDPI, Basel, Switzerland. This article is an open access article distributed under the terms and conditions of the Creative Commons Attribution (CC BY) license (http://creativecommons.org/licenses/by/4.0/).
Share and Cite
MDPI and ACS Style
Yang, W.; Bao, C.; Ma, X.; Zhang, S. Study on Structural Robustness of Isolated Structure Based on Seismic Response. Appl. Sci. 2018, 8, 1686. https://doi.org/10.3390/app8091686
AMA Style
Yang W, Bao C, Ma X, Zhang S. Study on Structural Robustness of Isolated Structure Based on Seismic Response. Applied Sciences. 2018; 8(9):1686. https://doi.org/10.3390/app8091686
Chicago/Turabian StyleYang, Wenwei, Chao Bao, Xiaotong Ma, and Shangrong Zhang. 2018. "Study on Structural Robustness of Isolated Structure Based on Seismic Response" Applied Sciences 8, no. 9: 1686. https://doi.org/10.3390/app8091686
Note that from the first issue of 2016, this journal uses article numbers instead of page numbers. See further details here.