Sensitivity Analysis for Ship-to-Shore Container Crane Design
by
 , , ,
, , ,
Quang Huy Tran
1 ,
,
Jungwon Huh
1,* ,
,
Van Bac Nguyen
1,
Choonghyun Kang
1,
Jin-Hee Ahn
2 and
Inn-Joon Park
3 1
Department of Civil and Environmental Engineering, Chonnam National University, Yeosu, Chonnam-do 59626, Korea
2
Department of Civil Engineering, Gyeongnam National University of Science and Technology, Jinju, Gyeongnam 52725, Korea
3
Department of Civil Engineering, Hanseo University, Seosan-si, Chungcheongnam-do 31962, Korea
*
Author to whom correspondence should be addressed.
Appl. Sci. 2018, 8(9), 1667; https://doi.org/10.3390/app8091667
Submission received: 21 August 2018
/
Revised: 6 September 2018
/
Accepted: 13 September 2018
/
Published: 15 September 2018
(This article belongs to the Section Mechanical Engineering)
Abstract
:Featured Application
The study provides crane designers and experts with a comprehensive view of the sources of uncertainty that might occur to container cranes subjected to an earthquake event. The sensitivities of seismic responses for the crane due to uncertainties associated with input design parameters were analyzed, and important characteristics of various contributors to overall uncertainty are also discussed in detail in terms of portal drift, vertical reaction, and total base shear.
Abstract
Ship-to-shore (STS) container cranes are important pieces of equipment in container terminals for container handling, so they need to be properly designed to avoid damage or collapse due to natural hazards (i.e., storms or earthquakes). However, the dynamic analyses necessary for this can be cost- and time-consuming because of the need to consider the time history of ground motions and several sources of uncertainty. Thus, sensitivity analysis on the input parameters to the responses of the structures is needed to categorize which sources of uncertainty are significant enough to be considered as random variables. In this study, an investigation is carried out into the sensitivity of some sources of uncertainty to the seismic response of a Korean container crane structure. The input random variables studied include ground motion intensity, ground motion profiles, mass, damping, and elastic modulus of steel. Nonlinear dynamic analyses are conducted using a set of 20 natural ground motions scaled to three ground motion intensity levels, in compliance with the Korean Design Standard. The method of deterministic sensitivity analysis using the so-called tornado diagram is applied for the evaluation of structural systems. For the studied type of Korean container crane, it can be stated that the intensity of ground motions (i.e., spectral acceleration) is the most significant input parameter on the response of the structure, as measured in terms of portal drift, vertical reaction of the crane’s legs, and total base shear. The next most significant influencing factors are the mass of the structure and the characteristics of every ground motion. Damping plays a relatively important role on the total base shear, while it shows almost no impact on the axial reaction of the crane’s legs. Of the three engineering design parameters (portal drift, vertical reaction, and total base shear), the elastic modulus exhibits a low effect, but it should be considered a source of uncertainty in seismic analysis.
1. Introduction
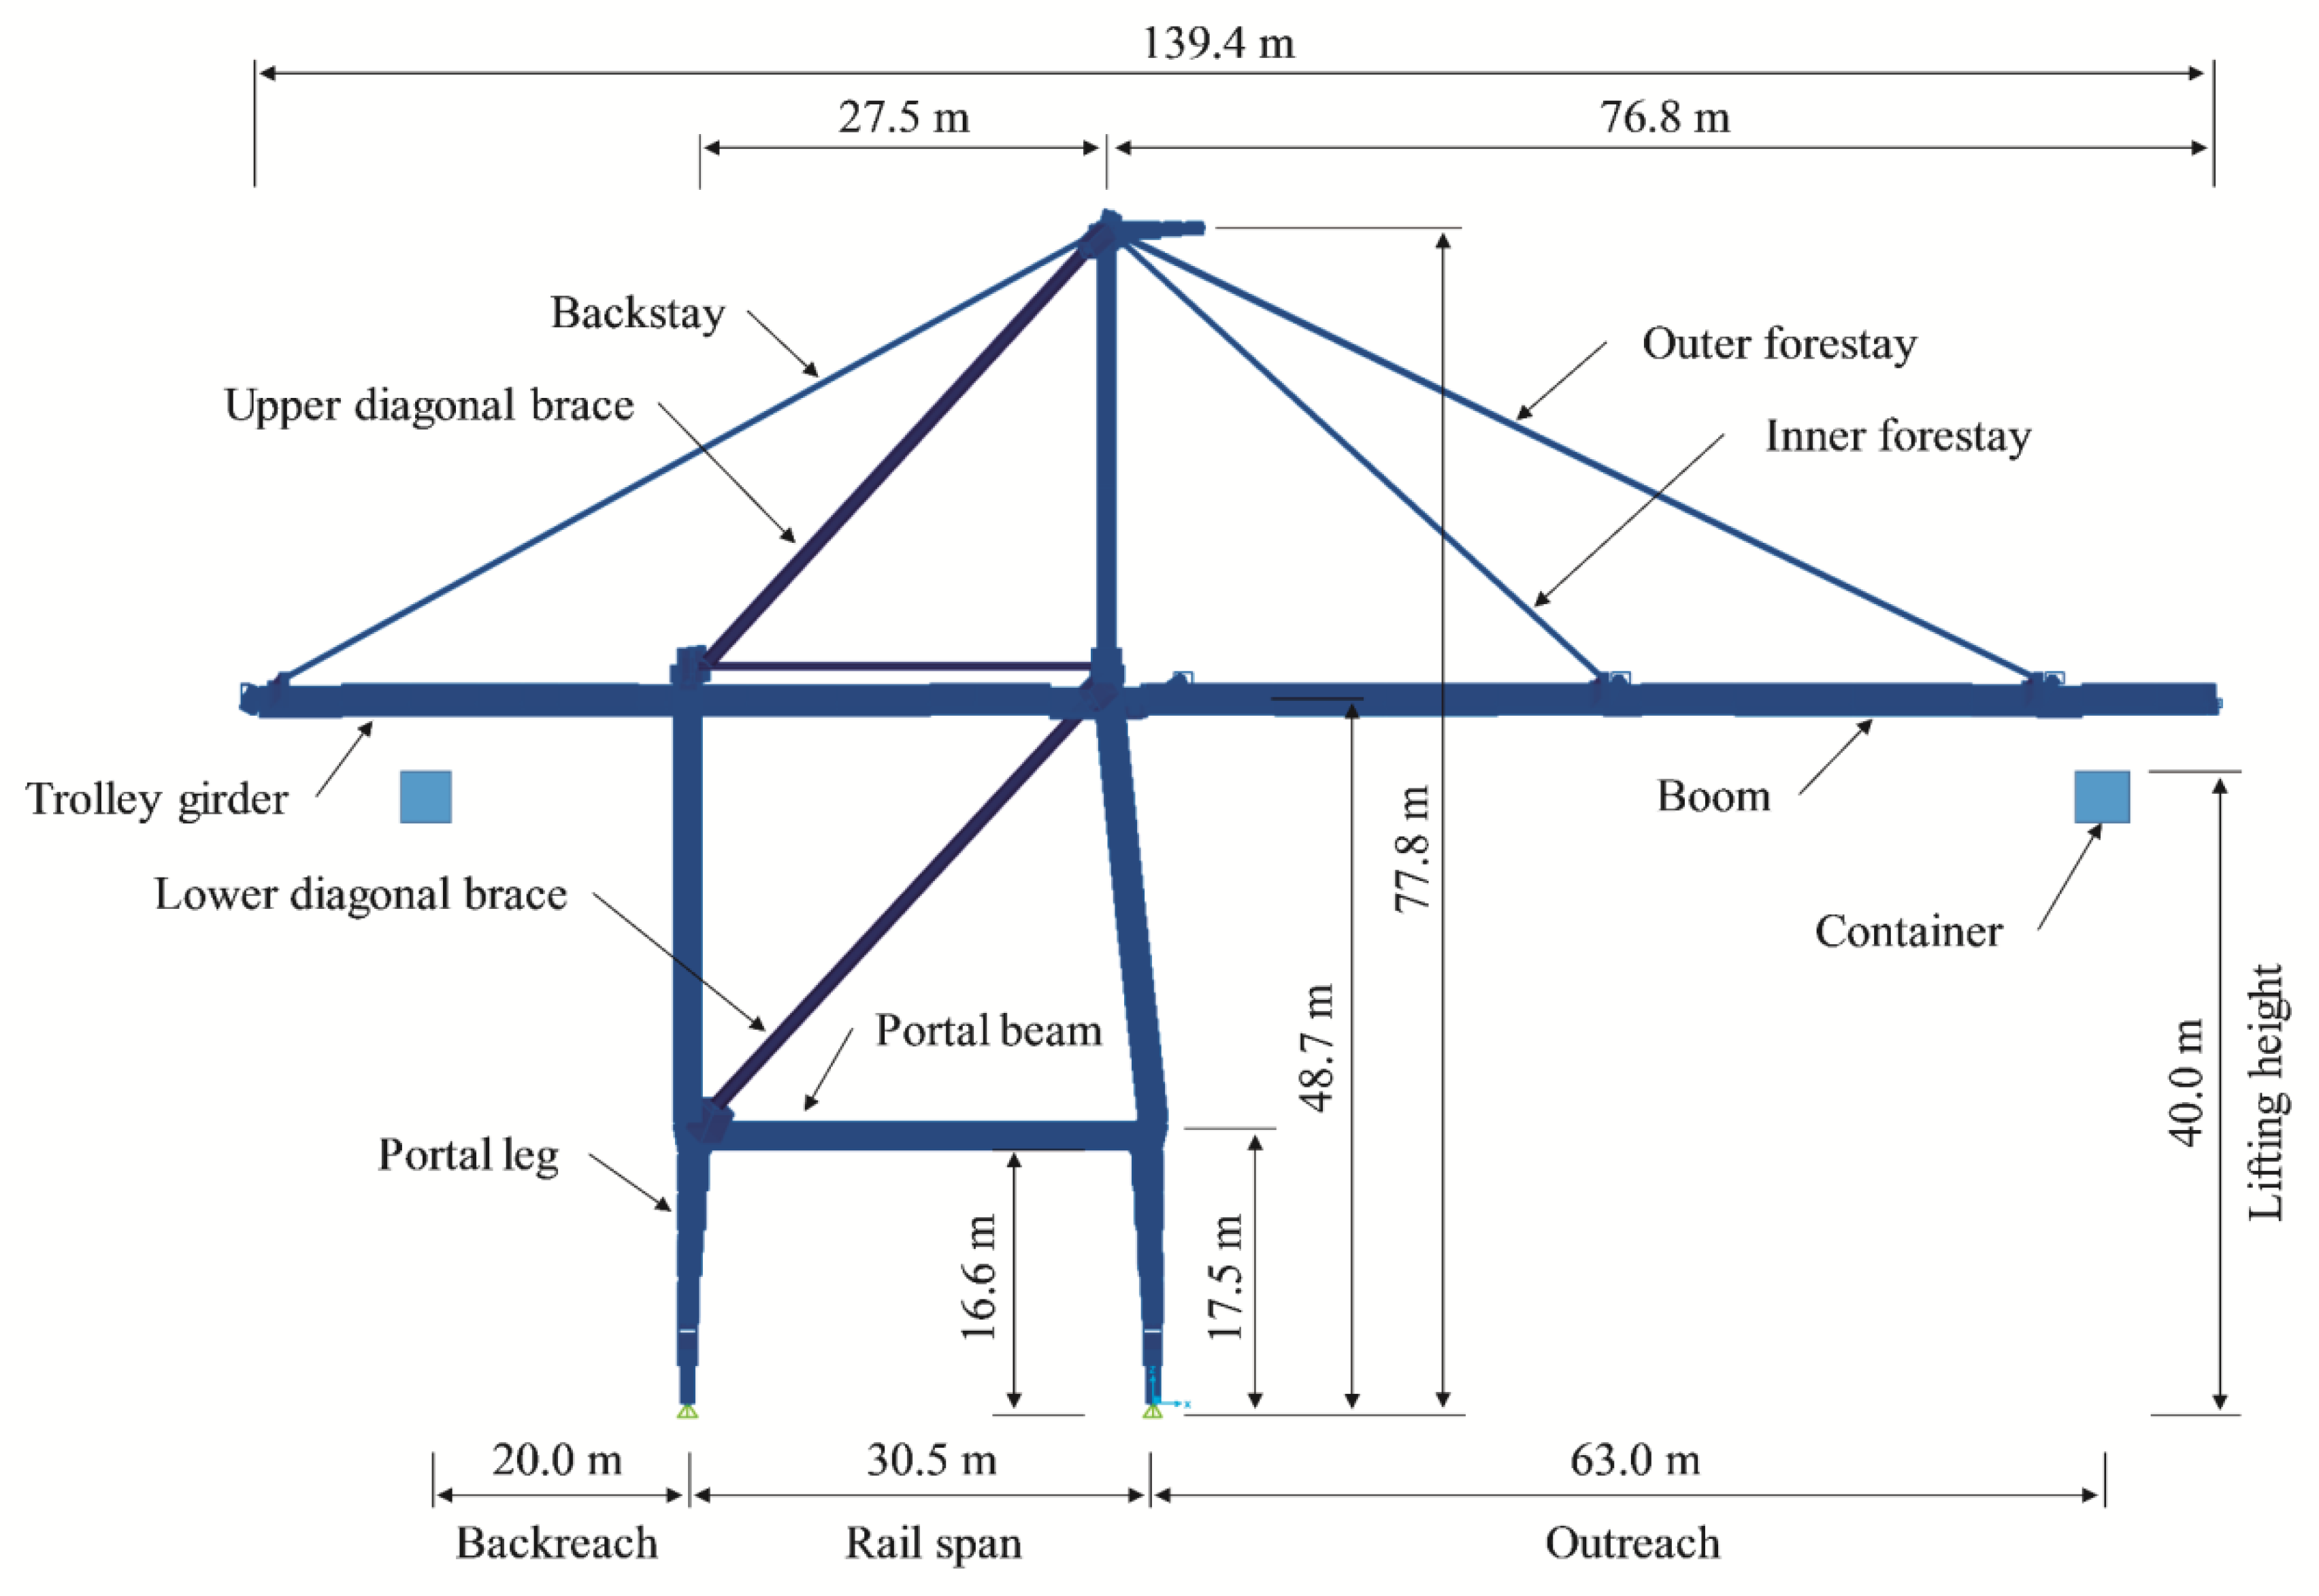
Ship-to-shore (STS) gantry container cranes are commonly used to transfer loaded containers to and from ships. The safety and efficiency of their movements are economic building blocks for many nations. The basic container crane transfer mechanism is shown in Figure 1. The container crane is located on rails which are laid on a quay wall/wharf. The rail gage/span is about 30.5 m to allow room between the legs for the hatch covers and maintenance vehicles [1]. The portal frame serves as the main structure supporting the whole crane. Thus, most of the failure mechanisms that appeared during past earthquakes were due to the portal legs. The height of the trolley and boom are approximately 48.7 m to suit the needs for vessels. However, the higher the trolley above the quay wall, the more difficult it is to control the load [2]. The 63-m outreach allows the crane to lift containers for vessels with 22 containers on deck. The whole structure is made of steel plate, except for the diagonal braces which use steel tubes. Aside from the crane’s own weight, other external loads to which the crane is subjected include stairs, drive trucks, stowed pins, machinery house, ½ festoon, snag device, boom hoist rope, etc. The material properties and the kinds of loadings are described in detail in the following sections.
Unlike the types of structures that are extensively studied all over the world such as buildings, bridges, nuclear power plants, etc., STS container cranes do not receive the attention they deserve, as ordinary people have limited exposure to them during everyday use; as a result, they do not receive the attention they deserve. For crane design, wind loads (i.e., operating condition loads and overload conditions) are the most important sources used to design the cranes, more so than seismic load because earthquakes rarely occur [3], especially in low-seismicity countries. However, once such a crane collapses due to earthquake, the economic and human influence will be hard to predict. Just as with the design of any commonly used structure, STS container cranes need to be designed in the presence of major sources of uncertainty. Some of the major design variables may be similar or the same to those of the other commonly used structures. However, the propagation of uncertainties from the parameter to the system level is expected to be very different because of the unique configurations of the STS systems, different performance requirements of the systems, and different consequences of failure.
The overall design concept of an STS crane is critically evaluated in this paper while emphasizing the presence of uncertainty in the design variables. This study identifies several important design parameters and their effects or sensitivity in maintaining or satisfying the overall performance requirements subjected to similar risks and reliabilities of other structures. Since the major sources of uncertainty cannot be completely eliminated, managing these uncertainties in the most appropriate way is expected to produce the most economical and damage-tolerant STS that can benefit the world communities in the most efficient way. Alternatively, efforts must be made to reduce the implication of the presence of uncertainty in them as much as possible. In this study, time-history ground motions are applied to a three-dimensional (3D) finite element (FE) model with an assumption that the output is a deterministic function of a variety of input variables. The FE model of this study refers to an STS container crane located in South Korea. The analysis employs a tornado diagram approach in which all random variables are expressed as a set of horizontal bars, referred to as swings [4,5,6]. The wider the swing of an input variable, the larger the effect on the response of the structure.
The rest of this article is structured as follows: Section 2 will introduce the methodology of the sensitivity analysis. Sources of uncertainty will be described in Section 3, which covers major random variables. Section 4 provides dynamic analyses on the 3D numerical model with discussions focusing on the responses of the structure in terms of portal drift, vertical reaction of the crane’s legs, and total base shear. Finally, the conclusions are summarized in Section 5.
2. Methodology of Sensitivity Analysis
To determine the relative significance of each uncertain input variable to the uncertainty of output values which are the so-called engineering design parameters (EDPs), two methods can be used: the First-Order Second-Moment (FOSM) method [7] and tornado diagram [4,6,8]. For the FOSM method, a FE model is used as the method to develop the performance function, and the response sensitivities can be computed using the finite difference approach by perturbing every variable and calculating the corresponding change in response through multiple deterministic analyses [9,10]. The tornado diagram method is commonly used to indicate the sensitivity of uncertain output values in terms of “swings” which are displayed in the descending order of swing size on the horizontal bar charts [4,7], as illustrated in Figure 2.
The sources of uncertainties come from both aleatory (physical randomness) and epistemic (state of knowledge) uncertainties, which include applied load (e.g., recorded or artificial time-history ground motions), material properties, mass, and damping. The issue that relates to the partially restrained connections of the steel structure is not considered in this study because the information of the uncertainty of the joints (i.e., welded or bolted) is not fully studied and not reliable to be applied for the container crane. For this study, the output values (or EDPs) are assumed to involve a known deterministic function of a variety of input variables, in this case a finite element model that gives the structural responses from a set of input variables. Each input variable is defined by a probability distribution with median (best estimate) and coefficient of variation (COV). First, to determine the best estimate of the output variable (or to establish the baseline output of the tornado diagram), all the input variables are set to their medians. Then, one input is set twice, each time using one of the extreme values which can be the upper or lower bounds of its probability distribution, and the output is measured to yield the upper and lower bounds of the output results of each input variable [6]. The absolute difference between these two bounding values is referred to as the swing. The same process is repeated for the next input variables. Figure 2 shows the procedure of developing a tornado diagram. A larger swing reflects the significance of the input uncertainty, while a small swing of the EDP means that the uncertainty of the input variable is not notable; hence, it can be considered as a fixed variable (i.e., median value) to reduce the cost of numerical analysis in practice.
3. Sources of Uncertainty
3.1. Uncertainty in Ground Motion Intensity and Method of Intensity Selection
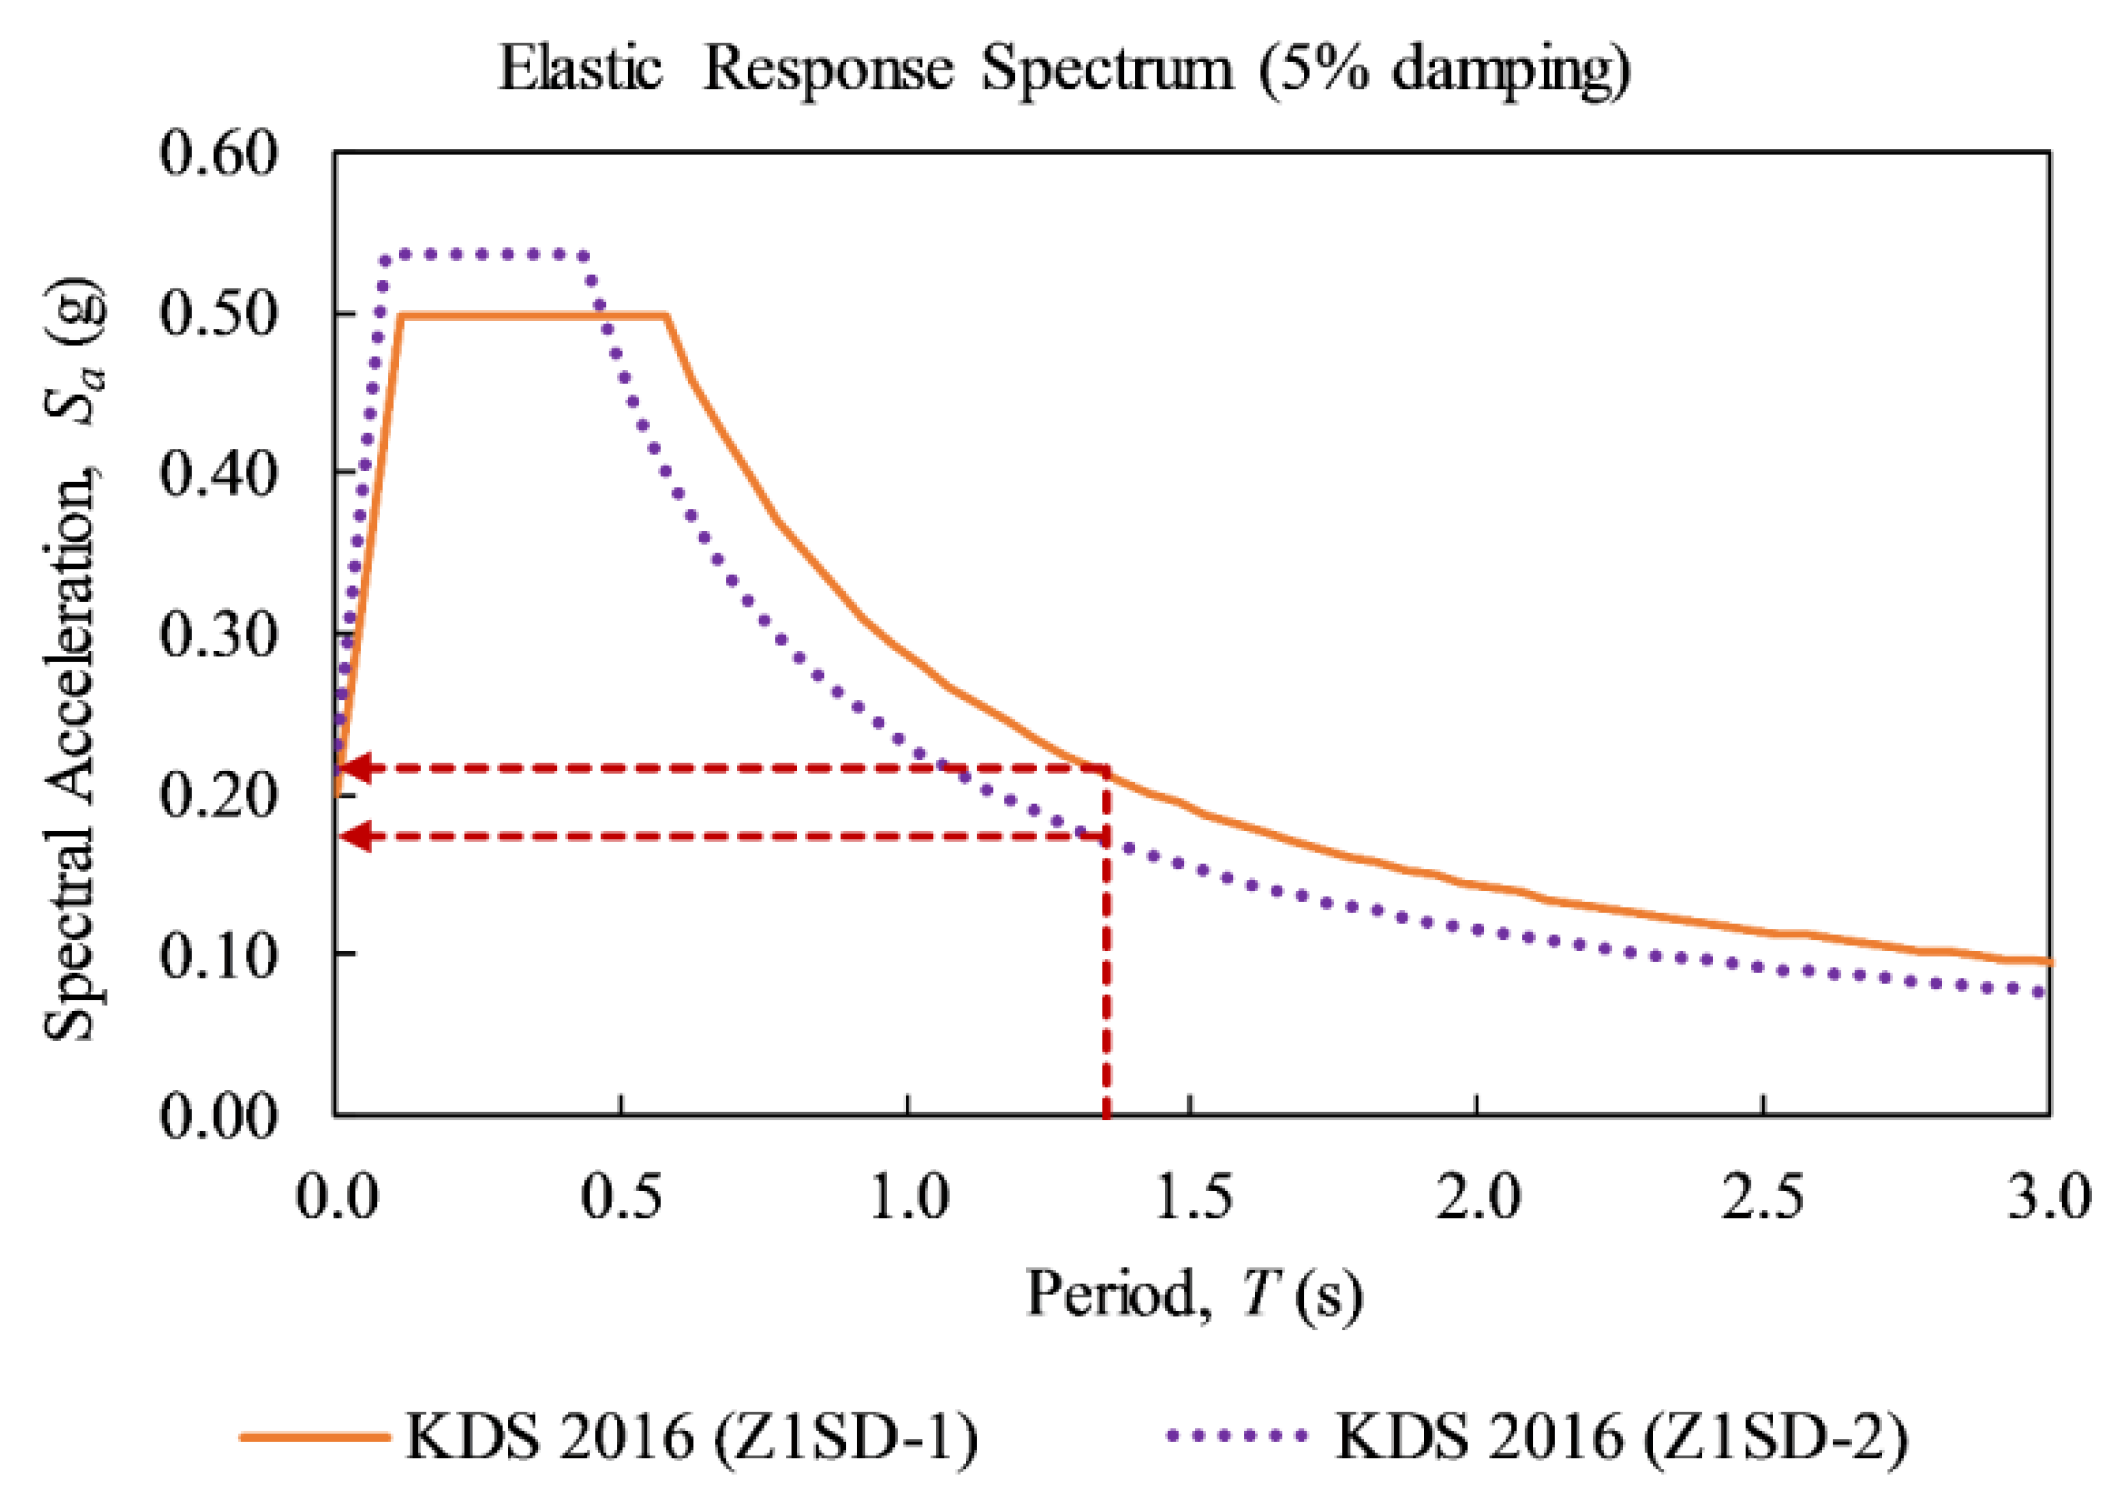
Intensity measures (IM) are useful, such as the information on the occurrence probability of a ground motion with a given IM level. The typical IM of an earthquake is commonly measured by peak ground motions (i.e., acceleration PGA, velocity PGV, or displacement PGD) or the spectral responses of structure (i.e., acceleration Sa, velocity Sv, or displacement Sd). The IM of an earthquake reflects the correlation of structural performance or damage. An IM candidate must satisfy two criteria, which are a proper IM to EDP of interest and an available probability function of occurrence [6]. For a 30.5 m-span STS gantry container crane having a long fundamental period ranging from 1.3 s to 2.1 s [1,11,12], the elastic spectral acceleration (Sa) is a more proper input variable to be selected compared to the peak ground acceleration. In addition, the spectral acceleration at the fundamental period of the structure relates to uniform hazard analysis that is commonly suggested in worldwide seismic guidelines. For instance, Figure 3 shows an example of two elastic response spectra constructed based on the Korean Design Standard (KDS) for seismic zone I and soil type SD-1 and SD-2 [13]. It can clearly be seen that the response spectrum of Z1SD-2 is developed from a higher peak ground acceleration (PGA) than that of Z1SD-1, they are 0.199 g and 0.214 g for Z1SD-1 and Z1SD-2, respectively. However, this does not reflect the actual response of the structure. In particular, in this study, at the fundamental period of 1.35 s of the Korean container crane, the spectral response of acceleration under Z1SD-1 earthquake is 0.217 g higher than that of Z1SD-2 of 0.174 g, as shown in Figure 3. In this study, therefore, the spectral acceleration (Sa) is a suitable input variable to consider the uncertainty in ground motion intensity and profile.
Two criteria for selection of an IM have been proposed by several researchers [8]: The first method strongly correlates with the performance variable of interest (i.e., damage factor). The second method uses hazard information (i.e., the information on the occurrence probability of an earthquake with a given IM level) [4]. In this study, the three Sa values selected corresponded to the seismic zone I of KDS [13] for return periods of 100, 500, and 2400 years, considered as the lower bound, median, and upper bounds, respectively. The adjustment of the amplitude according to local site conditions for numerical analyses will be explained in detail in Section 4.2.
3.2. Uncertainty in Ground Motion Profile
The ground motions generated from an earthquake reflect the features of many factors such as seismic source, the types of rupture, travel path, and local site conditions. As a result, the characteristics of ground motion near an active fault can be significantly different from those far from an active fault [14]. Motion decreases in high-frequency energy while it increases in low-frequency energy as distance increases [15]. A well-defined distance over which a site may be classified as either near- or far-fault has not yet been agreed upon. Chopra & Chintanapakdee [16] concluded on the characteristics of near-fault and far-fault motions such that the velocity-sensitive region for near-fault motions is much narrower, and the acceleration-sensitive and displacement-sensitive regions are much wider than those of far-fault motions. In other cases, near-fault is considered to be within a distance roughly equal to the ruptured length of the fault (i.e., 20 to 60 km typical). For many engineering applications, a zone within about 20 km of the fault distance is considered to be near-fault [17]. In this study, a set of 20 ground motion profiles, where each is scaled corresponding to the target IMs selected in Section 3.1, was used to obtain the EDP values by analyzing a 3D finite element model. Both near- and far-fault ground motions are considered. Then, the best estimate (50th percentiles) and lower and upper bound (10th and 90th percentiles) profiles can be chosen by sorting the EDPs in descending order. This process was mentioned by Lee & Mosalam [6] and Porter et al. [4] for buildings and structural components and by Kosbab for crane structures [5].
3.3. Uncertainty in Material Properties
The structure was made of steel with different cross-sectional areas. The properties of the materials comply with the Japanese Industrial Standards (JIS) which are JIS-SM490Y and JIS-STK490 for steel plate (i.e., hollow box sections and wide-flange shapes, respectively) and steel tubes of diagonal braces, respectively. According to Galambos and Ravindra, Young’s modulus is taken as a Gaussian distribution with a mean of 200 GPa and COV of 0.06 [18]. Information on JIS steel is not widely shared with the public, thus, the COV of steel yield strength is selected as 0.07, corresponding to the normal distribution of the A592 plate steel (or A709 steel with an additional requirement for Charpy V-notch impact test [5]) reported by Liu et al. [19]. The selected statistical properties of each random variable used for numerical analyses in this study are summarized in Table 1. In this study, by pre-analyzing the influence of yield strength on the portal drift, toe’s reaction, and total base shear, it is shown that the yield strength can be fixed as a mean value in sensitivity analysis. Hence, the yield strength will not be discussed in Section 4.
3.4. Uncertainty in Mass
Container crane mass is an uncertain variable for several reasons, such as the differences between a crane as-built and the initial design documents, the differences between the real equipment and crane components used compared to the design (e.g., machine house, cable rollers, ladders, or ½ festoon), and the exact unit weights of the materials. The probability distribution on dead load can be assumed as a Gaussian distribution with a COV of 0.10, as proposed by previous studies [1,19]. From the structure of this study, the total weight of the structure includes structural frame itself (i.e., portal legs, portal beam, trolley girder, boom, diagonal braces, etc.) and external loads (i.e., stairs, drive trucks, stowed pins, machinery house, ½ festoon, snag device, boom hoist rope, etc.), as shown in Table 2. Nodal masses are computed from the dead loads, in which all nodal masses are assigned for upper or lower bound levels together with the appropriate ratio. The median value of mass is considered to be nominal mass (Mn) with a ratio of 1.0.
3.5. Uncertainty in Damping Ratio
According to the on-site experiment conducted by Kohama et al. [20], the container crane was excited by the actuator at a height of about 40 m at the tie beam level. A cyclic loading at the same period with the natural periods of the crane was applied, the damping factor of the crane was then assessed from the decrease of amplitude during free vibration after cutting off the cyclic loading. It was shown that the damping factor ranged from approximately 0.2% to 0.4% and was always less than 2.5%, as for general steel structures. The damping ratios determined from the forced vibration test for two steel-frame buildings were proposed by Taoko [21]. The average of the observing damping ratios was reported as 1.1% with a COV of 0.3. Porter et al. also used a COV of 0.4 for their study on sensitivity analysis of building loss estimates. The modal parameters of the container crane in Koper port, Slovenia were numerically obtained using FEM with experimental verification by performing a full-scale forced vibration experiment, introduced by Dinevski et al. [12]. In particular, the structure was forced into the specific vibration mode with limited operational movements. Then, spectral analysis with Fourier transformation was conducted to obtain the frequency response. The portal sway in trolley travel direction behaved at a dominant frequency of 0.75 Hz (or period of 1.33 s). Thus, the average damping measured for this mode is 1.0% of critical damping. In addition, based on industry experience, a damping ratio of 1.5% is evaluated in the critical portal sway mode [5,22]. A recent study on a 1:20 scale container crane experiment that included verification through a numerical approach found that the sway in the portal frame had a damping ratio of 0.84%. In this study, the Rayleigh damping is taken as 1.5% with a COV of 0.3 assumed as Gaussian distribution, as recommended by Kosbab B.D. [5].
4. Analysis of Korea Container Crane
4.1. Container Crane Descriptions
The 30.5 m-span container crane of this study is a special steel structure located at a seaport in South Korea. The structures are made with stiffened hollow box sections, tubes, and wide-flange shapes in complying with JIS-SM490Y and JIS-STK490 of JIS, as mentioned earlier in Table 1. The crane has an outreach of 63 m and lifts above the crane rail of 40 m with a lifting capacity of 61 tons under spreader and 80 tons under cargo beam. The rail gage/span is 30.5 m and keeps a typical outreach-to-gage ratio of 2:1, in a similar fashion with most of the A-frame container cranes used worldwide, as illustrated in Figure 1 [23].
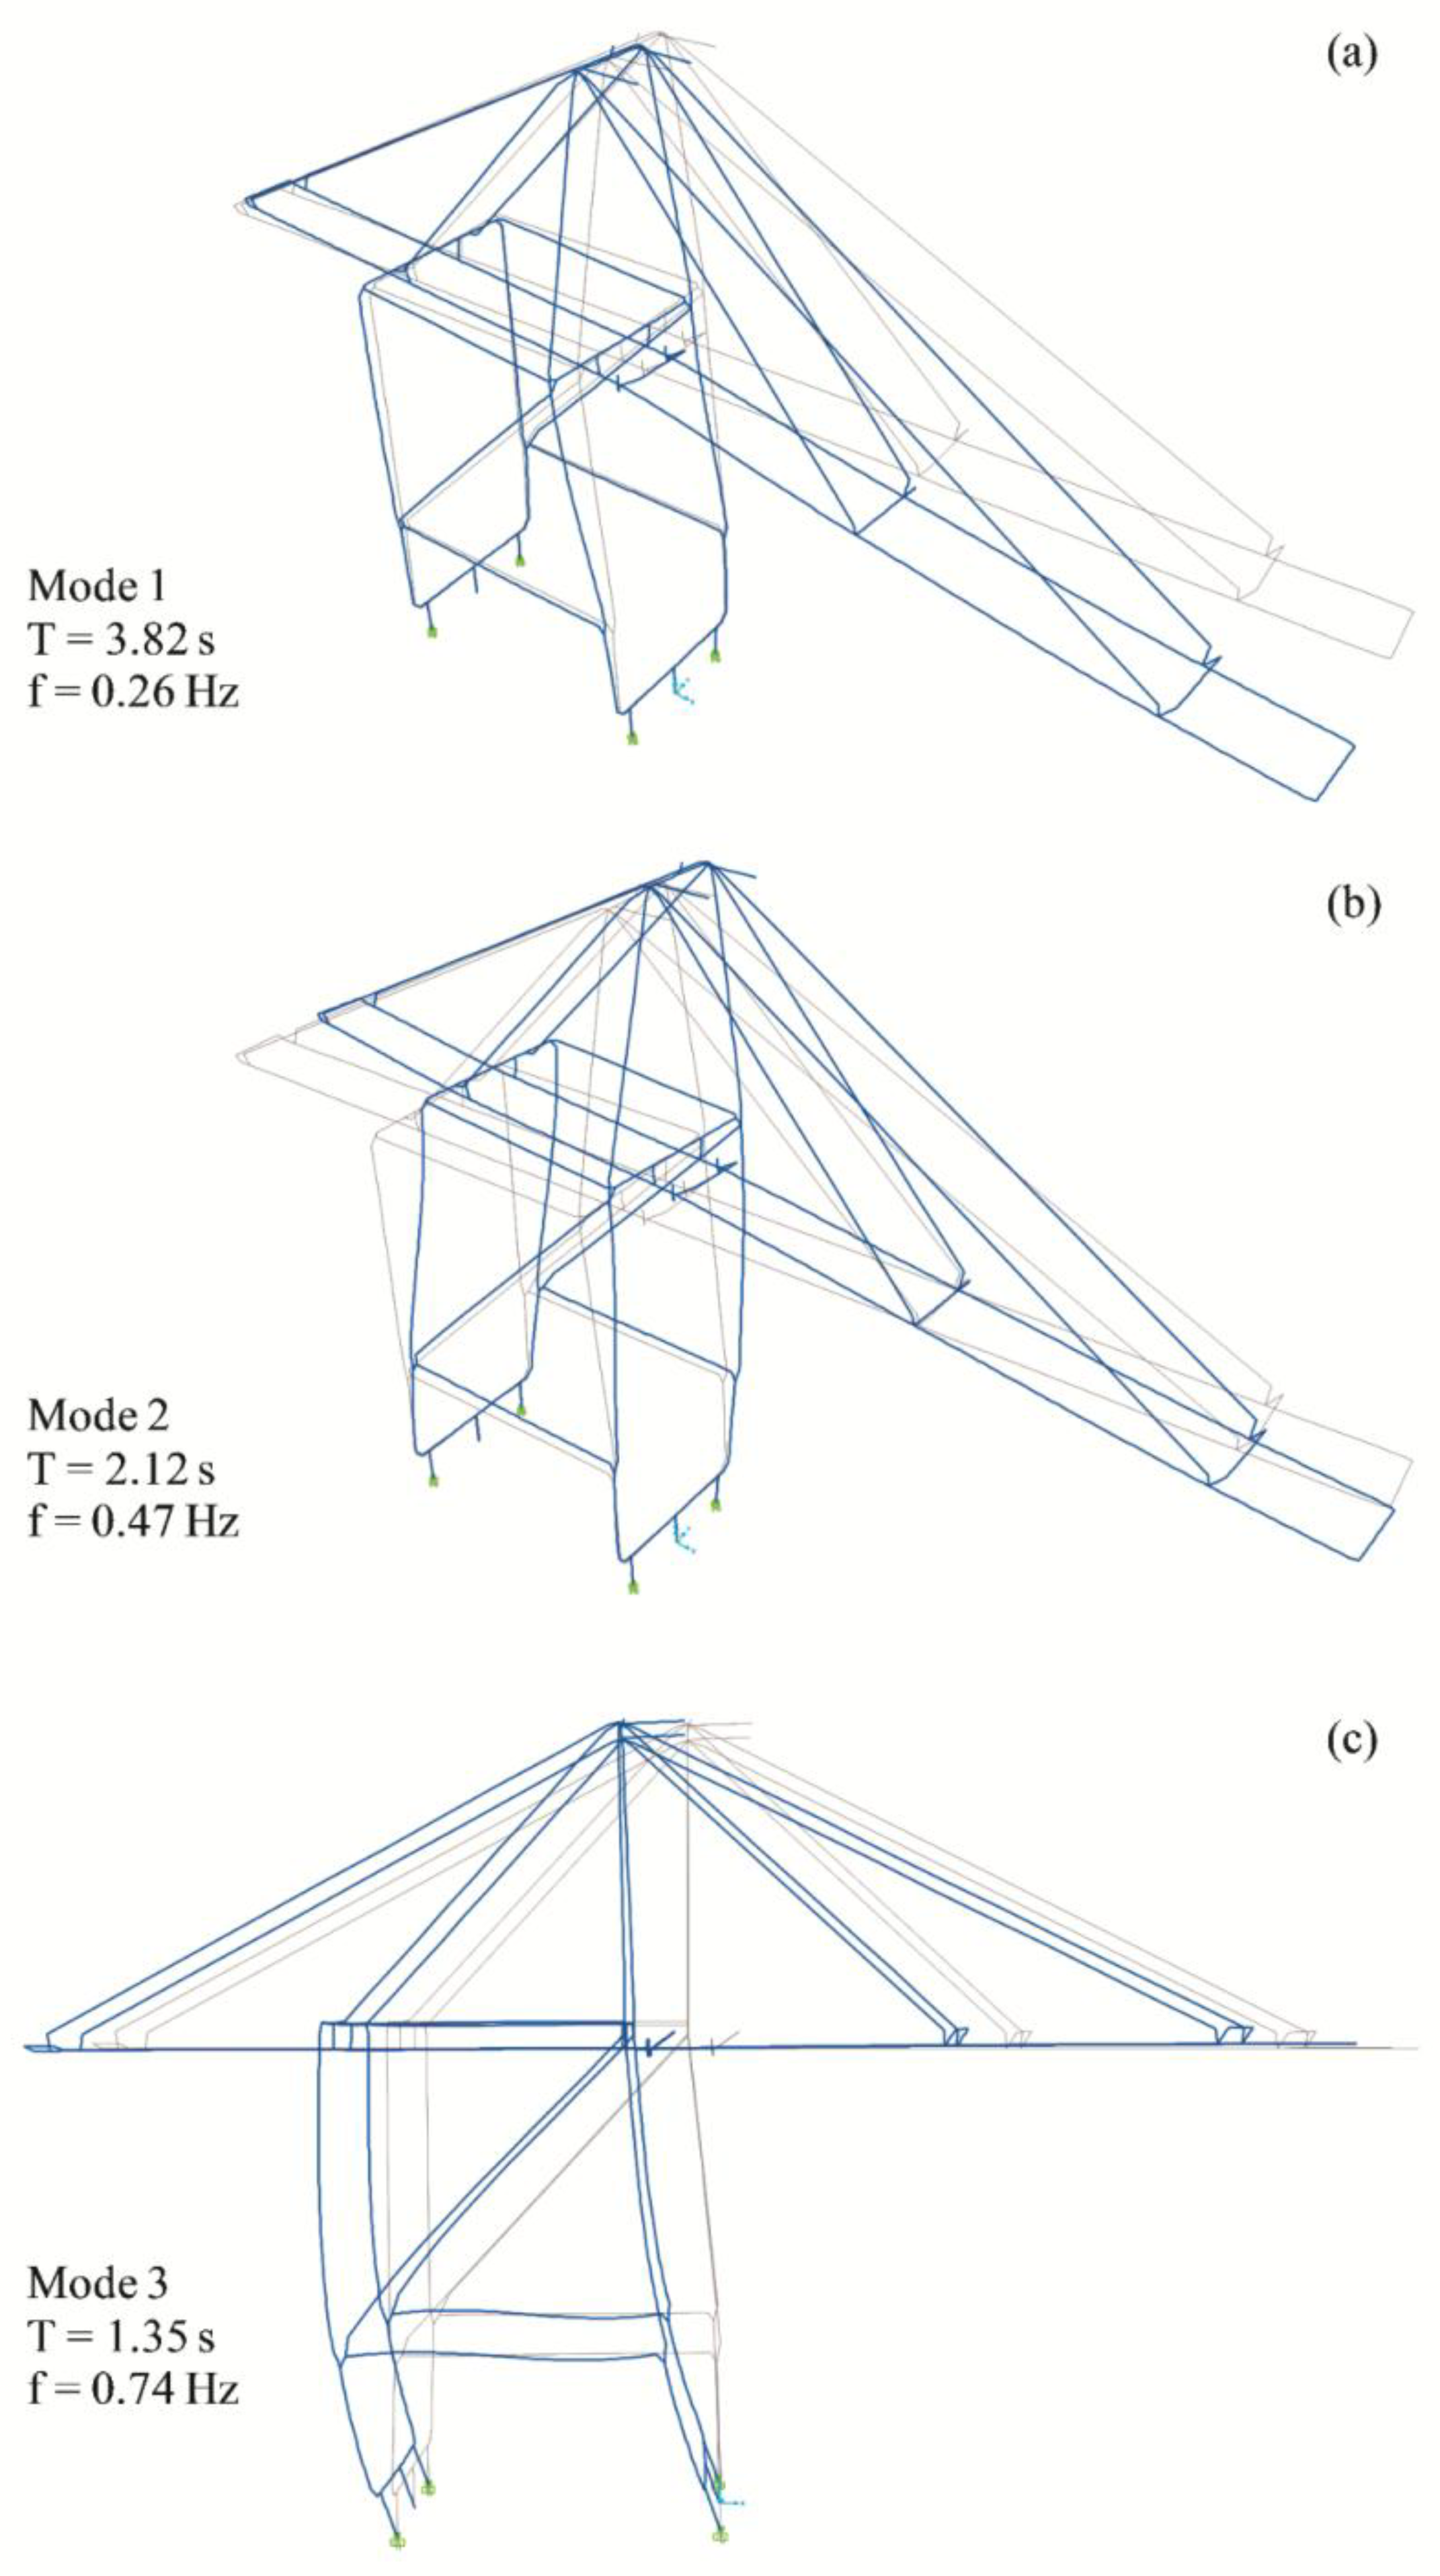
The modal shapes were obtained through Ritz-vectors analysis, which is efficient and widely used for dynamic analyses. Twelve modal shapes are considered in the analysis. Only the first three modal shapes with their corresponding natural periods and frequencies are illustrated in Figure 4. According to past experiences [1,5,22,24], typical failure modes during earthquakes are pull-out of vehicle (uplift), derailment, buckling, and overturning, or the rupture of clamps and anchors in the case that the crane at rest is fixed to the rails or quay wall. Most of the collapse mechanisms result in tilting and overturning in the trolley travel direction [24]. In this study, therefore, the selected fundamental sway is assumed to be mode 3 with a period T = 1.35 s. The sway in the trolley travel direction is also known as the term “portal sway”, as defined by Jacobs L.D. [22]. The numerical results of this study also show mode 3 having a modal participation ratio of over 90% in trolley travel direction (landside-to-waterside direction). Thus, mode 3 is considered to be the fundamental mode in this study.
4.2. Selection of Ground Motions
The crane is located on a reclamation area which used to be a soft ground area with a standard penetration test (SPT) N-value smaller than 10 (based on data of over 50 boreholes obtained prior to reclamation). To consider the effects of local soil conditions serving for the seismic analysis of the crane, ten more boreholes have been made within 30 m depth at the site. Several laboratory and field-testing methods were used, such as SPT; water ground measurement; cone penetration test (CPT); and density logging, especially the S-PS logging test for measuring P-wave and S-wave velocity. A summary of the soil properties at a specific harbor is shown in Table 3. The soil investigation report at the crane location showed that the mean shear wave velocity for the top 30 m of ground throughout the five boreholes of the S-PS logging test ranged from 247 m/s to 447 m/s.
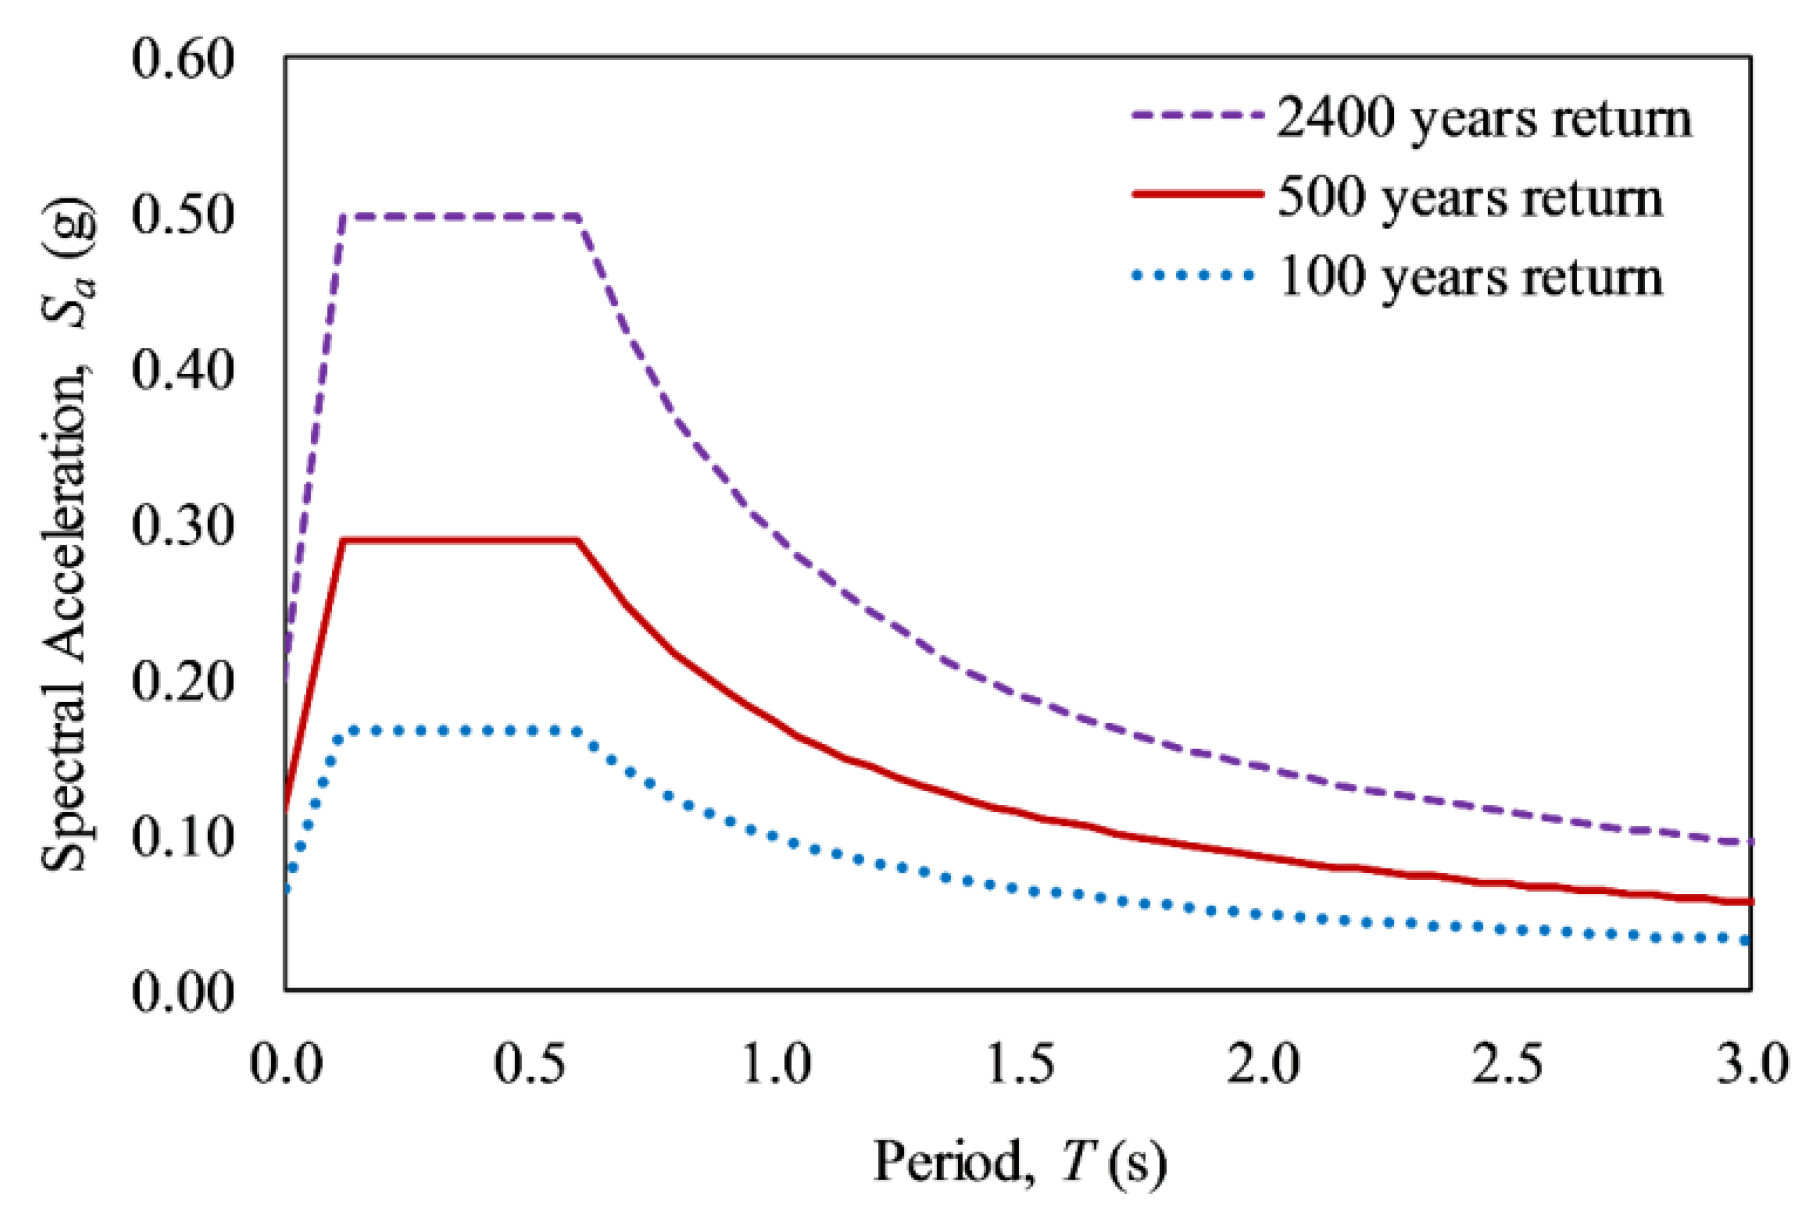
Based on the crane’s site, seismic zone I is identified, at which a seismic zone factor S = 0.22 g is assigned for a maximum considered earthquake (MCE) with a 2400-year mean recurrence interval. The design acceleration response spectrum is then developed corresponding to site coefficients Fa and Fv. From the soil investigation results, the average shear wave velocity of the ground within 30 m depth is approximately 338 m/s, thus the soil type SD is selected according to KDS [13]. Correspondingly, the spectral acceleration (Sa) at the structure’s fundamental mode (T = 1.35 s) is approximately 0.21 g. This shaking intensity is considered to be the upper-bound value. The lower bound is selected as a seismic zone factor S = 0.06 g (equivalent to a 100-year return period), whereas the median shaking intensity is chosen corresponding to a 500-year return period with S = 0.11 g. These elastic response spectra are provided by KDS, as shown in Figure 5. The selected Sa at the fundamental periods of the structure are estimated at 0.07 g, 0.13 g, and 0.21 g for the lower bound, median, and upper bounds of ground motions, respectively.
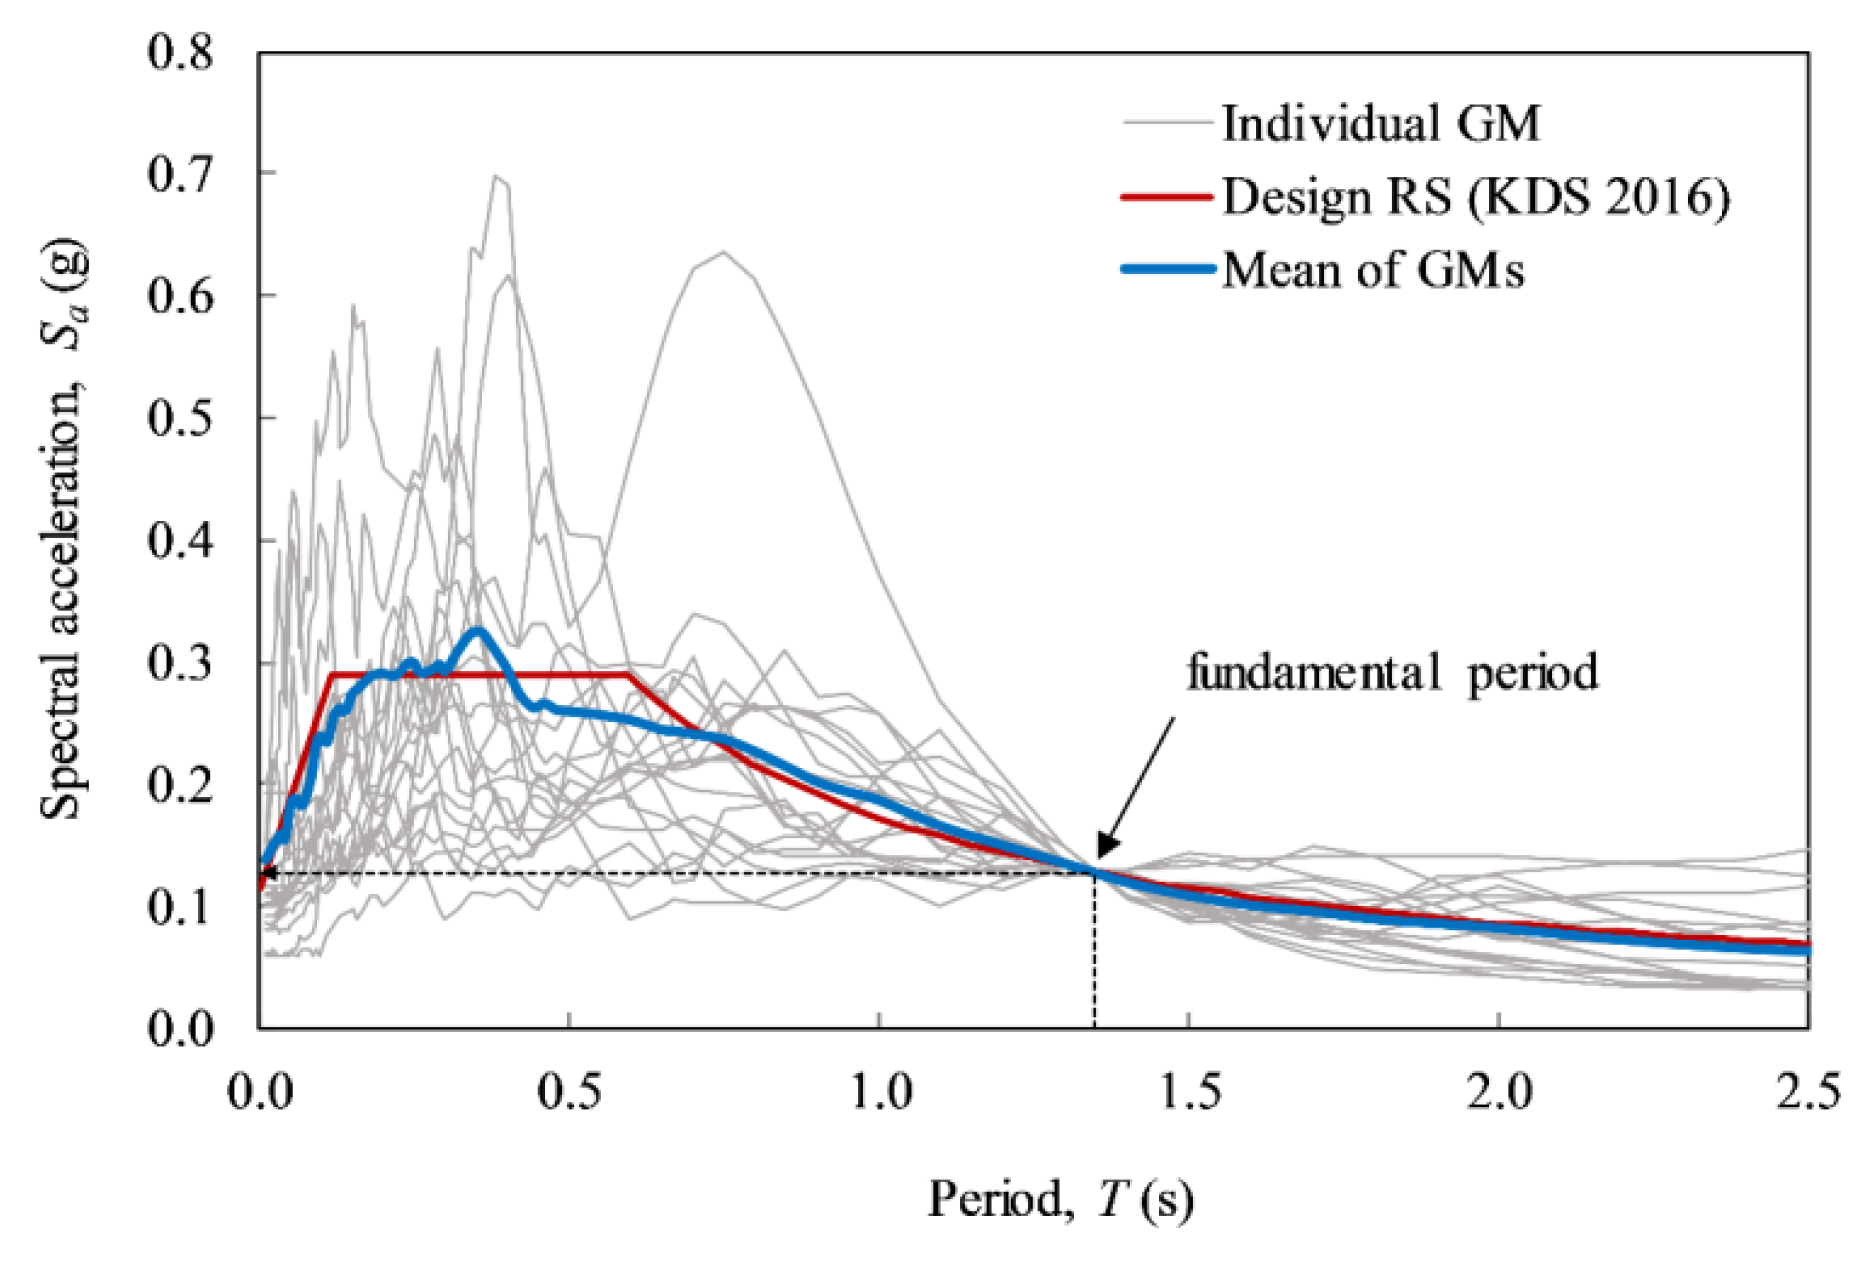
A set of 20 natural time-history ground motions worldwide is used in this study [23,25]. They are summarized in Table 4. These ground motions have different magnitudes, durations, PGAs, and fault distances, and were recorded from 1940 to 1999. The response spectra of these unscaled ground motions are scaled corresponding to the three earthquake target IM levels to generate 60 different time-history ground motions. Then, all input earthquakes are applied to a 3D FE model using nonlinear time-history analysis. Then, the best estimate, and lower and upper bound (10th and 90th percentiles) profiles can be chosen by sorting the EDPs, as previously mentioned in Section 3.2. An illustrated example of the scaled elastic response spectra of natural ground motions to the median shaking intensity is depicted in Figure 6.
4.3. Fast Nonlinear Analysis (FNA)
A 3D FE model was simulated using SAP2000 software package. The number of elements were 9912 frame elements and four link elements at the base supports. End releases were applied to the forestay, backstay, and diagonal brace elements to conform with the real behavior of the structure. All the nonstructural loads as mentioned in Section 3.4 were applied as concentrated and distributed loads. Both structural load and nonstructural loads were considered as gravity loads serving for seismic analysis. FNA, also known as nonlinear modal time-history analysis, is used in this study. The equation of motion can be expressed as follows [26]:
where M, C, and K are the mass, proportional viscous damping, and stiffness matrices, respectively; the RNL(t) is the nonlinear-object force vector from the sum of the forces in the nonlinear elements; and R(t) is the applied load [26,27]. The geometric nonlinearity was taken into account with P-Δ effects. The Rayleigh damping, β, which is said to be proportional to the stiffness and mass matrix, was applied in this study as follows [5]:
The Rayleigh damping of the nth mode can be obtained by
If the two modes are ωi and ωj, they have equal damping ratios. The coefficients a0 (mass proportional) and a1 (stiffness proportional) can be obtained as
The two modes selected were the boom torsion (mode 1) and portal sway mode (mode 3), as shown in Figure 4. The a0 and a1 were calculated as being approximately 3.64 × 10⁻² and 4.80 × 10⁻³, respectively, corresponding to an assumed damping ratio of 1.5%. To consider the nonlinear behavior, the concentrated plastic hinge method was applied to the portal frames with the assumption that they develop at the end of each frame [28]. The hinge’s properties are suggested as defined in ASCE/SEI 41-13 [29].
For the boundary conditions, pinned and gap element supports are two common support bases for analyzing a crane structure. A pinned boundary would be a reasonable choice for when there are no uplift and derailment for the analysis of wind or seismic resistance; or when the crane is fixed to rails with clamps or to a quay wall with anchors in large wind seasons such as hurricanes and typhoons. In this study, however, uplift behavior is expected to be performed. Thus, a gap link element is used to simulate the contact between trucks and rail, in which this link element is activated when structures come closer and deactivated when they go far away [27]. This means that the gap element is only compressed. Hence, it is possible to consider the uplift behavior of the crane in the operation without anchor fixing. The gap element does not remove itself from the horizontal direction during uplift. It is also the main limit of this support boundary, as discussed in detail by Kosbab B.D. [5].
For the input ground motions, a combined vertical/horizontal load analysis is not required for standard structures. For example, in ordinary standard bridges where the PGA is expected to be 0.6 g or greater, the structures will be considered in terms of the effect of vertical acceleration. In particular, an equivalent static vertical load with a magnitude of 25% of the dead load of the structure shall be applied to the superstructure upward and downward in order to estimate the effect of vertical acceleration, as mentioned in Caltrans 2013 [30]. For container cranes, the impact of vertical ground motion on the response of the container crane is significant for a high level of excitation. According to the experiments mentioned in Kosbab’s dissertation performed using ground motions with and without a vertical component, the change in maximum portal drift was approximately 0.1% for low levels of excitation (Sa (0.3 s) ≤ 0.5 g), while it was about 0.5% of portal drift for large levels of excitation (Sa (0.3 s) > 0.5 g) [5]. A comprehensive study on the influence of vertical ground motion should be analyzed on a whole complex soil-structure interaction and quay wall system. However, this is beyond the scope of our study. A simpler model is proposed to be used to reduce the cost and time-consuming nature in terms of sensitivity analysis. In this study, therefore, the vertical ground motions are neglected.
4.4. Sensitivity Analysis for Container Crane
The lower and upper bounds corresponding to 10th and 90th percentile values are calculated by the mean of the assumed normal distribution using the following equation [31]:
where μ and σ are the mean and standard deviation of the variable X and Z is the value of the standard normal distribution for the desired percentile (i.e., Z is equal to −1.282 and 1.282 for 10th and 90th percentile, respectively). All the input parameters are listed in Table 5. Notably, that the scaling factor (αi) in Table 5 is the ratio of the target acceleration spectrum (i.e., Sa target = 0.07 g, 0.13 g, and 0.21 g) to an ith acceleration spectrum, αi = Sa target/Sai.
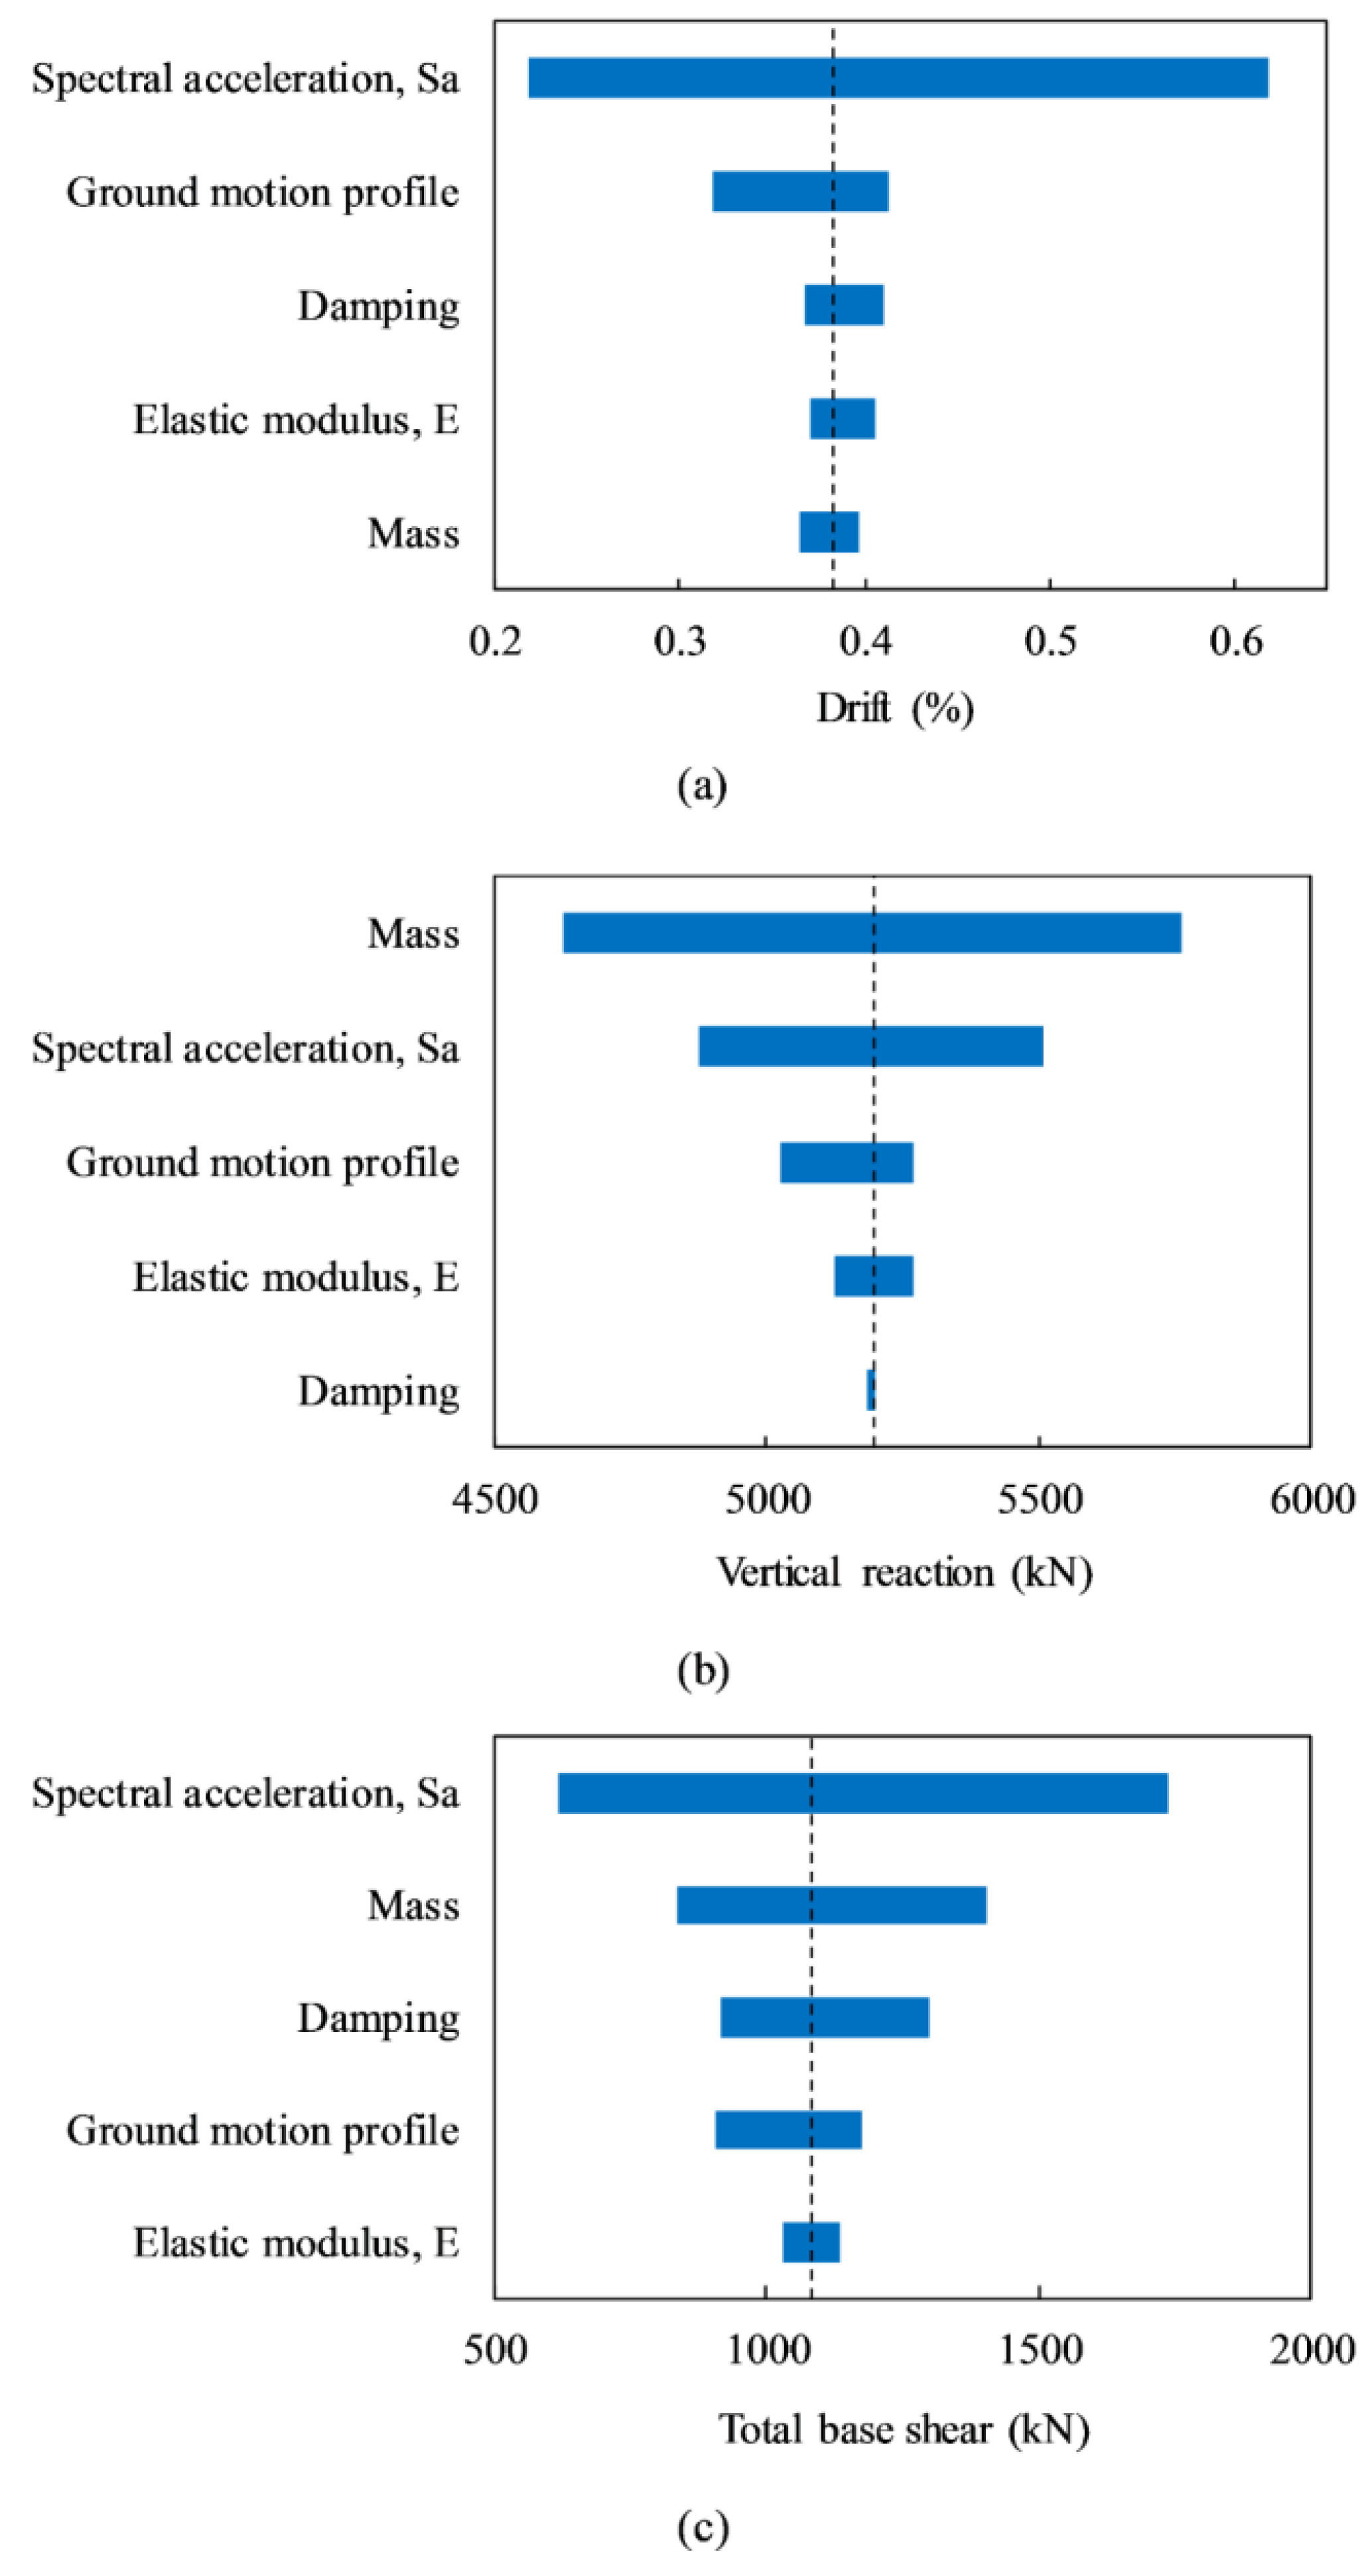
The swing analysis through “tornado diagrams” is shown in Figure 7. For the portal drift of the crane, the largest swing is associated with the ground motion intensity, which is approximately 0.4%. The second notable sensitivity is from the characteristics of the ground motion profile. The portal drift was from 0.32% to 0.42% (or a swing of around 0.1%). Of the structural properties, the damping, elastic modulus, and mass all have a low impact, with swing values of 0.043%, 0.035%, and 0.032%, respectively. The IM level plays a significant impact on the displacement of the structure in terms of portal drift. Under an IM level (Sa) ranging from 0.07 g to 0.21 g, the drift at the top of the portal frame fluctuates from 0.22% to 0.62%.
While the ground motion intensity is the most sensitive in terms of portal drift, mass has the highest effect on the vertical reaction of the crane legs. The oscillation of the vertical reaction along the seaside legs of the crane (for example, node 40 of the FE model, as shown in Figure 7b) is between 4628 to 5762 kN, corresponding to a swing of approximately 1134 kN. In contrast, the damping showed the lowest sensitivity, with a swing of roughly 13.5 kN, occupying around 1.2% compared to the effect of mass. The IM level also shows a remarkable effect on the increase of the axial reaction of the crane’s legs compared to the ground motion profile and elastic modulus. The swing of ground motion intensity was around three times that of the ground motion profile and over four times that of the elastic modulus.
Figure 7c describes the sensitivity analysis of the total base shear. Differently from Figure 7a,b, all the input parameters have their own contributions on the total base shear. The spectral acceleration parameter remains the highest with a swing of around 1120 kN compared to those of the mass, damping, ground motion profile, and elastic modulus of around 567, 383, 269, and 107 kN, respectively. The interesting point is from the effect of the damping ratio, it affects significantly on the total base shear, slightly on the drift, while it had almost no impact on the vertical reaction of the crane’s legs.
5. Conclusions
The study examines the sensitivity analysis of a Korean STS container crane to several uncertainty sources including ground motion intensity, ground motion profile, and structural characteristics (i.e., mass, damping, and elastic modulus). A three-dimensional FE model of container crane using dynamic analyses was applied to analyze a set of 20 natural ground motions scaled to the desired three ground motion intensity levels.
The intensity of ground motions (i.e., spectral acceleration) is the most significant input parameter on the response of the structure, as measured in terms of portal drift, vertical reaction of portal legs, and total base shear. The next most notable influences are the mass of structure and the characteristics of every ground motion. In particular, mass contributes its effect on the vertical (axial) reaction and total base shear, while ground motion profile is the secondary sensitivity in terms of the portal drift of the container crane.
Damping plays a relatively important role on the total base shear, while it shows no impact on the axial reaction of the crane’s legs. Of the three engineering design parameters (portal drift, vertical reaction, and total base shear), the elastic modulus exhibits a low impact, but it should be considered as a source of uncertainty in seismic analysis.
Author Contributions
Conceptualization, J.H. and Q.H.T.; Methodology, J.H.; Software, Q.H.T. and V.B.N.; Validation, I.J.P. and C.K.; Formal Analysis, Q.H.T.; Resources, J.H.; Data Curation, Q.H.T. and V.B.N.; Writing-Original Draft Preparation, Q.H.T.; Writing-Review & Editing, J.H. and J.H.A.; Supervision, J.H.
Funding
This research was funded by [Ministry of Oceans and Fisheries, Korea], [National Research Foundation of Korea] grant number [2017R1D1A3B03032854], and [Ministry of Public Administration and Security, Korea] and The APC was funded by [Ministry of Oceans and Fisheries, Korea].
Acknowledgments
This research was supported by Basic Science Research Program through the National Research Foundation of Korea (NRF) funded by the Ministry of Education (2017R1D1A3B03032854) and by Ministry of public Administration and Security as “Disaster Prevention Safety Human resource development Project”, and was also a part of the project titled “Development of performance-based seismic design technologies for advancement in design codes for port structures”, funded by the Ministry of Oceans and Fisheries, Korea.
Conflicts of Interest
The authors declare no conflict of interest.
References
- Kosbab, B.D.; Leon, R.T.; DesRoches, R. Seismic behavior considerations for jumbo container cranes. In Structures Congress 2009: Don’t Mess with Structural Engineers—Expanding Our Role; American Society Civil Engineers: Reston, VA, USA, 2009. [Google Scholar]
- Jordan, M.A. Future-Proof Your Crane; Liftech Consultants Inc.: Oakland, CA, USA, 2001; Available online: http://www.liftech.net/wp-content/uploads/2001/10/Future-Proof-Your-Crane.pdf (accessed on 17 July 2018).
- Bhimani, A.; Soderberg, E. Crane Loads & Wharf Structure Design: Putting the Two Together. Presented at AAPA Facilities Engineering Seminar, Jacksonville, FL, USA, 11 January 2006. [Google Scholar]
- Porter, K.A.; Beck, J.L.; Shaikhutdinov, R.V. Sensitivity of Building Loss Estimates to Major Uncertain Variables. Earthq. Spectra 2012, 18, 719–743. [Google Scholar] [CrossRef]
- Kosbab, B.D. Seismic Performance Evaluation of Port. Container Cranes Allowed to Uplift; Georgia Institute of Technology: Atlanta, GA, USA, 2010. [Google Scholar]
- Lee, T.-H.; Mosalam, K.M. Sensitivity of Seismic Demand of a Reinforced Concrete Shear-Wall Building. Presented at Ninth International Conference on Application of Statistics and Probability in Civil Engineering (ICASP 9), San Francisco, CA, USA, 6–9 July 2003. [Google Scholar]
- Lee, T.-H.; Mosalam, K.M. Probabilistic Seismic Evaluation of Reinforced Concrete Structural Components and Systems; University of California: Berkeley, CA, USA, 2006. [Google Scholar]
- Porter, K.A.; Beck, J.L.; Shaikhutdinov, R.V. Investigation of Sensitivity of Building Loss Estimates to Major Uncertain Variables for the Van Nuys Testbed; Pacific Earthquake Engineering Research Center: Berkeley, CA, USA, 2002. [Google Scholar]
- Lee, D.H.; Kim, B.H.; Jeong, S.H.; Jeon, J.S.; Lee, T.H. Seismic fragility analysis of a buried gas pipeline based on nonlinear time-history analysis. Int. J. Steel Struct. 2016, 16, 231–242. [Google Scholar] [CrossRef]
- Haldar, A.; Mahadevan, S. Reliability Assessment Using Stochastic Finite Element Analysis; John Wiley & Sons Inc.: New York, NY, USA, 2000. [Google Scholar]
- Kanayama, T.; Kashiwazaki, A. An Evaluation of Uplifting Behavior of Container Cranes Under Strong Earthquakes. Trans. Jpn. Soc. Mech. Eng. 1998, 64, 100–106. (In Japanese) [Google Scholar]
- Dinevski, D.; Oblak, M.; Novak, A. Experimental Verification of the Container Crane Natural Frequancies. WIT Trans. Model. Simul. 1997, 16, 245–254. [Google Scholar]
- Korean Building Code; Architectural Institute of Korea: Seoul, Korea, 2016.
- Davoodi, M.; Sadjadi, M.; Goljahani, P.; Kamalian, M. Effects of Near-Field and Far-Field Earthquakes on Seismic Response of SDOF System Considering Soil Structure Interaction. Presented at 15th World Conference on Earthquake Engineering, Lisbon, Portugal, 24–28 September 2012. [Google Scholar]
- United States Army Corps of Engineers (USACE). Time History of Dynamic Analysis of Concrete Hydraulic Structures; Department of the Army: Washington, DC, USA, 2003. [Google Scholar]
- Chopra, A.; Chintanapakdee, C. Comparing Response of SDF Systems to Near-Fault and Far-Fault Earthquake Motions in the Context of Spectral Regions Earthq. Eng. Struct. Dyn. 2001, 30, 1769–1789. [Google Scholar] [CrossRef]
- NEHRP Recommended Provisions for New Buildings and Other Structures: Training and Instructional Materials; Federal Emergency Management Agency and National Institute of Building Sciences: Washington, DC, USA, 2007.
- Galambos, T.; Ravindra, M. Properties of Steel for Use in LRFD. J. Struct. Div. 1978, 104, 1459–1468. [Google Scholar]
- Liu, J.; Sabelli, R.; Brockenbrough, R.; Fraser, T. Expected Yield Stress and Tensile Strength Ratios for Determination of Expected Member Capacity in the 2005 AISC Seismic provisions. Eng. J. 2007, 44, 15–25. [Google Scholar]
- Kohama, E.; Takenobu, M.; Sugano, T.; Ohya, Y. Field Experiment on a Damping Characteristic of Actual Container Cranes. Presented at 15th World Conference on Earthquake Engineering, Lisbon, Portugal, 24–28 September 2012. [Google Scholar]
- Taoko, G. Damping Measurements of Tall Structures. In Proceedings of the Second Specialty Conference on Dynamic Response of Structures: Experimentation, Observation, Prediction, and Control, Atlanta, GA, USA, 15–16 January 1981. [Google Scholar]
- Jacobs, L.; Kosbab, B.; Leon, R.; DesRoches, R. Seismic Behavior of a Jumbo Container Crane Including Uplift. Earthq. Spectra 2011, 27, 745–773. [Google Scholar]
- Tran, Q.H.; Huh, J.; Nguyen, V.B.; Haldar, A.; Kang, C.; Hwang, K.M. Comparative Study of Nonlinear Static and Time-History Analyses of Typical Korean STS Container Cranes. Adv. Civ. Eng. 2018, 2018, 2176894. [Google Scholar] [CrossRef]
- Balkema, A.A. Seismic Desing Guidelines for Port Structures; PIANC: Brussels, Belgium, 2001. [Google Scholar]
- Huh, J.; Haldar, A.; Yim, S. Effect of Uncertainty in Frequency Content and Strong Motion Duration on Structural Seismic Risks. Int. J. Syst. Eng. 2012, 2, 25–37. [Google Scholar]
- Wilson, E. Three-Dimensional Static and Dynamic Analysis of Structures: A Physical Approach with Emphasis on Earthquake Engineering, 2nd ed.; Computers and Structures Inc.: Berkeley, CA, USA, 1998. [Google Scholar]
- Linear and Nonlinear Static and Dynamic Analysis and Design of 3D Structures; Computers and Structures Inc.: Berkeley, CA, USA, 2006.
- Huh, J.; Tran, Q.H.; Haldar, A.; Park, I.; Ahn, J.-H. Seismic Vulnerability Assessment of a Shallow Two-Story Underground RC Box Structure. Appl. Sci. 2017, 7, 735. [Google Scholar] [CrossRef]
- ASCE/SEI 41, Seismic Evaluation and Retrofit of Existing Buildings; American Society of Civil Engineers: Reston, VA, USA, 2013.
- Caltrans. Seismic Design Criteria (Version 1.7); California Department of Transportation: Sacramento, CA, USA, 2013.
- Sullivan, L. The Role of Probability; Boston University: Boston, MA, USA; Available online: http://sphweb.bumc.bu.edu/otlt/MPH-Modules/BS/BS704_Probability/ (accessed on 29 June 2018).
Figure 1.
Overall dimensions of a Korean container crane.

Figure 2.
Sensitivity analysis by tornado diagram.
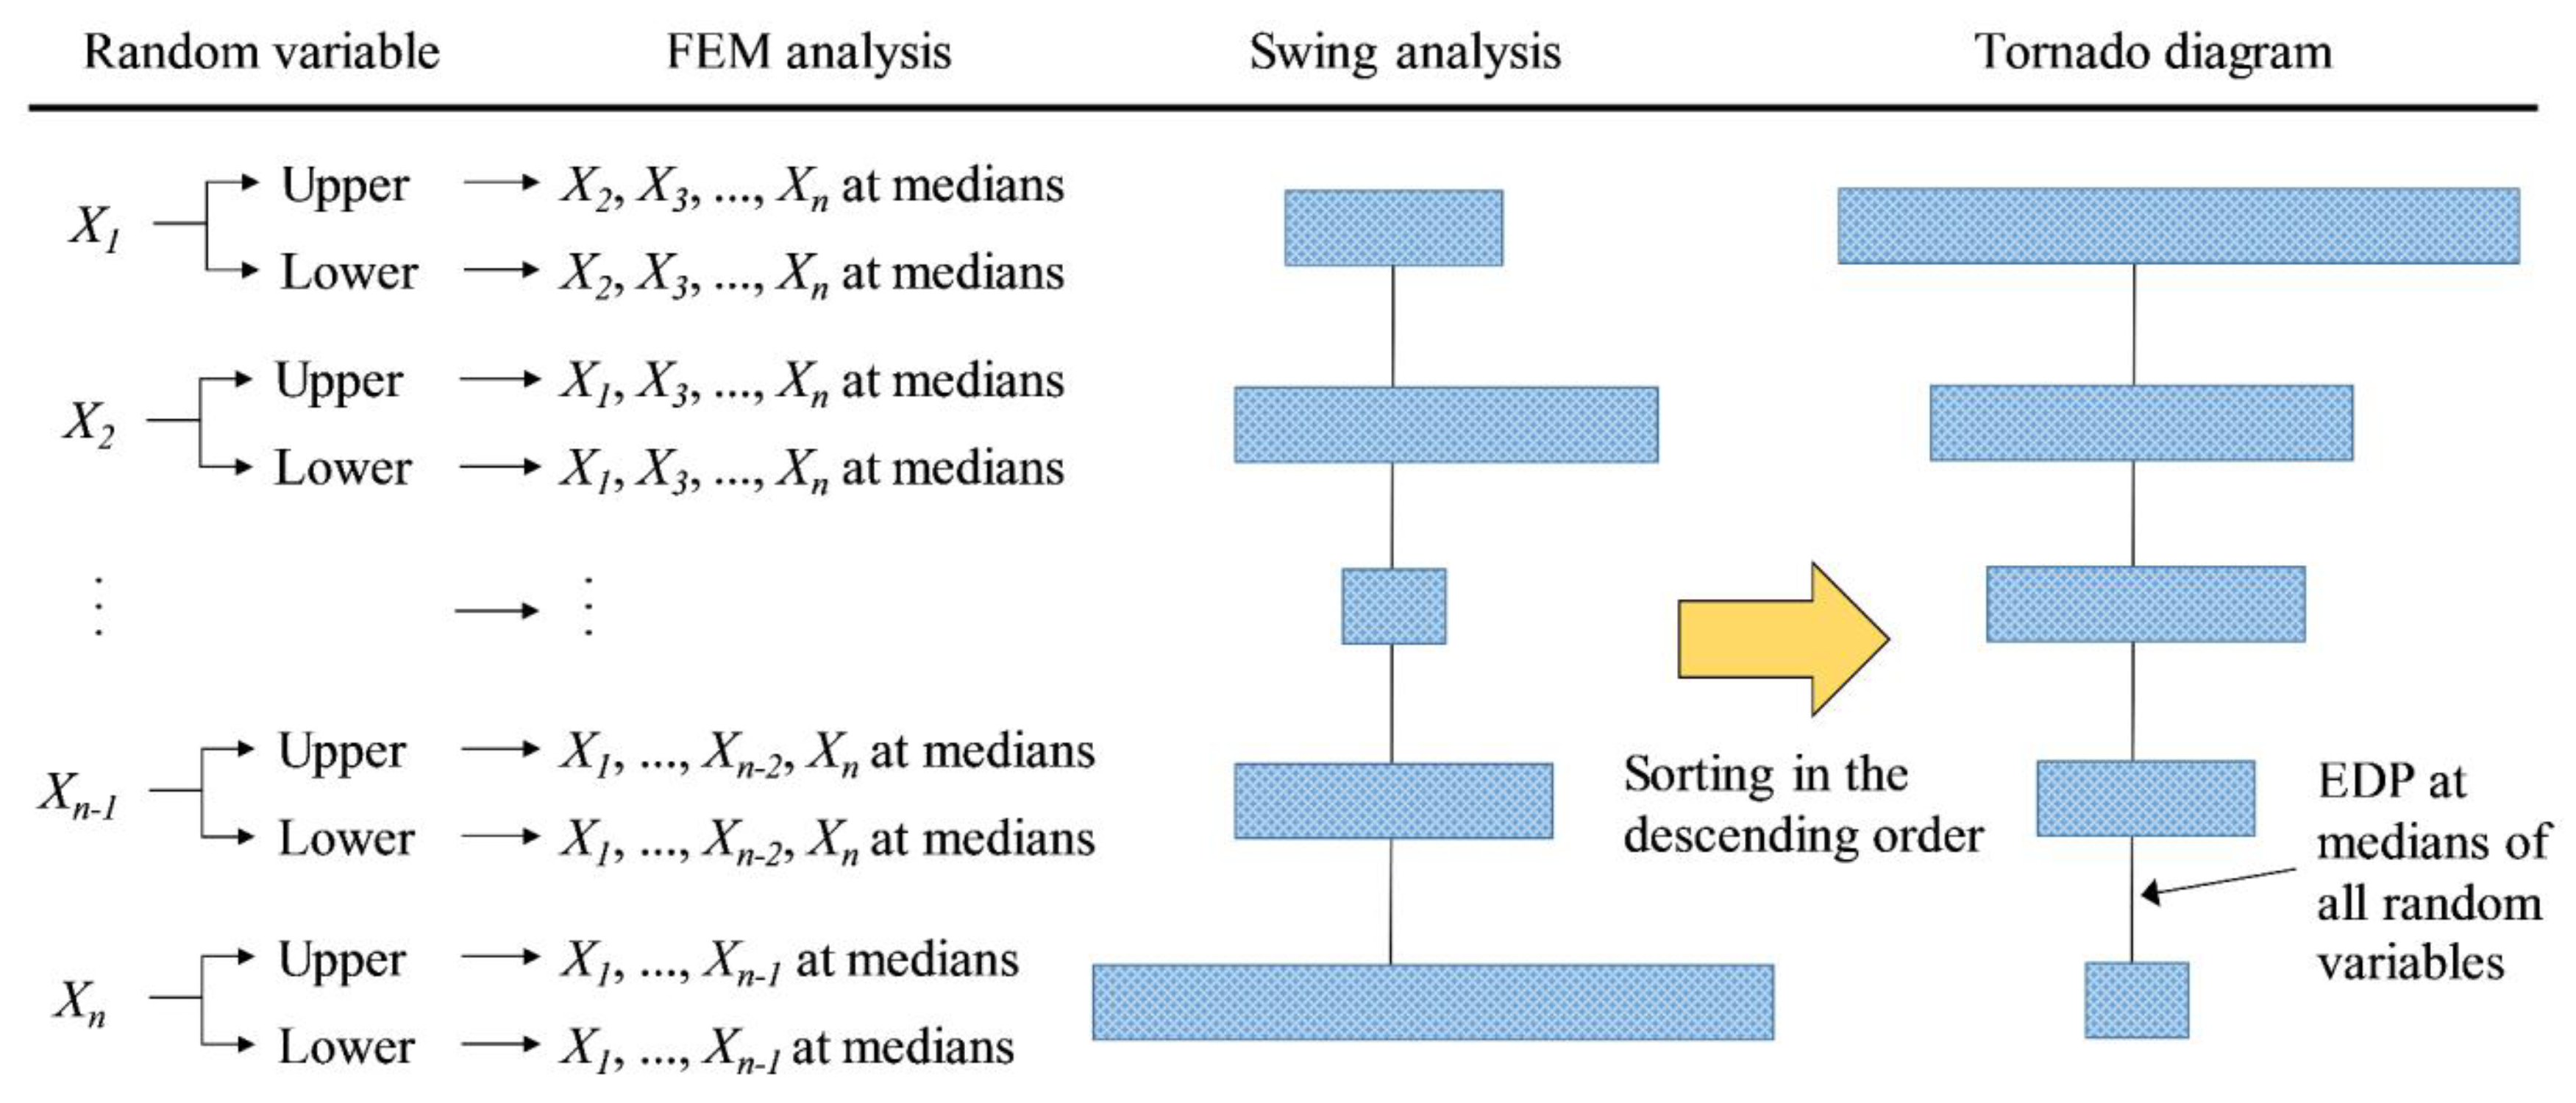
Figure 3.
A comparison of the structural response using elastic response spectra of Korean Design Standard (KDS).
Figure 3.
A comparison of the structural response using elastic response spectra of Korean Design Standard (KDS).

Figure 4.
Mode shapes and natural periods of three first significant modes of the crane: (a) Torsion of boom, (b) Torsion of frame, and (c) Portal sway in trolley travel direction.
Figure 4.
Mode shapes and natural periods of three first significant modes of the crane: (a) Torsion of boom, (b) Torsion of frame, and (c) Portal sway in trolley travel direction.

Figure 5.
Soil type SD-1 elastic response spectra (5% damping) of KDS for 100, 500, and 2400 years return.
Figure 5.
Soil type SD-1 elastic response spectra (5% damping) of KDS for 100, 500, and 2400 years return.

Figure 6.
Scaled natural response spectra to Korean response spectrum at the fundamental period of structure (IM level Sa = 0.13 g).
Figure 6.
Scaled natural response spectra to Korean response spectrum at the fundamental period of structure (IM level Sa = 0.13 g).

Figure 7.
Sensitivity analyses for drift (top of the seaside leg, node 4052), vertical reaction (seaside leg, node 40), and total base shear.
Figure 7.
Sensitivity analyses for drift (top of the seaside leg, node 4052), vertical reaction (seaside leg, node 40), and total base shear.

Table 1.
Statistical properties of the random variables.
| Random Variables | Unit | Distribution | Mean | Coefficient of Variation (COV) |
|---|---|---|---|---|
| Yield strength of steel for JIS-SM490Y | ||||
| Thickness t ≤ 16 mm | MPa | Normal | 365 | 0.07 |
| 16 mm < t ≤ 40 mm | MPa | Normal | 355 | 0.07 |
| t > 40 mm | MPa | Normal | 335 | 0.07 |
| Yield strength of steel for JIS-STK490 | MPa | Normal | 313 | 0.07 |
| Young’s modulus of both steel types | GPa | Normal | 200 | 0.06 |
Table 2.
Total weight of Korean container crane used in this study.
| Number | Items | Weight (kN) |
|---|---|---|
| 1 | Structural frame | 10,777.6 |
| 2 | Nonstructural loads | 3062.8 |
| Total | 13,840.4 |
Table 3.
Soil investigation at the crane location.
| Soil Type | Unit Weight, γ (kN/m3) | Shear Wave Velocity, vs (m/s) | Shear Modulus, G (MPa) | Poisson’s Ratio, ν | |
|---|---|---|---|---|---|
| Buried layer | Riprap | 19 | 345 | 2.47 × 10² | - |
| Sand | 18 | 323 | 2.06 × 10² | 0.35 | |
| Pebble | 18 | 295 | 1.67 × 10² | 0.35 | |
| Sediment | Clay | 17 | 203 | 3.34 × 10⁶ | 0.33 |
| Pebble | 19 | 379 | 2.31 × 10⁷ | 0.33 | |
| Weathered soil | 19 | 542 | 5.84 × 10⁷ | 0.33 | |
| Weathered rock | 20 | 471 | 1.71 × 10⁸ | 0.30 | |
| Soft rock | 23 | 1265 | 6.69 × 10⁸ | 0.28 |
Table 4.
Unscaled time-history accelerations.
| Ground Motion (GM) | Earthquake Name | Year | Station Name | Magnitude | PGA (g) | Sai (T) (g) |
|---|---|---|---|---|---|---|
| 1 | Imperial Valley-02 | 1940 | Elcentro Array #09 | 6.95 | 0.28 | 0.23 |
| 2 | Imperial Valley-02 | 1940 | Elcentro Array #09 | 6.95 | 0.21 | 0.25 |
| 3 | Imperial Valley-06 | 1979 | Elcentro Array #06 | 6.53 | 0.45 | 0.39 |
| 4 | Imperial Valley-06 | 1979 | Elcentro Array #06 | 6.53 | 0.45 | 0.40 |
| 5 | Landers | 1992 | Barstow | 7.28 | 0.13 | 0.11 |
| 6 | Landers | 1992 | Barstow | 7.28 | 0.14 | 0.12 |
| 7 | Landers | 1992 | Yermo Fire sta. | 7.28 | 0.24 | 0.53 |
| 8 | Landers | 1992 | Yermo Fire sta. | 7.28 | 0.15 | 0.32 |
| 9 | Loma Prieta | 1989 | Gilroy-Gavilan Coll. | 6.93 | 0.36 | 0.23 |
| 10 | Loma Prieta | 1989 | Gilroy-Gavilan Coll. | 6.93 | 0.33 | 0.09 |
| 11 | Northridge-01 | 1994 | Newhall-Fire sta. | 6.69 | 0.58 | 0.68 |
| 12 | Northridge-01 | 1994 | Newhall-Fire sta. | 6.69 | 0.59 | 0.95 |
| 13 | Northridge-01 | 1994 | Rinaldi Receiving Sta. | 6.69 | 0.87 | 1.22 |
| 14 | Northridge-01 | 1994 | Rinaldi Receiving Sta. | 6.69 | 0.47 | 0.72 |
| 15 | Northridge-01 | 1994 | Sylmar-Converter Sta. | 6.69 | 0.62 | 0.80 |
| 16 | Northridge-01 | 1994 | Sylmar-Converter Sta. | 6.69 | 0.92 | 1.15 |
| 17 | Kobe, Japan | 1995 | KJMA | 6.9 | 0.83 | 0.92 |
| 18 | Kobe, Japan | 1995 | KJMA | 6.9 | 0.63 | 0.42 |
| 19 | Chi-Chi, Taiwan | 1999 | TCU065 | 7.62 | 0.79 | 0.80 |
| 20 | Chi-Chi, Taiwan | 1999 | TCU065 | 7.62 | 0.58 | 0.75 |
Table 5.
Parameters of the sensitivity study.
| Number | Source of Uncertainty | Lower Bound | Median | Upper Bound | Remarks |
|---|---|---|---|---|---|
| 1 | IM, Sa (g) | 0.07 GM-17, 19 0.081, 0.092 | 0.13 GM-9, 11 0.552, 0.188 | 0.21 GM-9, 11 0.917, 0.313 | Spectral acceleration Ground motion Scaling factor |
| 2 | Ground motion profile | GM-16 0.111 | GM-9 0.552 | GM-14 0.178 | Ground motion Scaling factor |
| 3 | Mass, Mn (ton) | 0.872 × Mn | Mn | 1.128 × Mn | Mn: nominal mass = 1 |
| 4 | Damping ratio, ξ (%) | 0.92 | 1.50 | 2.08 | |
| 5 | Elastic modulus of steel, E (GPa) | 184.6 | 200 | 215.4 |
© 2018 by the authors. Licensee MDPI, Basel, Switzerland. This article is an open access article distributed under the terms and conditions of the Creative Commons Attribution (CC BY) license (http://creativecommons.org/licenses/by/4.0/).
Share and Cite
MDPI and ACS Style
Tran, Q.H.; Huh, J.; Nguyen, V.B.; Kang, C.; Ahn, J.-H.; Park, I.-J. Sensitivity Analysis for Ship-to-Shore Container Crane Design. Appl. Sci. 2018, 8, 1667. https://doi.org/10.3390/app8091667
AMA Style
Tran QH, Huh J, Nguyen VB, Kang C, Ahn J-H, Park I-J. Sensitivity Analysis for Ship-to-Shore Container Crane Design. Applied Sciences. 2018; 8(9):1667. https://doi.org/10.3390/app8091667
Chicago/Turabian StyleTran, Quang Huy, Jungwon Huh, Van Bac Nguyen, Choonghyun Kang, Jin-Hee Ahn, and Inn-Joon Park. 2018. "Sensitivity Analysis for Ship-to-Shore Container Crane Design" Applied Sciences 8, no. 9: 1667. https://doi.org/10.3390/app8091667
Note that from the first issue of 2016, this journal uses article numbers instead of page numbers. See further details here.