Melody Extraction Using Chroma-Level Note Tracking and Pitch Mapping


1
School of Information and Communication Engineering, Dalian University of Technology, Dalian 116023, China
2
School of Information and Communication Engineering, Dalian Minzu University, Dalian 116605, China
*
Author to whom correspondence should be addressed.
Appl. Sci. 2018, 8(9), 1618; https://doi.org/10.3390/app8091618
Submission received: 31 July 2018
/
Revised: 8 September 2018
/
Accepted: 10 September 2018
/
Published: 11 September 2018
(This article belongs to the Special Issue Digital Audio and Image Processing with Focus on Music Research)
Abstract
:A new architecture for melody extraction from polyphonic music is explored in this paper. Specifically, chromagrams are first constructed through the harmonic pitch class profile (HPCP) to measure the salience of melody, and chroma-level notes are tracked by dynamic programming. Then, note detection is performed according to chroma-level note differences between adjacent frames. Next, note pitches are coarsely mapped by maximizing the salience of each note, followed by a fine tuning to fit the dynamic variation within each note. Finally, voicing detection is carried out to determine the presence of melody according to the salience of fine-tuned notes. Note level pitch mapping and fine tuning avoids pitch shifting between different octaves or notes within one note duration. Several experiments have been conducted to evaluate the performance of the proposed method. The experimental results show that the proposed method can track the dynamic pitch changing within each note, and performs well at different signal-to-accompaniment ratios. However, its performance for deep vibratos and pitch glides still needs to be improved.
1. Introduction
Melody, as the essence of music, plays an important role in understanding music semantics and distinguishing different music pieces. Melody extraction is the process of automatically obtaining the pitch sequence of the lead voice or instrument from polyphonic music [1], and is widely used in music retrieval [2], genre classification [3], cover song identification [4,5], and so on. Recently, it has become an important topic in the music information retrieval community.
Existing melody extraction methods can be divided into three categories: source separation-based methods [6,7], data-driven classification-based methods [8,9], and salience-based methods [1,10,11,12]. Source separation-based methods employ spectrum decomposition schemes to separate the lead voice from the mixed recordings, then estimate and track the pitch sequence of the previously extracted source. Since melody-accompaniment separation is an ill-conditioned problem and source separation performance directly affects subsequent pitch estimation and tracking, these methods are suitable for singing melody extraction by making use of the unstable nature of voices, such as vibrato. Data-driven classification-based methods formulate melody extraction as a classification problem, where pitches are quantitized to some specific levels (such as MIDI pitch number) [8,9]. These methods need few priors, but they often cause quantization errors or over-fitting when the training dataset is small.
Most melody extraction methods belong to the salience-based category [1,10,11,12]. Multiple pitches of one music recording are estimated according to some kind of salience function, and tracking strategies are applied to obtain melody pitch sequence taking into account of both salience and smoothness constraints. Vincent [10] developed the YIN algorithm [13], built a salience function in the frequency domain, and then extracted melody based on the Bayesian harmonic model, but it has heavy computational complexity. In [11], a real-time predominant vocal melody extraction framework was presented to track various sources with the help of harmonic clusters. It only tracked the higher harmonic partials, making it suitable for melody whose lower partials are distorted by accompaniment. However, higher octave errors are frequently caused by tracking of higher harmonic partials. In order to deduce the perceived pitch through co-prime harmonic partials, a modified Euclidean algorithm is proposed in [12], which generalizes the Euclidean algorithm to float numbers and utilize it to obtain the perceived pitch. Pitch shifting between different octaves within one note is commonly found due to the intrinsic non-stationary nature of music.
A general architecture that underlies most salience-based methods is multiple pitch estimation, followed by pitch trajectory tracking or selection according to the smoothness and salience constraints. If fewer frame-wise pitches are considered, the true one may not lie in the search range. On the contrary, if more pitches are reserved for tracking, false-alarm rate will rise. Moreover, both salience and power distribution over different partials of the lead voice or instrument often vary with time, resulting in false estimations during some notes or frequency shifting between different octaves. One possible approach (to avoid the estimated melodic pitches shifting between different octaves or notes within one note duration) is to estimate pitch class first, and then map the accurate pitches at the note level.
Salamon and Gómez attempted to extract melody and bass line using chroma features, and the salience function was constructed by harmonic pitch class profile (HPCP) [14,15]. HPCP is, in essence, a pitch-class based salience function, and contains no octave information [14]. This method provides some new clues about measuring the salience of melody and bass line, but it outputs only melodic pitch classes, not their exact frequencies.
Motivated by the fact that melody originates from the predominant pitched source having comparatively higher chroma energy than others, and its salience usually decreases with time over note duration, a chroma-level note tracking and pitch mapping-based melody extraction method is proposed in this paper. Specifically, the chromagram is first constructed by HPCP. Then, chroma-level notes are tracked by dynamic programming (DP), which takes into account of both salience and smoothness. Next, pitch matching is carried out at two levels: coarse pitch mapping according to note-level salience, followed by fine tuning with the modified Euclidean algorithm. Finally, voicing detection based on the salience of the fine-tuned pitches of each note is done to determine the presence of melody. Experimental results show that the proposed method achieves good performance at different signal-to-accompaniment ratios, and can accurately track the detailed dynamic changing over each note for ordinary pitch modulations. Moreover, there is no pitch shifting between different octaves within one note.
The proposed method differs from our previous work in the following two aspects. (1) Their processing procedures are different. In the previous work, short-time Fourier transform is computed first, then multiple pitches are estimated based on modified Euclidean algorithm, and melodic contours are created and selected in the end. In contrast, chroma-level notes are first estimated by HPCP and dynamic programming, then pitch mapping, fine tuning, and voicing detection are implemented to get the final melodic pitch sequence in this work. (2) The modified Euclidean algorithm is employed for different purposes. It is used for multi-pitch estimation in the previous work, while it is for pitch fine tuning in this one. This method is also different from Salamon and Gómez’s in that it outputs the melodic pitches instead of pitch classes.
The proposed method first adopts HPCP feature to measure the salience of melody at the chroma level. Then it obtains the octave information back by the pitch mapping. The main contributions of this paper include: (1) a new architecture for melody extraction (i.e., chroma-level note tracking followed by accurate pitch mapping) is proposed, which is different from the general architecture with multi-pitch estimation plus pitch trajectory tracking or selection; (2) pitch mapping is accomplished by two steps, coarse mapping and fine tuning, to follow the dynamic changing of melody; (3) the modified Euclidean algorithm is introduced to fine tune the coarse pitches.
2. Chroma-Level Note Tracking and Pitch Mapping-Based Melody Extraction
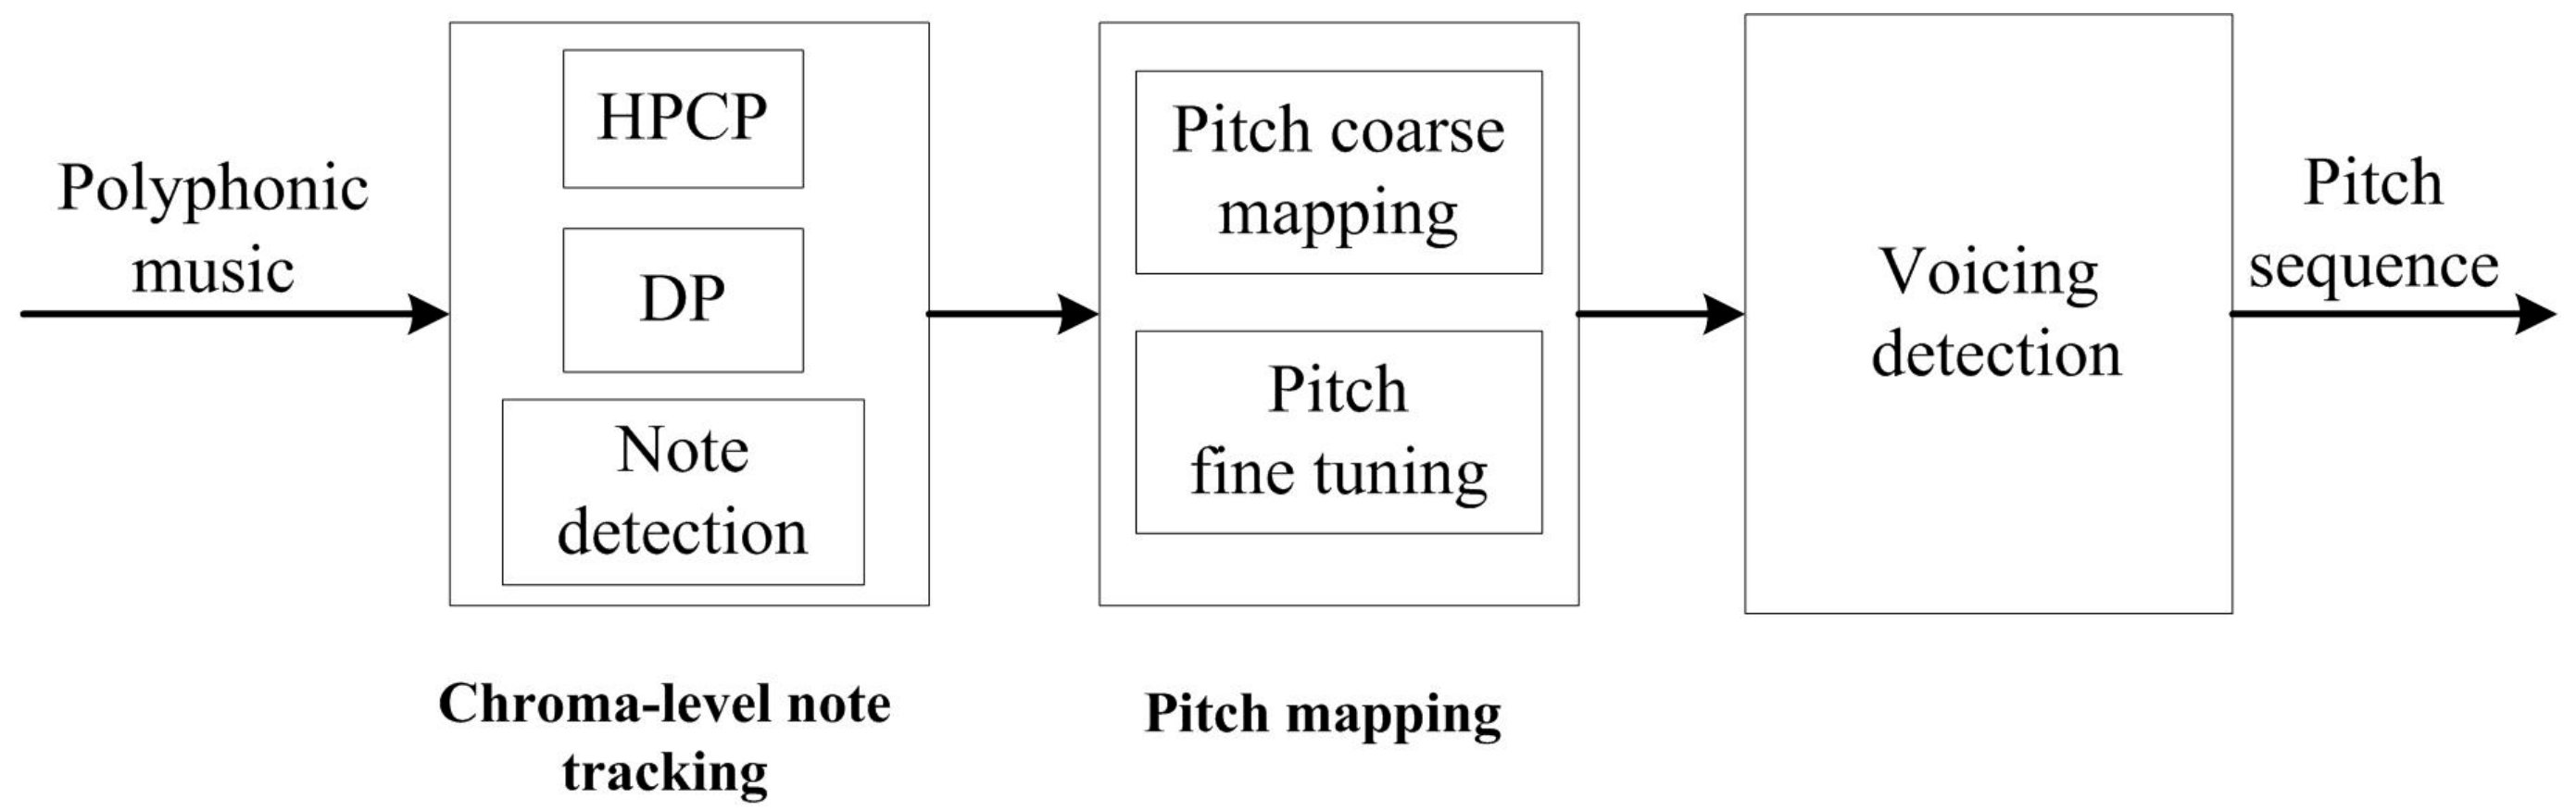
Melody originates from the lead voice or the most prominent instrument. Generally, the main energy of the human voice concentrates at the first few harmonics, and the spectral slope of music instruments decays 3 dB to 12 dB per octave [16], so it can be deduced that melody has the most prominent chroma, though concealed by some strong accompaniments occasionally. Motivated by the aforementioned facts, a chroma-level note tracking and pitch mapping-based method is proposed to extract main melody from polyphonic music. Block diagram of the proposed method is shown in Figure 1. The polyphonic music recording is first chopped into frames, then chromagram is obtained by the HPCP calculation. After that, dynamic programming is applied to obtain the chroma sequences taking into account of both salience and temporal smoothness constraints. Next, coarse melody contour is roughly constructed from the chroma sequence by a salience-based pitch matching scheme, and then fine tuned by the modified Euclidean algorithm. Finally, the average salience of fine tuned pitch is utilized for voicing detection.
The HPCP calculation presented in [17] is introduced to extract the chroma features, and the modified Euclidean algorithm described in [12] is utilized to compute the pitch candidates for fine tuning. For the other steps, such as chroma-level note tracking formulated by DP, chroma-level note detection, pitch coarse mapping and voicing detection, are new in this method. The HPCP calculation, melodic chroma sequence tracking, melodic pitch mapping and voicing detection are presented in detail in the following subsections.
2.1. Harmonic Pitch Class Profile
The pitch class profile (PCP), proposed by Fujishima [18], is a twelve dimension vector representing the intensities of the twelve semitone pitch classes. By introducing the harmonic weighting function, Gómez proposed the harmonic pitch class profile (HPCP) [17]. HPCP works very well when there are tuning errors and inharmonicity in the spectrum, and has been successfully utilized for music retrieval [19], cover song identification [20,21], and so on.
HPCP is defined as [17]
where and are the magnitude and frequency of the -th peak in the amplitude spectrum, respectively, is the number of spectral peaks in consideration, is HPCP bin, is the dimension of HPCP vector, and is the weight of frequency for HPCP bin .
The center frequency at bin is
where is the reference frequency.
The distance between peak frequency and bin center frequency in semitone is
where is the integer that minimizes , and is the absolute operator.
The weight in Equation (1) is
where is the width of the weight window.
The spectrum of each note consists of several harmonics whose frequencies are multiples of fundamental frequency. The value associated to the -th harmonic of a note is
where mod(·,·) is the modulus operator, and is the pitch class corresponding to the note.
Then, the frame-wise HPCP values are normalized with respect to the maximum value of each frame to obtain the relative relevance of HPCP bins, i.e.,
By the procedure presented in this subsection, the chromagram can be generated by HPCP, indicating the relative salience of different pitch classes of polyphonic music.
2.2. Melodic Chroma Sequence Tracking and Note Detection
It is commonly assumed that the global melody trajectory is constituted of the local optimum sub-trajectories [22]. Dynamic programming is an effective solution to the optimum path finding problems, and often used for melody pitch tracking [22]. Hence, it is also introduced to track the chroma sequences taking into account of both salience and smoothness constraints herein. The cost function of melodic chroma trajectory is
where is the normalized HPCP value at pitch bin of the -th frame, is the number of frames, and is the penalty factor determining frequency transition. In Equation (7), represents the salience constraint, while accounts for the smoothness constraint.
Suppose that is the accumulated cost function that pitch bin is taken at the -th frame. Then, the iterative function is
where and are the HPCP pitch bins at -th and -th frame, respectively, and .
The initial condition of is
After the chroma level melody is obtained by dynamic programming, note detection is carried out as follows. As polyphonic music is performed according to some music scores, it is assumed that the chroma estimated for each note is also within half-chroma interval. Moreover, notes should sustain no shorter than some length limitation to be perceived by human auditory system [23]. Based on the above two assumptions, note detection is modeled as the following optimization problem:
where is the chroma trajectory by dynamic programming, is the number of frames corresponding to minimum possible note length, and are the frame indices of note onset and offset, respectively, , and .
2.3. Melodic Pitch Mapping
The possible pitch frequencies corresponding to each pitch class are
where takes integers that force to be located within the possible melody pitch range, and is the HPCP pitch bin.
After all possible frequencies are obtained by Equation (11), coarse note mapping determines which frequency is the accurate pitch according to the following criterion
where is the magnitude of the -th harmonic for candidate at frame , and . in Equation (12) accounts for the salience of candidate frequencies, while for spectral flatness.
The pitches mapped by Equation (11) are standard frequencies in the equal tempered scale. However, most pitches have marginal shifts from these standard frequencies in real-world recordings. Hence, a fine tuning is necessary to obtain more accurate pitch frequencies.
Accurate pitch frequency can be obtained by the modified Euclidean algorithm based on the magnitudes and frequencies of the harmonics [12]. The detailed fine tuning procedure is described as follows.
Suppose that and are frequencies of the -th and -th peaks at frame , respectively. Let , and . Compute
where represents rounding towards the nearest integer.
If , , where is the threshold determining whether a pitch candidate is deduced, means modulus after division, and both input variables are float numbers. Then, let , iterate the above procedure again.
If , the estimated pitch is
A salience value is assigned to the estimated pitch, i.e.,
where is the magnitude of the -th harmonic for candidate , and .
For detailed information of the above procedure, please refer to Algorithm 1 [12].
| Algorithm 1. Computation for the parameters of pitch candidates: . |
|
There are numerous pitch candidates calculated according to the above procedure. Fine tuning aims to track the dynamic changing due to frequency mistuning or singing voice. The frequency mistuned deviation is generally less than 20 cents, while the vibrato extent of western opera can be more than one semitone, but still rarely exceeds 1.5 semitones [24,25]. In this paper, fine tuning is accomplished using heuristics based on auditory streaming cues [23]. First, a fine tuned pitch is the one with the greatest salience within one semitone range of the coarse one obtained according to Equation (12), and its salience is preserved as the pitch salience, i.e.,
where semitone.
If there is one gap, where no pitch is found locating within one semitone range of the coarse one, then track from the left side of each gap. The pitch candidate whose frequency is within the 80 cents range from the left adjacent pitch is added to the contour, a weight is assigned to the candidate according to Equation (15). Repeat the procedure until no further candidate can be found. Then track from the right side of the gap with the same processing scheme. Fine tuning is ceased if either of the following two conditions is satisfied: (a) there is no gap over the fine-tuned notes; (b) no candidate can be found to complement the fine-tuned contours. If fine tuning is ceased due to the second condition, and the first condition is not satisfied, the pitch contour is linearly interpolated over the gap. This fine tuning using heuristics improves the performance on recordings with deep vibratos and pitch glides. To show the fine tuning procedure more clearly, it is summarized in Algorithm 2.
2.4. Voicing Detection
A preliminary continuous melody is achieved by the chroma-level note tracking and pitch mapping as described in Section 2.1, Section 2.2 and Section 2.3. However, melody is not always present in polyphonic music. Voicing detection determines whether the estimated notes belong to melody by the note salience values. If the salience value of one note is greater than , the note frequencies after fine tuning are kept as the melodic pitches among the note duration, otherwise the note is removed and zero frequencies are assigned among the note duration to indicate that the melody is not present.
| Algorithm 2. Melodic pitch fine tuning |
|
The presence of melody over each note duration is determined by the following criterion
where is the threshold, and is the averaged salience of note , i.e.,
where and are the first and last frame indices of note , respectively.
The in Equation (17) is the average salience of all notes, i.e.,
where is the number of notes.
2.5. Summary
In this section, the proposed melody extraction method using chroma-level note tracking combined with pitch mapping is presented in detail. More precisely, the harmonic pitch class profile is first computed to obtain the chromagram. Then, chroma-level notes are tracked by dynamic programming and note detection. Next, chroma-level notes are mapped to accurate pitch frequencies by the coarse mapping and fine tuning. Finally, voicing detection is applied at the end to determine the presence of melody. In the proposed method, the note-level chroma mapping avoids the frequency shifting over each note duration, fine tuning allows the method to follow the dynamic changing of each note, and note-level voicing detection improves the robustness against the signal-to-accompaniment ratio at the end of notes.
3. Evaluation Results and Discussion
Some evaluation experiments are carried out to assess the performance of the proposed method. The evaluation collections, evaluation metrics, reference methods, evaluation results, and qualitative error analysis will be described in this section.
3.1. Evaluation Collections
Three collections are used for evaluation, i.e., ISMIR2004, MIR1K, and Bach10. The first two collections are commonly used for melody extraction evaluation, while the last one is for multi-pitch estimation [26]. Bach10 is introduced here to test the robustness of these methods with respect to the signal-to-accompaniment ratio. The detailed information relating to these three collections are listed in Table 1.
3.2. Evaluation Metrics and Reference Methods
To evaluate the performance of the proposed and other reference methods, three evaluation metrics are used, including raw pitch accuracy (RPA), raw chroma accuracy (RCA), and overall accuracy (OA).
where , , and are the number of true positives (correctly estimated voiced frames), voiced frames and total frames. RCA is similarly calculated as RPA, but the octave errors are ignored.
The three reference methods are the on-line melody extraction from polyphonic audio using harmonic cluster tracking (HCT) [11], the predominant-F0 estimation using Bayesian harmonic waveform models (BHWM) [10], and the melody extraction based on the modified Euclidean algorithm (MEA) [12]. For detailed information of these three reference methods, please refer to Section 1 and the related literature.
3.3. Evaluation Results
3.3.1. Parameter Setting
Parameters of the proposed method are set as follows. The reference frequency in Equation (11) is set as Hz (C4), which is commonly adopted in related works [14]. The parameter is set as recommended in [17], i.e., semitones. The selection of is elaborated in [12], and the same value, i.e., , is set herein. Bregman pointed out that western music tends to have notes that are rarely shorter than 150 milliseconds in duration [23], so the minimum note length is 150 ms. The parameter is set according some primary experiments on Bach10. Strictly speaking, the performance on different datasets varies slightly with this parameter. However, it is still set as for all the following evaluations. As mentioned before, the main energy of the human voice concentrates at the first few harmonics, and the spectral slope of music instruments decays 3 dB to 12 dB per octave [16], so and are set as , respectively. Some primary experimental results show that when varies from 3 to 6, or from 6 to 12, the performance of the proposed method is not severely affected.
3.3.2. Penalty Factor Selection
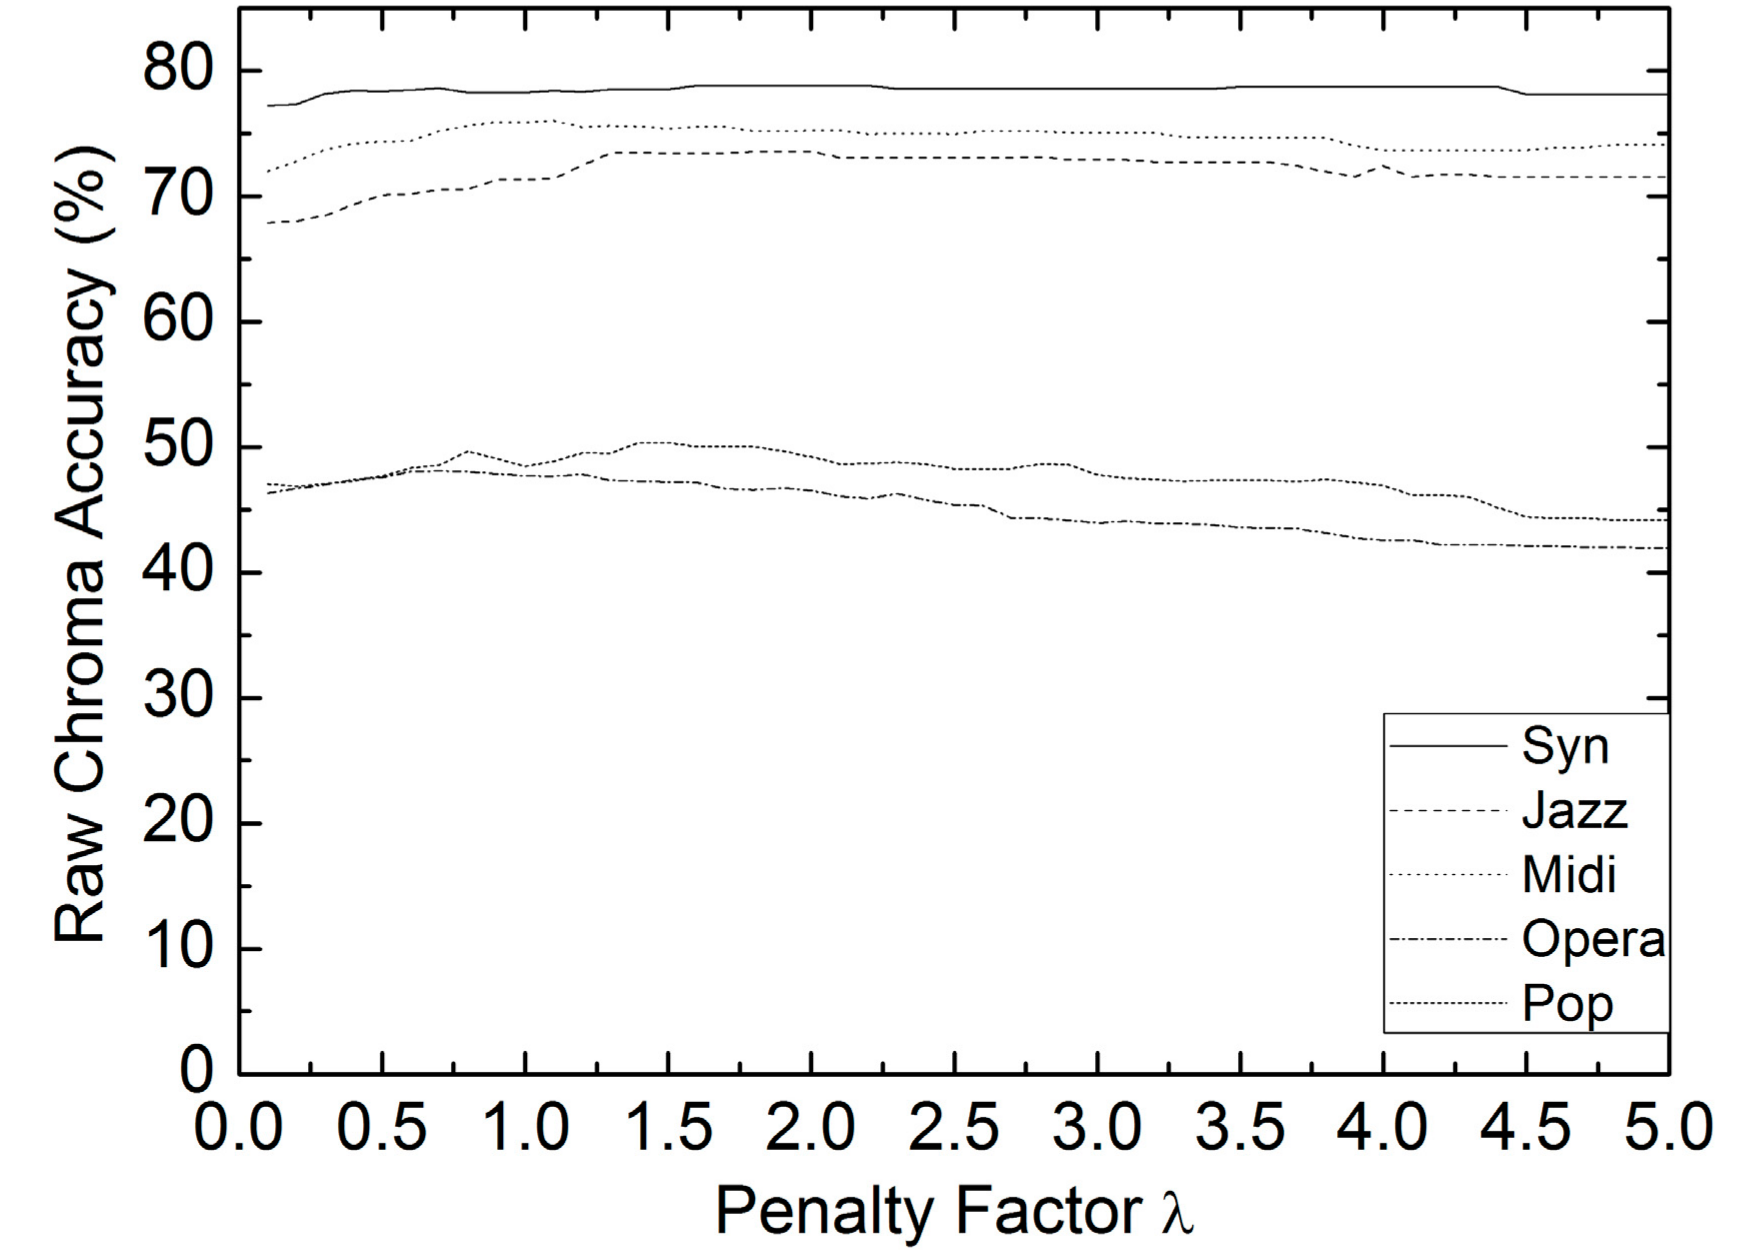
Since the chroma-level notes are tracked by dynamic programming, the validity of penalty factor is only related to the RCA. ISMIR2004 covers most types of polyphonic music recordings among these three collections, thus it is chosen to examine the RCA with respect to parameter in Equation (7). The excerpts are divided into five categories relying on melody type: synthesized voice (syn), saxophone (jazz), MIDI instruments (MIDI), classical opera (opera) and real-world pop (pop). There are four excerpts of each category. The averaged frame-wise RCAs of each category are shown in Figure 2. It can be seen from Figure 2 that syn, jazz, and MIDI obtain much higher RCAs than opera and pop, because there are deep vibratos and pitch glides shifting between different notes in these excerpts. It can also be seen that the RCAs do not change dramatically for each category, and those of opera and pop are comparatively more sensitive to parameter . Hence, the RCAs are more sensitive to melody type than penalty factor . is used for all of the other experiments.
3.3.3. Robustness against the Signal-to-Accompaniment Ratio
In order to verify the robustness of different methods with respect to the signal-to-accompaniment ratio (SAR), all excerpts of Bach10 are mixed with different SARs, i.e., −5 dB, 0 dB, 5 dB and 10 dB. Soprano is the signal (melody), and the other three parts (alto, tenor and bass) constitute accompaniment. Alto, tenor, and bass are mixed together as the accompaniment with the originally recorded samples, and soprano is mixed with the accompaniment again to obtain polyphonic music at different SARs.
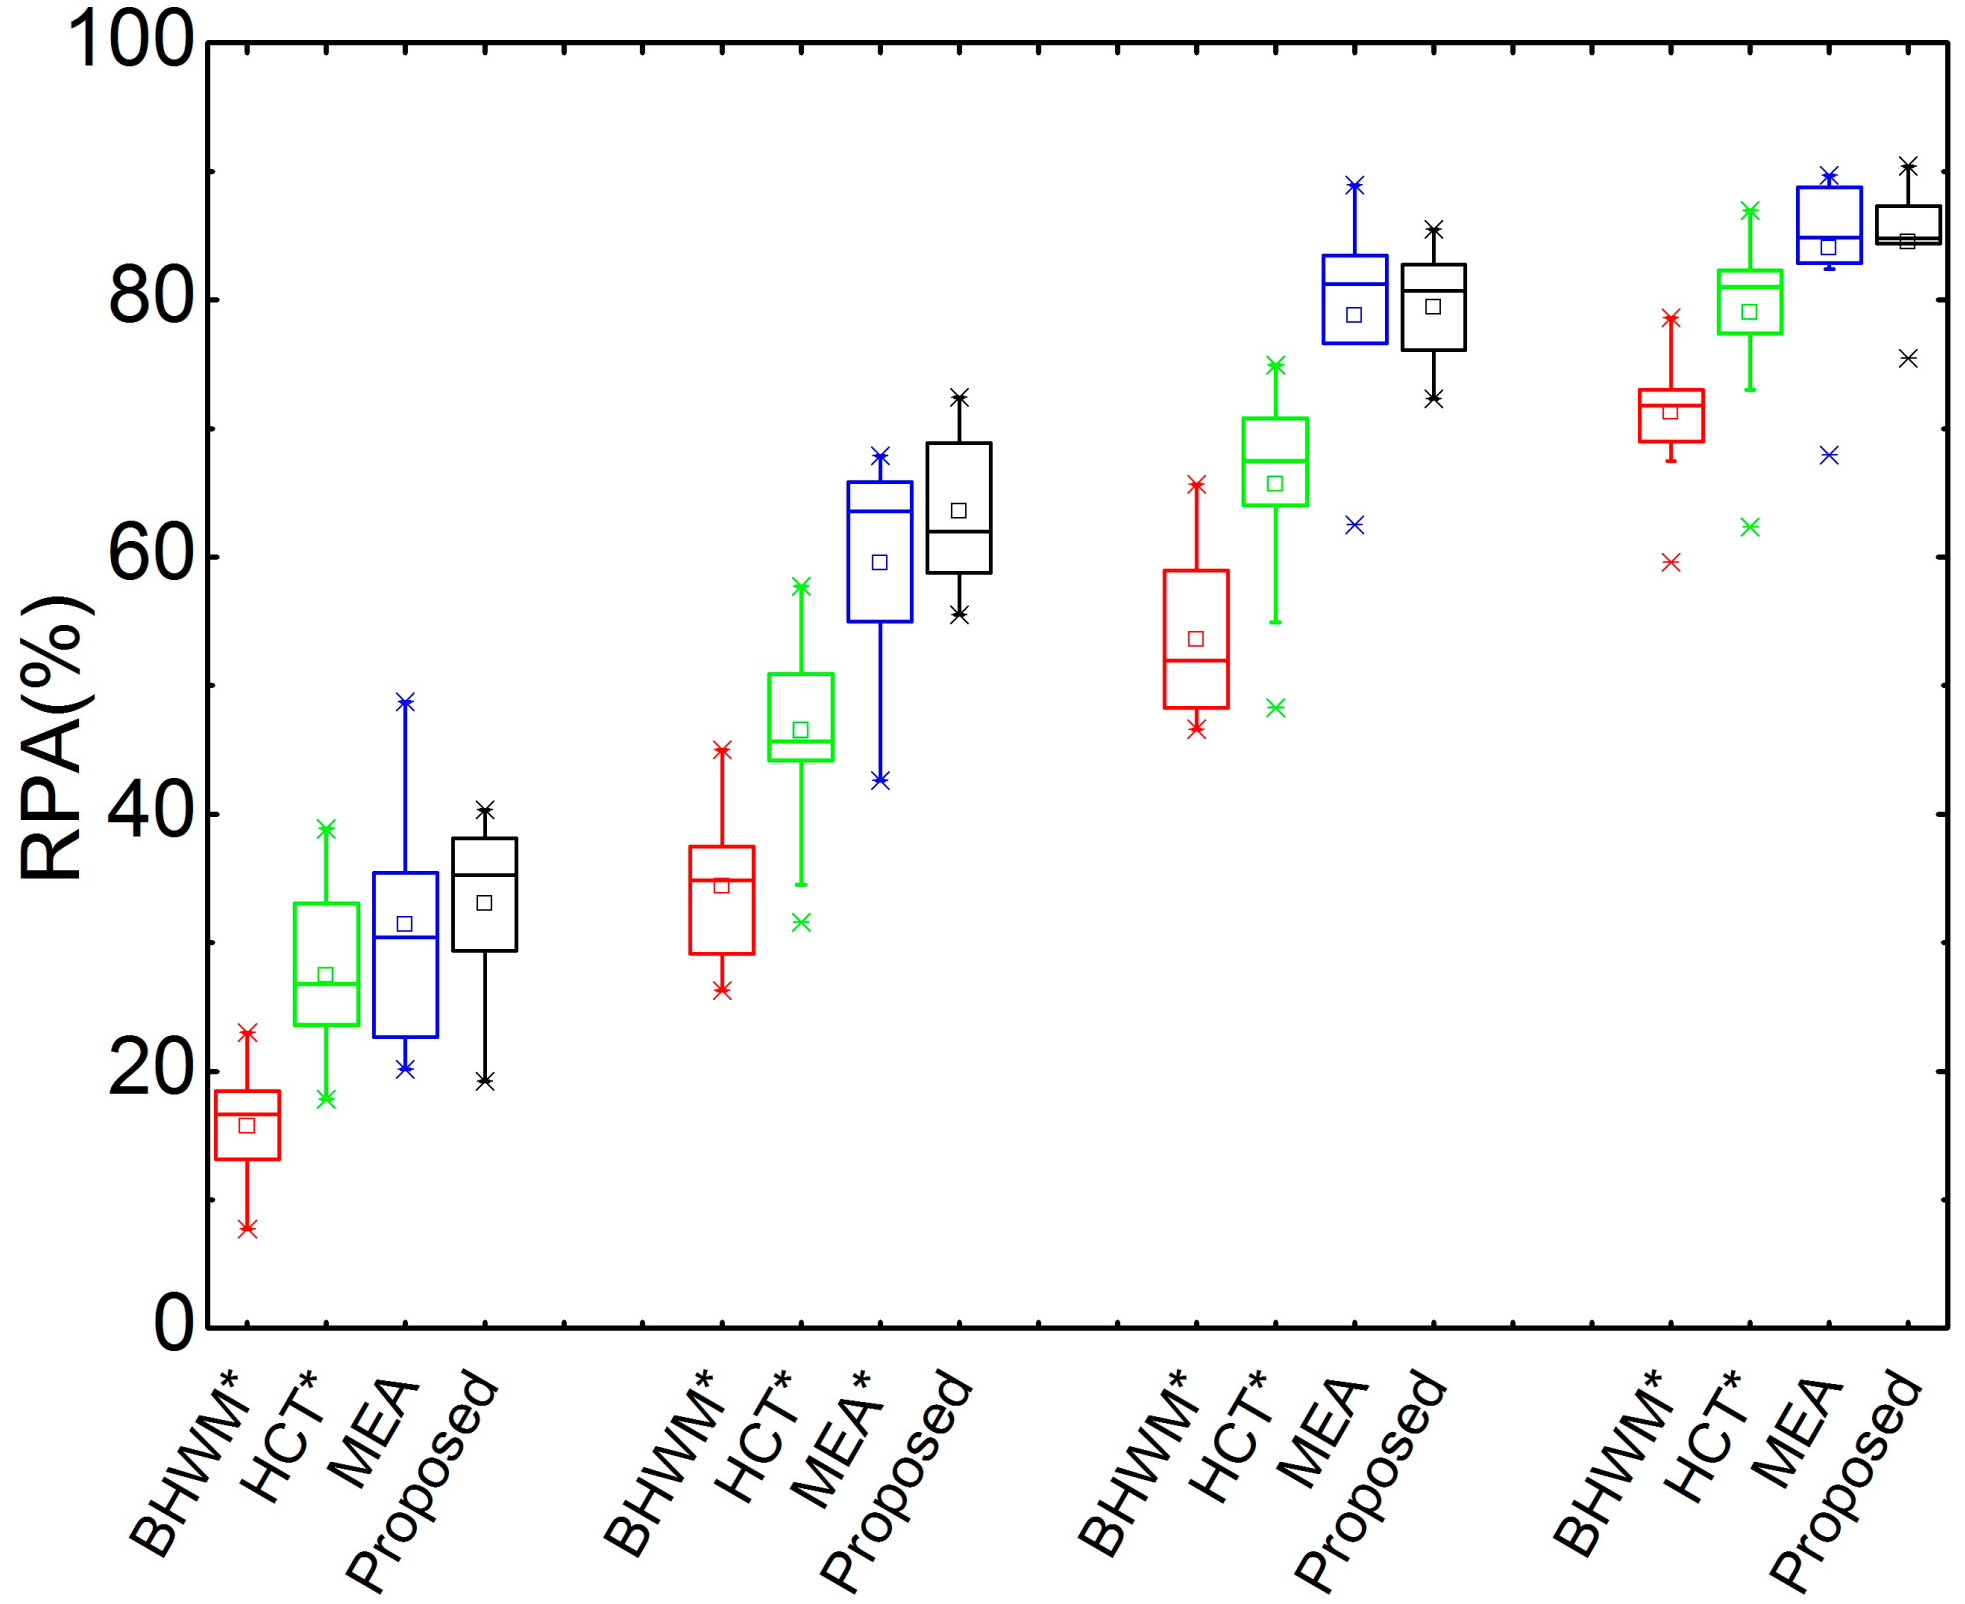
Figure 3 shows box plots of the RPA comparisons of the proposed method and other three reference methods on Bach10. There are four groups corresponding to different SARs, i.e., −5 dB, 0 dB, 5 dB, and 10 dB from left to right. It can be seen that all of the RPAs rise with the increase of the SAR for these four compared methods. The proposed method performs best at all SARs. To determine whether the superiority of the proposed method is statistically significant, a paired-sample t-test is performed between the proposed and each of the other three compared methods in terms of RPA with respect to different SARs. The significance level is set as 0.05. If the p-value is smaller than the significance level, an asterisk is marked at the name of the reference method. This sign is used for the same purpose on the other figures in this paper. It can be seen that the proposed method outperforms the HCT and BHWM methods significantly in terms of RPA for all SARs, and it performs better than MEA (though not significantly) for −5 dB, 5 dB, and 10 dB mixing. Additionally, the proposed method outperforms MEA significantly in terms of RPA at 0 dB SAR.
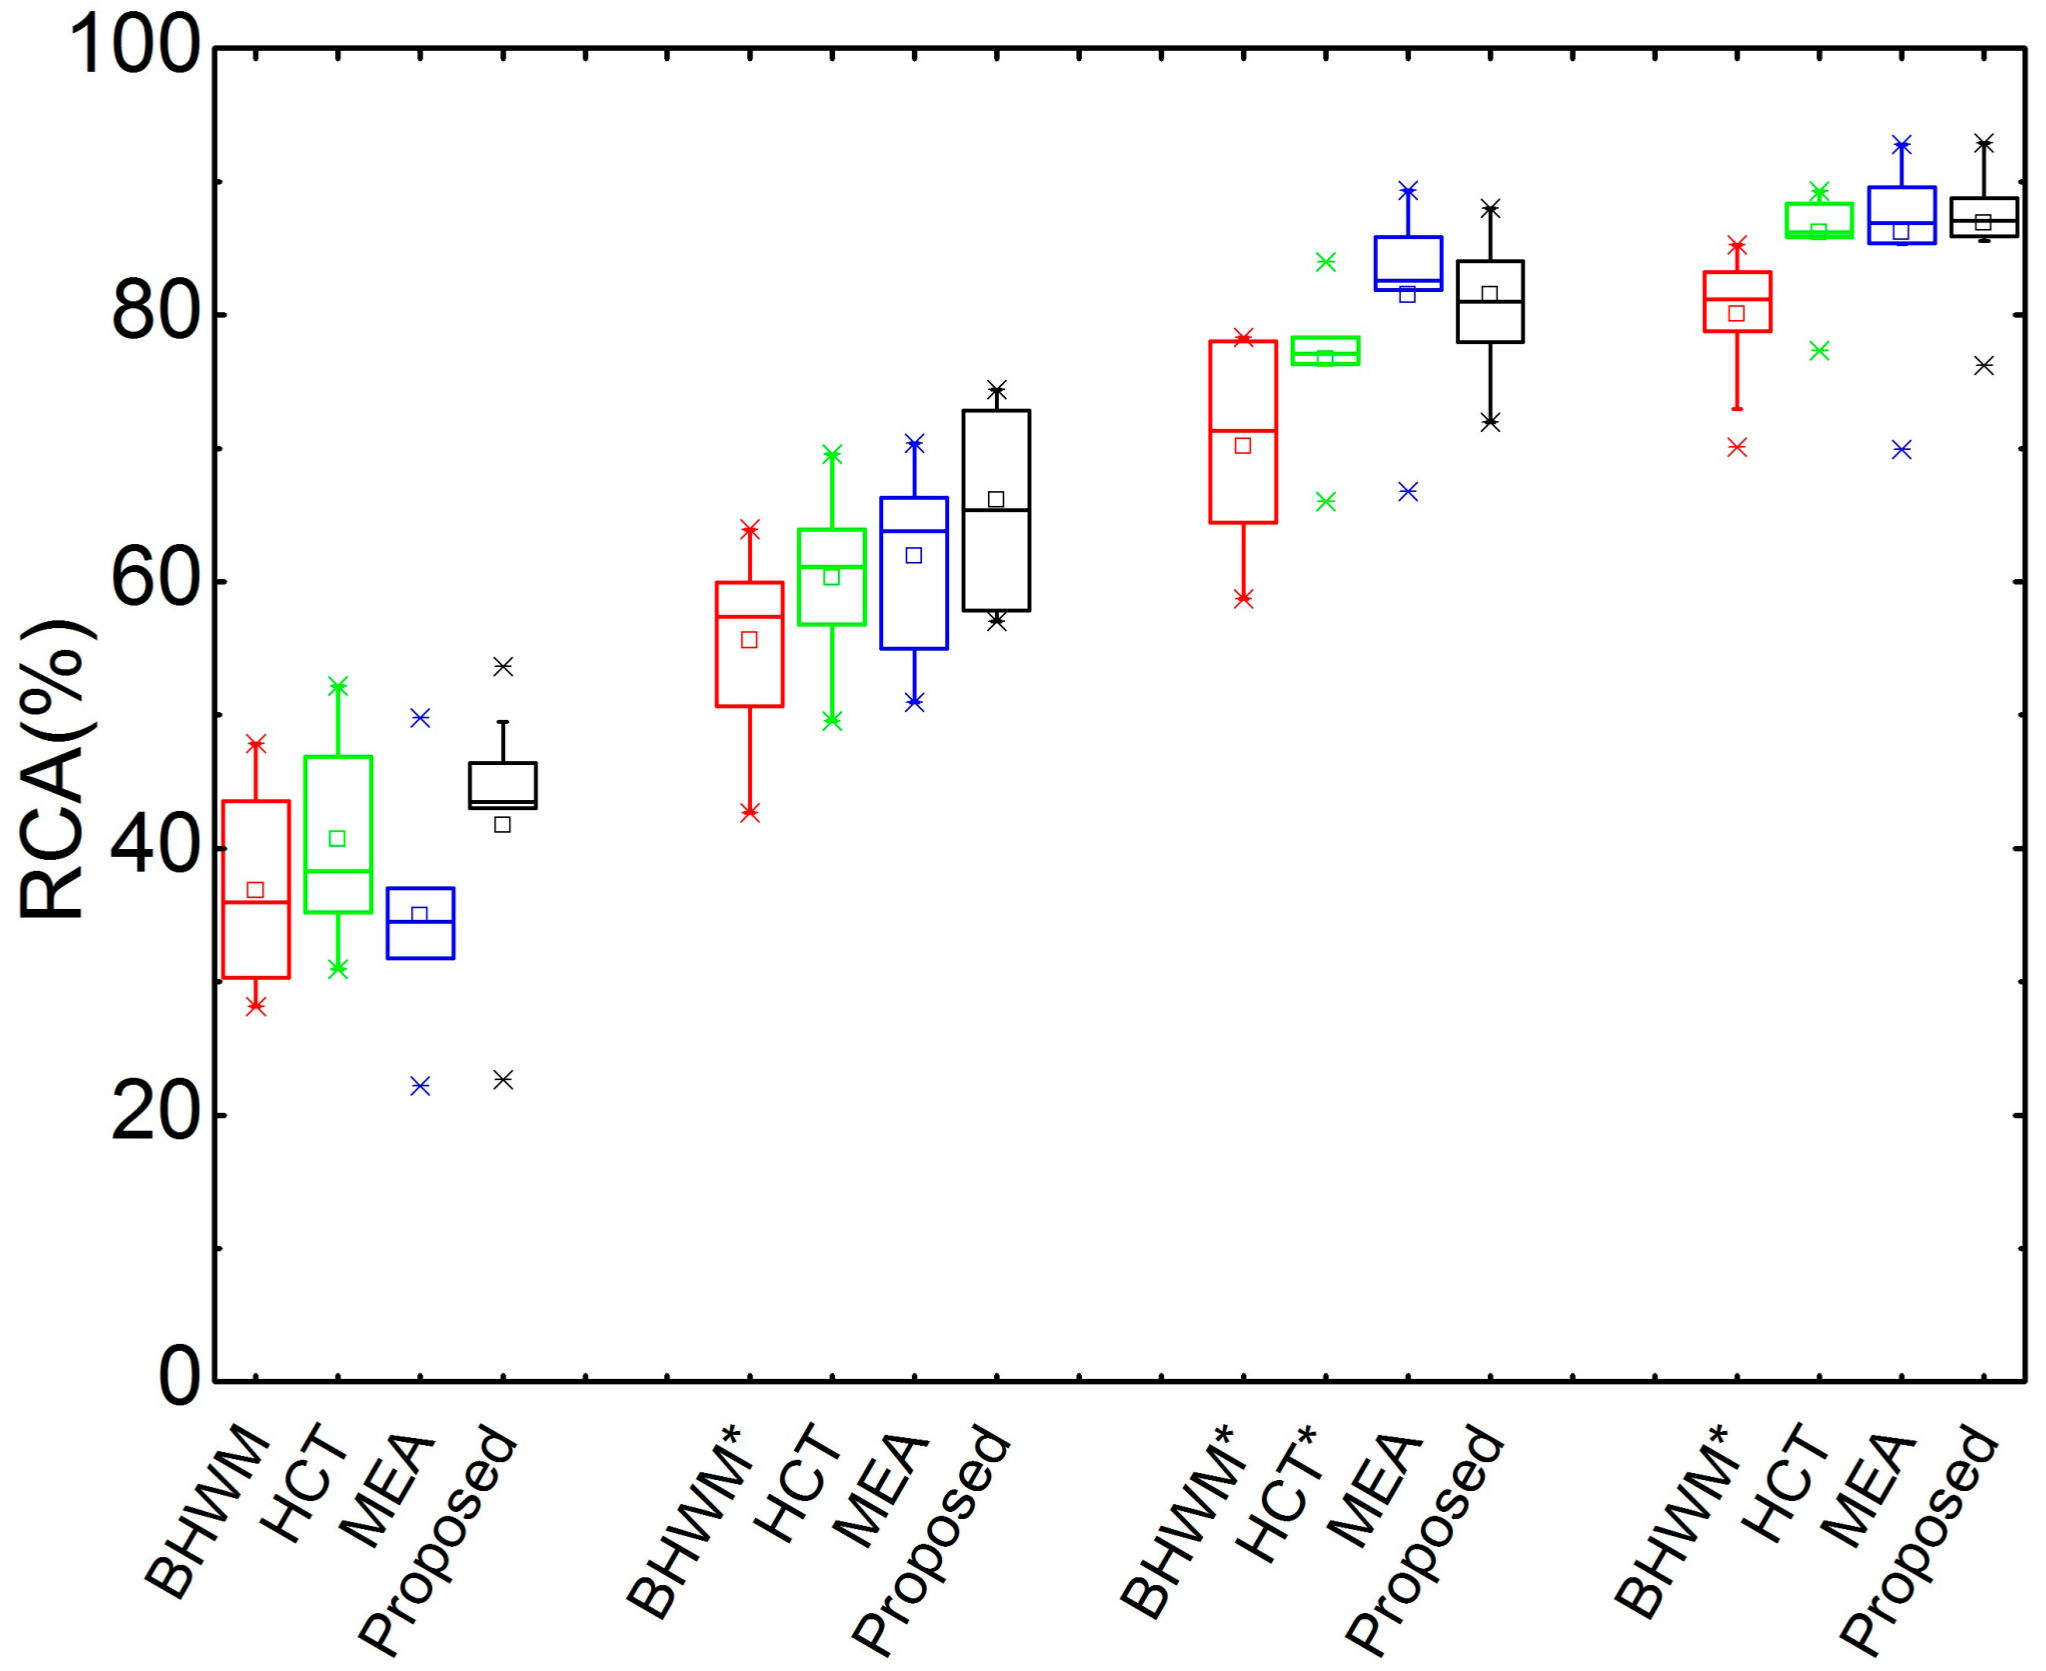
The box plots of RCA at different SARs on Bach10 are given in Figure 4. In particular, the proposed method still performs best at different SARs. The paired-sample t-test results show that the proposed methods significantly outperforms BHWM at 0 dB, 5 dB and 10 dB mixing, and HCT at 5 dB mixing. Additionally, the proposed method outperforms the other methods, though the marginals are not that large for the other cases.
Similarly, Figure 5 illustrates the box plots of OA with respect to different SARs and the statistical significance analysis results. It can be seen from this figure that the proposed method works well in terms of OA. It can be concluded from Figure 3, Figure 4 and Figure 5 that the proposed method performs well at different signal-to-accompaniment ratios.
3.3.4. Performance on Different Collections
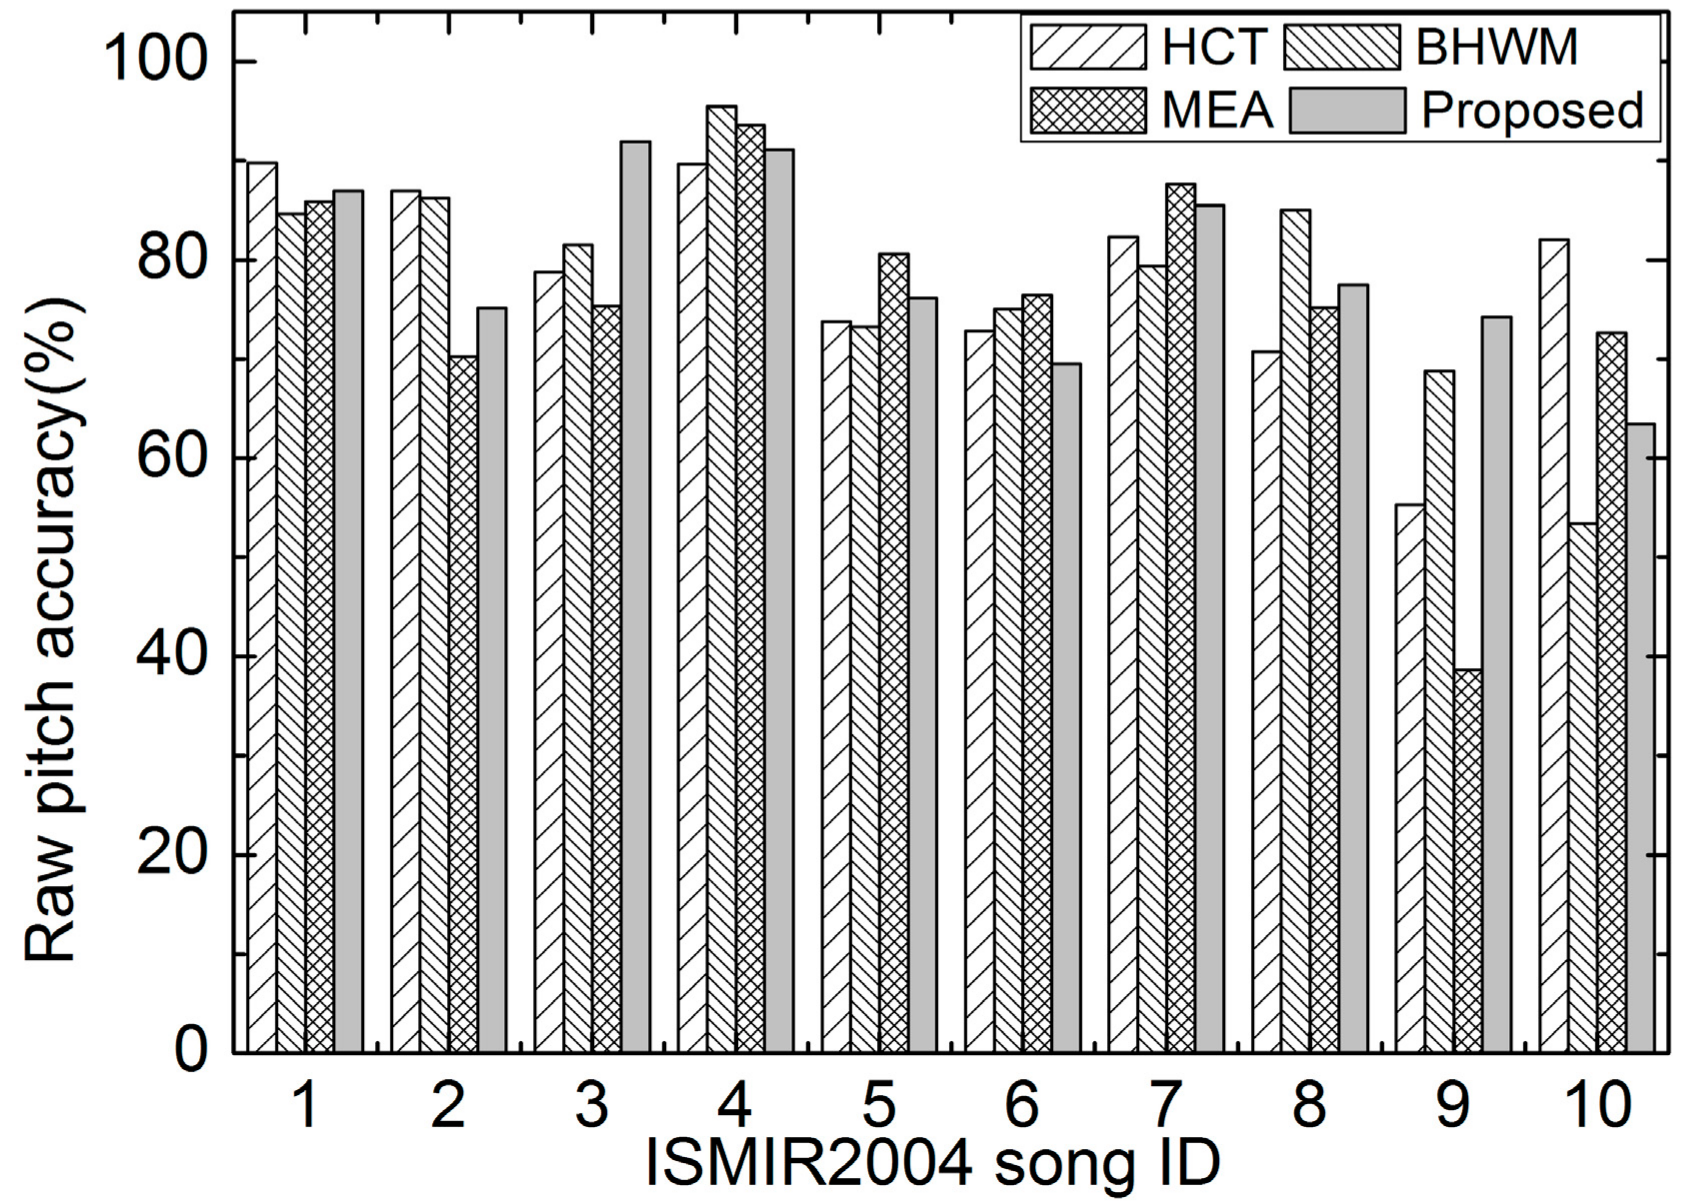
The performance of the compared methods is first evaluated on ISMIR2004. To intuitively show the results on each recording, the RPAs, RCAs, and OAs for the first 10 excerpts are illustrated and discussed herein. The overall evaluation results on this dataset are provided in Table 2. The RPAs of all compared methods with respect to the excerpts are illustrated in Figure 6. It can be seen from Figure 6 that the RPAs of all methods vary a great deal among different excerpts. The HCT and MEA perform poorly on the 9th excerpt, and BHWM achieves lower RPAs than others on the 10th excerpt. Comparatively, the proposed method obtains “smoother” RPAs on these ten excerpts.
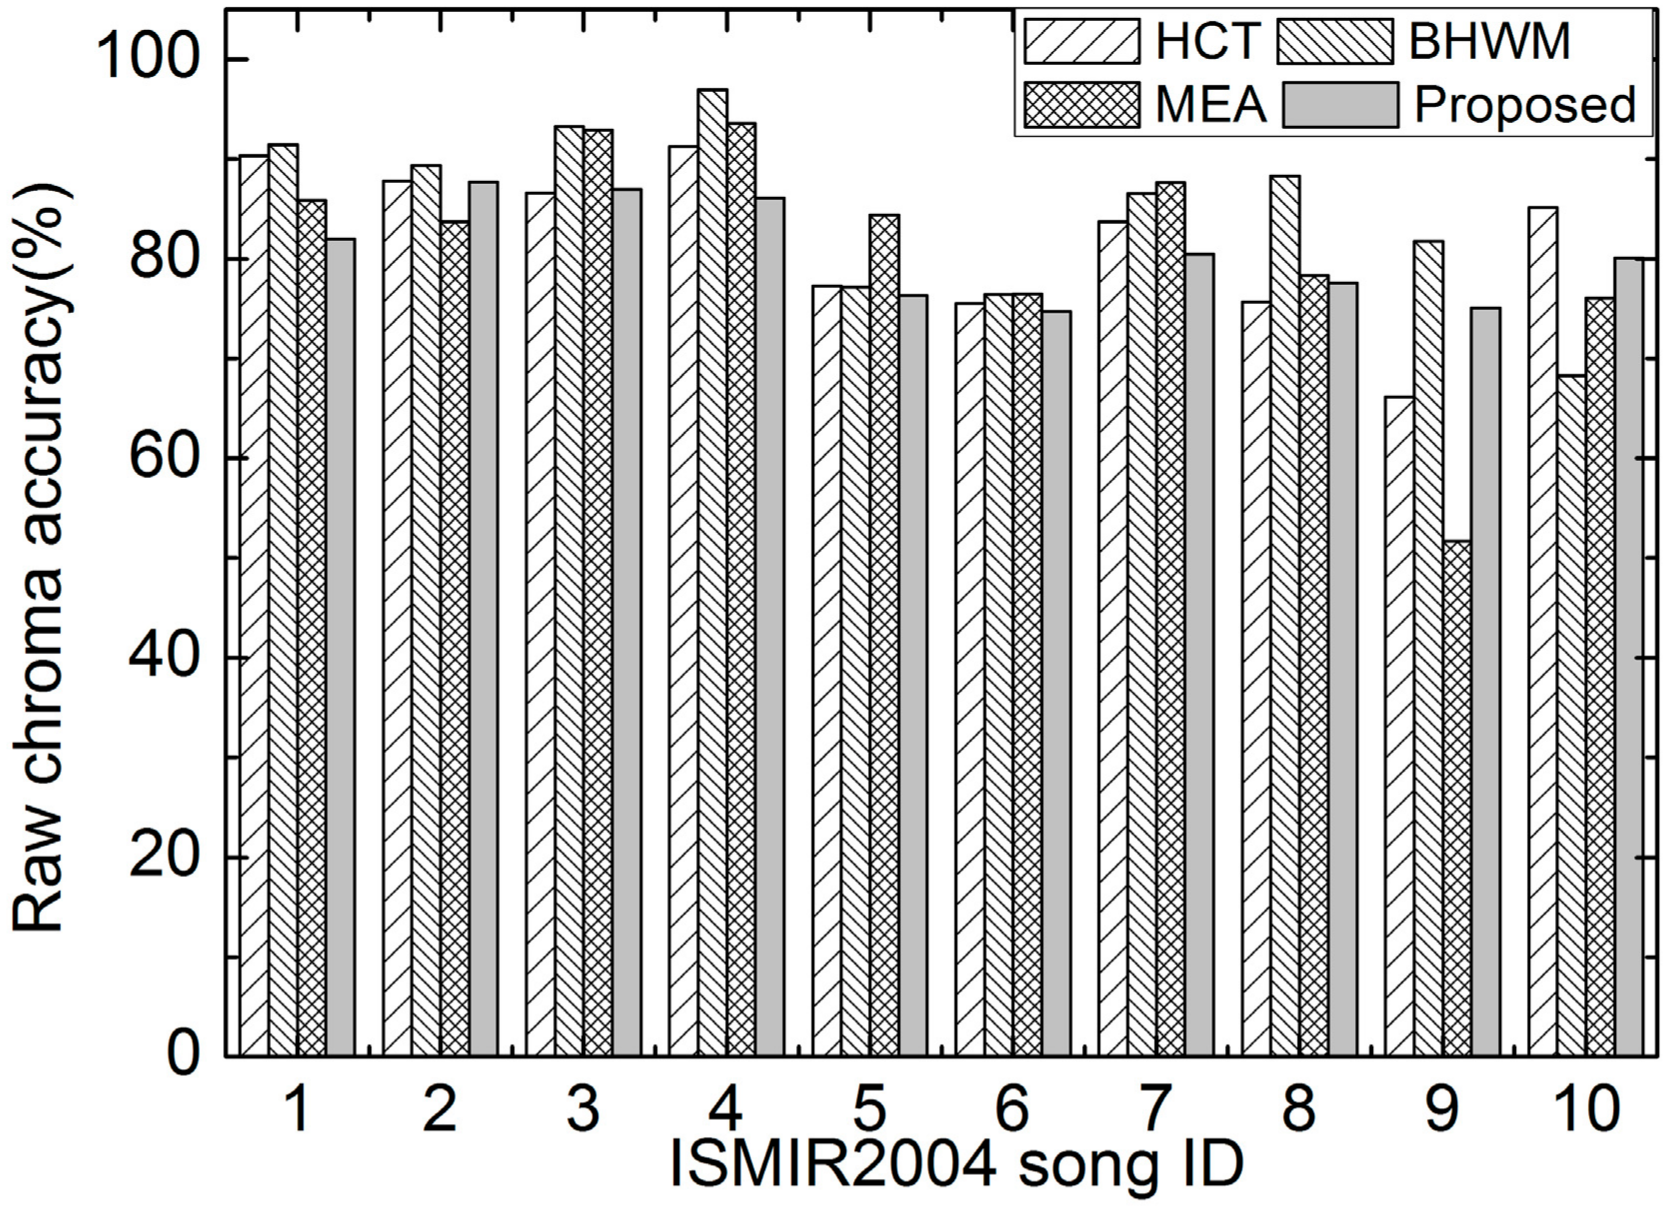
The RCAs of different methods on the first 10 excerpts of ISMIR2004 are depicted in Figure 7. Similar conclusions can be got as from the RPA results, indicating the robustness of the proposed method among these excerpts.
The OAs of all compared methods are illustrated in Figure 8. It can be seen that the proposed method performs the best or second best for recordings No. 1, 3, 5, 7, and 9. It can be concluded from Figure 6, Figure 7 and Figure 8 that the proposed method works well on these excerpts of ISMIR2004.
The overall evaluation results of the proposed and other reference methods on ISMIR2004 and MIR1K are listed in Table 2. It can be seen from this table that the proposed method outperforms the MEA on the ISMIR2004 dataset, and performs inferior than HCT and BHWM. Moreover, the proposed method gets the highest overall accuracy (OA), and obtains the second best RPA and RCA on the MIR1K dataset. Therefore, the proposed method can track the dynamic pitch changing within notes and achieves good performance comparing with the state-of-the-art methods.
It is interesting to see that the proposed method’s performance on Bach10 is much better than that on the other two datasets. When we look into the recordings, it is found there are deep vibratos and pitch glides in some excerpts of ISMIR2004, such as those opera and pop recordings. The proposed method could not track such fast and severe pitch variations. On the other hand, the melodies in MIR1K originate from the singing voice, where pitches are also modulated. However, the proposed method still works comparatively well on this dataset. That is because most pitches in this dataset do not vary so severely as in operas. Therefore, it can be concluded that the proposed method can track the ordinary pitch variation exhibited in the singing voice. Its performance on excerpts with deep vibratos and pitch glides still need to be improved.
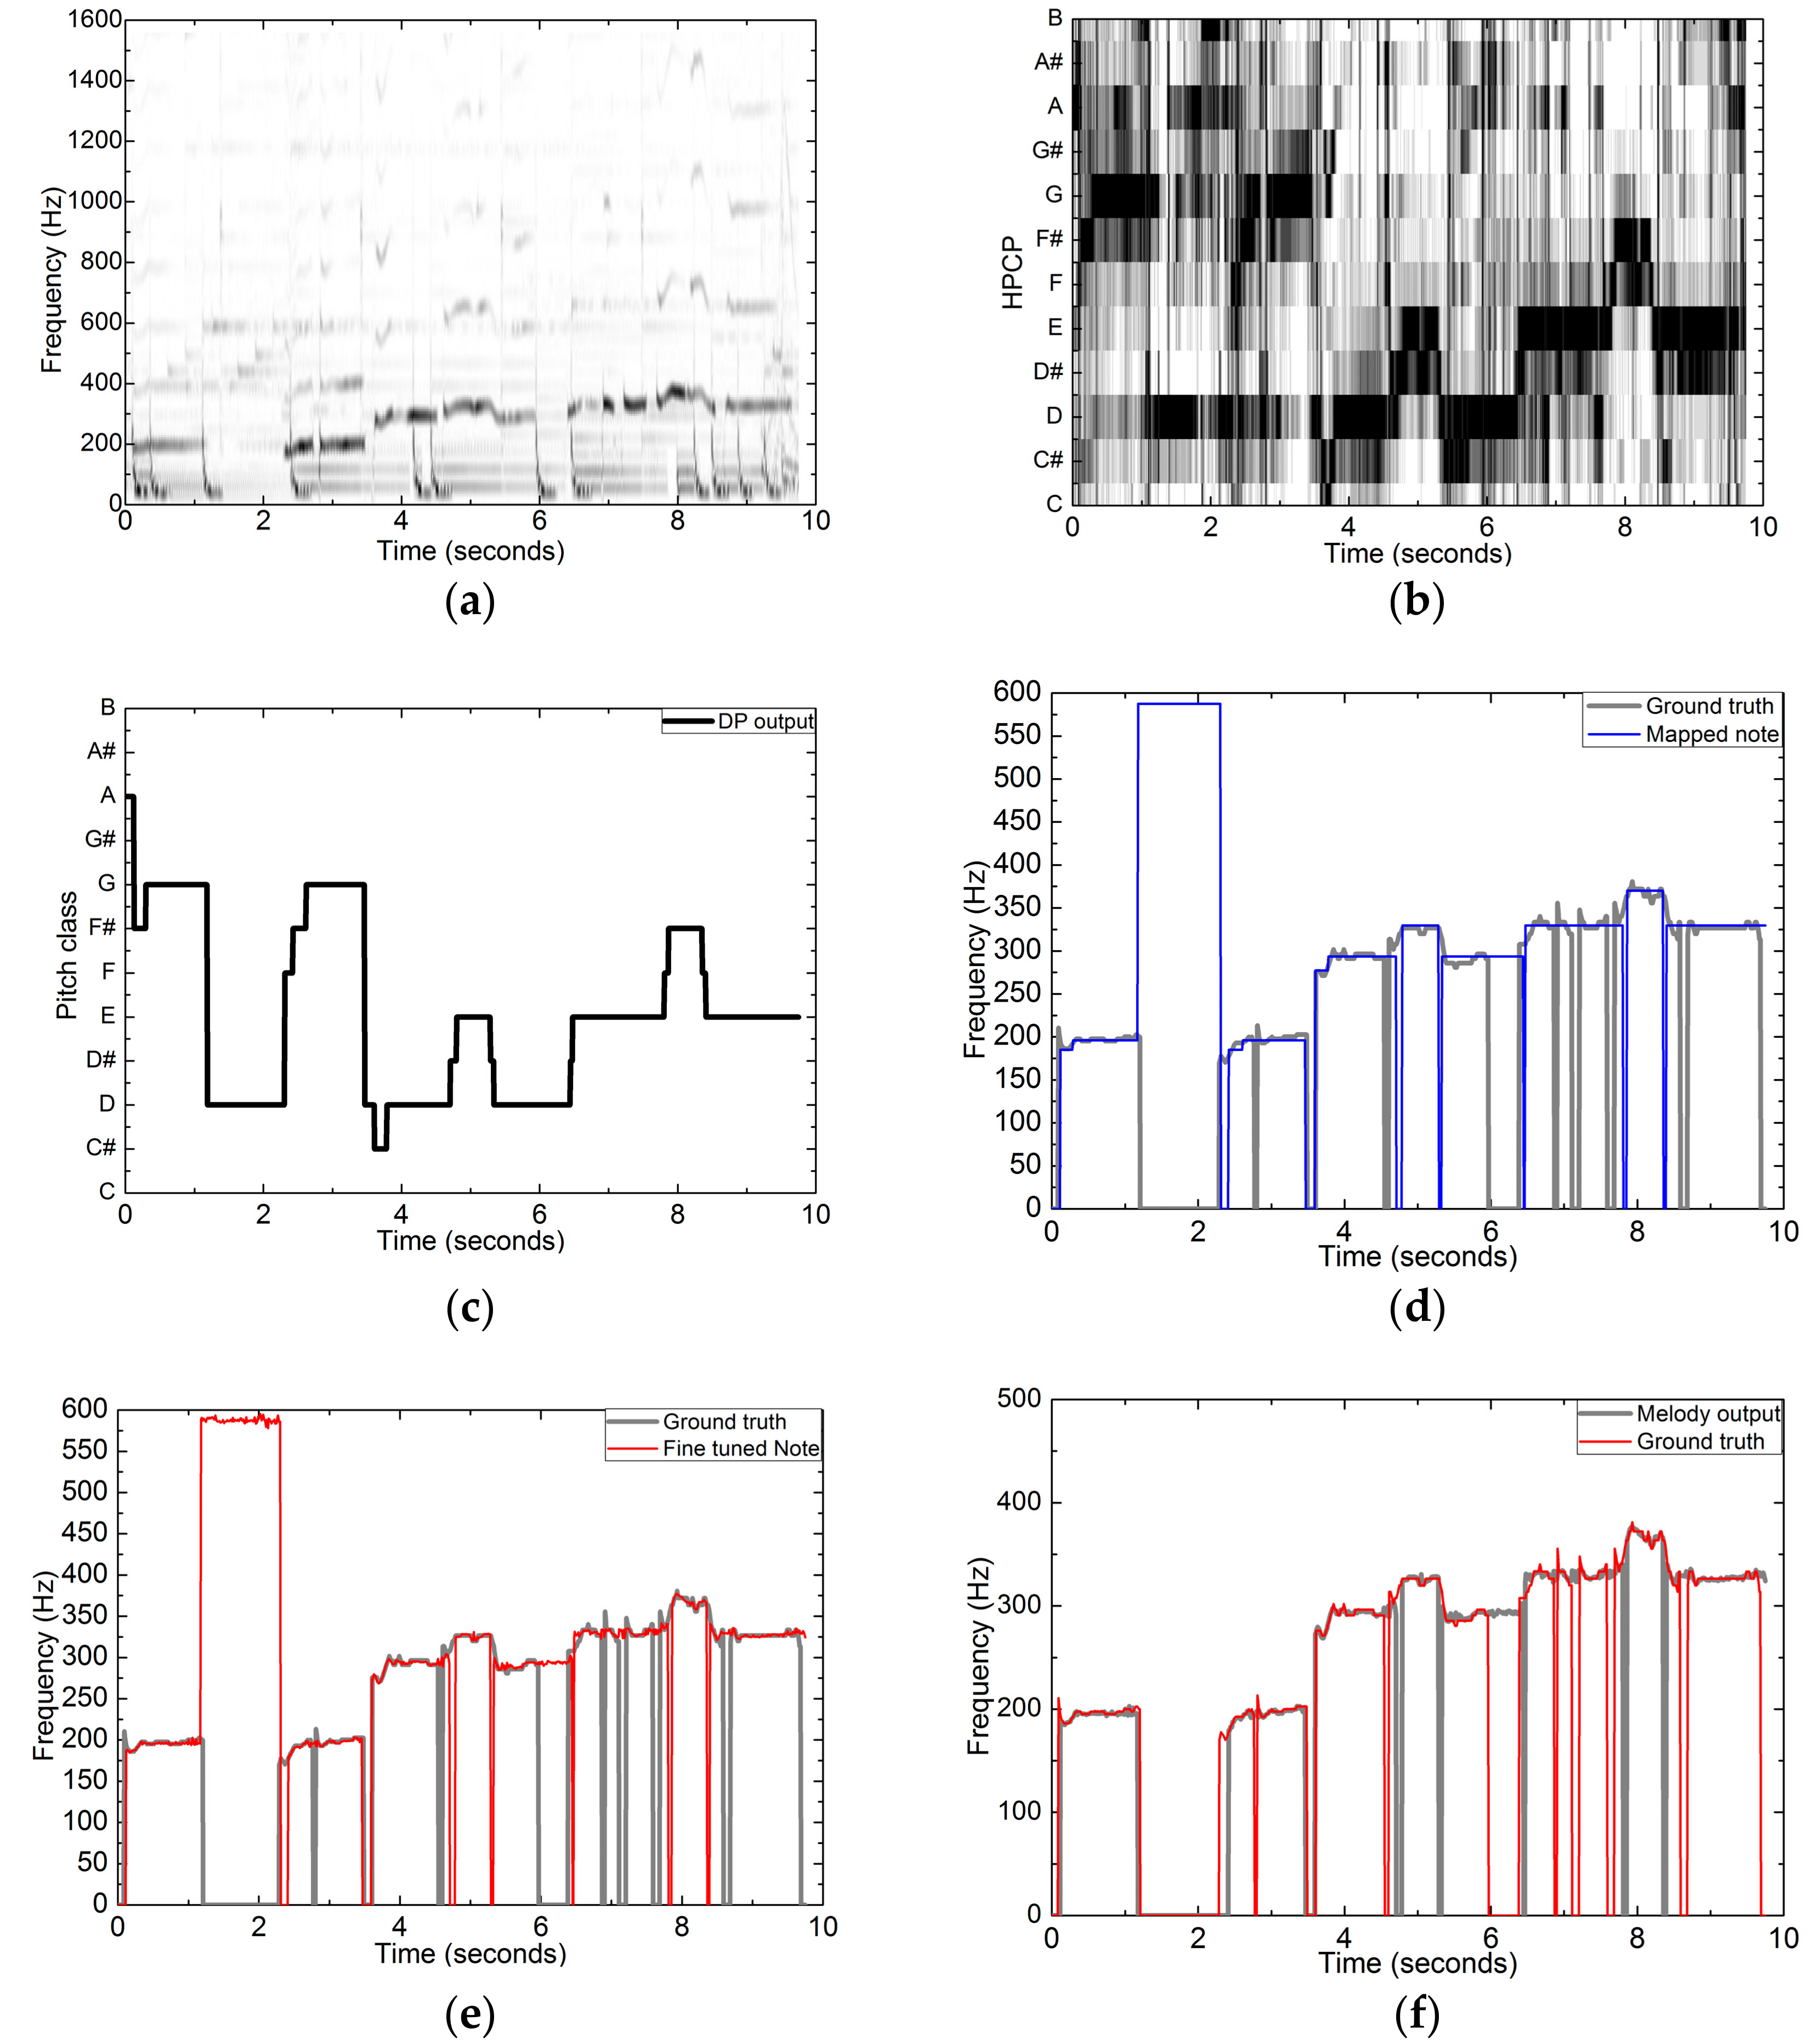
As an example, the results corresponding to the processing procedure, including spectrogram, HPCP, DP-based chroma tracking output, coarse mapped pitches, fine-tuned pitches, and the final melody output, are shown in Figure 9. This excerpt is taken from the MIR1K collection (Ani_4_05.wav). The melody originates from the singing voice with some vibrato as can be seen in Figure 9a. The chromagram constructed from the HPCP vectors is shown in Figure 9b. Then, it is not difficult to obtain the DP-based chroma tracking output as illustrated in Figure 9c. Next, the coarse melodic pitch sequence with no frequency variation over each note duration is shown in Figure 9d. After pitch frequency fine tuning, the refined pitch sequence provides more detailed dynamic variation, as illustrated in Figure 9e. Finally, the melody output after voicing detection is shown in Figure 9f.
3.4. Qualitative Error Analysis
A qualitative error analysis is valuable to help further improve the performance of the proposed method. It is noticed that the proposed method performs very well for the first 10 excerpts of ISMIR2004, while it is surpassed by some methods on this dataset. Hence, if the performance on the opera and pop excerpts is improved, the total performance on this dataset has the potential to surpass others. When we look insight into this dataset, the deep vibratos and pitch glides are commonly found, and the lower frequency accompaniments are also very strong. Moreover, the proposed method works much better in MIR1K, where there are 1000 excerpts, exceeding the other two datasets greatly.
There is no pitch shifting between different octaves by the proposed method because of the chroma-level note mapping. However, if the accompaniment is strong, the DP tracking may output the same pitch at the end of some notes due to the DP smoothing processing, leading to false alarm estimations. Thus, a more sophisticated voicing detection scheme is needed to further reduce the false alarms.
3.5. Discussion
According to the experimental results provided in this section, it can be seen that the proposed new architecture for melody extraction can extract melody from polyphonic music. It obtains the highest accuracies among the compared methods at different signal-accompaniment ratios. It achieves comparably good performance on the MIR1K dataset, but not that well on ISMIR2004. Deep observations reveal that, for the ordinary melody, either from singing voice or instruments, it can track the dynamic pitch variations, but it still needs to be improved to follow deep vibratos and pitch glides, such as in opera. In the future, we will focus our work on improving the performance of chroma-level note detection for such excerpts.
4. Conclusions
A chroma-level note tracking and pitch mapping-based melody extraction scheme is proposed in this paper. Specifically, the chroma-level notes are first tracked by dynamic programming. Next, a coarse note mapping is done according to a note salience function. Then, the frame-level pitches are fine tuned by the modified Euclidean algorithm, and the pitch salience values are utilized for subsequent voicing detection. Experimental results show the proposed method can track the dynamic pitch variation in general singing voice, and there is no pitch shifting between different octaves due to the note-level frequency mapping. Moreover, the proposed method performs well at different signal-to-accompaniment ratios. Its performance for recordings with deep vibratos and pitch glides still needs to be improved.
Author Contributions
Methodology, W.Z.; Validatation, W.Z.; Writing-Origina Draft Preparation, W.Z.; Writing-Review & Editing, F.Y. and Z.C.; Supervision, F.Y. and Z.C.
Funding
This work was supported by the National High Technology Research and Development Program (863 Program) of China, grant number (2015AA016306), the National Natural Science Foundation of China, grant number 61771091, the Natural Science Foundation of Liaoning Province, grant numbers 20170540159, 20170540197, and the Fundamental Research Funds for the Central Universities of China, grant numbers DUT17LAB04, DCPY2018062.
Acknowledgments
The authors would like to thank V. Arora and E. Vincent for providing the codes or executable programs for evaluating the performance of these methods.
Conflicts of Interest
The authors declare no conflict of interest.
References
- Salamon, J.; Gómez, E. Melody extraction from polyphonic music signals using pitch contour characteristics. IEEE Trans. Audio Speech Lang. Process. 2012, 20, 1759–1770. [Google Scholar] [CrossRef]
- Salamon, J.; Serrà, J.; Gómez, E. Tonal representations for music retrieval: From version identification to query-by-humming. Int. J. Multimedia Inf. Retr. 2013, 2, 45–58. [Google Scholar] [CrossRef]
- Salamon, J.; Rocha, B.; Gómez, E. Musical genre classification using melody features extracted from polyphonic music signals. In Proceedings of the 2012 IEEE International Conference on Acoustics, Speech and Signal Processing (ICASSP), Kyoto, Japan, 25–30 March 2012; pp. 81–84. [Google Scholar]
- Tsai, W.-H.; Yu, H.-M.; Wang, H.-M. Using the similarity of main melodies to identify cover versions of popular songs for music document retrieval. J. Inf. Sci. Eng. 2008, 24, 1669–1687. [Google Scholar]
- Sailer, C.; Dressler, K. Finding cover songs by melodic similarity. MIREX Ext. Abstr. 2006, 3, 1–3. [Google Scholar]
- Durrieu, J.L.; Richard, G.; David, B.; Fevotte, C. Source/Filter model for unsupervised main melody extraction from polyphonic audio signals. IEEE Trans. Audio Speech Lang. Process. 2010, 18, 564–575. [Google Scholar] [CrossRef]
- Fuentes, B.; Liutkus, A.; Badeau, R.; Richard, G. Probabilistic model for main melody extraction using constant-q transform. In Proceedings of the 2012 IEEE International Conference on Acoustics, Speech and Signal Processing (ICASSP), Kyoto, Japan, 25–30 March 2012; pp. 5357–5360. [Google Scholar]
- Poliner, G.; Ellis, D. A classi cation approach to melody transcription. In Proceedings of the 6th International society of Music Information Retrieval (ISMIR), London, UK, 11–15 September 2005; pp. 161–166. [Google Scholar]
- Ellis, D.P.W.; Poliner, G.E. Classi cation-based melody transcription. Mach. Learn. 2006, 65, 439–456. [Google Scholar] [CrossRef]
- Vincent, E.M.; Plumbley, M.D. Predominant-F0 estimation using Bayesian harmonic waveform models. In Proceedings of the International Conference on Music Information Retrieval (ISMIR), London, UK, 11–15 September 2005. [Google Scholar]
- Arora, V.; Behera, L. On-line melody extraction from polyphonic audio using harmonic cluster tracking. IEEE Trans. Audio Speech Lang. Process. 2013, 21, 520–530. [Google Scholar] [CrossRef]
- Zhang, W.; Chen, Z.; Yin, F. Main melody extraction from polyphonic music based on modified Euclidean algorithm. Appl. Acoust. 2016, 112, 70–78. [Google Scholar] [CrossRef]
- de Cheveigné, A.; Kawahara, H. YIN, a fundamental frequency estimator for speech and music. J. Acoust. Soc. Am. 2002, 111, 1917–1930. [Google Scholar] [CrossRef] [PubMed]
- Salamon, J.J. Chroma-Based Predominant Melody and Bass Line Extraction from Music Audio Signals. Master’s Thesis, Universitat Pompeu Fabra, Barcelona, Spain, 2008. [Google Scholar]
- Salamon, J.J.; Gómez, E. A chroma-based salience function for melody and bass line estimation from music audio signals. In Proceedings of the Sound and Music Computing Conference, Porto, Portugal, 23–25 July 2009; pp. 331–336. [Google Scholar]
- Dressler, K. Pitch estimation by the pair-wise evaluation of spectral peaks. In Proceedings of the 42nd International Conference Audio Engineering Society Conference, Ilmenau, Germany, 22–24 July 2011; pp. 1–10. [Google Scholar]
- Gómez, E. Tonal Description of Music Audio Signals. Ph.D. Thesis, Universitat Pompeu Fabra, Barcelona, Spain, 2006. [Google Scholar]
- Fujishima, T. Realtime chord recognition of musical sound: A system using common lisp music. In Proceedings of the International Computer Music Conference, Beijing, China, 22–27 October 1999; pp. 464–467. [Google Scholar]
- Grosche, P.; Müller, M.; Serrà, J. Audio Content-Based Music Retrieval. In Schloss DagstuhlLeibniz-Zentrum fuer Informatik; Dagstuhl: Wadern, Germany, 2012. [Google Scholar]
- Serrà, J.; Gómez, E.; Herrera, P.; Serra, X. Chroma binary similarity and local alignment applied to cover song identification. IEEE Trans. Audio Speech Lang. Process. 2008, 16, 1138–1151. [Google Scholar] [CrossRef]
- Chen, N.; Downie, J.S.; Xiao, H.D.; Zhu, Y. Cochlear pitch class profile for cover song identification. Appl. Acoust. 2015, 99, 92–96. [Google Scholar] [CrossRef]
- Fan, Z.C.; Jang, J.S.R.; Lu, C.L. Singing voice separation and pitch extraction from monaural polyphonic audio music via DNN and adaptive pitch tracking. In Proceedings of the IEEE Second International Conference on Multimedia Big Data (BigMM), Taipei, Taiwan, 20–22 April 2016; pp. 178–185. [Google Scholar]
- Howes, P.; Callaghan, J.; Davis, P.; Kenny, D.; Thorpe, W. The relationship between measured vibrato characteristics and perception in western operatic singing. J. Voice 2004, 18, 216–230. [Google Scholar] [CrossRef] [PubMed]
- Ferrante, I. Vibrato rate and extent in soprano voice: A survey on one century of singing. J. Acoust. Soc. Am. 2011, 130, 1683–1688. [Google Scholar] [CrossRef] [PubMed]
- Bregman, A.S. Auditory Scene Analysis: The Perceptual Organization of Sound; MIT Press: Cambridge, MA, USA, 1999. [Google Scholar]
- Duan, Z.; Pardo, B.; Zhang, C. Multiple fundamental frequency estimation by modeling spectral peaks and non-peak regions. IEEE Trans. Audio Speech Lang. Process. 2010, 18, 2121–2133. [Google Scholar] [CrossRef]
Figure 1.
Block diagram of the chroma-level note tracking and pitch mapping-based method.

Figure 2.
Frame-wise raw chroma accuracy vs. penalty factor for different melody types.
Figure 3.
RPAs of compared methods on Bach10 (%). These four groups correspond to different SARs, i.e., −5 dB, 0 dB, 5 dB, and 10 dB from left to right. The asterisk is to indicate the superiority of the proposed method at this metric and the SAR is significant. This sign is used for the same meaning in the following figures.
Figure 4.
RCAs of compared methods on Bach10 (%).

Figure 5.
OAs of compared methods on Bach10 (%).
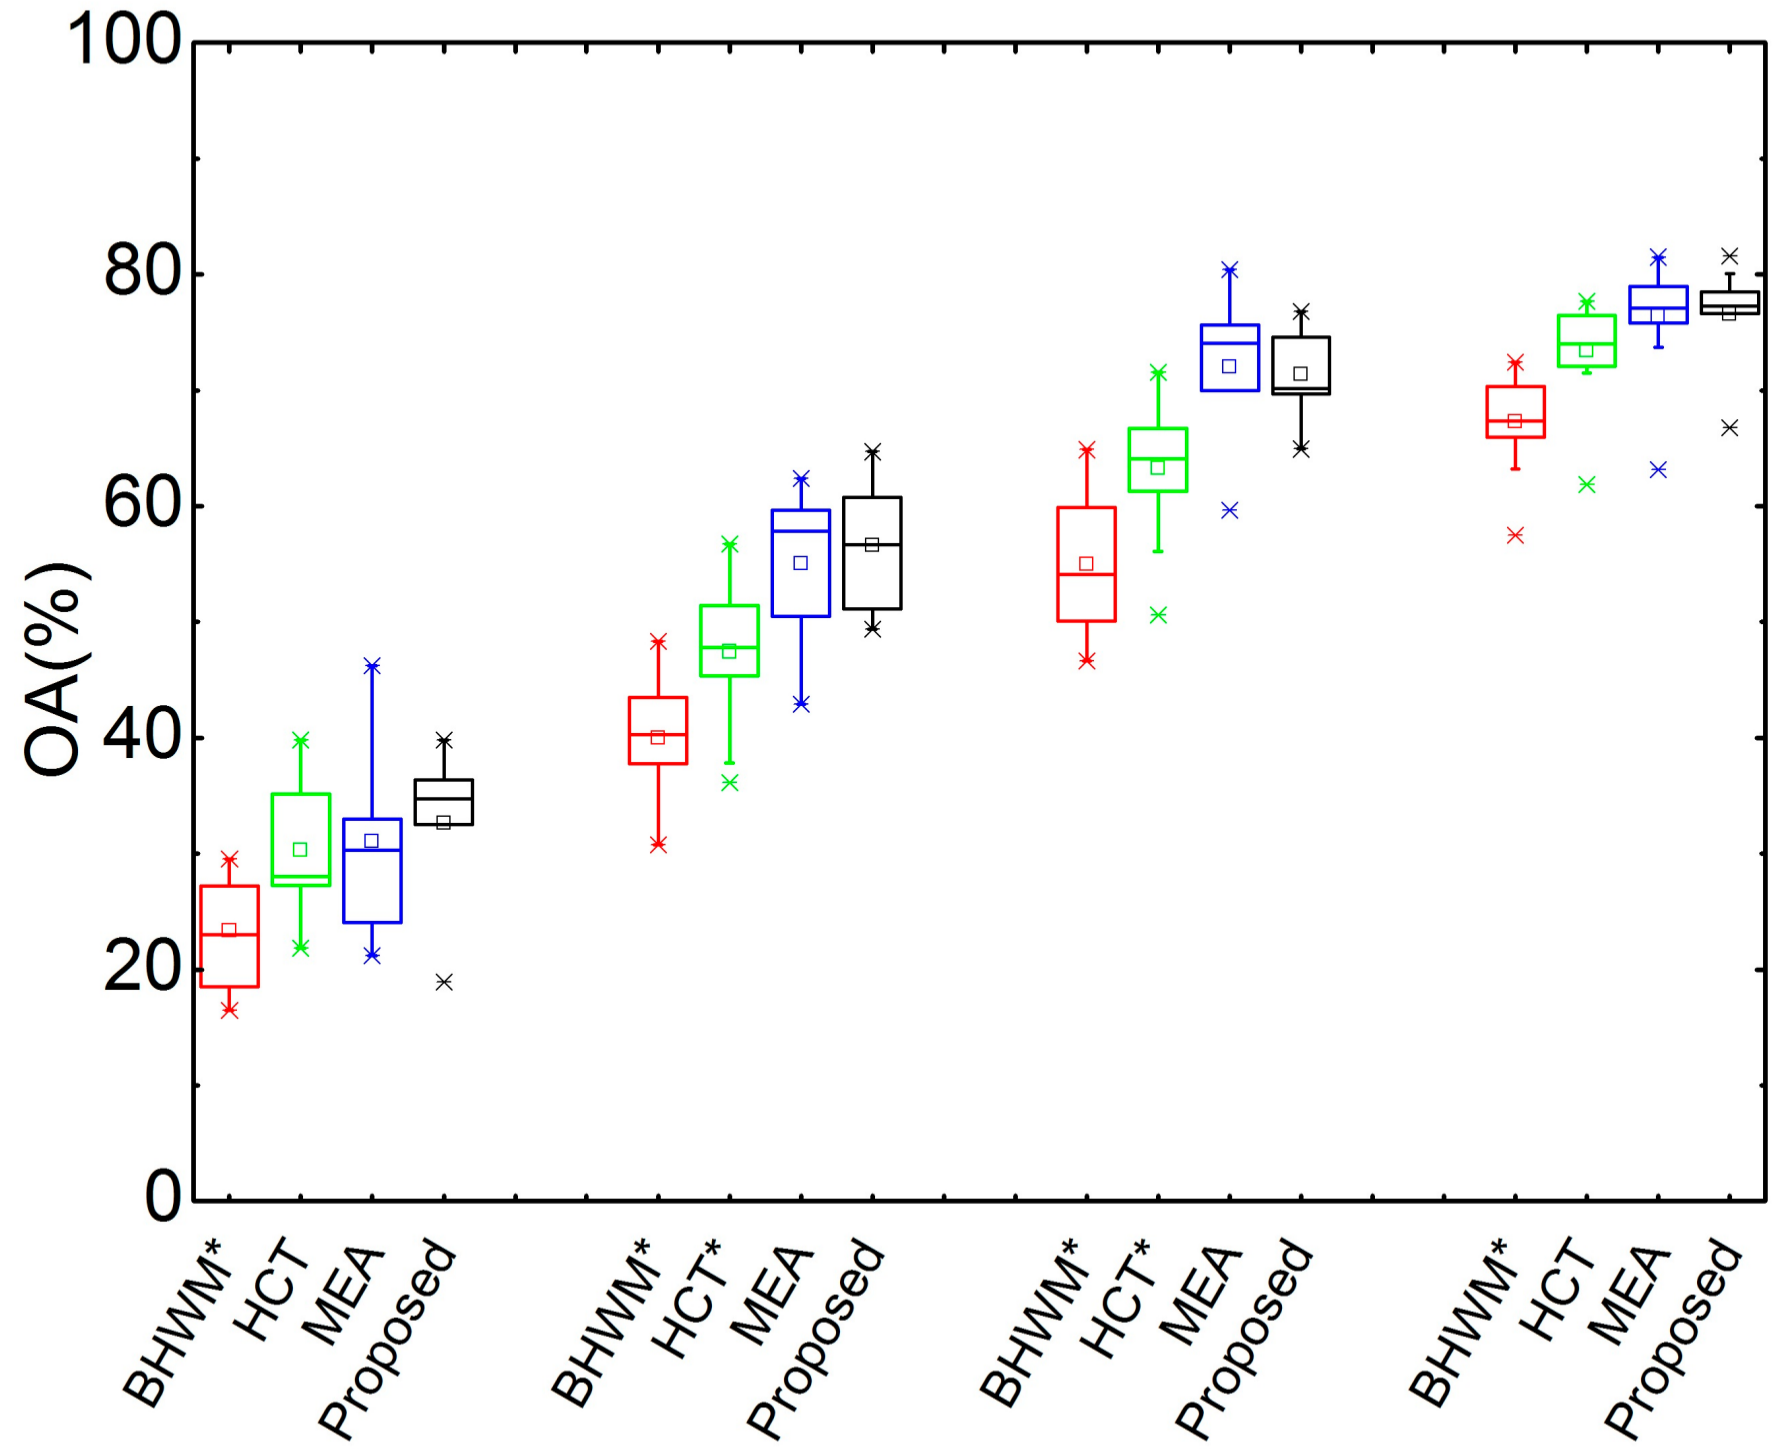
Figure 6.
Raw pitch accuracies of different methods on ISMIR2004.

Figure 7.
Raw chroma accuracies of different methods on ISMIR2004.
Figure 8.
Overall accuracies of different methods on ISMIR2004.
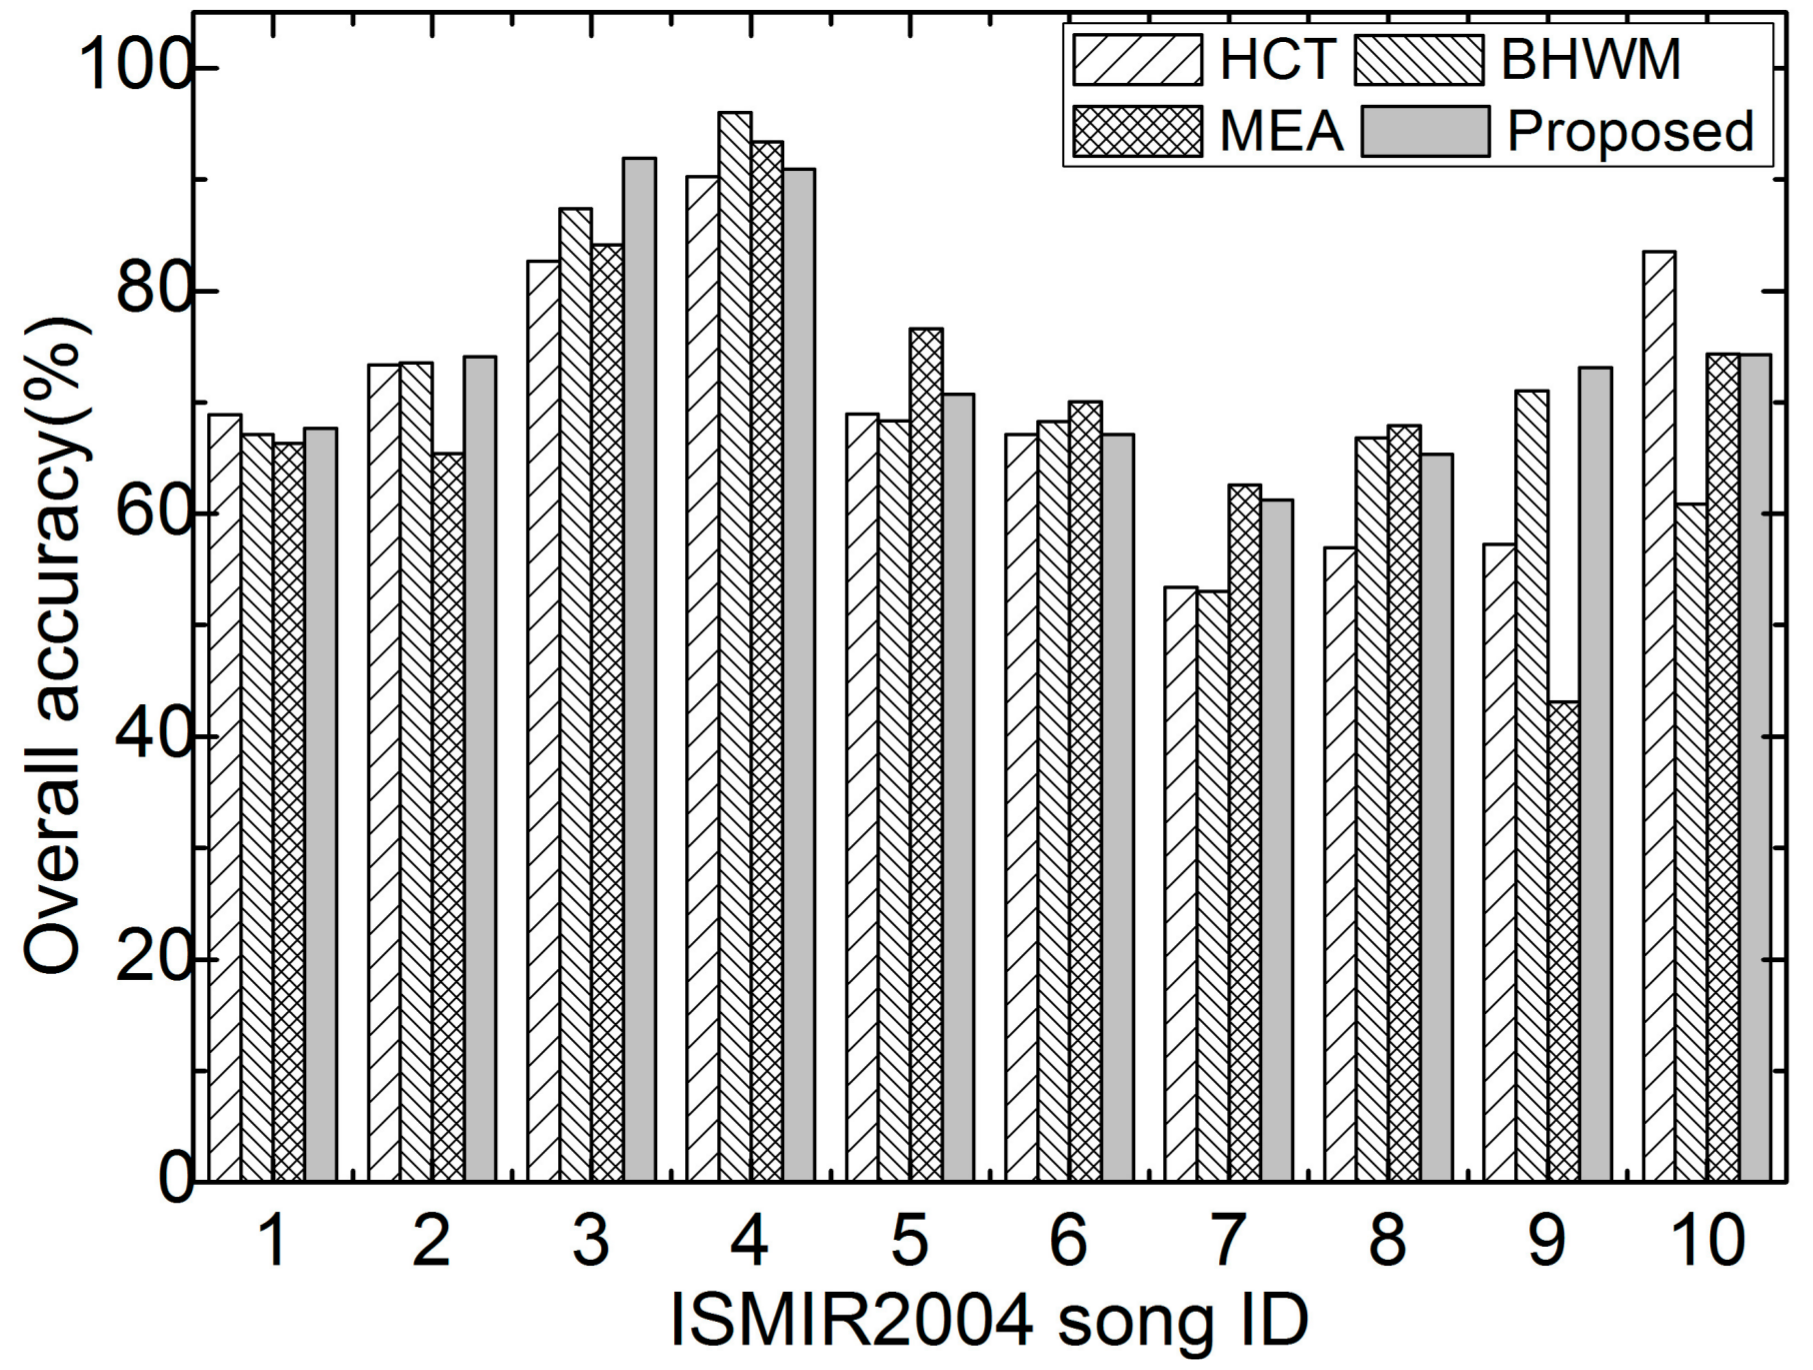
Figure 9.
Median results of extracting melody from a polyphonic music recording. (a) Spectrogram; (b) HPCP; (c) chroma-level notes; (d) coarsely mapped pitches; (e) fine-tuned pitches; (f) melody output.
Figure 9.
Median results of extracting melody from a polyphonic music recording. (a) Spectrogram; (b) HPCP; (c) chroma-level notes; (d) coarsely mapped pitches; (e) fine-tuned pitches; (f) melody output.

Table 1.
Evaluation collections.
| Collection | Description |
|---|---|
| ISMIR2004 | There are 20 excerpts of polyphonic recordings with five types of melody sources, the synthesized voice (syn), saxophone (jazz), MIDI instruments (MIDI), classical opera (opera), and real-world pop (pop). These recordings last roughly 20 s. The sampling rate is 44.1 kHz, and ground truths are given at 5.8 ms intervals (with hop size 256 samples). |
| MIR1 K | There are 1000 excerpts of Chinese karaoke excerpts recorded at 16 kHz sampling rate with 16-bit resolution. These excerpts were selected from 5000 Chinese pop songs sung by 19 male and female amateurs. These excerpts last from 4 s to 13 s, and total length of the collection is 133 min. The melodic pitches are also located at 10 ms intervals. |
| Bach10 | There are 10 pieces of recordings downloaded from Internet. There are four parts (soprano, alto, tenor, and bass) of each piece recorded separately with a sampling rate 44.1 kHz. The time interval of ground truth is also 10 ms. The soprano is considered as the melody, and mixed with other parts with signal-to-accompaniment ratios of −5 dB, 0 dB, 5 dB, and 10 dB. |
Table 2.
Accuracies of different methods on ISMIR2004 and MIR1K.
| Collection | Method | OA (%) | RPA (%) | RCA (%) |
|---|---|---|---|---|
| ISMIR2004 | HCT | 62.29 | 70.83 | 74.10 |
| BHWM | 66.64 | 74.78 | 81.06 | |
| MEA | 58.77 | 63.59 | 68.64 | |
| Proposed | 59.35 | 64.23 | 69.12 | |
| MIR1K | HCT | 33.54 | 34.82 | 44.15 |
| BHWM | 35.63 | 47.52 | 54.39 | |
| MEA | 43.89 | 56.07 | 63.09 | |
| Proposed | 44.58 | 53.89 | 61.93 |
© 2018 by the authors. Licensee MDPI, Basel, Switzerland. This article is an open access article distributed under the terms and conditions of the Creative Commons Attribution (CC BY) license (http://creativecommons.org/licenses/by/4.0/).
Share and Cite
MDPI and ACS Style
Zhang, W.; Chen, Z.; Yin, F. Melody Extraction Using Chroma-Level Note Tracking and Pitch Mapping. Appl. Sci. 2018, 8, 1618. https://doi.org/10.3390/app8091618
AMA Style
Zhang W, Chen Z, Yin F. Melody Extraction Using Chroma-Level Note Tracking and Pitch Mapping. Applied Sciences. 2018; 8(9):1618. https://doi.org/10.3390/app8091618
Chicago/Turabian StyleZhang, Weiwei, Zhe Chen, and Fuliang Yin. 2018. "Melody Extraction Using Chroma-Level Note Tracking and Pitch Mapping" Applied Sciences 8, no. 9: 1618. https://doi.org/10.3390/app8091618
Note that from the first issue of 2016, this journal uses article numbers instead of page numbers. See further details here.