NZEB Renovation Definition in a Heating Dominated Climate: Case Study of Poland


1
The Faculty of Civil Engineering, Warsaw University of Technology, Lecha Kaczyńskiego 16, Warsaw 00-637, Poland
2
The Building Research Institute, Ksawerów 21, Warsaw 02-656, Poland
*
Author to whom correspondence should be addressed.
Appl. Sci. 2018, 8(9), 1605; https://doi.org/10.3390/app8091605
Submission received: 7 August 2018
/
Revised: 28 August 2018
/
Accepted: 3 September 2018
/
Published: 10 September 2018
(This article belongs to the Special Issue Zero-Energy Buildings)
Abstract
:Featured Application
The aim of this study is to propose a definition that could be used by the programme Clean Air (with budget 24 billion EUR) focusing only on renovation of single family houses and, by doing so, improve the NZEB renovation.
Abstract
The main objective of this article is to propose possible requirements for NZEB (nearly zero-energy buildings) renovation definition in heating dominated climate. A survey was carried out on potential approaches and indicators that could be used for the NZEB definition of existing single-family houses in Poland. The process of determining requirements for the NZEB renovation definition was divided into two stages. The cost-optimal U-values of the building’s envelope were initially calculated and, based on them, the energy demand for heating (QH) and the reduction of non-renewable primary energy demand (QP) were estimated. The calculations were made for different energy prices, locations, and two building models. Based on them the requirements for cost-optimal renovation (QH ≤ 60 kWh/(m² year), QP reduction ≥ 75%) and NZEB renovation (QH ≤ 40 kWh/(m² year), QP reduction ≥ 80%) were proposed. In contrast to definitions using only a maximum level of QP, two indicators were used. Such a solution is appropriate for existing buildings because it prevents the situation in which only renewable energy sources (RES) (with a low primary energy factor) will be applied in order to decrease the primary, non-renewable energy demand.
1. Introduction
Existing buildings are responsible for about 40% of the EU’s final energy consumption, and more than one third of carbon dioxide emissions [1]. Currently, only 3% of Europe’s building stock meets the top “A” level rating or equivalent, meaning that 97% of buildings have low energy performance [2] and, depending on the Member State, only 0.4–1.2% of the stock is renovated every year [3]. Moreover, Europeans are spending 90% of their time indoors, so their health is strongly depending on the indoor climate of buildings [1].
Poles live in houses that are inadequately insulated against heat loss. Heating systems are outdated and the most popular energy carrier is highly polluting coal, burned in old coal-fired boilers. It is estimated that over 70% of detached single-family buildings in Poland (3.6 million) have no, or insufficient, thermal insulation [4]. Only 1% of all buildings in Poland can be considered energy efficient, primarily those that have been constructed in the last few years [4,5]. Most of the buildings with no thermal insulation had been built before 1989 [6].
Data from the Central Statistical Office [7] shows that about 50% of Polish residential buildings have been insulated, but in the majority of cases to a sub-optimal standard. Given that the economic efficiency for improving the insulation of these partially insulated houses is not favorable, it can be concluded that the remaining 50% of residential buildings should be prioritized for renovation.
Acceleration of the cost-effective modernization of existing building can improve energy efficiency of Poland and the entire EU. It is simultaneously the easiest and fastest way of receiving energy savings. The main goal of this article is to present possible requirements for nearly zero-energy buildings (NZEB) renovation definition in heating dominated climate. Poland does not have such official definition. At the same time the government is planning to launch a large scale support programme called Clean Air (with budget 24 billion EUR) focusing only on renovation of single family houses. An objective of this programme is that 70% of those family houses are expected to be renovated. Unfortunately there are no clear requirements referring to the energy standards after modernization. The aim of this study is to propose a definition that could be used by the programme and, by doing so, improve the NZEB renovation.
1.1. General NZEB Definition for Buildings Undergoing Major Renovations
Legal requirements for renovated building are described in the amended Energy Performance of Buildings Directive (EPBD) [8] and the Energy Efficiency Directive (EED) [9]. According to the EPBD (Article 9), Member States should also create policies in order to support the renovation of buildings to Nearly Zero Energy Building (NZEB) levels. So far the NZEB requirements established by the European Commission only deal with new buildings to be constructed from 2021 onwards (and from 2019 for buildings owned and occupied by the public estate). For the purpose of the EPBD, the following definition of NZEB is used: “nearly zero-energy building’ means a building that has a very high energy performance. The nearly zero or very low amount of energy required should be covered to a very significant extent by energy from renewable sources, including energy from renewable sources produced on-site or nearby.” No obligatory requirements on this regard have been introduced for NZEB renovations. According to the EED [9], Article 4 Member States should establish long-term renovation strategies for mobilizing investment in the renovation of national building stocks. Article 5 of the EED sets a 3% annual renovation goal for buildings owned and occupied by central government. Additionally, the package “Clean Energy for All Europeans”, released by the European Commission in November 2016, identifies the important role building renovation as a way of meeting the "Energy Efficiency First" principle.
A major renovation is defined in the EPBD Directive [10] thus: ‘major renovation’ indicates the renovation of a building where:
- (a)
- the total cost of the renovation relating to the building envelope or the technical building systems is higher than 25% of the value of the building, excluding the value of the land upon which the building is situated; or
- (b)
- more than 25% of the surface of the building envelope undergoes renovation.
The EC recommendation 2016/1318 [11] states that the refurbishment under the NZEB requirements should come along with consequent energy performance requirements.
According to the COHERENO project statement [12] the general definition on NZEB renovation can have one or more of the following features:
- (a)
- The energy performance of the building after renovation fulfils the NZEB requirements for new buildings as they are defined at level of the EU MS and regions; and/or
- (b)
- The primary energy consumption of the building after renovation is reduced by 75% as comparing to the pre-renovation status; and/or
- (c)
- Potentially an additional primary energy minimum requirement of not more than 50–60 kWh/(m2 year) energy consumption [13] for heating/cooling, domestic hot water, ventilation energy consumption of auxiliary building’s systems; and
- (d)
- Potentially an additional minimum requirement for renewable energy share (proposed to be at least 50% of the remaining energy demand of the building as it is suggested in [14] taking into account the NZEB definition from EPBD; and
- (e)
- Potentially an additional minimum CO2 requirement of no more than 3 kg CO2/(m2 year) as it is suggested in [14] based on the needs to meet the long-term decarbonisation goals for residential and services sectors as resulted from the EU 2050 Roadmap for a low-carbon economy.
Country-specific definitions take advantage of one or more of the listed requirements, as discussed in the next section.
1.2. Country-Specific Definitions
Criteria for NZEB renovation of buildings have been identified in 11 countries and regions [15,16,17,18,19,20,21,22,23,24,25,26], but definitions have so far only been established in eight (Austria, Cyprus, France, the Czech Republic, Denmark, Latvia, Lithuania, Brussels Capital Region). Poland does not have an official definition of NZEB renovation. Of these, France, Austria, and Brussels Capital Region have established primary energy use requirements for renovation at a less strict level compared to new buildings. Ireland, Germany, and Slovenia foresee doing likewise, though the renovation definitions for these countries have still not been set. Lithuania and Denmark have identical NZEB definitions for new and existing buildings, as do Cyprus, Bulgaria, Italy, and Latvia, where the NZEB definition for new buildings is also used for deep renovations. Some more information on the NZEB renovation requirements for existing buildings is described in Table 1.
For example, NZEB renovation in the Brussels Capital Region is defined with identical parameters as for new buildings [27,28,29]. These parameters apply whenever the renovation improvements include at least 75% of the heat loss surface area and the building systems. In this case all parameters for new buildings are multiplied with a factor of 1.2, except for the summertime comfort requirement. The indicators include energy demand for heating, primary energy demand, risk of overheating, and air tightness. For renovated residential buildings the parameters are the following:
- energy need for heating QH ≤ 18 kWh/(m² year);
- primary energy demand QP ≤ 54 kWh/(m² year), for heating, domestic hot water (DHW) and auxiliary electricity;
- summertime comfort (overheating risk), excessive temperature frequency (>25 °C) ≤5%; and
- air tightness of the building envelope: n50 ≤ 0.72 h−1.
Slovenia’s definition of NZEB [27,28,29] renovation envisages a tightening of the minimum requirements regarding the maximum permitted heating, cooling, or air-conditioning needs, the preparation of DHW, lighting within the building, and the increase in the headline share of RES in total energy use for the operation of buildings. For renovated buildings the requirements are as follows:
- energy need for heating QH ≤ 25 kWh/(m² year), where the requirement for primary energy may be met only by means of a distinctly higher actual share of RES (an envisaged increase from 25 to 50%) in the overall final energy for the operation of the systems in the building;
- energy need for heating QH ≤ 15 kWh/(m² year), if the technical possibilities for the use of RES at the building’s location are insufficient;
- primary energy demand QP ≤ 95 kWh/(m² year)—single-family houses, the requirements apply to the total sum of energy for the heating, ventilation, DHW and cooling;
- primary energy demand QP ≤ 90 kWh/(m² year)—multi-family buildings; and
- primary energy demand QP ≤ 65 kWh/(m² year)—non-residential buildings.
According to Slovak [27,28,29] regulations deep renovation is renovation of a building at the ultra-low-energy performance level. A complex renovated building must meet the NZEB requirement (the same as for new buildings) if it is technically, functionally, and economically possible. The standard is defined with following parameters:
- energy need for heating QH ≤ 50 kWh/(m² year) depending on the building shape factor—single-family building QH ≤ 40.7 kWh/(m² year), multi-family buildings QH ≤ 25 kWh/(m² year), office buildings QH ≤ 26.8 kWh/(m² year); and
- primary energy demand—single-family building QP ≤ 54 kWh/(m² year), multi-family buildings QP ≤ 32 kWh/(m² year), office buildings QP ≤ 60 kWh/(m² year); the requirements apply to the total sum of energy for the heating, DHW, cooling, ventilation, and in-house lightning.
1.3. Potential Indicators of the NZEB Renovation Definition: Results of a Survey
In order to create the NZEB renovation definition, it is crucial to determine its potential indicators. A survey was carried out among 17 building energy efficiency experts during 2017 on potential approaches and indicators that could be used for the NZEB definition of existing single-family houses in Poland. This number of informants was deliberately limited as it was especially important to address the question with experts having not only theoretical, but also practical, knowledge on the issue. The results of the survey were the starting point for the definition of NZEB renovation for single family buildings.
Table 2 shows that 7 out of 13 indicators have scored 10 or more votes and are most relevant from the point of view of the definition. At the same time almost all indicators have received negative votes. In order to state which requirements are most important the number of “No” votes was subtracted for the “Yes” votes. The result (last Table 2 column) clearly shows that now only two indicators (bold + green) have scores higher than 10. The rest score below 8, down to –4. It shows that, in the opinion of the experts, only the index of energy needed for heating QH and energy efficiency of renovation improvement (i.e., the percentage reduction of the primary, non-renewable energy QP demand) are found to be highly important. What is interesting is the index of non-renewable, primary energy demand QP of the building after renovation is found to be less important, scoring 10 compared to 13 for energy needed for heating QH. This is probably because of the comparison of energy consumption before and after renovation seems to be a more reliable methodology than the use of only one value after modernization.
According to the findings of the survey, the definition of NZEB renovation should only include two indicators:
- The energy need for heating QH, expressed in kWh/(m² year); and
- The percentage of reduction of primary non-renewable energy demand QP, (including heating, ventilation, domestic hot water (DHW), and auxiliary systems for the case of residential buildings), determined in relation to the energy demand of building before renovation. According to the EC recommendation 2016/1318 [11] QP should also include energy used for cooling and lightning although this was deliberately excluded in the study. Most of the existing SFH do not use cooling and lighting as it is calculated in non-residential buildings.
These two indicators would make the definition very flexible (reduction of QP can be achieved in many ways, e.g., use of renewable energy sources (RES), increase of systems energy efficiency, reduction of energy need for heating or DHW) but, at the same time, very demanding. The energy need for heating (QH) depends on, among other things, the thermal transmittance of the building elements, the thermal bridges, the air tightness, and the type of ventilation system. A low value of the energy need can be achieved in different ways depending on the building’s condition. For example, in case it is not possible to insulate the ground floor, other elements of the building’s envelope, e.g., external walls, roof, windows, or doors, can have a better thermal resistance. In addition, ventilation with heat recovery can be applied in order to reduce the ventilation heat loss and as a result QH. The energy need for heating (QH) as an indicator gives flexibility and provides the opportunity to choose the best renovation measures for the particular building.
The indicator referring to the reduction of primary non-renewable energy demand (QP) includes aspects like efficiencies of the heating and hot water system, energy source type and use of renewable energy sources (RES). Depending on the building’s conditions, different solutions can be chosen. Additional use of the first indicator—the energy need for heating (QH)—prevents the situation in which only RES (with low primary energy factor (PEF)) will be implemented in order to decrease the primary, non-renewable energy demand. In Poland, the value of PEF (only non-renewable part) for biomass is 0.2 and for coal 1.1, so a change from coal to biomass will reduce the primary, non-renewable energy demand by about 82%, whereas the energy demand for heating can stay at the same level. For comparison, the value of PEF (total renewable + non-renewable part) for biomass in other EU countries [30] is: AT: 1.08, ES: 1.25, and IT, RO, FR, DE, and FI: 1.50. Additionally, the use of primary energy (total renewable + non-renewable) mitigates against the situation in which only RES are applied in order to reduce the QP. The total PEF for other energy carriers are as follows [31,32,33]:
- Electricity: AT: 1.91, ES: 1.89, IT: 2.18, RO: 2.53, FR: 2.72, DE: 2.45, and FI: 2.69;
- Gas: AT: 1.13, ES, IT, RO, FR, DE, and FI: 1.0;
- District heating: AT: 1.0, ES, IT, RO, FR, DE: 1.20, and FI: 0.7; and
- Heating oil: IT: 1.0, CH: 1.15, and AT: 1.12.
2. Calculation Methodology
The process of determining requirements for the NZEB renovation definition was divided into two stages:
- calculation of the cost optimum U-values for renovated elements of the building envelope; and
- finding the cost optimal renovation variant of building models.
The first stage was defining the insulation requirements for renovated elements by different energy prices. Based on them it was possible to determine two main renovation variants W1 and W2 used in second stage. In order to calculate energy demand for heating it was necessary to define the variants of ventilation system modernization. Last element of the study consisted in determining the reduction of non-renewable primary energy demand. At this stage modernization of heating and DHW was included as well as the use of RES. Based on data analysis the definition of cost-optimum and NZEB renovation was possible. The calculations were made for different energy prices, in three weather conditions and two building models.
2.1. Stage I—Cost-Optimal U-Values for Renovated Elements of the Building Envelope
The aim of the calculation was to determine the cost-optimal heat transfer coefficients for the elements of the building’s fabric (external walls, roofs, floors, windows, etc.) for single-family houses to be renovated. The results depend on the type of building element (external wall, roof, etc.), its initial U-value and the cost of energy. As an optimizing criterion, the minimal cumulative cost (investment + energy losses cost) was used, calculated over a 30-year period. The calculations were based on the methodology framework established by the Commission with the Delegated Act No. 244/2012 [34,35]. The study by Fokaides and Papadopoulos [36] also shows a literature review of applied methodologies of the optimal insulation thickness calculation for the various building elements and in different climatic conditions. The cumulative cost for the purpose of the study was calculated on basis of the following formula:
where:
- kRd,j—unit cumulative cost for the renovation variant j, EUR/m2;
- kM,j—renovation cost of the external building element for variant j, EUR/m2;
- kE,j—annual cost of energy losses transferred through 1 m2 of the element for variant j in the base year (depends on the thermal insulation of the external element, climate conditions and the cost of heat), EUR; and
- Rdi(i)—the discount factor for the year i, depending on the rate of inflation, the increase in the prices of energy and the discount rate.
The cost optimal U-value of the renovated building element is the one for which the cumulative cost reaches the minimum value. The unit renovation cost of external building elements for different insulation thickness and techniques was calculated on the basis of the following formula:
where:
- Pv—tax on goods and services (8%), EUR/m2;
- Rj—labour cost depending on building element type, insulation technique and thickness, EUR/m2; and
- Mj—the cost of direct and auxiliary materials along with purchase costs (5.9%), EUR/m2.
The renovation cost was higher than the cost of new construction because it includes additional works like strengthening external walls or removal of old windows. The maximum analysed insulation thickness or minimum U-value was limited to the standard market available one. For example, in the case of ETICS (External Thermal Insulation Composite System) systems for external wall insulation it was 30 cm.
The annual energy cost was calculated with the simplified method derived from the Polish energy audit regulation [37] with use of the following equation:
where:
- Uj—heat transfer coefficient for the variant j, W/m2 K;
- Sd—heating degree days (HDD), Kd; and
- E—energy cost, EUR/GJ.
The numbers of HDD for the main Polish cities is presented in Table 3. These values vary from 3488 (Opole) to 4117 (Olsztyn) [38] and are typical for a heating dominated climate. For comparison, the number of HDD in the European cities ranges from 500 [Kd] (Limassol, Cyprus) to 7000 (Kd) (Tromsø, Norway) according to Eurostat [39]. Table 3 shows that the highest density of Polish cities falls at the value of around 3700 HDD. This value was used as a basis for further analysis.
Another aspect, key because of the significant influence on the annual cost of energy losses through the building element, affecting strongly the results of the optimization was the type of energy carrier used for heating of the building. The price of 1 GJ of energy was significantly diversified and depending on the energy carrier type. Table 4 shows current energy prices in Poland for chosen energy carriers, ignoring the efficiency of the heat source.
The difference between the prices was very high, for example energy from fire wood is seven times cheaper than from electricity. In reality, direct electrical energy is very seldom used for heating purposes. That is why the further analysis was carried out for the following energy prices: 4.7, 7.1, 9.5, 11.9, 14.3 EUR per 1 GJ in the case of optimization of heat transfer coefficients. They do not correspond to specified energy carriers and differ by a fixed value 2.4 EUR per GJ. Such solution was chosen to make the study more useful. In many cases in Poland people use different energy source combinations at once, e.g., coal + fire wood, gas + coal, gas + fire wood. In such cases the price of energy can be different from the one given in the Table 4. Additionally, the renovation process can also include changes depending on the heat source, e.g., from coal to gas with different energy prices. Due to the fact that people in Poland very often use two or more energy carriers and prefer to buy cheap, low-quality coal. As a result, the low energy price not always means biomass. Because the aim of this paper is to propose a general NZEB renovation definition, fixed energy prices were chosen and not the energy carriers. For the second stage of optimization (cost-optimal renovation standard) only three prices 4.7, 9.5, and 14.3 EUR per 1 GJ were used. The lowest energy price does not represent biomass. In many cases people in Poland buy cheap, low-quality coal, or even burn garbage. As a result the price of energy can be very low and emission of pollutants very high. In order to show how used energy prices correlate with certain new energy sources additional Table 5 was prepared.
The discount factor was calculated with the use of the following equation:
where:
- Rd(i) — sum of discount factors for the year i,
- d—discount rate;
- s—annual inflation rate;
- e—energy price increase rate over the inflation rate in the analysed period; and
- n—number of years (lifetime of 30 years is considered).
2.2. Stage II—Cost-Optimal Renovation Variant of the Single-Family Houses
In the second part of the analysis the cost optimal scenario for renovation of two reference buildings was determined. As an optimizing criterion, the minimum cumulative cost (1) was used, calculated for the 30-year period, covering renovation cost and discounted exploitation cost. The calculation was based on the aforementioned methodology framework established by the Commission [34,35] and the literature review: the study [47] shows in a clear way how to define construction variants, [48] steps involved in the cost-optimal methodology, [49,50] calculations made for single-family house, [51] experiences from NZEB renovation variants analysis in the neighbouring country and [52] application of RES in the renovation process.
The two basic scenarios of renovation were defined based on the heat transfer coefficient of the building elements calculated in stage I. Additionally, renovation of ventilation (two options), central heating and DHW system was included. Use of RES was limited to DHW. For each scenario the energy need for heating and ventilation was calculated on the basis of the methodology given in ISO 13790 standard [53]. The energy efficiency of building systems was evaluated by the simplified calculation methods derived from the Polish regulation [54] and several European reference standards: EN 15243 [55], EN 15316 [56], and EN 15316–3-1:2005 [57]. The primary non-renewable energy demand for heating, ventilation, DHW and auxiliary systems was calculated following the Polish regulations [54]. The following PEF (only non-renewable part) values were used: heating and DHW energy: 1.1, electrical energy: 3.0, and solar energy: 0.0.
The renovation cost for a given scenario was determined according to a simplified method of the investment cost calculation. For each building element (e.g., external wall) the unit renovation cost (from stage I) was multiplied by the element area. The 8% tax on goods and services was included for two base scenarios.
The cost of the annual exploitation is a sum of final energy cost used for heating and ventilation, DHW, by auxiliary equipment operation and energy prices. The energy demand for heating and ventilation was calculated for three locations in Poland—Warsaw (medium climate), Szczecin (the warmest climate), and Suwałki (the coldest climate). The same discount rate, energy price increase rate, and inflation level were used as in stage I.
3. Building Models
Two reference building models were used to determine the requirements for renovation to the NZEB definition (Figure 1):
- a one-storey building with an attic (numerical model only); and
- a typical two-storey building with a flat roof (numerical model based on a real existing building).
These two buildings represent very well the most typical single-family houses in Poland. The first one is a small house with a non-usable or usable attic, build before the 1970s. They were built mostly in the countryside or small cities. The second is a two-storey single-family house with a flat roof and unheated basement, so-called “cube”, build before the 1988. A report drawn up by the Central Statistical Office [7] shows the age structure of building stock in Poland (Table 6). Buildings built between 1945 and 1988 account for 52% of the total. The vast majority of single-family houses (from this period) have a very high level of demand for final energy and, thus, are key targets for renovation.
According to a The Buildings Performance Institute Europe (BPIE) report [59], in most of the cases modernization of residential buildings implies only a change of heat source or modernization of the heating system (84% of cases). Such solutions result in only a low reduction of the final energy demand—around 10%—and it is usually a result of essential replacement of an outdated heat source. Complex renovation, with final energy reduction of about 35%, refers only to 7% of cases. Renovations to NZEB levels is limited, achieving 0.5–1.0% of all renovations by 2020. The share of deep renovation will be higher and make up to 10% of total. At the same time about 35% of owners in Poland want to renovate their hoses and about 30% does not see such need [60]. The launching of the Clean Air programme along with the use of ambitious requirements could increase the share of NZEB renovations.
3.1. The Two-Storey Building with a Flat Roof
This single-family building was constructed in 1980 in Warsaw. It is characterized by construction and material solutions typical for houses constructed before the 1990s. The building has two above-ground storeys and one unheated, underground storey, half-buried in the ground. The house has traditional, brick construction. Masonry cavity walls have no insulation, only an air gap. Intermediate floors and the flat roof have reinforced concrete ribbed construction. Table 7 shows the basic geometric data of the building.
Table 8 shows the thermal parameters of the building envelope. The flat roof was insulated with 19 cm of granulated blast furnace slag and the floor above the unheated basement with 3 cm hardboard. As a result the U-values are quite high.
3.2. The One-Storey Building with an Attic
It is a one-storey building with usable, heated attic, without basement. The building was designed on a rectangular plan with sides of 12 m and 7 m. The heated area is 131.9 m2. The house has traditional brick construction. Masonry walls were constructed from slag concrete blocks. A gable roof with wooden structure covers the heated attic. The building has a suspended floor. Table 9 shows the basic geometric data of the building.
Table 10 shows the thermal parameters of buildings envelope that were renovated.
It was assumed that both buildings have natural ventilation and a heating system, as well as a hot water system, which have not been modernized.
4. Cost-Optimal Heat Transfer Coefficients of Renovated Building Envelope
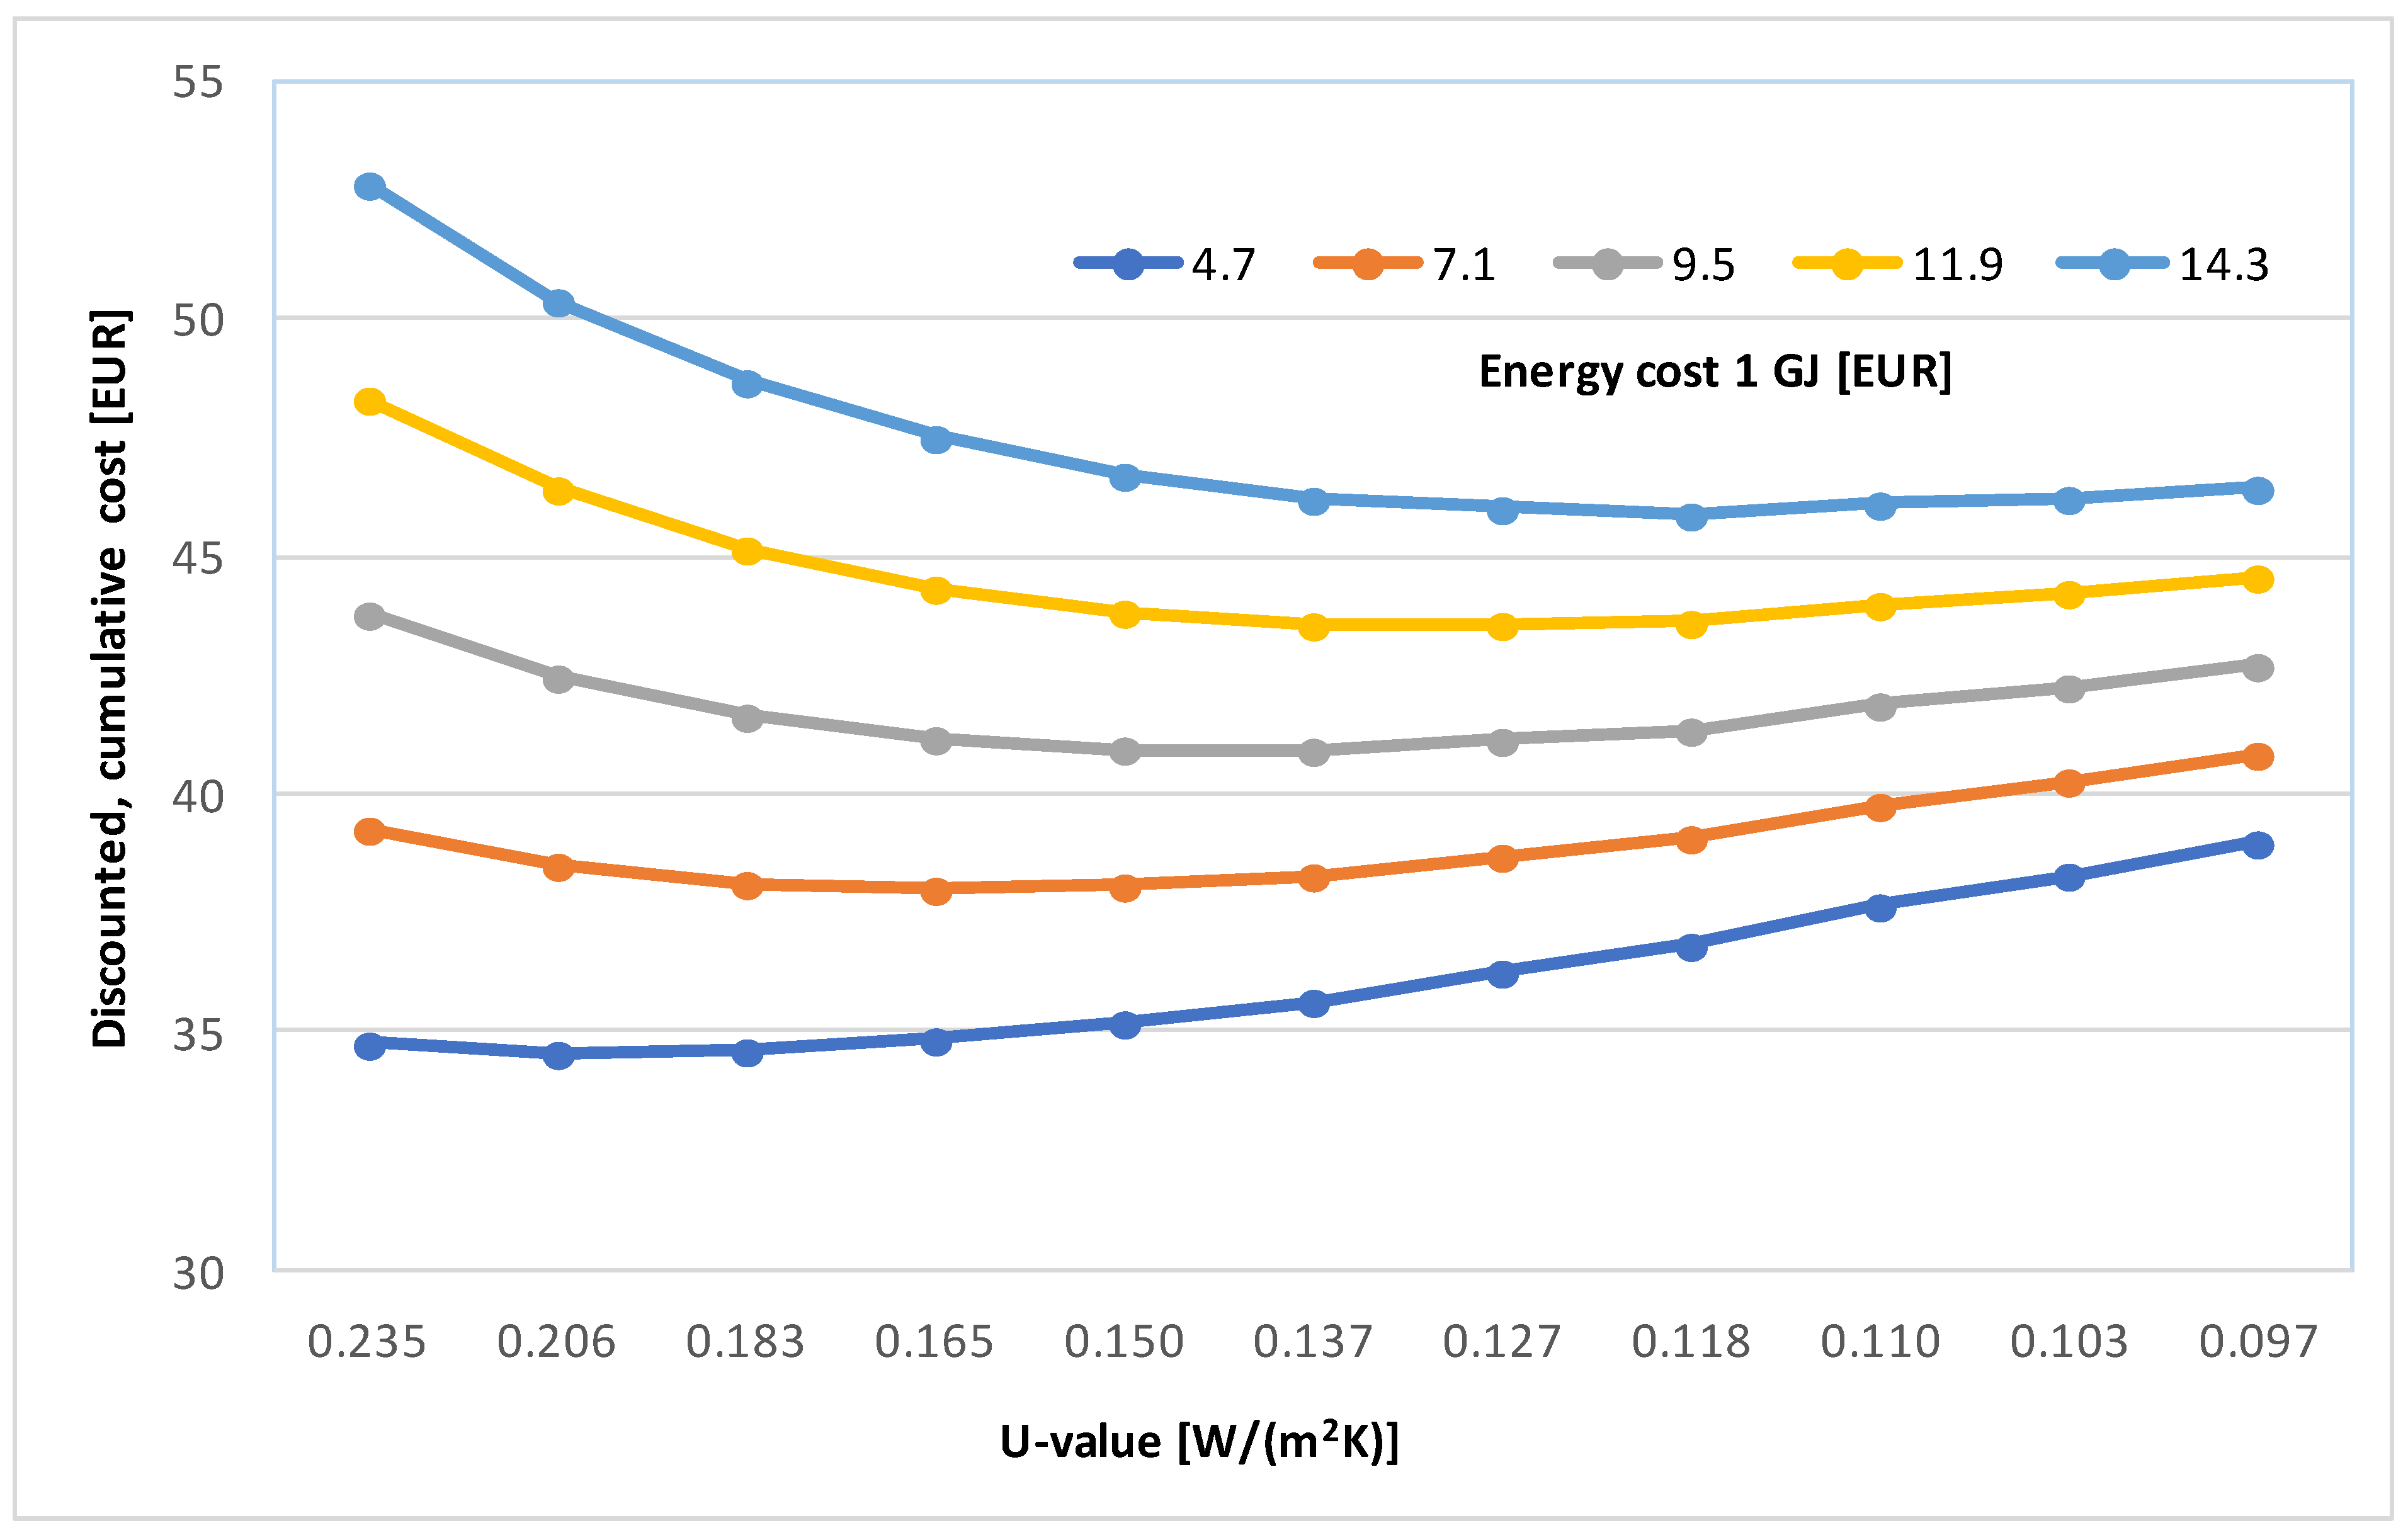
Table 11 shows the calculation results of the discounted cumulative cost for different variants of external wall renovation. The U-value of un-insulated walls was 0.82 W/(m2 K) for the two-storey building with a flat roof. Depending on the heating energy cost per 1 GJ the cost-optimum U-value (the renovation variant characterised with lowest discounted, cumulative cost), is from 0.20–0.12 W/(m2 K) (Table 11, highlighted), depending on the heating energy cost in EUR/GJ: 4.8, 7.1, 9.5, 11.9, and 14.3. In the case of the lowest energy price the cumulative cost is the lowest for the existing uninsulated wall. This means that renovation is not economically viable in this case. In other terms, there is no economic motivation to renovate a house in the case of having a cheap energy carrier.
Figure 2 shows the change of discounted cumulative cost depending on the energy cost and U-values for a renovated external wall. The cost optimum U-value is characterized with the lowest discounted, cumulative cost. Increasing trends at the ends of the chart show that either renovation cost or energy loss cost is starting to dominate in the cumulative cost. The results confirm that the cost optimum U-value depends strongly on the energy cost. In the case of cheap energy carriers, like fire wood or low quality coal, wall renovation is not cost-effective. The situation will change with the change of energy price or carrier, resulting from heat source replacement. For example cost of energy from wooden pellets is twice as high as that from fire wood.
The cost-optimal U-value for the all renovated building elements is shown in Table 12. It shows the results of calculation made for other elements of the two building models. For each building element the thickness of the additional insulation d and the cost of renovation are given. The optimal thermal transmittance strongly depends on the energy price. The Table 12 shows the values for the lowest and the highest energy price per GJ. The minimum and maximum U-values were used for defining the renovation variants used in the second stage of the analysis:
- First variant (W1)—the building envelope was renovated according to the cost-optimum thermal transmittance specified for energy price of 4.7 EUR per GJ; and
- Second variant (W2)—the building envelope was renovated according to the cost-optimum thermal transmittance specified for energy price of 14.3 EUR per GJ.
The energy price has a strong influence on the cost-optimal U-values of renovated elements. Change of heat source during the renovation process along with an increase of energy prices can promote more ambitious solutions.
In addition sensitivity analysis was performed for two different discount rates. The changes in the results by the modified discount rate of 3% were shown in Table 13. The discount factor changed from ΣRd(i) = 25.26 (discount rate: 4.0%) to ΣRd(i) = 29.20 (discount rate: 3.0%). The changes in the results by the modified discount rate of 8% were shown in Table 14. The discount factor changed from ΣRd(i) = 25.26 (discount rate: 4.0%) to ΣRd(i) = 15.31 (discount rate: 8.0%). The energy price increase: 1.6%, and the year-on-year inflation: 1.8% were the same for both cases.
The change of the discount rate has a visible influence on the calculation results. Increase of the discount rate causes the increase of cost-optimal U-vales. It happens because future energy savings are more discounted. With a decrease of the discount rate the situation is opposite. Based on the literature review [36,45,46] and historical data from the Polish Office of Competition and Consumer Protection further analysis was performed for the discount rate equal to 4%.
5. Cost-Optimal Building Renovation Variant
On the basis of defining cost-optimum U-values of building elements and solutions referring to the upgrading of the ventilation system and the use of RES, different renovation variants were identified. All of them include upgrading of the existing heating and domestic hot water system with replacement of heating source. The symbols used to differentiate the variants are explained below:
- W0: baseline variant, existing model buildings and systems before renovation;
- W1: variant I of building envelope renovation; energy price 4.7 EUR per 1 GJ;
- W2: variant II of building envelope renovation; energy price 14.3 EUR per 1 GJ;
- G: natural ventilation, improved base case but with no reduction of the energy loss through ventilation;
- H: hybrid ventilation, it was assumed that the energy loss through ventilation will be reduced by 20%;
- R: mechanical ventilation with heat recovery, efficiency of heat recovery: 90%; and
- S: solar system used for DHW heating, assumed coverage between 50–60% of DHW energy demand.
The precise description of improvements and solutions in baseline variant can be found in Table 15. The renovation cost, energy efficiency and auxiliary electrical energy consumption was calculated for each system. The costs of renovation were defined on basis of offers from companies and fixed max prices from existing renovation programmes, e.g., Jawor in Małopolska region. Since both models have similar heated area the absolute vales were given and used each case.
Each of the building models has been subjected to 12 renovation variants differing in the degree of insulation of the external elements, modernization of the ventilation system and the use of RES. Total renovation costs were presented in Table 16. The cheapest renovation variant is W1/G and the most expensive W2/R/S. The renovation cost of the one-storey building with an attic is slightly higher because the insulation of the suspended floor and pitched roof is more expensive.
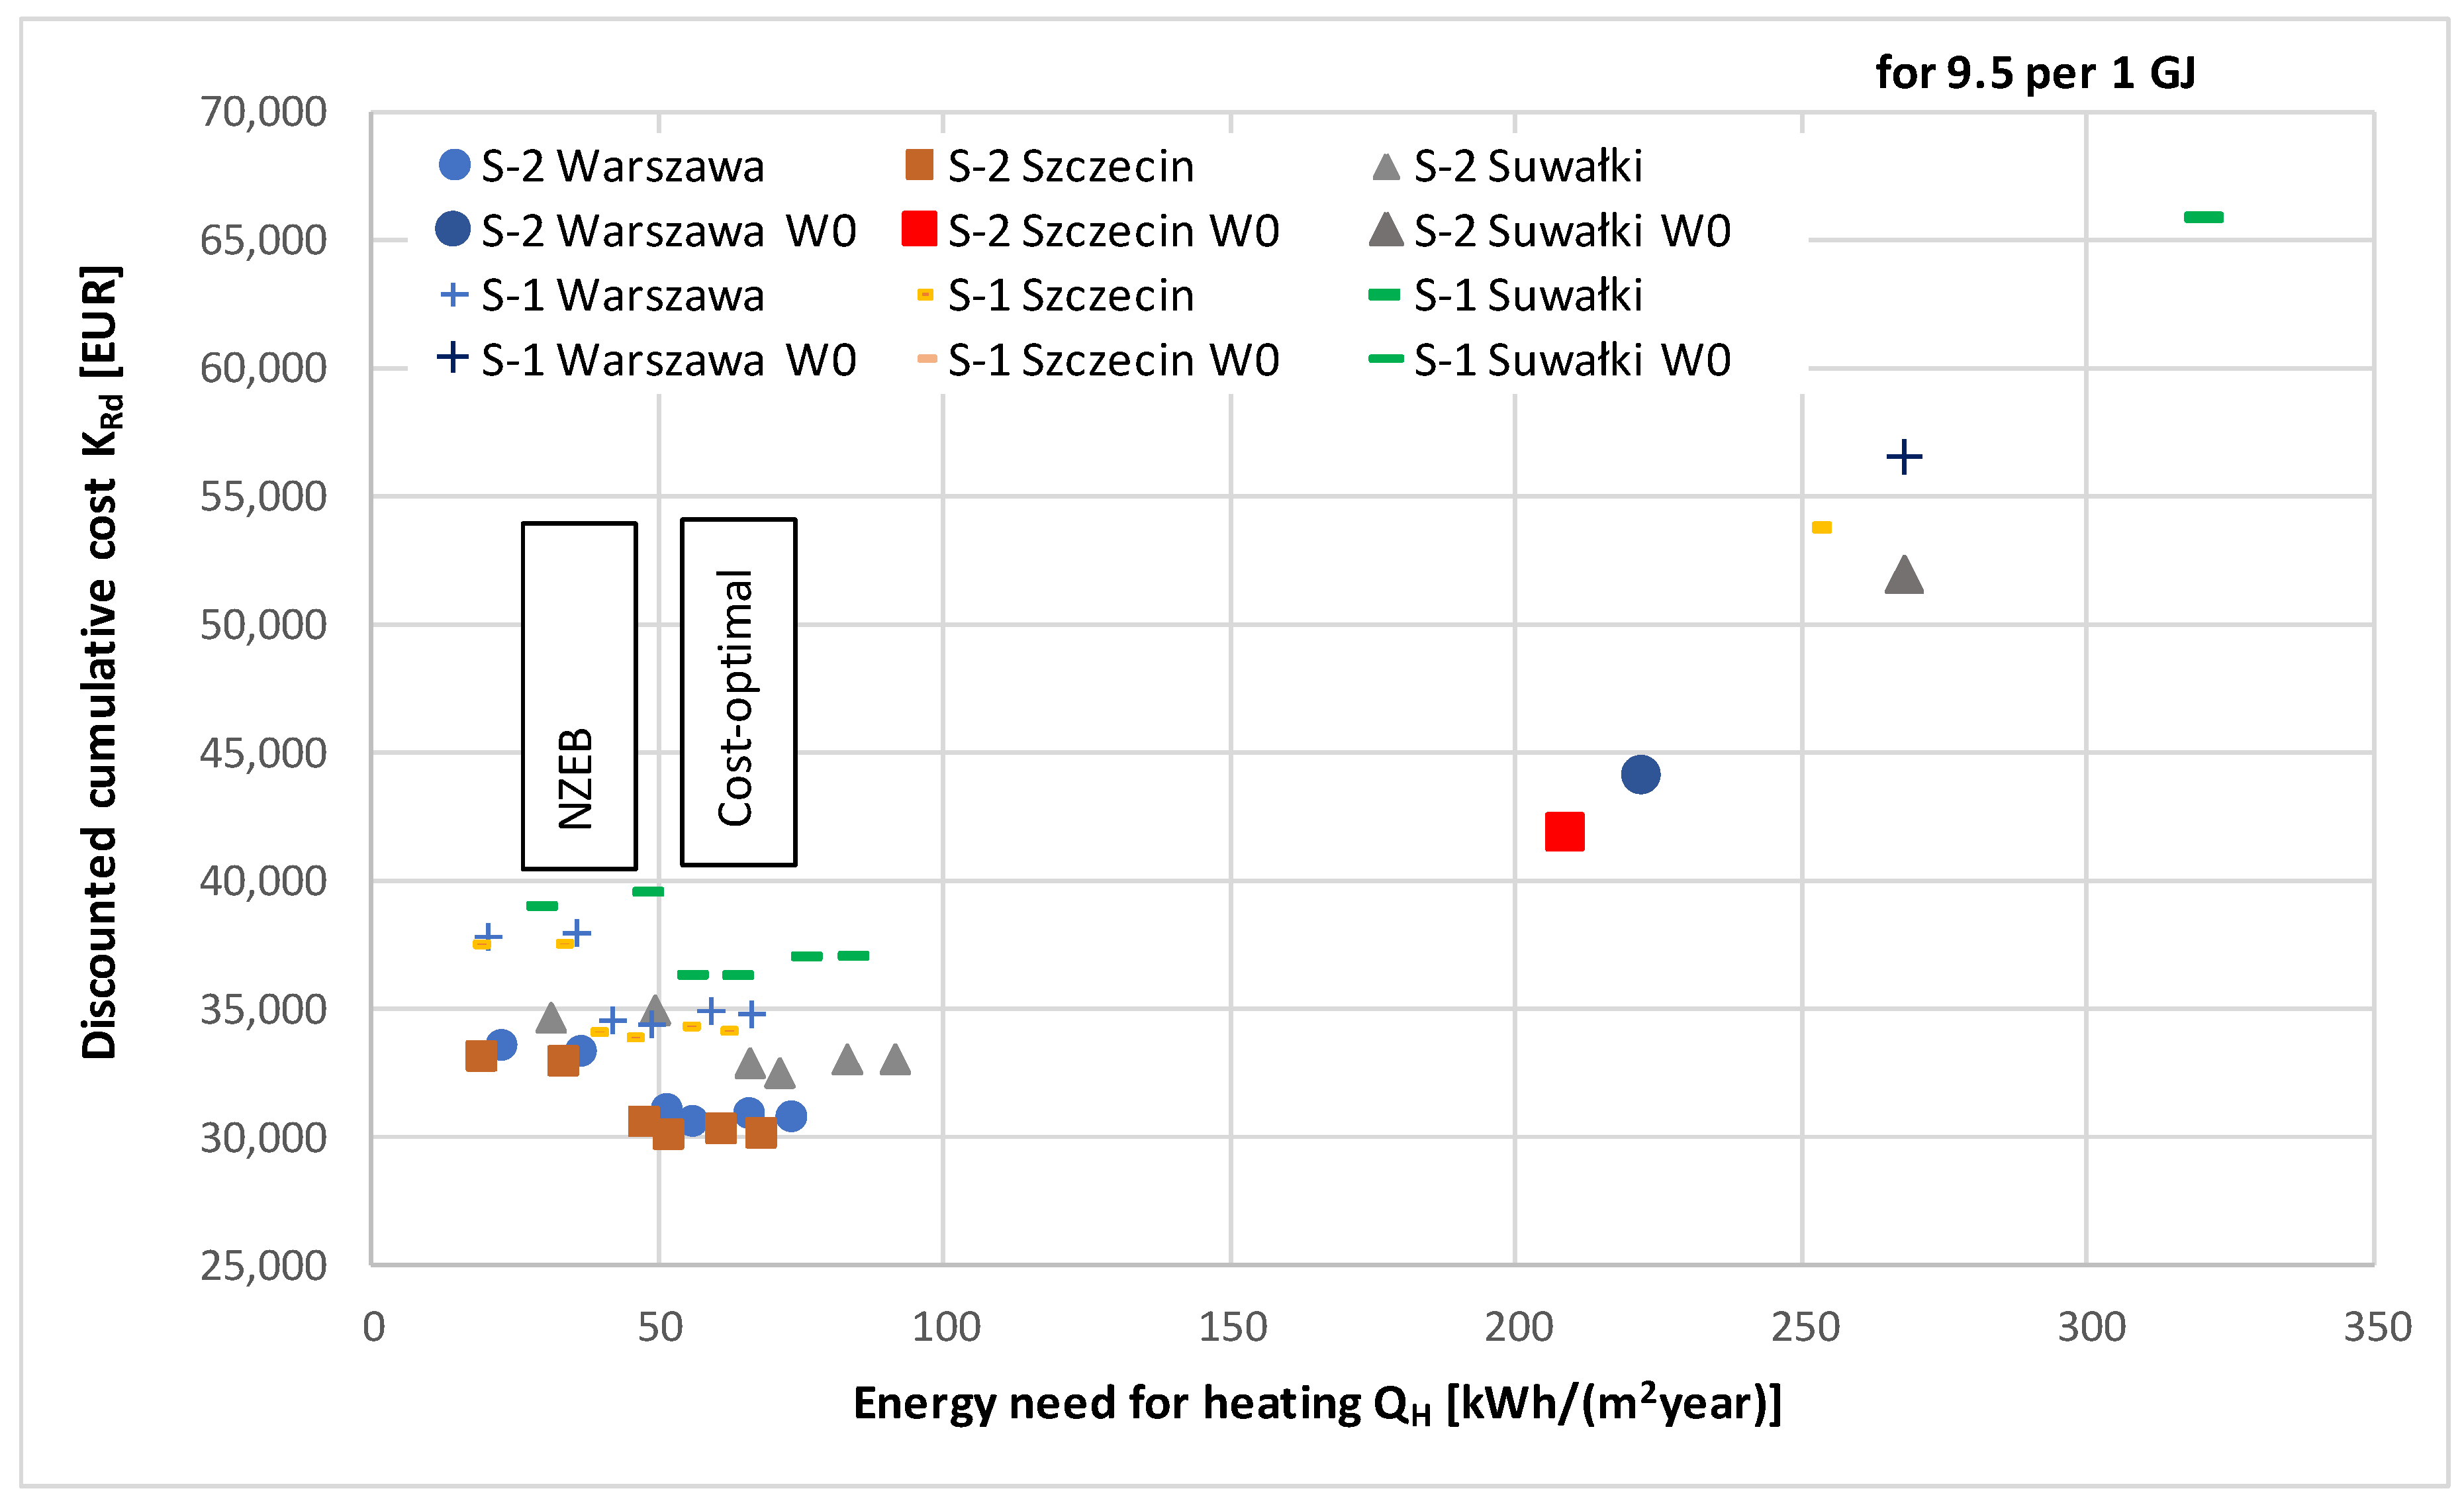
The discounted cumulative cost for each renovation variant of the two building models was calculated as a sum of renovation cost and discounted exploitation cost. The calculations were performed for three locations in Warsaw, Poland (medium climate), Szczecin (the warmest climate), and Suwałki (the coldest climate), and three energy prices of 4.7, 9.5, and 14.3 EUR per 1 GJ. Such an approach allowed taking into consideration different weather and financial conditions. The results for the middle energy price of 9.5 EUR/GJ are presented in Figure 3.
The value of the discounted cumulative cost shown in Figure 3 depends strongly on the energy efficiency of the houses, their location, and type. All renovation variants have lower costs than the base cases, which confirms that renovation is cost-efficient for a given energy price. The influence of location and building type is clearly visible. The one-storey building with an attic has higher cost than the two-storey building with a flat roof, despite a lower heated area. Higher shape factor and lower U-values increase the energy need for heating. The discounted cumulative cost for the same building type located in Suwałki is around 17% higher than in Szczecin. For renovated houses it is only 6%. The variants with the lowest cost have energy need for heating between 45–70 kWh/m2 year. The base case model needed between 208–320 kWh/m2 year of energy.
The cost-optimal variants (with the lowest discounted cumulative cost) of renovation of the two model buildings are presented in Table 17. The choice of variant depends to a decisive extent on two factors: the price of energy per 1 GJ and the building’s location (climate).
The calculations have shown that:
- For both building types at a low energy cost of EUR 4.7 per GJ, the renovation variant W1/G was optimal. It is a variant including improved natural ventilation and the following heat transfer coefficients (U) of external buildings elements: external walls: 0.19–0.21 W/m2 K, suspended floor: 0.24 W/m2 K, flat roof: 0.22 W/m2 K, pitched roof: 0.18 W/m2 K, floor above unheated basement: 0.25 W/m2 K, windows: 0.9 W/m2 K, and external doors: 1.3 W/m2 K;
- At the energy cost of EUR 9.5 per GJ, the renovation variant W2/G was optimal for both building types. In this case the variant involves improved natural ventilation and the following heat transfer coefficients (U) of external buildings elements: external walls: 0.12 W/m2 K, suspended on the ground: 0.14 W/m2 K, flat roof: 0.12 W/m2 K, pitched roof: 0.10 W/m2 K, floor above unheated basement: 0.19 W/m2 K, windows: 0.9 W/m2 K, and external doors: 0.9 W/m2 K; and
- In the case of EUR 14.3 per GJ for both building types the optimal variant is W2/S. which takes into account solar collector installations supporting the preparation of domestic hot water. Some differences can be seen in regard to ventilation. In the case of the two-storey building with flat roof, mechanical ventilation with heat recovery is cost-effective in Suwałki (the coldest location) whereas, for the second building, the use of hybrid ventilation is optimum for all locations.
Table 18 shows the energy need for heating (QH) (including heating and ventilation) for the cost-optimum variants of renovation of two model buildings, respectively. It can be seen that the energy need ranges from 30.9 to 91.1 kWh/m2 year correspond to the optimal variants. The high range of values is a result differences in climate (different locations) energy prices and building types. Average energy need at a low energy cost (EUR 4.7 per GJ) is around 62% higher than for high energy cost (EUR 14.3 per GJ). The difference caused by the climate (between Suwałki and Szczecin) is only 16%. The average energy need for heating for all renovation variants is 58 kWh/m2 year.
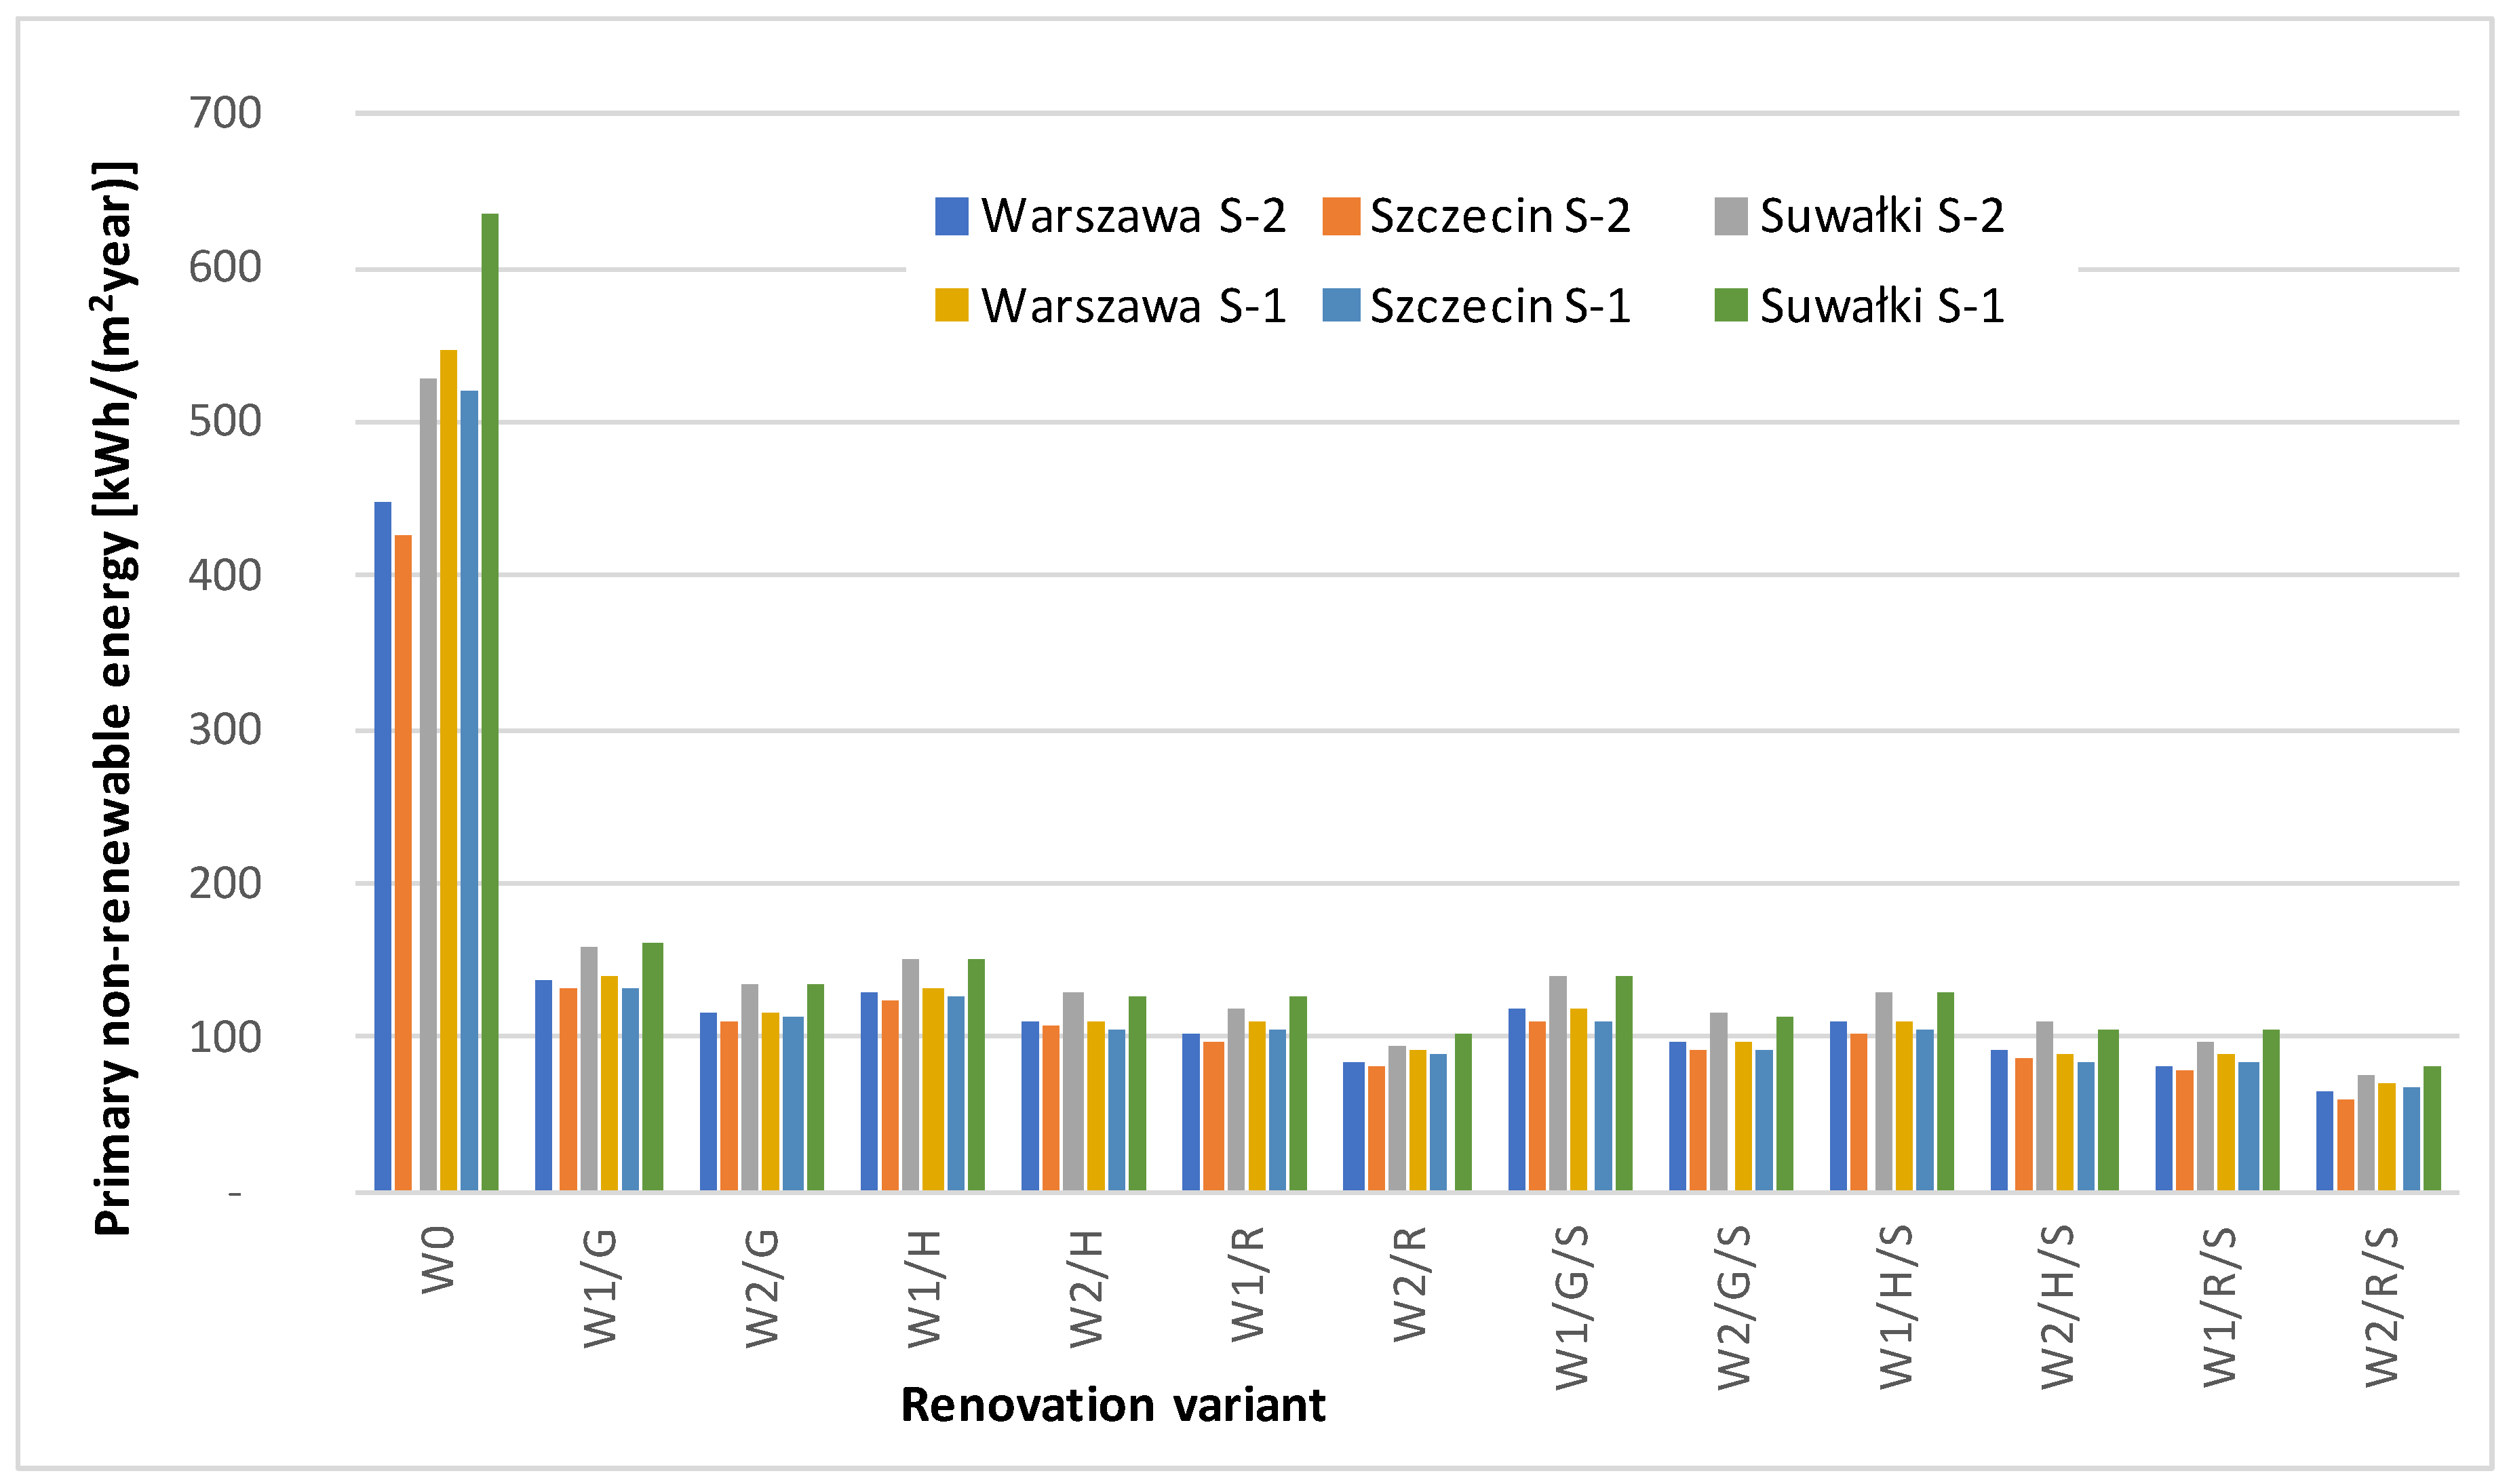
Based on the energy need for heating, the primary non-renewable energy demand was calculated for the models. At this point renovation of heating and DHW system, auxiliary equipment was included, as well as the use of solar collectors for DHW. The obtained reduction of the primary non-renewable energy demand for heating, ventilation, hot water production, and the work of auxiliary equipment (this includes energy for fans, pumps, electronics, etc.) is shown in Figure 4. In all the variants the demand is reduced significantly. Before renovation buildings have needed from 425 to 636 kWh/m2 year of primary, non-renewable energy. After renovation it was from 66 to 160 kWh/m2 year, depending on the variant. Such a high reduction was possible thanks to wide range of improvements, including not only the building envelope, but also the systems. The primary energy demand was, in most cases, higher than requirements for new NZEB single-family house (≤70 kWh/m2 year) [61].
The percentage of reduction of primary non-renewable energy demand was determined in relation to the energy demand of the buildings before renovation only for the cost-optimum renovation variants (Table 19). It ranges from 69% to 86%. The higher reduction in primary non-renewable energy can be achieved by using RES and a better insulated building envelope. Both improvements are used in the case of high energy price. The location does not have a significant effect in this case. The PEF for the main energy carrier was 1.1 before and after renovation.
6. Results and Discussion
The calculations were conducted for two single-family house types, three climate zones, three energy prices, and 13 variants including the base case. It allowed obtaining a large number of results (234 cases), which were thoroughly analysed. The aim was to define the NZEB renovation definition for single-family houses in the heating-dominated climate of Poland. The first stage of the process was determining the difference between cost-optimal and NZEB requirements. The regulations or literature does not define it precisely:
- According to the EU Regulation [34,35] “In cases where the outcome of the cost-optimal calculations gives the same global costs for different levels of energy performance, Member States are encouraged to use the requirements resulting in lower use of primary energy as the basis for comparison with the existing minimum energy performance requirements” (Annex I, Cap. 6-2). The NZEB level should be higher or equal to the cost-optimal.
- According to [30] the NZEB target was obtained incrementing by 10 kWh/m2/year the minimum primary energy achieved by the best building variant (from the energy point of view).
- Ferrara et al. [49] show how to find the cost-optimal level for the French single-family building typology. According to the conclusions finding the cost-optimal building configuration is more important from regulatory perspective than NZEB definition.
- The cost-optimal is focused on costs while the NZEB prioritizes the energy performance and the use of renewable energy harvested on site [63].
- A significant part of NZEB solutions, for every building and every climate zones, are within the range of 0 to 15 kWh/(m² year) [50].
Based on the above literature review, a decision was made to define two types of requirements: cost-optimal and NZEB. Additionally the proposed definition included not primary energy demand but energy need for heating and percentage reduction of non-renewable primary energy in regard to base variant. Only the second parameter includes the RES.
Since a large range of values, especially in regard to energy need for heating, was obtained, price analysis of charts for different energy prices was performed. The cost-optimal level was identified as the minimum energy need level with a lowest cumulative cost for a given energy price. For all three prices it was around 60 kWh/(m² year). The corresponding percentage reduction of non-renewable primary energy was 75%.
Based on this the proposed requirements for cost optimal renovation of single-family residential buildings are as follows:
- The energy need for heating QH ≤ 60 kWh/(m² year); and
- The percentage of reduction of the non-renewable, primary energy QP demand (including in case of residential buildings heating, ventilation, DHW and auxiliary systems) ≥75%.
The NZEB level was obtained as the minimum energy need achieved by the second best (from the energy perspective) building renovation variant. For all the prices, climates, and building models it was around 40 kWh/(m² year). The corresponding percentage reduction of non-renewable primary energy was 80%. Based on this the requirements for NZEB renovation of single-family residential buildings are as follows:
- The energy need for heating QH ≤ 40 kWh/(m² year); and
- The percentage of reduction of the non-renewable, primary energy QP demand (including in case of residential buildings heating, ventilation, DHW and auxiliary systems) ≥80%.
The calculations show that reaching of NZEB level is not possible without the use of RES and a ventilation system with heat recovery.
7. Conclusions
The calculations enabled the identification of a definition of cost-optimal and NZEB renovation in a heating-dominated climate of Poland. The propositions refer well to the one of general definition on NZEB renovation characteristics [12]: “The primary energy consumption of the building after renovation is reduced by 75% as comparing to the pre-renovation status”. The defined requirement for energy need for heating for NZEB renovation is the same as unofficial indicator for low-energy residential buildings in Poland (QH ≤ 40 kWh/(m² year) [64]. However, many NZEB renovation definitions are much more ambitious than proposed in the study:
- QH ≤ 18 kWh/(m² year): Belgium (Brussels); and
- QH ≤ 15 kWh/(m² year): Slovenia.
The open question is if such ambitious standards can be widely used in reality and how they correspond to real cases. Examples from Poland show that it is possible to reach a level of energy demand for heating of 24.5 kWh/(m² year) [65] or reduce the final energy demand by 90% [66]. Although the reduction in energy demand was very significant, unfortunately it does not translate into a very good economic result in terms of investment. The cost was much higher than in the study. From this perspective the use of lower requirements seems to be reasonable.
The calculation shows that the index of primary, non-renewable energy QP demand for cost-optimal renovation variants was higher than required for a new NZEB single-family house in Poland. Such results confirm that the requirements used for existing buildings should be different from those for new ones. Reaching NZEB standards in case of existing buildings can be technically complicated (implementation of mechanical ventilation with heat recovery) and also very expensive.
Final results show that cost-optimal level depends strongly from the energy price. In a case of very cheap fuel renovation can be economically ineffective. People in Poland use very often two or more energy carriers and buy cheap, low quality coal. There are also some examples of garbage burning. From this perspective it is very important to introduce regulations that will forbid the use of cheap, low-quality fuel. A higher cost of energy sources stimulates the renovation process.
In contrast to definitions using only maximum level primary energy demand, two indicators were proposed in the study: heating energy demand and percentage of reduction of the primary, non-renewable energy. Such a solution is appropriate for existing buildings because it prevents the situation in which only RES (with low PEF) will be implemented in order to reduce the primary, non-renewable energy demand. Additionally, according to BPIE [67] the use of PEFs to calculate the energy performance of a building is often incorrect or leads to perverse effects. For example, dual fuel boilers, burning both biomass and coal, are very common in some Member States, e.g., Poland. According to their energy characteristics, these buildings claim to use biomass but, in reality, they are burning a high proportion of coal, resulting in a real energy consumption (and CO2 emissions) significantly greater than the calculated consumption. Expected energy saving targets are, therefore, only met on paper, not in reality. BPIE [67] proposes an alternative way of determining and setting requirements for the building energy performance: using the calculated delivered energy as one of the main building performance indicators rather than primary energy. Primary energy alone does not provide useful information about the energy efficiency of buildings, but is more a political indicator. It depends on the generation mix and efficiency of the system rather than the actual performance of the building. Using delivered energy can make the calculation independent from the PEF. Another solution proposed in the paper is using heating energy demand and the percentage of reduction of the primary, non-renewable energy in order to better show the effects of renovation.
The preformed analysis did not include a change of energy source (PEF = 1.1), only the use of RES (PEF = 0.0) for the heating of domestic hot water. As a result the primary energy demand for buildings after renovation is quite high and is around 110 kWh/(m² year) for the cost-optimum level and around 90 kWh/(m² year) for NZEB. A change to biomass (PEF = 0.2) could significantly reduce the values but, at the same time, would change the energy price before and after renovation. Calculations including this aspect could be an element of future analysis, as well as the indoor environmental quality before and after renovation [68,69].
In order to support the renovation of buildings, it is crucial to determine the requirements for cost-effective and NZEB renovation. The method and principles of support should give the building owners the incentive to self-incur the costs of carrying out economically viable improvements. For example, there should be no support for improvements with a short payback time, as these can be financed by investors or by using external capital. It is necessary to set a definition for the NZEB renovation level and determinate technical requirements for individual energy efficiency improvements (e.g., the insulation of building elements) in the frame of planned Clean Air programme. Policies supporting the modernization of existing buildings stock should be designed in a way that guarantees the achievement of the expected environmental outcomes whilst promoting ambitious, yet realistic, renovation levels.
Author Contributions
Investigation: M.P.; Rest, S.F.
Funding
This research was funded by European Climate Foundation grant BPIE Poland 2018.
Acknowledgments
We gratefully thank Dan Staniaszek and BPIE for the technical support.
Conflicts of Interest
The authors declare no conflict of interest.
References
- Building Performance Institute Europe (BPIE). Renovation Strategies of Selected EU Countries. A Status Report on Compliance with Article 4 of the Energy Efficiency Directive; BPIE: Brussels, Belgium, 2014. [Google Scholar]
- Building Performance Institute Europe (BPIE). 97% of Buildings in the EU Need to be Upgraded; BPIE: Brussels, Belgium, 2014. [Google Scholar]
- EPBD. Proposal for a Directive of the European Parliament and of the Council Amending Directive 2010/31/EU on the Energy Performance of Buildings; Com(2016) 765 Final, 2016/0381 (Cod); European Commission: Brussels, Belgium, 2016. [Google Scholar]
- Institute of Environmental Economics (IEE). Energy Efficiency in Poland 2013 Review, Single Family Houses Energy Efficiency and Air Quality; IEE: Kraków, Poland, 2014. [Google Scholar]
- Gajewski, R.R.; Węglarz, A.; Żmijewski, K. Poly-Optimal Method of Designing Environmentally Friendly Buildings. In Portugal SB07, Sustainable Construction, Materials and Practices, Challenge of the Industry for the New Millenium; IOS Press BV: Delft, The Netherlands, 2007; pp. 488–493. [Google Scholar]
- Pierzchalska, D.; Węglarz, A. Practical realization of deep renovation idea (Praktyczna realizacja idei głębokiej termomodernizacji). Mater. Bud. 2016, 1, 23–25. [Google Scholar]
- Central Statistical Office. Inhabited Buildings, the National Census of Population and Housing 2011; Central Statistical Office: Warsaw, Poland, 2013.
- Directive (EU) 2018/844 of the European Parliament and of the Council of 30 May 2018 Amending Directive 2010/31/EU on the Energy Performance of Buildings and Directive 2012/27/EU on Energy Efficiency. Available online: https://eur-lex.europa.eu/legal-content/EN/TXT/?uri=uriserv%3AOJ.L_.2018.156.01.0075.01.ENG (accessed on 4 May 2018).
- Directive 2012/27/EU of the European Parliament and of the Council of 25 October 2012 on Energy Efficiency, Amending Directives 2009/125/EC and 2010/30/EU and Repealing Directives 2004/8/EC and 2006/32/EC; EEA Relevance, COD 2011/0172; European Parliament, Council of the European Union: Brussels, Belgium, 2012; Available online: https://eur-lex.europa.eu/legal-content/EN/TXT/?uri=celex%3A32012L0027 (accessed on 4 May 2018).
- EPBD Recast: Directive 2010/31/EU of the European Parliament and of Council of 19 May 2010 on the energy performance of buildings (recast). Off. J. Eur. Union 2010, 153, 13–35. Available online: https://eur-lex.europa.eu/legal-content/EN/ALL/?uri=celex%3A32010L0031 (accessed on 4 May 2018).
- Commission Recommendation (EU) 2016/1318 of 29 July 2016 on Guidelines for the Promotion of Nearly Zero-Energy Buildings and Best Practices to Ensure that, by 2020, All New Buildings Are Nearly Zero-Energy Buildings. 2016. Available online: http://data.europa.eu/eli/reco/2016/1318/oj (accessed on 3 June 2017).
- NZEB Criteria for Typical Single-Family Home Renovations in Various Countries; Intelligent Energy Europe Project COHERENO: Brussels, Belgium, 2013; Available online: https://repository.tudelft.nl/islandora/object/uuid%3A0473d019-a18f-4a32-81d3-93ea98a71503 (accessed on 4 May 2018).
- What Is a Deep Renovation Definition? Technical Report; Global Building Performance Network: Paris, France, 2013; Available online: http://www.gbpn.org/sites/default/files/08.DR_TechRep.low_.pdf (accessed on 4 May 2018).
- Building Performance Institute Europe (BPIE). Principles for Nearly Zero-Energy Buildings. Paving the Way for Effective Implementation of Policy Requirements; BPIE: Brussels, Belgium, 2011; ISBN 9789491143021. [Google Scholar]
- Outline National Plan to Increase the Number of Nearly Zeroenergy Buildings in Accordance with Article 9 of Directive 2010/31/EU on the Energy Performance of Buildings; Ministry of Regional Development and Public Works: Sofia, Bulgaria, 2013; Available online: https://ec.europa.eu/energy/sites/ener/files/documents/ms_nzeb_national_plans.zip (accessed on 4 May 2018).
- Finland’s National Plan to Increase the Number of Nearly Zero-Energy Buildings; Report to the European Commission Pursuant to Article 9 of Directive 2010/31/EU on the Energy Performance of Buildings; Ministry of Environment: Helsinki, Finland, 2012. Available online: https://ec.europa.eu/energy/sites/ener/files/documents/ms_nzeb_national_plans.zip (accessed on 4 May 2018).
- Action Plan for Increasing the Number of Nearly Zero-Energy Buildings; ш Ref. Ares (2013) 54186—16/01/2013; France, 2013. Available online: https://ec.europa.eu/energy/sites/ener/files/documents/ms_nzeb_national_plans.zip (accessed on 4 May 2018).
- Towards Nearly Zero Energy Buildings in Ireland, Planning for 2020 and Beyond; Department of the Environment, Community and Local Government: Dublin, Ireland, 2012. Available online: https://ec.europa.eu/energy/sites/ener/files/documents/ms_nzeb_national_plans.zip (accessed on 4 May 2018).
- National Plan for Increasing the Number of “Nearly-Zero Energy Buildings” Guidelines and Development Framework; Italy, 2013. Available online: https://ec.europa.eu/energy/sites/ener/files/documents/ms_nzeb_national_plans.zip (accessed on 4 May 2018).
- National Plan for Increasing the Number of Nearly-Zero Energy Buildings; Ministry of the Environment of the Republic of Lithuania: Vilnius, Lithuania, 2012. Available online: https://ec.europa.eu/energy/sites/ener/files/documents/ms_nzeb_national_plans.zip (accessed on 4 May 2018).
- National Plan for Luxembourg to Increase the Number of Nearly Zero-Energy Buildings; Le Gouvernement du Grand-Duche de Luxembourg, Ministere de l’Economie et du Commerce Exterieur: Luxembourg, 2013. Available online: https://ec.europa.eu/energy/sites/ener/files/documents/ms_nzeb_national_plans.zip (accessed on 4 May 2018).
- National Plan for Increasing the Number of Nearly Zero-Energy Buildings in Portugal; Direcao Geral de Energia e Geologia: Lisboa, Portugal, 2013. Available online: https://ec.europa.eu/energy/sites/ener/files/documents/ms_nzeb_national_plans.zip (accessed on 4 May 2018).
- National Plan for Increasing the Number of Nearly Zero-Energy Buildings; Slovakia, 2013. Available online: https://ec.europa.eu/energy/sites/ener/files/documents/ms_nzeb_national_plans.zip (accessed on 4 May 2018).
- National Plan for Increasing the Number of Nearly Zero-Energy Buildings in Accordance with Article 9 of the Recast EPBD; Republika Slovenija, Ministrstvo za Infrastrukturo in Prostor: Ljubljana, Slovenia, 2013. Available online: https://ec.europa.eu/energy/sites/ener/files/documents/ms_nzeb_national_plans.zip (accessed on 4 May 2018).
- Towards Nearly Zero-Energy Buildings; Communication 2011/12:131; Ministry of Industry, Employment and Communications: Stockholm, Sweden, 2012. Available online: https://ec.europa.eu/energy/sites/ener/files/documents/ms_nzeb_national_plans.zip (accessed on 4 May 2018).
- Bointner, R.; Toleikytė, A.; Kranzl, L. Cross-country analysis of the implementation of nearly zero-energy building standards across Europe. In Proceedings of the 2nd International Conference on Intelligent Green Building and Smart Grid (IGBSG), Prague, Czech Republic, 27–29 June 2016; ISBN 978-1-4673-8474-2. [Google Scholar] [CrossRef]
- D’Agostino, D. Assessment of the progress towards the establishment of definitions of Nearly Zero Energy Buildings (nZEBs) in European Member States. J. Build. Eng. 2015. [Google Scholar] [CrossRef]
- Panagiotidou, M.; Fuller, R.J. Progress in ZEBs—A review of definitions, policies and construction activity. Energy Policy 2013, 62, 196–206. [Google Scholar] [CrossRef]
- Lund, H.; Marszal, A.; Heiselbergb, P. Zero energy buildings and mismatch compensation factors. Energy Build. 2011, 43, 1646–1654. [Google Scholar] [CrossRef]
- Zangheri, P.; Armani, R.; Pietrobon, M.; Pagliano, L. Identification of cost-optimal and NZEB refurbishment levels for representative climates and building typologies across Europe. Energy Effic. 2018, 11, 337–369. [Google Scholar] [CrossRef]
- Primary Energy Factors and Members States Energy Regulations Primary Factors and the EPBD. Available online: https://www.epbd-ca.eu/wp-content/uploads/2018/04/05-CCT1-Factsheet-PEF.pdf (accessed on 15 August 2018).
- Leoncini, L. The Primary Energy Factors play a central role in European 2020 targets achievement. Chapter 2—Policies for Sustainable Construction. In Proceedings of the Portugal SB13—Contribution of Sustainable Building to Meet EU 20-20-20 Targets, Guimarães, Portugal, 30 October–1 November 2013; Available online: https://www.irbnet.de/daten/iconda/CIB_DC26383.pdf (accessed on 4 May 2018).
- Fritsche, U.R.; Greß, H.-W. Development of the Primary Energy Factor of Electricity Generation in the EU-28 from 2010-2013; IINAS: Darmstadt, Germany, 2015. [Google Scholar]
- European Parliament. Commission Delegated Regulation (EU) No. 244/2012 of 16 January 2012 supplementing Directive 2010/31/EU of the European Parliament and of the Council on the Energy Performance of Buildings by Establishing a Comparative Methodology Framework for Calculating Cost-Optimal Levels of Minimum Energy Performance Requirements for Buildings and Building Elements; Official Journal of the European Union: Brussels, Belgium, 2012. [Google Scholar]
- European Parliament. Guidelines Accompanying Commission Delegated Regulation (EU) No. 244/2012 of 16 January 2012 supplementing Directive 2010/31/EU of the European Parliament and of the Council on the Energy Performance of Buildings by Establishing a Comparative Methodology Framework for Calculating Cost-Optimal Levels of Minimum Energy Performance Requirements for Buildings and Building Elements; Official Journal of the European Union: Brussels, Belgium, 2012. [Google Scholar]
- Fokaides, P.A.; Papadopoulos, A.M. Cost-optimal insulation thickness in dry and mesothermal climates: Existing models and their improvement. Energy Build. 2014, 68, 203–212. [Google Scholar] [CrossRef]
- Ministry of Infrastructure Poland. Regulation of the Minister of Infrastructure of March 17, 2009 on the Detailed Scope and Forms of the Energy Audit and Parts of the Renovation Audit, Models of Audit Cards, as Well as the Algorithm to Assess the Cost-Effectiveness of the Thermomodernization Project; OJ 2009 No. 43 Item 346; Ministry of Infrastructure Poland: Warsaw, Poland, 2009.
- Narowski, P.; Janicki, M.; Heim, D. Comparison of untypical meteorological years (UMY) and their influence on building energy performance simulations. In Proceedings of the BS 2013: 13th Conference of the International Building Performance Simulation Association, Chambery, France, 26–28 August 2013. [Google Scholar]
- EUROSTAT Database. Available online: http://epp.eurostat.ec.europa.eu (accessed on 28 June 2011).
- 535pellet. Available online: http://www.535pellet.pl/ (accessed on 30 April 2018).
- Katowicki Węgiel. Available online: http://www.wegiel.katowice.pl/ (accessed on 30 April 2018).
- Eko Energy Paliwa Ekologiczne. Available online: http://eko-groszek.org/ (accessed on 30 April 2018).
- olej-opalowy.pl. Available online: http://www.olej-opalowy.pl/ (accessed on 30 April 2018).
- e-petrol.pl. Available online: http://www.e-petrol.pl/ (accessed on 30 April 2018).
- Congedo, P.M.; Baglivo, C.; D’Agostino, D.; Zacà, I. Cost-optimal design for nearly zero energy office buildings located in warm climates. Energy 2015, 91, 967–982. [Google Scholar] [CrossRef]
- Marco, F.; Almeida, M.G.; Ana, R.; da Silva, S.M. Comparing cost-optimal and net-zero energy targets in building retrofit. Build. Res. Inf. 2016, 44, 188–201. [Google Scholar]
- Kurnitski, J.; Saarib, A.; Kalameesc, T.; Vuolled, M.; Niemeläd, J.; Tarke, T. Cost optimal and nearly zero (NZEB) energy performance calculations for residential buildings with REHVA definition for NZEB national implementation. Energy Build. 2011, 43, 3279–3288. [Google Scholar] [CrossRef]
- Congedo, P.M.; D’Agostino, D.; Baglivo, C.; Tornese, G.; Zacà, I. Efficient solutions and cost-optimal analysis for existing school buildings. Energies 2016, 9, 851. [Google Scholar] [CrossRef]
- Ferrara, M.; Fabrizio, E.; Virgone, J.; Filippi, M. A simulation-based optimization method for cost-optimal analysis of nearly Zero Energy Buildings. Energy Build. 2014, 84, 442–457. [Google Scholar] [CrossRef]
- Hamdy, M.; Hasan, A.; Siren, K. A multi-stage optimization method for cost-optimal and nearly-zero-energy building solutions in line with the EPBD-recast 2010. Energy Build. 2013, 56, 189–203. [Google Scholar] [CrossRef]
- Lupisek, A.; Volf, M.; Hejtmanek, P.; Sojkova, K.; Tywoniak, J.; Op’t Veld, P. Introduction of a methodology for deep energy retrofitting of post-war residential buildings in central Europe to zero energy level. Commun. Sci. Lett. Univ. Zilina 2016, 18, 30–36. [Google Scholar]
- Kalamees, T.; Lupíšek, A.; Sojková, K.; Mørck, O.C.; Borodinecs, A.; Almeida, M.; Rovers, R.; Op’Tveld, P.; Kuusk, K.; Silva, S. What kind of heat loss requirements NZEB and deep renovation sets for building envelope? In Proceedings of the CESB 2016—Central Europe Towards Sustainable Building, Innovations for Sustainable Future, Prague, Czech Republic, 22–24 June 2016; pp. 137–144. [Google Scholar]
- ISO 13790. Energy Performance of Buildings—Calculation of Energy Use for Space Heating and Cooling; International Organization for Standardization: Geneva, Switzerland, 2008; Available online: https://www.iso.org/standard/41974.html (accessed on 4 May 2018).
- Ministry of Infrastructure and Development Poland. Regulation of the Minister of Infrastructure and Development of 27 February 2015 on the Methodology for Determining the Energy Performance of a Building or Part of a Building and Energy Performance Certificates; OJ 2015 Item 376; Ministry of Infrastructure and Development Poland: Warsaw, Poland, 2015. Available online: http://prawo.sejm.gov.pl/isap.nsf/DocDetails.xsp?id=WDU20150000376 (accessed on 4 May 2018).
- EN 15243:2007. Ventilation for Buildings. Calculation of Room Temperatures and of Load and Energy for Buildings with Room Conditioning Systems; CEN: Brussels, Belgium, 2007; Available online: http://store.uni.com/catalogo/index.php/en-15243-2007.html?josso_back_to=http://store.uni.com/josso-security-check.php&josso_cmd=login_optional&josso_partnerapp_host=store.uni.com (accessed on 4 May 2018).
- EN 15316:2007. Heating Systems in Buildings. Method for Calculation of System Energy Requirements and System Efficiencies; CEN: Brussels, Belgium, 2007; Available online: http://www.cres.gr/greenbuilding/PDF/prend/set1/WI_08_TC-approval_version_prEN_15316-2-1_Space_heating_emission_systems.pdf (accessed on 4 May 2018).
- EN 15316-3-1:2005. Heating Systems in Buildings—Method for Calculation of System Energy Requirements and System Efficiencies—Part 3-1: Domestic Hot Water Systems, Characterisation of Needs; CEN: Brussels, Belgium, 2005; Available online: http://www.cres.gr/greenbuilding/PDF/prend/set3/WI_11_TC-approval_version_prEN_15316-3-1_Domestic_hot_water-Characterization_of_needs.pdf (accessed on 4 May 2018).
- Mankowski, S.; Szczechowiak, E. Strategic Research Project Entitled “Integrated System for Reducing Operating Energy Consumption in Buildings” Research Task No. 2 Volume I. Part A: Conditions of Transformations in Construction; Warszawa, Poland, 2012. [Google Scholar]
- Building Performance Institute Europe (BPIE). Financing Building Energy Performance Improvement in Poland; BPIE: Brussels, Belgium, 2016; Available online: http://bpie.eu/wp-content/uploads/2016/01/BPIE_Financing-building-energy-in-Poland_EN.pdf (accessed on 4 May 2018).
- Institute of Environmental Economics (IEE). Energy Efficiency in Poland 2017 Review, Single Family Houses Smog; IEE: Kraków, Poland, 2018; Available online: https://depot.ceon.pl/bitstream/handle/123456789/15592/KK_IES_Przeglad2017_ceon.pdf?sequence=7&isAllowed=y (accessed on 4 May 2018).
- Firląg, S. How to meet the minimum energy performance requirements of Technical Conditions in year 2021? Procedia Eng. 2015, 111, 202–208. [Google Scholar] [CrossRef]
- Patiño-Cambeiro, F.; Armesto, J.; Patiño-Barbeito, F.; Bastos, G. Perspectives on Near ZEB Renovation Projects for Residential Buildings: The Spanish Case. Energies 2016, 9, 628. [Google Scholar] [CrossRef]
- Ahmed, K.; Carlier, M.; Feldmann, C.; Kurnitski, J. A New Method for Contrasting Energy Performance and Near-Zero Energy Building Requirements in Different Climates and Countries. Energies 2018, 11, 1334. [Google Scholar] [CrossRef]
- Król, P.; Firląg, S.; Węglarz, A. Integrated environmental impact assessment of single-family houses. Rynek Instalacyjny 2013, 9, 20–25. [Google Scholar]
- Pierzchalski, M. Single-Family Residential Building Energy Retrofit: A Case Study. In Design Solutions for nZEB Retrofit Buildings; IGI Global: Hershey, PA, USA, 2018; pp. 248–274. [Google Scholar] [CrossRef]
- Żurawski, J. Deep renovation of buildings in Poland, Buildings renovation. Izolacje 2018, 1, 18–28. [Google Scholar]
- Building Performance Institute Europe (BPIE). Is the Primary Energy Factor the Right Indicator for Determining the Energy Performance of Buildings? BPIE: Brussels, Belgium, 2017; Available online: http://bpie.eu/publication/the-role-of-the-primary-energy-factor-pef-in-determining-the-energy-performance-of-buildings/ (accessed on 4 May 2018).
- Piasecki, M.; Kostyrko, K.; Pykacz, S. Indoor environmental quality assessment: Part I: Choice of the indoor environmental quality sub-component models. J. Build. Phys. 2017, 41, 264–289. [Google Scholar] [CrossRef]
- Piasecki, M.; Kostyrko, K. Indoor environmental quality assessment, part 2: Model reliability analysis. J. Build. Phys. 2018, 5. [Google Scholar] [CrossRef]
Figure 1.
Reference single family house: (a) one-storey building with an attic (1-S); and (b) two-storey building with flat roof (2-S).
Figure 1.
Reference single family house: (a) one-storey building with an attic (1-S); and (b) two-storey building with flat roof (2-S).
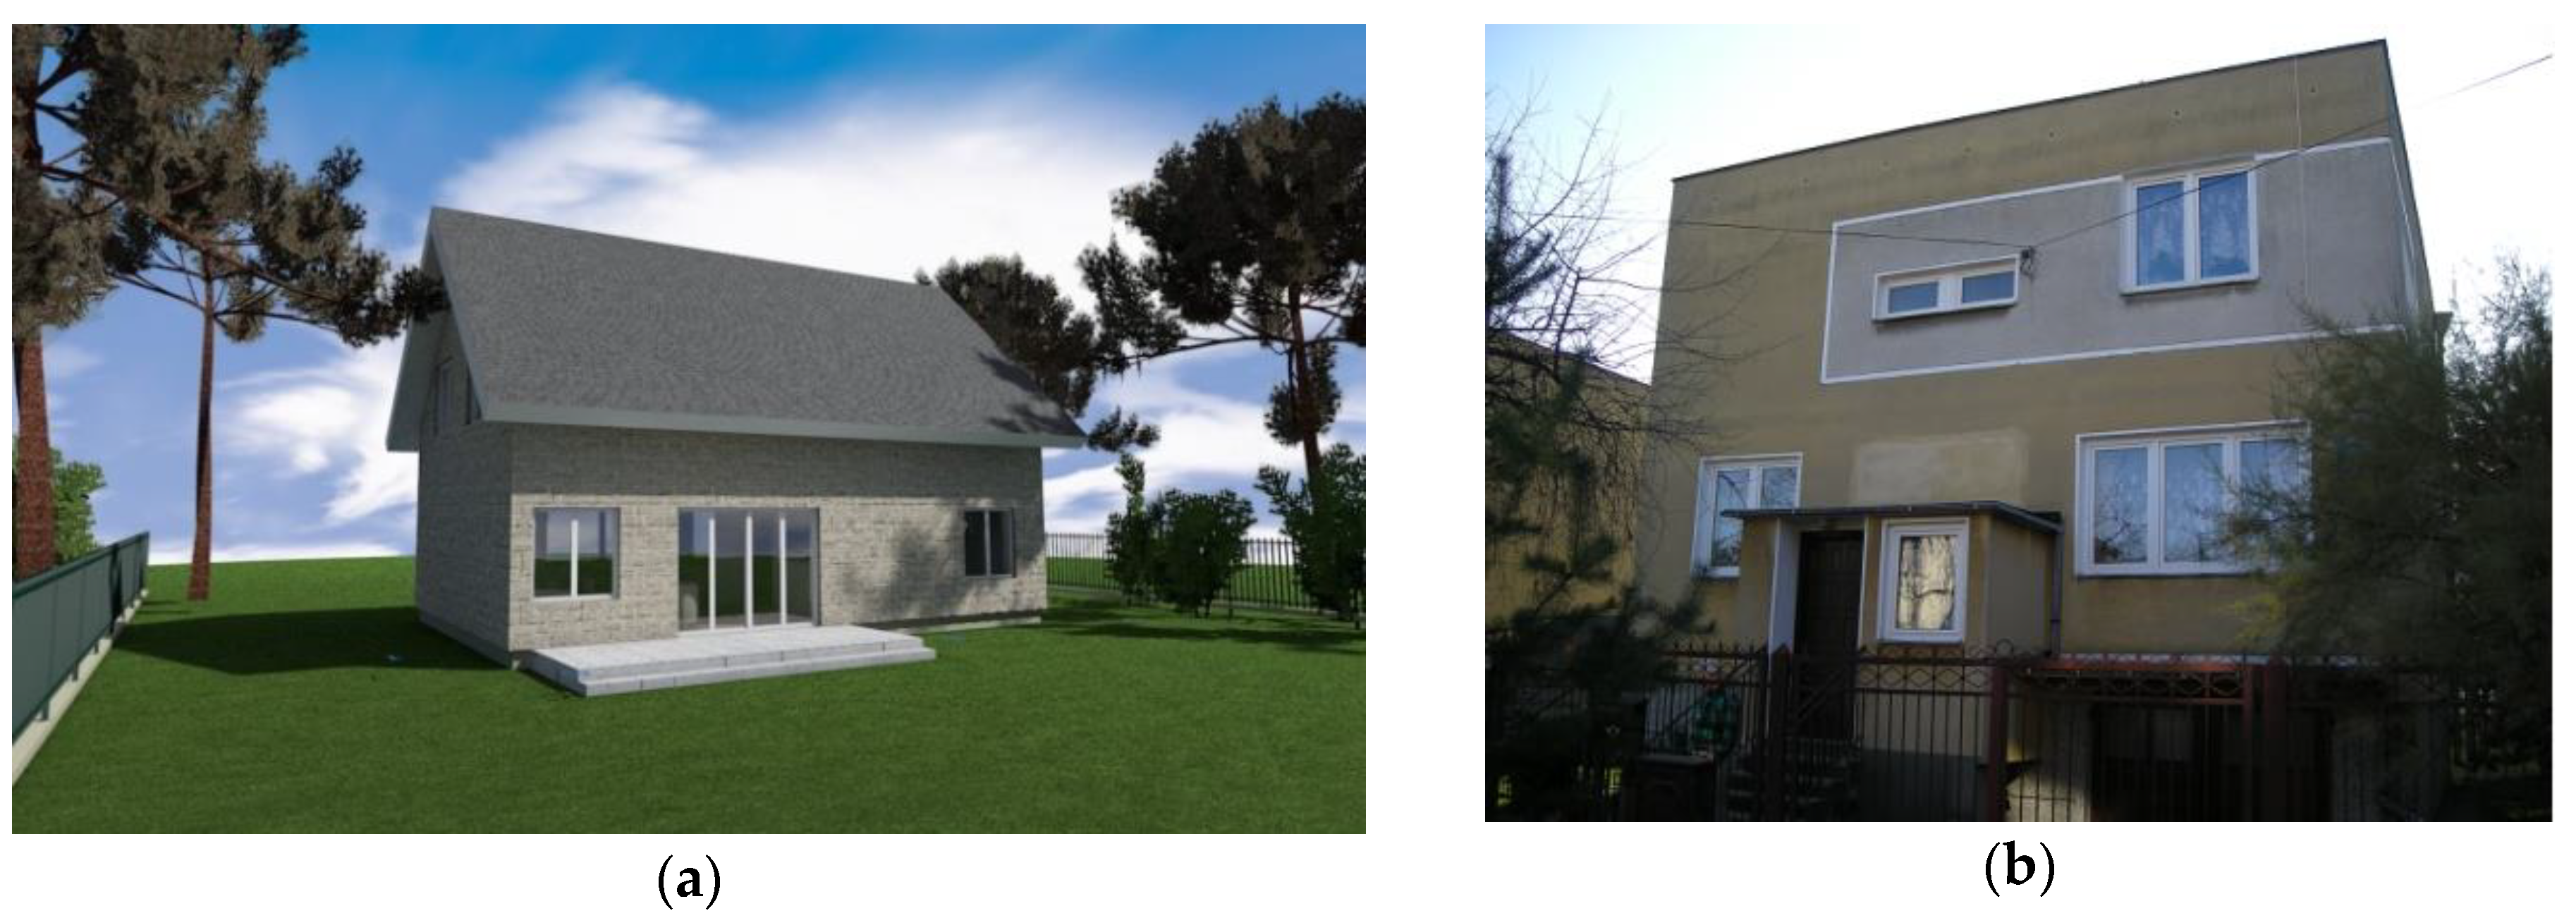
Figure 2.
The discounted, cumulative cost (KRd) per m2 for renovated external wall depending on U-value and the energy cost.
Figure 2.
The discounted, cumulative cost (KRd) per m2 for renovated external wall depending on U-value and the energy cost.

Figure 3.
Discounted cumulative cost (KRd) for different renovation variants, base case (W0), locations and buildings models S-1 and S-2 in relation to energy need for heating (QH). Energy price: 9.5 EUR/GJ.
Figure 3.
Discounted cumulative cost (KRd) for different renovation variants, base case (W0), locations and buildings models S-1 and S-2 in relation to energy need for heating (QH). Energy price: 9.5 EUR/GJ.
Figure 4.
Primary non-renewable energy demand for different building models, renovation variants, and locations.
Figure 4.
Primary non-renewable energy demand for different building models, renovation variants, and locations.


Table 1.
Indicators of NZEB renovation definition used in EU countries [15,16,17,18,19,20,21,22,23,24,25,26,27,28,29].
| Country | Energy Need for Heating QH | Primary Energy Demand QP | Final Energy Demand QF | CO2-Emissions | Summertime Comfort | Air Tightness | Thermal Transmittance of Fabrics Elements | Systems Efficiency |
|---|---|---|---|---|---|---|---|---|
| Austria | ||||||||
| Belgium (Brussels) | ||||||||
| Germany | ||||||||
| Ireland | ||||||||
| Slovenia | ||||||||
| Portugal | ||||||||
| Slovak Republic | ||||||||
| Italy | ||||||||
| France | ||||||||
| Luxembourg | ||||||||
| Sweden |
Table 2.
Results of the survey on the potential indicators of NZEB renovation definition. DHW: domestic hot water; RES: renewable energy resources.
Table 2.
Results of the survey on the potential indicators of NZEB renovation definition. DHW: domestic hot water; RES: renewable energy resources.
| Should the NZEB Renovation Definition Include Requirements Regarding: | Yes | No | Importance (Yes Votes Less No Votes) |
|---|---|---|---|
| Index of energy need for heating QH | 15 | 2 | 13 |
| Energy efficiency of renovation improvement—percentage reduction of the primary, non-renewable energy QP demand | 13 | 3 | 10 |
| Thermal transmittance (U-value) of diverse building elements | 12 | 4 | 8 |
| Index of non-renewable, primary energy demand QP | 12 | 5 | 7 |
| CO2 emission index | 10 | 5 | 5 |
| Index of final (delivered) energy demand QF | 10 | 6 | 4 |
| Share of RES | 10 | 7 | 3 |
| Ventilation systems and the efficiencies of heat recovery | 9 | 6 | 3 |
| Efficiencies of heating and DHW systems | 9 | 6 | 3 |
| Index of final (delivered) energy demand QF for cooling | 1 | 0 | 1 |
| Air tightness | 7 | 7 | 0 |
| Energy demand of auxiliary systems | 6 | 8 | −2 |
| Summertime comfort—overheating risk | 5 | 9 | −4 |
Table 3.
The number of heating degree days (HDD) for main Polish cities.
| City | HDD, Kd |
|---|---|
| OPOLE | 3488 |
| GORZÓW WIEL | 3548 |
| GDAŃSK | 3597 |
| POZNAŃ | 3672 |
| WARSZAWA | 3686 |
| ŁÓDŹ | 3696 |
| TORUŃ | 3697 |
| WROCŁAW | 3716 |
| ZIELONA GÓRA | 3724 |
| KATOWICE | 3743 |
| KRAKÓW | 3748 |
| LUBLIN | 3825 |
| KIELCE | 3835 |
| SZCZECIN | 3879 |
| RZESZÓW | 3936 |
| BYDGOSZCZ | 3941 |
| BIAŁYSTOK | 4095 |
| OLSZTYN | 4117 |
Table 4.
The energy price with the tax (23%) pre GJ and kWh for chosen energy carriers [40,41,42,43,44].
| Energy Carrier | Price with Tax | Calorific Value | Price with Tax | |||||
|---|---|---|---|---|---|---|---|---|
| Value | Unit | in MJ | Unit | in kWh | Unit | EUR per GJ | EUR per kWh | |
| Electrical energy (tariff G-11) | 0.13 | EUR/kWh | - | - | - | - | 36.38 | 0.130 |
| Firewood | 35.71 | EUR/m3 | 7200 | MJ/mp | 2000 | kWh/m3 | 4.96 | 0.019 |
| Wooden pellet | 0.20 | EUR/kg | 19.0 | MJ/kg | 5.28 | kWh/kg | 10.78 | 0.038 |
| Hard coal | 0.18 | EUR/kg | 29.0 | MJ/kg | 8.06 | kWh/kg | 6.32 | 0.024 |
| Eco-pea coal | 0.21 | EUR/kg | 27.5 | MJ/kg | 7.64 | kWh/kg | 7.79 | 0.029 |
| Heating oil | 0.58 | EUR/L | 39.0 | MJ/L | 10.83 | kWh/L | 14.77 | 0.052 |
| Natural gas (tariff W-3) | 0.38 | EUR/m3 | 39.5 | MJ/m3 | 10.97 | kWh/m3 | 9.65 | 0.036 |
| LPG (liquid gas) | 0.38 | EUR/L | 24.0 | MJ/L | 6.67 | kWh/L | 18.39 | 0.057 |
Table 5.
The energy price with the tax (23%) pre GJ and kWh for chosen energy sources.
| Energy Source | Seasonal Efficiency | Price with Tax | |
|---|---|---|---|
| % | EUR per GJ | EUR per kWh | |
| Condensing, gas boiler | 94 | 10.27 | 0.038 |
| Pellet boiler | 85 | 12.68 | 0.045 |
| Wood boiler | 82 | 6.05 | 0.023 |
| Eco-pea coal boiler | 82 | 9.50 | 0.035 |
| Oil boiler | 87 | 16.98 | 0.060 |
| LPG boiler | 87 | 21.14 | 0.066 |
| Electric radiators | 99 | 36.75 | 0.131 |
| Year of Construction | Buildings | Dwellings | Primary Energy * | Final (Delivered) Energy | ||
|---|---|---|---|---|---|---|
| Thousands | % | mln. | % | kWh/(m2a) | kWh/(m2a) | |
| before 1918 | 413.30 | 7.71 | 1.21 | 9.01 | >350 | >300 |
| 1918–1944 | 828.20 | 15.44 | 1.54 | 11.46 | 300–350 | 260–300 |
| 1945–1970 | 1367.50 | 25.50 | 3.71 | 27.62 | 250–300 | 220–260 |
| 1971–1978 | 676.50 | 12.61 | 2.16 | 16.08 | 210–250 | 190–220 |
| 1979–1988 | 763.50 | 14.24 | 2.20 | 16.38 | 160–210 | 140–190 |
| 1989–2002 | 698.40 | 13.02 | 1.52 | 11.31 | 140–180 | 125–160 |
| 2003–2010 | 616.02 | 11.48 | 1.09 | 8.14 | 100–150 | 90–120 |
| All | 5,363.42 | 100.0 | 13.43 | 100.0 | ||
* NOTE: The primary energy indicator concerns the index of non-renewable energy used for heating, ventilation and DHW. The final energy indicator concerns the energy of the demand on the heating and ventilation and DHW.
Table 7.
Basic geometric data of the two-storey building with a flat roof.
| Number of Storeys | 3 | Units |
|---|---|---|
| Gross covered area | 107.0 | m2 |
| Heated part volume | 326.0 | m3 |
| Heated area | 125.4 | m2 |
| Shape factor | 0.57 | m−1 |
Table 8.
The heat transfer coefficients and surfaces of external elements of the two-storey building with a flat roof.
Table 8.
The heat transfer coefficients and surfaces of external elements of the two-storey building with a flat roof.
| Element | Quantity | Unit | U |
|---|---|---|---|
| W/m2 K | |||
| External wall | 198.9 | m2 | 0.82 |
| Floor above unheated basement | 63.6 | m2 | 1.02 |
| Flat roof | 65.0 | m2 | 0.69 |
| Windows | 27.2 | m2 | 2.60 |
| External door | 1 | pcs. | 2.60 |
Table 9.
Basic geometric data of the one-storey building with an attic.
| Number of Storeys | 2 | Units |
|---|---|---|
| Gross covered area | 84.0 | m2 |
| Heated part volume | 420.0 | m3 |
| Heated area | 121.9 | m2 |
| Shape factor | 0.85 | m−1 |
Table 10.
The heat transfer coefficients and surfaces of external elements of the one-storey building with an attic.
Table 10.
The heat transfer coefficients and surfaces of external elements of the one-storey building with an attic.
| Element | Quantity | Unit | U |
|---|---|---|---|
| W/m2 K | |||
| External wall | 162.5 | m2 | 1.03 |
| Suspended floor | 84.0 | m2 | 0.73 |
| Pitched roof | 96.7 | m2 | 0.72 |
| Windows | 31.2 | m2 | 2.60 |
| External door | 1 | pcs. | 2.60 |
Table 11.
The discounted, cumulative cost (KRd) per m2 (the cost of energy loss plus the unit cost of renovation (K)) with tax (KVAT), depending on the renovation option and the cost of energy. Insulation of external walls using EPS with λ = 0.033 W/(mK).
Table 11.
The discounted, cumulative cost (KRd) per m2 (the cost of energy loss plus the unit cost of renovation (K)) with tax (KVAT), depending on the renovation option and the cost of energy. Insulation of external walls using EPS with λ = 0.033 W/(mK).
| U-Value, Insulation Cost and Energy Loss Per M2 for External Wall Depending on Insulation Thickness | Heating Energy Cost in EUR Per 1 GJ | ||||||||
|---|---|---|---|---|---|---|---|---|---|
| 4.7 | 7.1 | 9.5 | 11.9 | 14.3 | |||||
| d | U-Value | K | KVAT | Energy Loss | Discounted, Cumulative Cost in EUR per m2 | ||||
| cm | W/(m2 K) | EUR/m2 | EUR/m2 | GJ/(m2year) | KRd_4.7 | KRd_7.1 | KRd_9.5 | KRd_11.9 | KRd_14.3 |
| 0 | 0.820 | 0.00 | 0.00 | 0.262 | 31.52 | 47.29 | 63.05 | 78.81 | 94.57 |
| 10 | 0.231 | 23.79 | 25.70 | 0.074 | 34.52 | 39.05 | 43.33 | 47.86 | 52.38 |
| 12 | 0.202 | 24.66 | 26.63 | 0.065 | 34.40 | 38.33 | 42.14 | 46.19 | 50.00 |
| 14 | 0.180 | 25.52 | 27.56 | 0.058 | 34.52 | 37.86 | 41.43 | 45.00 | 48.33 |
| 16 | 0.163 | 26.38 | 28.50 | 0.052 | 34.76 | 37.74 | 40.95 | 44.05 | 47.14 |
| 18 | 0.148 | 27.25 | 29.43 | 0.047 | 35.00 | 37.86 | 40.71 | 43.57 | 46.43 |
| 20 | 0.136 | 28.11 | 30.36 | 0.043 | 35.48 | 38.10 | 40.60 | 43.21 | 45.95 |
| 22 | 0.125 | 29.06 | 31.38 | 0.040 | 36.19 | 38.57 | 40.95 | 43.33 | 45.95 |
| 24 | 0.117 | 29.90 | 32.29 | 0.037 | 36.67 | 39.05 | 41.19 | 43.57 | 45.71 |
| 26 | 0.109 | 30.95 | 33.42 | 0.035 | 37.62 | 39.76 | 41.90 | 43.81 | 45.95 |
| 28 | 0.102 | 31.79 | 34.34 | 0.033 | 38.33 | 40.24 | 42.14 | 44.05 | 46.19 |
| 30 | 0.096 | 32.64 | 35.25 | 0.031 | 39.05 | 40.71 | 42.62 | 44.52 | 46.43 |
Table 12.
The cost-optimum renovation variants (depending on the energy cost) of building’s envelope used in the stage II of the study (discount rate 4%).
Table 12.
The cost-optimum renovation variants (depending on the energy cost) of building’s envelope used in the stage II of the study (discount rate 4%).
| Building Element | W1—4.7 EUR per 1 GJ | W2—14.3 EUR per 1 GJ | ||||||
|---|---|---|---|---|---|---|---|---|
| d | U-Value | Renovation Cost | Unit | d | U-Value | Renovation Cost | Unit | |
| cm | W/(m2 K) | cm | W/(m2 K) | |||||
| External wall | 12 | 0.206 | 26.63 | EUR/m2 | 24 | 0.118 | 32.29 | EUR/m2 |
| Floor above an unheated cellar | 7 | 0.247 | 12.60 | EUR/m2 | 10 | 0.187 | 18.00 | EUR/m2 |
| Suspended floor | 14 | 0.235 | 30.82 | EUR/m2 | 26 | 0.144 | 36.74 | EUR/m2 |
| Flat roof | 12 | 0.217 | 20.42 | EUR/m2 | 26 | 0.121 | 26.50 | EUR/m2 |
| Pitched roof | 20 | 0.177 | 33.73 | EUR/m2 | 35 | 0.097 | 39.02 | EUR/m2 |
| Windows | - | 0.9 | 133.90 | EUR/m2 | - | 0.9 | 133.90 | EUR/m2 |
| External doors | - | 1.3 | 973.27 | EUR/pcs. | - | 0.9 | 1035.08 | EUR/pcs. |
Table 13.
The cost-optimum renovation variants (depending on the energy price) of building’s envelope—discount rate changed to 3%.
Table 13.
The cost-optimum renovation variants (depending on the energy price) of building’s envelope—discount rate changed to 3%.
| Building Element | W1—4.7 EUR per 1 GJ | W2—14.3 EUR per 1 GJ | ||||||
|---|---|---|---|---|---|---|---|---|
| d | U-Value | Renovation Cost | Unit | d | U-Value | Renovation Cost | Unit | |
| cm | W/(m2 K) | cm | W/(m2 K) | |||||
| External wall | 14 | 0.183 | 27.56 | EUR/m2 | 24 | 0.118 | 32.29 | EUR/m2 |
| Floor above an unheated cellar | 7 | 0.247 | 12.60 | EUR/m2 | 10 | 0.187 | 18.00 | EUR/m2 |
| Suspended floor | 14 | 0.235 | 30.82 | EUR/m2 | 30 | 0.128 | 38.71 | EUR/m2 |
| Flat roof | 12 | 0.217 | 22.05 | EUR/m2 | 26 | 0.121 | 26.50 | EUR/m2 |
| Pitched roof | 20 | 0.177 | 33.73 | EUR/m2 | 35 | 0.097 | 39.02 | EUR/m2 |
| Windows | - | 0.9 | 133.90 | EUR/m2 | - | 0.9 | 133.90 | EUR/m2 |
| External doors | - | 1.3 | 973.27 | EUR/pcs. | - | 0.9 | 1035.08 | EUR/pcs. |
Table 14.
The cost-optimum renovation variants (depending on the energy price) of building’s envelope—discount rate changed to 8%.
Table 14.
The cost-optimum renovation variants (depending on the energy price) of building’s envelope—discount rate changed to 8%.
| Building Element | W1—4.7 EUR per 1 GJ | W2—14.3 EUR per 1 GJ | ||||||
|---|---|---|---|---|---|---|---|---|
| d | U-Value | Renovation Cost | Unit | d | U-Value | Renovation Cost | Unit | |
| cm | W/(m2 K) | cm | W/(m2 K) | |||||
| External wall | 10 | 0.235 | 25.70 | EUR/m2 | 18 | 0.150 | 29.29 | EUR/m2 |
| Floor above an unheated cellar | 3 | 0.438 | 7.71 | EUR/m2 | 7 | 0.248 | 12.60 | EUR/m2 |
| Suspended floor | 10 | 0.297 | 28.85 | EUR/m2 | 20 | 0.179 | 33.78 | EUR/m2 |
| Flat roof | 10 | 0.245 | 21.35 | EUR/m2 | 18 | 0.162 | 25.04 | EUR/m2 |
| Pitched roof | 20 | 0.177 | 33.73 | EUR/m2 | 30 | 0.115 | 37.11 | EUR/m2 |
| Windows | - | 1.3 | 108.76 | EUR/m2 | - | 0.9 | 133.90 | EUR/m2 |
| External doors | - | 1.3 | 973.27 | EUR/pcs. | - | 0.9 | 1035.08 | EUR/pcs. |
Table 15.
Description of base case solutions and improvements of heating, DHW and ventilation system.
Table 15.
Description of base case solutions and improvements of heating, DHW and ventilation system.
| Symbol | System | Base Case/Improvement Description |
|---|---|---|
| 0 | Base heating system | total system energy efficiency including heat source: 0.64; auxiliary electrical energy: 0 kWh/year |
| - | Modernization of heating system | replacement of heat source, exchange of radiators, assembly of radiator valves with thermostatic heads, assembly of automatic air vents and closed expansion vessel; total system energy efficiency including heat source: 0.89; modernization cost: 3071 EUR: 1-S; 3310 EUR: 2-S; auxiliary electrical energy: 372 kWh/year |
| 0 | Base DHW system | total system energy efficiency including heat source: 0.23; auxiliary electrical energy: 0 kWh/year |
| - | Modernization of DHW system | exchange of DHW tank, insulation of pipes; total system energy efficiency including heat source: 0.43; modernization cost: 905 EUR; auxiliary electrical energy: 63 kWh/year |
| 0 | Base ventilation system | natural ventilation, masonry exhaust ducts, air supply window leaks |
| G | Modernization of natural ventilation | supplying air to the house and removing air from it without using mechanical systems, air supplied by of trickle vents assembled in exchanged windows, removed by existing masonry exhaust ducks; modernization cost (trickle vents): 157 EUR: S-1; 214 EUR: S-2; energy loss through ventilation reduced by: 0%; auxiliary electrical energy: 0 kWh/year |
| H | Hybrid ventilation | the ventilation is neither entirely natural, nor entirely mechanical, it works like natural ventilation, when weather conditions are favourable (pressure differences arising from natural forces is appropriate), and when they are not, it is by mechanically-supported exhaust ventilation, air supplied by trickle vents assembled in exchanged windows, removed by existing masonry exhaust ducks with low-speed automatic controlled vents, energy loss through ventilation reduced by: 20%; modernization cost: 1051 EUR: S-1, 1107 EUR: S-2; auxiliary electrical energy: 39 kWh/year |
| R | Balanced ventilation with heat recovery | mechanical ventilation heat recovery, supplying air to the house and removing air from it with using mechanical systems, assembly of ventilation unit with heat recovery, exhaust and supply ducts, and air vents is needed; energy loss through ventilation reduced by: 90%; modernization cost: 5714 EUR: S-1; 5952 EUR: S-1; auxiliary electrical energy: 394 kWh/year |
| S | Solar collectors for DHW | Assembly of solar collectors for DHW and tank; modernization cost: 2380 EUR; auxiliary electrical energy: 77 kWh/year |
Table 16.
Renovation variants matrix and costs.
| Symbol of Renovation Variant | Description | Total Renovation Costs 1-S, EUR | Total Renovation Costs 2-S, EUR |
|---|---|---|---|
| W1/G | Variant I of building’s envelope renovation Modernization of natural ventilation | 20,089 | 16,957 |
| W1/G/S | Variant I of building’s envelope renovation Modernization of natural ventilation Solar collectors for DHW | 22,470 | 19,338 |
| W1/H | Variant I of building’s envelope renovation Hybrid ventilation | 20,983 | 17,850 |
| W1/H/S | Variant I of building’s envelope renovation Hybrid ventilation Solar collectors for DHW | 23,364 | 20,231 |
| W1/R | Variant I of building’s envelope renovation Balanced ventilation with heat recovery | 25,885 | 22,695 |
| W1/R/S | Variant I of building’s envelope renovation Balanced ventilation with heat recovery Solar collectors for DHW | 28,265 | 25,076 |
| W2/G | Variant II of building’s envelope renovation Modernization of natural ventilation | 21,929 | 18,884 |
| W2/G/S | Variant II of building’s envelope renovation Modernization of natural ventilation Solar collectors for DHW | 24,310 | 21,265 |
| W2/H | Variant II of building’s envelope renovation Hybrid ventilation | 22,823 | 19,777 |
| W2/H/S | Variant II of building’s envelope renovation Hybrid ventilation Solar collectors for DHW | 25,204 | 22,158 |
| W2/R | Variant II of building’s envelope renovation Balanced ventilation with heat recovery | 28,265 | 24,622 |
| W2/R/S | Variant II of building’s envelope renovation Balanced ventilation with heat recovery Solar collectors for DHW | 30,105 | 27,003 |
Table 17.
Cost-optimum renovation variants.
| Building Model | Location | Energy Price per 1 GJ | ||
|---|---|---|---|---|
| 4.7 EUR | 9.5 EUR | 14.3 EUR | ||
| Cost-Optimum Renovation Variants | ||||
| S-1 (one-storey building with an attic) | Warszawa | W1/G | W2/G | W2/H/S |
| Szczecin | W1/G | W2/G | W2/H/S | |
| Suwałki | W1/G | W2/G | W2/H/S | |
| S-2 (two-storey building with flat roof) | Warszawa | W1/G | W2/G | W2/G/S |
| Szczecin | W1/G | W2/G | W2/G/S | |
| Suwałki | W1/G | W2/G | W2/R/S | |
Table 18.
Cost-optimum renovation variants.
| Building Model | Location | Energy Price per 1 GJ | ||
|---|---|---|---|---|
| 4.7 EUR | 9.5 EUR | 14.3 EUR | ||
| QH (kWh/m2 year) | ||||
| S-1 (one-storey building with an attic) | Warszawa | 66.0 | 48.5 | 41.7 |
| Szczecin | 60.9 | 44.5 | 38.2 | |
| Suwałki | 83.8 | 63.6 | 55.7 | |
| S-2 (two-storey building with flat roof) | Warszawa | 72.9 | 55.6 | 55.6 |
| Szczecin | 67.6 | 51.4 | 51.4 | |
| Suwałki | 91.1 | 70.9 | 30.9 | |
Table 19.
Change of the primary, non-renewable energy index after renovation to the cost-optimum variant.
Table 19.
Change of the primary, non-renewable energy index after renovation to the cost-optimum variant.
| Building Model | Localization | QP Index for Base Variant [kWh/m2year] | Energy Price per 1 GJ | ||
|---|---|---|---|---|---|
| 4.7 EUR | 9.5 EUR | 14.3 EUR | |||
| QP Index for Renovation Variants (kWh/m2year) (Percentage Reduction in Regard to Base Variant (%)) | |||||
| S-1 (one-storey building with an attic) | Warszawa | 574 | 138 (75%) | 117 (79%) | 88 (84%) |
| Szczecin | 546 | 132 (75%) | 112 (78%) | 84 (84%) | |
| Suwałki | 669 | 160 (75%) | 135 (79%) | 105 (83%) | |
| S-2 (two-storey building with flat roof) | Warszawa | 448 | 137 (69%) | 116 (74%) | 96 (79%) |
| Szczecin | 425 | 130 (69%) | 110 (74%) | 90 (79%) | |
| Suwałki | 527 | 160 (70%) | 135 (74 %) | 74 (86%) | |
© 2018 by the authors. Licensee MDPI, Basel, Switzerland. This article is an open access article distributed under the terms and conditions of the Creative Commons Attribution (CC BY) license (http://creativecommons.org/licenses/by/4.0/).
Share and Cite
MDPI and ACS Style
Firląg, S.; Piasecki, M. NZEB Renovation Definition in a Heating Dominated Climate: Case Study of Poland. Appl. Sci. 2018, 8, 1605. https://doi.org/10.3390/app8091605
AMA Style
Firląg S, Piasecki M. NZEB Renovation Definition in a Heating Dominated Climate: Case Study of Poland. Applied Sciences. 2018; 8(9):1605. https://doi.org/10.3390/app8091605
Chicago/Turabian StyleFirląg, Szymon, and Michał Piasecki. 2018. "NZEB Renovation Definition in a Heating Dominated Climate: Case Study of Poland" Applied Sciences 8, no. 9: 1605. https://doi.org/10.3390/app8091605
Note that from the first issue of 2016, this journal uses article numbers instead of page numbers. See further details here.