An Experimental Study of the Leakage Mechanism in Static Seals

1
College of Aerospace Science and Engineering, National University of Defense Technology, Changsha 410072, China
2
National Innovation Institute of Defense Technology, Chinese Academy of Military Science, Beijing 100000, China
*
Author to whom correspondence should be addressed.
Appl. Sci. 2018, 8(8), 1404; https://doi.org/10.3390/app8081404
Submission received: 18 July 2018
/
Revised: 16 August 2018
/
Accepted: 16 August 2018
/
Published: 19 August 2018
Abstract
:This paper investigates the fluidic leak rate through sealing contact surfaces by comparison between model calculation and experiment measurement. The focus is on an experimental device designed to measure the leak rate of the static seals with a simpler structure, smaller errors, stronger stability, and more functions. Using the device, experiments were carried out to four test pieces with different surface characteristics, whose leak rates were measured separately. Compared with the calculation results obtained from the fractal surface leak rate prediction model, the correctness and the application range of the model were verified, and the effects of different surface topographies and material properties of the four test pieces on the leak rate were analyzed as well. The experimental device was also used to perform single-factor comparison experiments, which were then combined with the theoretical prediction model to analyze the effects of the sealing surface contact load, fluid pressure, and surface apparent size on the leak rate, so that theoretical support and experimental evidence for selecting the parameters of sealing device was provided.
1. Introduction
A surface-to-surface contact static seal is widely applied in various industries (such as deep space exploration and nuclear power generation [1,2,3]) and has always been a research topic of great concern. Although simple in structure, the leakage of contact static seals can directly affect the operation safety of the device and lead to environmental pollution and waste of resources. As machine-processed sealing end faces (even highly polished) are rough, leakage is inevitable [4,5,6,7,8]; however, it is only possible to control the leak rate of the seals to within a certain range to meet the requirements for normal operation of mechanical devices. Therefore, theoretical studies on the leak rate prediction of sealing interfaces (the sealing interfaces formed by surface-to-surface contact) and experimental studies on leak rate measurements are of great significance for the design of seals.
In terms of theoretical research, as early as the middle of the 20th century, Heinze [9], Mayer [10], Lebeck [11,12] et al. carried out research on the prediction model for the leak rate of sealing interfaces. However, they all simplified the characterizations of the sealing surface topography and the leakage channels to various degrees, which consequently caused a large error between the calculated and the actual leak rates. In recent years, with the development of the fractal theory, there has been new theoretical support for the characterization of multiscale contact states and leakage channel complex structures in contact interfaces. Persson [13,14] proposed a contact pressure theory that considered the multiscale effect by mathematical methods such as fractal theory and frequency domain transformation, as well as a prediction model for the leak rate of rubber gaskets. Subsequently, many researchers improved this model [15,16]. Compared with rubber gaskets, metal gaskets are more sensitive to the microstructure of leakage channels. In 1991, Majumdar et al. [17] used the Weierstrass–Mandelbrot fractal function (i.e., W–M function) to characterize the surface topography, and proposed a contact pressure model (i.e., M–B model) based on different observation scales. The M–B model eliminated the effect of sampling length and instrument resolution on the characterization of rough surfaces. However, it described the initial surface profile of rough surfaces through the asperity contact area A, resulting in the initial profile varying with the contact area A, and consequently concluded that “full plastic deformation happens to asperities before elasto-plastic deformation and elastic deformation”, which is contrary to real-world observations. In our previous work [18] (the article “Fractal Modeling of Fluidic Leakage through Metal Sealing Surfaces”), we improved the M–B model (by setting up a reference surface on the fractal surface), as the original M–B model was violating real-world observations when applied to calculating the contact load; moreover, using the improved contact model, the leakage channel under the contact surface is mathematically modeled based on the fractal theory and proposed the fractal surface leak rate prediction model.
When it comes to experimental research, few experimental studies have been conducted on the leakage mechanism at sealing interfaces. Yanagisawa et al. [19] used the “water bubble” method to measure the gas leak rate and studied the deformation of the sealing surfaces under load but did not conduct corresponding theoretical research on the leak rate. In the follow-up study by the same authors in 1991, the effect of lead coating on the sealing performance in a low-temperature environment (70 K) was verified through experimental studies [20]. Matsuzaki and Kaza-maki [21,22] studied the effect of sealing surface materials (copper, stainless steel, or other alloyed steel) and machining processes (polishing, grinding, etc.) on the gas leak rate. Lorenz built a fluid percolation experimental system and measured the leak rate of the rubber gasket seal; the experimental measurement results were consistent with the calculation results of Persson’s leakage prediction model, but the experiment was relatively simple, only the theoretical model verified, and other parameters were not investigated. In 2007, Marie et al. [23] designed a relatively precise device for fluid leakage measurements to study the relationship between pressure and leak rate driven by different gas pressures during contact between sapphire and metal surfaces, and compared the results with the theoretical prediction model. However, the study only considered sealing performance of a single material.
In this study, experiments were carried out on contact static seals. A new seal leak rate measurement system was built with a simpler structure, smaller errors, stronger stability, and more functions. In addition, four test pieces with different surface characteristics were designed and processed, whose leak rates were measured separately. Compared with the calculation results obtained from the fractal surface leak rate prediction model [18], the correctness and the application range of the model were verified, and the effects of different surface topographies and material properties of the four test pieces on the leak rate were analyzed as well. The proposed system was also used to perform single-factor comparison experiments, which were then combined with the theoretical prediction model to analyze the effects of the sealing surface contact load, fluid pressure, and surface apparent size on the leak rate, so that theoretical support and experimental evidence for selecting the parameters of sealing device was provided.
2. Review the Leak Rate Prediction Model
2.1. Fractal Surface
This model is used to calculate the static sealing surface by high-precision grinding, and studies [24,25,26] have shown that the seals’ surfaces have the self affine characteristics that can be approximately described using the three-dimensional Ausloos–Berman function:
where z and are the height and coordinates of the surface, respectively. The parameter M denotes the number of superposed ridges and is used to construct the surface. L is the sample length; is a random number in the range between 0 and . The surface roughness is characterized by the frequency spectrum , where satisfies ; n represents the frequency index of asperities. D (in the domain of ) and G are the fractal dimension and roughness constant, respectively, and are independent of .
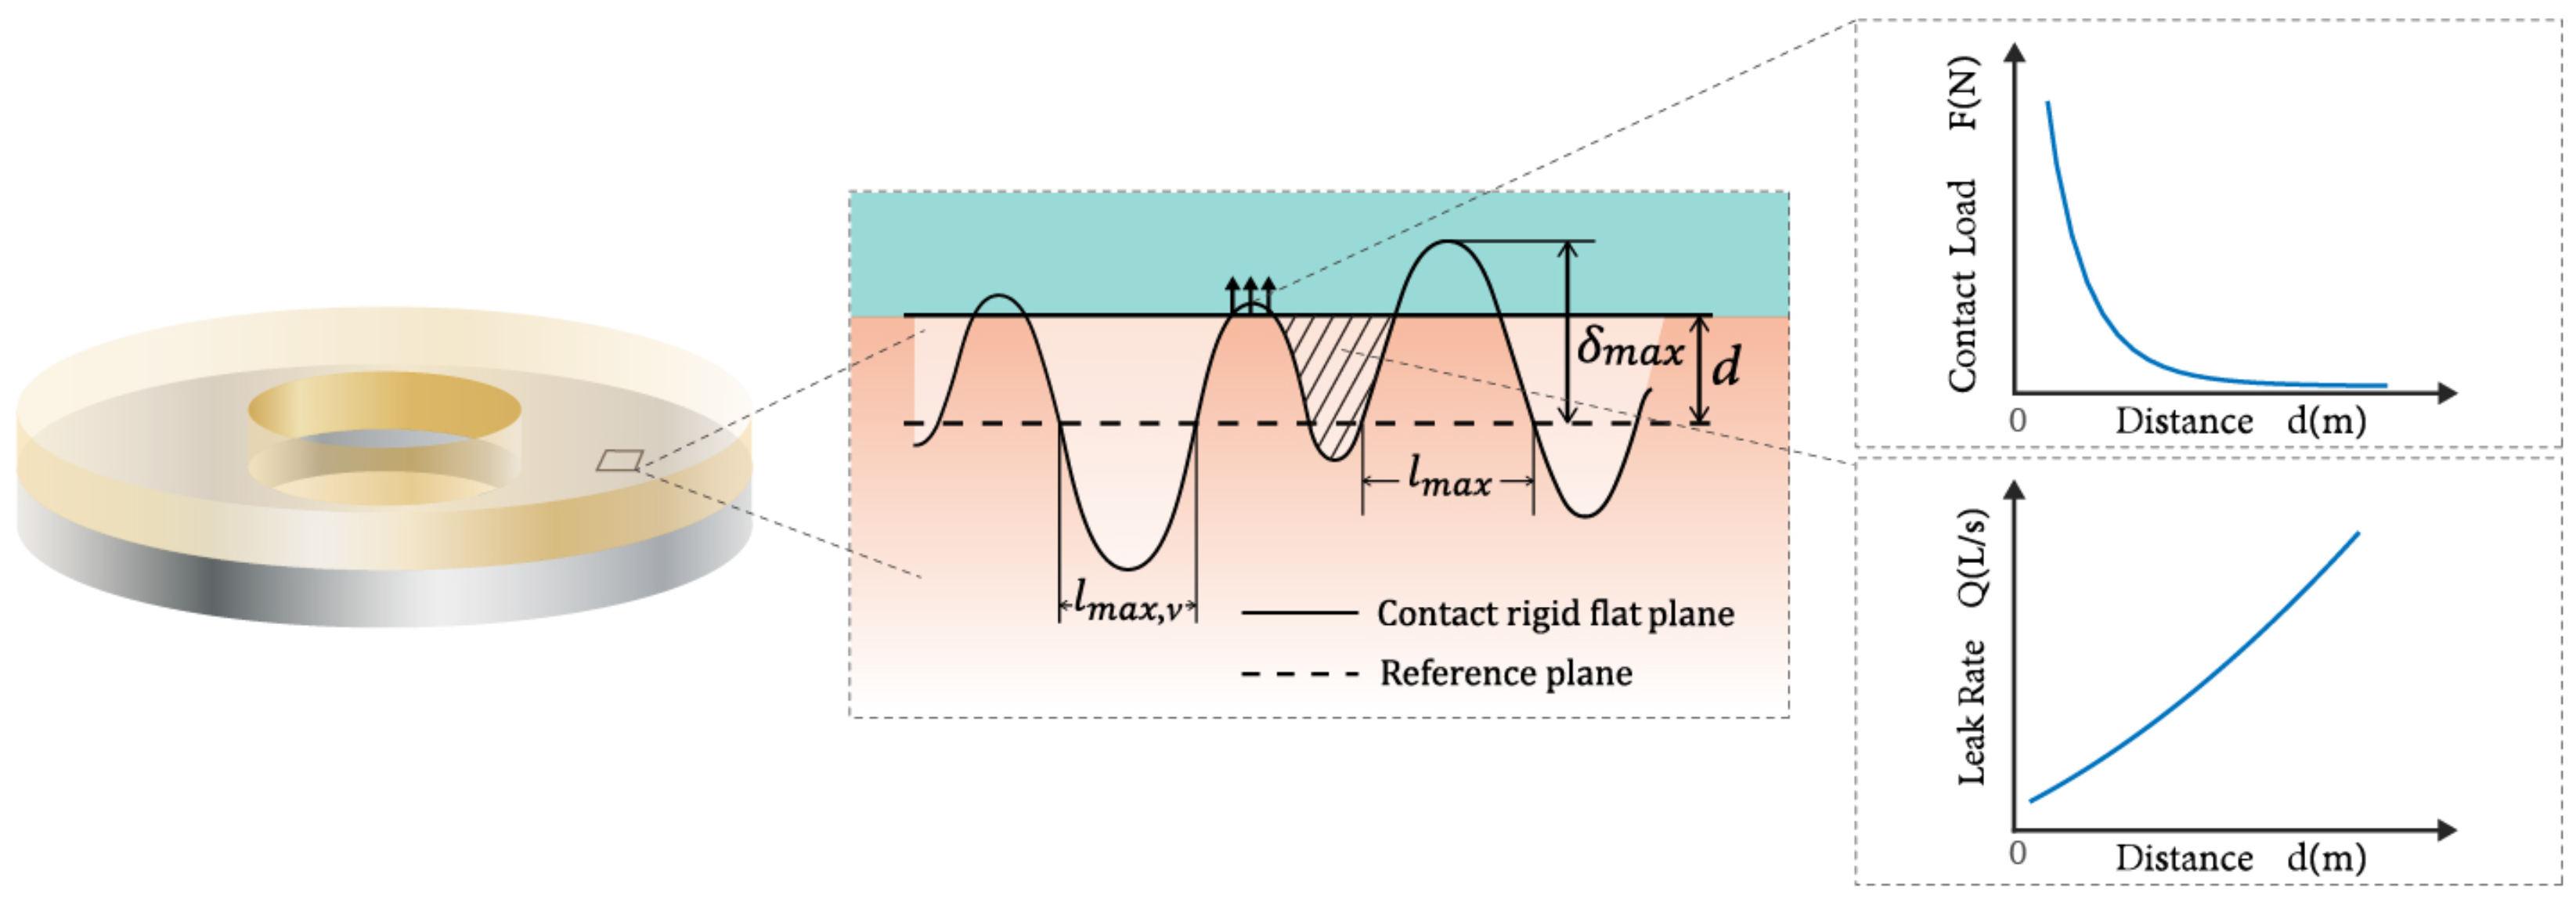
Introduce a reference plane on the fractal surface as shown in Figure 1. The seals interface are divided into a region of contact and a region of leakage by the reference plane. According to the fractal theory, the fractal surface is simplified to asperities distributed above the reference plane and pores distributed below the reference plane. The fundamental wavelengths of asperities and pores in the reference plane are l and , respectively, which is called the characteristic length of the asperity and the pore [18].
The above Equations (2) and (3) can obtain the height , curvature radius R and volume v of the asperity and pore, and are used to calculate the contact load and leak rate.
According to the fractal theory [17], the distribution function of the asperity and pore are given by:
where and are the maximum characteristic length of asperities and pores, respectively.
2.2. Contact Process
The contact load on the sealing surface is the sum of all the contact load generated by the asperities distributed above the reference plane. According to the critical deformation function of the contact model [18], the characteristic length interval of the asperities in each contact regimes (the elastic, elastic-plastic and plastic regimes) is obtained when the contact distance is d. Then, the integrated contact load is obtained by integrating the contact model [25] and distribution function (Equation (3)) of the single asperity in each contact regimes. Take elastic contact, for example, the integrated elastic contact load :
where is the contact load of the single asperity in the elastic regime [25]. Nl is given by Equation (3). is the range of the characteristic length interval of the asperities in elastic contact regimes [18].
In the same way as calculating the plastic contact load and elastic-plastic contact load , the total integrated contact load is
2.3. Leakage Process
The leak rate of seal interface (equivalent to a one-layer porous medium) depends on the porosity, i.e., the ratio of the volume of percolation channels to total volume of interface. In this model, the percolation channels within the seal–contact interface are formed by pores. The porosity of contact interface is calculated by geometric method is given by:
where and are the integrated volume of asperities and pores are obtained by integrating the volume and distribution function (Equation (3)) of the single asperity and pore, respectively. is the volume of the seal–contact interface, equalling the product of length , width and height . In the same way, the volume between the reference plane and contact plane is given by .
The pores-forming percolation channels within the seal–contact interface are considered to be a combination of filled tortuous capillaries with their diameter satisfying the fractal power law, based on the fractal theory of fluidic transport in porous media developed by Yu [27,28,29,30]. The fractal dimension of tortuous capillaries given by the porosity . In addition, the permeability is defined as:
The leak rate of ring gasket can be obtained by [18]:
where represent the fluid pressure difference.
3. Experimental Design for Sealing Surface Leak-Rate Measurement
3.1. Experimental Devices
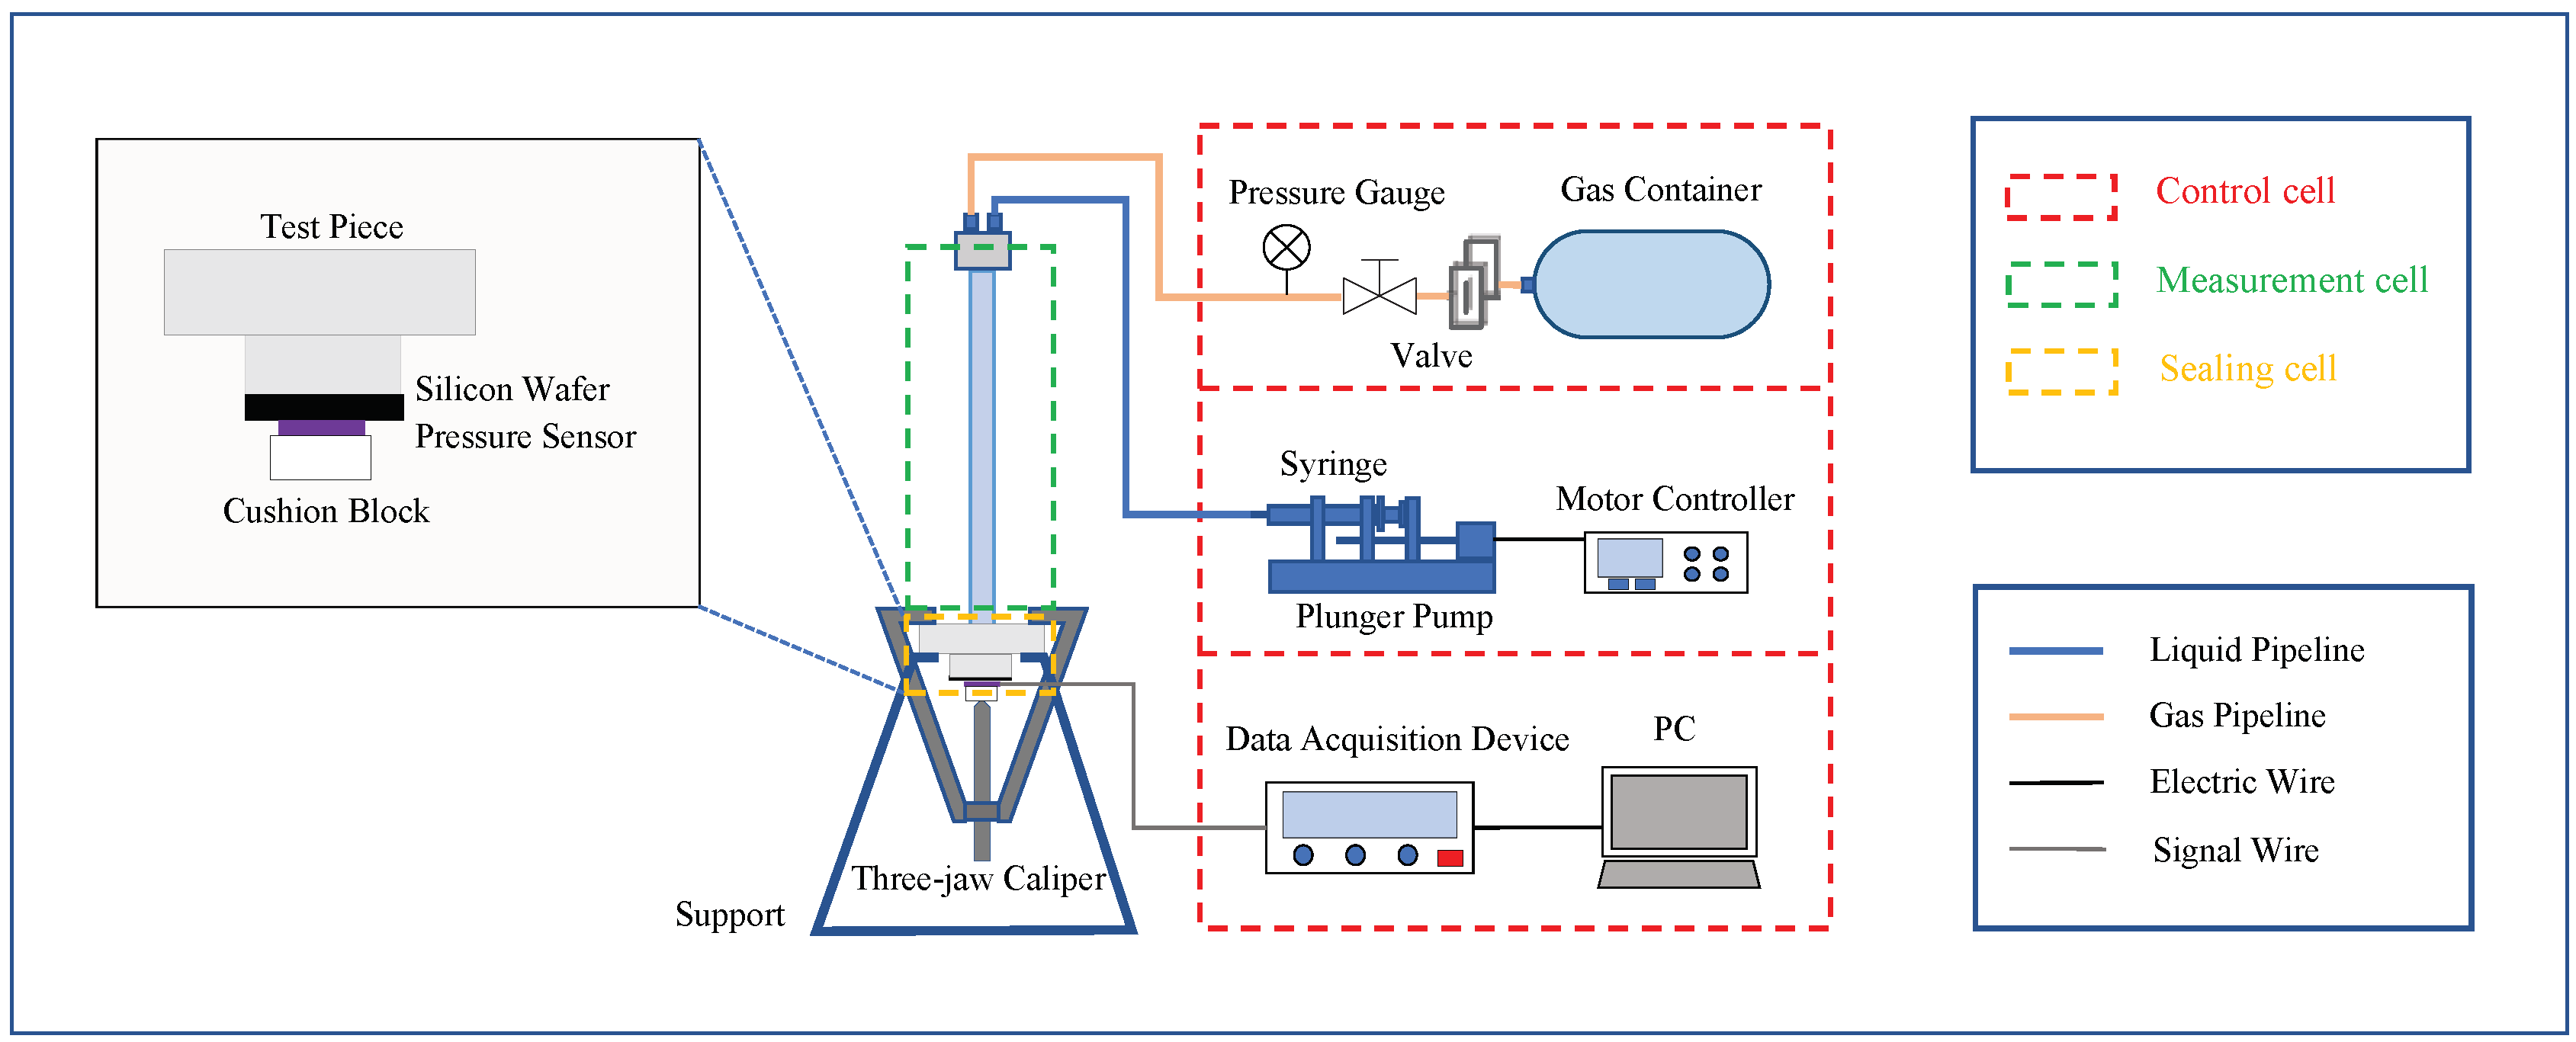
This experiment focused on the study and investigation of the leakage mechanism of sealing interfaces. During the design of the experimental device, the replacement of test pieces and the control and measurement of the operating parameters were both considered. As illustrated in Figure 2, the experimental device consisted of a sealing cell, a measurement cell, and a control cell.
(1) Sealing Cell
The sealing cell mainly comprised a test piece and silicon wafers. As shown in Figure 2, the test piece was a cylindrical boss, with the small-radius (50 mm) round surface as the sealing surface butted to the silicon wafers to form a sealing interface. The large-radius round surface was used for fixing and clamping (a three-jaw caliper), the position at the center of the circle was connected to the leakage measuring tube through a tapered threaded hole, and the fluid in the measuring tube infiltrated the sealing surface through the through-hole at the center of the test piece. The connection position between the test piece and the leakage measuring tube was sealed (by tape wrapping and dispensing) to ensure that the gas leak rate at this position was less than Pa·m/s, thereby controlling the experimental measurement error. The silicon wafers were approximated as a smooth plane, and the elastic modulus of the silicon wafers and the test piece was equivalent to in the leak rate prediction model. The surface size of the silicon wafers was considered equal to the apparent contact area of the sealing surface.
(2) Measurement Cell
The measurement cell mainly consisted of a measuring tube (plexiglass tube). The amount of fluid leakage was calculated by observing the change in the fluid level in the measuring tube over a certain period. In this experiment, the inner diameter of the measuring tube was 100 mm, the length was 250 mm, and the initial position of the fluid level was 200 mm. In order to reduce the effect of fluid pressure variation caused by a change in the fluid level on the experimental data, in the seepage experiment, the upper limit of the leakage was set to 0.75 mL (i.e., a height change of about 10 mm), which could be extended correspondingly in the leakage experiment driven by gas pressure. For this device, a leakage amount of greater than 0.15 mL (i.e., a height change of about 2 mm) was considered observable, so the measurement range was 0.15 mL–0.75 mL. In view of this, it was necessary to adjust the time of each experiment according to the experimental conditions and the leakage amount. For a 120-min measurement, the precision in measurement time could reach m/s. The lower end of the measuring tube was connected to the test piece, while the upper end was connected to the gas pressure control cell and the fluid supplementing cell.
(3) Control Cell
The control cell was composed of a load control cell, a fluid supplementing cell, and an gas pressure control cell.
The pressure control cell consisted of a three-jaw caliper, a polytetrafluoroethylene (PTFE) cushion block, and a membrane pressure sensor, providing a uniform, stable and measurable contact load to the seal surface. As shown in Figure 2, the test piece was fixed by the three-jaw caliper, and the contact load was controlled by a rotating screw. The tapered head of the screw was placed on the cylindrical PTFE cushion block on the lower side of the silicon wafer, and the contact load was distributed through contact points to the entire contact surface, thereby providing a normal pressure no larger than N for the contact surface. In addition, a membrane pressure sensor was installed between the cushion block and the silicon wafer to monitor the contact load in real time.
The fluid level control cell was composed of a syringe, a plunger pump, and a motor controller. The motor would drive the syringe to inject fluid into the measuring tube, whose amount was determined by the leakage amount. The fluid level control cell was mainly used to maintain the fluid level in the measuring tube, supplement fluid after leakage, and assist in monitoring the leakage amount from the injection amount.
The gas pressure control cell was composed of a gas container, a pressure reducing valve, and a pressure gauge. The pressure inside the measuring tube was controlled by the pressure reducing valve, and the pressure gauge was used for monitoring, thereby controlling the fluid pressure. Considering the pressure bearing capacity of the measuring tube, the maximum working pressure of the gas pressure control cell was no more than 1.5 MPa.
3.2. Experimental Samples
In this study, three common seal materials were selected, including stainless steel 316L, hardened SKD11 steel, and PTFE. The materials were processed and surface treated through the four different processes of turning, fine turning, electrical discharge machining (EDM), and polishing to obtain four different test pieces with obvious surface differences (as depicted in Figure 3).
The material parameters of the four test pieces are listed in Table 1.
The cross-sectional profile data of the four test pieces were collected using an optical profilometer Veeco Wyko NT9100 (Veeco Corporate Headquarters, 1 Terminal Drive, Plainview, NY 11803, US) (vertical resolution: 0.1 nm, horizontal resolution: 400 nm), as shown in Figure 4.
The structure function of the 2D profile function of the fractal surface can be expressed as:
where denotes the scale of the structure function. By calculating the logarithms of both sides of Equation (11), we have
As seen from the equation above, the cross-sectional profile curves of the rough surface with fractal characteristics, lg and lg, present a linear relationship. The correlation between the slope k and the intercept B, and the fractal parameters, can be expressed as
As an illustration, one set of cross-sectional profile data was substituted into Equation (11) to demonstrate the linear relationship between lg and lg. As demonstrated in Figure 5a, the slope of the trend line and the intercept were substituted into Equations (13) and (14) to obtain fractal parameters and . The fractal parameters were then substituted into the cross-sectional profile function of the AB model [18]. The results are shown in Figure 5b, where the blue line and the red line denote the fitted profile and the measured profile, respectively. The fitted three-dimensional surface is shown in Figure 5c.
The fractal parameters of the sealing surfaces of the test pieces are shown in Table 1. The measurement and calculation results showed that the surfaces of test pieces No. 1 and 2 were smooth, and followed the fractal characteristics ( and were in a linear relationship); the surface of test piece No. 3 was rough (Ra = 3.7), but still followed fractal characteristics; the surface of test piece No. 4 was covered with several spiral grooves, and the measurement results showed that it did not follow fractal characteristics, and thus could not be accurately characterized using the fractal theory.
3.3. Experimental Implementation
The experimental work in this study was mainly dedicated to two purposes: to study the effect of sealing surface characteristics on leakage, analyze the leakage mechanism of sealing interfaces, and verify the leak rate prediction model; and to learn the effect of external factors of the sealing device on the leak rate, and apply the leak rate prediction model to optimize the design parameters of the sealing device.
3.3.1. Effect of Sealing Surface Characteristics on Leak Rate
The properties of the sealing surfaces include material properties and surface topography, measurement parameters of surface topography and the material parameters are shown in Table 1. In this experiment, the leak rates of the four test pieces in contact with the silicon wafers were measured. The surfaces of test pieces No. 1 and 2 were smooth, so that the amount of leakage was relatively small. For these two pieces, as the contact load of the device would gradually decrease during long-term measurement (greater than 200 min), the gas pressure was increased to 0.1 MPa to reduce the measurement time. The surfaces of test pieces No. 3 and 4 were rough, and the leakage amount was consequently larger. As a result, for these two pieces, the gas pressure was set to 0 MPa, so that the measurement conditions of the experimental device were satisfied when measuring the leakage amount of the seepage process. All experimental fluids used in this study were water, whose viscosity coefficient was 1.01 × 10 Pa·s. In addition, the experimental temperature is at 25 C.
3.3.2. Effect of Sealing Device Working Conditions on Leak Rate
In the experiment, the effects of the three working conditions, i.e., the contact load, fluid pressure, and apparent contact area of test piece No. 1 on the leak rate, were studied through single-factor comparison experiments. These three parameters were also the ones to be considered during the design of seals. The experimental parameters are shown in Table 2, with five levels of contact load, three levels of gas pressure, and two apparent contact surface sizes.
As the surface topography of the test pieces would change under the contact load (plastic deformation), the experimental measurements with the 66.7 mm silicon wafer were performed first. During measurement, the contact load was increased in steps from 100 N to 500 N. For each contact load, the leak rate under an gas pressure of 0.1, 0.2, and 0.3 MPa was measured, followed by increasing the contact load for measurement, so that the total pressure on the contact surface was increased incrementally. After all measurements with the 66.7 mm silicon wafer were completed, it was replaced with a 33.3 mm silicon wafer, and leak rate measurements were continued with a contact load of 500 N and different gas pressures.
4. Results and Analysis
4.1. Effect of Surface Characteristics on Leak Rate
In this section, we verified the correctness and the scope of application of the theoretical model by means of studying how the leak rates of the four test pieces (with four kinds of sealing surfaces) changed with the contact load, analyzing the effects of surface characteristics on the leak rate, and substituting the surface parameters of the four test pieces (as shown in Table 1) and the working conditions (as shown in Table 2) into the leak rate prediction model. As shown in Figure 6, the four Figure 6a and Figure 1b–d are in one-to-one correspondence to test pieces No. 1–4 for the experimental results (asterisks) and the calculation results (solid lines) obtained from the model, where the abscissa and the ordinate are contact load and leak rate, respectively.
It is observed in Figure 6a that the experimental results of test piece No. 1 basically agree with the calculation results obtained from the model, and that the leak rate is a decreasing function of the contact load. As shown in Figure 6b, the order of magnitude of the calculated leak rate of test piece No. 2 obtained from the model is , and that of the leak rate measured in the experiment is . This indicates that the theoretical model is not applicable to materials with low elastic modulus, such as PTFE. When the deformation of the asperity on the contact surface is significant, the simplified contact model [25] of the asperity is no longer applicable, which is consistent with predictions from previous studies [18]. For this reason, the proposed theoretical model is only suitable for contact seal problems on metal surfaces.
As shown in Figure 6c, the leakage experiment results are basically consistent with the calculation results obtained from the model. It can be seen from the comparison between Figure 6a and Figure 6c that the leak rate of test piece No. 1 (Ra is 0.3) at a fluid pressure of 0.1 MPa is smaller than that of test piece No. 3 (Ra is 2.5) at a fluid pressure of 0 MPa, indicating that roughness and leak rate are positively correlated, that is, the rougher the surface (the larger the fractal dimension), the larger the leak rate.
It is noted from Figure 6d that the leakage experiment results are smaller than the calculation results obtained from the model. Test piece No. 4 was processed with turning, and the surface was covered with spiral grooves, for which reason the surface cannot be described by the fractal theory, and consequently the theoretical model is not applicable any more. The fact that the experimental results are lower than the results obtained from the model indicates that, for the same surface roughness, the performance of sealing surfaces with spiral grooves is better than that of evenly distributed rough surfaces.
4.2. Effect of Sealing Device Parameters on Leak Rate
In this section, by combining the single-factor comparison experiment with the leak rate prediction model [18], the effects of the three sealing device parameters, i.e., gasket (metal) contact load, fluid pressure, and apparent surface size, on the leak rate were analyzed. Experimental and calculation parameters are shown in Table 1 and Table 2.
4.2.1. Effect of Sealing Surface Contact Load on Leak Rate
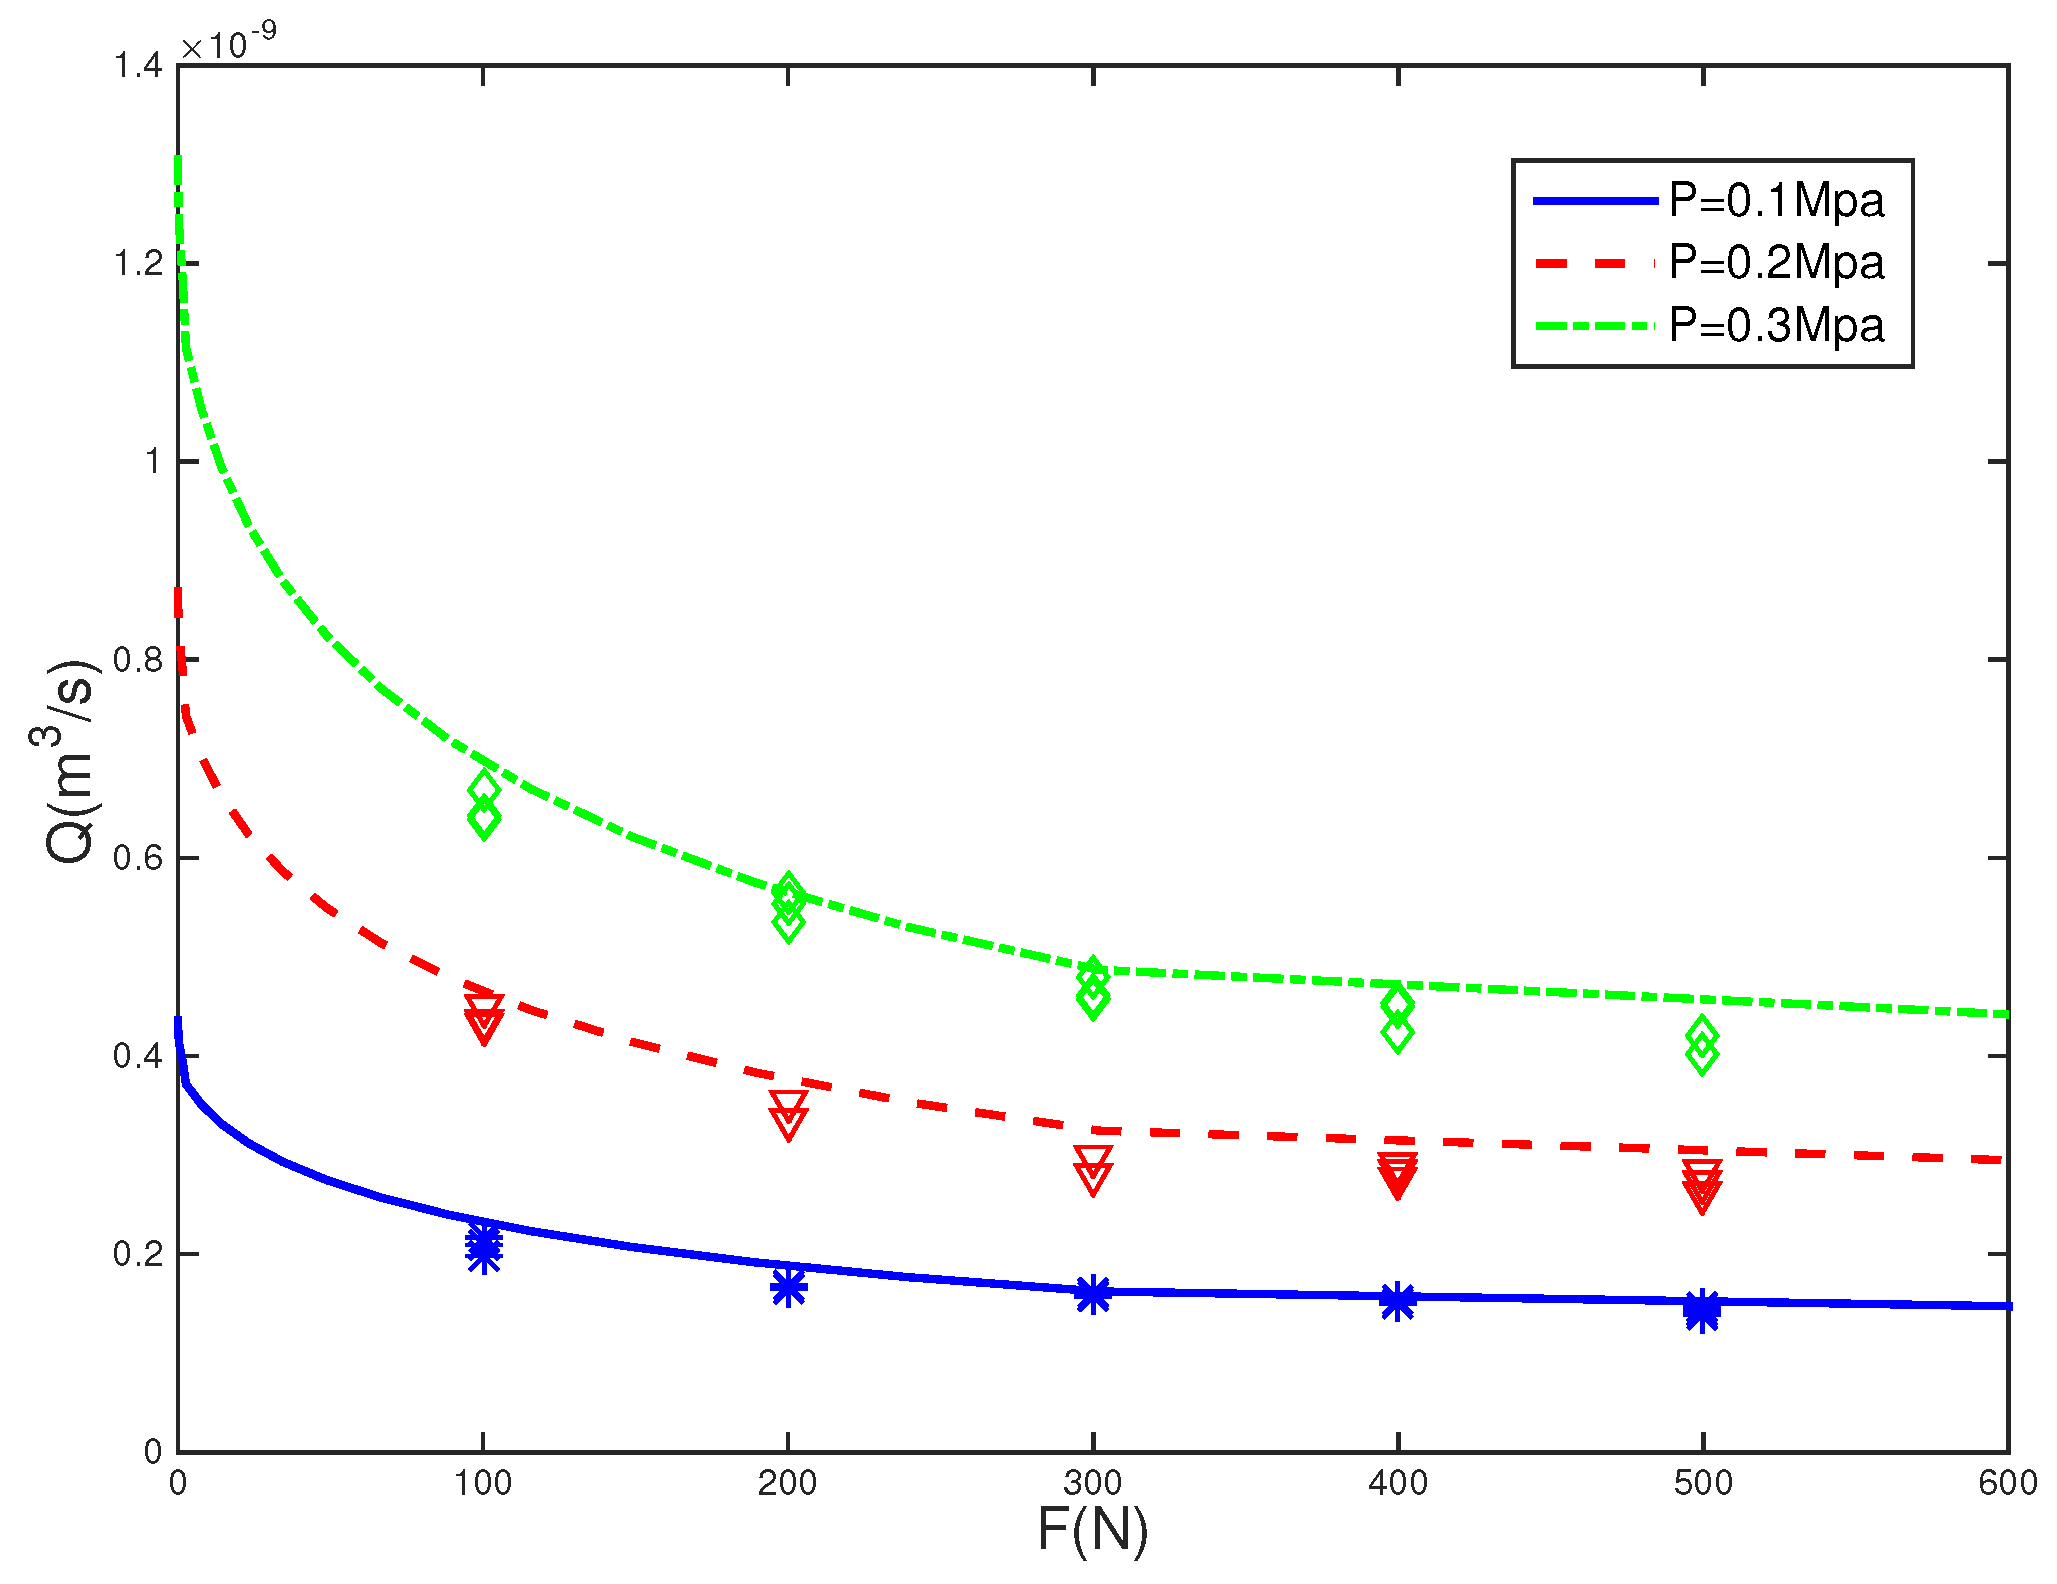
As seen in Figure 7, the variation rules of the leak rate with the contact load were compared by setting the fluid pressure to 0.1 MPa (with the dash line denoting the calculation results obtained from the theoretical model, and the asterisks denoting the experimental data), 0.2 MPa (with the dotted line denoting the calculation results obtained from the theoretical model, and the triangles denoting the experimental data) and 0.3 MPa (with the dash-dotted line denoting the calculation results obtained from the theoretical model, and the prismatic marks denoting the experimental data) in the experiment. It is found that leak rate decreases with increasing contact load, as it decreases by m/s when contact load increases from 100 N to 200 N, and by /s when contact load increases from 400 N to 500 N. The results indicate that, with increasing contact load, the change rate of the leak rate gradually decreases, and eventually stabilizes so that, in the case of a high contact load (depending on the surface characteristics), the contact load impact on the leak rate is negligible.
4.2.2. Effect of Fluid Pressure on Leak Rate
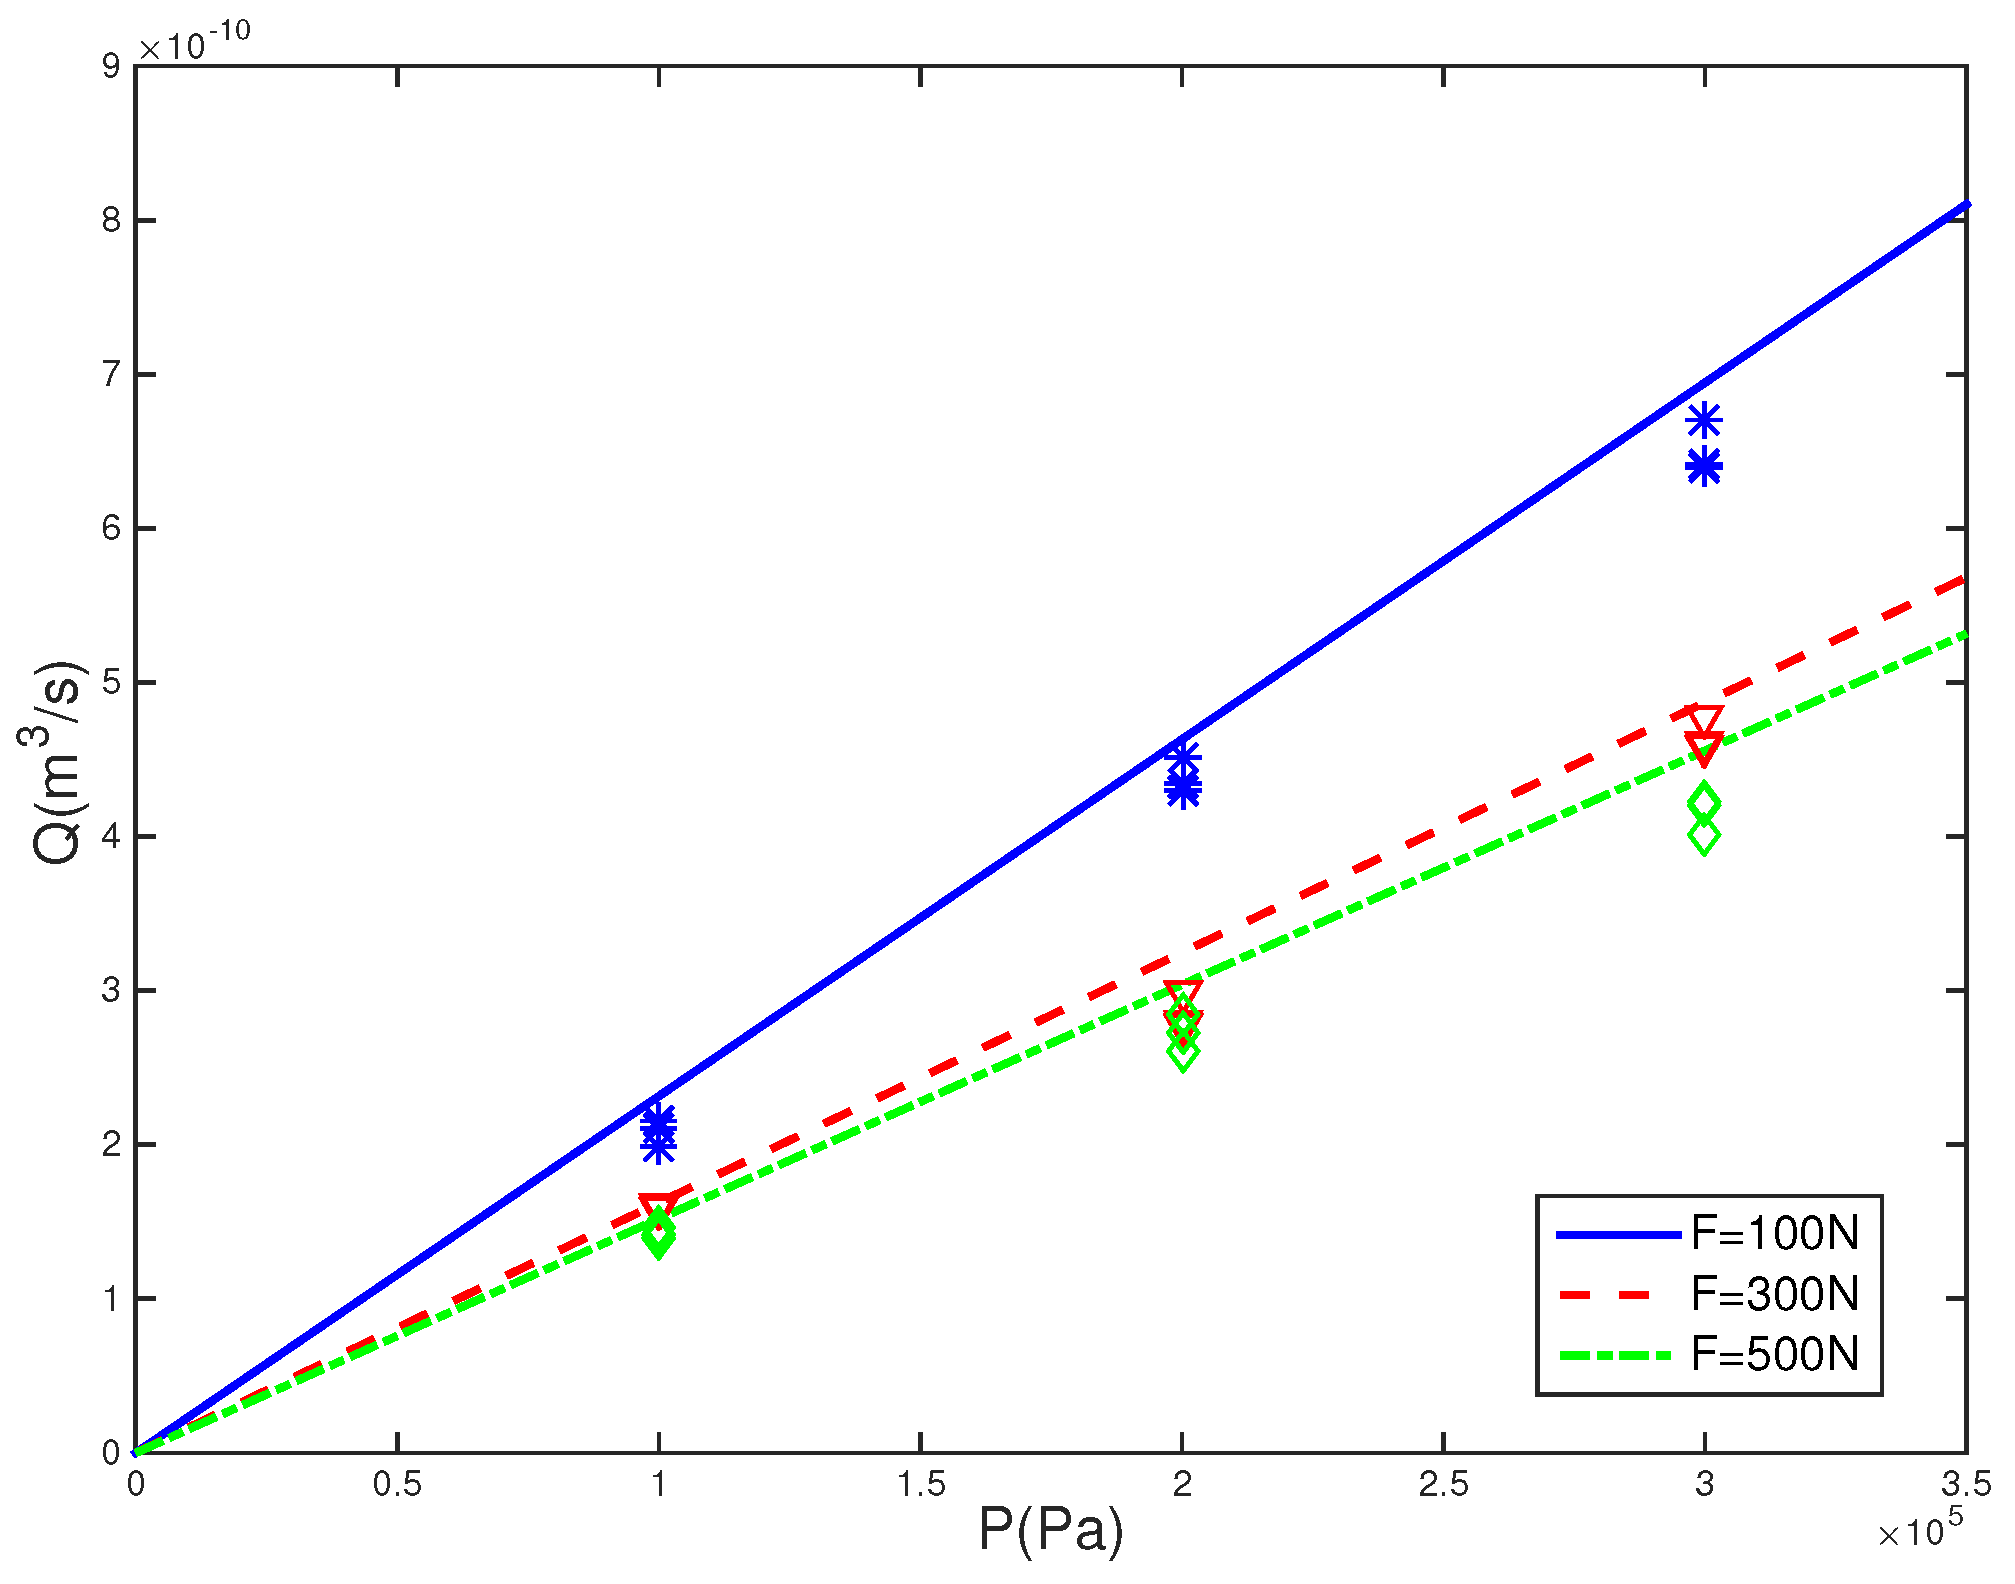
As shown in Figure 8, the variation rules of the leak rate with the fluid pressure were compared by setting the contact load to 100 N (with the dash line denoting the calculation results obtained from the theoretical model, and the asterisks denoting the experimental data), 300 N (with the dotted line denoting the calculation results obtained from the theoretical model, and the triangles denoting the experimental data) and 500 N (with the dash-dotted line denoting the calculation results obtained from the theoretical model, and the prismatic marks denoting the experimental data) in the experiment. It demonstrates that fluid pressure is positively correlated with leak rate. The change rate of the leak rate with fluid pressure (i.e., the slope of the dash line) is obviously larger under a contact load of 100 N than at 300 N or 500 N, indicating that, when the contact load is smaller (leak rate is larger), the effect of liquid pressure on leak rate is more substantial.
4.2.3. Effect of Size on Leak Rate
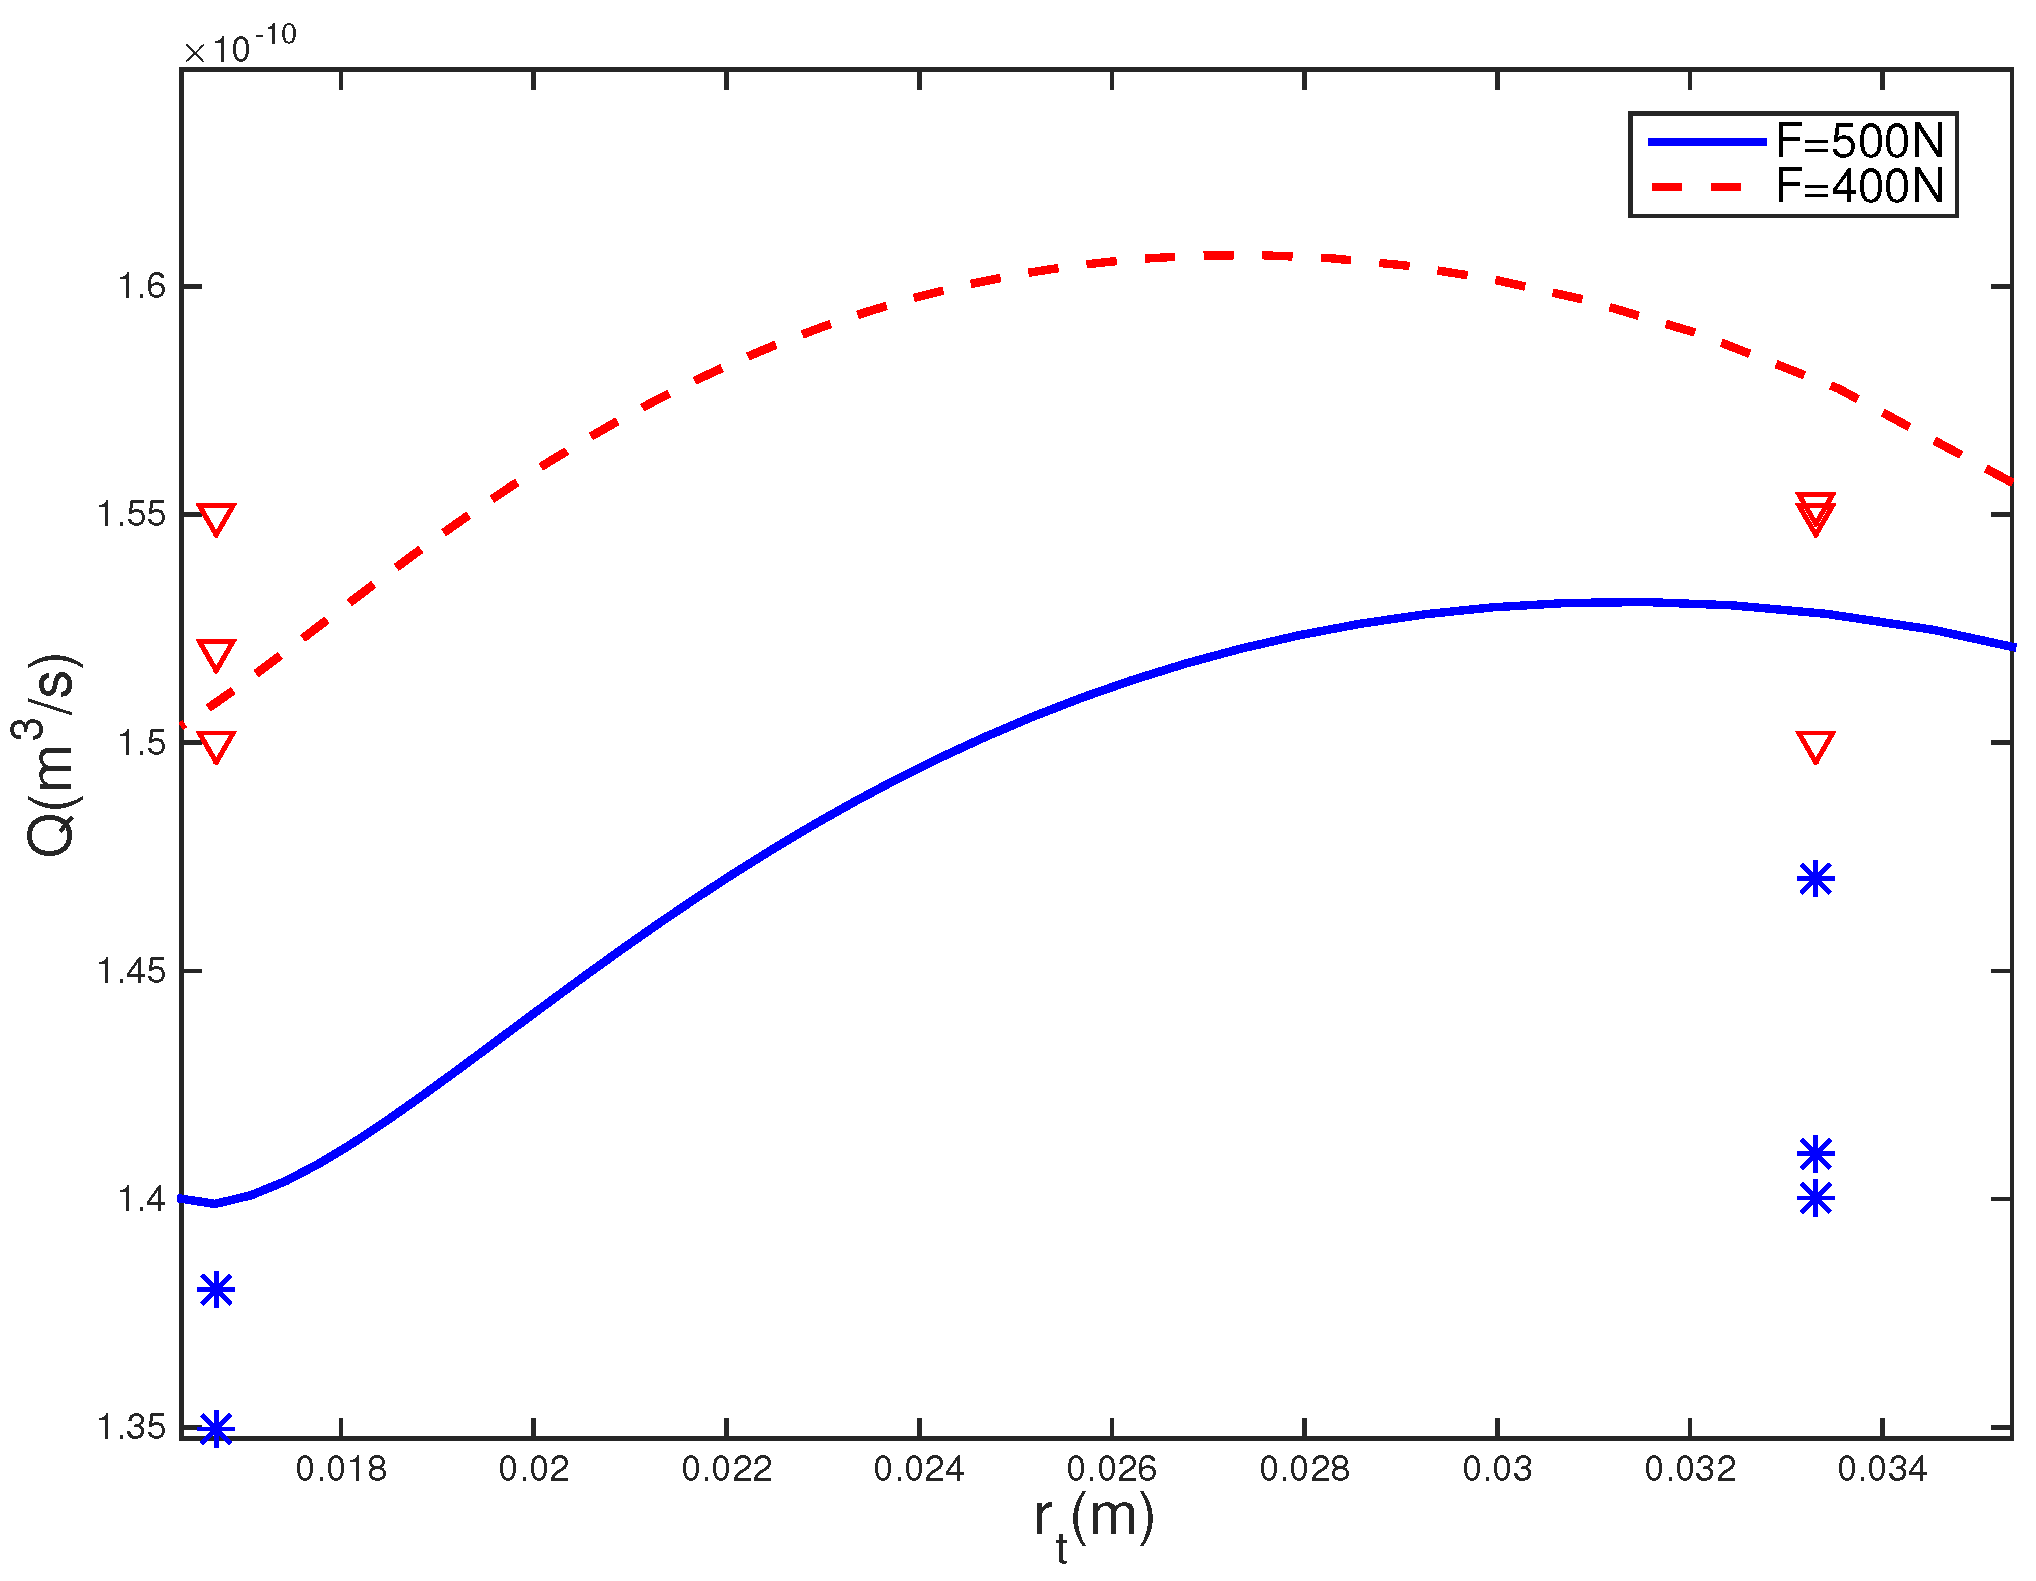
In the experiment, as shown in Figure 9, the inner radius of the gasket was fixed to 2.5 mm, while the outer radius of the gasket was changed. In addition, the contact load to 500 N (with the dash line denoting the calculation results obtained from the theoretical model, and the asterisks denoting the experimental data), 400 N (with the dotted line denoting the calculation results obtained from the theoretical model, and the triangles denoting the experimental data). For the contact load is 500 N, when the outer radius is less than 31 mm, the amount of deformation in the leakage channel plays a dominant role in the leak rate because, when the outer radius increases, the pressure per unit area decreases, resulting in a less compressed leakage channel, and consequently an increased leak rate. When the inner radius is larger than 31 mm, the length of the leakage channel instead plays a dominant role in the leak rate because, as the outer radius increases, the length of the leakage channel increases, resulting in a decreased leak rate. Our study shows that, for metal end face seals, when processing technology and structural strength satisfy the requirements, the smaller the outer diameter, the higher the sealing efficiency, which is consistent with engineering experience.
5. Conclusions
In this study, contact static seal was studied. A new seal leak rate measurement experimental device was built with a simpler structure. In the 120 min measurement, the leak rate measurement accuracy of the system could reach m/s. The device was able to control the following three operation parameters: the fluid pressure (0.01–1.5 MPa), the contact load (50–10,000 N), and the apparent contact area of the circular gasket (up to a radius of 50 mm). Using the device, experiments were carried out to study the effects of the sealing surface characteristics on the leakage, and the effects of the external factors of the sealing device on the leak rate. In addition, the practical application of the fractal surface leak rate prediction model was investigated and verified. The results showed that the model demonstrated a relatively high calculation accuracy for metal fractal surfaces, but was not suitable for use for non-metallic surfaces and surfaces that did not follow fractal properties (with spiral grooves). By combing the calculations from the theoretical model with the experimental verification, the following conclusions are obtained:
- Surface topography plays a decisive role in the order of magnitude of leak rate, which means that the roughness and the leak rate are positively correlated, i.e., the rougher the surface (the larger the fractal dimension), the larger the leak rate.
- The contact load and the leak rate are negatively correlated. In the case of a high contact load (depending on the surface characteristics), its impact on the leak rate is negligible.
- The smaller the leak rate, the smaller the effect of fluid pressure on sealing performance.
- When the requirements for the processing technology and structure are satisfied, in the case of the contact load is constant, the smaller the apparent contact area of the sealing device, the better the sealing performance.
The conclusions listed above help designers to further understand the leakage mechanism of the sealing interface, and provide theoretical support and experimental evidence for parameter-optimized design of seals.
Author Contributions
Q.Z., X.C. and Y.H. conceived and designed the experiments; Q.Z. and X.Z. performed the experiments; Q.Z. analyzed the data; Q.Z. and X.Z. wrote the paper.
Funding
This study is funded by the National Natural Science Foundation of China (No. 11702320).
Conflicts of Interest
The authors declare no conflict of interest.
References
- Goryacheva, I. Contact Mechanics in Tribology; Kluwer Academic Publishers: Dordrecht, The Netherlands, 1998. [Google Scholar]
- Rodriguez, P.; Markovitch, R. Space Station Freedom Seal Leakage Rate Analysis and Testing Summary: Air Leaks in Ambient Versus Vacuum Exit Conditions; NASA Marshall Space Flight Center: Huntsville, AL, USA, 1992. Available online: https://ntrs.nasa.gov/search.jsp?R=19930002961 (accessed on 18 July 2018).
- Liu, Y.; Wang, J.; Wang, W. Strain Behaviors of Seal Cone in Connection Pipeline for the Ultrahigh Pressure easurement. Equip. Manuf. Technol. 2015, 5, 4–6. [Google Scholar]
- Greenwood, J.; Williamson, J. Contact of nominally flat surfaces. Proc. R. Soc. A 1966, 295, 300–319. [Google Scholar] [CrossRef]
- Greenwood, J.; Tripp, J. The contact of two nominally flat rough surfaces. Proc. Inst. Mech. Eng. 1970, 185, 625–633. [Google Scholar] [CrossRef]
- Greenwood, J. A simplified elliptic model of rough surface contact. Wear 2006, 261, 191–200. [Google Scholar] [CrossRef]
- Berry, M.; Lewis, Z. On the Weierstrass-Mandelbrot fractal function. Proc. R. Soc. A 1980, 370, 459–484. [Google Scholar] [CrossRef]
- Jana, T.; Mitra, A.; Sahoo, P. Dynamic contact interactions of fractal surfaces. Appl. Surf. Sci. 2016, 392, 872–882. [Google Scholar] [CrossRef]
- Heinze, E. Besonderer BerÜcksichti- dung ihrer Verwendung im Kältema schinenbau. Kältetechnik 1949, 1, 26–32. [Google Scholar]
- Mayer, E. Mechanical Seals; Newnes Butterworth: London, UK, 1997. [Google Scholar]
- Lebeck, A.O. Hydrodynamic lubrication in wavy contacting face seals—A two dimensional model. J. Lubr. Technol. 1981, 103, 578–586. [Google Scholar] [CrossRef]
- Lebeck, A.O. Contacting mechanical seal design using a simple hydrostatic mode. Tribol. Int. 1988, 21, 2–14. [Google Scholar] [CrossRef]
- Persson, B.; Albohr, O.; Creton, C. Contact area between a viscoelastic solid and a hard, randomly rough, substrate. J. Chem. Phys. 2004, 120, 8779–9793. [Google Scholar] [CrossRef] [PubMed] [Green Version]
- Persson, B.N.; Yang, C. Theory of the leak-rate of seals. J. Phys. Condens. Matter 2008, 20, 315011. [Google Scholar] [CrossRef]
- Campañá, C.; Persson, B.; Müser, M. Transverse and normal interfacial stiffness of solids with randomly rough surfaces. J. Phys. Condens. Matter 2011, 23, 085001. [Google Scholar] [CrossRef] [PubMed]
- Lorenz, B.; Persson, B.N. Leak rate of seals: Comparison of theory with experiment. Europhys. Lett. 2009, 86, 44006. [Google Scholar] [CrossRef] [Green Version]
- Majumdar, A.; Bushan, B. Fractal model of elastic-plastic contact between rough surfaces. J. Tribol. 1991, 113, 1–11. [Google Scholar] [CrossRef]
- Zhang, Q.; Chen, X.; Huang, Y.; Chen, Y. Fractal modeling of fluidic leakage through metal sealing surfaces. AIP Adv. 2018, 8, 045310. [Google Scholar] [CrossRef]
- Yanagisawa, T.; Sanada, M.; Komiya, M.; Tanoue, H.; Hirabayashi, H. Fundamental Study of the Sealing Performance of a C-Shaped Metal Seal. In Proceedings of the 2nd Inter-national Symposium on Fluid Sealing, Nashville, TN, USA, 17–21 June 1990; pp. 18–20. [Google Scholar]
- Yanagisawa, T.; Sanada, M.; Koga, T.; Hirabayashi, H. The Influence of Designing Factors on the Sealing Performance of C-Seal. SAE Trans. 1991, 27, 178–182. [Google Scholar]
- Matsuzaki, Y.; Kazamaki, T. Effect of Surface Roughness on Com-pressive Stress of Static Seals. JSME Int. J. 1988, 3, 99–106. [Google Scholar]
- Matsuzaki, Y.; Hosokawa, K.; Funabashi, K. Effect of Surface Roughness on Contact Pressure of Static Seals. JSME Int. J. 1992, 3, 470–476. [Google Scholar]
- Marie, C.; Lasseux, D. Experimental Leak-Rate Measurement Through a Static Metal Seal. J. Fluid. Eng. 2007, 5, 799–805. [Google Scholar] [CrossRef]
- Ausloos, M.; Berman, D. A Multivariate Weierstrass-Mandelbrot Function. Proc. Roy. Soc. 1985, 400, 331–350. [Google Scholar] [CrossRef]
- Yan, W.; Komvopoulos, K. Contact analysis of elastic-plastic fractal surfaces. J. Appl. Phys. 1998, 84, 3617–3624. [Google Scholar] [CrossRef]
- Li, J.; Tang, Y.; Li, Z.; Ding, X.; Li, Z. Study on the optical performance of thin-film light-emitting diodes using fractal micro-roughness surface model. Appl. Surf. Sci. 2017, 410, 60–69. [Google Scholar] [CrossRef]
- Yu, B.; Li, J. Some Fractal Characters of Porous Media. Fractals 2001, 9, 365–372. [Google Scholar] [CrossRef]
- Yu, B.; Cheng, P. A Fractal Permeability Model for Bi-Dispersed Porous Media. Int. J. Heat Mass Transf. 2002, 45, 2983–2993. [Google Scholar] [CrossRef]
- Zheng, Q.; Xu, J.; Yang, B.; Yu, B. A fractal model for gaseous leak rates through contact surfaces under non-isothermal condition. Appl. Therm. Eng. 2013, 52, 54–61. [Google Scholar] [CrossRef]
- Yu, B. Fractal Porous Media Transport Physics; Science Press: Beijing, China, 2014. [Google Scholar]
Figure 1.
Schematic of the ring gasket leak rate prediction model.

Figure 2.
Schematic of the measurement setup.

Figure 3.
Photographs of the four test pieces: (a) Test piece 1; (b) Test piece 2; (c) Test piece 3; and (d) Test piece 4.
Figure 3.
Photographs of the four test pieces: (a) Test piece 1; (b) Test piece 2; (c) Test piece 3; and (d) Test piece 4.
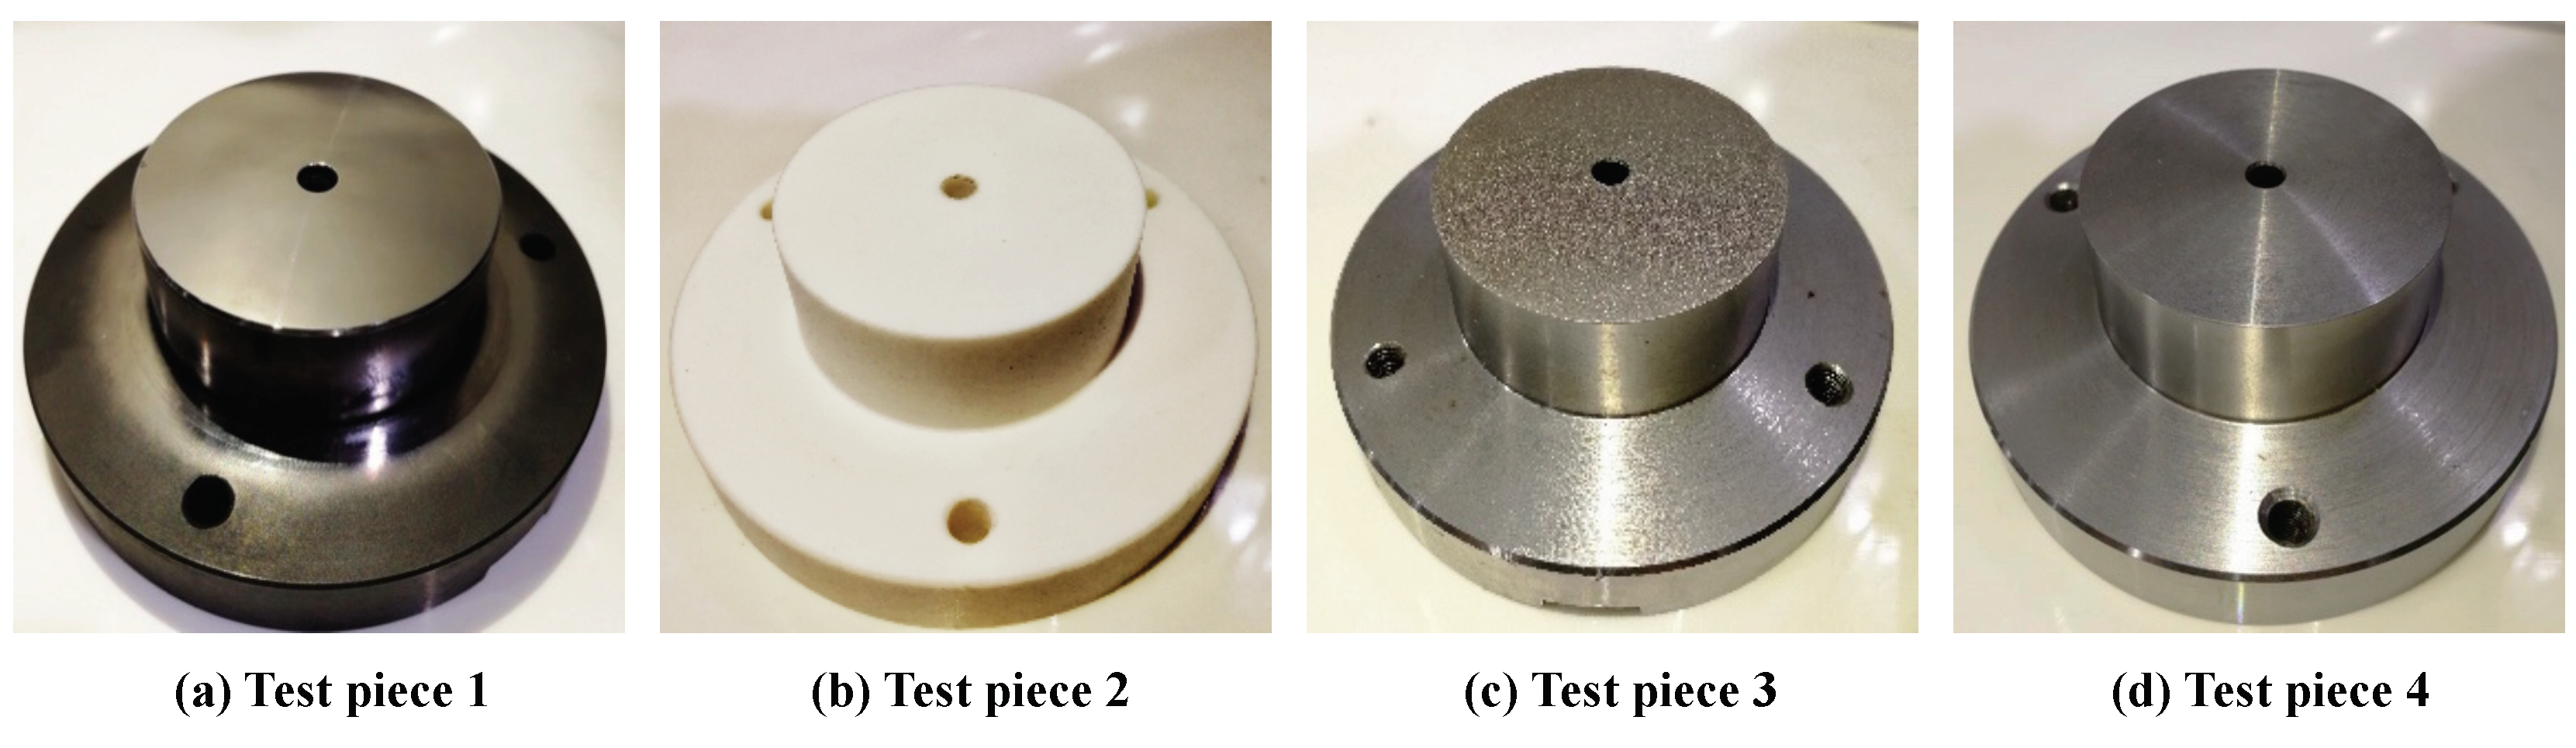
Figure 4.
The cross-sectional profile of the four test pieces.
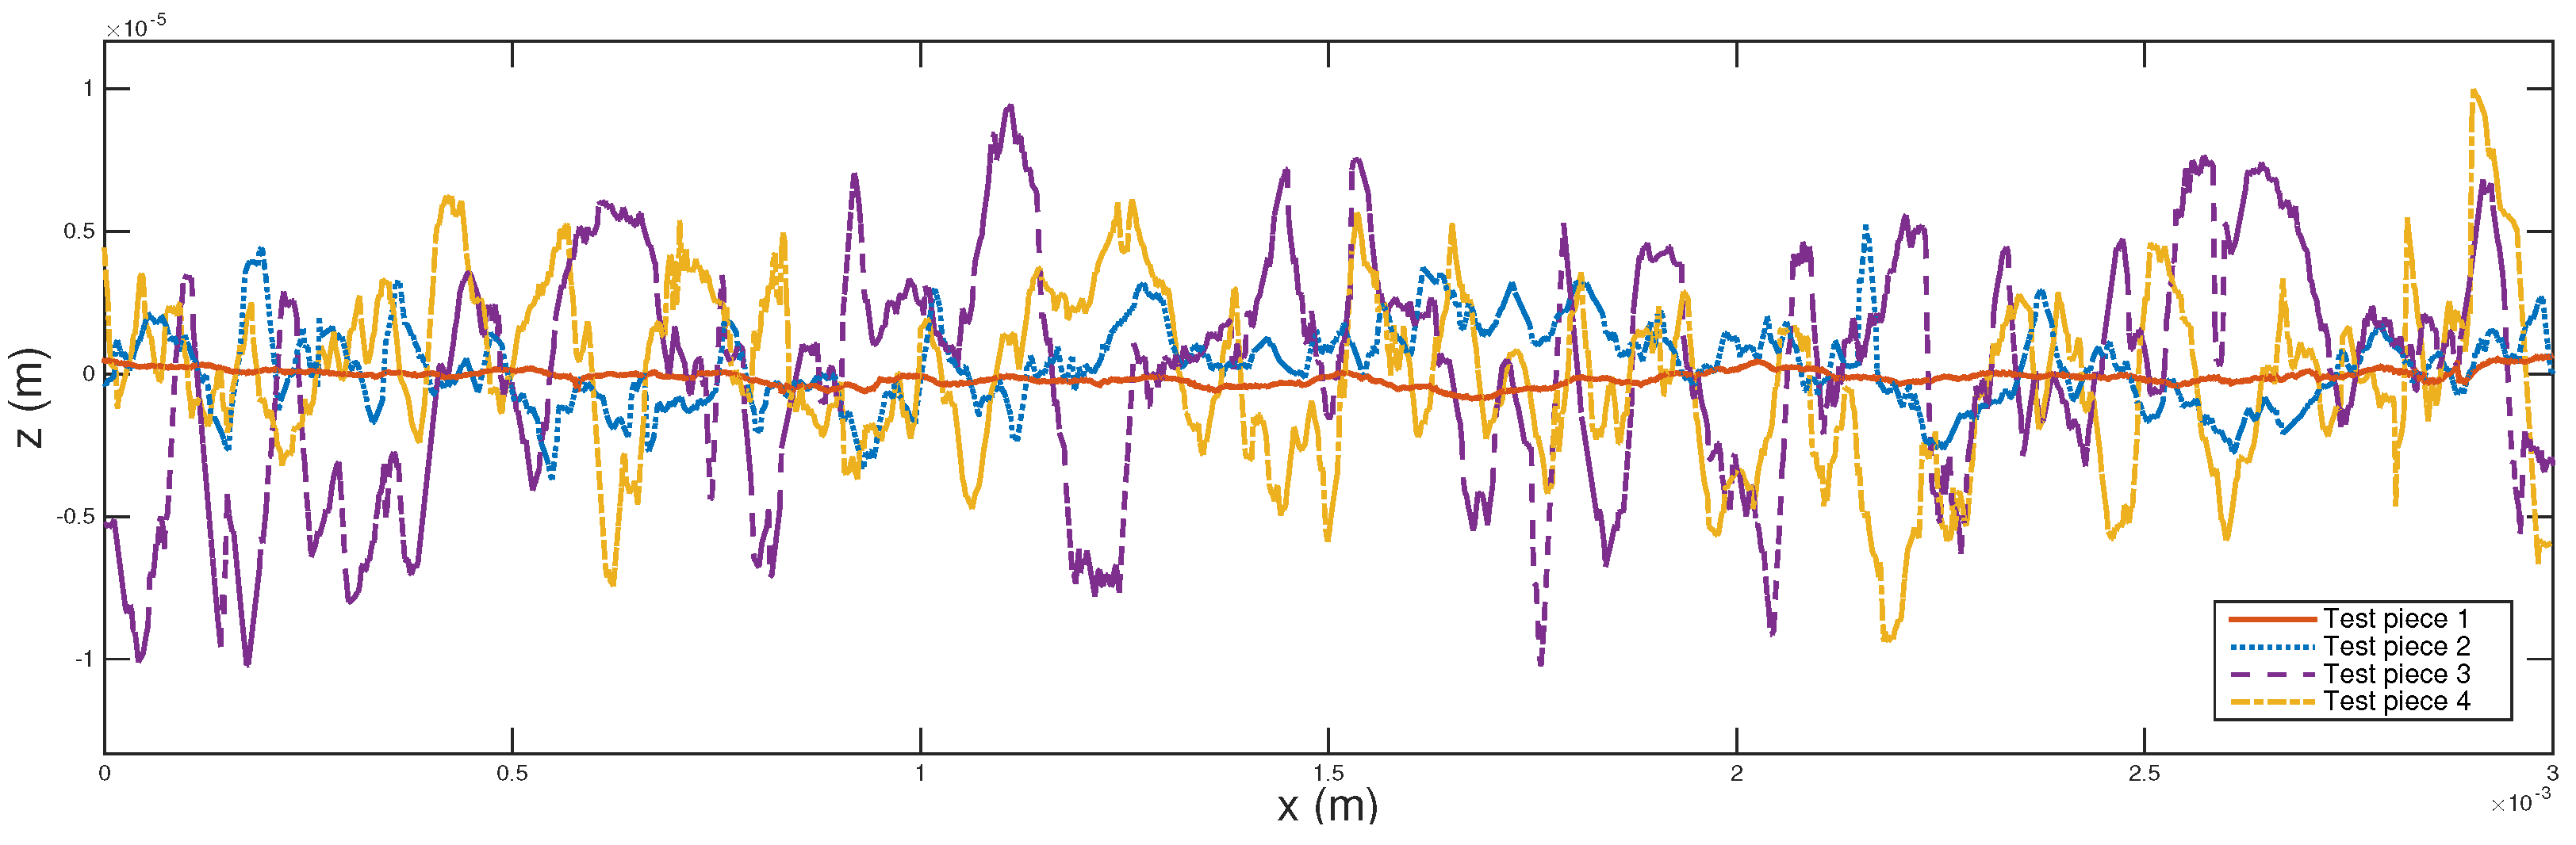
Figure 5.
Fractal theory characterization of the sample sealing surface. (a) The logarithmic relationship between the structure function and the scale obtained from one set of sample cross-sectional profile data. (b) The cross-sectional profile of sealing surface, and the blue line and the red line denote the fitted profile (AB model) and the measured profile (experiment data), respectively. (c) The fitted three-dimensional sealing surface.
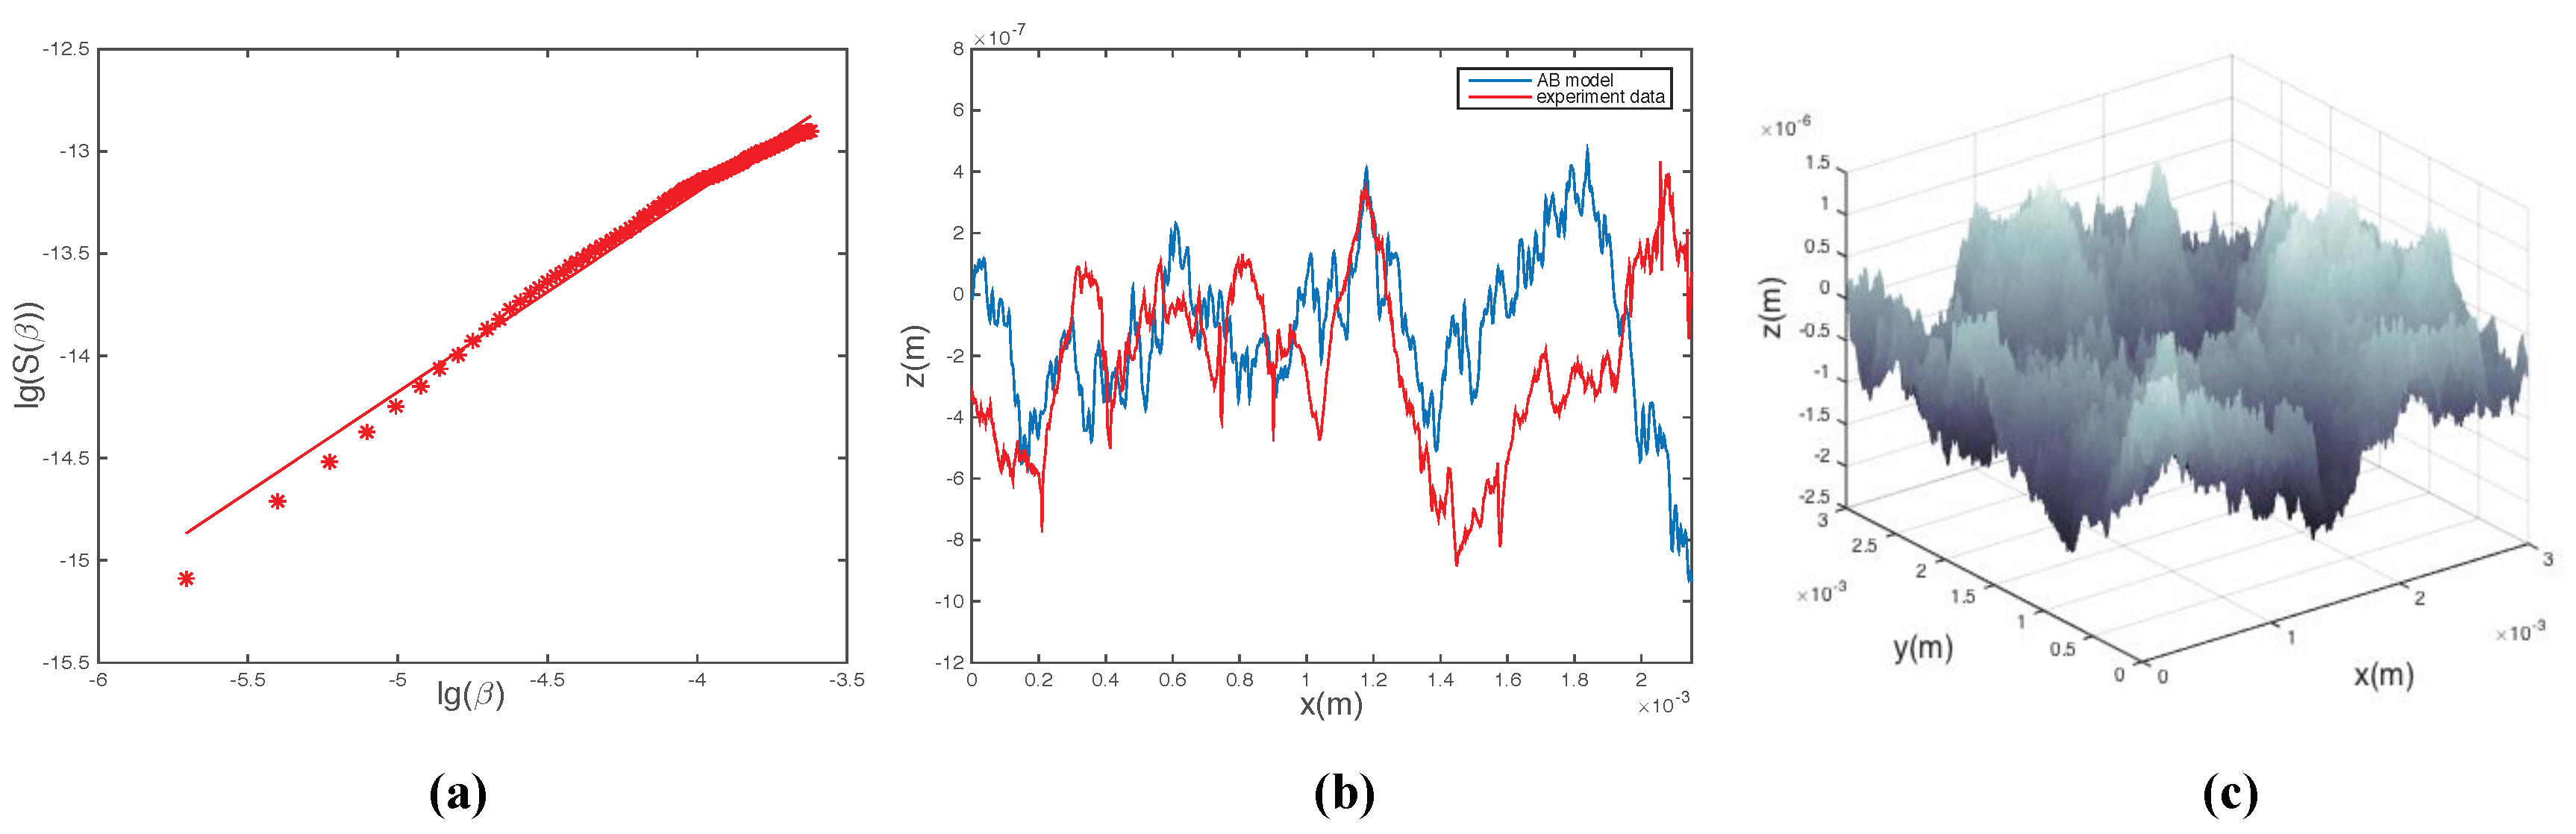
Figure 6.
The leak rate versus the contact load through the four test pieces: (a) Test piece 1; (b) Test piece 2; (c) Test piece 3; and (d) Test piece 4.
Figure 6.
The leak rate versus the contact load through the four test pieces: (a) Test piece 1; (b) Test piece 2; (c) Test piece 3; and (d) Test piece 4.
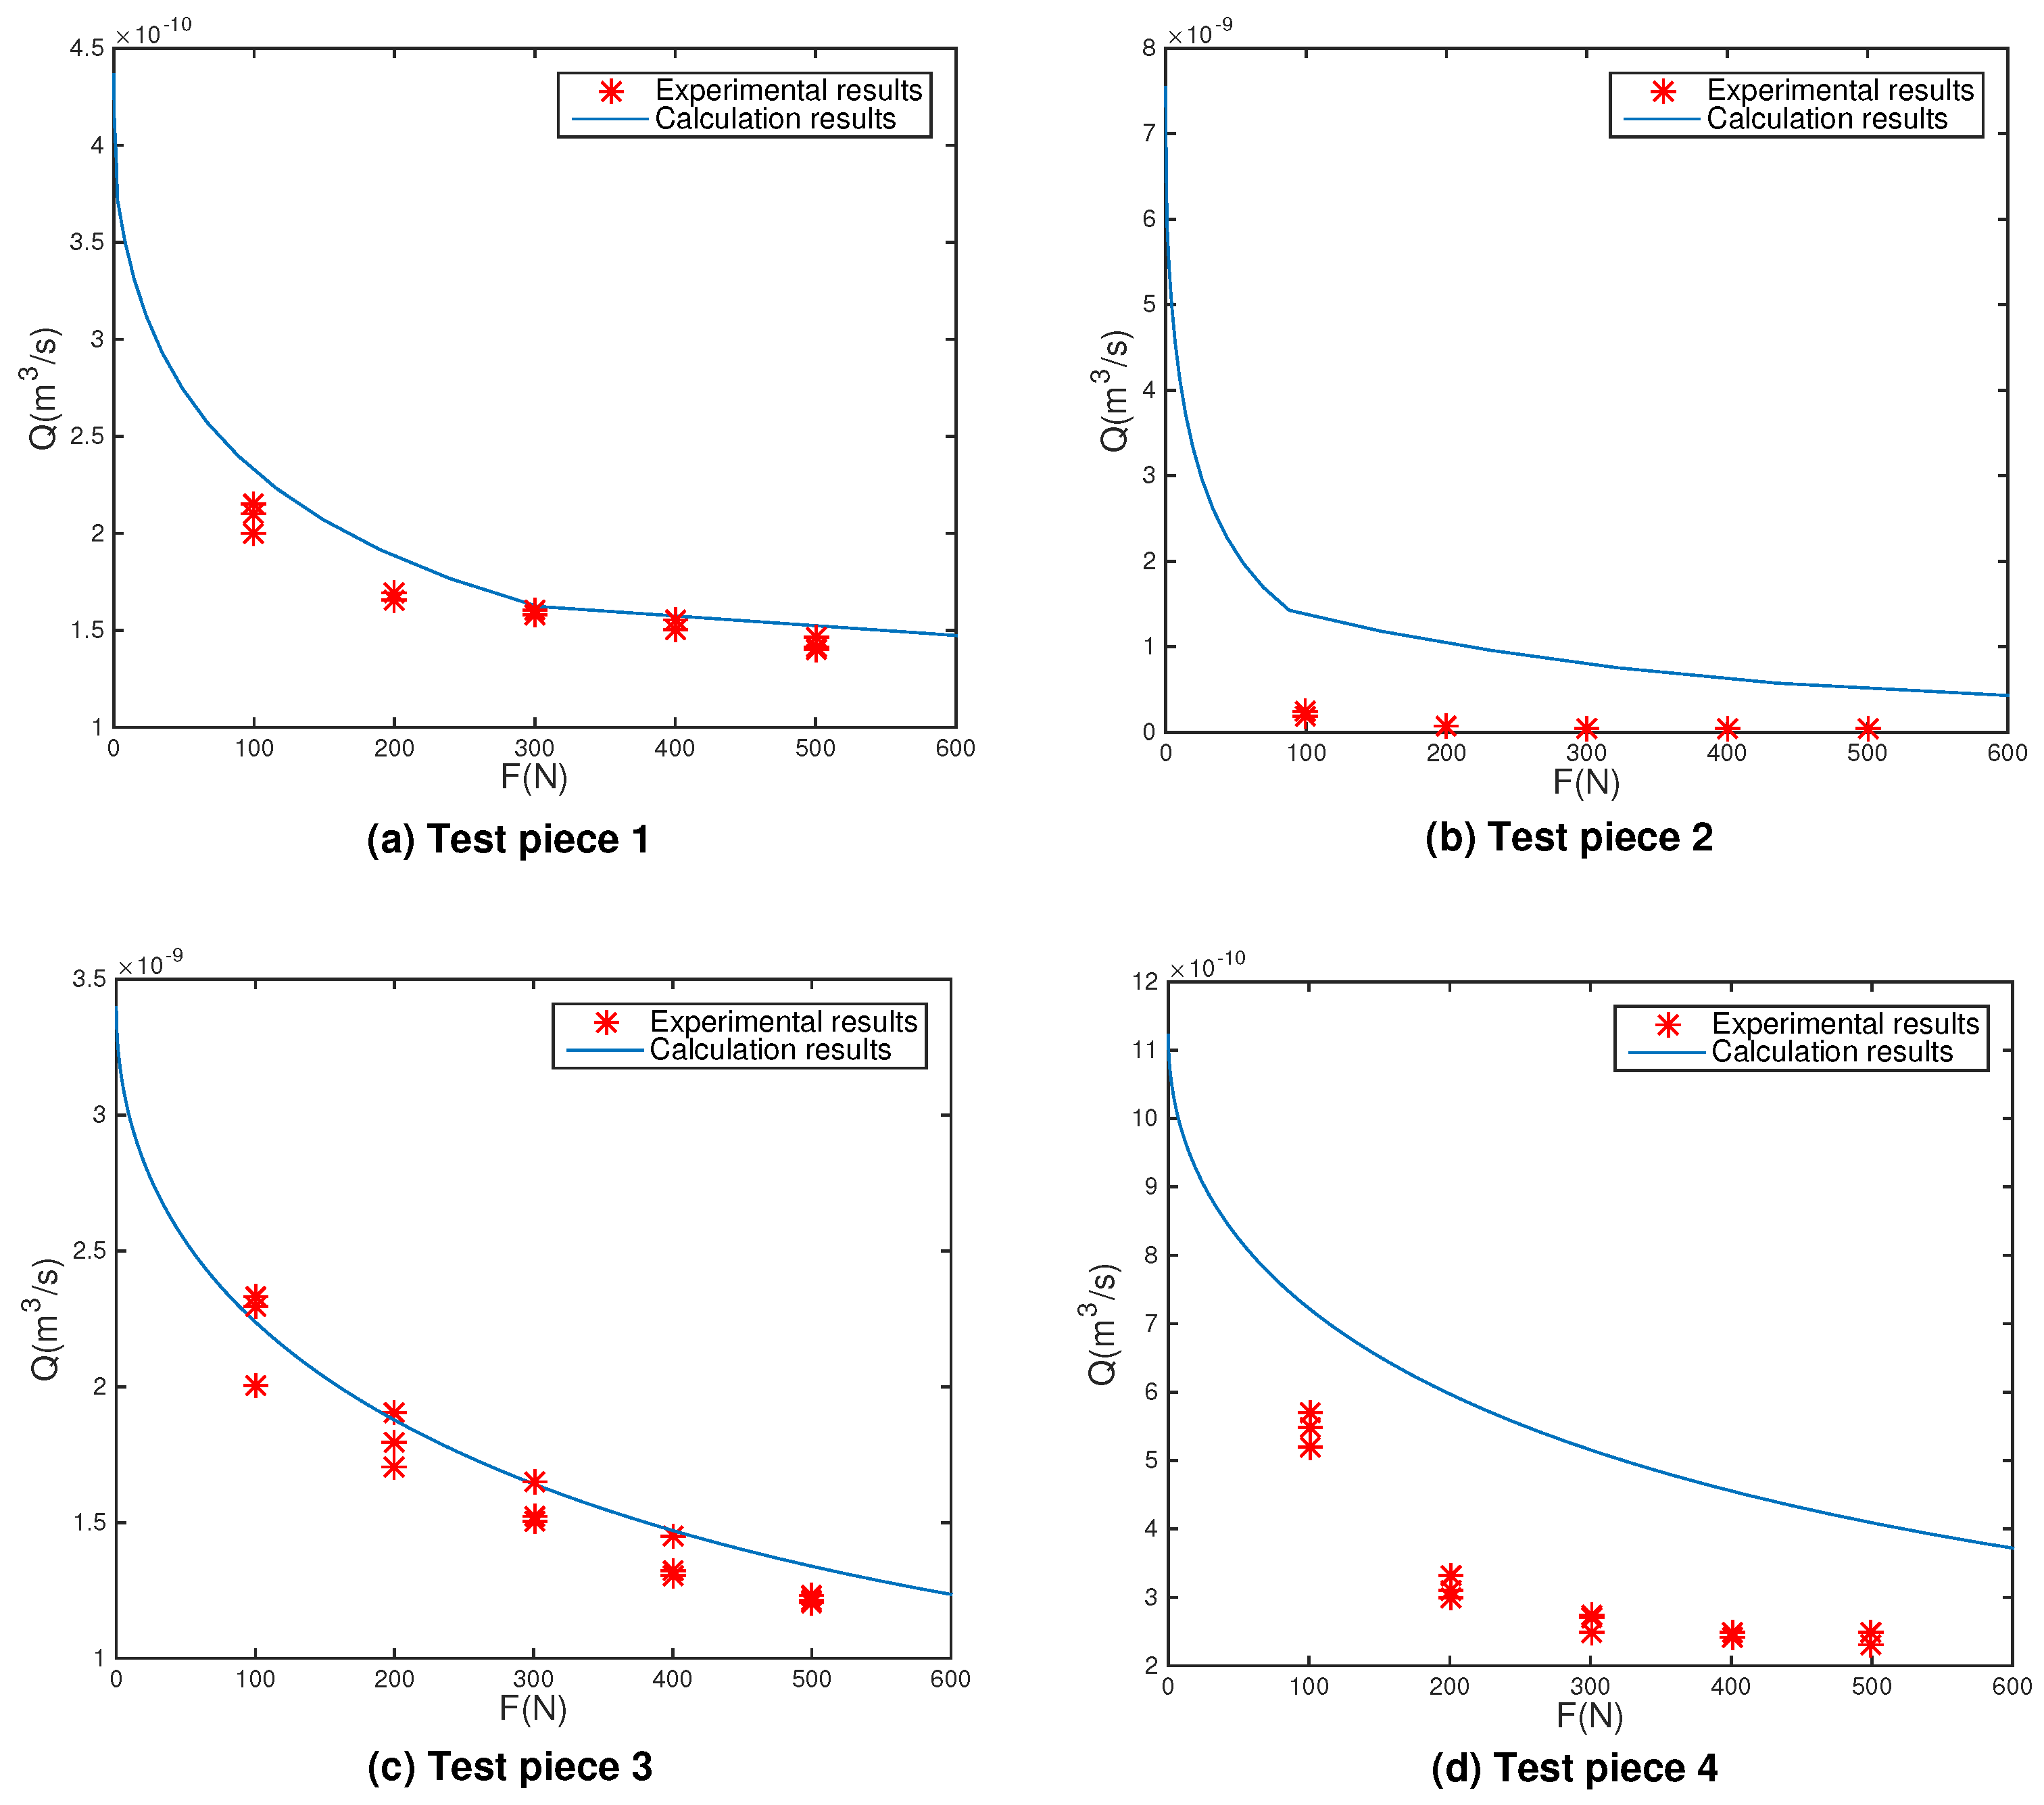
Figure 7.
The leak rate versus the contact load through the fluid pressure for three values.
Figure 8.
The leak rate versus the fluid pressure through the contact load for three values.
Figure 9.
The leak rate versus the outer radius of the gasket.

Table 1.
Material and surface topography parameters of the test pieces.
| Material | No. 2 | Material Parameters | Measurement Parameters of Surface Topography | |||||
|---|---|---|---|---|---|---|---|---|
| Elastic Modulus | Poisson’s Ratio | Hardness | Process | D | G | Ra | ||
| Mold steel skd11 | 1 | 210 GPa | 0.3 | 850 MPa | Forging | 1.51 | 6.59 × 10 | 0.3 |
| PTFE | 2 | 1.42 GPa | 0.4 | 4.54 MPa | Turning | 1.46 | 8.28 × 10 | 1.3 |
| Stainless steel | 3 | 195 GPa | 0.3 | 187 MPa | EDM | 1.35 | 1.87 × 10 | 3.7 |
| Stainless steel | 4 | 195 GPa | 0.3 | 187 MPa | Fine | X: 1.42 Y: 1.47 | X: 2.98 × 10 Y: 3.81 × 10 | 2.5 |
Table 2.
Designed parameters for the contrast experiment.
| Test Piece | Contact Load (N) | Gas Pressure (MPa) | Silicon Wafer Diameter (mm) |
|---|---|---|---|
| Test piece No. 1 | 100, 200, 300, 400, 500 | 0.1, 0.2, 0.3 | 33.3, 66.7 |
| Test piece No. 2 | 0.1 | 66.7 | |
| Test piece No. 3 | 0 | ||
| Test piece No. 4 | 0 |
© 2018 by the authors. Licensee MDPI, Basel, Switzerland. This article is an open access article distributed under the terms and conditions of the Creative Commons Attribution (CC BY) license (http://creativecommons.org/licenses/by/4.0/).
Share and Cite
MDPI and ACS Style
Zhang, Q.; Chen, X.; Huang, Y.; Zhang, X. An Experimental Study of the Leakage Mechanism in Static Seals. Appl. Sci. 2018, 8, 1404. https://doi.org/10.3390/app8081404
AMA Style
Zhang Q, Chen X, Huang Y, Zhang X. An Experimental Study of the Leakage Mechanism in Static Seals. Applied Sciences. 2018; 8(8):1404. https://doi.org/10.3390/app8081404
Chicago/Turabian StyleZhang, Qiang, Xiaoqian Chen, Yiyong Huang, and Xiang Zhang. 2018. "An Experimental Study of the Leakage Mechanism in Static Seals" Applied Sciences 8, no. 8: 1404. https://doi.org/10.3390/app8081404
Note that from the first issue of 2016, this journal uses article numbers instead of page numbers. See further details here.