Experimental Analysis of Pore and Permeability Characteristics of Coal by Low-Field NMR


1
Institute of Resources and Environment, Henan Polytechnic University, Jiaozuo 454000, China
2
Collaborative Innovation Center of Coalbed Methane and Shale Gas for Central Plains Economic Region, Jiaozuo 454000, China
*
Author to whom correspondence should be addressed.
Appl. Sci. 2018, 8(8), 1374; https://doi.org/10.3390/app8081374
Submission received: 21 July 2018
/
Revised: 8 August 2018
/
Accepted: 10 August 2018
/
Published: 15 August 2018
(This article belongs to the Special Issue Nanotech for Oil and Gas)
Abstract
:On the basis of the complexity of the pore structure characteristics of a coal reservoir, coal samples with different ranks were selected to study the difference in pore structures and permeability using nuclear magnetic resonance (NMR), scanning electron microscopy (SEM), mercury intrusion porosimetry (MIP), and permeability measurement. Porosity and pore size distribution (PSD) above 20 nm can be analyzed by the improved NMR equation, and the results were basically consistent with that of SEM and MIP. The NMR spectra of the coal samples from the same location were close, but the difference between the coal samples from different locations was quite large, which indicated that the heterogeneity of a coal reservoir was strong. An empirical equation of movable fluid porosity was proposed, which can be used to evaluate the fluid migration characteristics of the coal reservoir, and the porosity of movable fluid mainly came from the contribution of fissures and micro-fissures. The average movable fluid porosity of the coal samples from the Chengzhuang (CZ) coal mine, Wuyang (WY) coal mine, and Yujialiang (YJL) coal mine was 1.37%, 0.67%, and 4.26%, respectively. Although the permeability is related to the NMR porosity and movable fluid porosity, it was difficult to establish a widely used mathematical equation correlating permeability and porosity based on the experimental data.
1. Introduction
Coalbed methane (CBM), as a type of clean and efficient unconventional energy, is mainly adsorbed in the coal matrix micropores. A coal reservoir is composed of the coal matrix, various scales, and morphological pores and fissures. To describe the migration and output of CBM, some scholars have put forward the triple-porosity/dual-permeability geological model and divided the pores and fissures of coal into adsorption pores, diffusion pores, seepage pores, and fissures. It is generally accepted that the CBM is mainly adsorbed on the micropores surface, diffuses through the mesopores, then flows continuously to the fissures through macropores and micro-fissures, and finally gets to the well bore in the CBM production [1].
The fine characterization of the pore structure plays an important role in coal reservoir research and CBM productivity evaluation. For coal, as a typical porous material, there are many test methods for studying the pore structure. They are divided into three types: fluid injection, image observation, and physical detection. Fluid injection is to study the structure information, such as volume, specific surface area, and fractal dimension of pores in different scales, in coal with fluid molecules, in which mercury intrusion porosimetry (MIP) and gas adsorption are the most commonly used methods [2,3]. Image observation is to observe the morphology, size, and distribution of the pores in coal using an optical microscope (OM), scanning electron microscopy (SEM), and transmission electron microscope (TEM) [4,5]. Physical detection is to analyze and recognize three-dimensional pore structures in coal by receiving the feedback signal of the external magnetic field or ray, including nuclear magnetic resonance (NMR), computed tomography (CT), and small angle X-ray scattering (SAXS) [6,7,8].
Fluid injection can only detect open pores, ignoring the closed pores information. Image observation has higher requirements for sample pretreatment, and the statistical data of the micro-local pores structure cannot fully represent the pores structure parameters in the whole coal. The above two methods generally use powdered or small bulk coal samples, which can only obtain the distribution information of pores smaller than the sample size. However, NMR has the advantages of fast, convenient, non-destructive, and multi-scale pore information representation, and it can be used to analyze the pores in different scale samples, such as laboratory samples and strata in drilling. At first, NMR was used to analyze the fluid composition and pore structure of the conventional reservoir and to determine the reservoir permeability, which was used to analyze the physical parameters of the coal reservoir in recent years [9,10]. NMR usually uses the transverse relaxation time (T2) to analyze the pore size distribution (PSD). The pores corresponding to the T2 peaks are divided into adsorption pores, seepage pores, and fissures by Yao et al. [11] and Cai et al. [12]. They think that the patterns of unimodal, bimodal, and multi-peak in the T2 spectra represent different pore types and PSD, and the pore characteristics of NMR were compared with those of MIP and CT scanning [13,14].
Most of the previous research calculates the PSD and permeability based on the inversion analysis of the NMR signals of the saturated and centrifugal coal samples. The structure, distribution, and connectivity of pores in different mining areas and in different ranks of coal are different, and the centrifugal force, T2 cutoff value (T2C), and its corresponding size in centrifuge experiments with different coal samples are also different. Therefore, the PSD of different coal samples cannot be calculated according to the constant T2C. The movable fluid porosity cannot be obtained directly by using the T2 spectra in the logging process. In general, it is necessary to determine the value of T2C by a centrifugal experiment and then calculate the fluid porosity, which requires drilling cores and a series of laboratory work. Some scholars have established many models of permeability and porosity, and the scope of application of these models is very limited, so it is very important to establish a widely and easily calculated equation [11,15,16].
In this paper, 8 coal samples with different coal ranks were selected, and the low-field NMR tests were carried out for the fully dried, saturated water and centrifugal coal samples. At the same time, MIP, SEM, and pulse-decay-permeability tests were carried out, the variation of the T2 spectra of the different coal samples were analyzed, and the classification of the pores and fissures in the coal were divided based on the shape of the T2 spectra. Based on the experimental data of porosity and permeability, the accuracy and applicability of the different permeability calculation models were analyzed and validated.
2. Coal Samples and Experiments
2.1. Sample Description
Coal samples were collected from Jincheng, Luan, and Yulin mining areas of China. The block raw coals were sampled in mining face and heading face. The coal cores were drilled along the bedding or vertical direction to obtain a cylindrical coal sample with a diameter of 25 mm and a length of about 50 mm, which was used for the NMR scanning and permeability test (Figure 1). After the above tests, the cores were crushed, sieved, and made into 3–6 mm, larger than 80-mesh samples, respectively, for the MIP test and proximate analysis.
The vitrinite reflectance measurement was performed using a Zeiss Axioskop-40 polarizing microscope (Zeiss, Oberkochen, Germany), according to the Chinese standard of GB/T 6948-2008 [17]. The proximate analysis was performed using the Automatic Proximate Analysis Instrument 5E-MAG6700 (Changsha Kaiyuan Instruments Co., Ltd., Changsha, China), according to the Chinese standard of GB/T212-2008 [18]. The test results and the physical properties of the coal samples are shown in Table 1.
In Table 1, CZ-1, CZ-2, and CZ-4 are the bedding coal samples from different layers in the No. 3 coal seam of the Chengzhuang (CZ) coal mine; CZ-3 is a vertical coal sample from the same layer as CZ-2. WY-1 and WY-2 are the bedding and vertical coal samples from the same layer of the Wuyang (WY) coal mine. YJL-1 and YJL-2 are the bedding and vertical coal samples from the same layer of the Yujialiang (YJL) coal mine. The maximum vitrinite reflectance of the samples is between 0.66% and 3.10%. The three kinds of coal samples of CZ, WY, and YJL belong to anthracite, lean coal, and long flame coal, respectively. The macrolithotype of the CZ and WY coal samples are mainly bright coal, followed by dull coal with vitrain strip. The macrolithotype of the YJL coal samples are mainly semi-dull coal, followed by semi-bright coal and dull coal and little vitrain strip.
2.2. Low-Field NMR Test
The NMR measurement was carried out using the MesoMR23-060H-I (NIUMAG Co., Ltd., Suzhou, China). The magnetic field intensity, resonance frequency, magnet temperature, probe coil diameter, waiting time, echo time, superposition times, and echo number of the NMR instrument were 0.52 ± 0.05 T, 24.68 MHz, 32.00 ± 0.02 °C, 25 mm, 3000 ms, 0.15 ms, 128 times, 10,000, respectively.
The NMR tests were conducted on the coal samples, which were dried, to different saturation degrees and on centrifugal samples under different centrifugal forces, to understand the NMR signals of various samples under different water contents. The dried coal samples preparation was as follows: coal samples were placed in a drying oven and dried for more than 48 h at 70 °C. The saturated coal samples preparation was as follows: the dried coal samples were evacuated, saturated in deionized water for 24 h under the negative pressure, and then saturated for about 100 h under 0.1 MPa. The centrifugal coal samples preparation was as follows: saturated coal samples were placed in the high-speed refrigeration then centrifuged at different rotational speeds. We recorded the coal samples’ weight before and after each centrifugation.
2.3. MIP, SEM, and Permeability Test
MIP, SEM, and permeability measurements were performed for all coal samples to understand the internal relationship between PSD and permeability. MIP was performed using an Autopore IV 9500 instrument (Micromeritics Instrument Co., Ltd., Norcross, GA, USA) by the GB/T21650.1-2008 [19]. The mercury injection pressure was 0.01–413.46 MPa, and the corresponding pore size was 130 μm to 3 nm. The size of coal samples used in the experiment was 3–6 mm.
The SEM test was carried out using a Quanta 250 field emission scanning electron microscope (FEI Company, Hillsboro, OR, USA). The coal samples were prepared by the PECS-II-685 argon ion polishing instrument (Gatan, Inc., Pleasanton, CA, USA). Pores and fissures larger than 20 nm on the coal surface can be observed.
The permeability test used pulse-decay permeability of PDP-200 (Core Laboratories, Tulsa, OK, USA), which is widely used in the permeability test of coal with low to ultra-low permeability. The measurements ranged from 10−5 mD to 10 mD. It is particularly worth noting that the experimental coal samples were dried with nitrogen as the working medium, and the permeabilities were tested at the same confining pressure and pore pressure of 2 MPa.
3. Discussion
3.1. Pore Type of NMR
3.1.1. Morphology and Variation of T2 Spectra
The T2 spectra of the saturated coal were closely related to PSD, so their morphological characteristics reflected pore structure, PSD, and connectivity. The T2 of the saturated coal sample was positively correlated with the pore size. The T2 spectra peaks indicated that the corresponding pores were more developed. The peak width reflected the PSD range, and it can reflect the flow characteristics of the fluid in the pores in comparison with the results of the centrifugal coal samples [20].
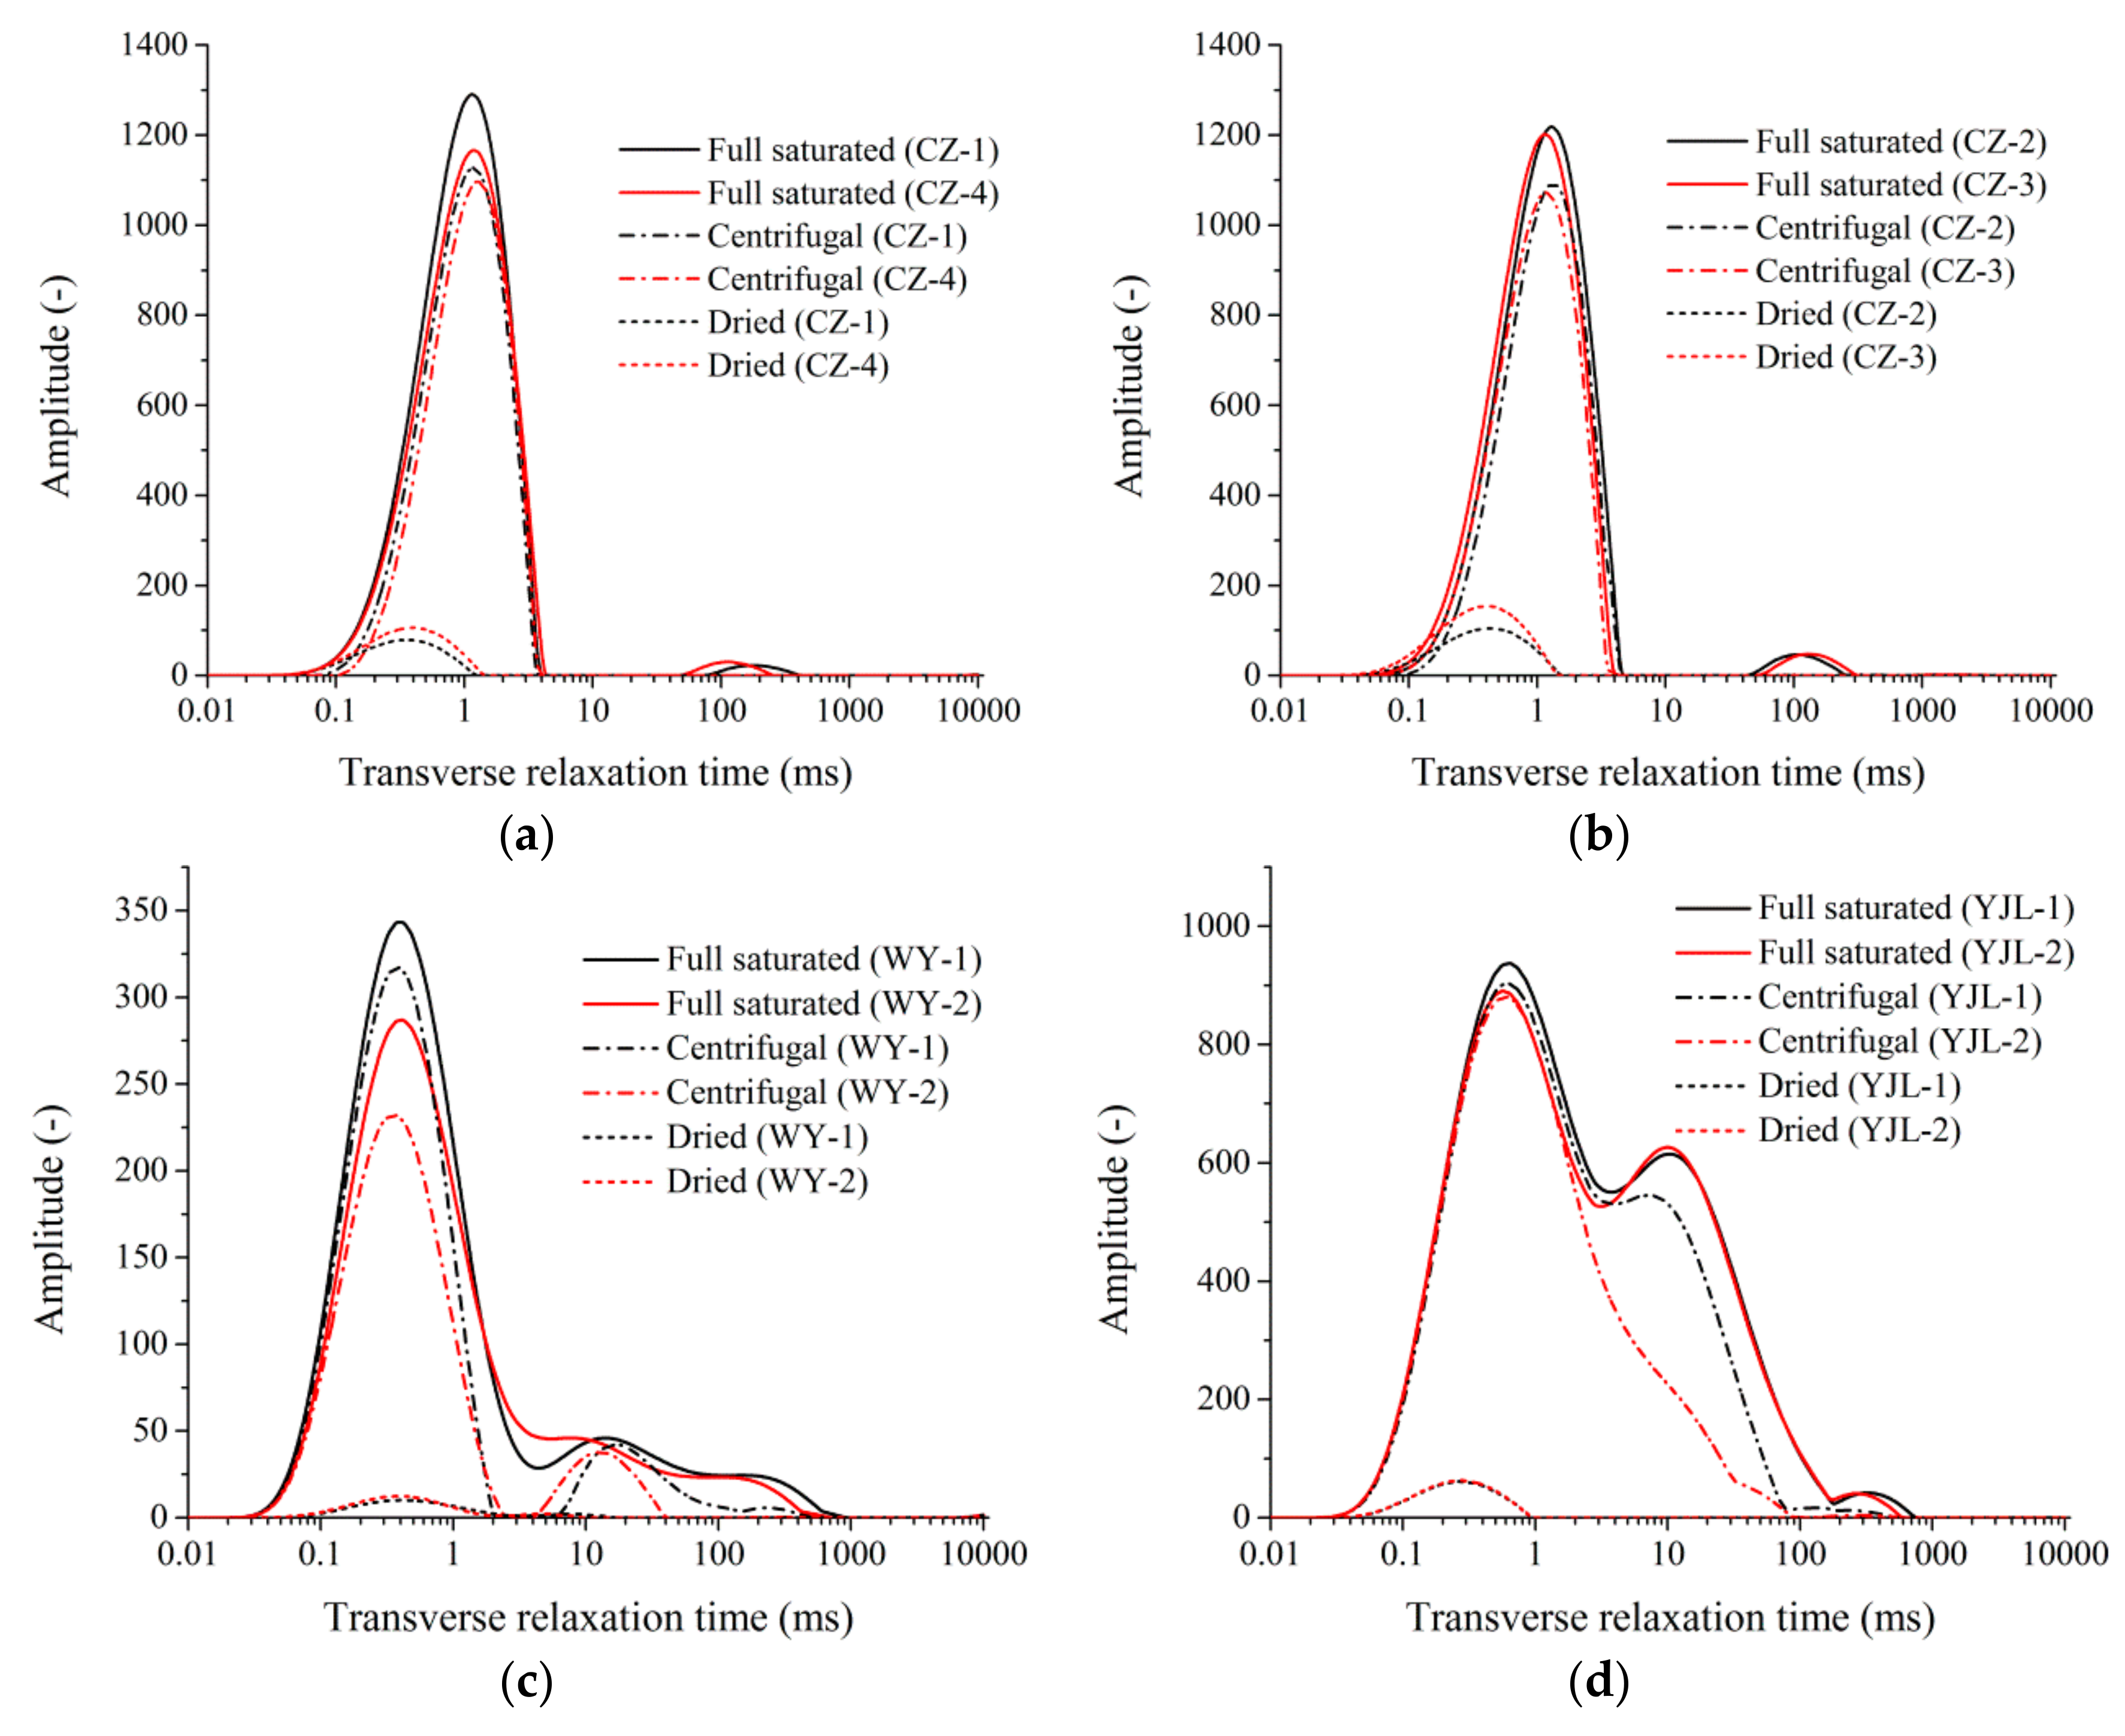
Figure 2 shows the T2 spectra of the 8 dried, saturated, and centrifugal samples, respectively. There were noticeable differences in the patterns of the T2 spectra of the coal samples from different mining areas, and their shapes differed obviously before and after the centrifugation.
The T2 spectra of the dried coal samples were unimodal, and their peak intensity and width were different. The T2 spectra of samples from the same mining area were coincident or similar, and the intensity of CZ, YJL, and WY decreased greatly. The above characteristics indicated that there were some unbound hydrogen nuclei in the dried coal. The hydrogen atoms maybe belonged to the methane or gaseous water molecules adsorbed in the micropores. There was a slight difference between the amount of the hydrogen nuclei and the size of the pores absorbing methane or water vapor in the coal samples from different mining areas.
There were noticeable differences in the number, position, and intensity of the T2 spectra peak of saturated coal samples from different mining areas. The T2 spectra of the CZ coal sample was bimodal, and the two peak positions were corresponding to the T2 of 1 ms and 100 ms, respectively. The left peak was an asymmetrical left monoclinic distribution, and its intensity was far higher than the right peak. The two peaks were completely separated, indicating that many small pores were developed in the coal samples (Figure 2a,b). The T2 spectra of the YJL coal sample had three peaks, they were located at 0.8 ms, 10 ms, and 300 ms, and their intensity decreased significantly with the increase of T2 (Figure 2d). The T2 spectra of the WY coal sample also had three peaks, and the peak positions were distributed in 0.4 ms, 15 ms, and 200 ms, respectively. They were of a continuous distribution and with no obvious crossover. The intensity of the peaks was significantly decreased with the increase of T2, and the amplitude was obviously higher than that of YJL coal sample (Figure 2c).
After centrifugation, the variation of the T2 spectra of the coal samples from different mining areas was different. The first peak intensity of the CZ coal sample decreased slightly, and the secondary peak was completely disappeared. The first peak intensity of the YJL coal sample was invariable, and the secondary peak and the minimum peak disappeared. The first and secondary peak of the WY coal sample decreased to a certain extent, and the reduction of the minimum peak was the most obvious.
The morphology and peak position of the T2 spectra of the bedding and vertical coal samples was basically the same. Only the first peak intensity of the WY vertical coal sample was obviously lower than that of bedding coal sample under the condition of saturated water and centrifugation.
3.1.2. Pore Types and Development Characteristics
There are multi-shape and multi-scale pores and fissures in coal. When NMR is used for PSD analysis, it is necessary to convert the NMR signal into the equivalent pore size. According to the morphological changes of the T2 spectra before and after centrifugation, combined with the size, shape, and distribution of the pores and fissures in the coal observed by SEM, the contribution to gas adsorption, diffusion and seepage, and the pores and fissures in the coal can be classified.
According to the NMR theory, there is an intrinsic relationship between the pore size and T2. It is assumed that there exists very long free relaxation rate and ignores the effects of free and diffusion relaxation. In porous materials, the hydrogen proton is mainly affected by the surface diffusion relaxation, and the surface relaxation time is related to the surface relaxation rate and pores shape [10,21].
where T2 is the transverse relaxation time, ms; ρs is the surface relaxation rate, cm/ms; S is the pore surface area, m2; V is the pore volume, cm3; rp is the pore radius, nm; F is the geometrical shape factor of the pore, and the value of the spherical, cylindrical, and plate pore is 3, 2, 1, respectively.
The surface relaxation rate is a characteristic parameter of the interaction of the magnetic material in the solid–liquid interface, which is closely related to the surface properties. For a certain coal sample, the surface relaxation rate is a constant. Assuming that the structure and composition of pores in a certain aperture are very similar, the F in Equation (1) is also a constant, and then, the T2 is linearly related to the equivalent pore size.
Figure 2 shows that the development of the pores and fissures from the coal samples of CZ, WY, and YJL differed greatly. In general, both the pores and fissures are developed in coal, and they are all reflected in the T2 spectra, so rp in Equation (1) is equivalent to the pore radius. The T2 spectra can only reflect the relative proportions of the pore volume in different pore sizes, without any information regarding pore morphology.
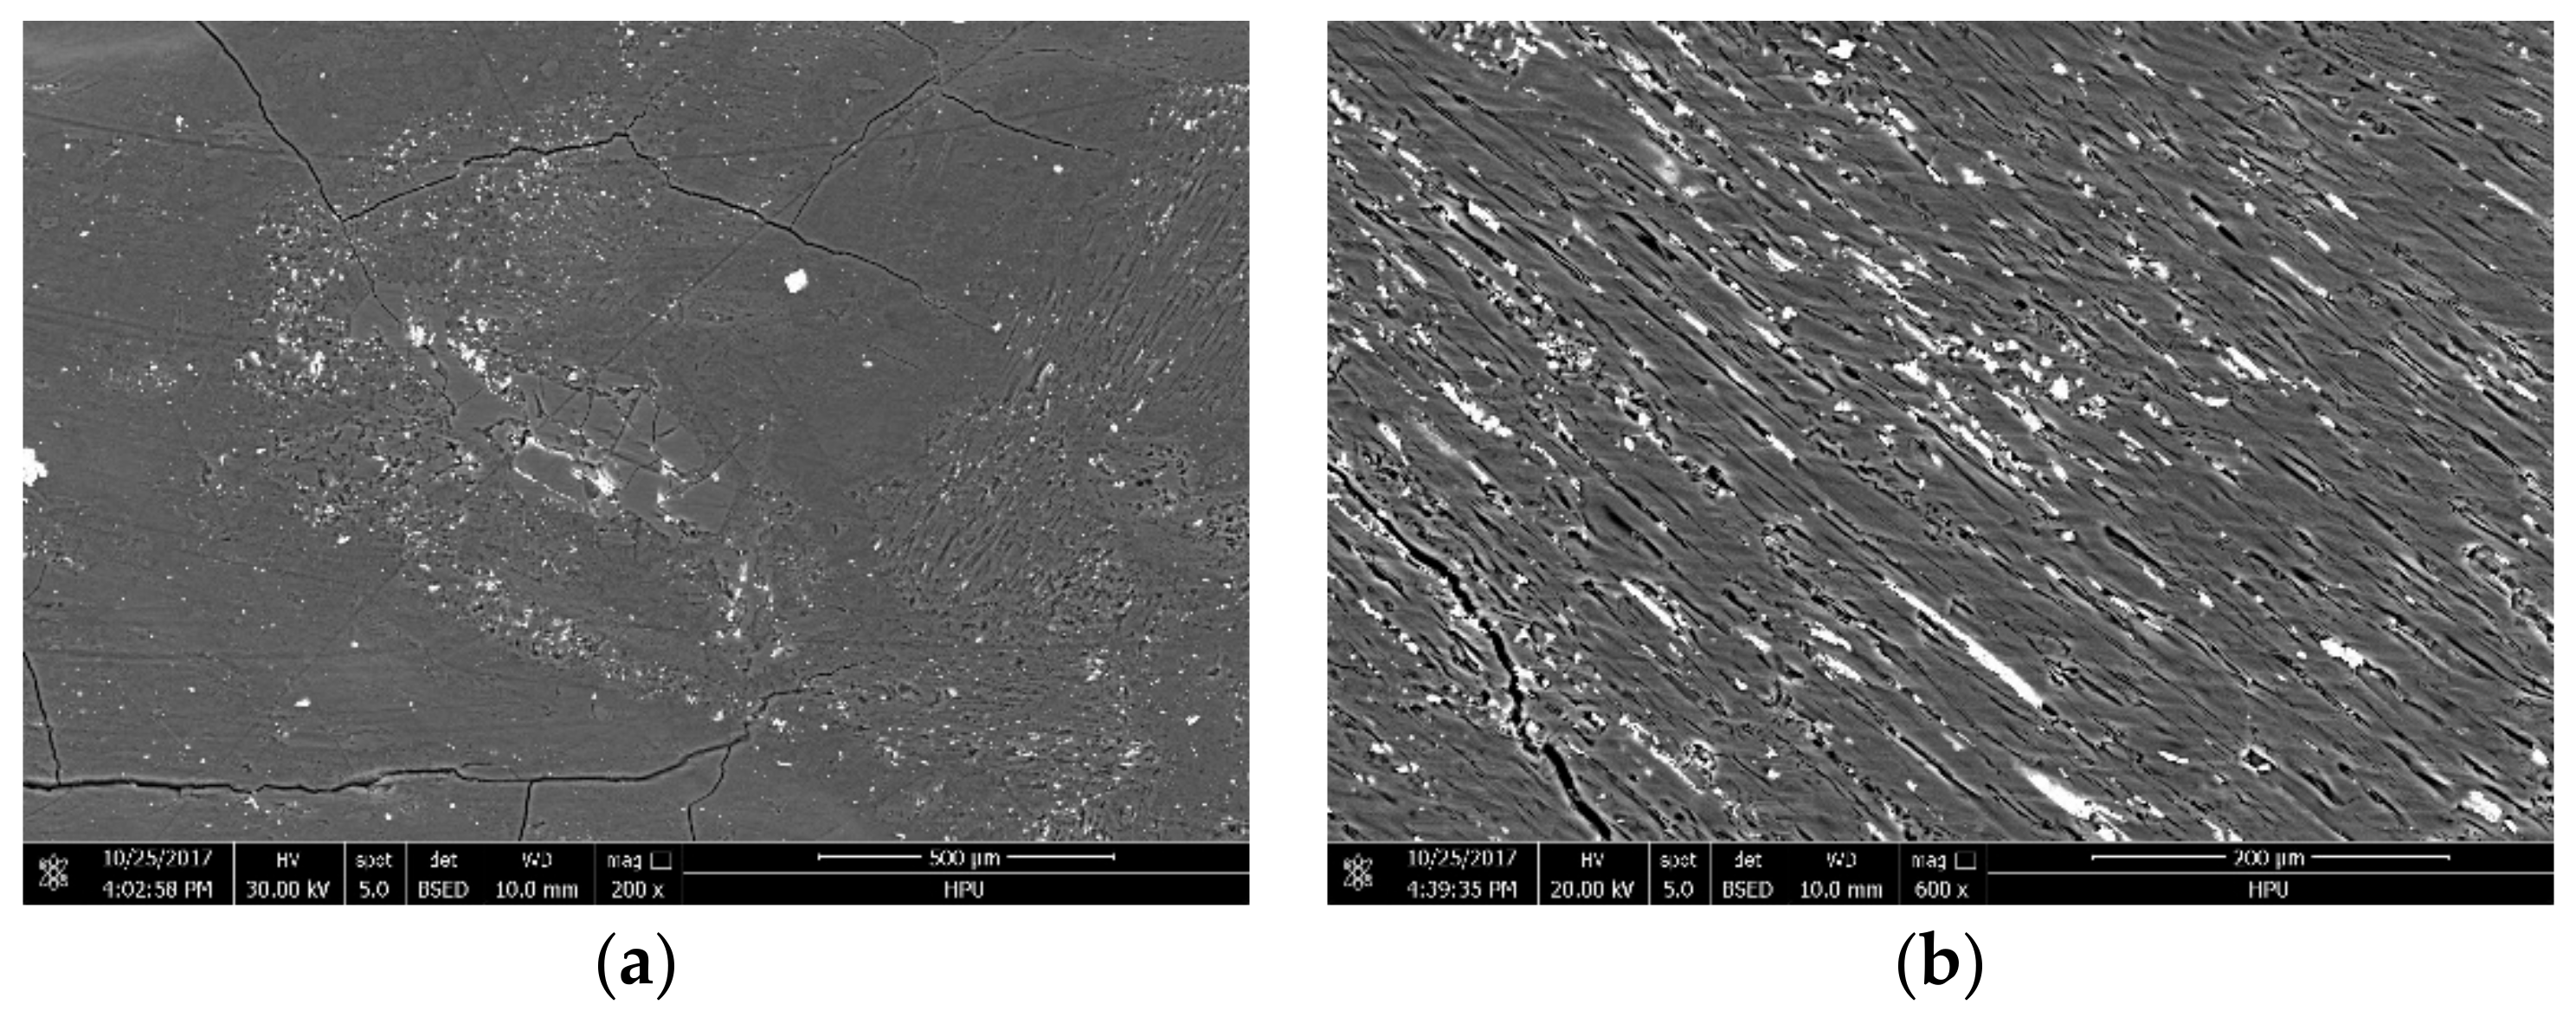
Figure 3a–e are the SEM images of the pores and fissures of the YJL coal samples after argon ion polishing. The fissures, micro-fissures, and nanopores are all developed in the YJL coal samples. The fissures were randomly distributed in the coal matrix, their length often exceeded the visual range of the SEM image, and the width was generally greater than 2.5 μm (Figure 3a). Micro-fissures were often developed in some special macerals, their width was hundreds of nanometers, and the length was hundreds of microns (Figure 3b,c). The nanopores were distributed on some small maceral particles with the aperture between dozens of and hundreds of nanometers (Figure 3d,e). Based on the morphology of the T2 spectra and the size and shape of the pores and fissures observed by SEM, the pores and fissures in the YJL coal samples can be divided into three types: nanopores, micro-fissures, and fissures. Comparing the T2 spectra of the samples from different mining areas (Figure 2), it was found that their characteristics were obviously different. The three types of pores in the YJL coal samples were all developed, the nanopore peaks were the strongest, the second was the micro-fissures peak, and the fissure peaks were the weakest, which was consistent with the distribution and development characteristics of the pores observed by SEM.
In the T2 spectra of the CZ coal samples, the nanopore peaks had the highest intensity, and the fissures peaks were also obvious but lacking micro-fissure peaks, which indicated that the nanopores in coal samples were very developed and the fissures with width larger than 2.5 μm were also developed. At the same time, many nanopores were distributed in some micro-maceral particles and some fissures were distributed in coal matrix in the SEM images (Figure 3f–h), but we could not find any obvious micro-fissures. The nanopores, micro-fissures, and fissures peaks all appeared in the T2 spectra of the WY coal samples, with the strongest nanopore peak and the weakest fissure peak in intensity. In the SEM images, nanopores, micro-fissures, and fissures were found (Figure 3i–l), but the surface density of micro-fissures was far lower than that in YJL coal samples.
3.1.3. Influence of Pore Type on Fluid
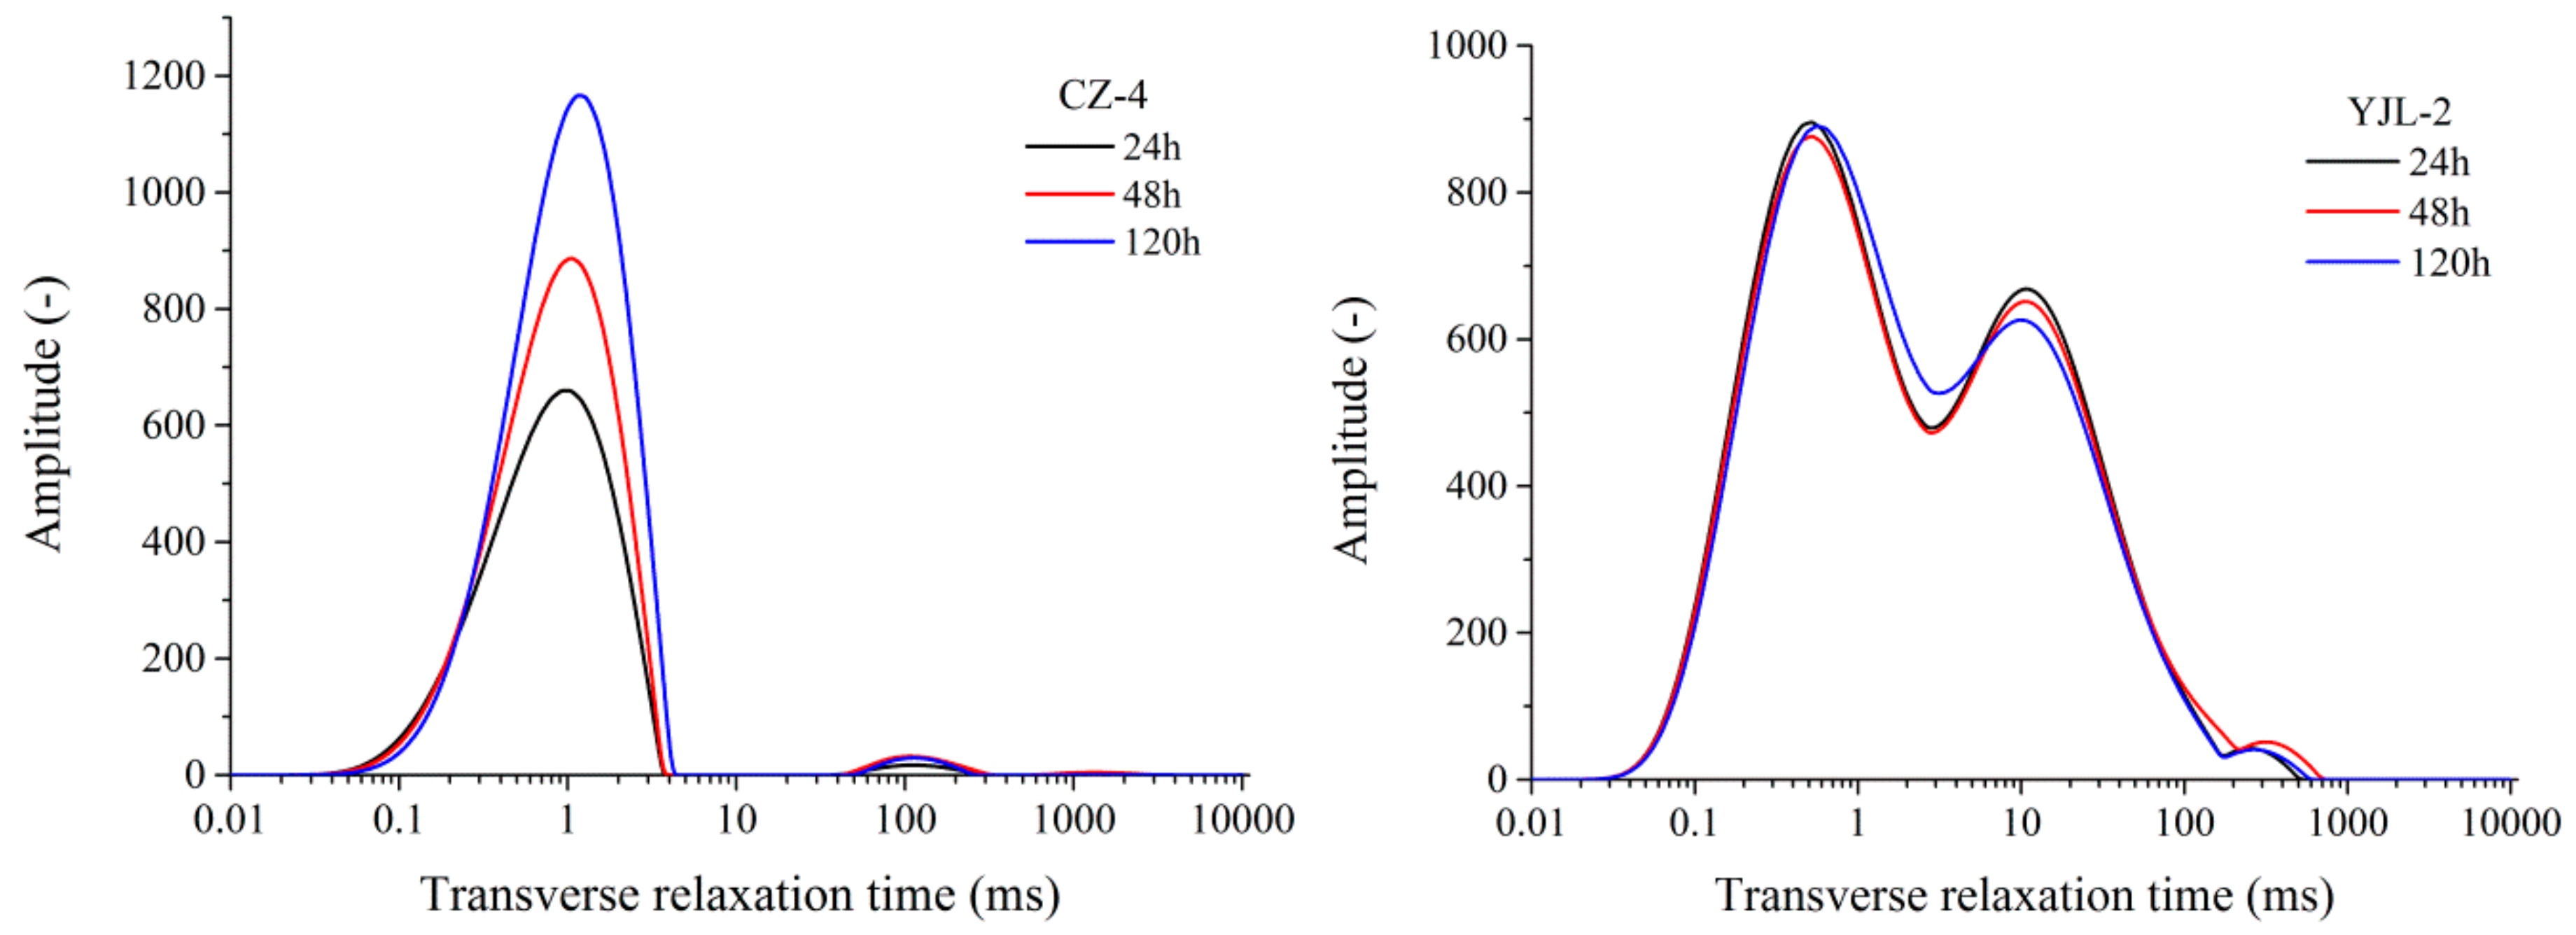
To understand the influence of the size, shape, and connectivity of the pores on the water migration in the process of saturation and centrifugation, we selected CZ-4 and YJL-2 to saturate in different times (24 h, 48 h, 120 h) and centrifuge by different rotational speeds (4000 rpm, 6000 rpm, and 8000 rpm), and carry out the NMR scanning to obtain their T2 spectra (Figure 4 and Figure 5).
Figure 4 is the T2 spectra of the CZ-4 and YJL-2 coal samples under different saturated times. With the increase of saturated time, there was no obvious change in the shape and peak intensity of YJL-2, which showed that the mass and distribution of the water in the fissures and pores were not changed obviously after 24 h. In 24 h, the water had fully entered the fissures, micro-fissures, and partial nanopores. Because the micro-fissures developed very well in the YJL coal samples, water could enter larger nanopores through micro-fissures, while some gaseous water molecules diffused to small nanopores through the micro-fissures. With the increase of saturated time, the peak position in the T2 spectra of CZ-4 had no obvious change, but the peak intensity increased significantly. In 24 h, the water was also full of fissures. However, the micro-fissures in this coal were not developed, so it was lacking an effective migration channel for the liquid water molecule seepage and gaseous water molecule diffusion. The adsorption process of liquid water into the larger nanopores was slow, so the intensity of the pores peak increased continuously.
Figure 5 is the T2 spectra of centrifugal coal samples at different rotational speeds of CZ-1 and YJL-2. Under the rotational speed of 4000 rpm, the nanopore peak intensity of CZ-1 decreased slightly, and the fissure peak intensity decreased significantly. When the rotational speed reached 6000 rpm, the nanopore peaks continued to decrease, and the fissure peaks disappeared completely. When the rotational speed increased to 8000 rpm, there was no obvious change in the spectra. After centrifugation, the nanopore peak of YJL-2 had not changed, and the variation of fissure peak was similar with CZ-1. With the increases of centrifugal speed, the micro-fissure peak intensity decreased gradually and disappeared in 8000 rpm.
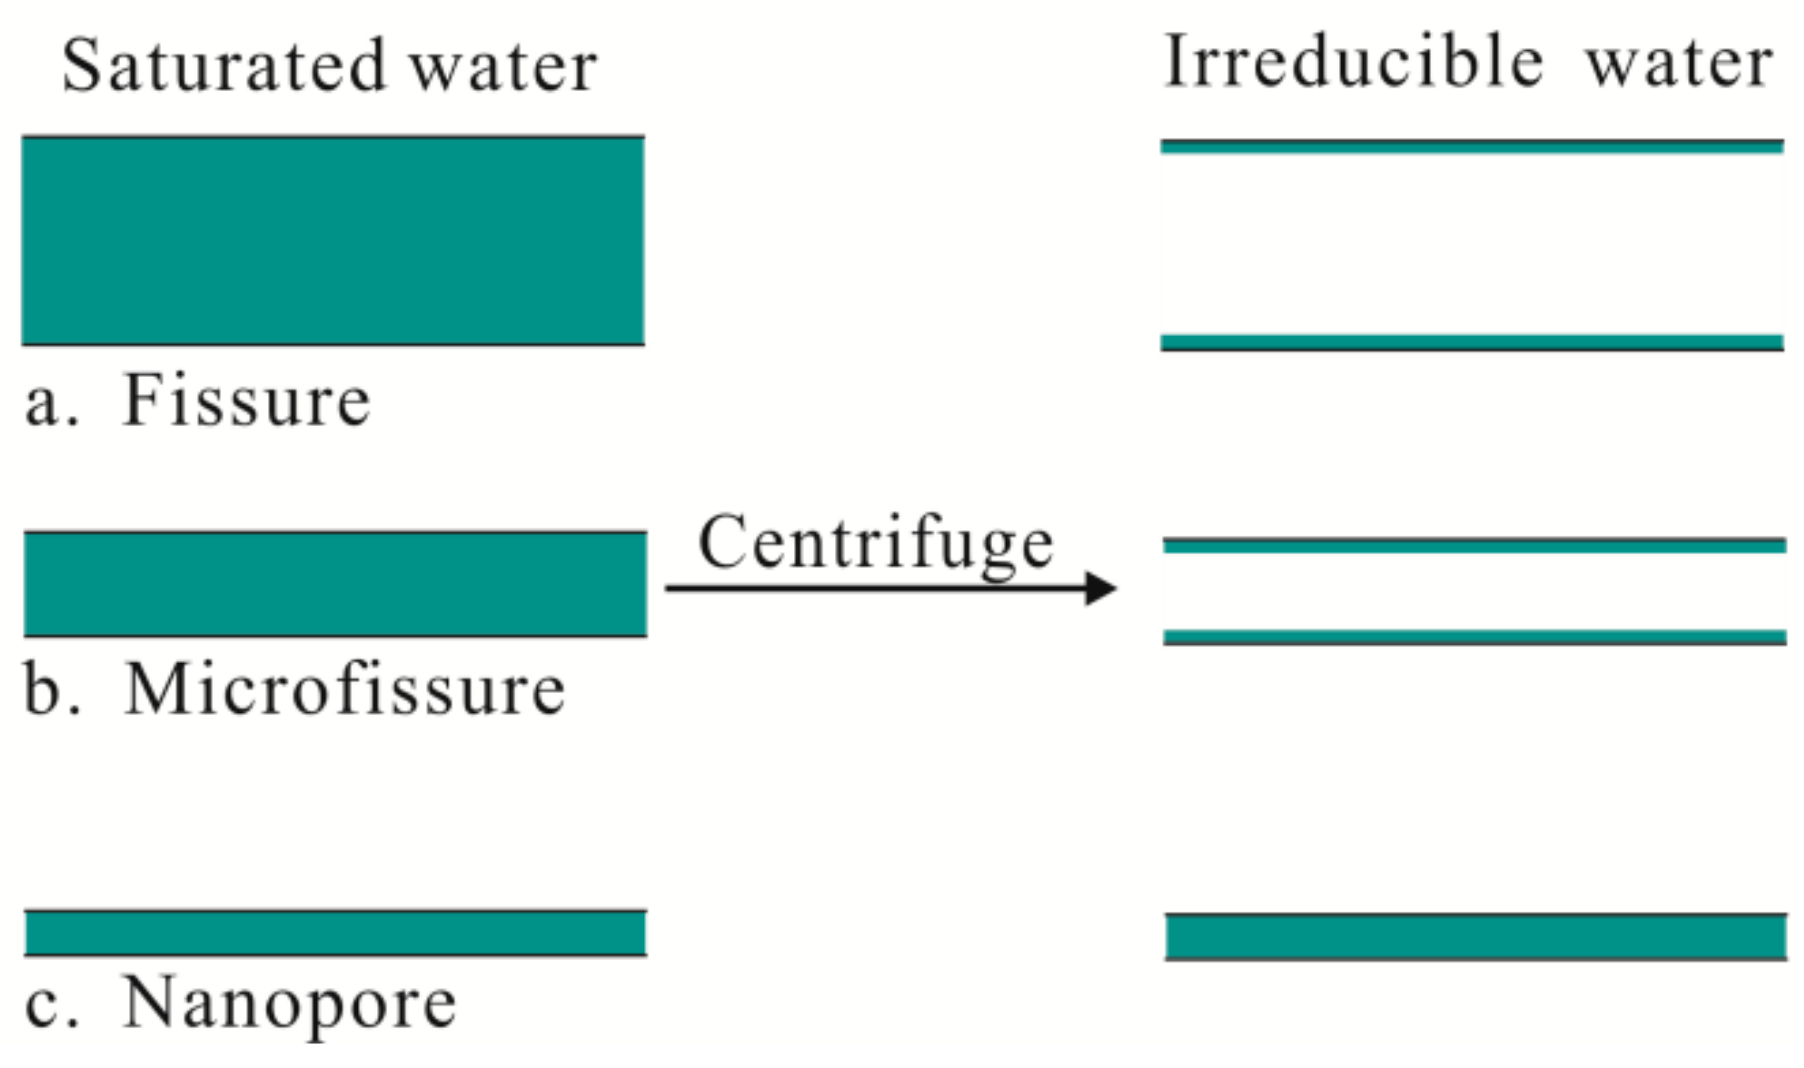
The fissure width in the coal was large, and their connectivity was good, so most of the water in the fissures was discharged under the action of centrifugal force. Because coal belongs to a water wetting medium, a very small amount of membrane water still adsorbed on the fissure wall (Figure 6a). The process of water migration in the fissures was in agreement with the variation of the fissure peaks in centrifugation. The micro-fissures had small width and poor connectivity, and the water could migrate effectively only under greater centrifugal force (the YJL coal samples), so the micro-fissure walls would still absorb a small amount of membrane water (Figure 6b). In some coal, the structure of the micro-fissures was complex, so even if the centrifugal speed was up to 8000 rpm, only part of the water could discharge, which showed the decrease of the intensity of the micro-fissure peaks (the WY coal samples). The signal of the nanopore peaks of the T2 spectra was the superstition of liquid water and gaseous water molecules absorbed in small nanopores wall. In centrifugation, only the liquid water in the larger pores with good connectivity discharged effectively, which reduced the intensity of the nanopore peaks, such as in the WY samples. Most of the water in the nanopores in the centrifugal process did not move, such as the CZ and YJL coal samples, and their spectral peaks were basically unchanged (Figure 6c).
3.2. NMR Porosity
NMR not only identified the pore type, but also calculated the total porosity and the volume distribution at different scales.
3.2.1. Porosity of Different Types of Pores
Precious research shows that the intensity of the NMR signal was proportional to the water content in the saturated coal samples [22,23]. By NMR testing of the known porosity standard samples, the unit volume NMR signal of different porosity standard samples was obtained, and the linear relationship between the porosity and the NMR unit volume signal intensity was established as follows:
where ϕNMR is the NMR porosity, %; and Suv is the NMR unit volume signal intensity.
We used density balance and precise mass balance to determine the density and mass of each saturated coal sample and to calculate their volume. The total amount of NMR signals was divided by the coal sample volume to obtain the signal intensity of the unit volume. Then, substituting Equation (2), the total NMR porosity of the coal sample was obtained. According to the proportions of various peaks, the porosity of different types of pores was calculated, and the results are shown in Table 2.
Yao et al. [20] studied porosity by NMR, MIP, and helium adsorption and considered that NMR porosity is relatively accurate and reliable. Table 2 shows that the total porosity of the coal samples from the different mining areas differed greatly. The porosity of WY-2 was the lowest, only 2.75%, and the porosity of YJL-1 was the highest, up to 15.12%. The porosity of the coal samples from the same mining area was very close, and the porosity of the bedding coal samples was slightly higher than that of the vertical coal samples. The porosity proportion of the three types of pores of samples from different mining areas was obviously different. The porosity of CZ was mainly from nanopores and partly from fissures, and the micro-fissures porosity was zero. The porosity of WY mainly came from nanopores, and the contribution of micro-fissures and fissures was very small. The porosity of YJL was also mainly from nanopores, followed by micro-fissures, and the contribution to fissures was very small.
3.2.2. Movable Fluid Porosity
The movable fluid saturation is an indicator of the permeability of the conventional reservoir and the coal reservoir, which refers to the proportion of movable fluid in the reservoir.
The T2 cut-off method was usually used to calculate the free fluid index (FFI). Their T2 cumulative curves of the coal samples under two conditions of saturated water and centrifugation were obtained by NMR (Figure 7).
Along with the maximum value of the cumulative curve of the centrifugal T2 plot, the parallel line to the X-axis intersected with the T2 cumulative curve of the saturated sample at the O point. At the O point, we made a perpendicular line to the X-axis and intersected at point A. The relaxation time of the point A is the T2C value. The FFI can be calculated based on the proportion of the accumulated signal area larger than T2C. The ϕFFI is the product of FFI and the total porosity.
Due to the differences in the pore and fissure structures in the coal samples from different mining areas, the different centrifugal force was used to test the centrifugal effect of the saturated coal samples, and the proper centrifugal force of each sample was obtained. Then, the T2C and ϕFFI of each coal samples were calculated, and the results are shown in Table 3.
At present, the pore size corresponding to T2C is commonly used as the boundary between movable and bound water. Because the structure, distribution, and connectivity of the pores and fissures in the coal are very complex, there is a “partial movable water pore” interval in the T2 cumulative curve, which is the micro-fissure mentioned earlier. As shown in Figure 7, the minimum pore size of the micro-fissures begins at point B at the fork of the cumulative T2 curves of the centrifugal and saturated coal samples, and the maximum pore size is terminated by the maximum signal starting point C of the T2 cumulative curve of the centrifugal coal samples. The two ends of the micro-fissures are the nanopore and fissure segments, respectively.
From Table 3, the FFI and porosity of coal samples in the same mining area were very close, but the FFI between the coal samples from different mining areas varied greatly, and the movable fluid porosity was much different. The movable fluid porosity of YJL-1 as the highest, up to 4.35%, and the ϕFFI of WY-2 was the lowest, only 0.63%. The difference between the vertical layer and the bedding sample was not obvious, and the FFI of the bedding coal samples was slightly larger than that of the vertical coal samples.
In the logging process, the T2 spectra of the water-bearing coal seam can be measured, but the T2C and ϕFFI cannot be obtained directly. At present, in the logging of the sandstone reservoir, people often calculate the ϕFFI based on an empirical value of T2C.
From the above analysis, the migration of water in the nanopores, micro-fissures, and fissures are different in centrifugation, so the φFFI may have some intrinsic relationship with the porosity of the nanopores, micro-fissures, and fissures. Based on the porosity data of 8 coal samples, the empirical equation between the φFFI and the three types of porosity was fitted as follows
where ϕCFFI is the movable fluid porosity, %; ϕp, ϕmf, ϕf is the porosity of nanopores, micro-fissures, and fissures, %, and R2 is the correlation coefficient.
Equation (3) shows that the contribution to the movable fluid porosity mainly comes from fissures, followed by micro-fissures, with the contribution of nanopores being the lowest. Table 3 showed that the movable fluid porosity calculated from the T2 spectra was very close to that of the laboratory, which indicated that the method can be used to calculate the movable fluid porosity of the reservoir in the field work through the T2 spectra of saturated samples. It needs to be explained that there are large differences in pore structure of the coal reservoir in different mining areas, and the fitting equation should be more accurate and reliable based on coal samples from the same mining area.
3.3. NMR Pore Structure
3.3.1. PSD of NMR
The preceding discussion shows that the T2 is linearly related to the equivalent pore size, and the conversion coefficient between them can be obtained by centrifugal experiments. The water in the pores of the coal sample can overcome the capillary pressure discharge coal sample under the centrifugal force. According to the National Standard of GB/T29171-2012 [24], the centrifugal force is related to the rotational speed, rotor radius, and sample length, and the centrifugal force was calculated by the following equation:
where Pc is centrifugal force, MPa; Δρ is two-phase fluid density difference, g/cm3; L is the coal sample length, cm; Rc is the rotor radius, cm; and n is the rotational speed, r/min.
The capillary force in the capillary is equal to the additional pressure (ΔP) produced by the curved liquid surface, the ΔP is related to the shape of the capillary, and the relationship between the ΔP and the radius of the surface curvature can be deduced according to the Young–Laplace equation [25]:
where σ is the liquid surface tension, N/m; and r1 and r2 are the radius of curvature of the curved liquid surface in two directions. When the capillary is a cylindrical tube or a plate fissure, there will appear r1 = r2 or r1 ≫ r2, so the upper-equation is simplified to the following:
where rP, df is the radius of cylindrical pore and the width of plate-like fissure, nm, respectively.
The critical pore size of the centrifugal force can be expressed by the Washburn equation [26].
where σ is the water surface tension, 0.072, N/m; and θ is the wetting angle, 0°.
The centrifugal test instrument is the Eppendorf 5804R high-speed centrifuge (Eppendorf, Hamburg, Germany). The fixed-angle rotor, rotor radius, and maximum speed are F-34-6-38, 11.5 cm, and 12,000 rpm, respectively. The rotational speed of the centrifugal experiments is 8000 rpm. According to Equations (4)–(7), when the rotational speed of the centrifugal experiments is 8000 rpm, the corresponding pore radius is 45.64 nm.
The shape and structure of the pores and fissures in coal are very complicated. The nanopores in coal are mainly spherical and cylindrical, whereas the micro-fissures and fissures are network-like, poorly connected, rough plate-like cracks. The above equations assumed that the pores in the coal are regular, smooth cylindrical pores or plate-like fissures. It differs greatly from the equivalent pore size of the different pores and fissures in the coal, so the PSD of 5–100 nm is corrected by the gas adsorption analysis results. The equivalent pore size corresponding to T2C is calculated by the centrifugal experiment. The pore size corresponding to other T2 values can be calculated by the proportional relationship between them. Considering the correction factor, the expression is as follows:
where dpi is the equivalent pore size, nm; T2i is the transverse relaxation time, ms; d2C is the pore size corresponding to the T2C, nm; and C is the correction factor.
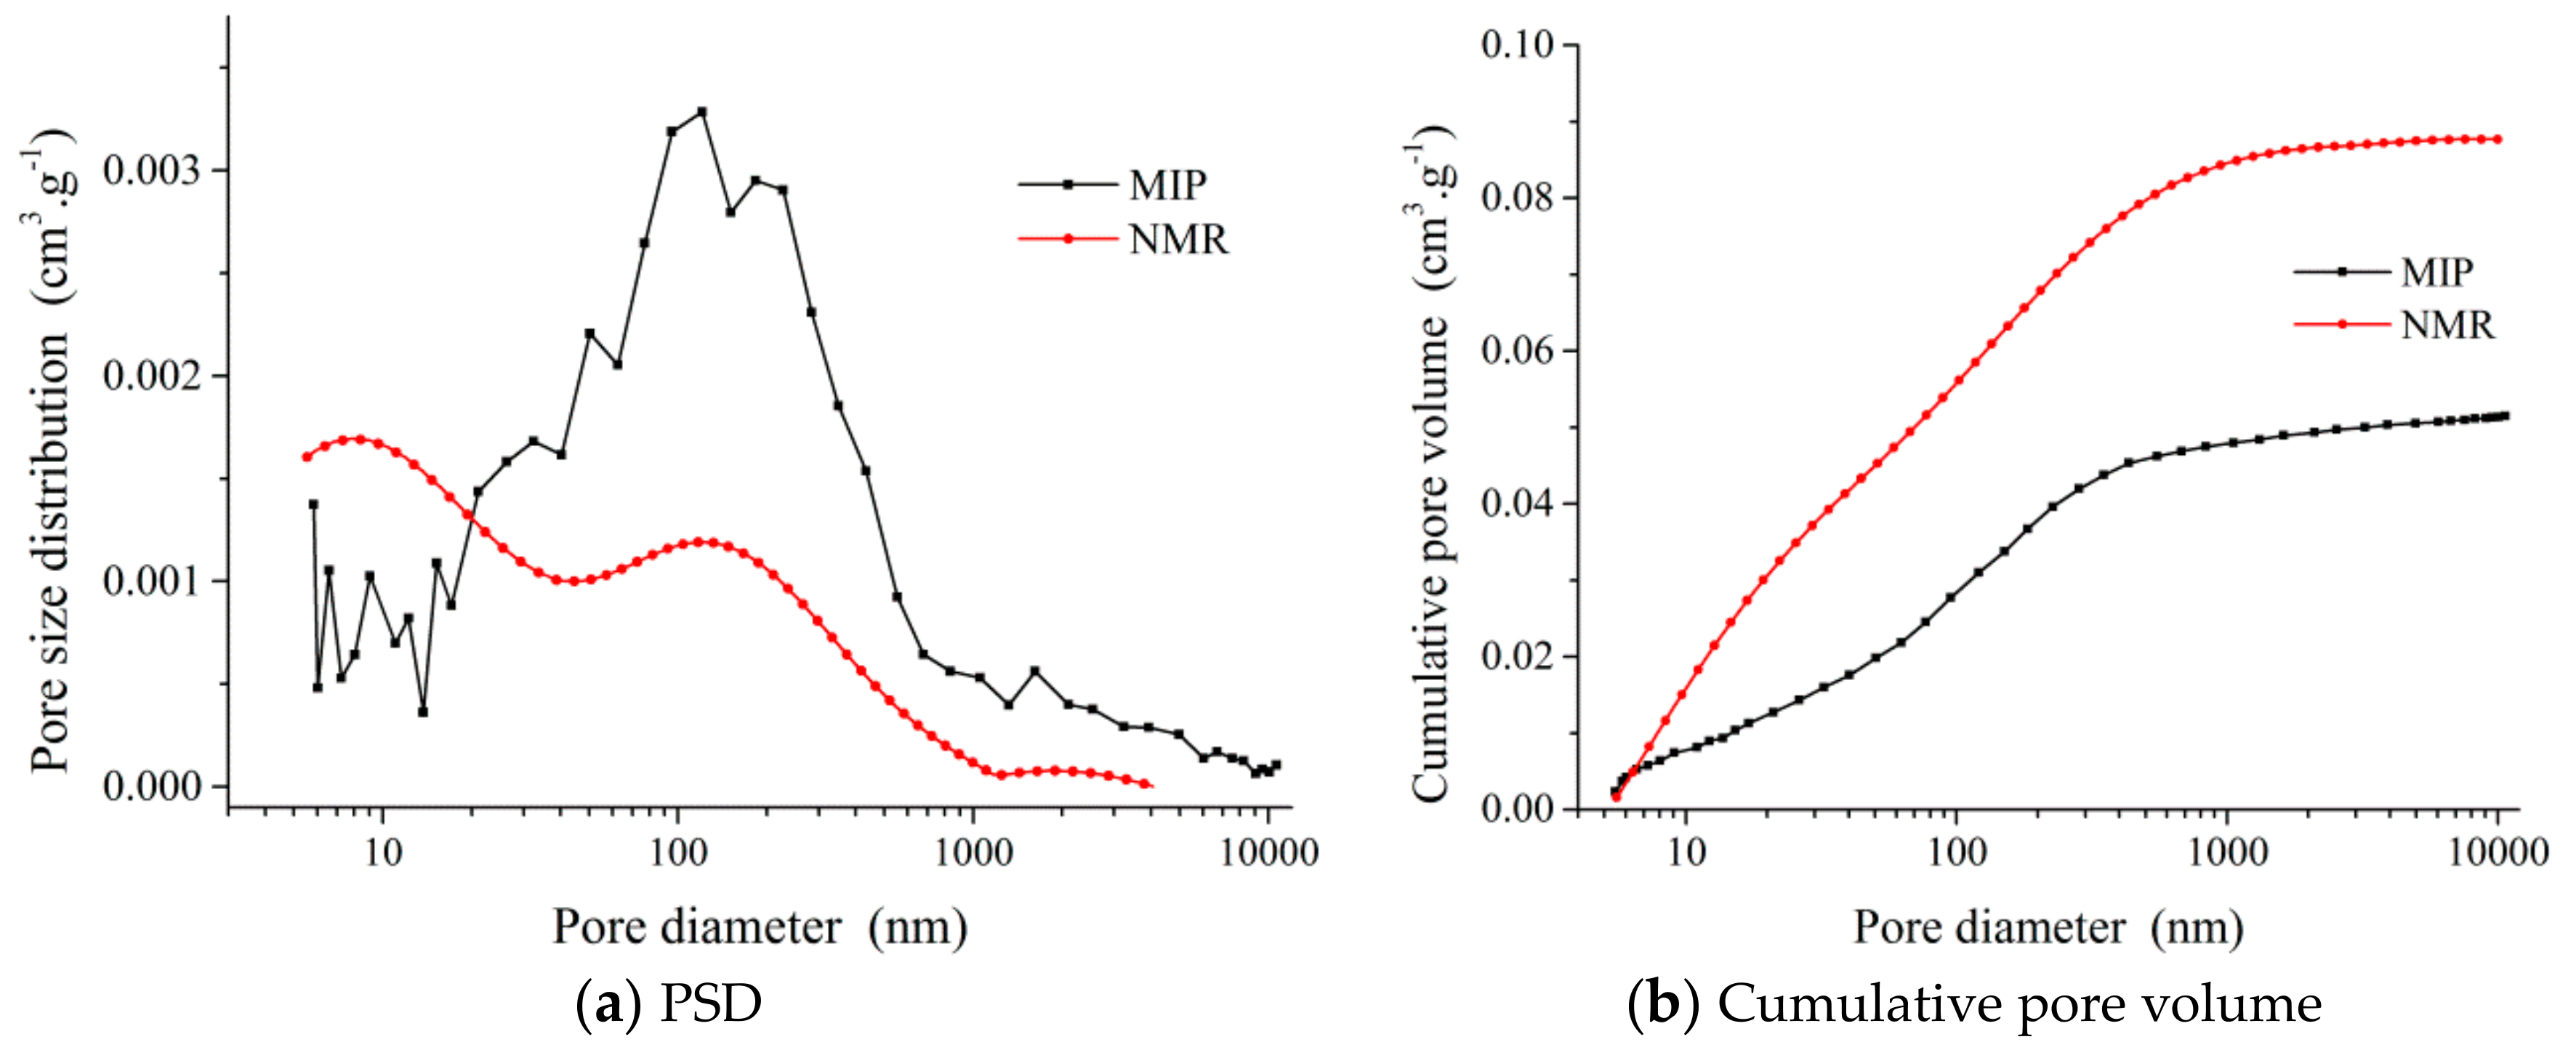
According to the characteristics of the T2 spectra and the PSD curve of transformation (Figure 8), the pores and fissures in the coal were divided into three parts: adsorption-diffusion nanopores with equivalent pore sizes of less than 50 nm, micro-fissures with widths between 50 nm and 2.5 μm, and fissures with widths larger than 2.5 μm. In order to verify the reliability of the NMR results, the PSD curve of MIP was given in Figure 8, which was corrected by the coal matrix compression effect.
The variation trend of PSD of micro-fissures and fissures by NMR was basically the same as that of MIP, and the corresponding position of the peak was identical, whereas the pore volume of nanopores with NMR was much higher than that with MIP. The difference may be due to signal superposition of hydrogen atoms in gaseous water molecules and methane molecules absorbed in nanopores. For the volume of pores larger than 50 nm, the NMR result was slightly higher than that of MIP. Because coal particles of sizes between 3–6 mm were used for the MIP experiments, some fissures were destroyed in sample crush and preparation. In general, the NMR test considers the differences of pore shapes and can accurately characterize the volume information of pores and fissures in the coal reservoir with pore size more than 20 nm.
3.3.2. NMR Permeability
Although the NMR test cannot directly determine reservoir permeability, it can be used to obtain distribution and structural parameters of the pores in the reservoir and then to calculate the permeability with them. There are two main kinds of calculation models for NMR permeability of conventional oil and gas reservoir: the Timur-Coates (TC) model [27,28] and the mean T2 model (SDR) model [29]. In the two models, the NMR porosity was all used, and the TC model also took into account the saturation of the irreducible and movable water in the reservoir. The equation is as follows:
where kTC is NMR permeability calculated by the TC model, mD; a is the empirical statistic constant, which is 42,000 in this paper; and ϕNMR is the NMR porosity, %.
The TC model has been modified by many scholars to adapt to various conventional reservoirs under different geologic backgrounds [30,31]. Yao has also modified this model and applied it to the permeability calculation of coal samples [11].
Besides considering the NMR porosity, the SDR model also considers the geometric mean of transverse relaxation time, and the equation is as follows [29]:
where kSDR is the NMR permeability calculated by SDR model, mD; and T2,log mean is the geometric mean of transverse relaxation time, ms.
Westphal et al. [32] used the SDR model to predict the permeability of the limestone reservoir, but the calculation effect in the coal reservoir was poor. Based on the NMR porosity of movable water, Yao et al. [11] proposed a PP model to calculate the permeability of coal reservoir.
Song et al. [15] compared and analyzed the reliability of the above three models according to the permeability and NMR parameters of more than 30 coal samples and proposed a coal rank (CR) model based on the coal rank.
The above equations only discuss the relationship between permeability and porosity. Because the pore structure of coal is complex and changeable, the structure parameters, such as pore size, tortuosity, and fractal dimension, will also affect the permeability. Based on the Kozeny–Carman equation, the permeability is related to the porosity, tortuosity, and effective fluid radius [33,34].
where τ is the tortuosity; and reff is the effective fluid radius, nm.
The above equation is based on the assumption that the wall of the pore is smooth. Considering the fractal characteristics of the pore structure, the relation between the average particle size, and surface area, the following equation (NMRF model) can be deduced [16]:
where ϕFFI is the NMR movable fluid porosity, %; DNMR is the NMR fractal dimension of seepage fissures; and rg the average grain radius, nm.
The average grain radius can be expressed as follows [35]:
where Sp is the ratio of pore specific surface area to movable water pore volume, m−1.
The relationship between porosity and tortuosity can be expressed as follows [36]:
The T2 is linearly related to the pore size, and the geometrical fractal relation of NMR pores can be expressed as follows [13]:
where Vc is the percentage of pore accumulation volume occupied by the total volume, %; and T2max is the maximum transverse relaxation time, ms.
Using logarithms for Equation (16), we obtained the following:
Based on the NMR experimental data and Equation (17), the relationship between lg(Vc) and lg(T2) was obtained, and then, the fractal dimension of seepage fissures can be calculated. Using Equations (9)–(11) and (13), the permeability of NMR in each coal sample was calculated, and the results are shown in Table 4.
Table 4 showed that T2,log mean, DNMR, and Sp are between 0.83–2.18 ms, 2.9434–2.9940, 0.48–450.66 m−1, respectively, which indicated that the pore structures of the coal samples from different mining areas were different. There were noticeable differences in the permeability results calculated by different models, and no one model results were basically consistent with the results of the laboratory tests. It was worth noting that the porosity and structural parameters of the bedding and vertical layers of the same seam were very close, but their permeability determined in the laboratory differed greatly. The above fact shows that the permeability of the coal seam is not only closely related to the porosity but also to the pore connectivity. The pores and fissures in the coal seam are controlled by the maceral, coalification, and tectonic movement, and the heterogeneity of pore structure and connectivity is much higher than that of porosity, so their influence on permeability is often more significant. Therefore, it is very difficult to establish a model of the relationship between porosity and permeability of different reservoirs, especially for coal samples from different mining areas, and the relationship between them is more complex and changeable.
The NMR porosity determined in the laboratory can basically represent the porosity of the coal reservoir. The structure and connectivity of the pores in the coal are typically heterogeneous, and the permeability of the coal samples from the same mining area differs, so they cannot represent the permeability of the coal reservoir. Therefore, it is difficult to establish an exact relation equation between the NMR porosity and the permeability of the reservoir only through the laboratory work. The study of the correlation between the MNR porosity and permeability of 51 coal samples drilled from 16 wells in southern Sichuan Basin by Shan et al. [37] also proved this opinion.
3.4. Significance of NMR to CBM Development
The NMR T2 spectra of coal samples in different states not only reflect the scale and distribution of pores and fissures in the coal sample, but also reflect the migration of water during centrifugation. The difference between the saturation and centrifugal T2 spectra can be used to evaluate the distribution and connectivity of pores and fissures in the coal reservoir. Depending on the characteristics of the T2 spectra of the saturated coal samples, the porosity and fluid saturation can be calculated, and the admissibility of CBM can be evaluated.
In CBM production, methane desorbs, diffuses, and flows in connected a pore and fissure system, and the transport mechanism of methane in various types of pores is different [38]. The connected pores and fissures are effective channels for gas diffusion and seepage. The development and structure information of pores and fissures is obtained by NMR. They control the gas storage capacity of the coal reservoir and explore the potential of CBM. The gas transport mechanism and scale in the nanopores and micro-fissures will be the focus of future research.
4. Conclusions
The pore structure and permeability of the different coal rank samples were analyzed by NMR, SEM, and MIP experiments. The conclusions are as follows.
NMR can be used to evaluate porosity, the movable fluid porosity, and the fluid migration characteristics of coal reservoir. According to the equivalent pore size, the pores and fissures in coal reservoir were divided into adsorption-diffusion pores, micro-fissures, and fissures.
The NMR results showed that the pore characteristics of the different ranks of coal are obvious difference by NMR, which indicated that the heterogeneity of the pore development of the coal reservoir was strong. The pores and fissures in the CZ coal samples were very well developed, and the micro-fissures were not developed. The pores, micro-fissures, and fissures in the WY coal samples were all more developed, but the total porosity was low, and the connectivity of micro-fissures was poor. The pores, micro-fissures, and fissures in the YJL coal samples were very well developed, the micro-fissures were particularly developed compared with other coal samples, and their connectivity was the best.
An improved conversion method between the T2 and pore size was proposed based on the pore shape in the coal. The empirical equation between the movable water porosity and the porosity of nanopores, micro-fissures, and fissures was proposed, which can quickly and conveniently evaluate the migration characteristics of the reservoir fluid.
The permeability of the coal reservoir is affected by many factors, such as porosity, pore structure, and connectivity [39]. The structure and connectivity heterogeneity of pores and fissures in the coal reservoir are significant, so it is impossible to establish a widely used relation expression between NMR porosity and gas permeability, which was confirmed by the results of multiple permeability calculation models.
Author Contributions
Conceptualization, X.J. and D.S.; Funding Acquisition, D.S. and Y.L.; Methodology, X.J.; Investigation, H.Z. and K.H.; and Validation, D.S.
Acknowledgments
This research was funded by the National Science Foundation of China (41172141, 41602175), Coal seam gas Joint Foundation Shanxi (2016012001), and Henan Province basic and frontier technology research project (152300410099).
Conflicts of Interest
The authors declare no conflicts of interest.
References
- Scott, R.; Larry, P. Advanced reservoir modeling in desorption-controlled reservoirs. In Proceedings of the SPE Rocky Mountain Petroleum Technology Conference, Keystone, CO, USA, 21–23 May 2001. [Google Scholar]
- Okolo, G.N.; Everson, R.C.; Neomagus, H.W.J.P.; Roberts, M.J.; Sakurovs, R. Comparing the Porosity and Surface Areas of Coal as Measured by Gas Adsorption, Mercury Intrusion and SAXS Techniques. Fuel 2015, 141, 293–304. [Google Scholar] [CrossRef]
- Qu, Z.; Jiang, B.; Wang, J.; Li, M. Study of Nanopores of Tectonically Deformed Coal Based on Liquid Nitrogen Adsorption at Low Temperatures. J. Nanosci. Nanotechnol. 2017, 17, 6566–6575. [Google Scholar] [CrossRef]
- Zhao, Y.; Liu, S.; Elsworth, D.; Jiang, Y.; Jie, Z. Pore Structure Characterization of Coal by Synchrotron Small-Angle X-ray Scattering and Transmission Electron Microscopy. Energy Fuels 2014, 28, 3704–3711. [Google Scholar] [CrossRef]
- O’Brien, G.; Gu, Y.; Adair, B.J.I.; Firth, B. The Use of Optical Reflected Light and SEM Imaging Systems to Provide Quantitative Coal Characterisation. Miner. Eng. 2011, 24, 1299–1304. [Google Scholar] [CrossRef]
- Radlinski, A.P.; Mastalerz, M.; Hinde, A.L.; Hainbuchner, M.; Rauch, H.; Baron, M.; Lin, J.S.; Fan, L.; Thiyagarajan, P. Application of SAXS and SANS in Evaluation of Porosity, Pore Size Distribution and Surface Area of Coal. Int. J. Coal Geol. 2004, 59, 245–271. [Google Scholar] [CrossRef]
- Zhou, H.W.; Zhong, J.C.; Ren, W.G.; Wang, X.Y.; Yi, H.Y. Characterization of Pore-Fracture Networks and Their Evolution at Various Measurement Scales in Coal Samples Using X-ray μCT and a Fractal Method. Int. J. Coal Geol. 2018, 189, 35–49. [Google Scholar] [CrossRef]
- Li, X.; Kang, Y.; Haghighi, M. Investigation of Pore Size Distributions of Coals with Different Structures by Nuclear Magnetic Resonance (NMR) and Mercury Intrusion Porosimetry (MIP). Measurement 2018, 116, 122–128. [Google Scholar] [CrossRef]
- Kleinberg, R.L.; Vinegar, H.J. NMR Properties of Reservoir Fluids. Log Anal. 1996, 37, 20–32. [Google Scholar] [CrossRef]
- Seevers, D.O. A Nuclear Magnetic Method for Determining the Permeability of Sandstones. In Proceedings of the SPWLA 7th Annual Logging Symposium, Tulsa, OK, USA, 9–11 May 1966. [Google Scholar]
- Yao, Y.; Liu, D.; Che, Y.; Tang, D.; Tang, S.; Huang, W. Petrophysical Characterization of Coals by Low-Field Nuclear Magnetic Resonance (NMR). Fuel 2010, 89, 1371–1380. [Google Scholar] [CrossRef]
- Cai, Y.; Liu, D.; Pan, Z.; Yao, Y.; Li, J.; Qiu, Y. Petrophysical Characterization of Chinese Coal Cores with Heat Treatment by Nuclear Magnetic Resonance. Fuel 2013, 108, 292–302. [Google Scholar] [CrossRef]
- Zou, M.; Wei, C.; Miao, Z.; Jian, S.; Chen, Y.; Yu, Q. Classifying Coal Pores and Estimating Reservoir Parameters by Nuclear Magnetic Resonance and Mercury Intrusion Porosimetry. Energy Fuels 2013, 27, 3699–3708. [Google Scholar] [CrossRef]
- Yao, Y.; Liu, D. Comparison of Low-Field NMR and Mercury Intrusion Porosimetry in Characterizing Pore Size Distributions of Coals. Fuel 2012, 95, 152–158. [Google Scholar] [CrossRef]
- Song, L.; Tang, D.; Hao, X.; Zi, Y.; Guo, L. Porosity and Permeability Models for Coals Using Low-Field Nuclear Magnetic Resonance. Energy Fuels 2012, 26, 5005–5014. [Google Scholar] [CrossRef]
- Cai, Y.; Liu, D.; Pan, Z.; Che, Y.; Liu, Z. Investigating the Effects of Seepage-Pores and Fractures on Coal Permeability by Fractal Analysis. Transp. Porous Media 2016, 111, 479–497. [Google Scholar] [CrossRef]
- Method of Determining Microscopically the Reflectance of Vitrinite in Coal; GB/T 6948; Standardization Administration of the People’s Republic of China: Beijing, China, 2008; pp. 1–12.
- Proximate Analysis of Coal; GB/T 212; Standardization Administration of the People’s Republic of China: Beijing, China, 2008; pp. 1–15.
- Pore Size Distribution and Porosity of Solid Materials by Mercury Porosimetry and Gas Adsorption Part 1: Mercury Porosimetry; GB/T 21650.1; Standardization Administration of the People’s Republic of China: Beijing, China, 2008; pp. 1–18.
- Yao, Y.B.; Liu, D.M. Advanced Characterization of Pores and Fractures in Coals by Nuclear Magnetic Resonance and X-ray Computed Tomography. Sci. China Ser. D Earth Sci. 2010, 53, 854–862. [Google Scholar] [CrossRef]
- Kleinberg, R.L. Utility of NMR T2 Distributions, Connection with Capillary Pressure, Clay Effect, and Determination of The Surface Relaxivity Parameter ρ2. Magn. Reson. Imag. 1996, 14, 761–767. [Google Scholar] [CrossRef]
- Cohen, M.H.; Mendelson, K.S. Nuclear Magnetic Relaxation and the Internal Geometry of Sedimentary Rocks. J. Appl. Phys. 1982, 53, 1127–1135. [Google Scholar] [CrossRef]
- Harmer, J.; Callcott, T.; Maeder, M.; Smith, B.E. A Novel Approach for Coal Characterization by NMR Spectroscopy: Global Analysis of Proton T1 and T2 Relaxations. Fuel 2001, 80, 417–425. [Google Scholar] [CrossRef]
- Rock Capillary Pressure Measurement; GB/T 29171; Standardization Administration of the People’s Republic of China: Beijing, China, 2012; pp. 1–24.
- Finn, R. Capillary Surface Interfaces. Notices AMS 1999, 46, 771–781. [Google Scholar]
- Washburn, E.W. The Dynamics of Capillary Flow. Phys. Rev. 1921, 17, 273–283. [Google Scholar] [CrossRef]
- Timur, A. An Investigation of Permeability, Porosity, and Residual Water Saturation Relationship for Sandstone Reservoirs. In Proceedings of the SPWLA 9th Annual Logging Symposium, New Orleans, LA, USA, 23–26 June 1968. [Google Scholar]
- Coates, G.; Denoo, S. The Producibility Answer Product. Tech. Rev. 1981, 29, 54–63. [Google Scholar]
- Kenyon, W.E.; Day, P.I.; Straley, C.; Willemsen, J.F. A Three-part Study of NMR longitudinal Relaxation Properties of Water-saturated Sandstones. SPE Form. Eval. 1988, 3, 622–636. [Google Scholar] [CrossRef]
- Timur, A. Pulsed Nuclear Magnetic Resonance Studies of Porosity, Movable Fluid, and permeability of Sandstones. J. Pet. Technol. 1969, 21, 775–786. [Google Scholar] [CrossRef]
- Coates, G.R.; Xiao, L.; Prammer, M.G. NMR Logging Principles and Applications; Haliburton Energy Service: Houston, TX, USA, 1999; Volume 234. [Google Scholar]
- Westphal, H.; Surholt, I.; Kiesl, C.; Thern, H.F.; Kruspe, T. NMR Measurements in Carbonate Rocks: Problems and an Approach to a Solution. Pure Appl. Geophys. 2005, 162, 549–570. [Google Scholar] [CrossRef]
- Carman, P.C. Permeability of Saturated Sands, Soils and Clays. J. Agric. Sci. 1939, 29, 262–273. [Google Scholar] [CrossRef]
- Carman, P.C. Fluid Flow Through Granular Beds. Chem. Eng. Res. Des. 1997, 75, S32–S48. [Google Scholar] [CrossRef]
- Pape, H.; Clauser, C.; Iffland, J. Variation of Permeability with Porosity in Sandstone Diagenesis Interpreted with a Fractal Pore Space Model. Pure Appl. Geophys. 2000, 157, 603–619. [Google Scholar] [CrossRef]
- Yu, B.; Li, J. A Geometry Model for Tortuosity of Flow Path in Porous Media. Chin. Phys. Lett. 2004, 21, 1569–1571. [Google Scholar] [CrossRef]
- Shan, C.; Zhang, T.; Guo, J.; Zhang, Z.; Yang, Y. Characterization of the Micropore Systems in the high-rank Coal Reservoirs of the Southern Sichuan Basin, China. AAPG Bull. 2015, 99, 2099–2119. [Google Scholar] [CrossRef]
- Choi, J.G.; Do, D.D.; Do, H.D. Surface diffusion of adsorbed molecules in porous media: Monolayer, multilayer, and capillary condensation regimes. Ind. Eng. Chem. Res. 2001, 40, 4005–4031. [Google Scholar] [CrossRef]
- Si, L.; Li, Z.; Yang, Y. Coal Permeability Evolution with the Interaction Between Nanopore and Fracture: Its Application in Coal Mine Gas Drainage for Qingdong Coal Mine in Huaibei Coalfield, China. J. Nat. Gas Sci. Eng. 2018, 56, 523–535. [Google Scholar] [CrossRef]
Figure 1.
Coal samples used in the NMR experiment.

Figure 2.
T2 distribution of the coal samples of different ranks: (a) CZ-1 and CZ-4; (b) CZ-2 and CZ-3; (c) WY-1 and WY-2; (d) YJL-1 and YJL-2.
Figure 2.
T2 distribution of the coal samples of different ranks: (a) CZ-1 and CZ-4; (b) CZ-2 and CZ-3; (c) WY-1 and WY-2; (d) YJL-1 and YJL-2.

Figure 3.
SEM images of pores, micro-fissures, and fissures. (a) Fissures with widths larger than 2.5 μm in YJL coal samples (×200); (b) Fissures with widths less than 2.5 μm (×600); (c) Enlarged image of (b) (×20,000); (d) Nanopores in the coal matrix (×1000); (e) Enlarged image of (c) (×30,000); (f) Nanopores in the CZ coal samples (×1200); (g) Enlarged image of (f) (×30,000); (h) Fissures in the CZ coal samples (×140); (i) Nanopores in the WY coal samples (×2000); (j) Enlarged image of (i) (×20,000); (k) Micro-fissures in the WY coal samples (×13,000); (l) Fissures in the WY coal samples (×150).

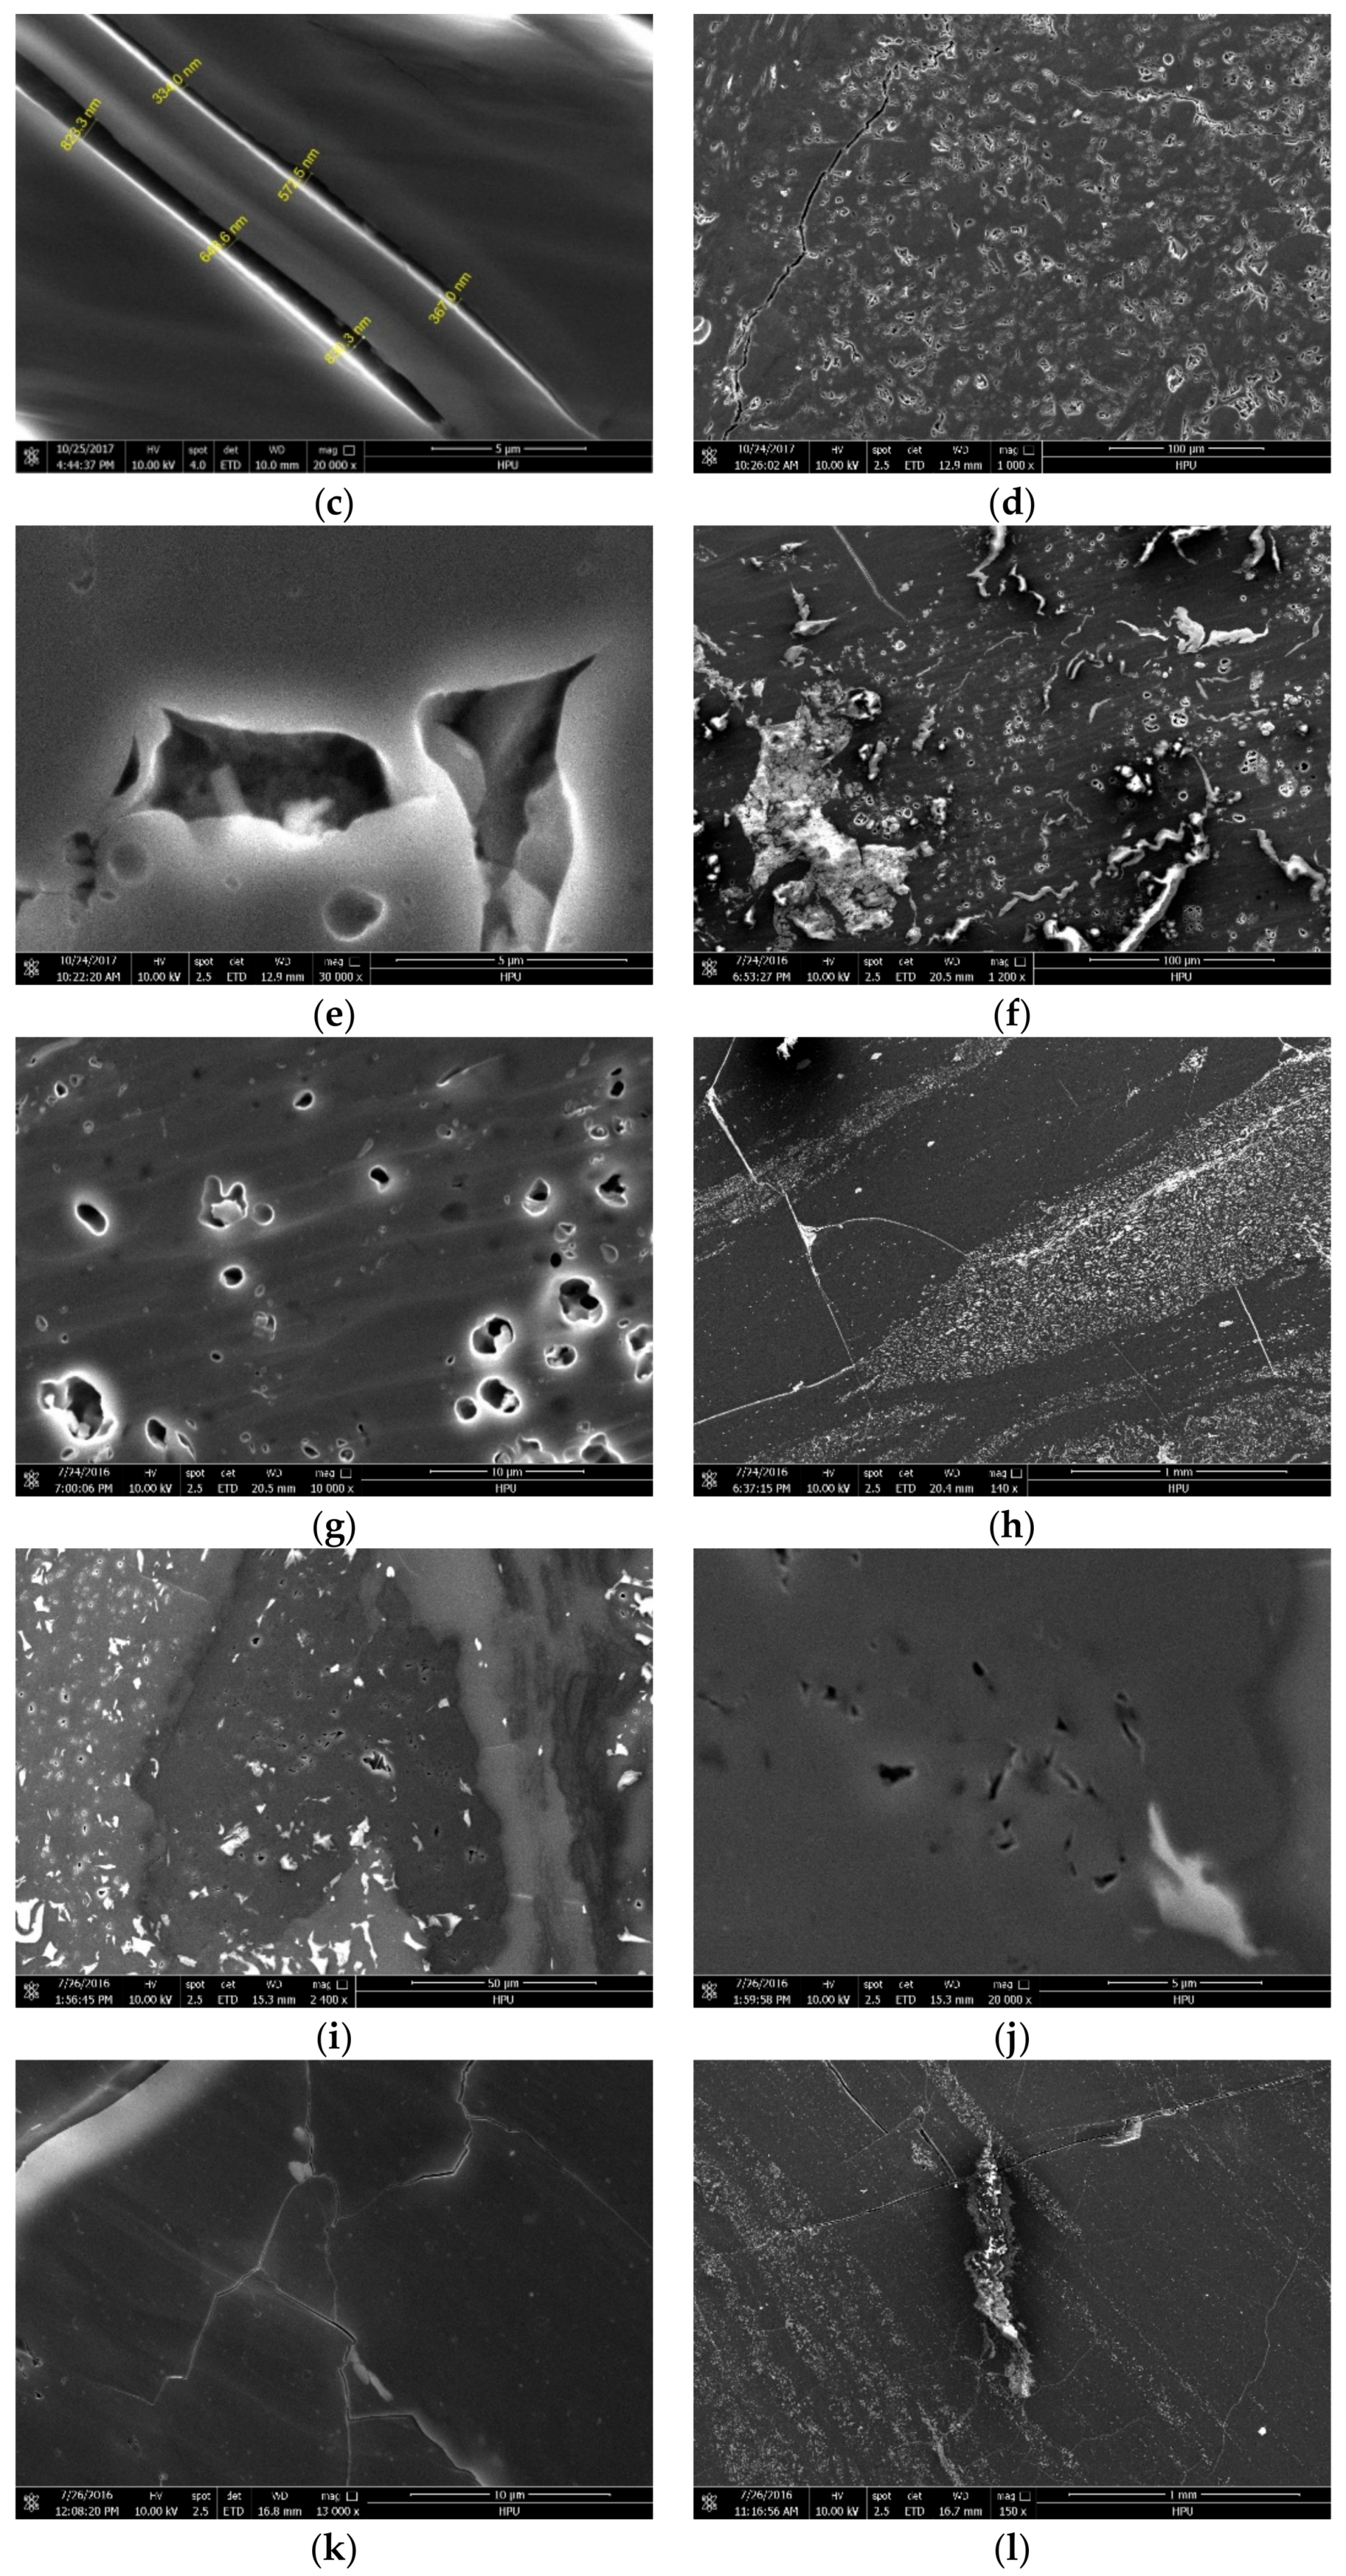
Figure 4.
T2 distribution under different full water times.

Figure 5.
T2 distribution of different centrifugal states.

Figure 6.
Migration of water in coal under centrifugal force.

Figure 7.
Pore classification by T2 accumulate curve.
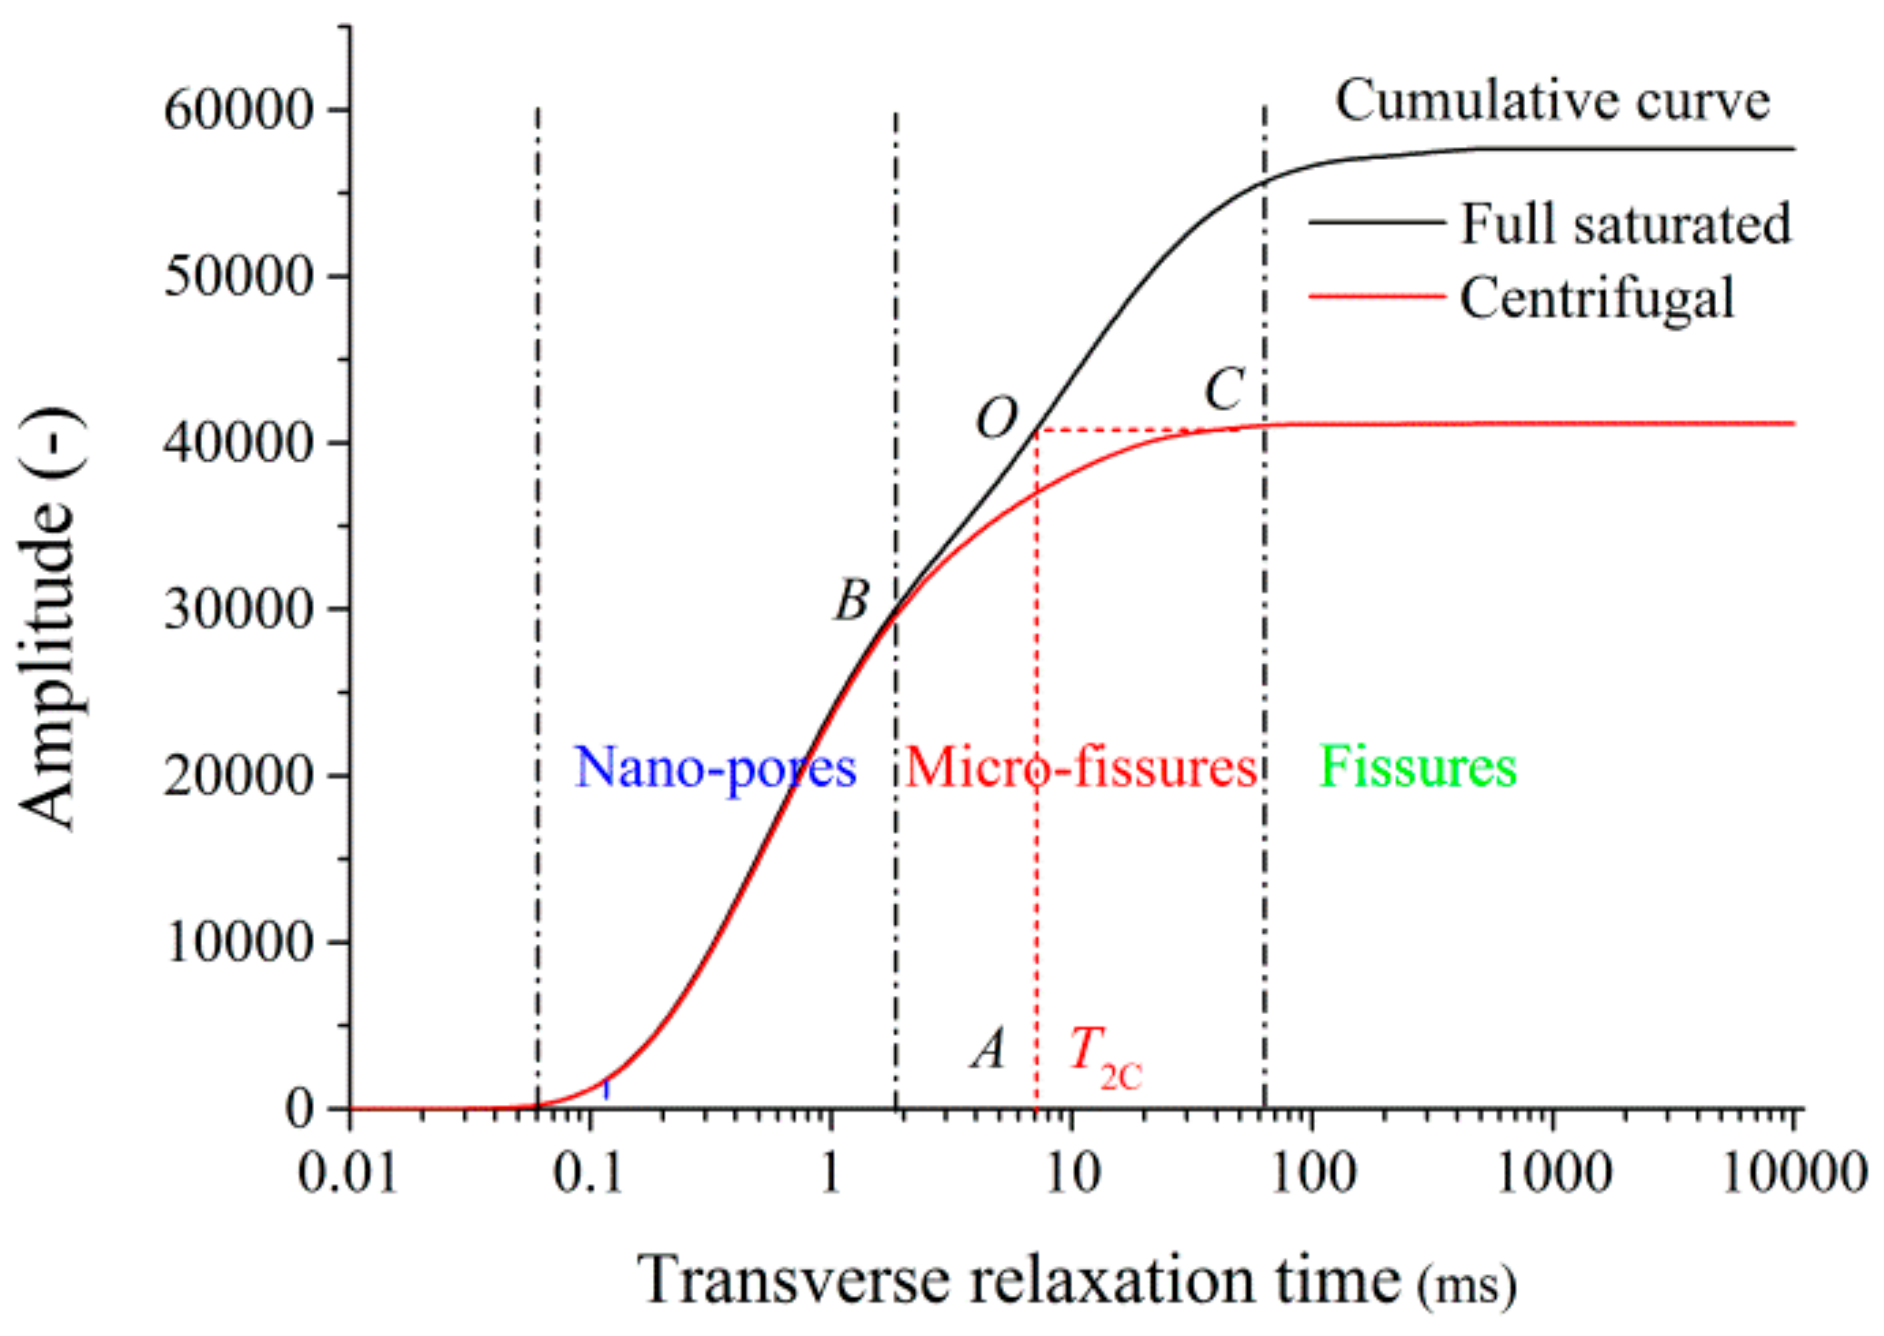
Figure 8.
Comparison of pore characteristics of the YJL coal samples by mercury intrusion porosimetry (MIP) and NMR.
Figure 8.
Comparison of pore characteristics of the YJL coal samples by mercury intrusion porosimetry (MIP) and NMR.


Table 1.
Coal sample information, proximate analysis, and vitrinite reflectance.
| Sample ID | Mining Area | Sample Direction | Coal Rank | Ro,max (%) | Mad (%) | Ad (%) | Vdaf (%) | FCd (%) |
|---|---|---|---|---|---|---|---|---|
| CZ-1 | Jincheng | bedding | anthracitic | 2.69 | 3.53 | 9.72 | 7.23 | 83.75 |
| CZ-2 | Jincheng | bedding | anthracitic | 2.87 | 2.58 | 9.90 | 7.72 | 83.14 |
| CZ-3 | Jincheng | vertical | anthracitic | 2.79 | 2.56 | 9.87 | 7.74 | 83.15 |
| CZ-4 | Jincheng | bedding | anthracitic | 3.10 | 3.46 | 11.45 | 7.32 | 82.07 |
| WY-1 | Luan | bedding | bitumite | 1.94 | 1.03 | 8.91 | 13.13 | 79.13 |
| WY-2 | Luan | vertical | bitumite | 2.05 | 1.00 | 8.92 | 13.20 | 79.06 |
| YJL-1 | Yulin | bedding | sub-bitumite | 0.66 | 6.17 | 3.77 | 29.51 | 67.83 |
| YJL-2 | Yulin | vertical | sub-bitumite | 0.69 | 6.18 | 3.78 | 29.51 | 67.83 |
Ro,max, max vitrinite reflectance; Mad, moisture (as air-dried basis); Ad, ash (as dry basis); Vdaf, volatile (as dry, ash-free basis); FCd, fixed carbon (as dry basis); CZ, Chengzhuang coal mine; WY, Wuyang coal mine; YJL, Yujialiang coal mine.
Table 2.
NMR porosity of coal samples.
| Sample ID | Volume (cm3) | ρ (g/cm3) | Suv | ϕt (%) | ϕp (%) | ϕmf (%) | ϕf (%) |
|---|---|---|---|---|---|---|---|
| CZ-1 | 25.36 | 1.47 | 1031.45 | 8.26 | 8.18 | 0 | 0.08 |
| CZ-2 | 25.44 | 1.47 | 1016.76 | 8.14 | 7.96 | 0 | 0.17 |
| CZ-3 | 25.16 | 1.45 | 977.27 | 7.83 | 7.65 | 0 | 0.17 |
| CZ-4 | 25.82 | 1.49 | 955.97 | 7.66 | 7.56 | 0 | 0.10 |
| WY-1 | 24.84 | 1.42 | 372.77 | 3.05 | 2.58 | 0.36 | 0.11 |
| WY-2 | 24.80 | 1.40 | 334.02 | 2.75 | 2.34 | 0.30 | 0.10 |
| YJL-1 | 25.05 | 1.32 | 1900.47 | 15.12 | 9.43 | 5.53 | 0.16 |
| YJL-2 | 25.19 | 1.33 | 1831.65 | 14.58 | 8.67 | 5.78 | 0.13 |
ρ is the density of the coal samples; ϕt, ϕp, ϕmf, ϕf is the porosity of the total, nanopores, micro-fissures, and fissures, respectively.
Table 3.
Pore characteristic parameters of the coal samples.
| Sample ID | T2C (ms) | FFI (%) | BVI (%) | ϕFFI (%) | ϕBVI (%) | ϕCFFI (%) |
|---|---|---|---|---|---|---|
| CZ-1 | 1.78 | 17.95 | 82.05 | 1.48 | 6.78 | 1.36 |
| CZ-2 | 1.84 | 16.99 | 83.01 | 1.38 | 6.76 | 1.41 |
| CZ-3 | 1.88 | 16.93 | 83.07 | 1.33 | 6.50 | 1.36 |
| CZ-4 | 1.93 | 16.91 | 83.09 | 1.30 | 6.36 | 1.28 |
| WY-1 | 1.36 | 23.35 | 76.65 | 0.71 | 2.34 | 0.68 |
| WY-2 | 1.76 | 23.05 | 76.95 | 0.63 | 2.12 | 0.61 |
| YJL-1 | 6.94 | 28.79 | 71.21 | 4.35 | 10.77 | 4.26 |
| YJL-2 | 7.39 | 28.61 | 71.39 | 4.17 | 10.41 | 4.23 |
T2C is the T2 cutoff value; BVI is bound water volume index; and ϕCFFI is the movable fluid porosity by fitting equation.
Table 4.
Permeability of coal samples by several calculation models.
| Sample ID | T2,log mean | Sp (m−1) | DNMR | kTC (mD) | ks (mD) | kpp (mD) | kCR (mD) | kNMRF (mD) | kT (mD) |
|---|---|---|---|---|---|---|---|---|---|
| CZ-1 | 0.93 | 0.48 | 2.9933 | 0.0936 | 0.0284 | 0.9295 | 10.4002 | 0.9810 | 0.0317 |
| CZ-2 | 1.14 | 0.50 | 2.9912 | 0.0772 | 0.0400 | 0.8249 | 7.7132 | 0.8979 | 0.1317 |
| CZ-3 | 1.01 | 0.51 | 2.9903 | 0.0656 | 0.0267 | 0.7681 | 6.4302 | 0.8655 | 0.0067 |
| CZ-4 | 0.97 | 0.48 | 2.9923 | 0.0599 | 0.0229 | 0.7391 | 5.8221 | 0.9762 | 0.0215 |
| WY-1 | 0.83 | 9.32 | 2.9633 | 0.0034 | 0.0004 | 0.2904 | 0.4461 | 0.0024 | 0.0998 |
| WY-2 | 0.88 | 9.96 | 2.9616 | 0.0022 | 0.0003 | 0.2436 | 0.2705 | 0.0021 | 0.0033 |
| YJL-1 | 2.16 | 430.24 | 2.9442 | 3.5890 | 1.7126 | 11.7815 | 6.0027 | 1.0068 × 10⁻⁶ | 2.2253 |
| YJL-2 | 2.18 | 450.66 | 2.9434 | 3.0460 | 1.5007 | 10.2214 | 5.0976 | 1.1061 × 10⁻⁶ | 1.7177 |
kTC, ks, kCR are the permeability calculated by NMR porosity and models of TC, SDR, CR. kpp, kCR, kNMRF are the permeabilities calculated by the NMR movable fluid porosity and models of PP, CR, NMRF. kT is the permeability measured in the laboratory with nitrogen.
© 2018 by the authors. Licensee MDPI, Basel, Switzerland. This article is an open access article distributed under the terms and conditions of the Creative Commons Attribution (CC BY) license (http://creativecommons.org/licenses/by/4.0/).
Share and Cite
MDPI and ACS Style
Ji, X.; Song, D.; Zhao, H.; Li, Y.; He, K. Experimental Analysis of Pore and Permeability Characteristics of Coal by Low-Field NMR. Appl. Sci. 2018, 8, 1374. https://doi.org/10.3390/app8081374
AMA Style
Ji X, Song D, Zhao H, Li Y, He K. Experimental Analysis of Pore and Permeability Characteristics of Coal by Low-Field NMR. Applied Sciences. 2018; 8(8):1374. https://doi.org/10.3390/app8081374
Chicago/Turabian StyleJi, Xiaofeng, Dangyu Song, Haotian Zhao, Yunbo Li, and Kaikai He. 2018. "Experimental Analysis of Pore and Permeability Characteristics of Coal by Low-Field NMR" Applied Sciences 8, no. 8: 1374. https://doi.org/10.3390/app8081374
Note that from the first issue of 2016, this journal uses article numbers instead of page numbers. See further details here.