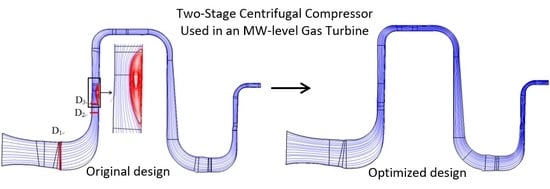
Analysis and Improvement of a Two-Stage Centrifugal Compressor Used in an MW-Level Gas Turbine


Key Laboratory for Thermal Science and Power Engineering of Ministry of Education, Department of Energy and Power Engineering, Tsinghua University, Beijing 100084, China
*
Author to whom correspondence should be addressed.
Appl. Sci. 2018, 8(8), 1347; https://doi.org/10.3390/app8081347
Submission received: 6 July 2018
/
Revised: 1 August 2018
/
Accepted: 7 August 2018
/
Published: 10 August 2018
(This article belongs to the Special Issue Radial Turbomachinery Aerodynamics)
Abstract
:Featured Application
A two-stage centrifugal compressor used in an MW-level gas turbine is optimized, especially for diffusers. The experiences can also be used for other similar equipment.
Abstract
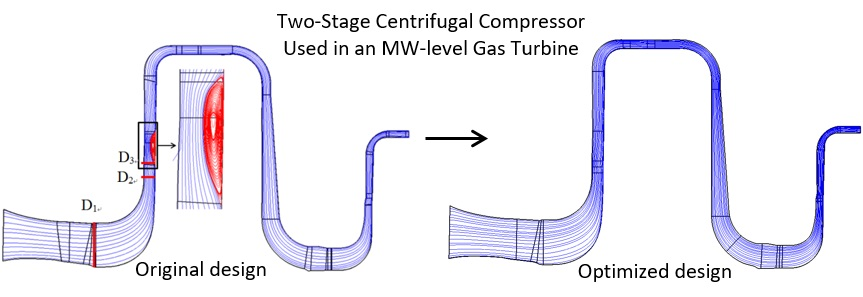
The performance of a low/high-pressure-stage centrifugal compressor in a land-use MW-level gas turbine with a pressure ratio of approximately 11 is analyzed and optimized with a 1D aerodynamic design and modeling optimization system. 1D optimization results indicate that the diameter ratio of the low-pressure-stage centrifugal compressor with a vane-less diffuser, and the divergent angle of the high-pressure-stage centrifugal compressor with a vaned diffuser, are extremely large and result in low efficiency. Through modeling design and optimization system analysis, a tandem vaned diffuser is used in the low-pressure stage, and a tandem vaned diffuser with splitter vanes is adopted in the high-pressure stage. Computational fluid dynamics (CFD) results show that the pressure ratio and efficiency of the optimized low/high-pressure-stage centrifugal compressor are significantly improved. Coupling calculations of the low/high-pressure stage of the original and optimized designs are conducted based on the results of MW-level gas turbine cycles. CFD results show that the pressure ratio and efficiency of the optimized two-stage centrifugal compressor increase by approximately 8% and 4%, respectively, under three typical load conditions of 100%, 90%, and 60%.
1. Introduction
As pressure-generator devices, centrifugal compressors have been applied in the industry since the 19th century [1]. Centrifugal compressors are commonly used when the flow rate is low, typically 1~4 kg/s. Experimental research on the application of centrifugal compressors to gas turbines began in the early 20th century. In 1903, Elling [2] successfully built a gas turbine that could transmit power outward. The real motivation for research on centrifugal compressors was the application of these machines in flight propulsion. From 1928–1941, Frank Whittle, a British engineer, and Hans Joachim Pabst von Ohain, a German physicist, independently developed the world’s first jet engine. They adopted a centrifugal compressor for the selected air compressor device. Gas turbines with centrifugal compressors are frequently used in the engines of tanks or small aircraft due to their limited through-current capacity. The pursuit of a compact engine and a high thrust-to-weight ratio promoted the development of centrifugal compressors decades after the invention of jet engines. In the past 60 years, many scholars have investigated centrifugal compressors and obtained a deep understanding of the internal flow phenomenon.
In 1976, Eckardt [3] measured the jet-wake phenomenon in the outlet of a centrifugal compressor with a pressure ratio of 2.1. Karin [4] also measured a centrifugal compressor with a pressure ratio of 4. Hah [5] performed a 3D numerical simulation of a centrifugal compressor. Krain [6,7] measured the shock wave in the inlet of a centrifugal compressor that had an inlet tip Mach number of 1.3 and a pressure ratio of 6.1. Hah [8] conducted a numerical simulation of this centrifugal compressor. Meanwhile, Senoo [9] measured the shock wave and pressure distribution in the inlet of a centrifugal compressor with a pressure ratio of 10. Higashimori [10,11] measured a centrifugal compressor with a pressure ratio of 11 and analyzed its flow characteristic. Hosseini [12] investigated the effects of the radial gap ratio on a high-pressure ratio centrifugal compressor and the flow phenomena inside the compressor components by using numerical simulations. Ebrahimi [13] analyzed the matching of the vaned diffuser with the impeller for different working conditions. Sun [14] investigated the flow instability of centrifugal compressors with vaned diffusers experimentally and presented diverse instability patterns and transient behavior in detail. Zheng [15] investigated the instability mechanisms of a high-speed turbocharger centrifugal compressor with a vaneless diffuser using the unsteady simulation method.
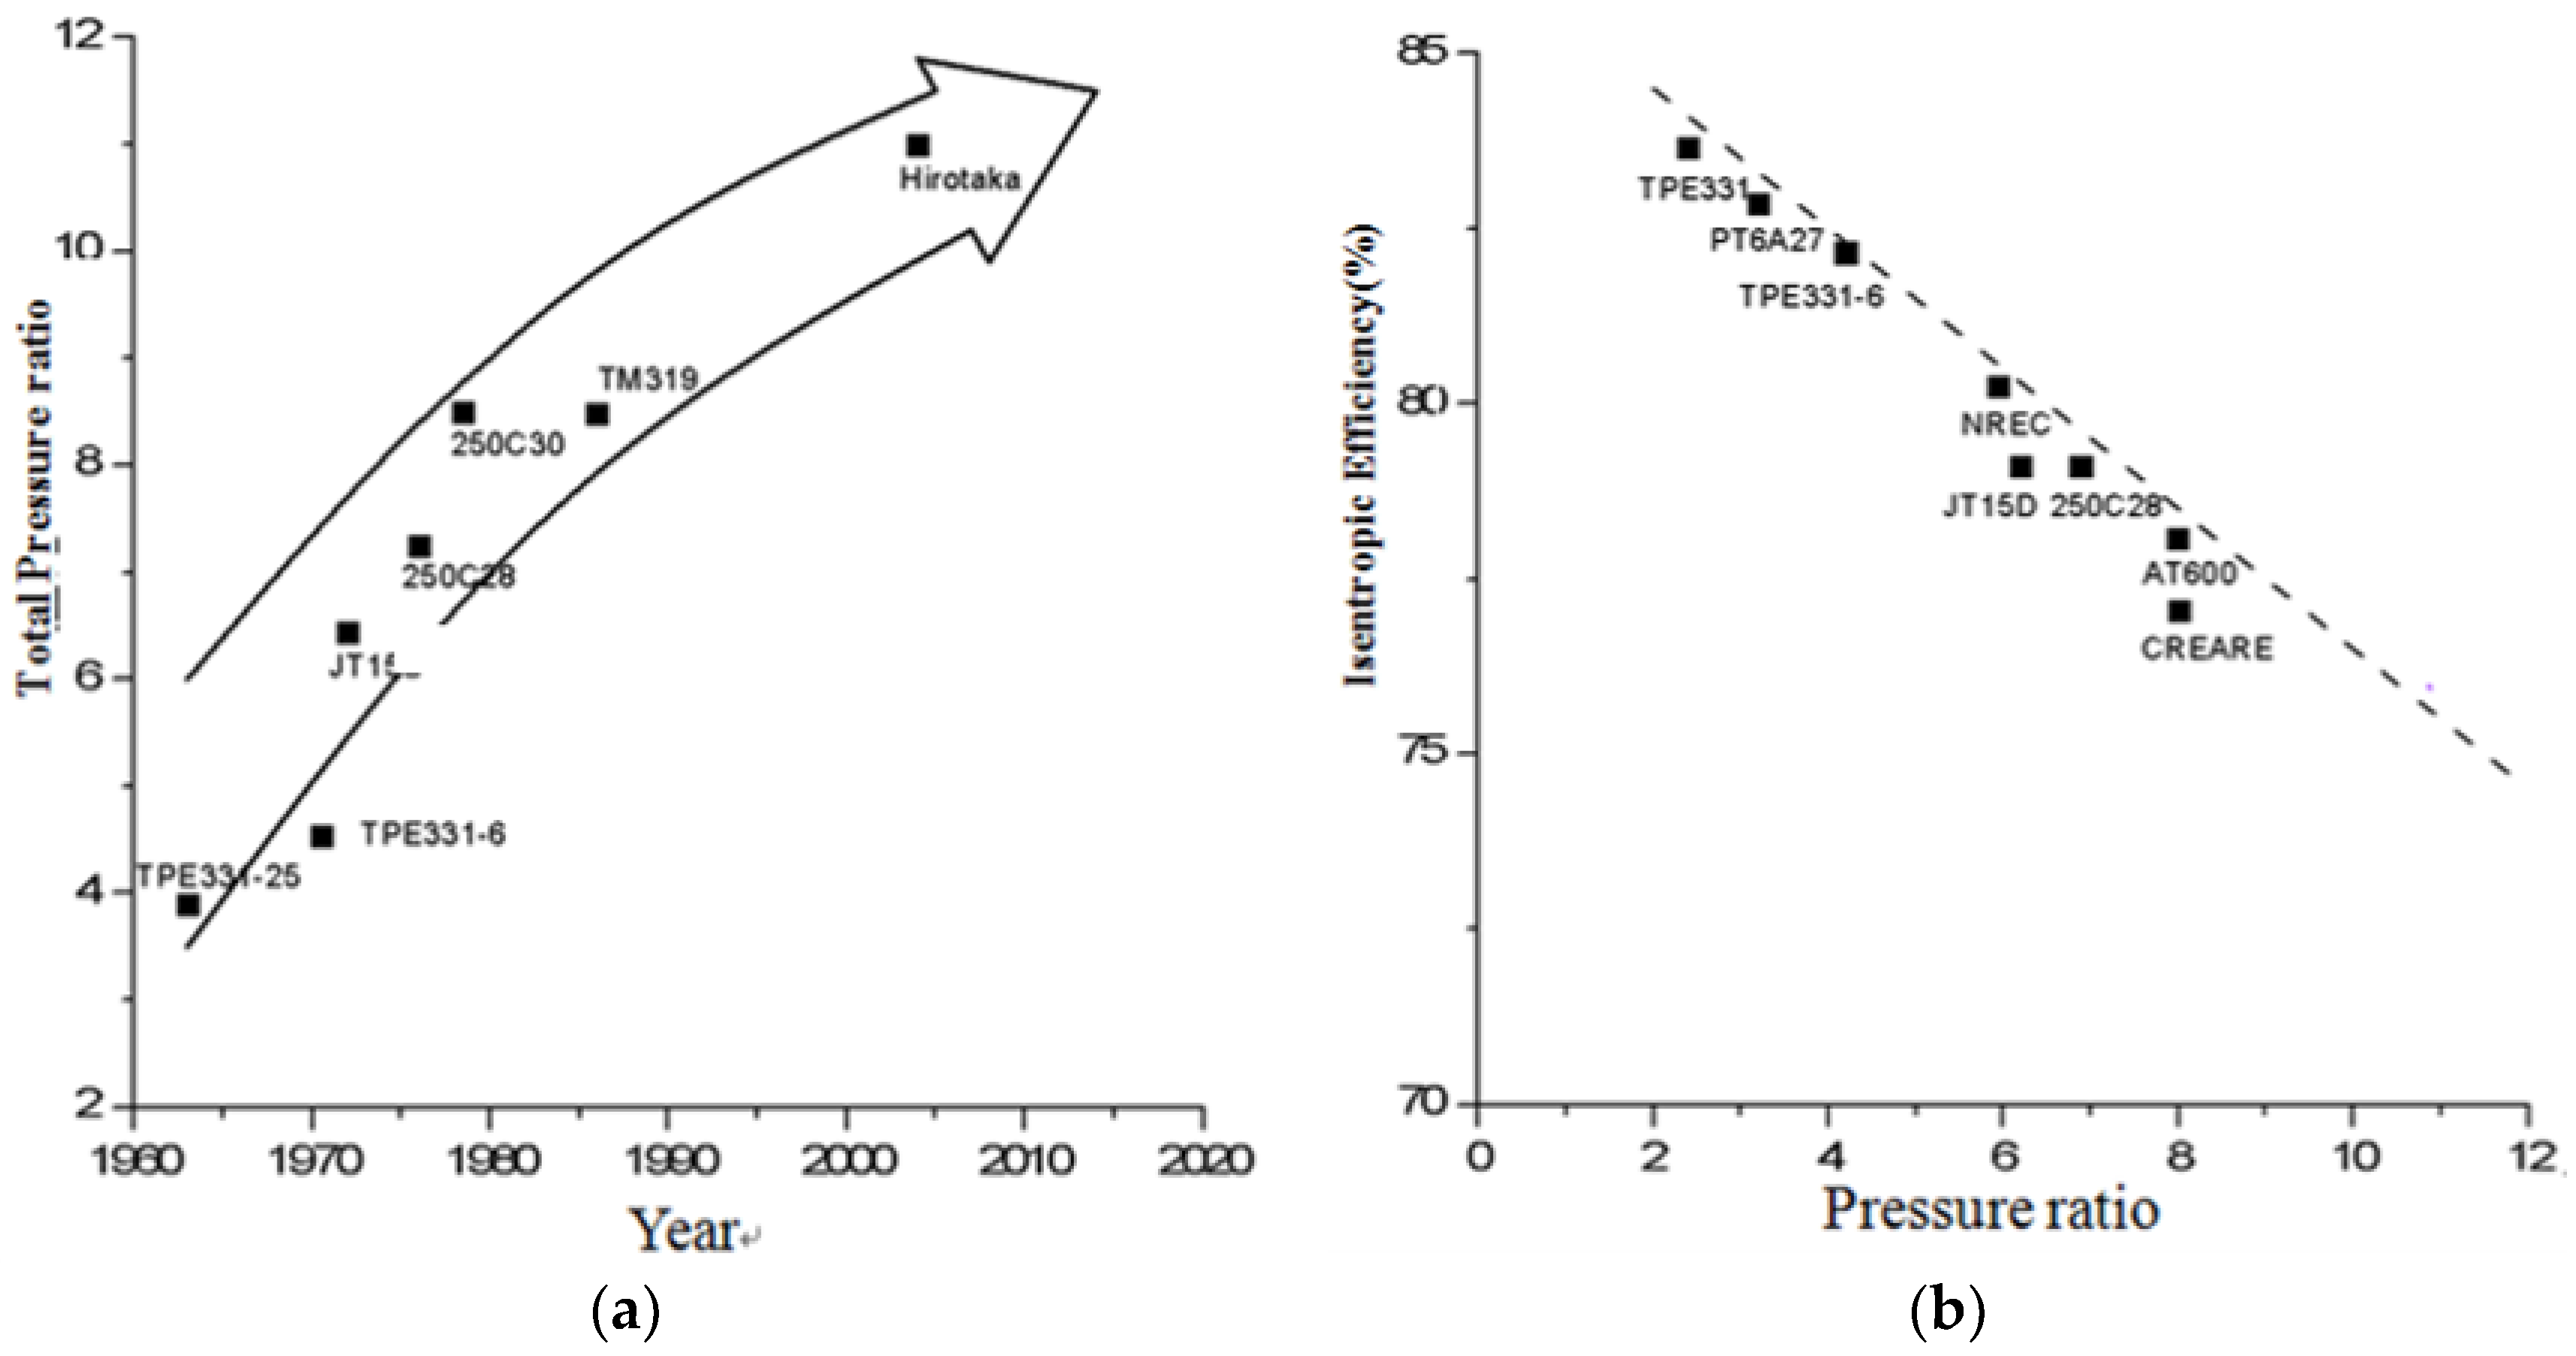
Figure 1 shows the development trend of centrifugal compressors for commercial use during the past few decades. The pressure ratios of single-stage centrifugal compressors have improved continually, and centrifugal compressors with single-stage pressure ratios over 10 have been put into practical use.
The required pressure ratio for a tank or helicopter engine is between 8 and 12, and the efficiency is approximately 80%. Centrifugal compressors with multi-stage low-load design are frequently adopted to obtain high efficiency and low cost. Considering that the ratio of a single-stage compressor cannot meet this requirement, gas turbines mostly adopt a two-stage centrifugal or multi-stage axis compressor with a single-stage centrifugal compressor, as shown in Figure 2. For example, the TPE331 turboprop engine developed by Garrett Al in 1959 uses a two-stage centrifugal compressor with a flow mass of 3.49 kg/s and a pressure ratio of 10.8 [16]. The Light Helicopter Turbine Engine Company [17] developed a high-performance two-stage centrifugal compressor for the T800-LHT-800 helicopter engine. Its design flow mass, compression ratio, adiabatic efficiency, and surge margin are 3.3 kg/s, 14:1, >80%, and >15%, respectively.
An MW-level engine compressor is composed of a low/high-pressure two-stage centrifugal compressor. The pressure ratio of this two-stage centrifugal compressor is approximately 11, resulting in poor performance. Ref. [18] adopted a 1D aerodynamic optimization design system and used the computational fluid dynamics (CFD) commercial software Numeca (Numeca, Brussels, Belgium) to perform numerical calculations, performance analysis, and optimization of the poor performance of the two-stage centrifugal compressor.
2. Analysis of the Performance of Low/High-Pressure Two-Stage Centrifugal Compressor
The structure of an MW-level gas turbine is shown in Figure 3. The low/high-pressure two-stage centrifugal compressor is composed of an inlet guide vane, an impeller, and a diffuser. A vaned diffuser is used to connect the two stages. The geometric structure of the centrifugal compressor is shown in Figure 4.
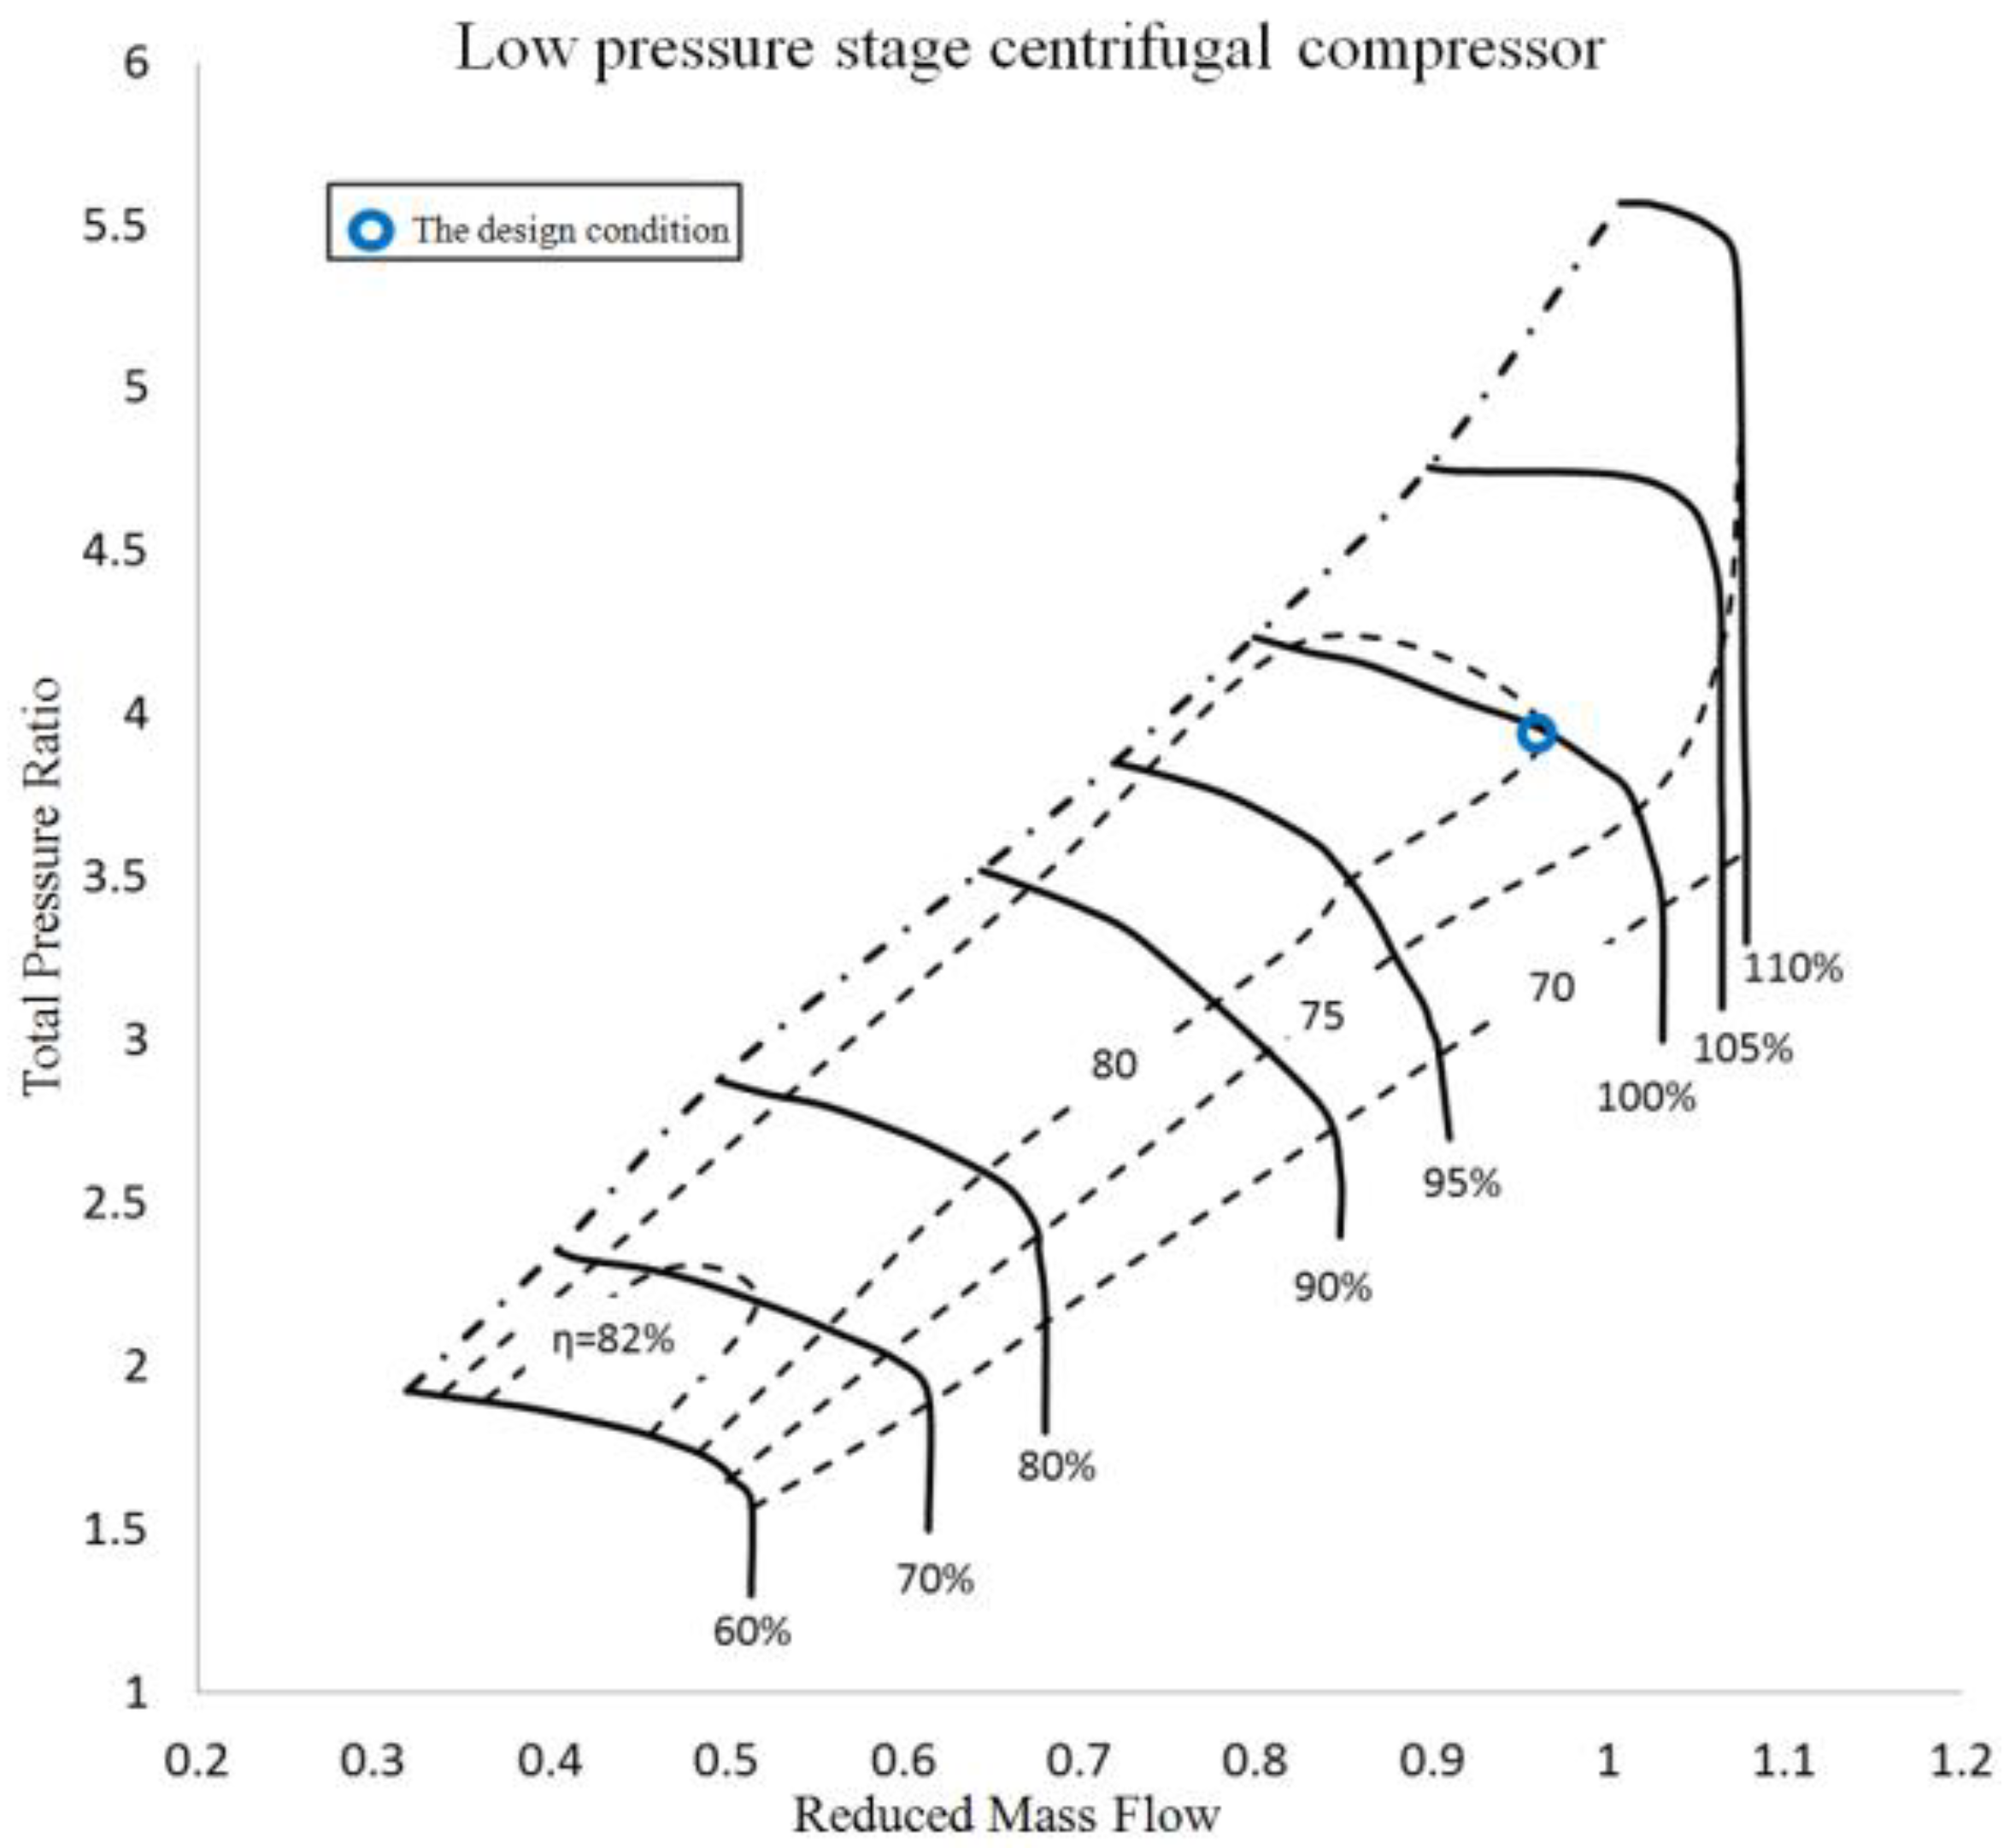
The low-pressure-stage impeller’s rotation speed is 28,000 rpm, and the rim speed is 478 m/s. Figure 5 shows the CFD calculation results for the performance curve of the low-pressure-stage centrifugal compressor. The pressure ratio of the low-pressure-stage centrifugal compressor is 3.92, and its efficiency is 79.9% in the design condition [18].
The high-pressure-stage impeller’s rotation speed is 38,000 rpm, and the rim speed is 501 m/s. Figure 6 shows the CFD calculation results for the performance curve of the high-pressure-stage centrifugal compressor. The pressure ratio of the high-pressure-stage centrifugal compressor is 2.85, and its efficiency is 80.5% in the design condition [18].
The performance analysis shows that the efficiency of the low/high-pressure two-stage centrifugal compressor is lower than that of a unit with a similar pressure ratio, as shown in Figure 1. This observation indicates that several limitations exist in the design of the low/high-pressure two-stage centrifugal compressor, and that the design needs to be optimized.
3. Optimization of the Low-Pressure-Stage Centrifugal Compressor
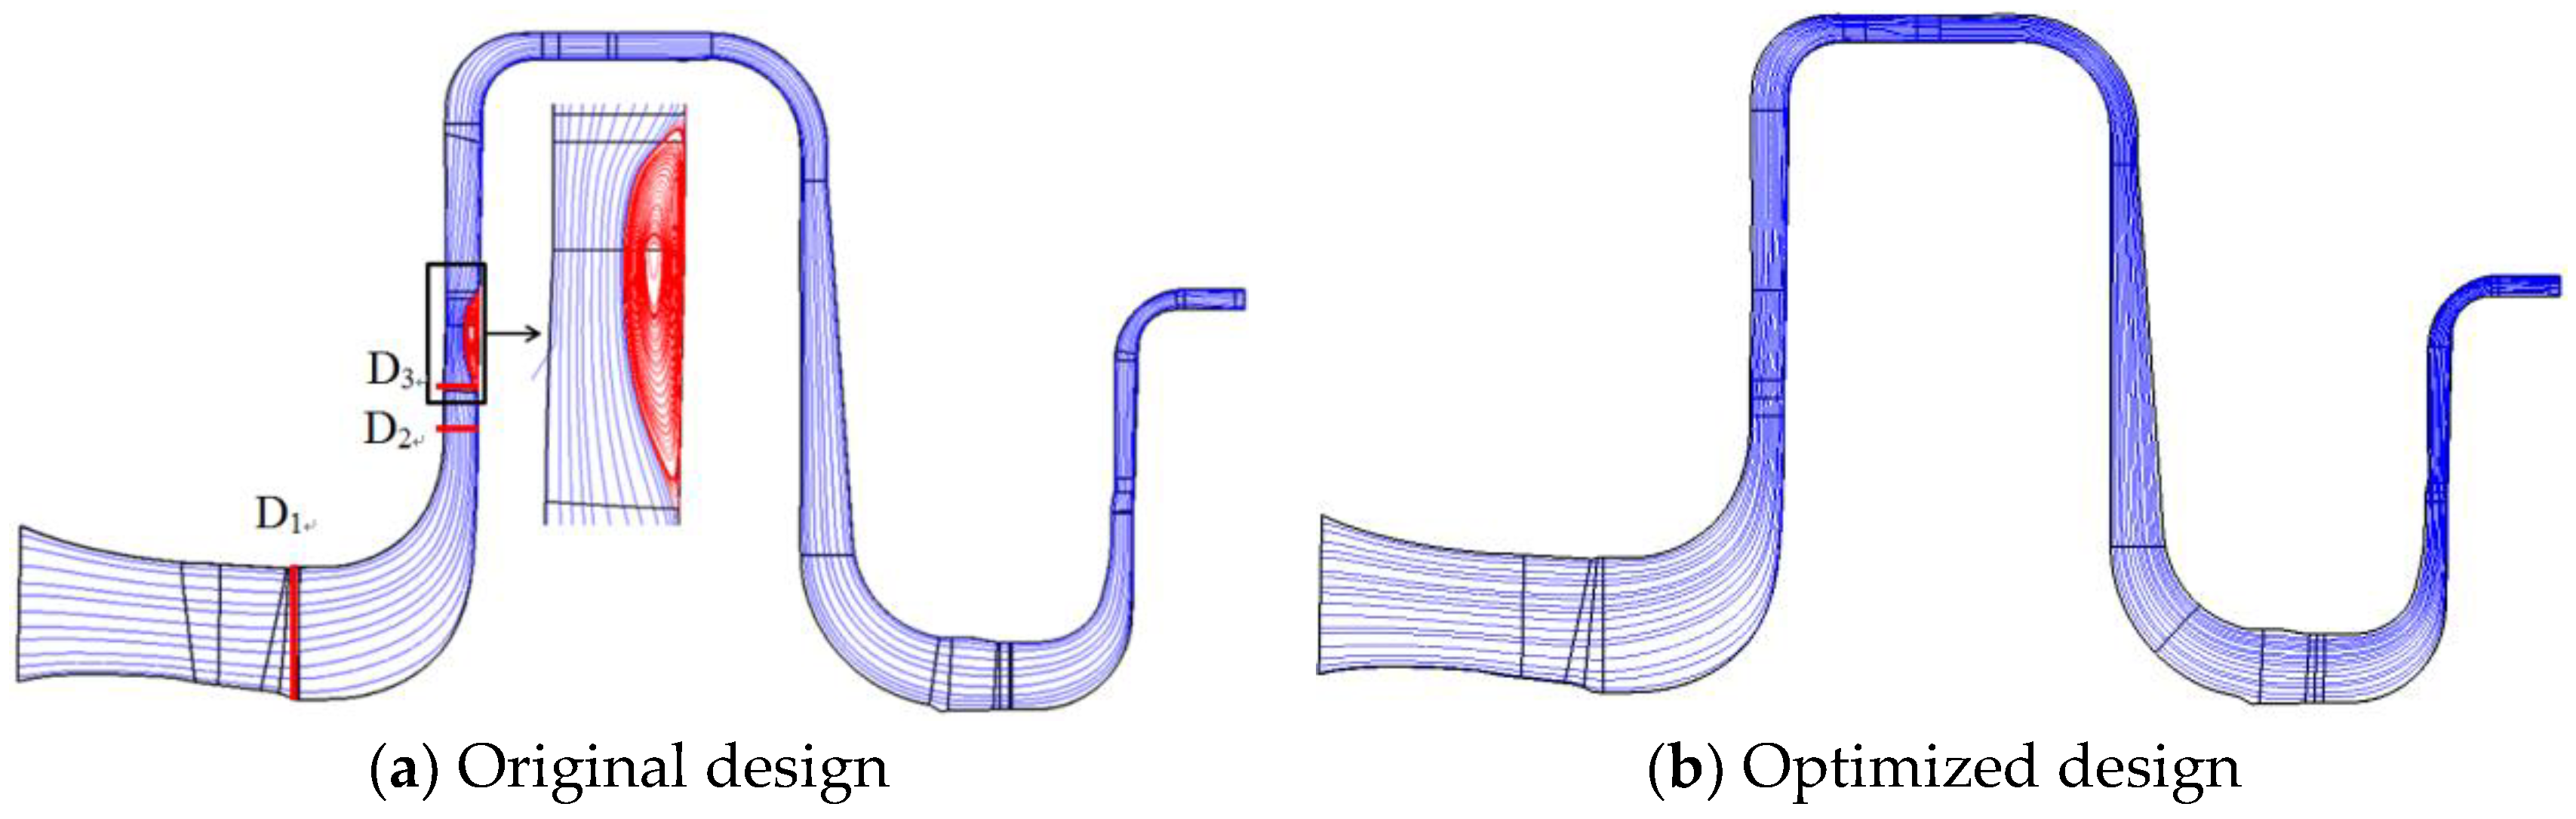
An optimized design system [18] was adopted to optimize the aerodynamic layout of the low-pressure-stage centrifugal compressor. A comparison of the parameters of the original and optimized designs is shown in Table 1. The geometric impeller parameters after optimization changed minimally and, mainly due to a slight increase in the outlet width, b2, the efficiency of the optimized design increased by approximately 0.3% compared with the original design. This result shows that the impeller parameters are set reasonably in the original design. After optimization, the outlet efficiency of the vaned diffuser was 2.29% higher than that of the original design. This finding indicates that the mismatch between the diffuser and impeller mainly leads to the low efficiency in the original design. For the vane-less diffuser, pressure can be increased by increasing diameter ratio D3/D2. However, if the increase in the diameter ratio is overly large, the efficiency of the entire stage would decrease. Thus, the ratio of D3/D2 = 1.05:1.2 is recommended. In the original design, the diameter ratio, D3/D2, is 1.34, which is much higher than the recommended value. In the optimized design, D3/D2 is 1.1, which is within the reasonable design range. Thus, the loss in the vane-less diffuser was significantly reduced, leading to an increase in the efficiency of the entire stage.
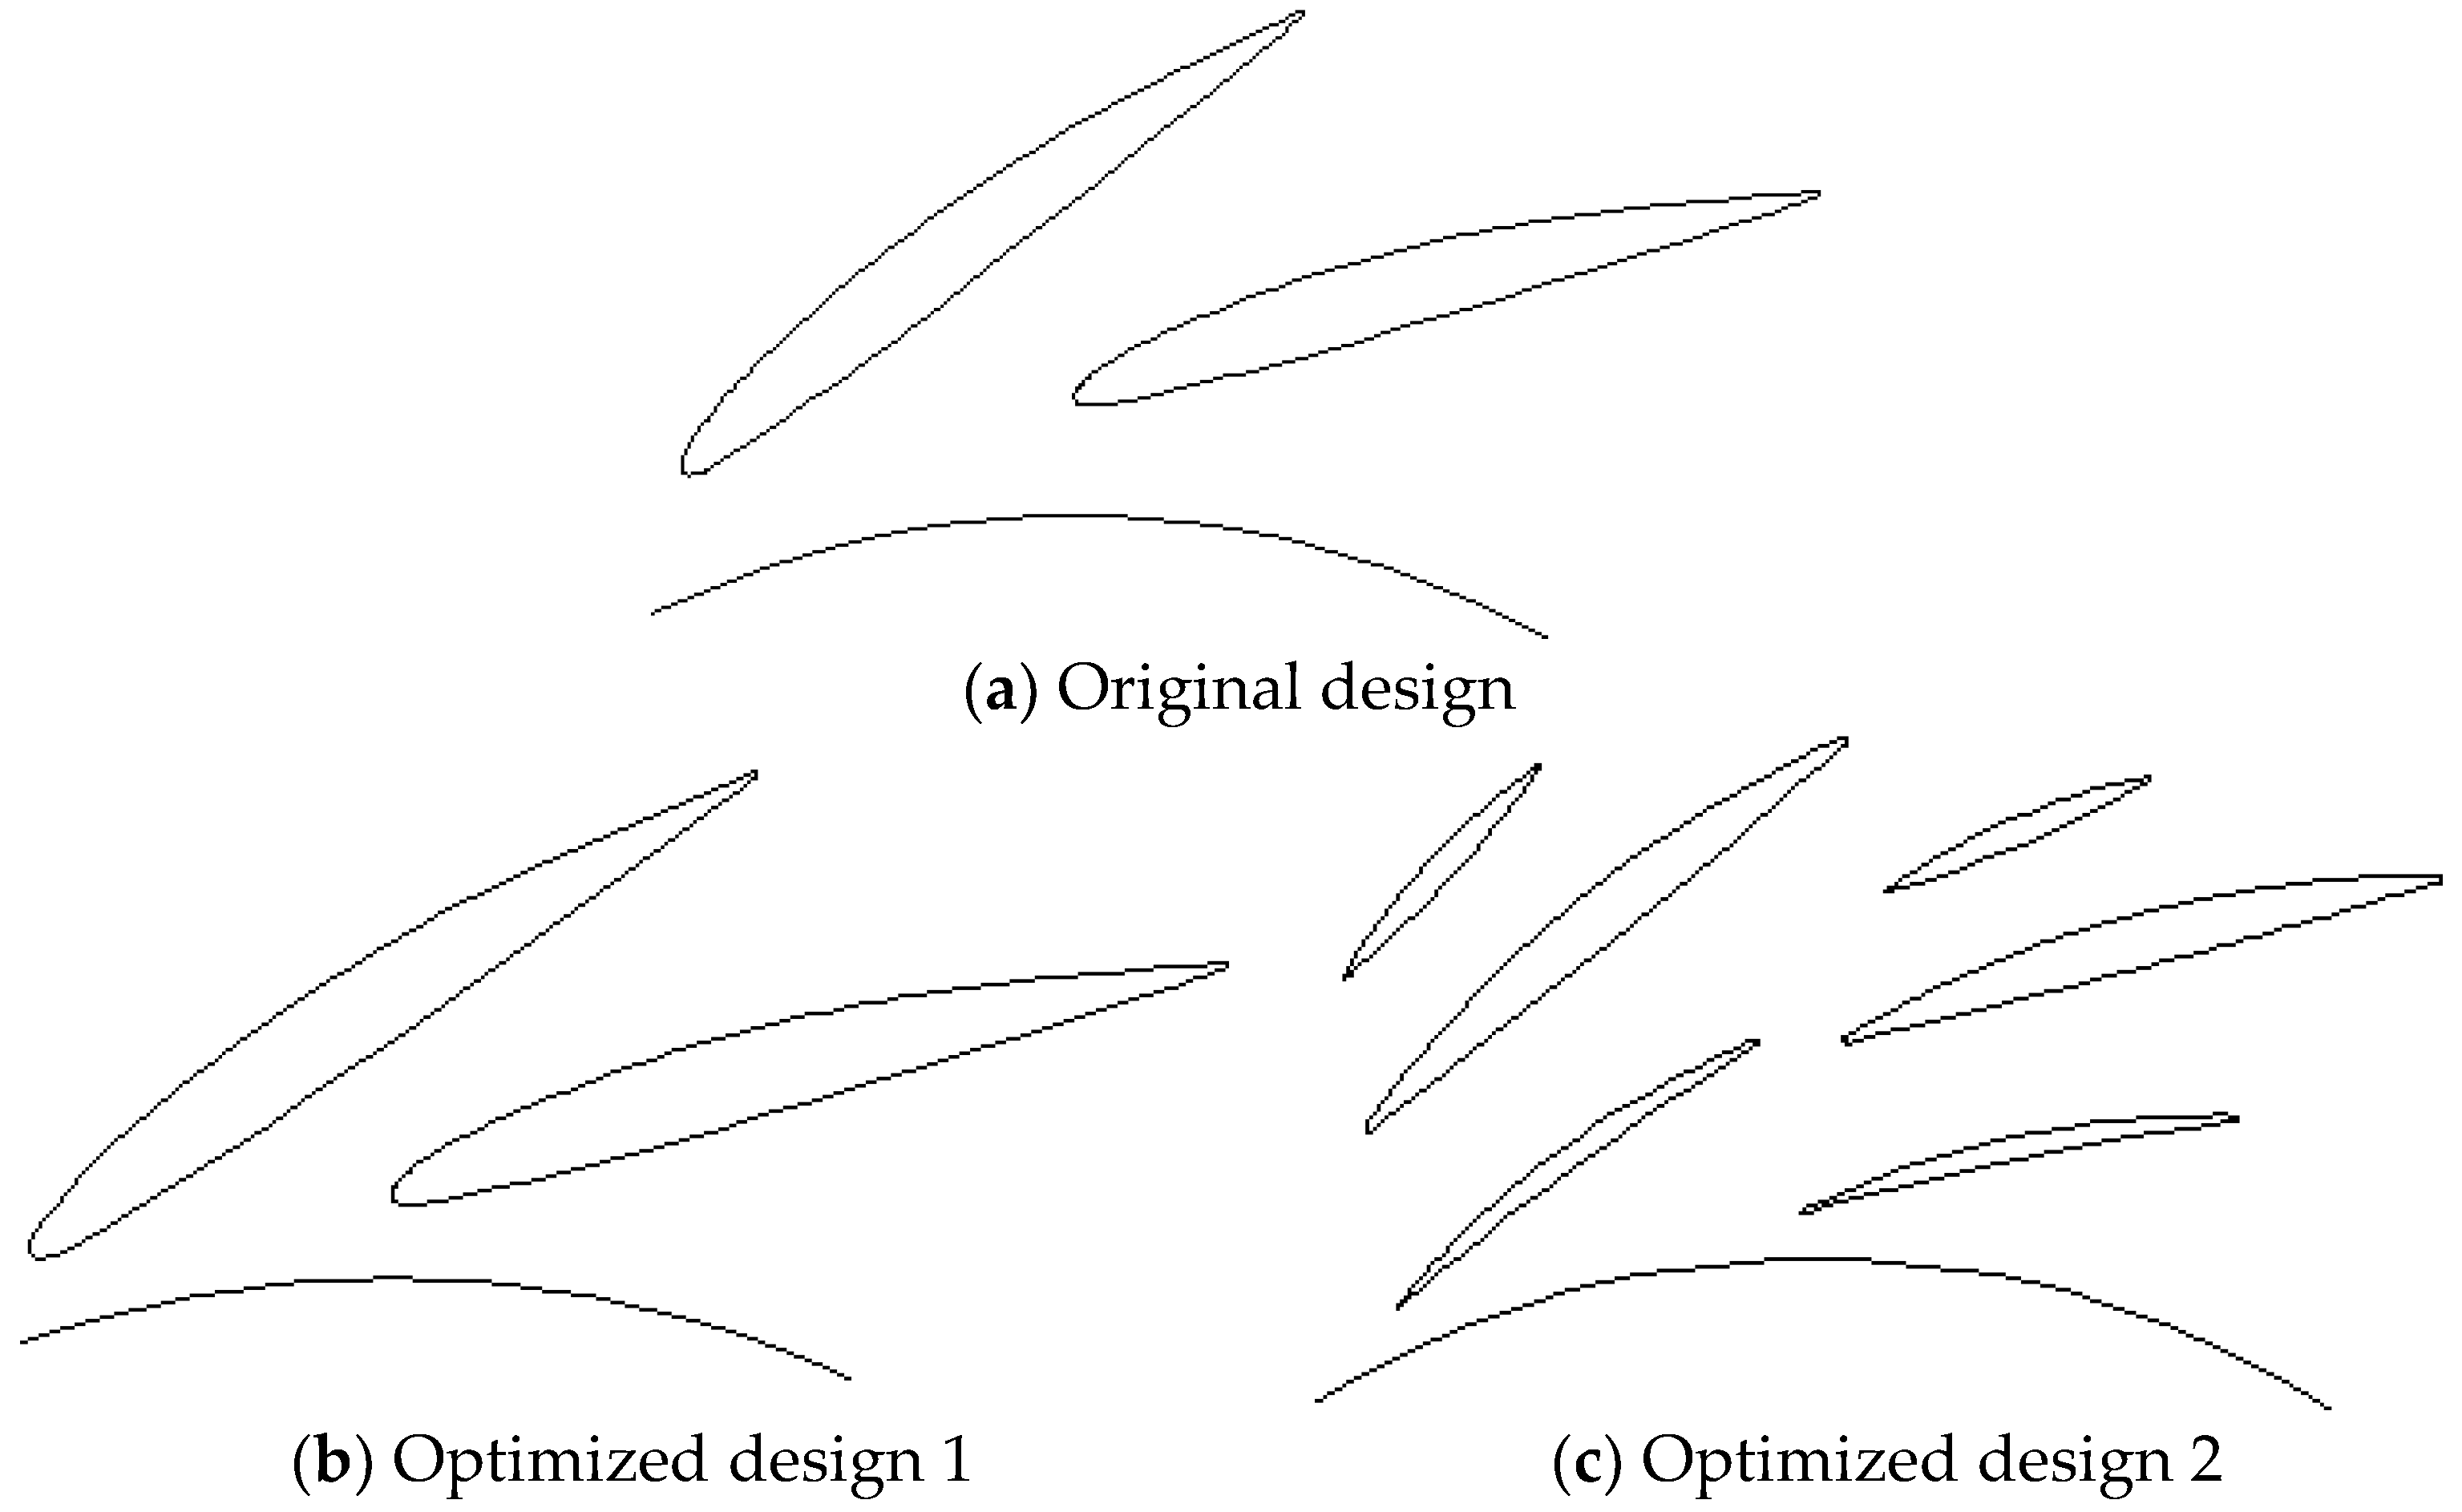
The 1D optimization results showed it was necessary to reduce D3/D2 to improve the efficiency of the entire stage of the low-pressure-stage centrifugal compressor. When D3/D2 was reduced, if the original shape of the vanes was still used in the vaned diffuser, the throat area of the vaned diffuser decreased, as shown in optimized design 1 in Figure 7. Then, the chock mass flow of the vaned diffuser decreased to have an influence on the matching of the diffuser and impeller. In order to improve the performance of the entire stage after optimization, it is necessary to analyze the matching of the diffuser and impeller. To achieve the best matching performance of the diffuser and impeller, the design ratio, Ad*/Ai*, should be as close to the theoretical level as possible [19].
The ratio of design Ad*/Ai* to theoretical Ad*/Ai* is 1.161 in the original design as shown in Table 2. It indicates that the chock mass flow of the vaned diffuser is larger than that of the impeller. When the vaned diffuser is moved toward the impeller, the ratio of design Ad*/Ai* to theoretical Ad*/Ai* would be decreased to 0.922. The choke area decreased significantly to make the chock mass flow in the vaned diffuser much lower than that of the impeller, which cannot meet the design requirements. Therefore, it is necessary to redesign the vaned diffuser to leave the chock mass flow of the unit unchanged when the diameter ratio D3/D2 is reduced. Considering all factors, the original vaned diffuser was replaced by a tandem vaned diffuser as shown in optimized design 2 in Figure 7. By using the optimized method, the ratio of design Ad*/Ai* to theoretical Ad*/Ai* was 1.043, which is closer to 1 and indicates the better matching of the diffuser and impeller. The throat area of the vaned diffuser was slightly larger than that of the impeller, which made the choke mass flow of the optimized design consistent with that of the original design.
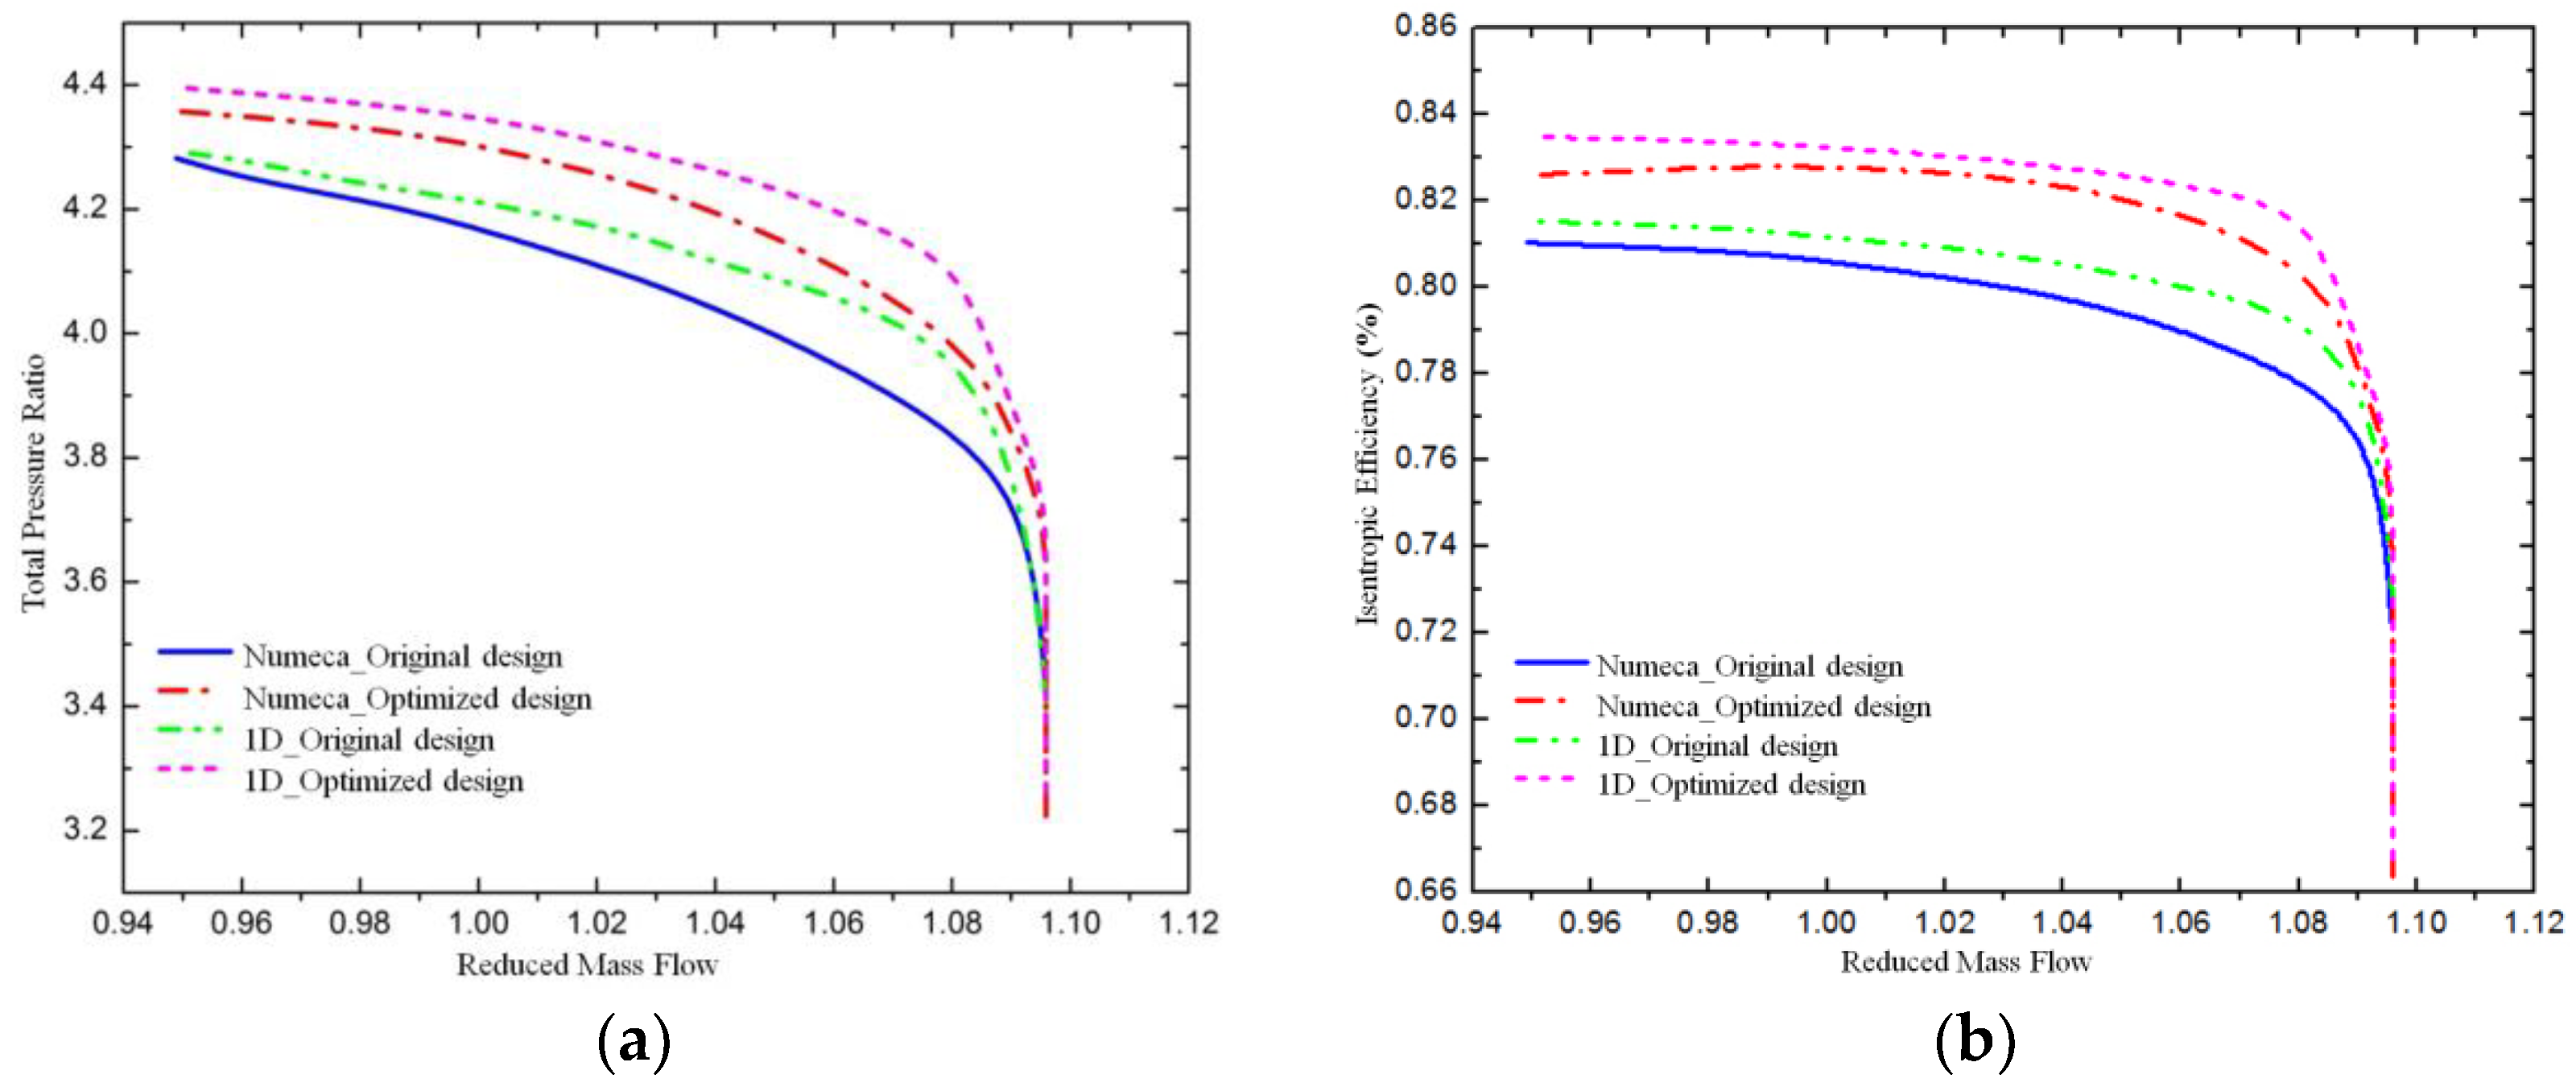
The steady simulations were performed using the commercial software Numeca. The Spalart-Allmaras (SA) turbulence model was used. Grids were generated by grid generation software AutoGrid (Numeca, Brussels, Belgium). The grid number of the original design was 1,100,000; after optimization, it was 1,400,000. Total pressure of 101,300 Pa was set at the inlet and the back-pressure was set at the outlet for boundary conditions. The wall was adiabatic with a sliding surface. The calculation results are shown in Figure 8, and the 1D calculations are also shown for comparison.
The calculation results show that the pressure ratio of the original design was 4.152, and the efficiency was 80.35%. The pressure ratio of the optimized design was 4.291, and the efficiency was 82.79%. Compared with the pressure ratio and efficiency of the original design, those of the optimized design represented a significant improvement. The trend of the 1D calculation results was similar to that of the Numeca calculation results. The pressure ratio and efficiency of the original design were 4.218 and 81.09%, respectively, whereas the pressure ratio and efficiency of the optimized design were 4.339 and 83.20%, respectively. Compared with the pressure ratio of the original design, that of optimized design increased by 2.87%, and the efficiency increased by 2.11%.
Figure 9 shows the inlet attack angle distribution of the vaned diffuser. In the original design, because of the separation area in the vaneless diffuser, the separation vortex worsened the flow condition at the vaned diffuser inlet with the variable scope of the inlet attack angle close to 50°. In the optimized design, the separation vortex disappeared in the vane-less diffuser, and the flow condition of the vaned diffuser inlet significantly improved with the decrease in diameter ratio, D3/D2. The range of angle of attack along the span was reduced from 50° to 15°.
4. Optimized Design of the High-Pressure-Stage Centrifugal Compressor
The optimized design system [18] was adopted to optimize the aerodynamic layout of the high-pressure-stage centrifugal compressor. Table 3 shows a comparison of the parameters of the original and optimized designs. The geometric parameters after optimization changed only slightly, and the efficiency of the optimized design increased by approximately 0.2% compared with the original design. This finding shows that the impeller parameters are set reasonably in the original design. After optimization, the efficiency of the vaned diffuser outlet was 2.61% higher than that of the original design. This result indicates that the mismatch between the diffuser and impeller mainly lead to the low efficiency in the original design.
Compared with the value of the divergent angle, 2θ, in the original design, the value in the optimized design decreased significantly. The divergent angle is defined as follows:
.
For the diffuser design, 2θ should be less than 12° to avoid gas over-expansion and separation. The experimental results showed that the loss coefficient of the vaned diffuser is related to the divergent angle. In general, the loss was minimal when 2θ = 6°, and gradually increased with the growth of 2θ. If the value of 2θ is too large, it could be reduced by increasing the diameter and number of blades. By contrast, the increase in diameter and blade number increased the loss in flow passage. Therefore, the influence of various parameters on the performance of the diffuser should be considered comprehensively in the design. In the original design, the large divergent angle increases the loss in the vaned diffuser, which, in turn, leads to the low efficiency of the entire stage. In the optimized design, the divergent angle was effectively reduced, and the efficiency of the unit was improved by increasing the blade number and length.
The divergent angle was reduced in the 1D optimized design system by increasing the blade number and length, as shown in Figure 10b, and the efficiency of the design was improved. This optimization method reduced the throat area of the vaned diffuser and changed the matching characteristics of the vaned diffuser and impeller. Therefore, it is necessary to make an optimized design on the matching characteristics of the impeller and vaned diffuser.
The ratio of design Ad*/Ai* to theoretical Ad*/Ai* is 1.09 in the original design as shown in Table 4. It indicates that the chock mass flow of the vaned diffuser is larger than that of impeller. When the number of blades is increased and the blade diffuser is moved close to the impeller, the ratio of design Ad*/Ai* to theoretical Ad*/Ai* would be decreased to 0.948. The choke area decreased significantly to make the chock mass flow in the vaned diffuser much lower than that of impeller, which cannot meet the design requirements. Therefore, it is necessary to redesign the vaned diffuser to leave the chock mass flow of the unit unchanged, when the diameter ratio D3/D2 is reduced. Considering all factors, the original vaned diffuser was replaced by a tandem vaned diffuser as shown in optimized design 2 in Figure 10c.
In the first row, 15 small vanes were selected, which is less than the 17 of the original design. In this way, the throat area of the vaned diffuser slightly decreases when the diameter ratio decreases. The second row combines 15 large vanes and 15 splitter vanes. In this way, the divergent angle of the vaned diffuser can be reduced to prevent separation. Meanwhile, the friction loss on the inner surface of the vaned diffuser with the increase in the vane number would not be significant.
By using the optimized method, the ratio of design Ad*/Ai* to theoretical Ad*/Ai* is 1.037, which is closer to 1 and indicates the better matching of the diffuser and impeller. The throat area of the vaned diffuser is slightly larger than that of the impeller, which makes the choke mass flow of the optimized design consistent with that of the original design.
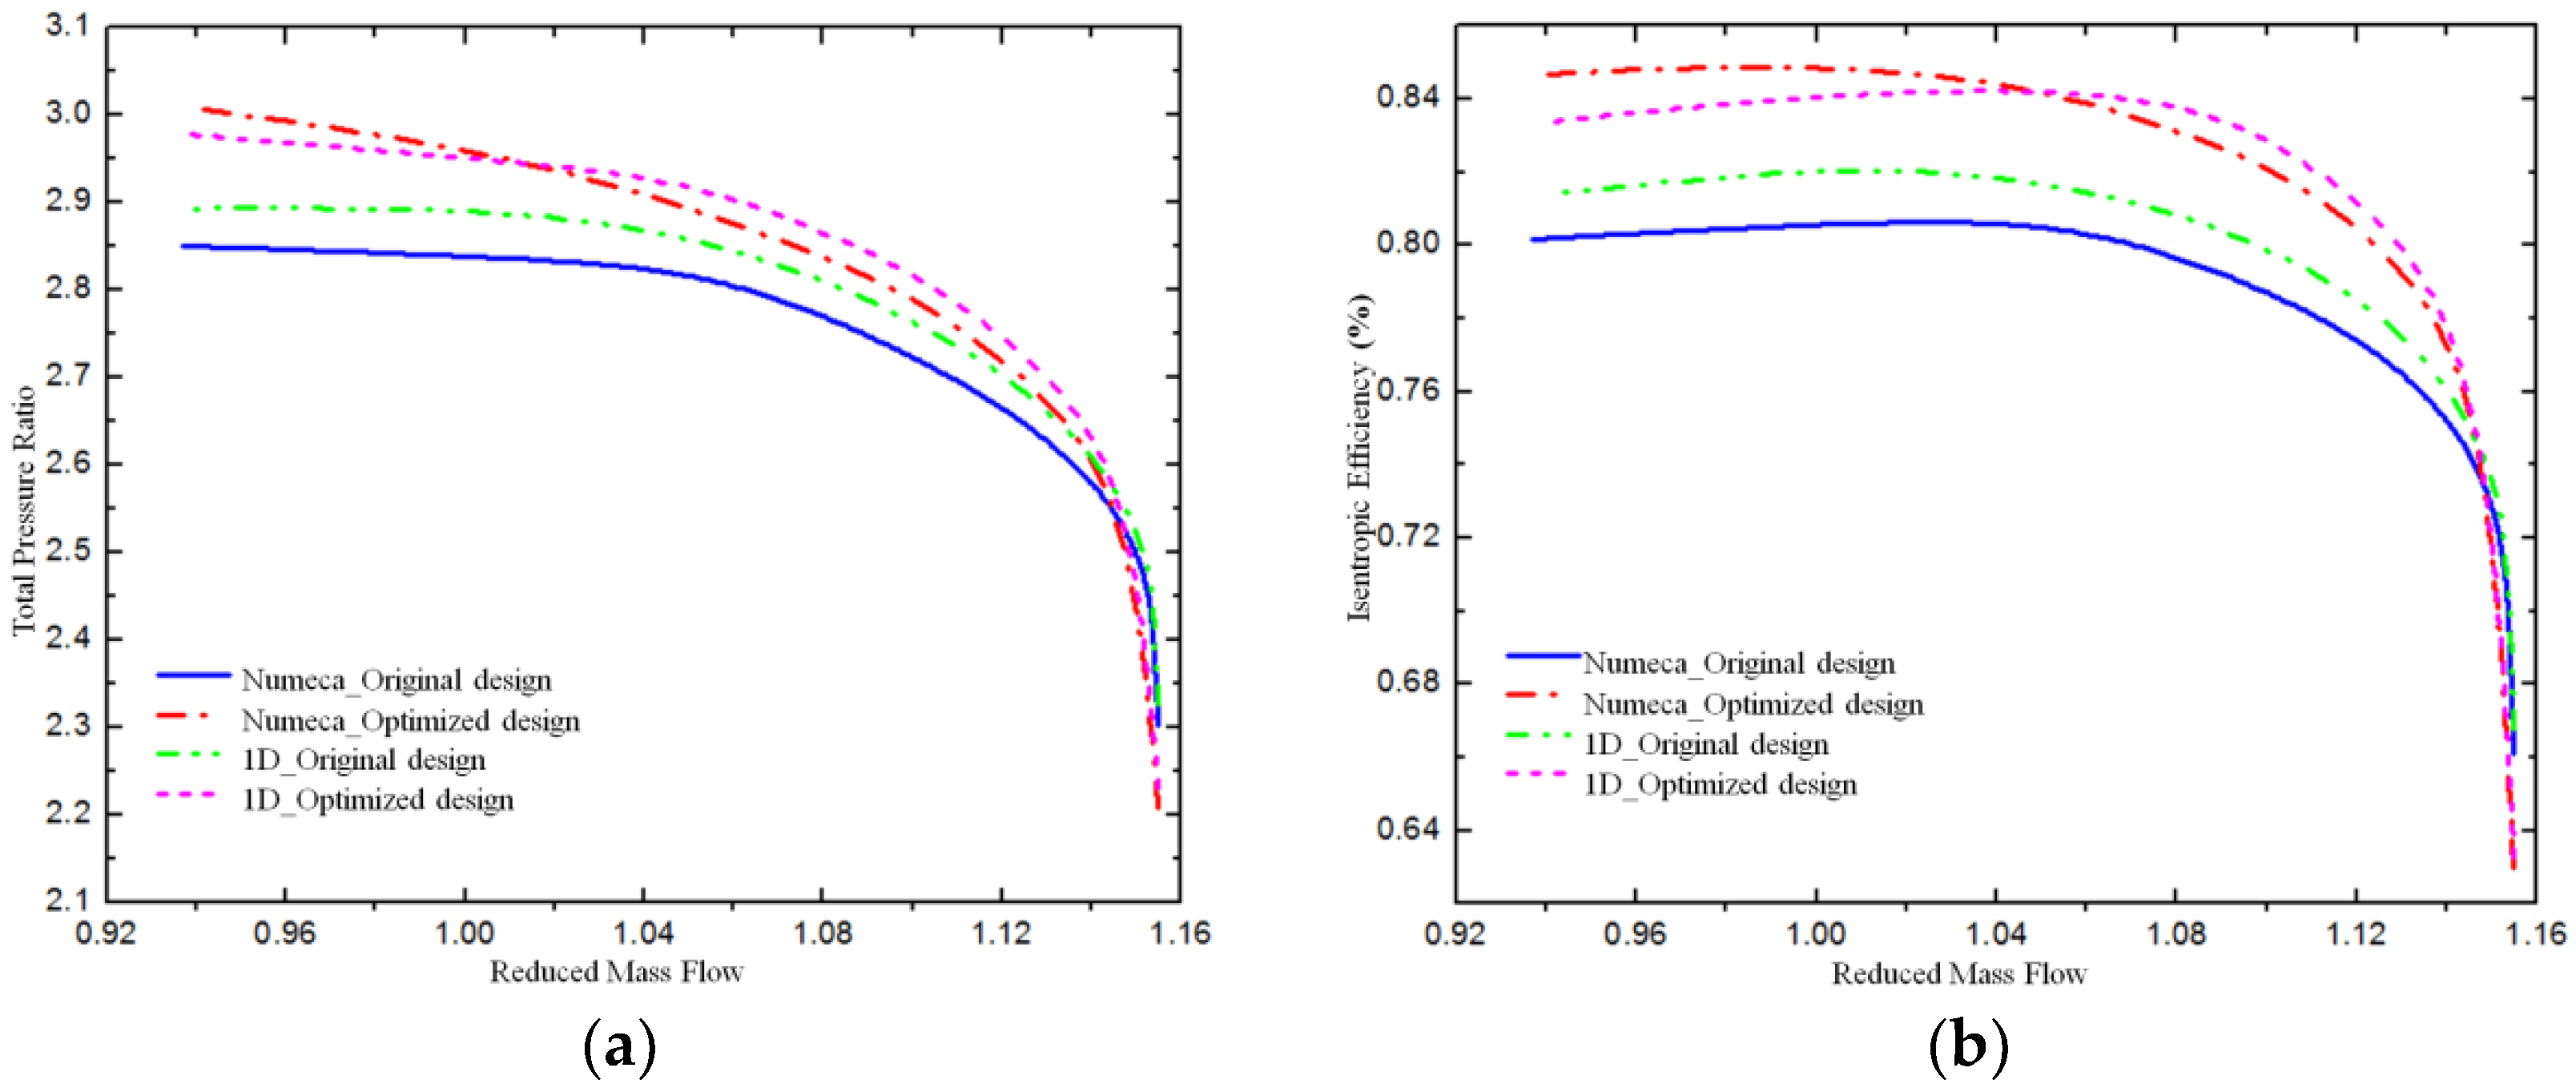
The steady simulations were performed using the commercial code Numeca. The S-A turbulence model was used. Grids were generated by AutoGrid. The grid number of the original design was 1,180,000; after optimization, it was 1,740,000. Total pressure of 101,300 Pa was set at the inlet and the back-pressure was set at the outlet for boundary conditions. The wall was adiabatic with a sliding surface. The calculation results are shown in Figure 11, and the 1D calculations are also shown for comparison.
The calculation results show that the pressure ratio of the original design was 2.838, and the efficiency was 80.68%. The pressure ratio of the optimized design was 2.967, and the efficiency was 85.03%. Compared with the pressure ratio and efficiency of the original design, those of the optimized design 2 represented a significant improvement. The trend of the 1D calculation results was similar to that of the Numeca calculation results. In the design condition, the pressure ratio and efficiency of the original design were 2.894% and 82.29%, respectively, whereas the pressure ratio and efficiency of the optimized design were 2.952% and 84.52%, respectively. Compared with the values in the original design, the pressure ratio and efficiency of the optimized design increased by 2.01% and 2.23%, respectively.
Figure 12 shows the inlet attack angle distribution of the vaned diffuser. Compared with the attack angle in the original design, the angle in the optimized design was reduced to a certain extent. Specifically, the attack angle decreased by approximately 5° near the blade root, which changed the range of the attack angle from the blade root to blade tip less than 8°. In the original design, the range of the attack angle was close to 15°.
5. Coupling Calculations of the Original and Optimized Designs
After the low/high-pressure-stage centrifugal compressor was optimized and designed, circular calculations of the MW-level gas turbine were performed under three typical load conditions of 100%, 90%, and 60%. The operating parameters of circular calculation are shown in Table 5. To analyze the actual performance of the low/high-pressure-stage centrifugal compressor, we conducted coupling calculations and analysis of the original and optimized designs under different working conditions for an entire week. The calculated geometric model is shown in Figure 13. Numeca software was used for calculations, and an S-A turbulence model was employed.
Table 6 shows a comparison of the pressure ratio and efficiency of the original and optimized designs of the low/high-pressure-stage compressor under three typical load conditions. The optimized design performed better than the original design. At 100% load, the low-pressure-stage pressure ratio increased by 4.01%, and the efficiency increased by 2.90%. The high-pressure-stage pressure ratio increased by 4.12%, and the efficiency increased by 3.00%. The pressure ratio of the unit increased by 8.4%, and its efficiency increased by 3.70%. At 90% load, the low-pressure-stage pressure ratio increased by 5.22%, and the efficiency increased by 3.30%. The high-pressure-stage pressure ratio increased by 3.41%, and the efficiency increased by 3.10%. The pressure ratio of the unit increased by 9.37%, and its efficiency increased by3.80%. At 60% load, the low-pressure-stage pressure ratio increased by 2.33%, and the efficiency increased by 4.80%. The high-pressure-stage pressure ratio increased by 4.72%, and the efficiency increased by 4.70%. The pressure ratio of the unit increased by 7.70%, and its efficiency increased by 5.40%.
The specific performance of the low/high-pressure-stage centrifugal compressor under different working conditions was analyzed as follows.
5.1. 100% Load
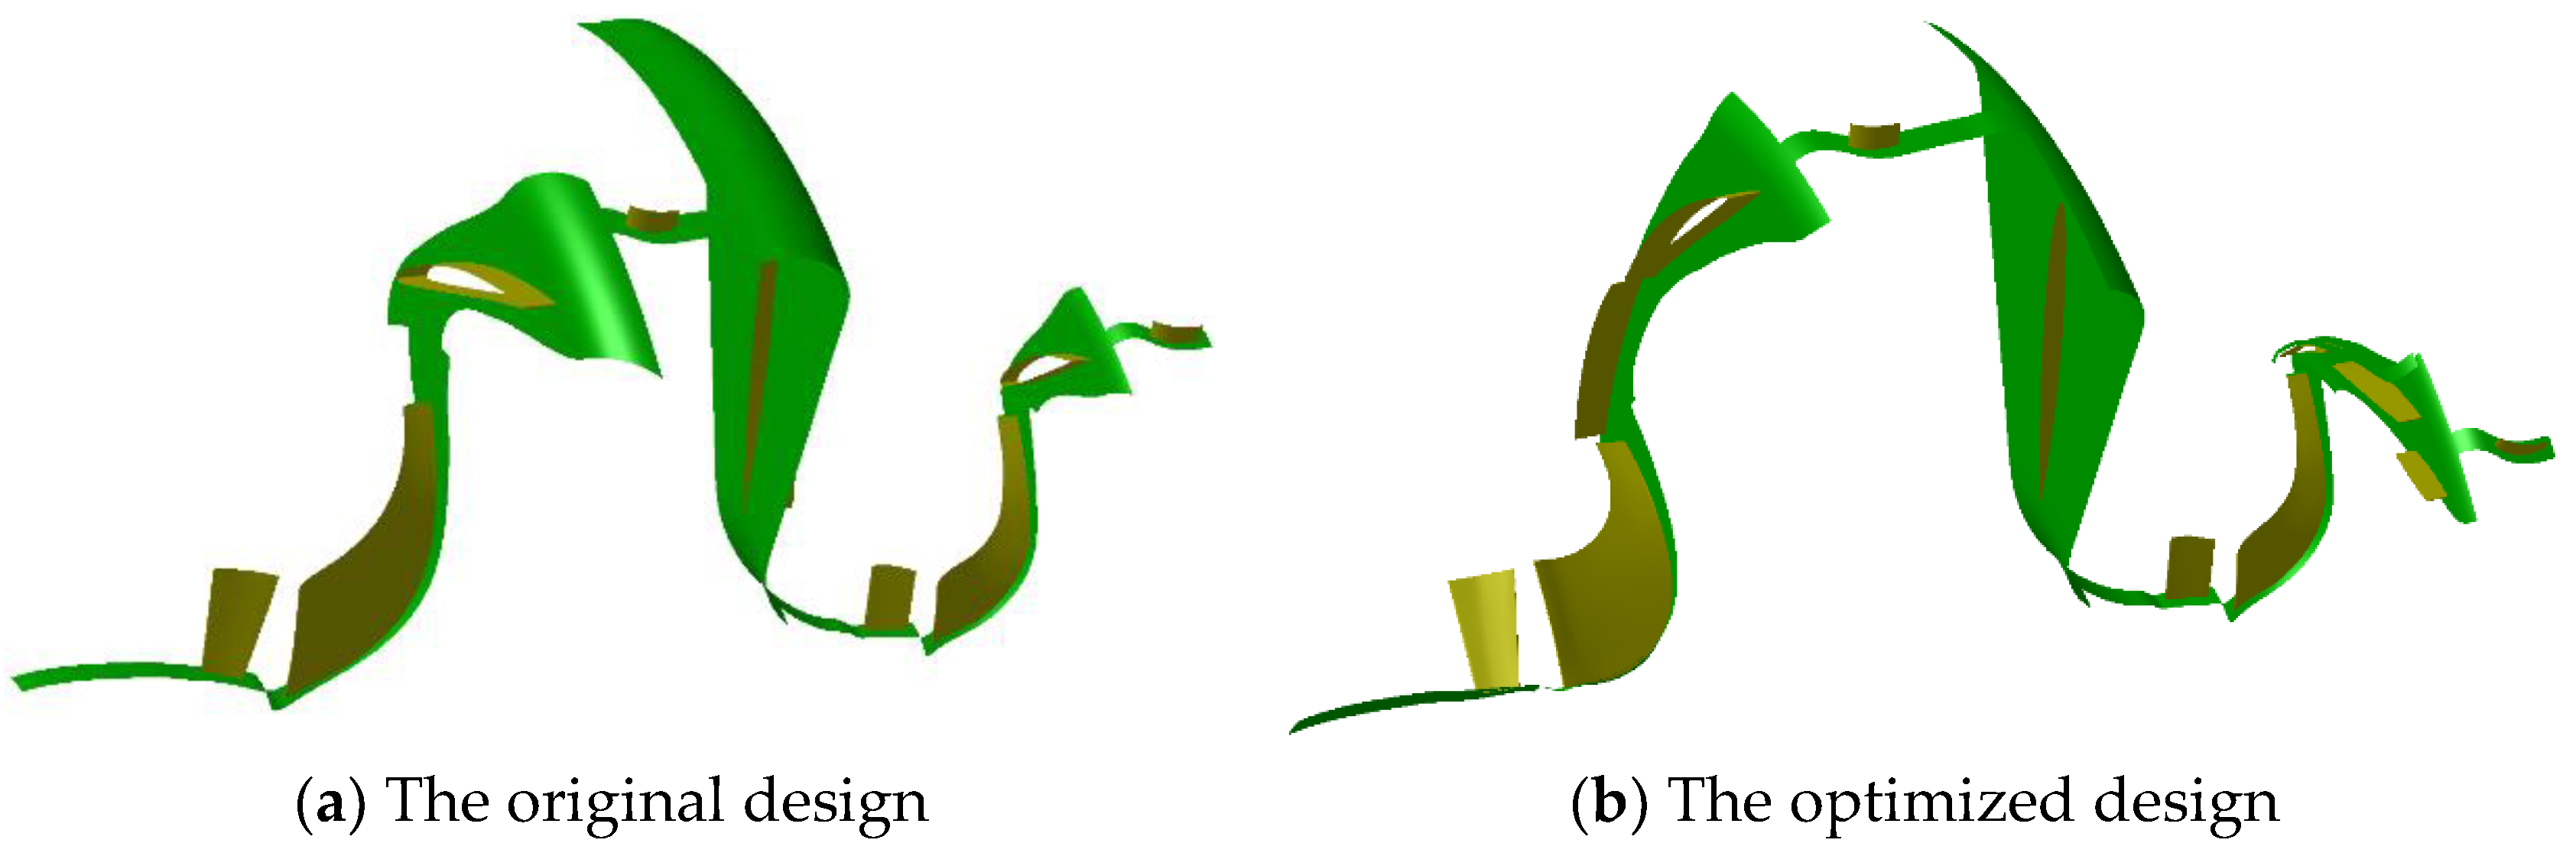
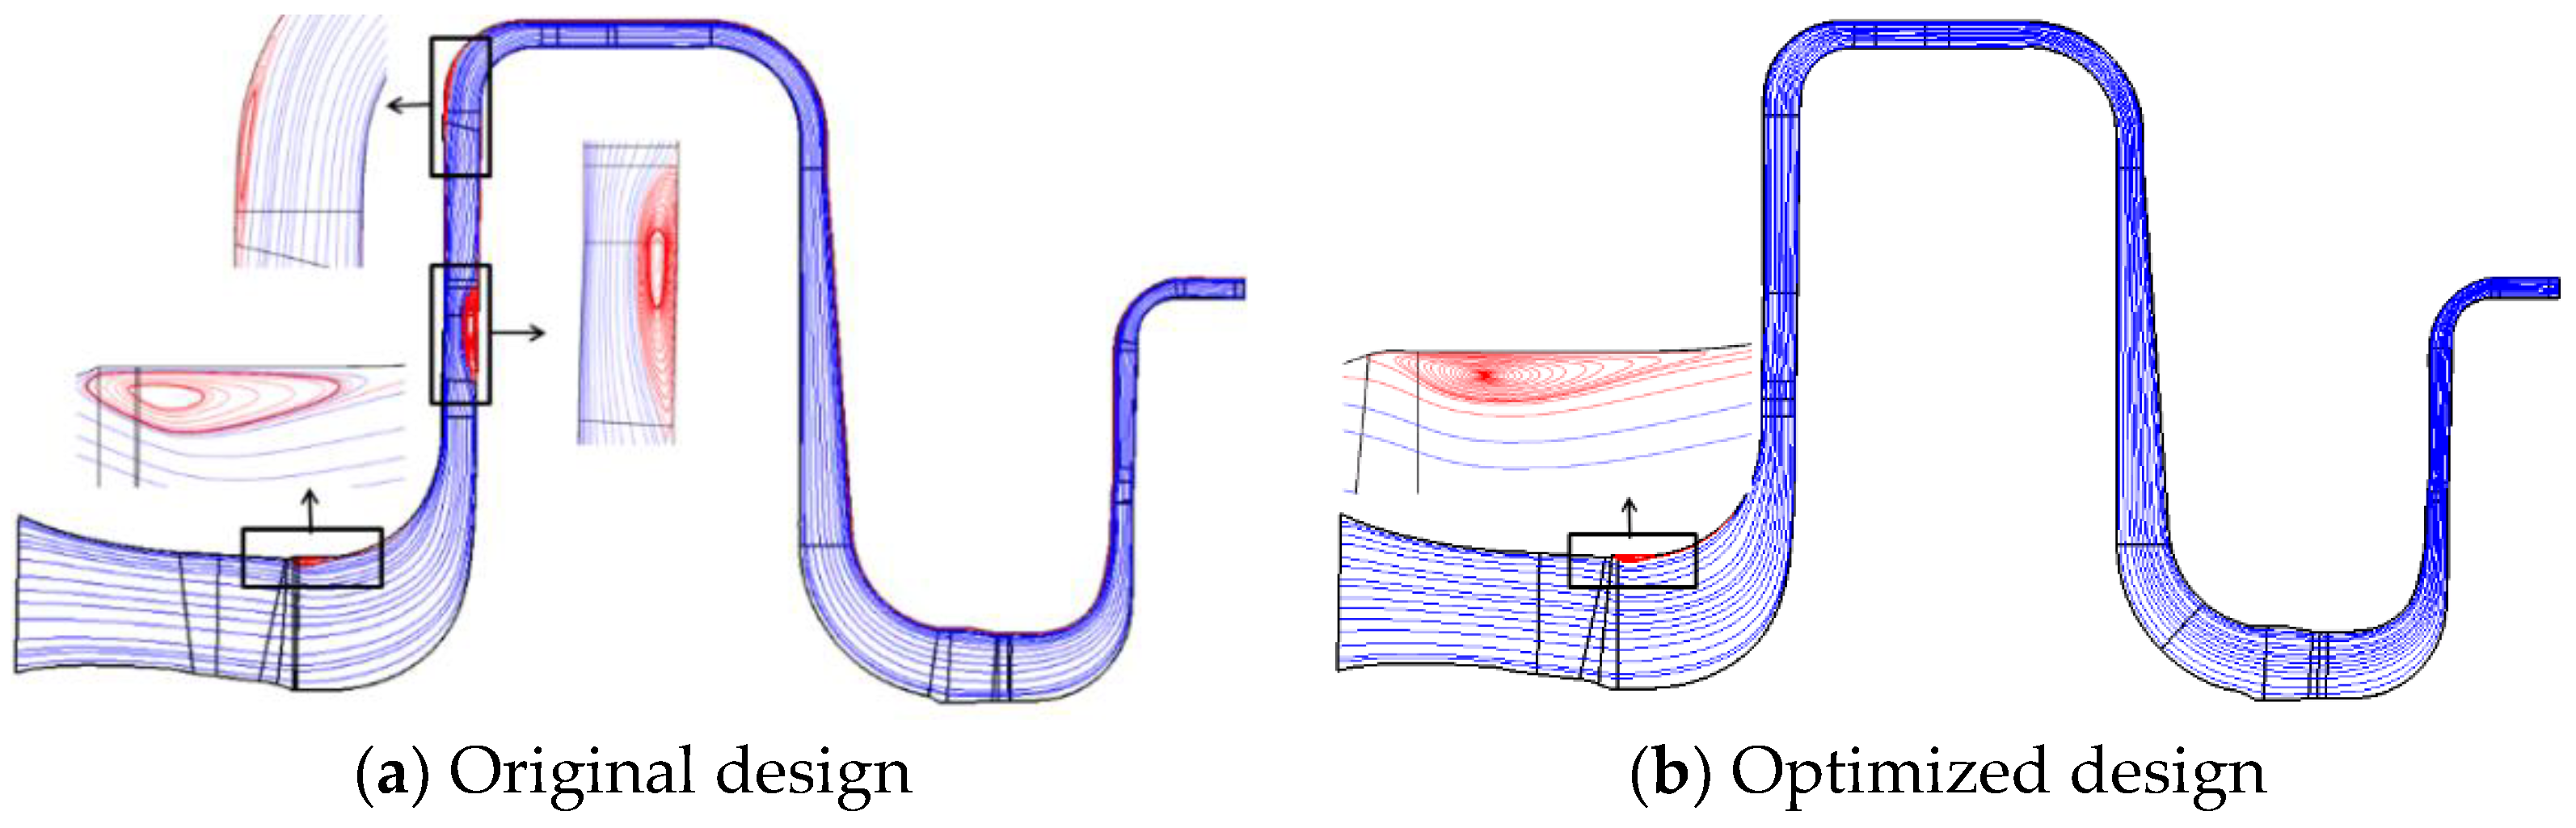
Figure 14 shows the meridional streamline chart at 100% load and illustrates a large separation vortex in the vane-less diffuser in the original design. In the optimized design, the separation vortex disappeared in the vane-less diffuser with the decrease in diameter ratio, D3/D2. The flow condition at the vaned diffuser inlet improved. Therefore, a separation area was not observed in the vaned diffuser.
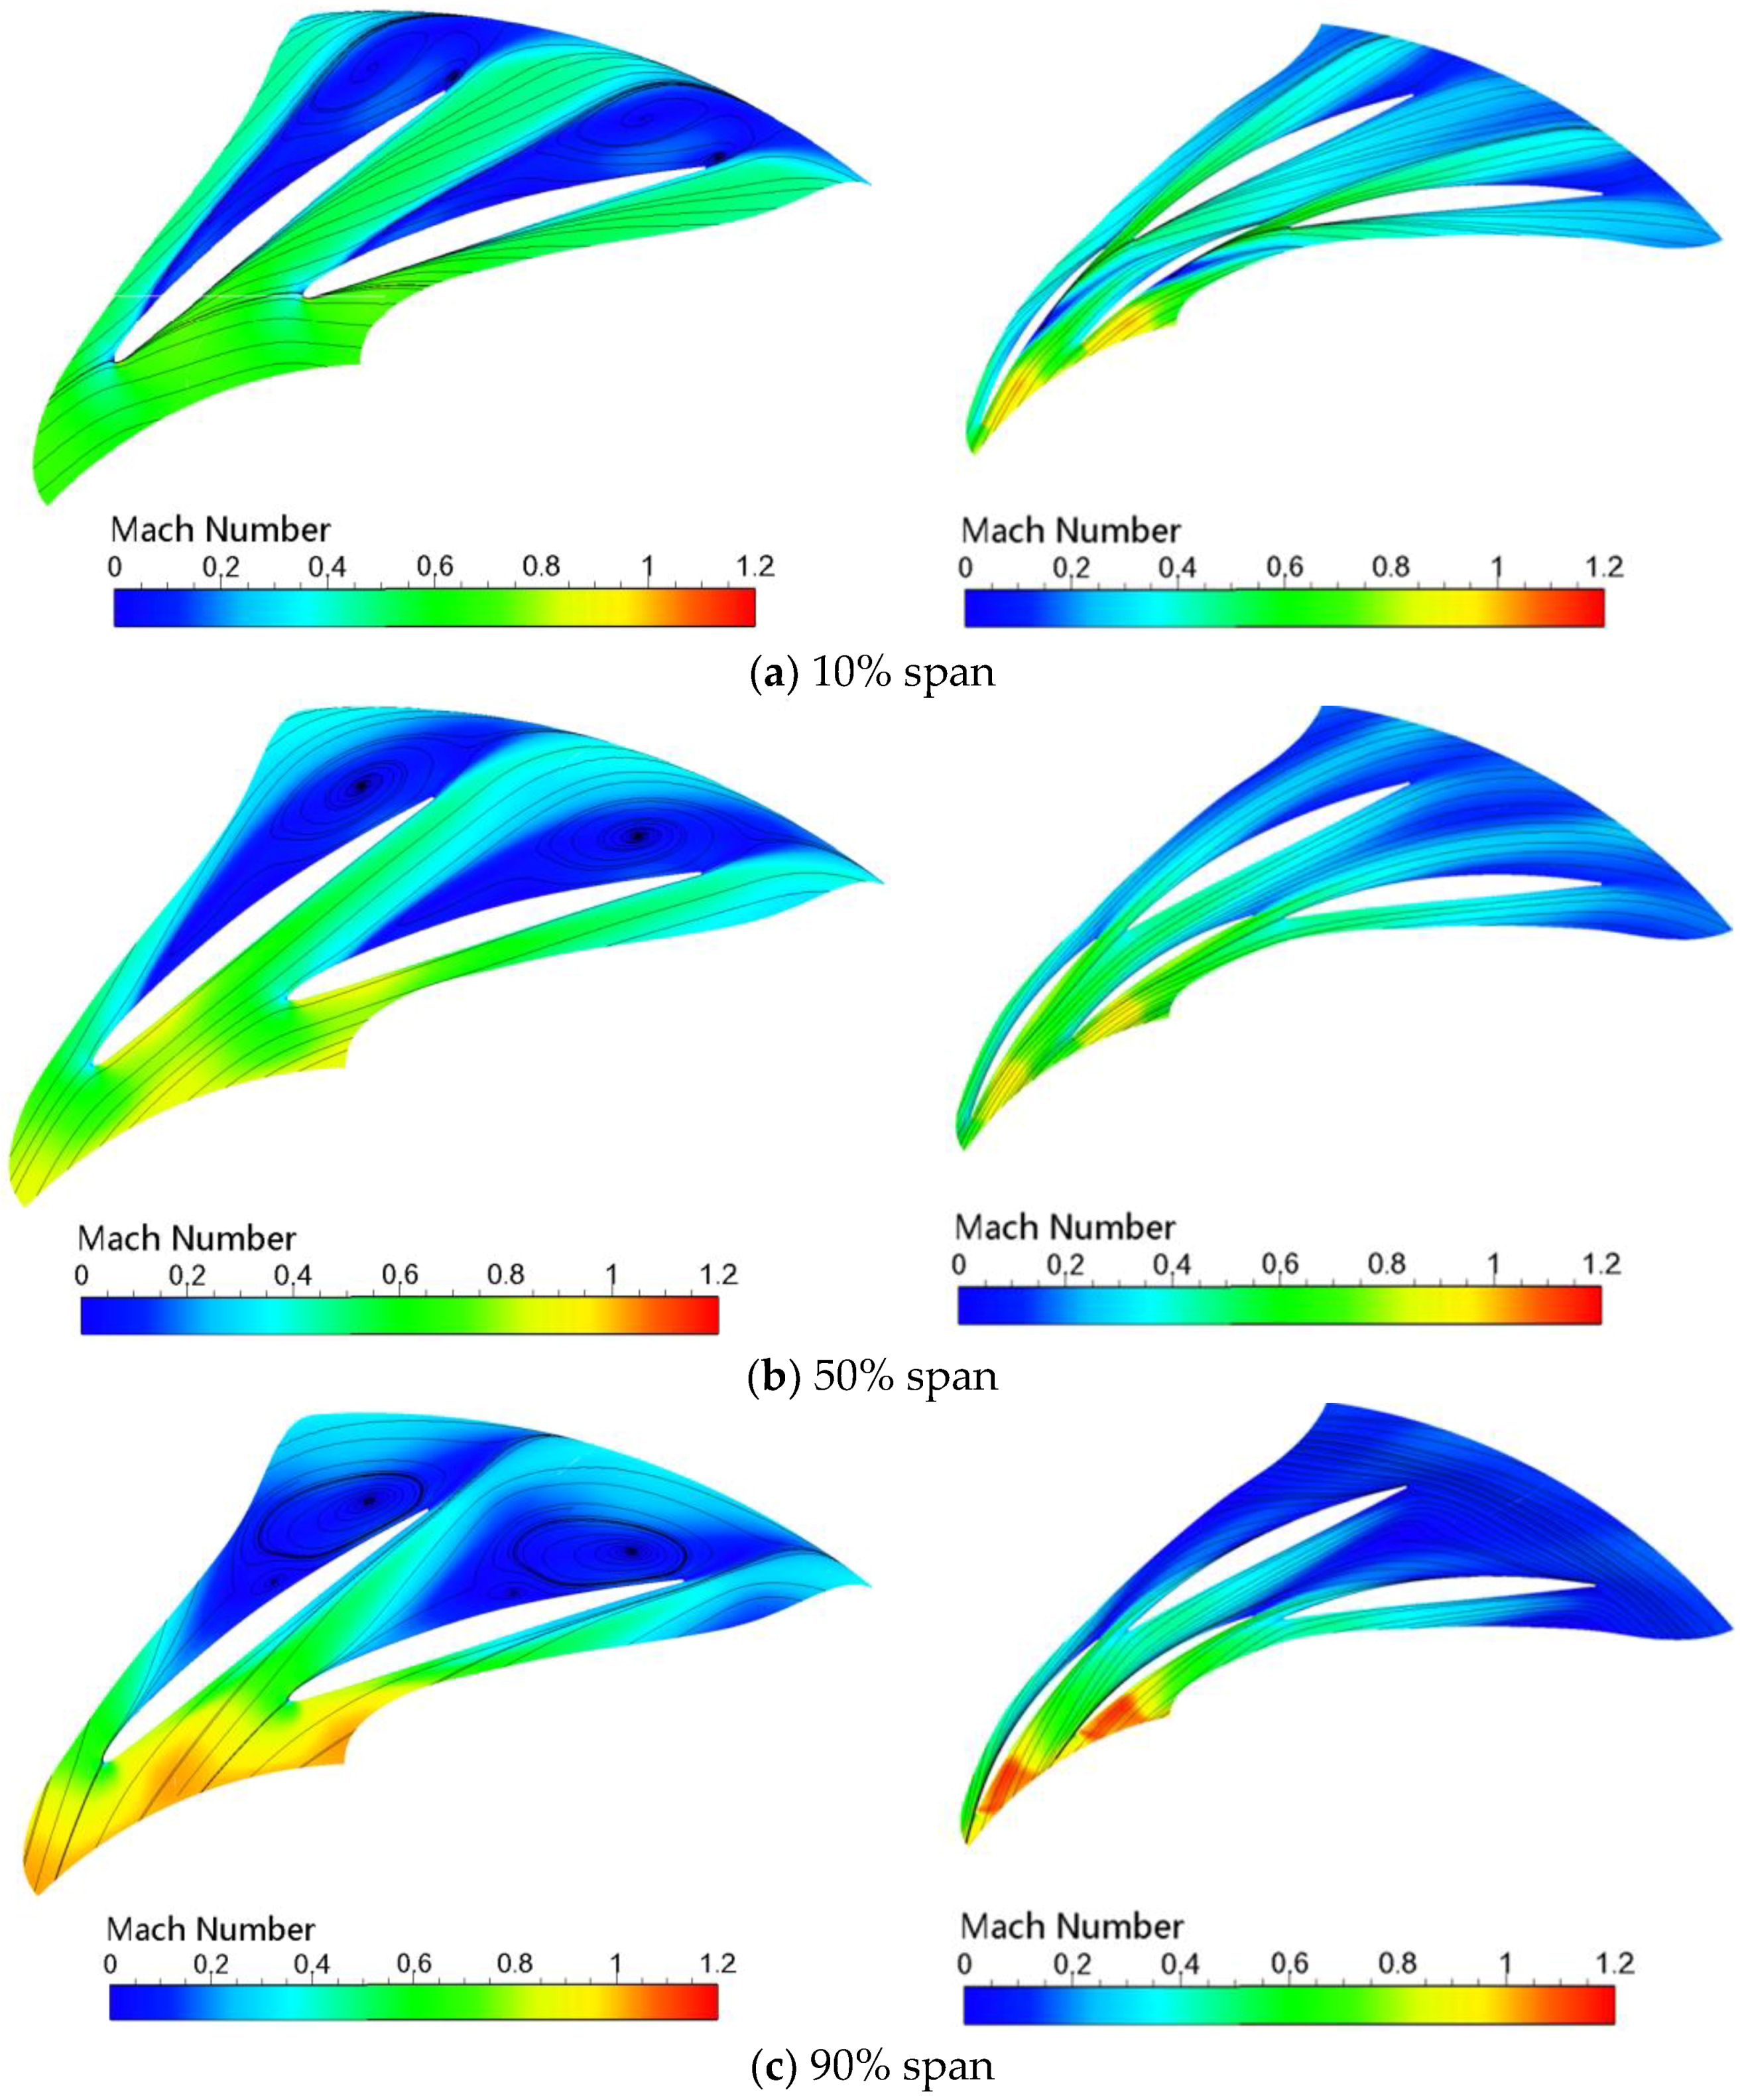
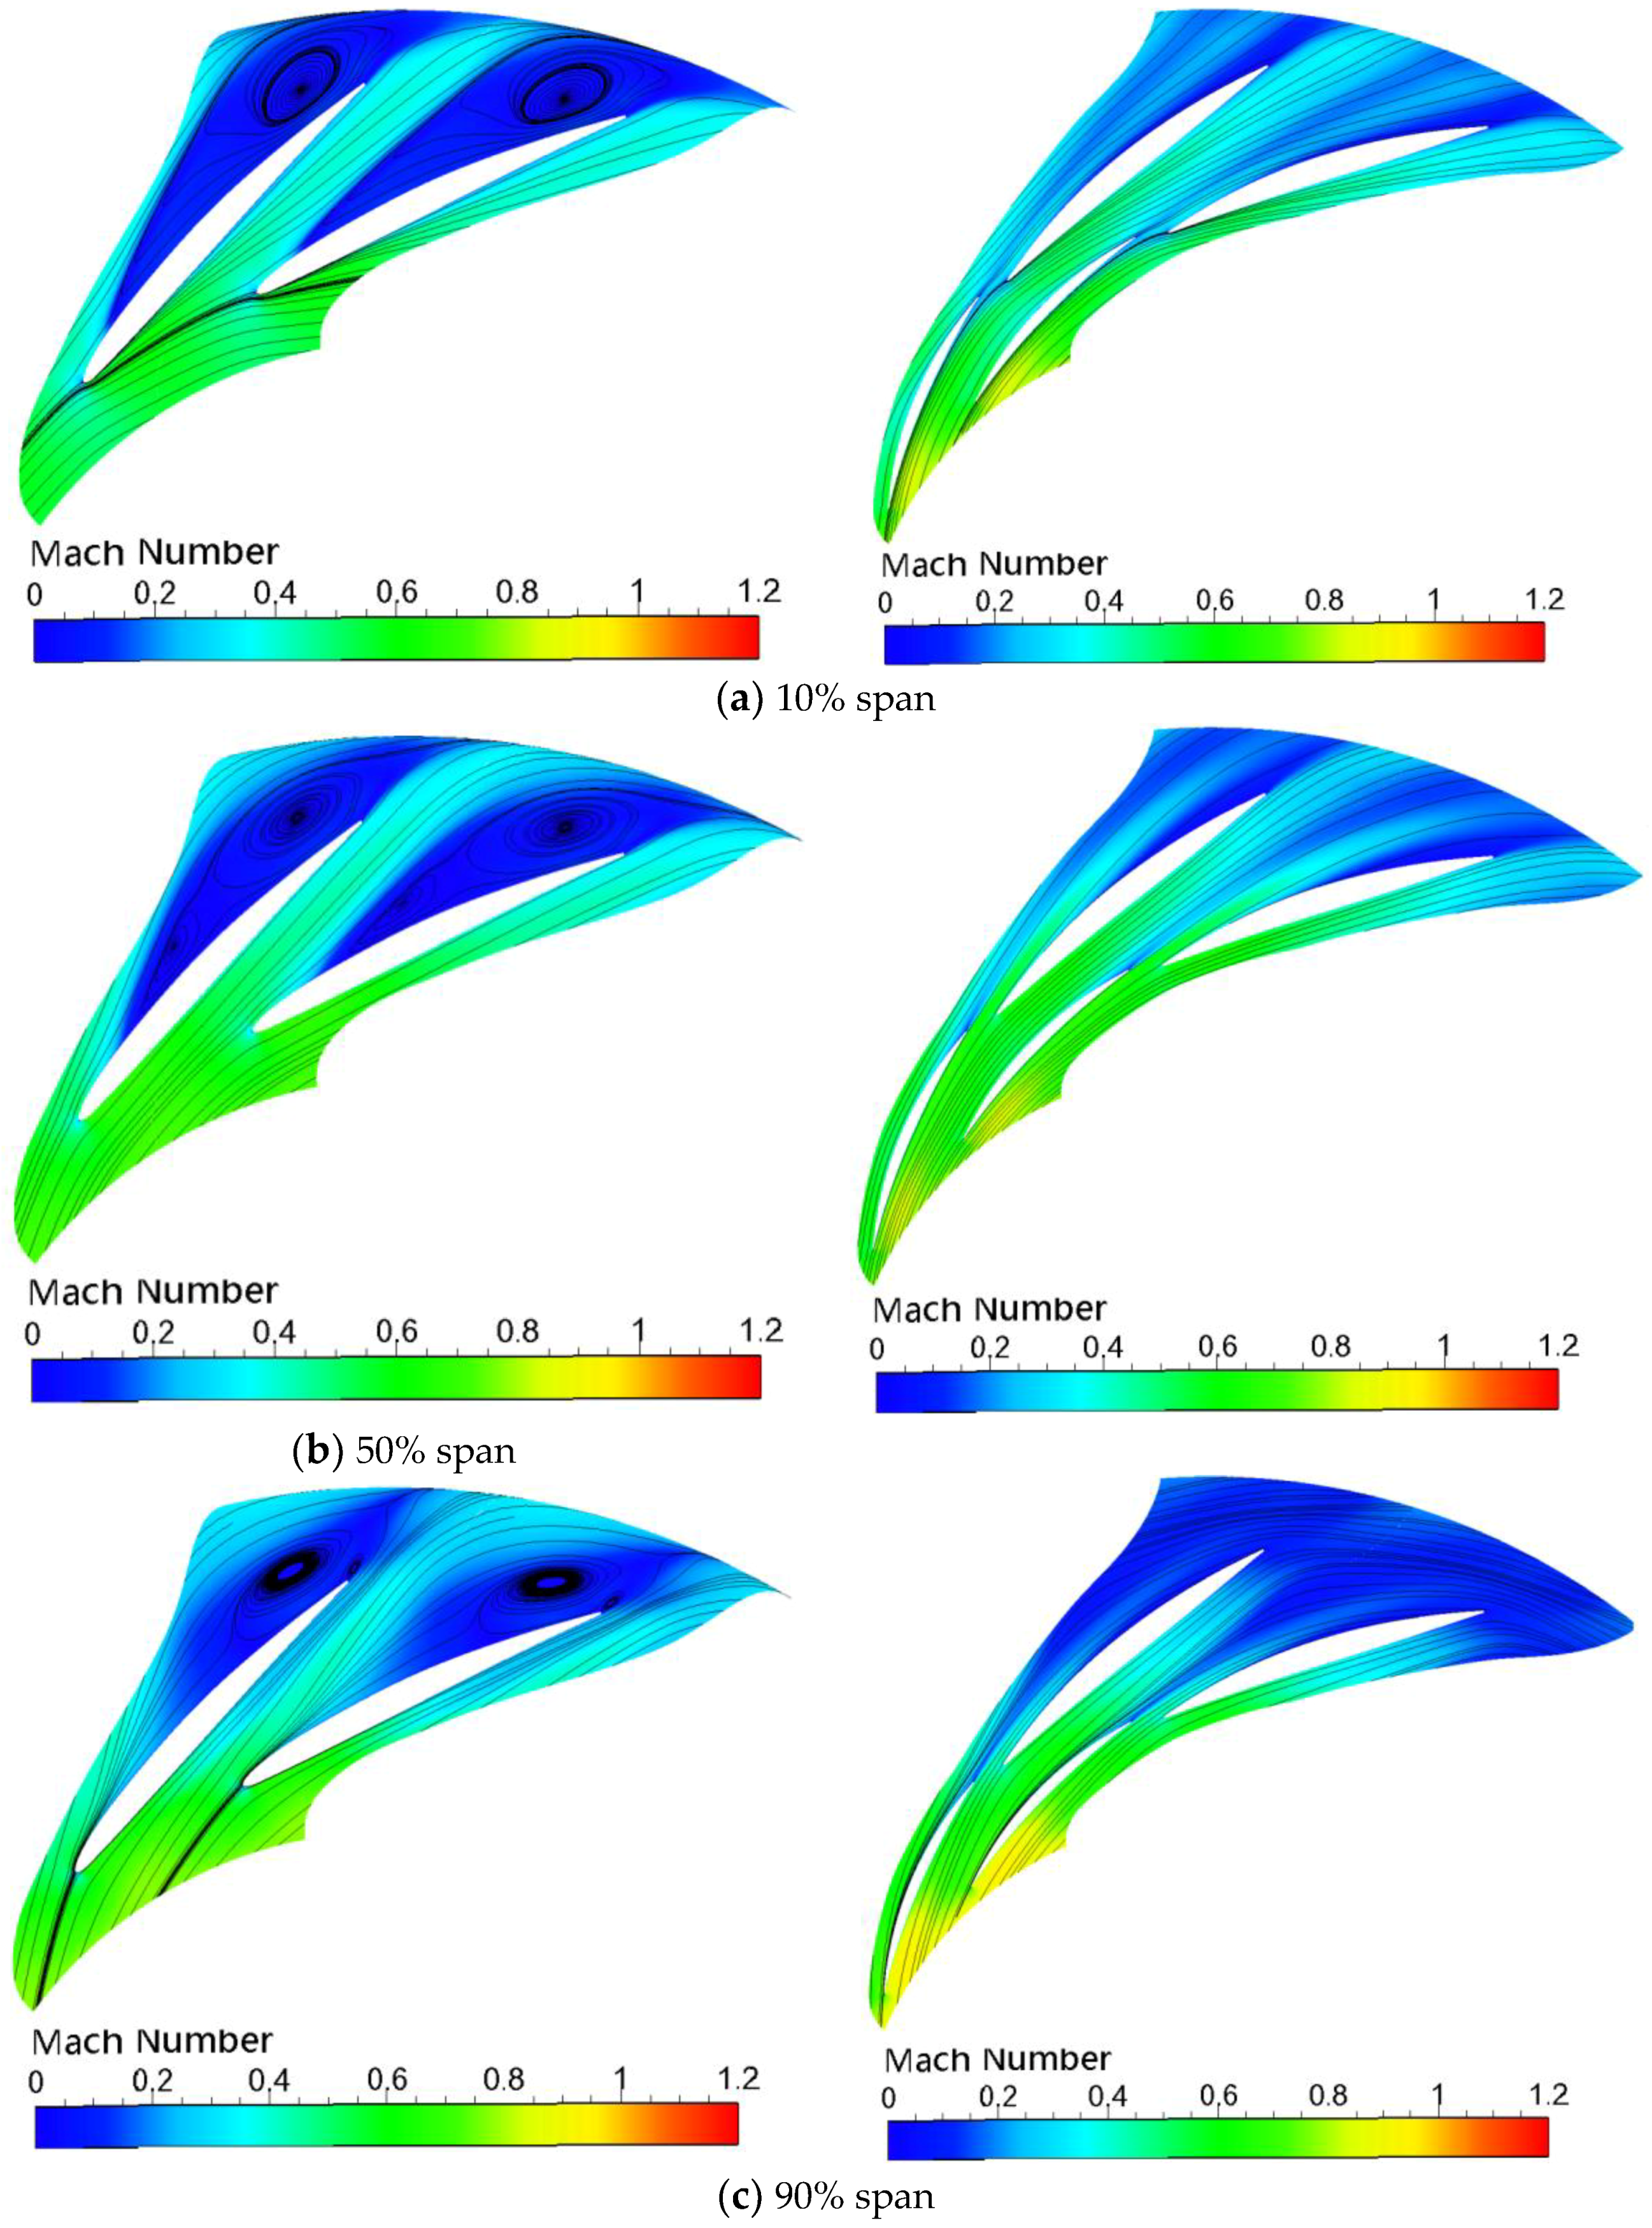
Figure 15 shows the Mach number distribution in different spans of the original and optimized designs of the low-pressure-stage centrifugal compressor at 100% load. An obvious backflow was observed at the vaned diffuser inlet in the original design at 10% span because the diameter ratio was large, and the separation vortex in the vane-less diffuser worsened the flow condition at the vaned diffuser inlet. The overall flow in the vaned diffuser was good with no obvious vortex.
In the optimized design, the diameter ratio of the vane-less diffuser decreased, and the flow was uniform without separation due to the use of the tandem diffuser. Therefore, the vaned diffuser inlet was in a good condition without backflow. An obvious low-speed area was observed at the end of the second-row diffuser, and no obvious separation was observed in the passage. The inlet flow was not affected and had no backflow at 50% span because the vaned diffuser inlet flow was far from the vane-less diffuser separation area. The gas flow in the vaned diffuser was stable, and a large separation area appeared at the vaned diffuser outlet. In the optimized design, a high Mach number area existed in the diffuser inlet on the first row because the vaned diffuser inlet was close to the impeller. A large low-speed area was observed in the diffuser end on the second row, similar to the 10% span. At 90% span, the separation area inside the vaned diffuser had no influence on the vaned diffuser inlet flow in the original design, and the inlet condition was improved. The flow showed significant deceleration in the vaned diffuser, and the Mach number in the middle of the vaned diffuser dropped to approximately 0.2. The low-speed area at the vaned diffuser outlet expanded further and occupied approximately 80% of the flow passage. In the optimized design, the flow deceleration process was obvious in the vaned diffuser, and the Mach number at the outlet dropped to below 0.2. However, the flow in the passage was stable with no obvious separation phenomenon.
In general, in the original design, the flow condition was affected by the separation area in the vaneless diffuser, and the Mach number distribution was completely different at different spans. The flow condition near the blade root was poor with obvious backflow at the vaned diffuser inlet. The closer to the tip, the better the flow. However, the condition at the vaned diffuser outlet was the opposite. The flow near the blade root was smooth with no obvious low-speed area. The farther away from the blade root, the smaller the Mach number. Serious blockage existed near the tip. In the optimized design, the flow at the vaned diffuser inlet was similar in different spans because no separation occurred in the vane-less diffuser. The flow in the vaned diffuser was nearly the same, and an obvious low-speed area existed at the end.
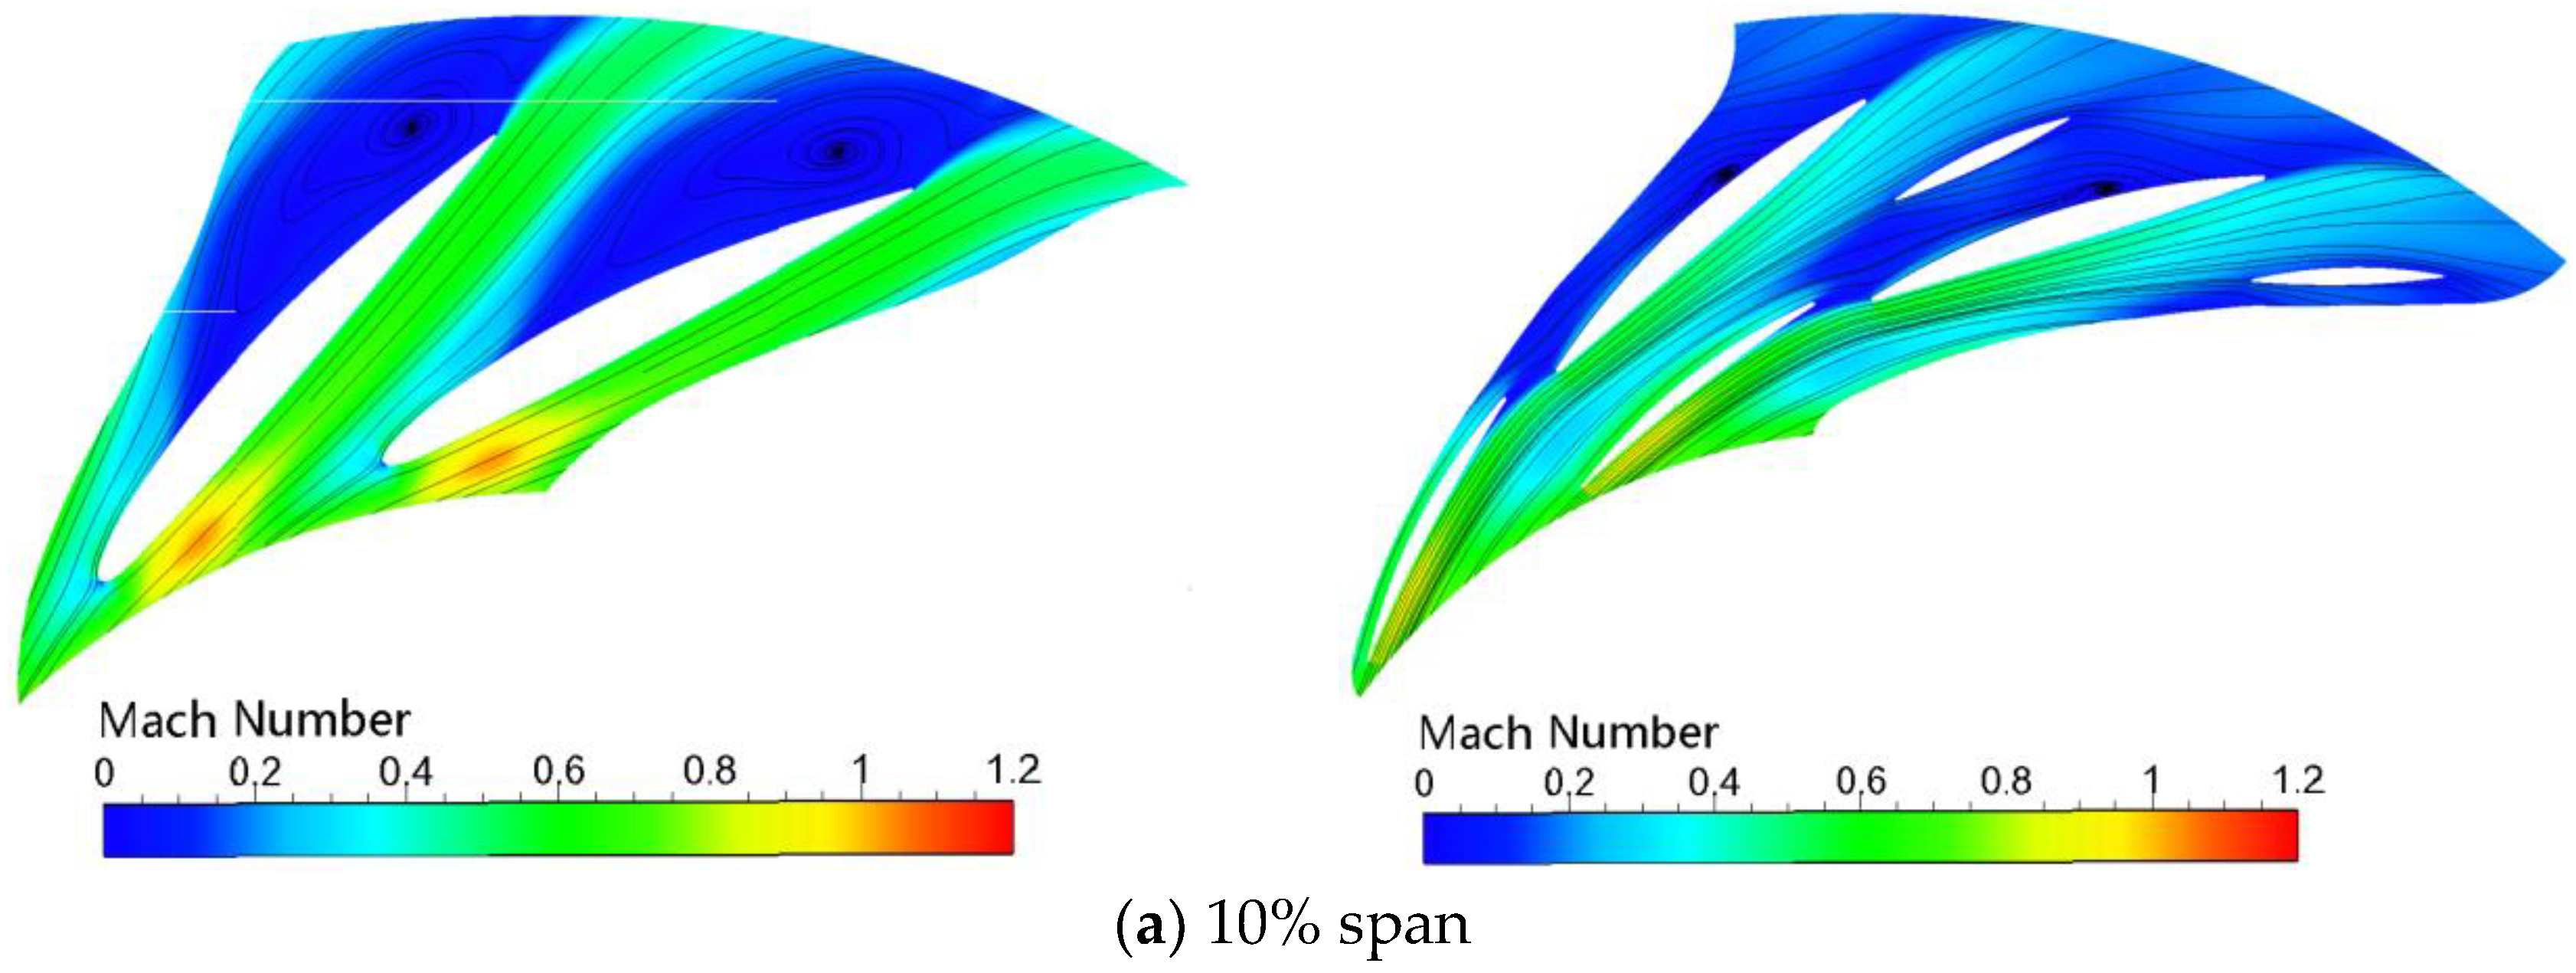
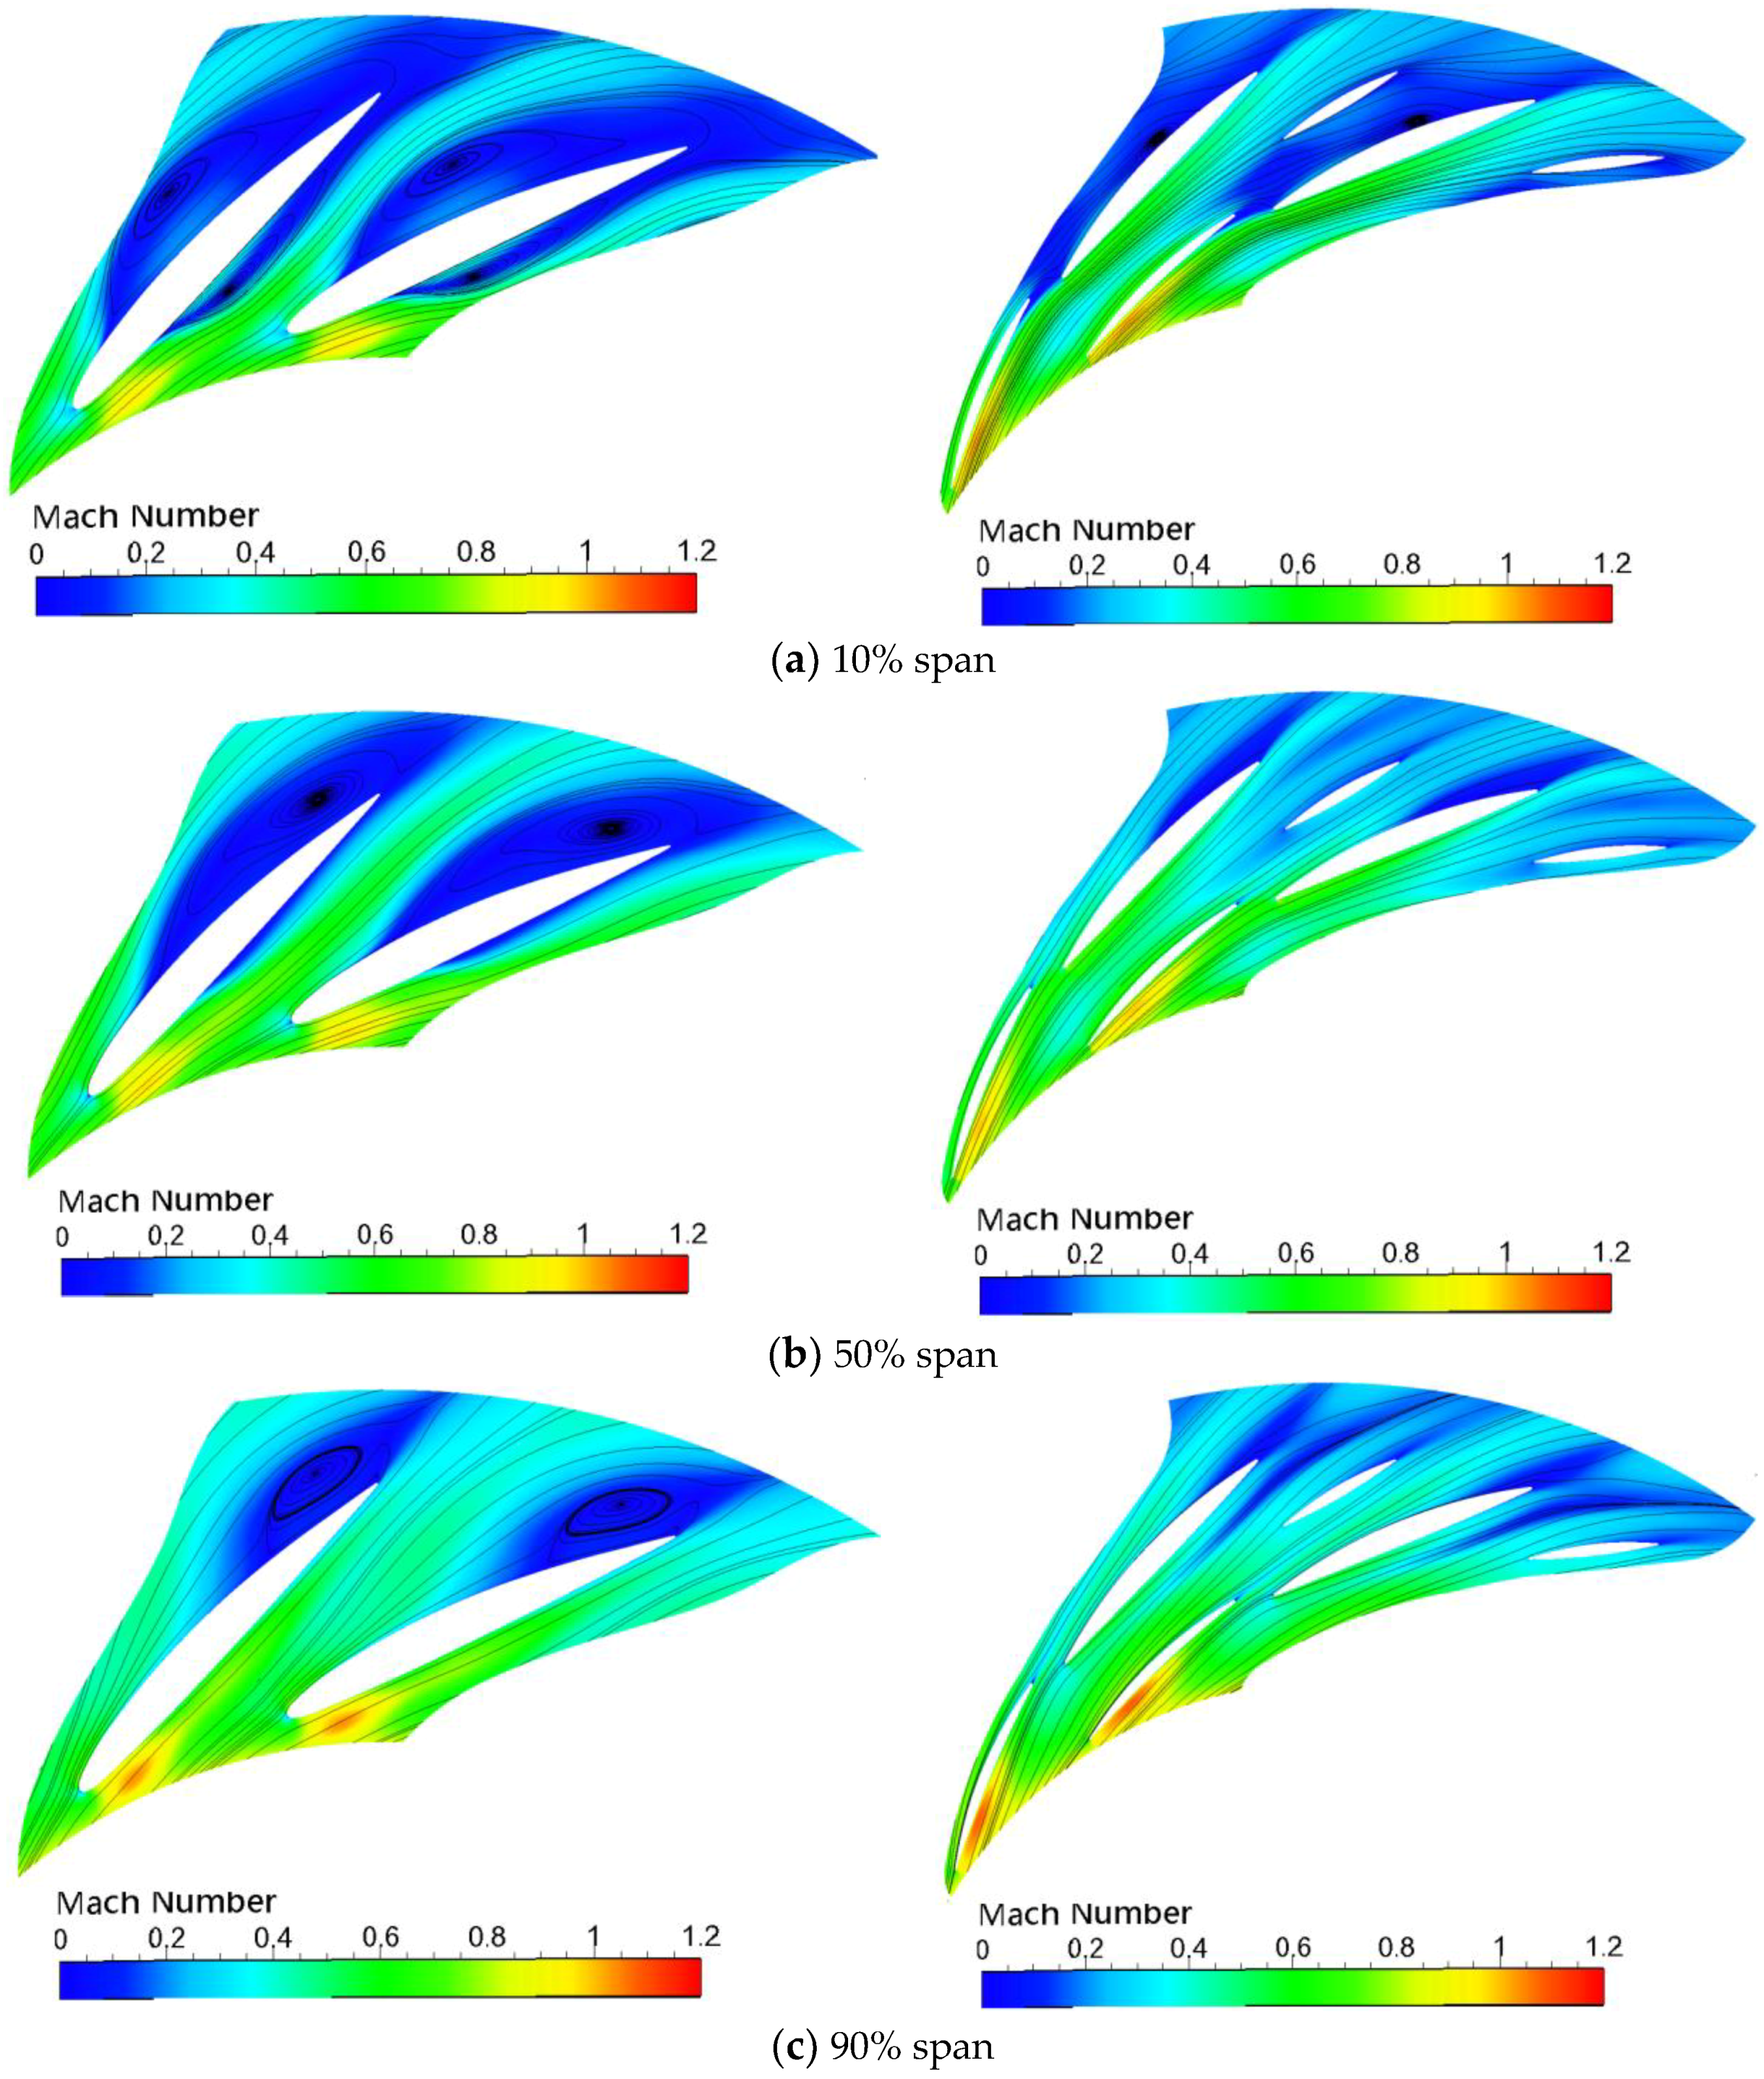
Figure 16 shows the Mach number distribution in different spans of the original and optimized designs of the high-pressure-stage centrifugal compressor at 100% load. An obvious low-speed area was observed at the end of the vaned diffuser in the original design at 10% span, and this area occupied more than 50% of the flow passage. An obvious separation phenomenon was observed in the low-speed area. In the optimized design, the flow in the flow passage was stable due to the addition of splitter vanes on the second row. However, a small separation area was observed on the pressure side of the second large vane row. At 50% span, the position of the low-speed area in the vaned diffuser moved slightly backward compared with the original design. However, the low-speed area still occupied approximately 50% of the passage. An obvious separation phenomenon was still observed in the low-speed area, but the range was reduced. The optimized design was similar to the original design. The low-speed region in the vaned diffuser was also backward and occupied approximately 50% of the passage. However, the flow was steady in the low-speed area with no separation. At 90% span, the low-speed area in the passage and the separation area were significantly reduced in the original design. In the optimized design, the low-speed area obviously decreased in the vaned diffuser.
In general, the divergent angle of the vaned diffuser was overly large in the original design, leading to obvious separation in different spans. The closer to the tip, the better the flow. In the optimized design, the addition of splitter vanes effectively reduced the divergent angle of the vaned diffuser. Therefore, no separation existed, although a low-speed area was observed in the flow passage. Similar to the original design, the closer to the tip, the better the flow. The overall flow in the vaned diffuser was significantly improved.
5.2. 90% Load
Figure 17 shows the meridional flow diagram at 90% load. Similar to the situation with 100% load, a large separation area was observed in the vaned diffuser in the original design, and a small separation area was found near the tip of the vaned diffuser outlet. In the optimized design, the flow was still steady in the flow passage without obvious separation.
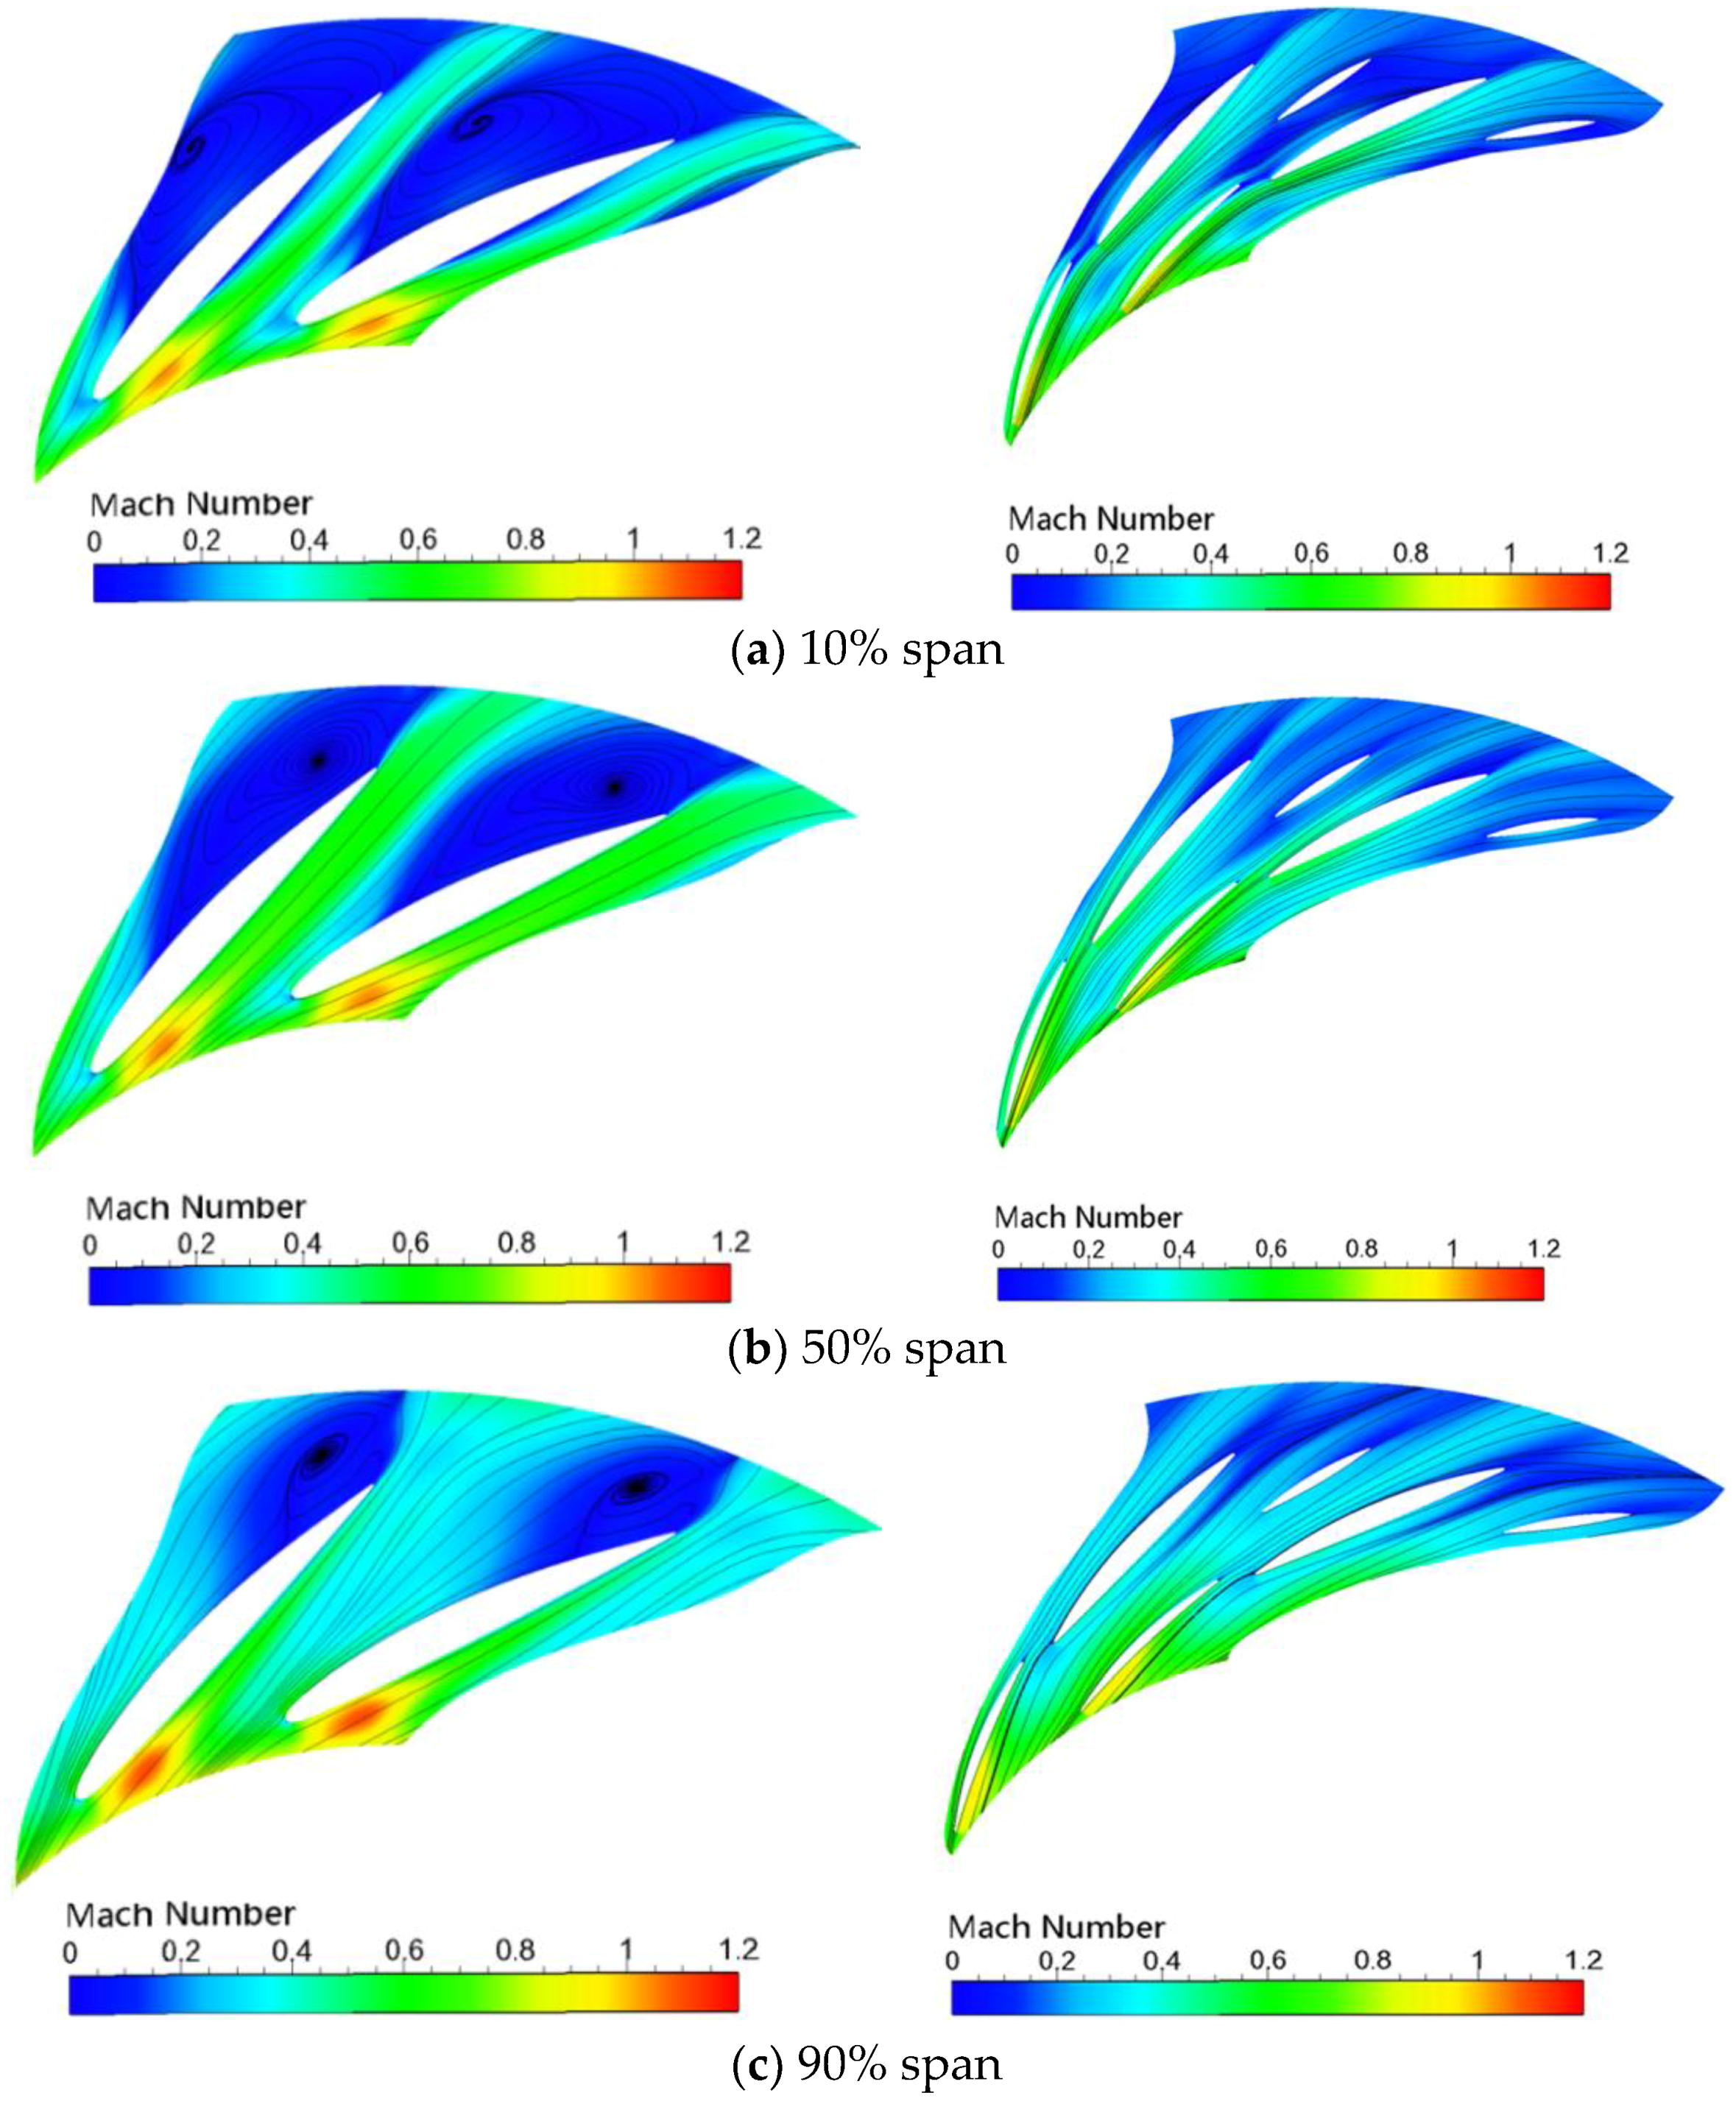
Figure 18 shows the Mach number distribution in different spans of the original and optimized designs of the low-pressure-stage centrifugal compressor at 90% load. For the original and optimized designs, the Mach number distribution in different spans and the flow in the flow passage were similar to those at 100% load. However, the blockage increased in the vaned diffuser outlet in the original design at 90% span, making the blade tip show an obvious backflow area.
Figure 19 shows the Mach number distribution in different spans of the original and optimized designs of the high-pressure stage centrifugal compressor at 90% load. In the high-pressure stage, the high Mach number distribution and flow condition at different spans were similar to those at 100% load in the original and optimized designs, and the overall flow features had no obvious change.
In general, compared with the situation in the 100% load, the flow characteristics did not change considerably in the original and optimized designs of the low/high-pressure-stage centrifugal compressor at 90% load. In the original design, the low/high-pressure centrifugal compressor was affected by its design limitation, and several poor flows were observed in the flow passage. In the optimized design, the flow in the low/high-pressure-stage centrifugal compressor obviously improved.
5.3. 60% Load
Figure 20 shows the meridional streamline chart at 60% load. In the original design, a separation area was observed near the edge of the impeller inlet rim, in addition to the separation area in the vane-less diffuser and vaned diffuser outlet. This condition indicates that the operating condition of the low-pressure-stage compressor was close to the surge line. In the optimized design, the overall flow in the passage was stable, but separation areas were observed near the impeller inlet rim of the low-pressure-stage compressor.
Figure 21 shows the Mach number distribution in different spans of the original and optimized designs of the low-pressure-stage centrifugal compressor at 60% load. For the original and optimized designs, the Mach distribution in different spans and the flow in the passage were nearly similar to those at 90% load.
Figure 22 shows the Mach number distribution in different spans of the original and optimized designs of the high-pressure-stage centrifugal compressor at 60% load. In the high-pressure stage, the high Mach number distribution and the flow in the passage were similar to those at 90% load in the original and optimized designs, and the overall flow features had no obvious change.
In general, the largest difference between 100%, 90%, and 60% loads was the emergence of separation areas near the low-pressure stage impeller inlet rim. This condition shows that the low-pressure-stage compressor operation points were near the surge line, which is an unstable factor for the operation of the unit and requires appropriate attention to avoid accidents.
Under three typical load conditions of 100%, 90% and 60%, the flow in the low/high-pressure-stage centrifugal compressor had several undesirable conditions in the original design. However, the flow was improved effectively in the optimized design.
6. Results
This study presented an optimized design method for centrifugal compressors based on 1D calculations and analyses. A low/high-pressure-stage centrifugal compressor in an MW-level gas turbine was optimized by the proposed method. According to the calculation results of the MW-level gas turbine cycle, three typical load conditions of 100%, 90%, and 60% were calculated for the original and optimized designs. The main conclusions are summarized as follows.
For the low-pressure-stage centrifugal compressor, the analysis showed that the diameter ratio of the vaned diffuser was overly large, which led to an increase in loss and low efficiency. The diameter ratio was reduced in the optimized design. To optimize the ratio of the throat area between the impeller and diffuser, a tandem diffuser was used to replace the original single-stage diffuser. After optimization, the pressure ratio increased by more than 3%, and efficiency improved by more than 2%.
For the high-pressure-stage centrifugal compressor, the calculation results of the 1D optimal design system showed that the divergent angle of the vaned diffuser was overly large and led to unit performance degradation. In the optimized design, the divergent angle was reduced by using a vaned diffuser with splitter vanes. After optimization, the pressure ratio and efficiency increased by more than 4%.
Through the coupling calculations at 100%, 90%, and 60% loads, the performances of optimized design were significantly improved compared to those of the original design in the low/high-pressure-stage centrifugal compressor. Under the three load conditions, the pressure ratio of the unit increased by approximately 8%, and efficiency improved by approximately 4%.
Author Contributions
Conceptualization, X.S.L. and C.W.G.; Methodology, W.Z. and X.D.R.; Investigation, W.Z. and X.D.R.; Validation, W.Z. and X.D.R.; Writing-Original Draft Preparation, W.Z. and X.S.L.; Writing-Review & Editing, W.Z. and X.S.L.; Visualization, X.S.L.; Supervision, C.W.G.
Funding
This research was funded by [National Natural Science Foundation of China] grant number [51736008].
Conflicts of Interest
The authors declare no conflicts of interest.
Nomenclature
| Ad*/Ai* | the theoretical ratio of the impeller and the diffuser throat areas when the impeller and the vaned diffuser choke at the same time |
| B | hub to shroud passage width |
| b* | ratio of vaneless diffuser inlet width to impeller exit width |
| B | aerodynamic blockage |
| cf | skin friction coefficient |
| C | absolute velocity |
| Cp | specific heat at constant pressure |
| Cm | absolute meridional velocity |
| Cθ | absolute tangential velocity |
| D | diameter |
| dHB | hydraulic diameter |
| Df | diffusion factor |
| Δhth | euler work |
| LB | impeller flow length |
| LZ | axial length of impeller |
| m | mass flow rate |
| U | Impeller periphery velocity |
| W | relative velocity |
| Z | number of blade |
| α | absolute flow angle |
| β | relative angle |
| Φ | flow coefficient |
| γ | meridional inclination angle |
| η | Efficiency |
| ε | wake fraction of blade-to-blade space |
| μ | slip factor μ = Cθ2/Cθ2∞ |
| ρ | density |
| σ | slip factor σ = 1 − Cslip/U2 |
| Subscripts | |
| 1 | impeller inlet condition |
| 2 | impeller outlet condition |
| 3 | vaneless diffuser outlet condition |
| 4 | vaned diffuser outlet condition |
| M | meridional direction |
| θ | tangential direction |
| h | hub |
| s | shroud |
References
- Krain, H. Review of centrifugal compressor’s application and development. ASME J. Turbomach. 2005, 127, 25–34. [Google Scholar] [CrossRef]
- Johnson, D.G. The Norwegian Gas Turbine Pioneer: Aegidius Elling. Energy World 1985, 1, 10–13. [Google Scholar]
- Eckardt, D. Detailed flow investigations within a high-speed centrifugal compressor impeller. J. Fluids Eng. 1976, 98, 390–399. [Google Scholar] [CrossRef]
- Krain, H. Swirling impeller flow. J. Turbomach. 1988, 110, 122–128. [Google Scholar] [CrossRef]
- Hah, C.; Krain, H. Secondary flows and vortex motion in a high-efficiency backswept impeller at design and off-design conditions. J. Turbomach. 1990, 112, 7–13. [Google Scholar] [CrossRef]
- Krain, H.; Hoffmann, B. Aerodynamics of a Centrifugal Compressor Impeller with Transonic Inlet Conditions; ASME Paper 95-GT-079; ASME: New York, NY, USA, 1995. [Google Scholar]
- Eisenlohr, G.; Krain, H.; Richter, F.A.; Tiede, V. Investigations of the Flow through a High Pressure Ratio Centrifugal Impeller; ASME Paper; ASME: New York, NY, USA, 2002; pp. 649–657. [Google Scholar]
- Hah, C.; Krain, H. Analysis of Transonic Flow Fields Inside a High Pressure Ratio Centrifugal Compressor at Design and off Design Conditions; ASME Paper; ASME: New York, NY, USA, 1999; p. 446. [Google Scholar]
- Senoo, Y.; Hayami, H.; Kinoshita, Y.; Yamasaki, H. Experimental study on flow in a supersonic centrifugal impeller. J. Eng. Gas Turbines Power 1979, 101, 32–39. [Google Scholar] [CrossRef]
- Higashimori, H.; Hasagawa, K.; Sumida, K.; Suita, T. Detailed flow study of Mach number 1.6 high transonic flow with a shock wave in a pressure ratio 11 centrifugal compressor impeller. ASME J. Turbomach. 2004, 126, 473–481. [Google Scholar] [CrossRef]
- Higashimori, H.; Morishita, S.; Suita, T. Detailed Flow Study of Mach Number 1.6 High Transonic Flow in a Pressure Ratio 11 Centrifugal Compressor Impeller; ASME Paper; ASME: New York, NY, USA, 2007; pp. 1071–1080. [Google Scholar]
- Hosseini, M.; Sun, Z.; He, X.; Zheng, X. Effects of Radial Gap Ratio between Impeller and Vaned Diffuser on Performance of Centrifugal Compressors. Appl. Sci. 2017, 7, 728. [Google Scholar] [CrossRef]
- Ebrahimi, M.; Huang, Q.; He, X.; Zheng, X. Effects of Variable Diffuser Vanes on Performance of a Centrifugal Compressor with Pressure Ratio of 8.0. Energies 2017, 10, 1–15. [Google Scholar]
- Sun, Z.; Zheng, X.; Kawakubo, T. Experimental investigation of instability inducement and mechanism of centrifugal compressors with vaned diffuser. Appl. Therm. Eng. 2018, 13, 464–471. [Google Scholar] [CrossRef]
- Zheng, X.; Liu, A.; Sun, Z. Investigation of the instability mechanisms in a turbocharger centrifugal compressor with a vaneless diffuser by means of unsteady simulations. Inst. Mech. Eng. 2017, 231, 1558–1567. [Google Scholar] [CrossRef]
- Frignac, J.P. The Growth and Evolution of the TPE311; ASME Paper 79-GT-164; ASME: New York, NY, USA, 1979. [Google Scholar]
- Palmer, D.L.; Waterman, W.F. Design and development of an advanced two-stage centrifugal compressor. J. Turbomach. 1995, 117, 205–212. [Google Scholar] [CrossRef]
- Li, P.Y.; Gu, C.W.; Song, Y. A new optimization method for centrifugal compressors based on 1D calculations and analyses. Energies 2015, 8, 4317–4334. [Google Scholar] [CrossRef]
- Casey, M.; Rusch, D. The Matching of a Vaned Diffuser with a Radial Compressor Impeller and Its Effect on the Stage Performance. J. Turbomach. 2014, 136, 121004. [Google Scholar] [CrossRef]
Figure 1.
Development trend of centrifugal compressors: (a) Development trend of total pressure ratio; (b) Relation between pressure ratio and efficiency.
Figure 1.
Development trend of centrifugal compressors: (a) Development trend of total pressure ratio; (b) Relation between pressure ratio and efficiency.

Figure 2.
Comparison of centrifugal compressor pressure ratios.
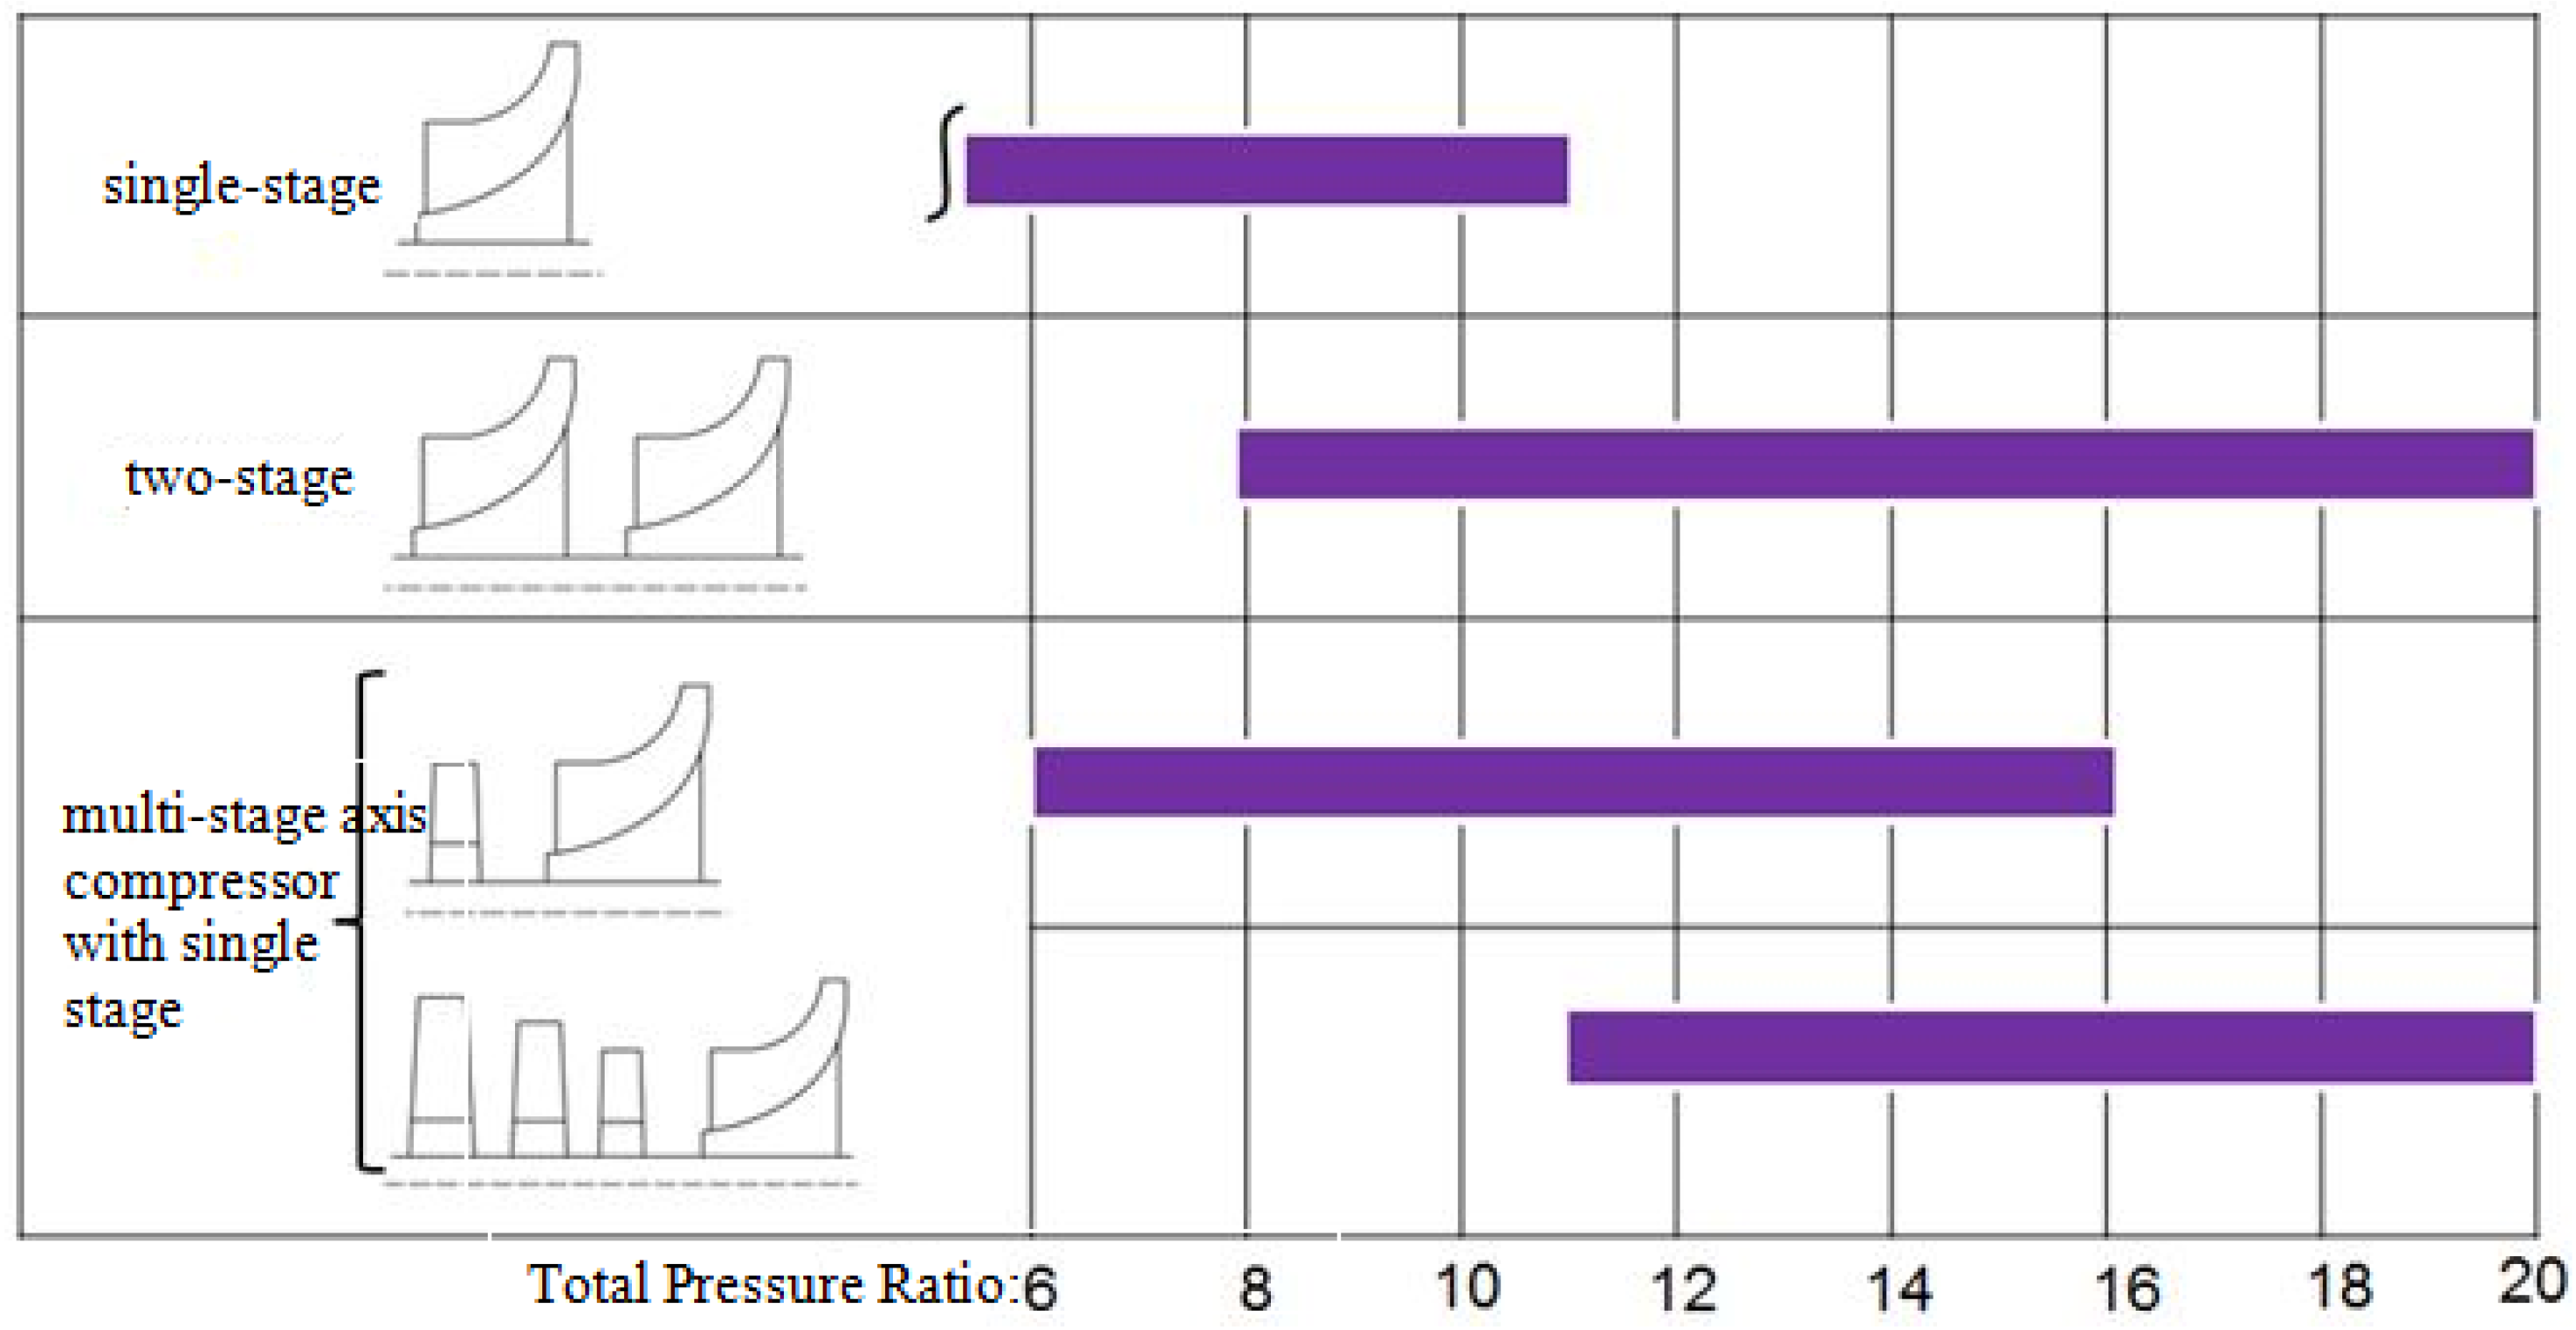
Figure 3.
Structure of an MW-level gas turbine.
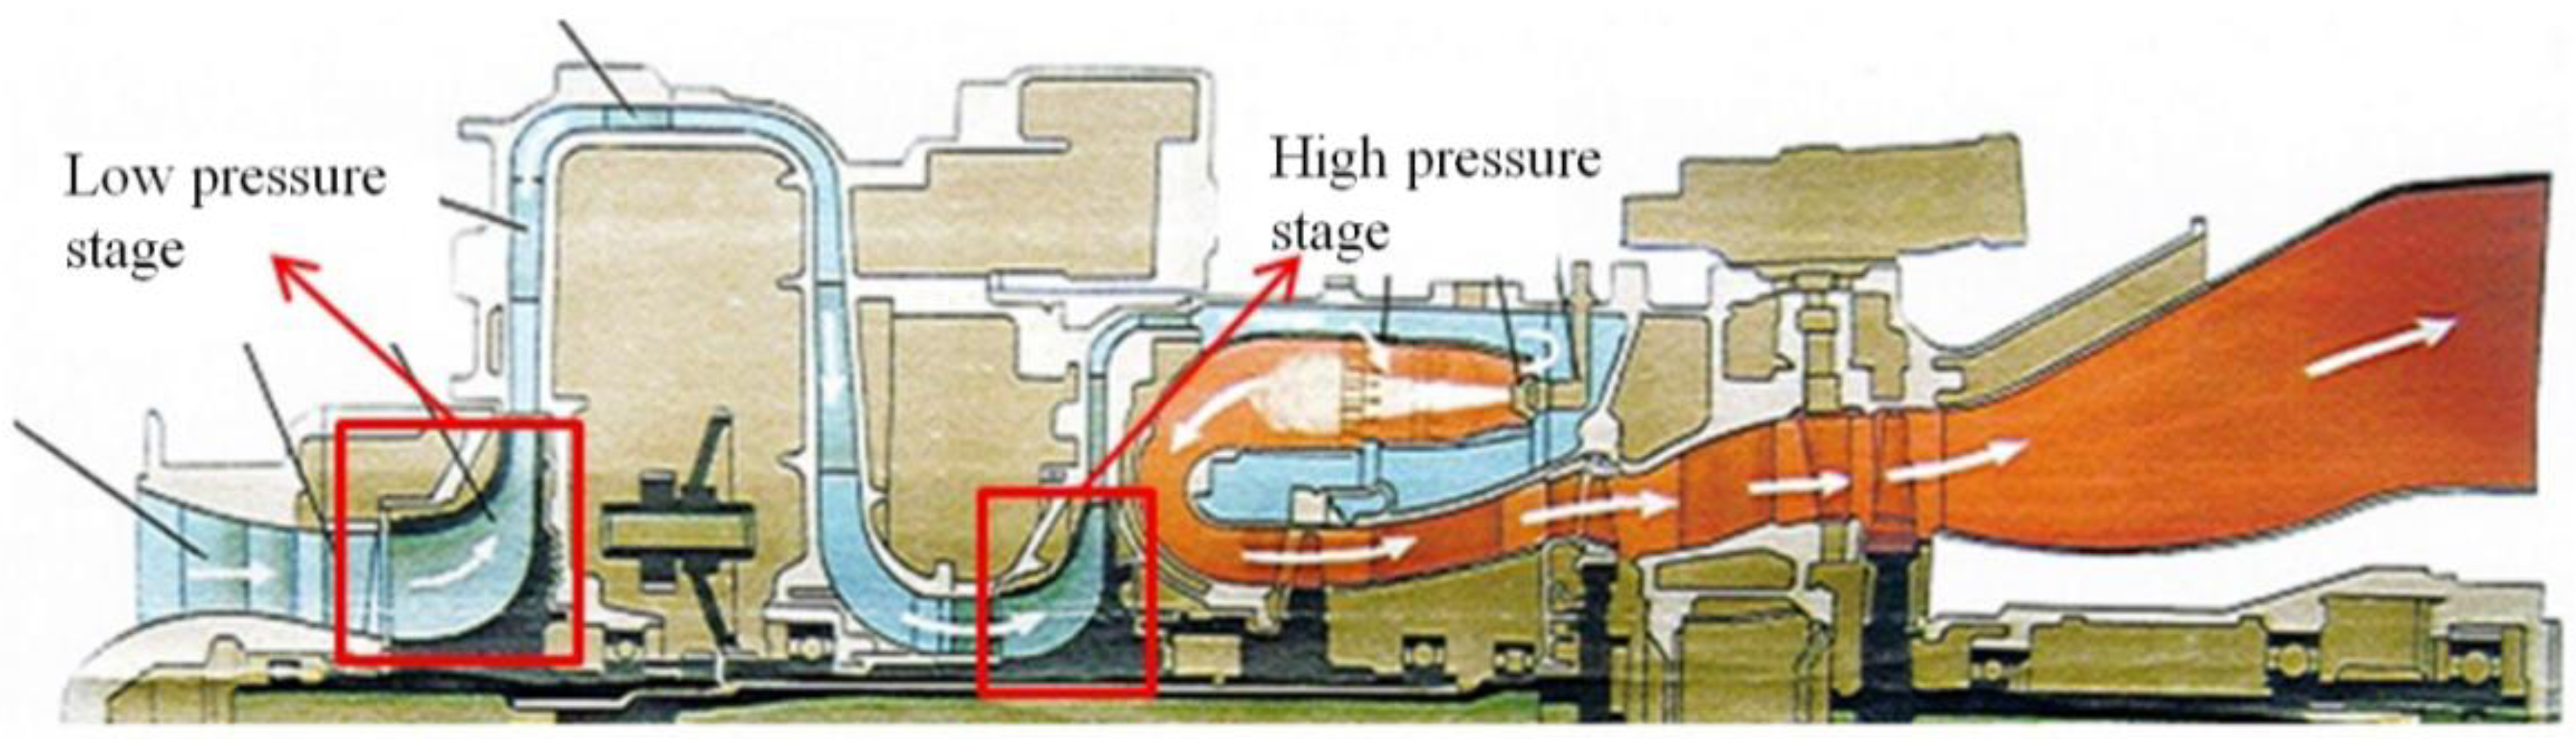
Figure 4.
Geometric structure of a low/high-pressure two-stage centrifugal compressor: (a) Low-pressure stage (b) High-pressure stage.
Figure 4.
Geometric structure of a low/high-pressure two-stage centrifugal compressor: (a) Low-pressure stage (b) High-pressure stage.

Figure 5.
Performance curve of the low-pressure-stage centrifugal compressor.

Figure 6.
Performance curve of the high-pressure-stage centrifugal compressor.
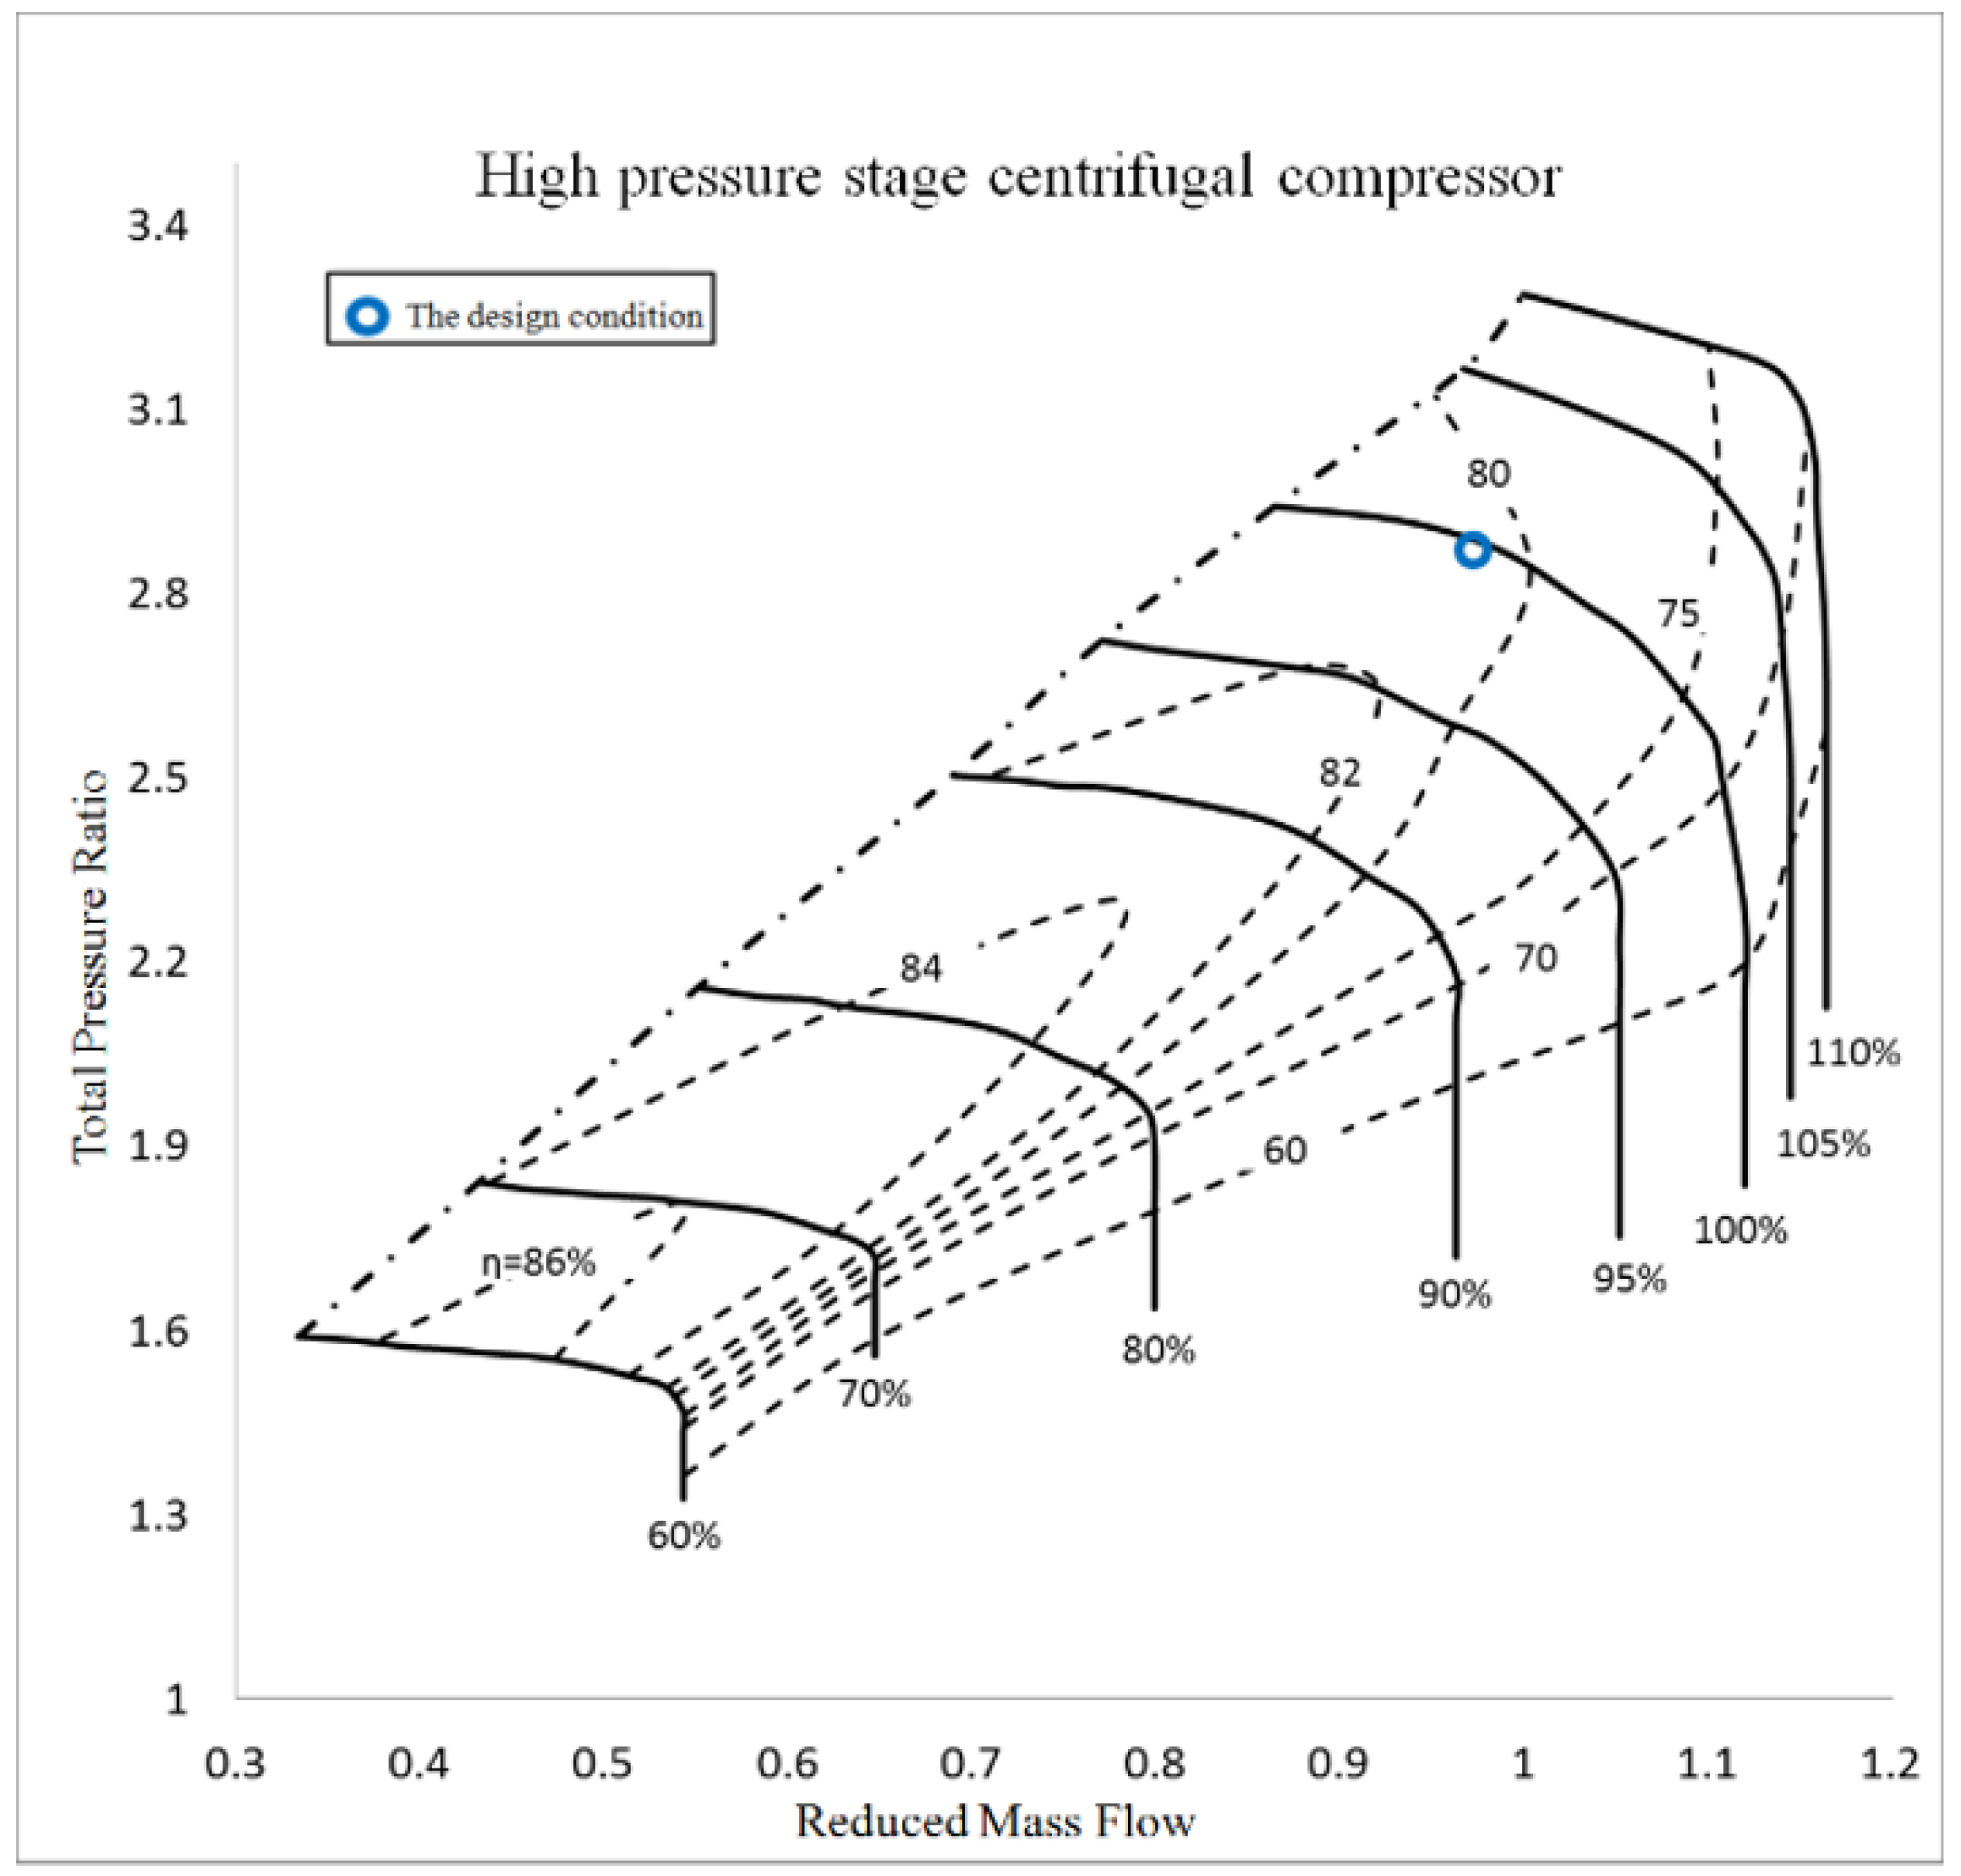
Figure 7.
Geometric structure of the vaned diffuser.

Figure 8.
Performance map of the original and optimized designs for the low-pressure stage: (a) Reduced mass flow vs. total pressure ratio; (b) Reduced mass flow vs. isentropic efficiency.
Figure 8.
Performance map of the original and optimized designs for the low-pressure stage: (a) Reduced mass flow vs. total pressure ratio; (b) Reduced mass flow vs. isentropic efficiency.

Figure 9.
Inlet attack angle distribution of the vaned diffuser in the optimized design.
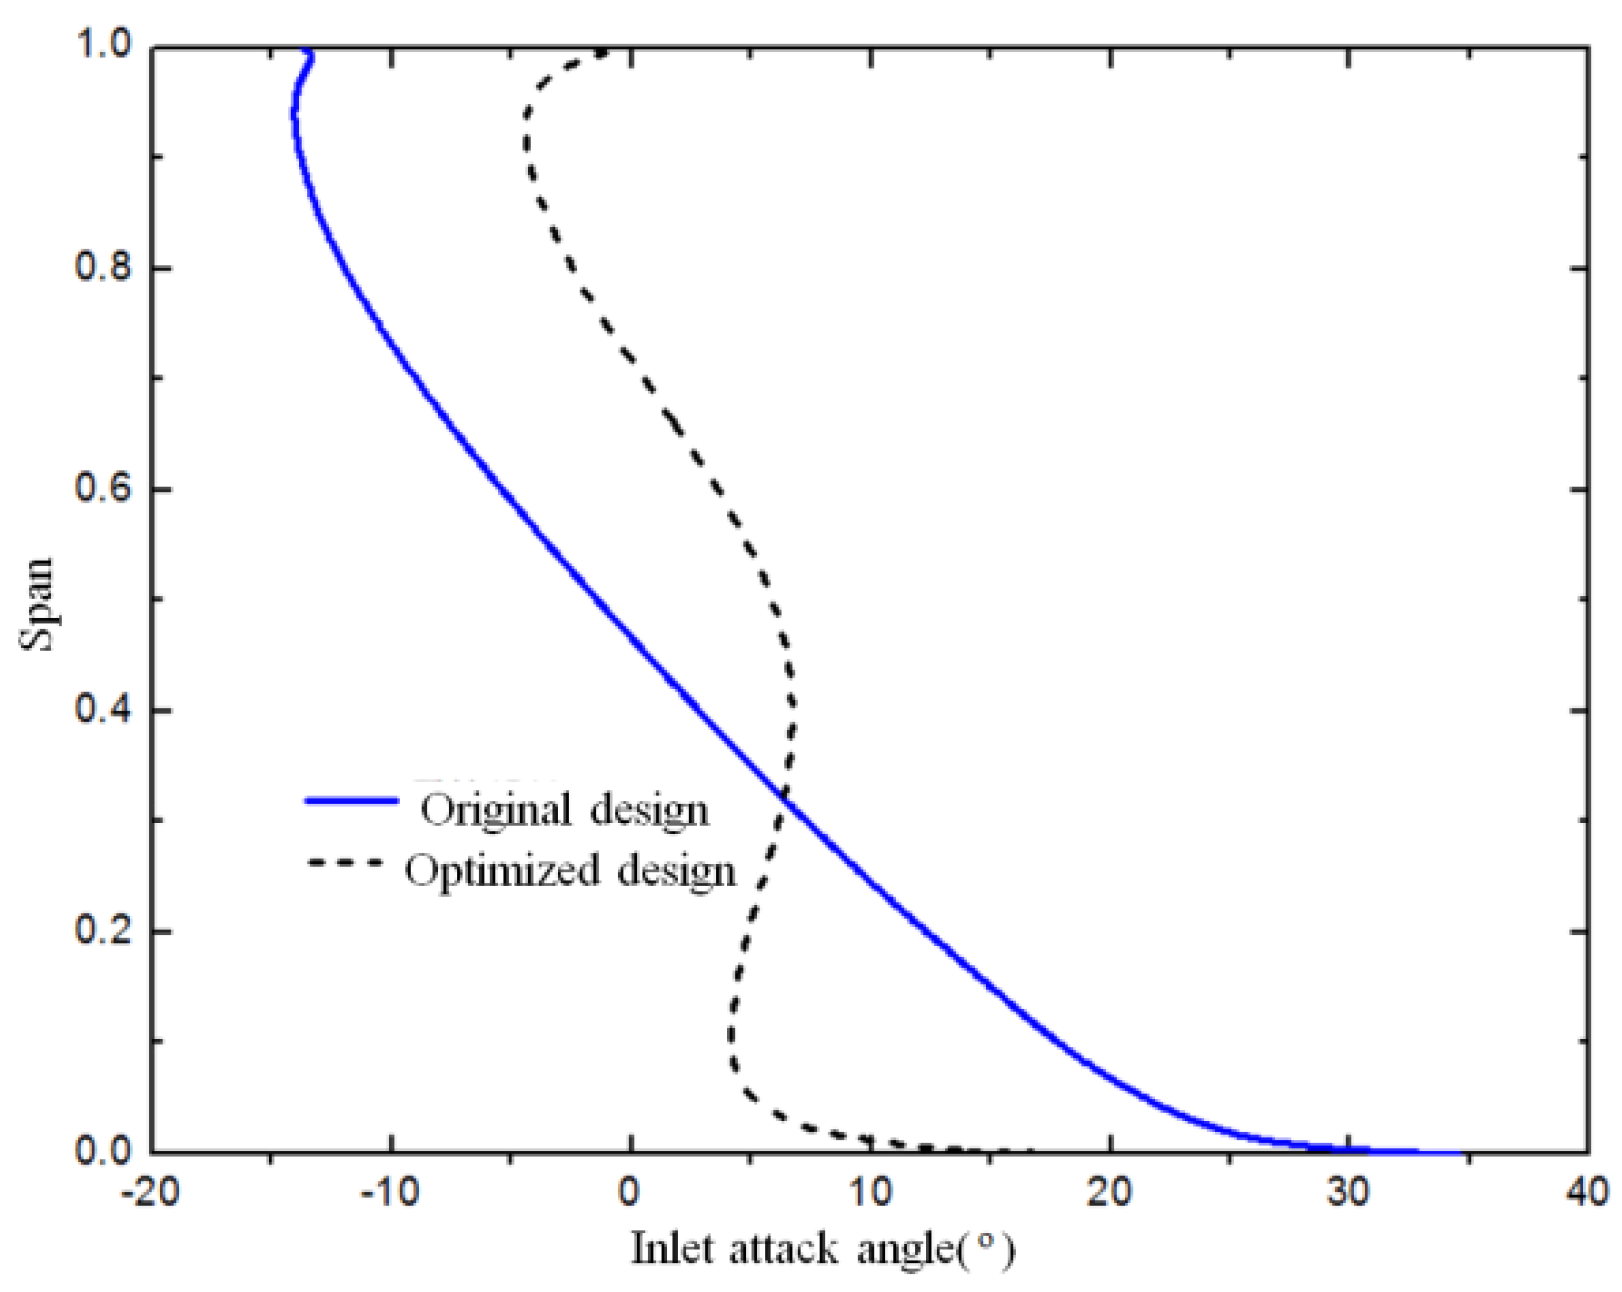
Figure 10.
Geometric structure of the vaned diffuser.

Figure 11.
Performance map of the original and optimized designs for the high-pressure stage: (a) Reduced mass flow vs. total pressure ratio; (b) Reduced mass flow vs. isentropic efficiency.
Figure 11.
Performance map of the original and optimized designs for the high-pressure stage: (a) Reduced mass flow vs. total pressure ratio; (b) Reduced mass flow vs. isentropic efficiency.

Figure 12.
Inlet attack angle distribution of the vaned diffuser.
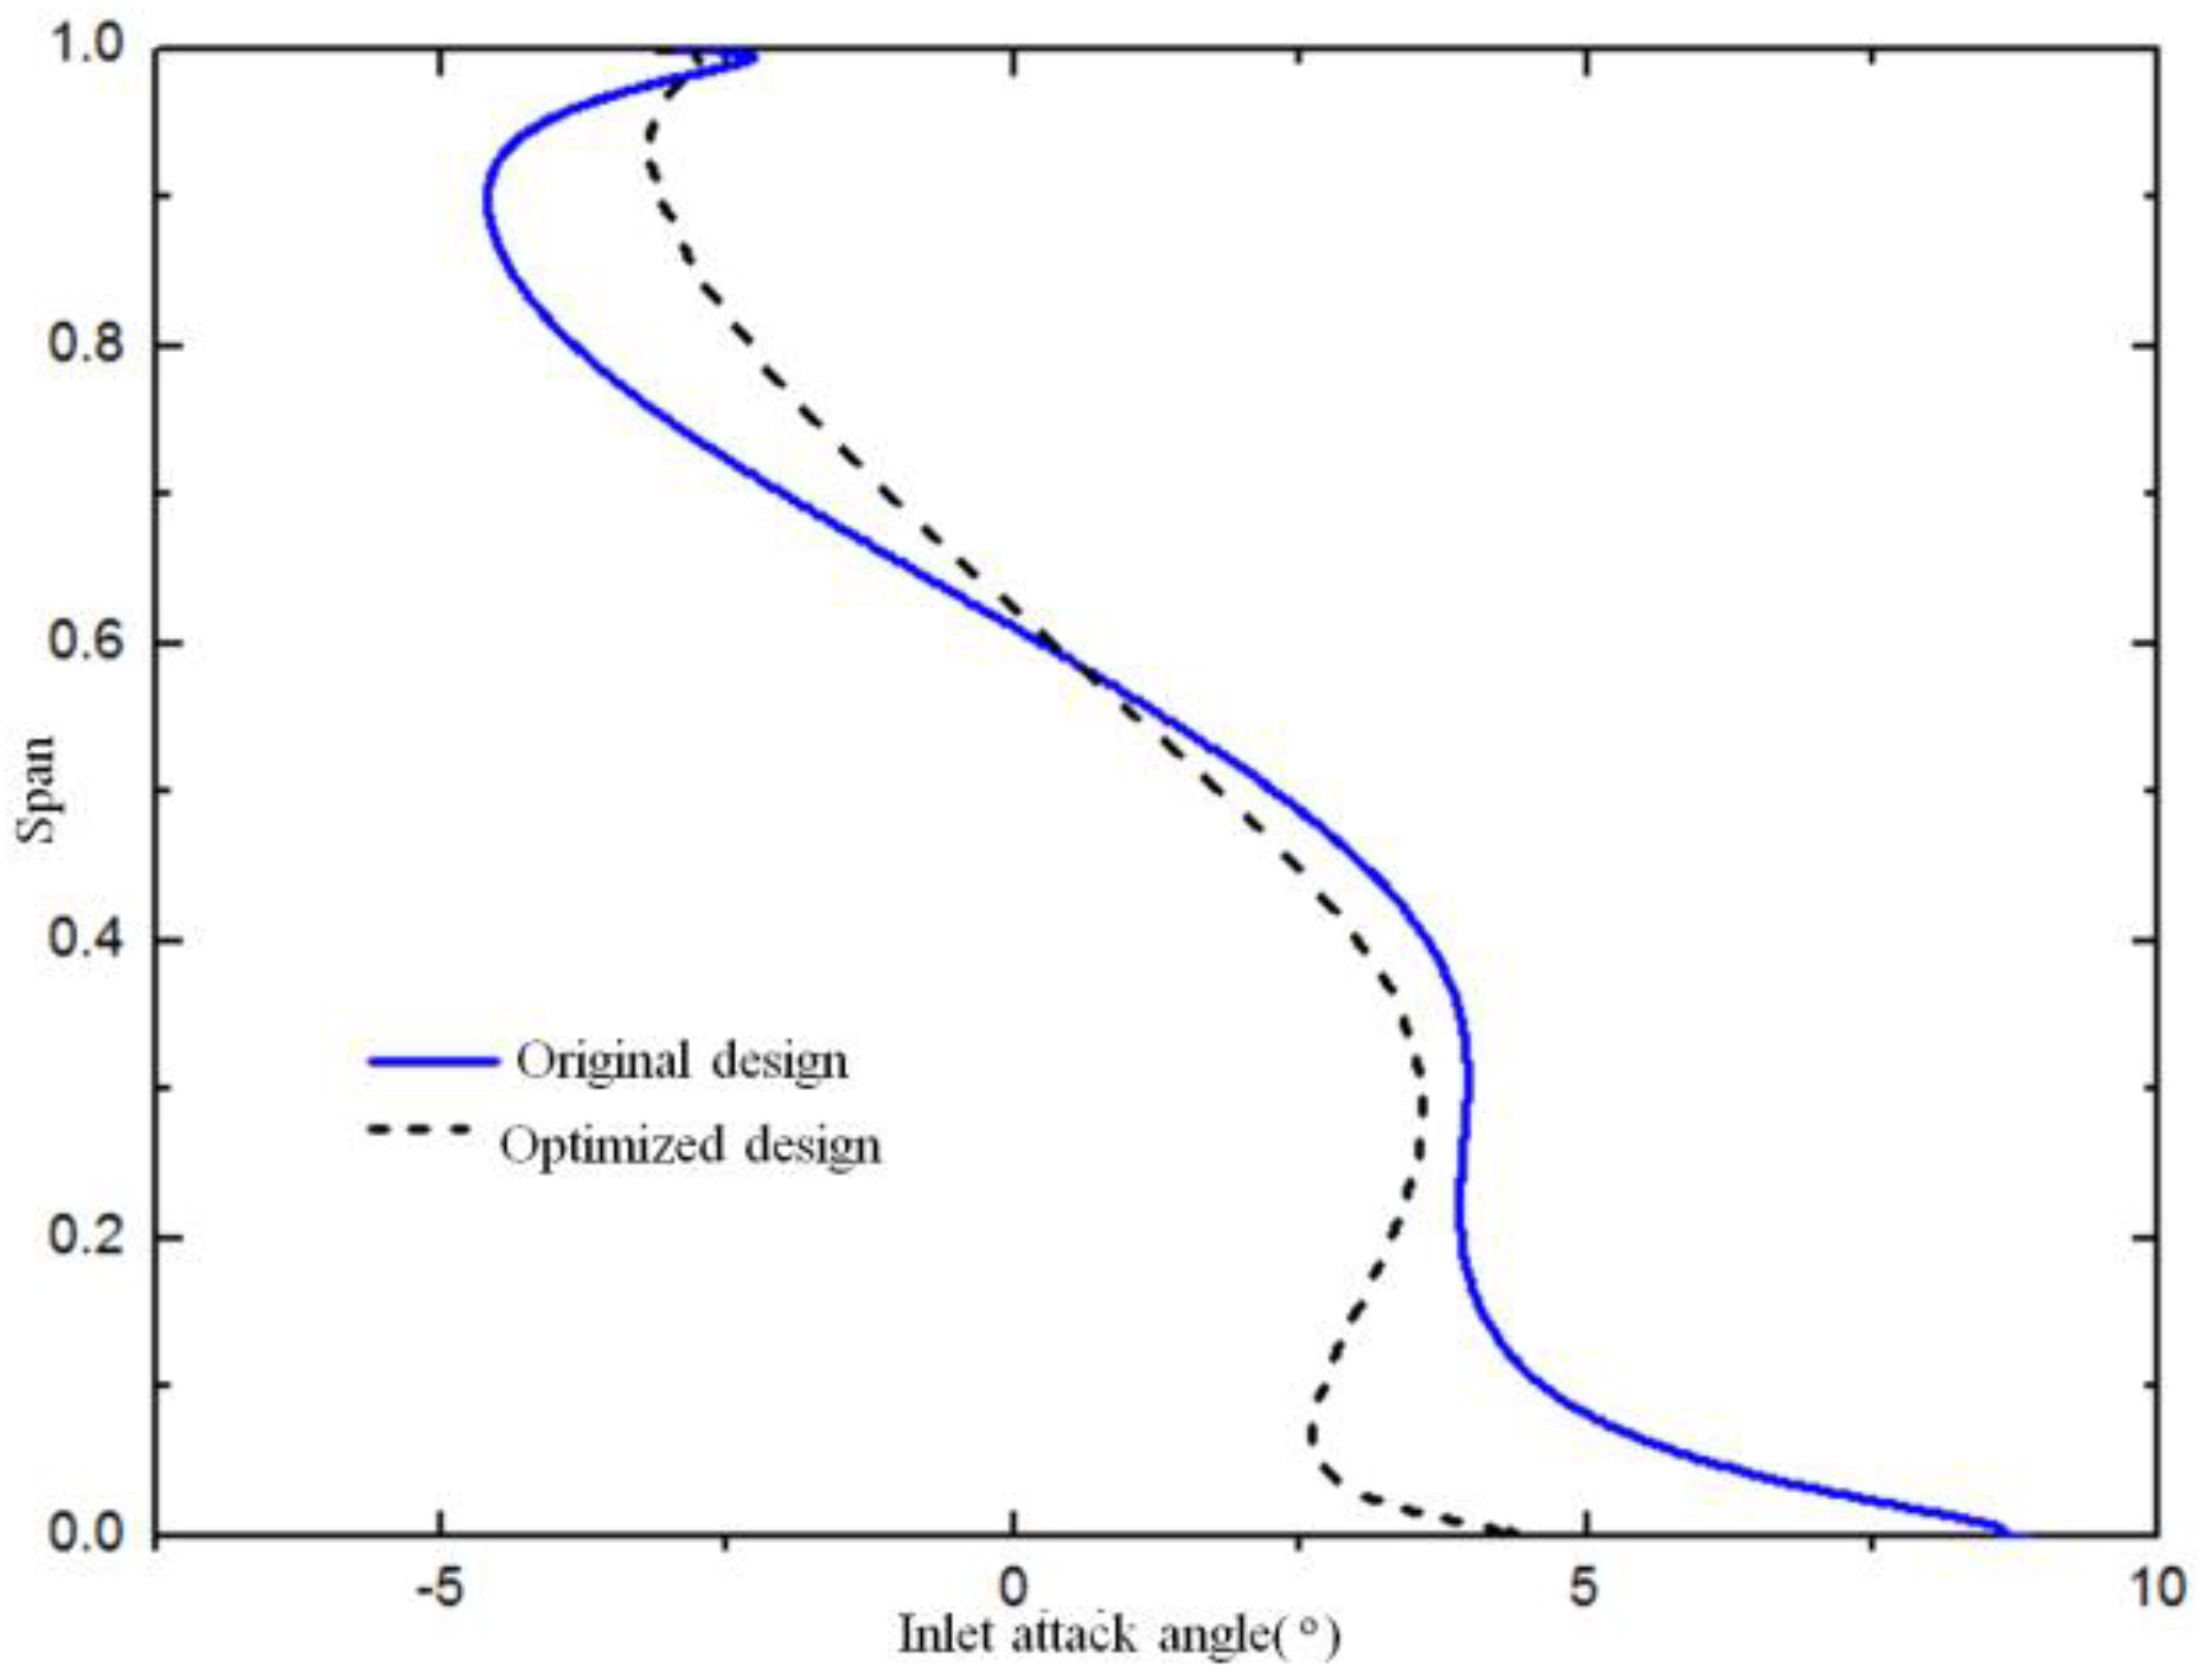
Figure 13.
Geometric structure.

Figure 14.
Meridional streamline at 100% load.

Figure 15.
Mach number distribution at different spans of the original and optimized designs of the low-pressure-stage centrifugal compressor at 100% load.
Figure 15.
Mach number distribution at different spans of the original and optimized designs of the low-pressure-stage centrifugal compressor at 100% load.

Figure 16.
Mach number distribution at different spans of the original and optimized designs of the high-pressure-stage centrifugal compressor at 100% load.
Figure 16.
Mach number distribution at different spans of the original and optimized designs of the high-pressure-stage centrifugal compressor at 100% load.

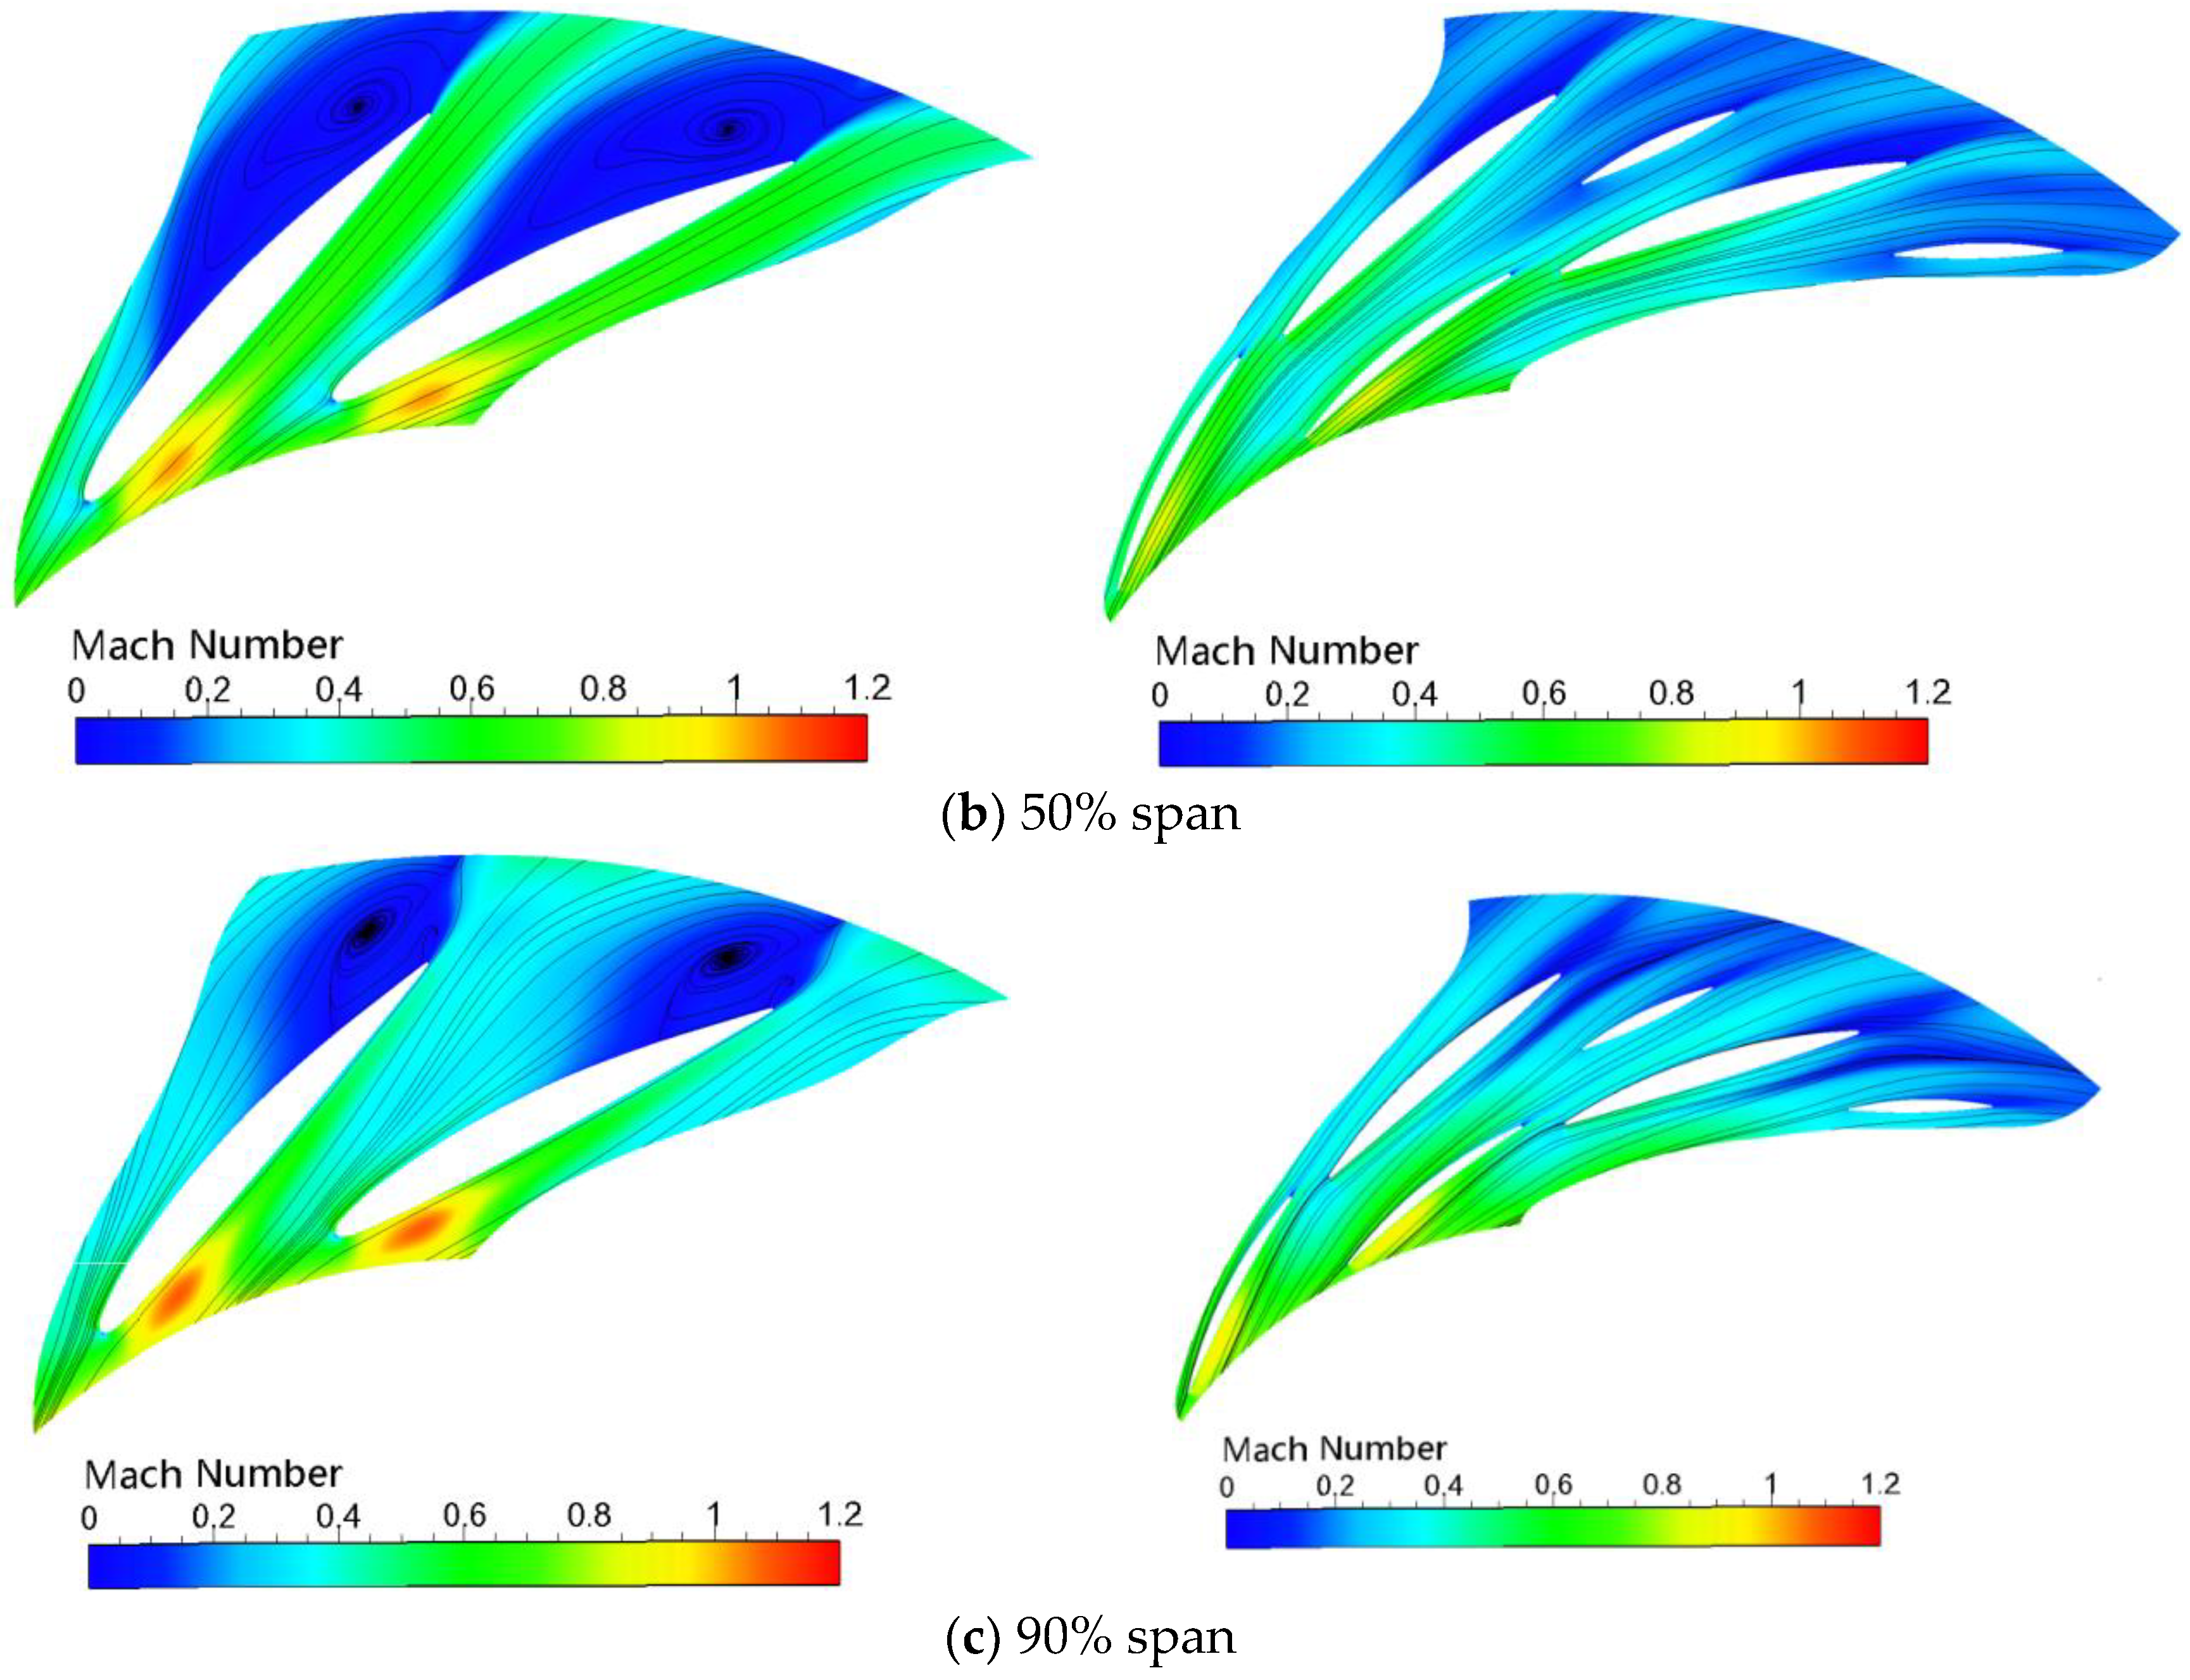
Figure 17.
Meridional streamline at 90% load.
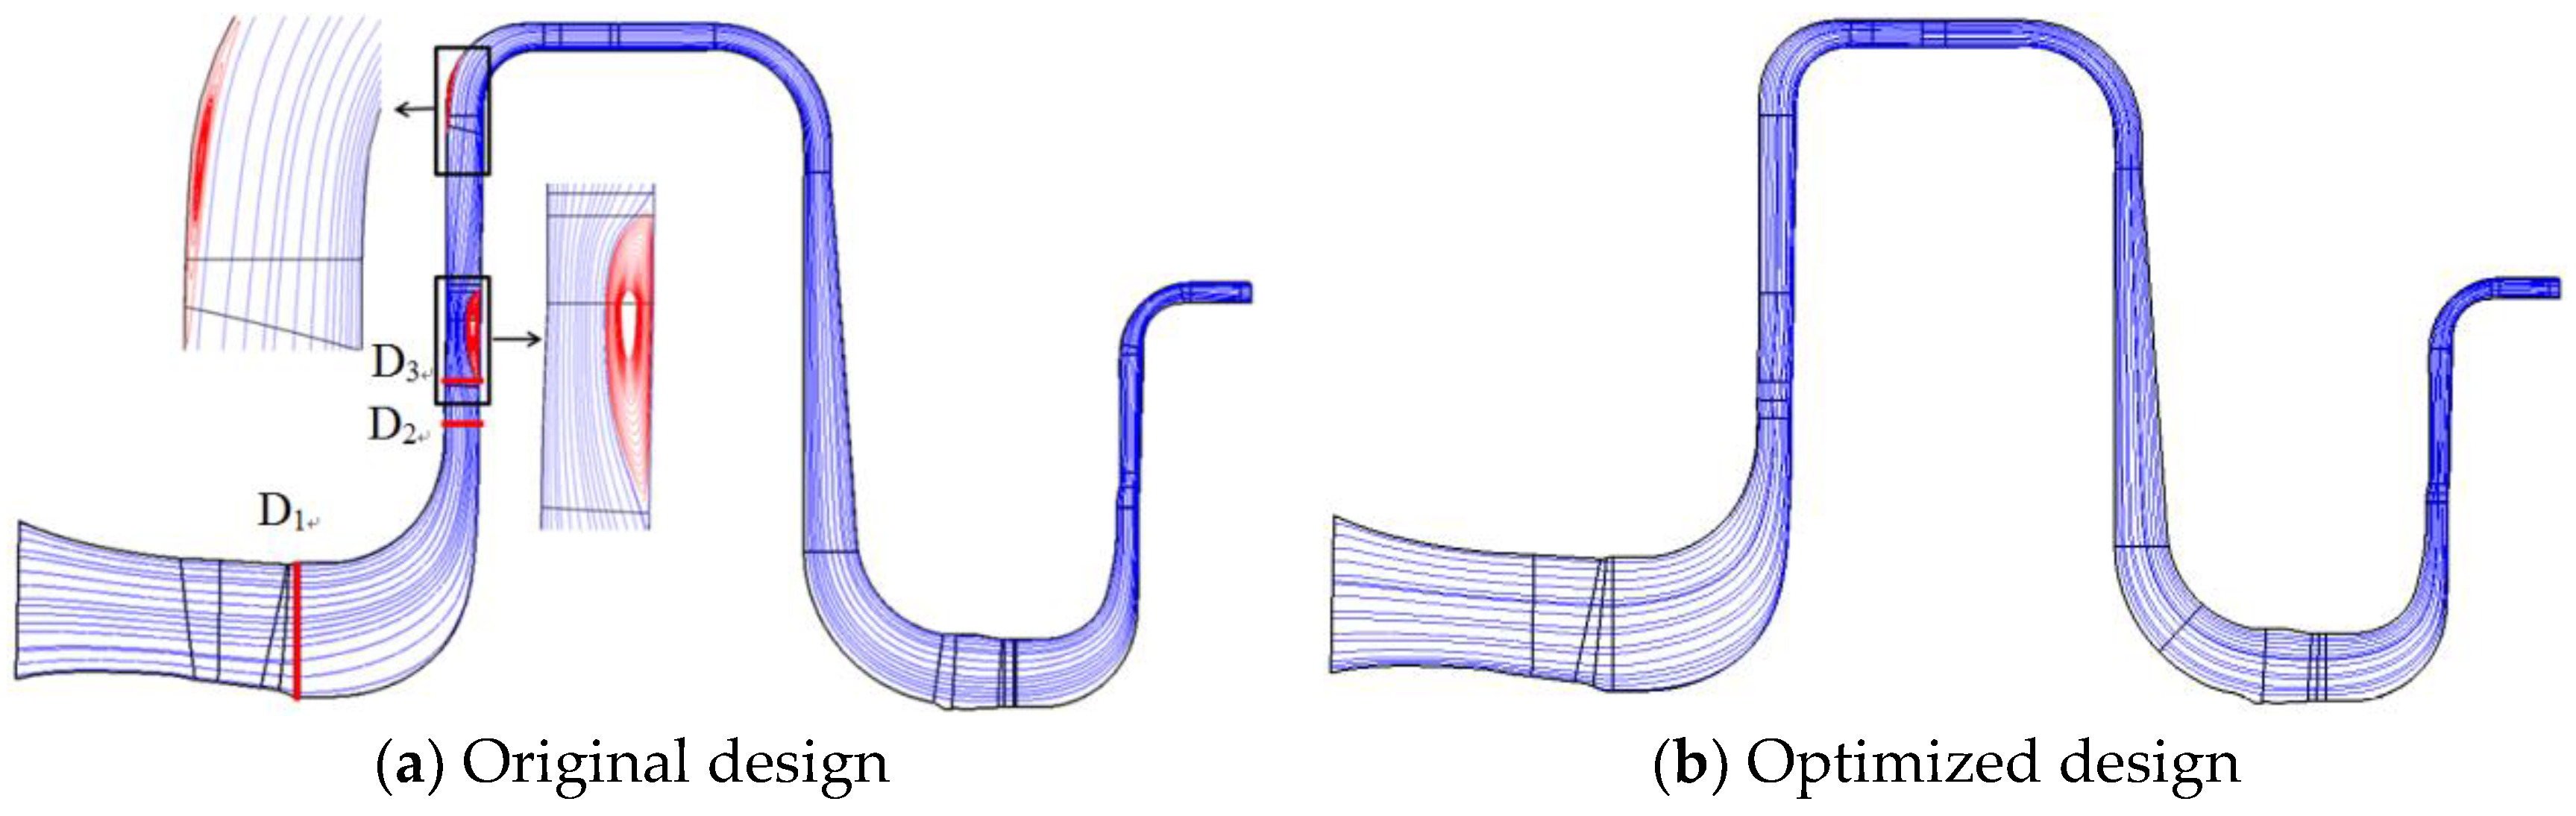
Figure 18.
Mach number distribution at different spans of the original and optimized designs of the low-pressure-stage centrifugal compressor at 90% load.
Figure 18.
Mach number distribution at different spans of the original and optimized designs of the low-pressure-stage centrifugal compressor at 90% load.
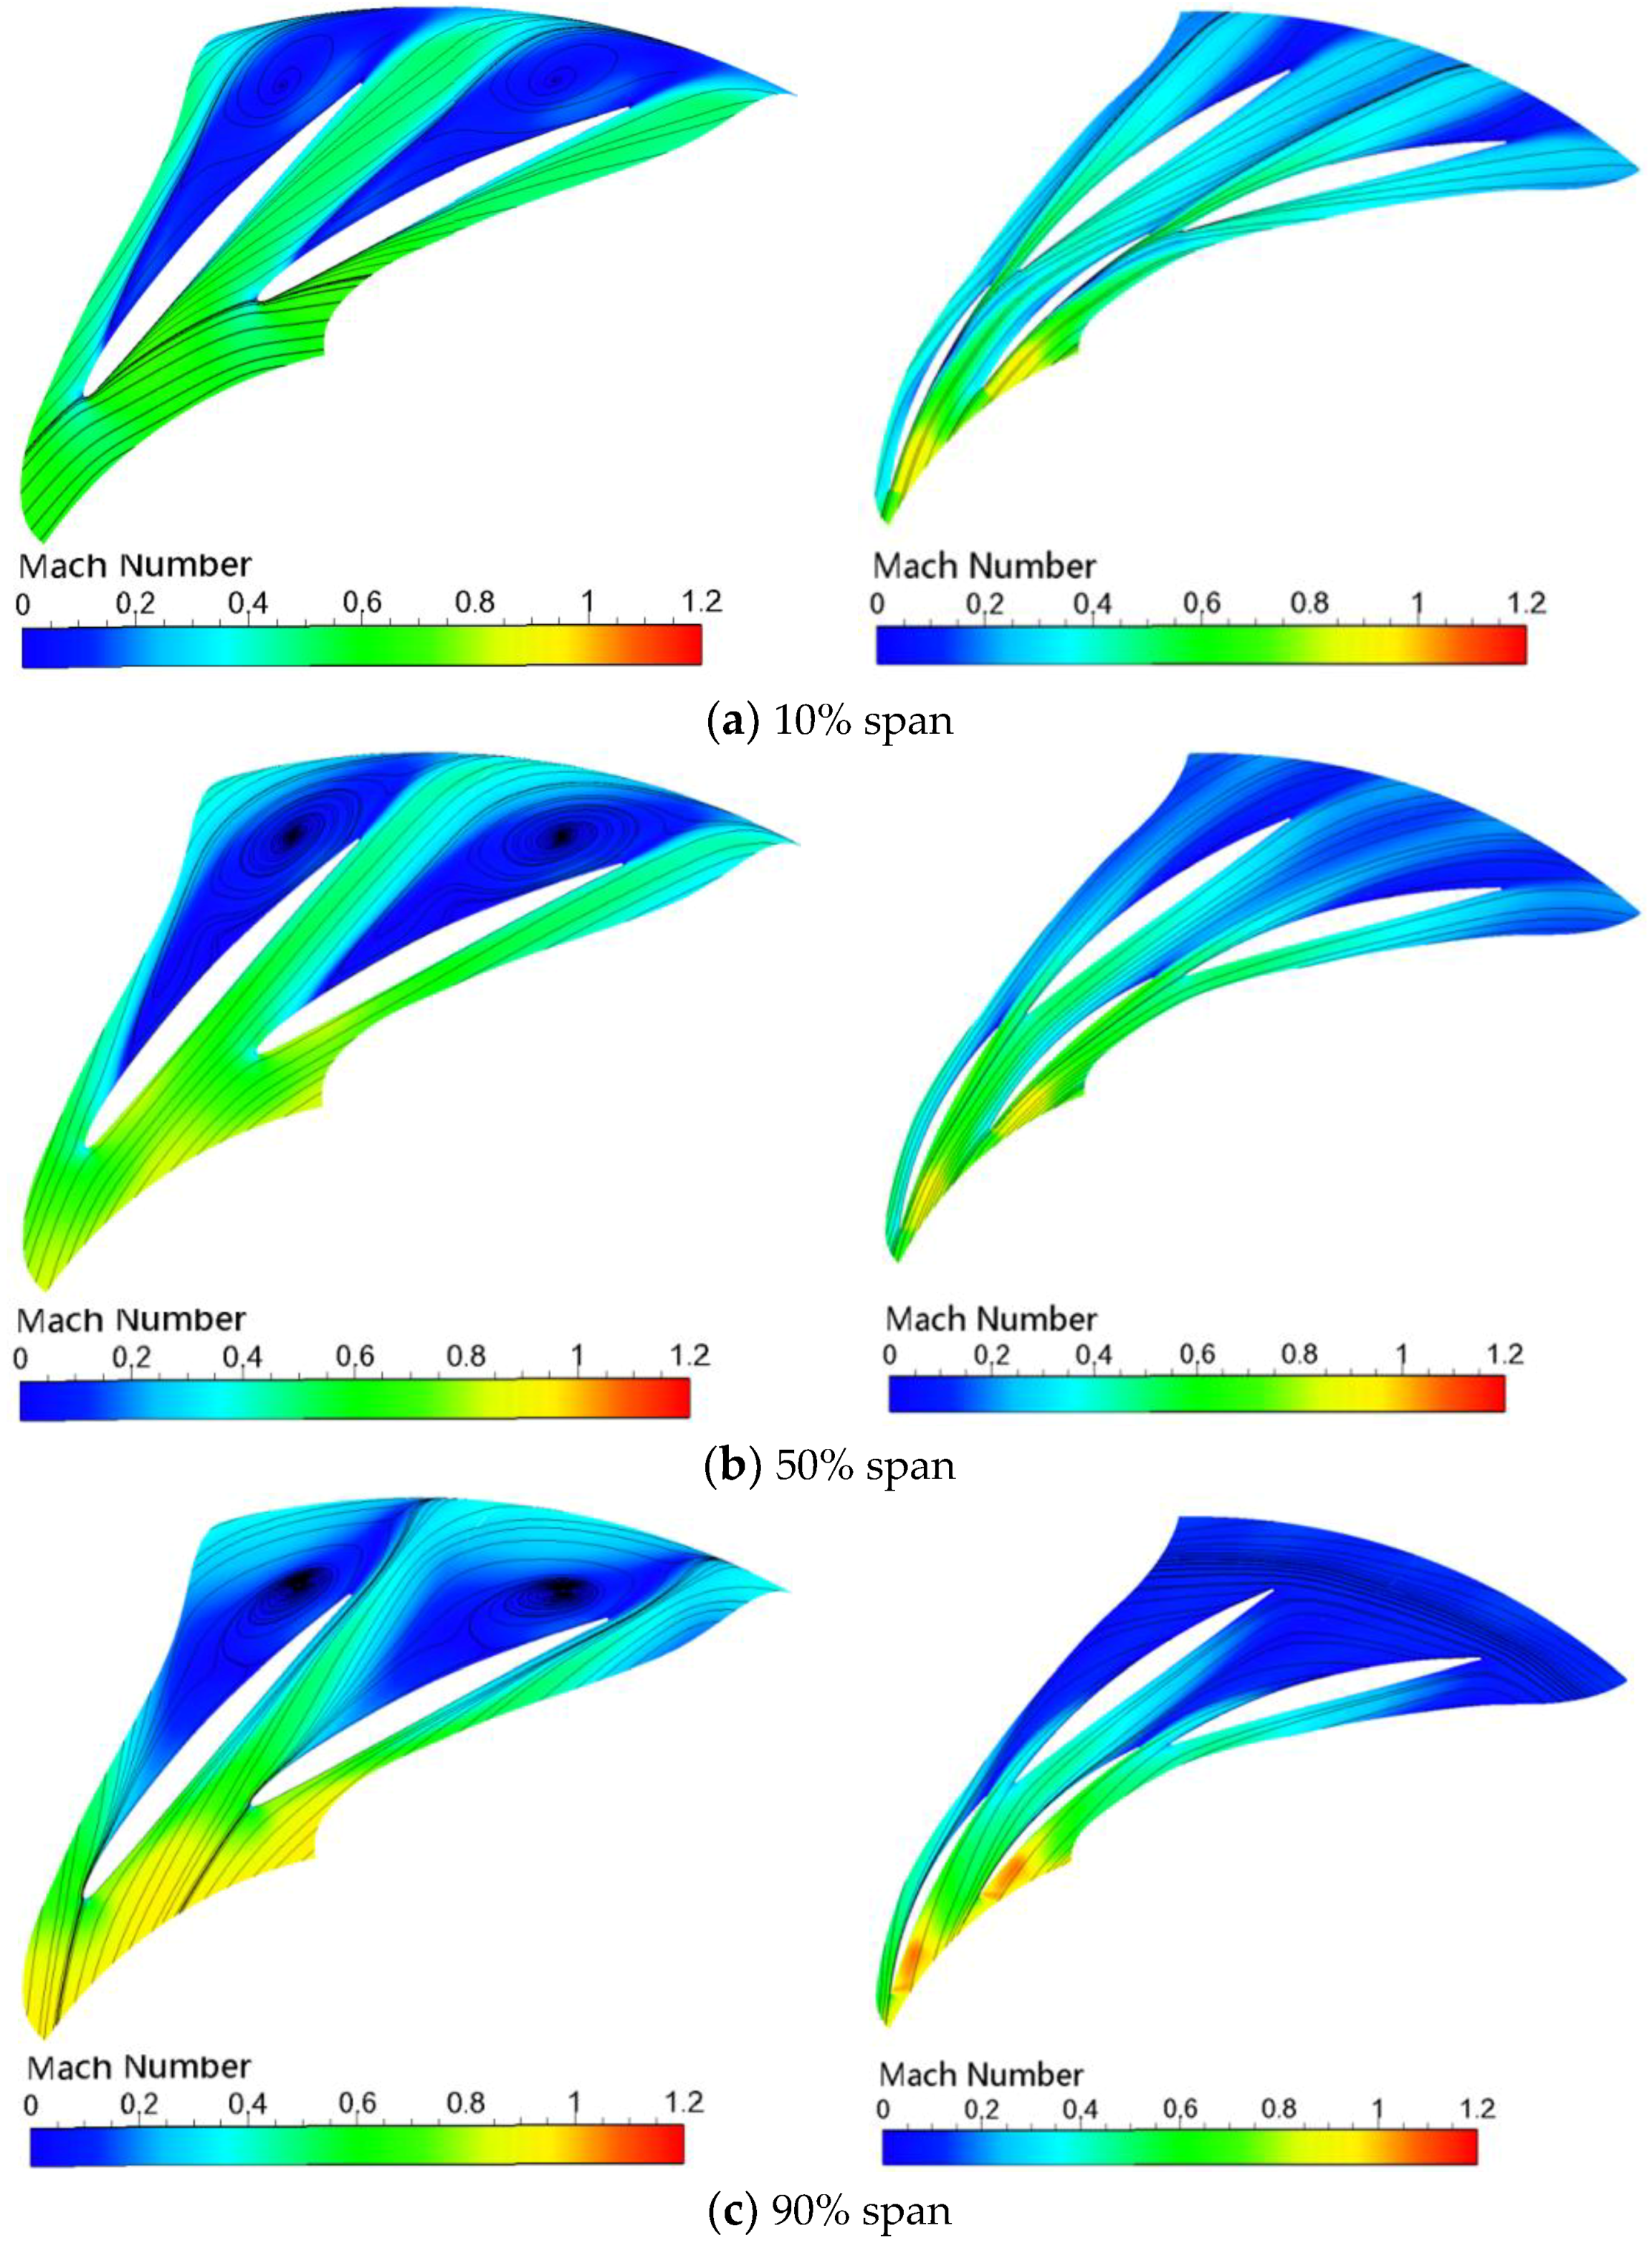
Figure 19.
Mach number distribution at different spans of the original and optimized designs of the high-pressure-stage centrifugal compressor at 90% load.
Figure 19.
Mach number distribution at different spans of the original and optimized designs of the high-pressure-stage centrifugal compressor at 90% load.

Figure 20.
Meridional streamline at 60% load.

Figure 21.
Mach number distribution at different spans of the original and optimized designs of the low-pressure-stage centrifugal compressor at 60% load.
Figure 21.
Mach number distribution at different spans of the original and optimized designs of the low-pressure-stage centrifugal compressor at 60% load.

Figure 22.
Mach number distribution at different spans of the original and optimized designs of the high-pressure-stage centrifugal compressor at 60% load.
Figure 22.
Mach number distribution at different spans of the original and optimized designs of the high-pressure-stage centrifugal compressor at 60% load.


Table 1.
Comparison of the parameters of the optimized and original designs.
| Parameter | Optimized Design | Original Design |
|---|---|---|
| D1s (m) | 0.075 | 0.082 |
| D1t (m) | 0.190 | 0.202 |
| D2 (m) | 0.326 | 0.326 |
| Lz (m) | 0.075 | 0.080 |
| b2 (m) | 0.0158 | 0.0151 |
| D3 (m) | 0.358 | 0.440 |
| D4 (m) | 0.601 | 0.601 |
| D3/D2 | 1.10 | 1.34 |
| η2 | 95.15% | 94.87% |
| η3 | 92.63% | 86.29% |
| η4 | 83.38% | 81.09% |
Table 2.
Ratio of design Ad*/Ai* to theoretical Ad*/Ai*.
| Original Design | Optimized Design 1 | Optimized Design 2 | |
|---|---|---|---|
| 1.161 | 0.922 | 1.043 |
Table 3.
Comparison of the parameters of the optimized and original designs.
| Parameter | Optimized Design | Original Design |
|---|---|---|
| D1s (m) | 0.071 | 0.073 |
| D1t (m) | 0.192 | 0.134 |
| D2 (m) | 0.252 | 0.252 |
| Lz (m) | 0.057 | 0.058 |
| b2 (m) | 0.0956 | 0.00948 |
| D3 (m) | 0.274 | 0.282 |
| D4 (m) | 0.392 | 0.388 |
| 1.09 | 1.12 | |
| 2θ | 11.9 | 15.7 |
| Z | 20 | 17 |
| η2 | 95.47% | 95.24% |
| η3 | 92.88% | 92.37% |
| η4 | 84.12% | 82.29% |
Table 4.
Ratio of design Ad*/Ai* to theoretical Ad*/Ai*.
| Original Design | Optimized Design 1 | Optimized Design 2 | |
|---|---|---|---|
| 1.09 | 0.948 | 1.037 |
Table 5.
Parameters of circular calculation.
| 100% Load | 90% Load | 60% Load | |
|---|---|---|---|
| Mass flow (kg/s) | 4.17 | 3.52 | 2.33 |
| Rotation speed of low-pressure stage (rpm) | 28,300 | 26,500 | 22,100 |
| Rotation speed of high-pressure stage (rpm) | 37,200 | 36,800 | 34,100 |
Table 6.
Computational fluid dynamics (CFD) calculation results of the MW-level gas turbine.
| 100% Load Original Design | Optimized Design | Relative Error | 90% Load Original Design | Optimized Design | Relative Error | 60% Load Original Design | Optimized Design | Relative Error | |
|---|---|---|---|---|---|---|---|---|---|
| Low-pressure stage pressure ratio | 4.24 | 4.41 | 4.01% | 3.64 | 3.83 | 5.22% | 2.58 | 2.64 | 2.33% |
| Low-pressure stage efficiency | 0.793 | 0.822 | 2.90% | 0.797 | 0.830 | 3.30% | 0.783 | 0.831 | 4.80% |
| High-pressure stage pressure ratio | 2.574 | 2.68 | 4.12% | 2.64 | 2.73 | 3.41% | 2.54 | 2.66 | 4.72% |
| High-pressure stage efficiency | 0.826 | 0.856 | 3.00% | 0.819 | 0.850 | 3.10% | 0.807 | 0.854 | 4.70% |
| Pressure ratio of the unit | 10.83 | 11.74 | 8.4% | 9.50 | 10.39 | 9.37% | 6.49 | 6.99 | 7.70% |
| Efficiency of the unit | 0.770 | 0.807 | 3.70% | 0.772 | 0.810 | 3.80% | 0.764 | 0.818 | 5.40% |
© 2018 by the authors. Licensee MDPI, Basel, Switzerland. This article is an open access article distributed under the terms and conditions of the Creative Commons Attribution (CC BY) license (http://creativecommons.org/licenses/by/4.0/).
Share and Cite
MDPI and ACS Style
Zhu, W.; Ren, X.-D.; Li, X.-S.; Gu, C.-W. Analysis and Improvement of a Two-Stage Centrifugal Compressor Used in an MW-Level Gas Turbine. Appl. Sci. 2018, 8, 1347. https://doi.org/10.3390/app8081347
AMA Style
Zhu W, Ren X-D, Li X-S, Gu C-W. Analysis and Improvement of a Two-Stage Centrifugal Compressor Used in an MW-Level Gas Turbine. Applied Sciences. 2018; 8(8):1347. https://doi.org/10.3390/app8081347
Chicago/Turabian StyleZhu, Wei, Xiao-Dong Ren, Xue-Song Li, and Chun-Wei Gu. 2018. "Analysis and Improvement of a Two-Stage Centrifugal Compressor Used in an MW-Level Gas Turbine" Applied Sciences 8, no. 8: 1347. https://doi.org/10.3390/app8081347
Note that from the first issue of 2016, this journal uses article numbers instead of page numbers. See further details here.