SiO2-SnO2:Er3+ Glass-Ceramic Monoliths
by
 ,
,
Lam Thi Ngoc Tran
1,2,3,*, 
Damiano Massella
1,4,
Lidia Zur
1,5,
Alessandro Chiasera
1,
Stefano Varas
1,
Cristina Armellini
1,
Giancarlo C. Righini
5,6 ,
,
Anna Lukowiak
7,
Daniele Zonta
1,2,8 and
Maurizio Ferrari
1,5,* 1
FBK Photonics Unit, IFN-CNR CSMFO Lab, Povo, 38123 Trento, Italy
2
Department of Civil, Environmental and Mechanical Engineering, University of Trento, Mesiano, 38123 Trento, Italy
3
Department of Applied Sciences, Ho Chi Minh City University of Technology and Education, Linh Chieu, Thu Duc, Ho Chi Minh City 720214, Vietnam
4
Department of Physics, University of Trento, Povo, 38123 Trento, Italy
5
Museo Storico della Fisica e Centro Studi e Ricerche “Enrico Fermi”, Piazza del Viminale 1, 00184 Roma, Italy
6
MiPLab, IFAC-CNR, 50019 Sesto Fiorentino, Italy
7
Institute of Low Temperature and Structure Research, PAS, 50422 Wroclaw, Poland
8
Department of Civil and Environmental Engineering, University of Strathclyde, Glasgow G1 1XJ, UK
*
Authors to whom correspondence should be addressed.
Appl. Sci. 2018, 8(8), 1335; https://doi.org/10.3390/app8081335
Submission received: 4 July 2018
/
Revised: 4 August 2018
/
Accepted: 6 August 2018
/
Published: 10 August 2018
(This article belongs to the Special Issue Rare-Earth Doping for Optical Applications)
Abstract
:Featured Application
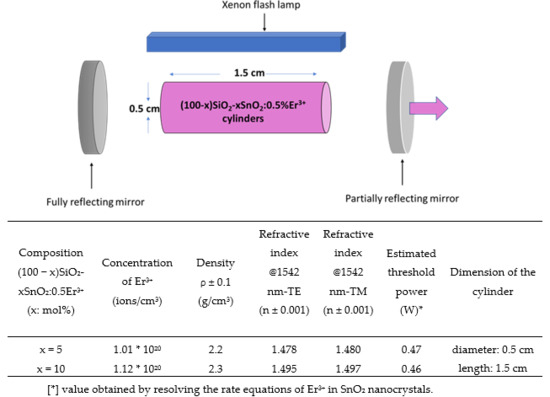
The goal of this work is to demonstrate: (1) a reliable fabrication protocol of monolithic SiO2-SnO2:Er3+ glass-ceramics and (2) the luminescence efficiency of this system. Based on these fundamental results, we are working on developing a proof of concept of a solid-state laser with lateral pumping as drawn below.
Abstract
The development of efficient luminescent systems, such as microcavities, solid-state lasers, integrated optical amplifiers, and optical sensors is the main topic in glass photonics. The building blocks of these systems are glass-ceramics activated by rare-earth ions because they exhibit specific morphologic, structural, and spectroscopic properties. Among various materials that could be used as nanocrystals to be imbedded in a silica matrix, tin dioxide presents some interesting peculiarities, e.g., the presence of tin dioxide nanocrystals allows an increase in both solubility and emission of rare-earth ions. Here, we focus our attention on Er3+—doped silica—tin dioxide photonic glass-ceramics fabricated by a sol-gel route. Although the SiO2-SnO2:Er3+ could be fabricated in different forms, such as thin films, monoliths, and planar waveguides, we herein limit ourselves to the monoliths. The effective role of tin dioxide as a luminescence sensitizer for Er3+ ions is confirmed by spectroscopic measurements and detailed fabrication protocols are discussed.
1. Introduction
Looking at the literature from the last few years, it is evident that glass-based rare-earth-activated optical structures represent the technological pillar of a huge of photonic applications covering health and biology, structural engineering, environment monitoring systems, and quantum technologies. Among different glass-based systems, a strategic place is assigned to transparent glass-ceramics and nanocomposite materials, which offer specific characteristics of capital importance in photonics [1,2,3]. These two-phase materials are constituted by nanocrystals or nanoparticles dispersed in a glassy matrix. The respective composition and volume fractions of crystalline and amorphous phase determine the properties of the glass-ceramics. The key to making the spectroscopic properties of the glass-ceramics very attractive for photonic applications is to activate the nanocrystals by using rare-earth ions as luminescent species [4]. From a spectroscopic point of view, the more appealing feature of glass-ceramic systems is that the presence of the crystalline environment for the rare-earth ions allows high absorption and emission cross sections, reduction of the non-radiative relaxation thanks to the lower phonon cut-off energy, and tailoring of the ion–ion interaction by the control of the rare-earth ion partition [5]. Here we focus on glass-ceramic photonic systems based on rare-earth activated SiO2-SnO2 monoliths produced by sol-gel route. Although the system has been investigated for several years, the research activity is still undergoing because of the need to develop reliable fabrication protocols and to control the ion–ion interaction [4,5,6]. Both these problems are highly detrimental for the efficiency of active devices [2,7,8,9]. Among the different materials that are successfully used as nanocrystals to be embedded in the silica matrix, tin dioxide presents specific interesting characteristics. Rare-earth-activated SnO2-based bulk glass ceramics have been extensively studied for improving luminescence efficiencies of several rare-earth ions by exciton mediated energy transfer from SnO2 nanocrystals to the rare-earth ion [6,10,11]. SnO2 is a wide-band gap semiconductor (Eg = 3.6 eV at 300 K) with a maximum phonon energy of 630 cm−1, exhibiting a broad window of transparency from visible to infrared covering a significant emission range of rare-earth ions [12].
Here we look for two significant outcomes: (i) a fabrication protocol of SiO2-SnO2:Er3+ glass-ceramic monoliths, and (ii) efficient Er3+ sensitizing by SnO2 nanocrystals pumping. We will present recent results concerning sol-gel fabrication of SiO2-SnO2:Er3+ glass-ceramic monoliths and their spectroscopic assessment for the development of luminescent systems such as solid-state lasers and active fibers.
2. Materials and Methods
2.1. Sample Preparation: Sol-Gel Derived Route
In this work, a sol-gel derived route was employed to synthesize the tin dioxide-based glass-ceramic monoliths. The monoliths were prepared following five consecutive stages: sol formation, gelation, aging, drying, and heat treatment. Since the final monoliths were obtained based on the phase transformation from gels to glasses, the first four stages played critical roles in assembling the gel skeleton, and it in turn defined a specific strategy for the heat treatment to obtain the glass-ceramics. Table 1 describes the synthesis recipe used for sol formation which is similar to the one reported elsewhere [13]. Briefly, the syntheses started by dissolving TEOS, SnCl2∙2H2O, and Er(NO3)3∙5H2O in ethanol separately, and then the solutions were mixed together. The solution of water and hydrochloric acid was poured drop by drop into the mixture. After that, the mixture was stirred for 1 h to form the resulting solution. This solution was transferred into the containers and sealed before being applied to any further treatment.
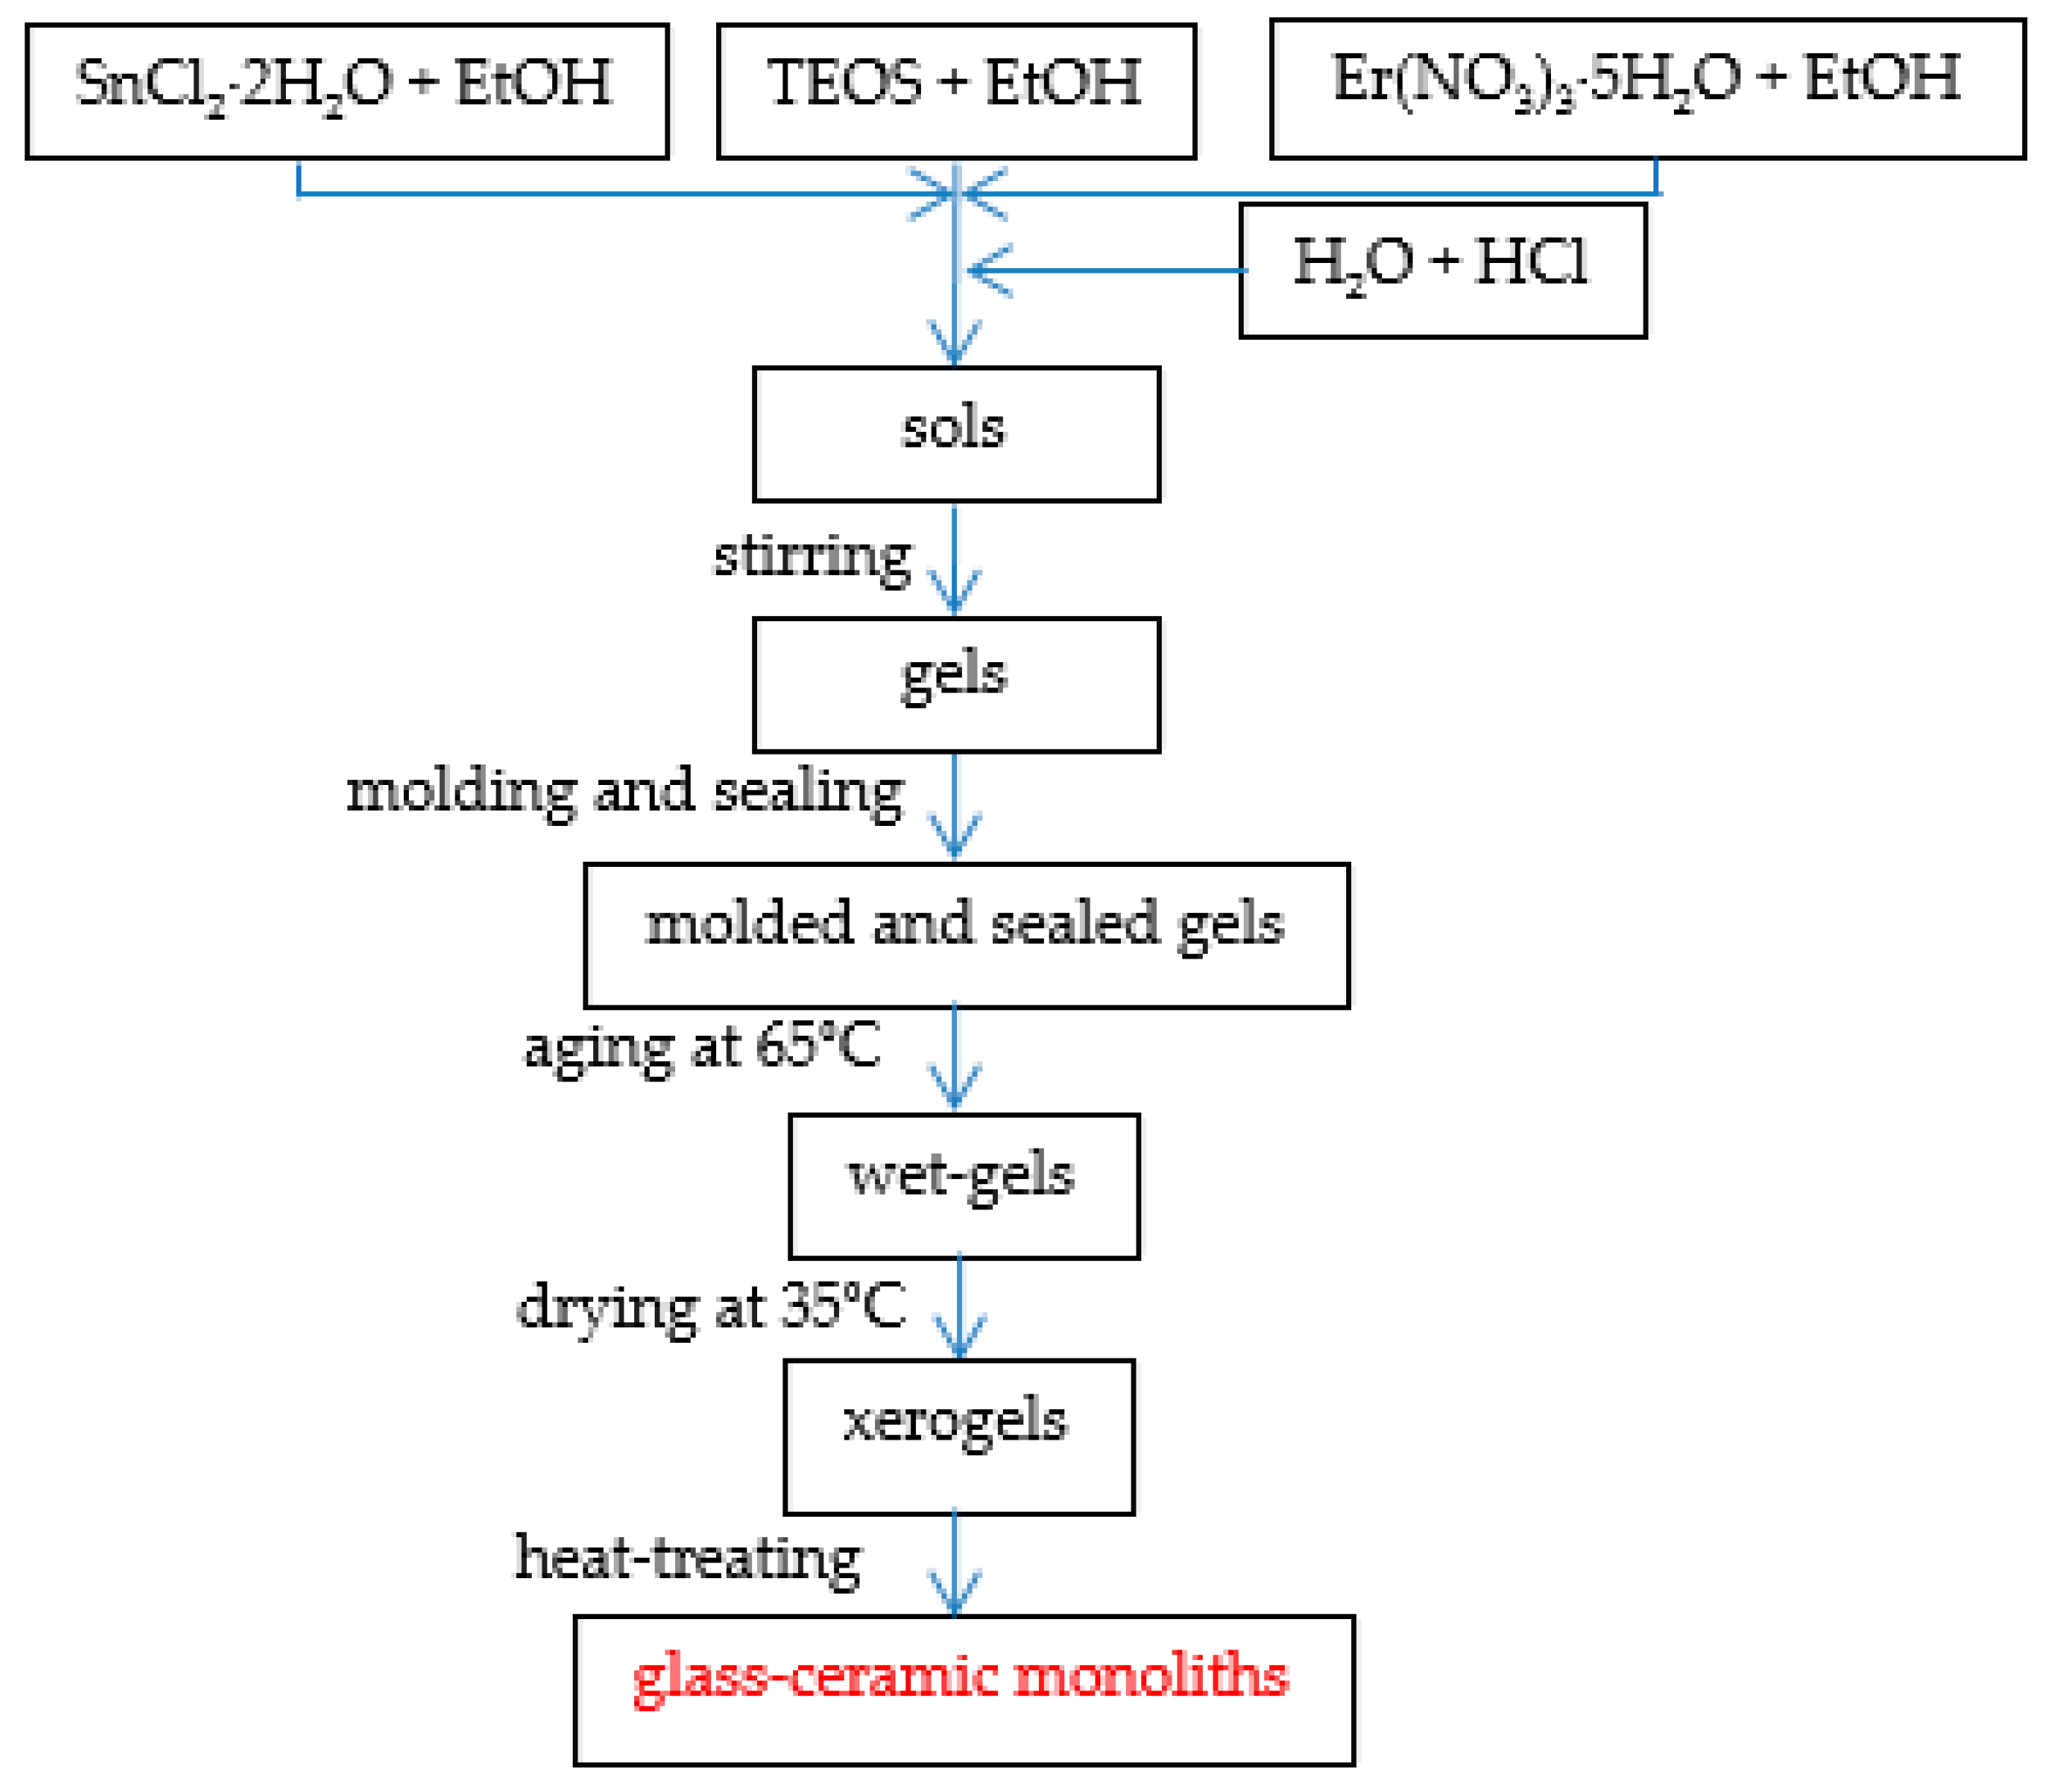
However, since our target was to increase the SnO2 content higher than 5 mol %, as in Reference [13], it was necessary to modify the condition of the next stages, i.e., gelation, aging, drying, and heat treatment. This change helped avoid any phase separation when the content of SnO2 was increased up to 10 mol %. The schematic synthesis procedure of 90SiO2-10SnO2:0.5Er3+ monoliths is shown in Figure 1.
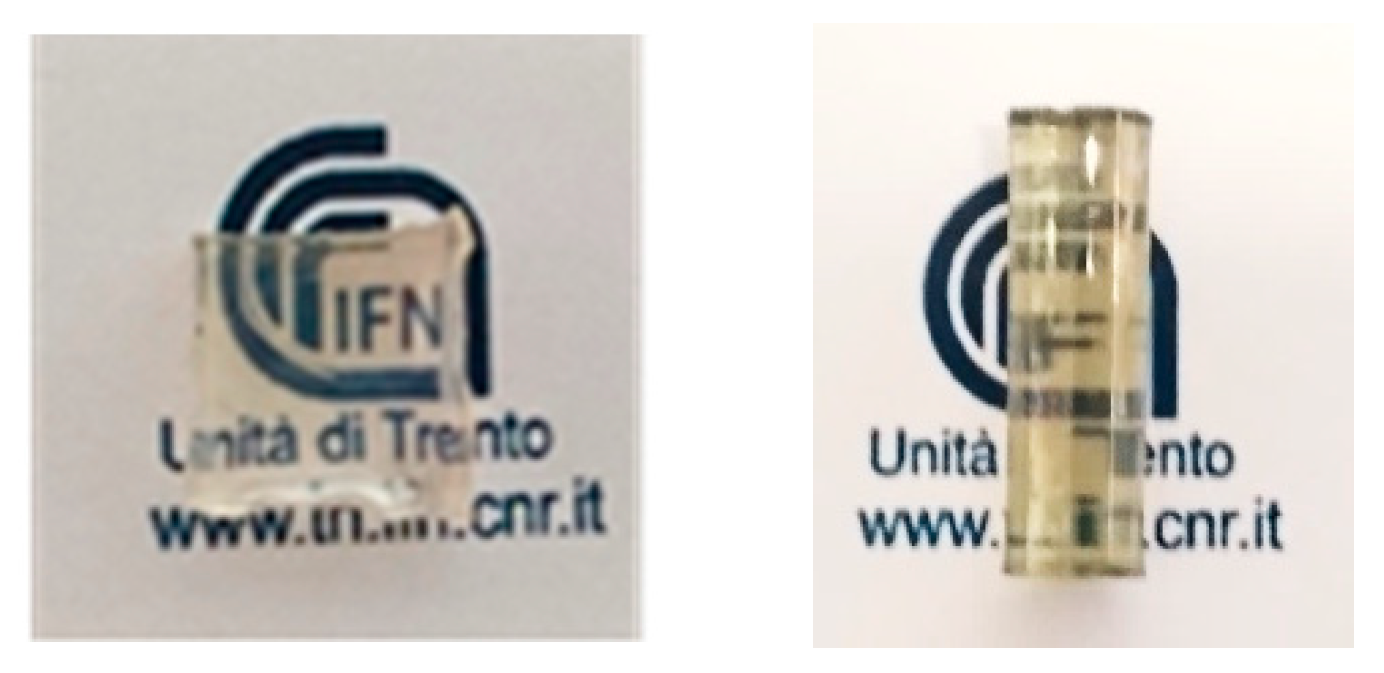
Figure 2 below shows the photos of two examples of the crack-free and transparent 90SiO2-10SnO2:0.5Er3+ monolithic square and cylinder after the heat treatment at 900 °C for 40 h.
2.2. Charaterization Methods
To check the effective role of tin dioxide as a luminescence sensitizer for Er3+ ions, the spectroscopic measurements based on different excitation sources were carried out on the 90SiO2-10SnO2:0.5Er3+ monolith that was heat treated at 900 °C for 40 h. By the use of Xenon lamp 450 W (Edison, NJ, USA) coupled to monochromator Horiba mod. microHR (Edison, NJ, USA), the 1500 nm emission spectra excited at different wavelengths and the excitation spectrum were performed. The excitation range was from 300nm to 750 nm with a 1 nm scanning step and a spectral resolution of 10 nm. The results proved the energy transfer from SnO2 to Er3+ and its effective role in this indirect excitation scheme in comparison with other direct ones. For the lifetime acquisition of the 4I13/2-4I15/2 Er3+ transition, the 514.5 nm coherent laser beam from the Ar+ laser Coherent mod. Innova-Sabre TSM 15 (Santa Clara, CA, USA) was then employed to perform the time-resolved 1500 nm florescence spectroscopy of the monolith. All of the luminescence signal was dispersed by a 320 mm single-grating monochromator with a resolution of 0.5 nm and 2 nm for the emission and excitation spectra, respectively, and was detected using a Hamamatsu photomultiplier tube (Shizuoka, Japan) and standard lock-in technique. Measurements were performed at room temperature.
3. Results
3.1. Emission Spectra
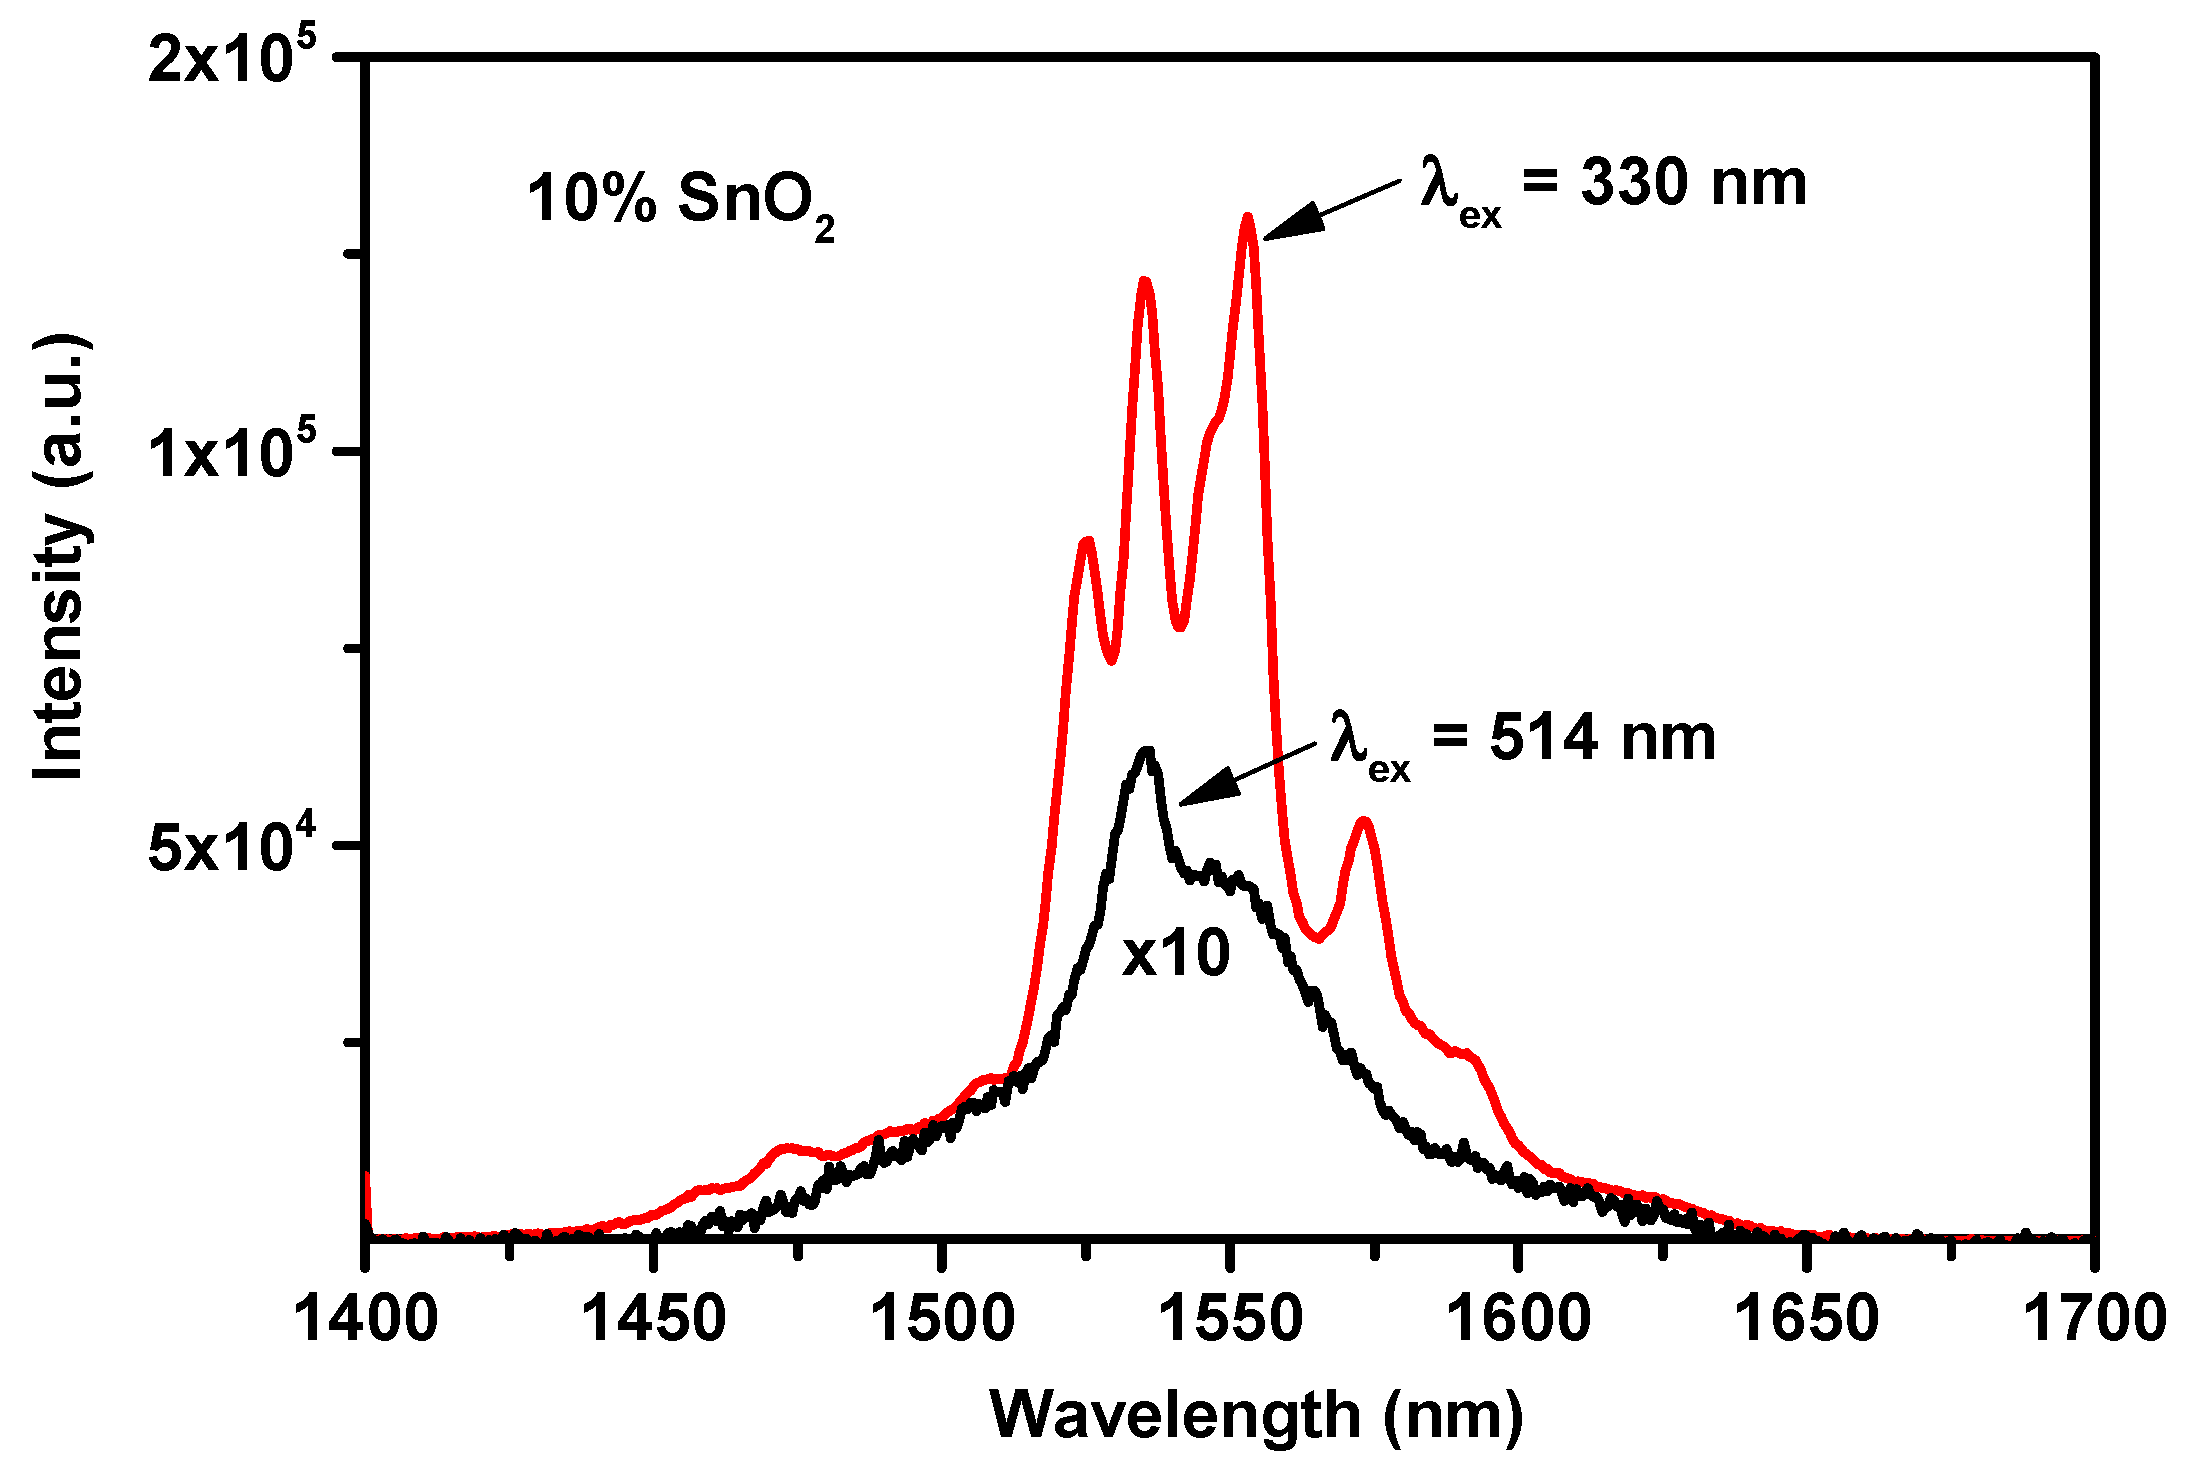
Figure 3 shows the photoluminescence spectra of the 90SiO2-10SnO2: 0.5Er3+ monolith acquired at 1500 nm using a Xenon lamp as an excitation source. Two different excitation schemes are presented in this figure. One is the indirect excitation, when the sample was excited at 330 nm, corresponding to the maximum of the absorption band of SnO2. The other at 514 nm is the direct excitation of Er3+ to the 2H11/2 excited state. The Stark splitting and the enhancement of the 4I13/2 → 4I15/2 emission of Er3+ ions upon 330 nm indirect excitation are clearly shown. On the contrary, the 514 nm excitation led to a broad and weaker emission band at 1500 nm typical of an Er3+ ion embedded in glass [14,15].
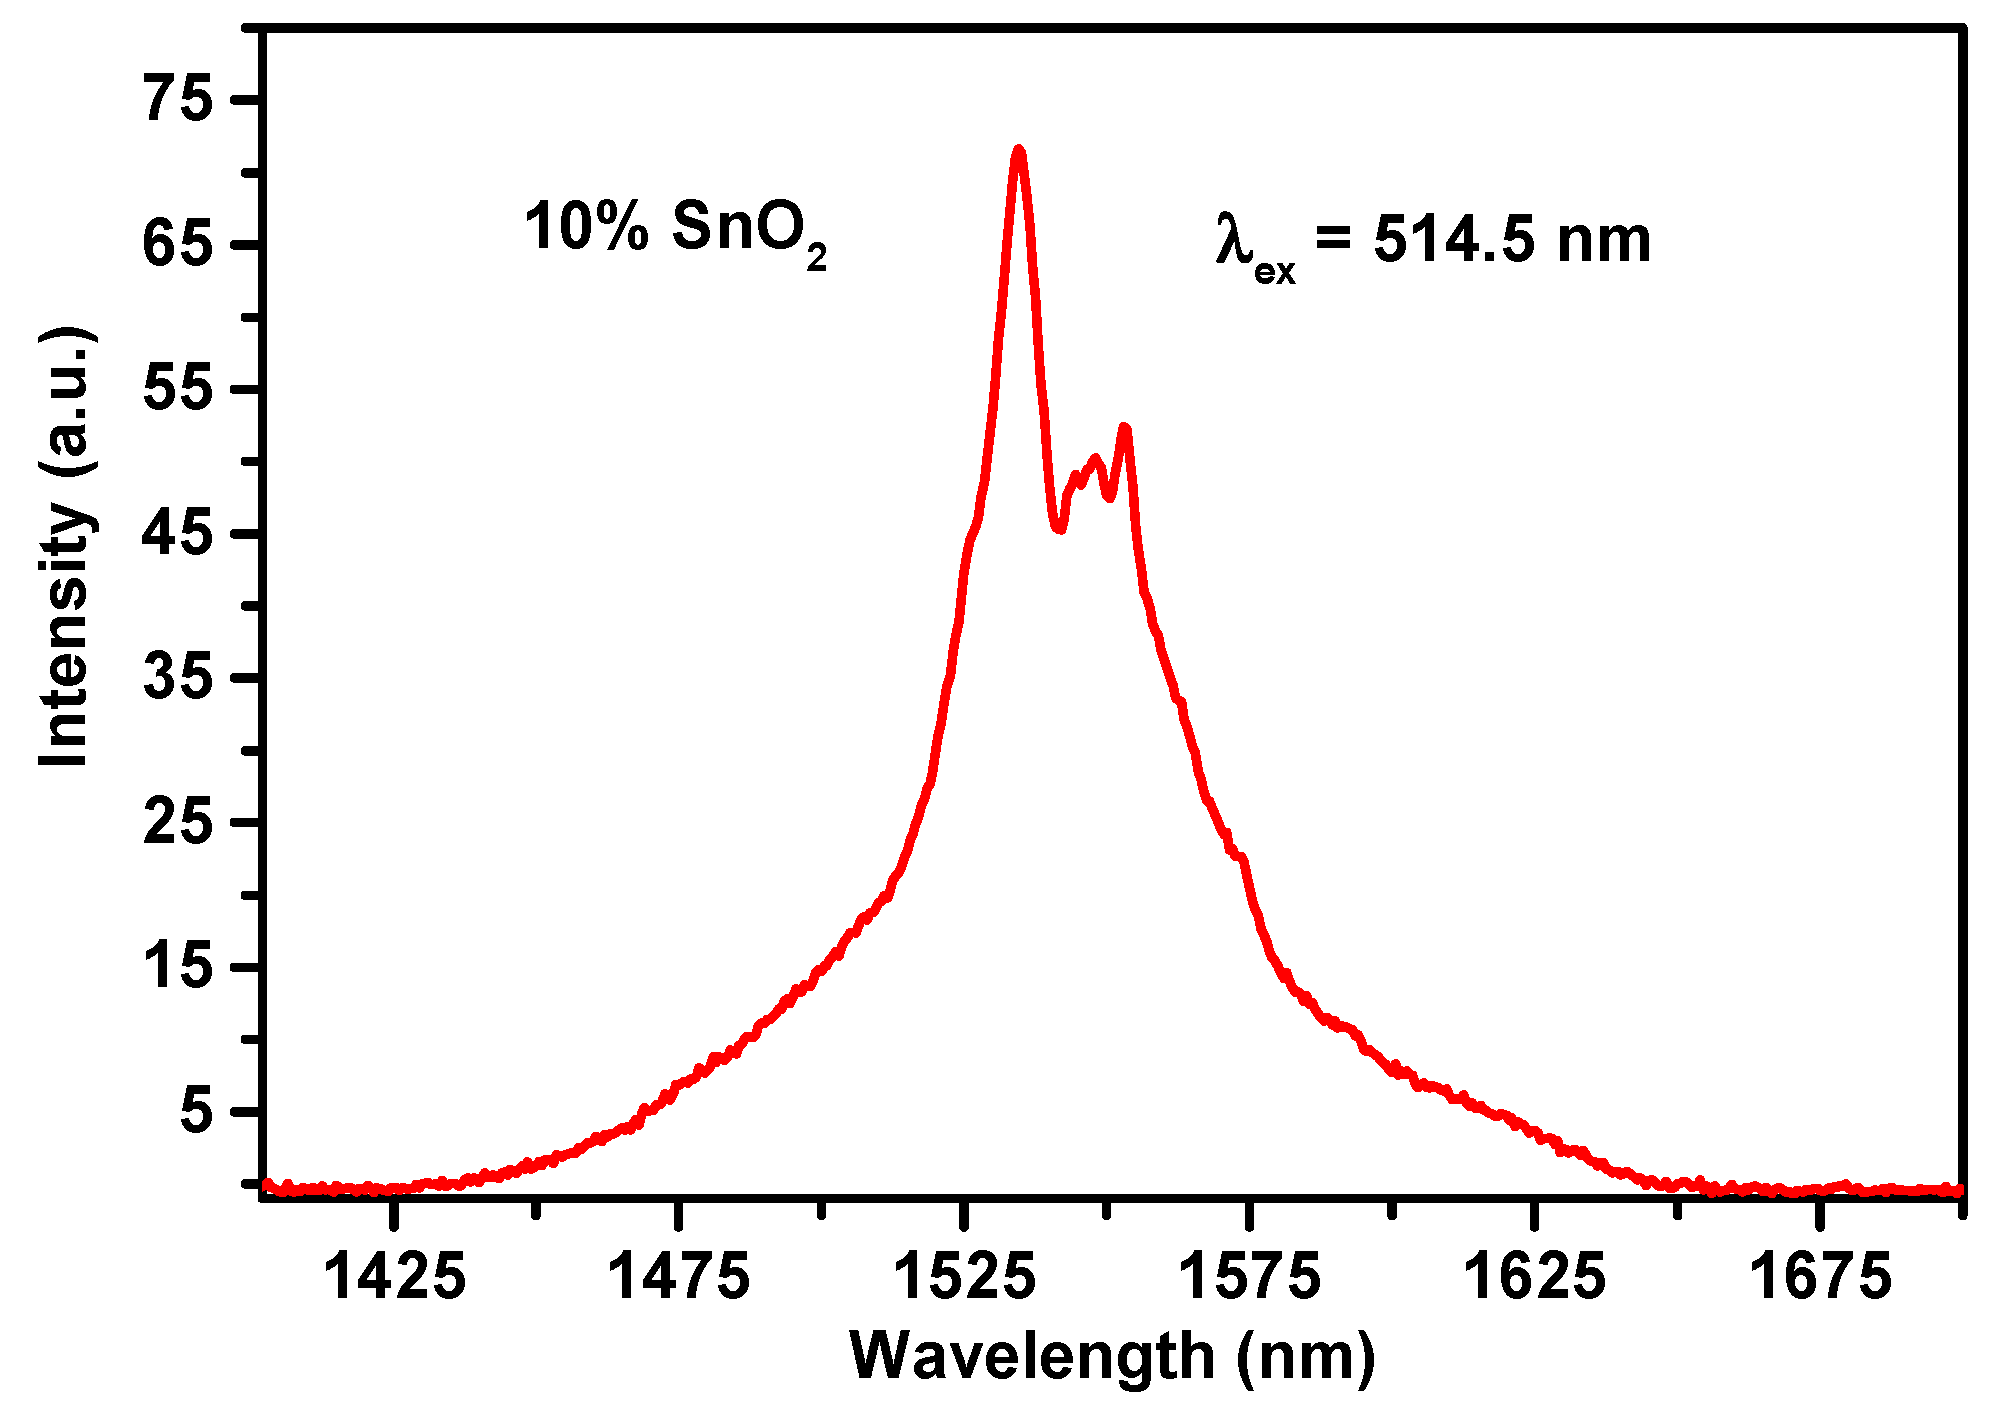
In Figure 4, the 1500 nm emission characteristics of the direct excitation was more evident under the coherent 514.5 nm laser beam excitation. The spectrum also revealed the Stark splitting, but it was less pronounced in comparison with the emission spectrum obtained upon 330 nm excitation (Figure 3).
3.2. Excitation Spectra
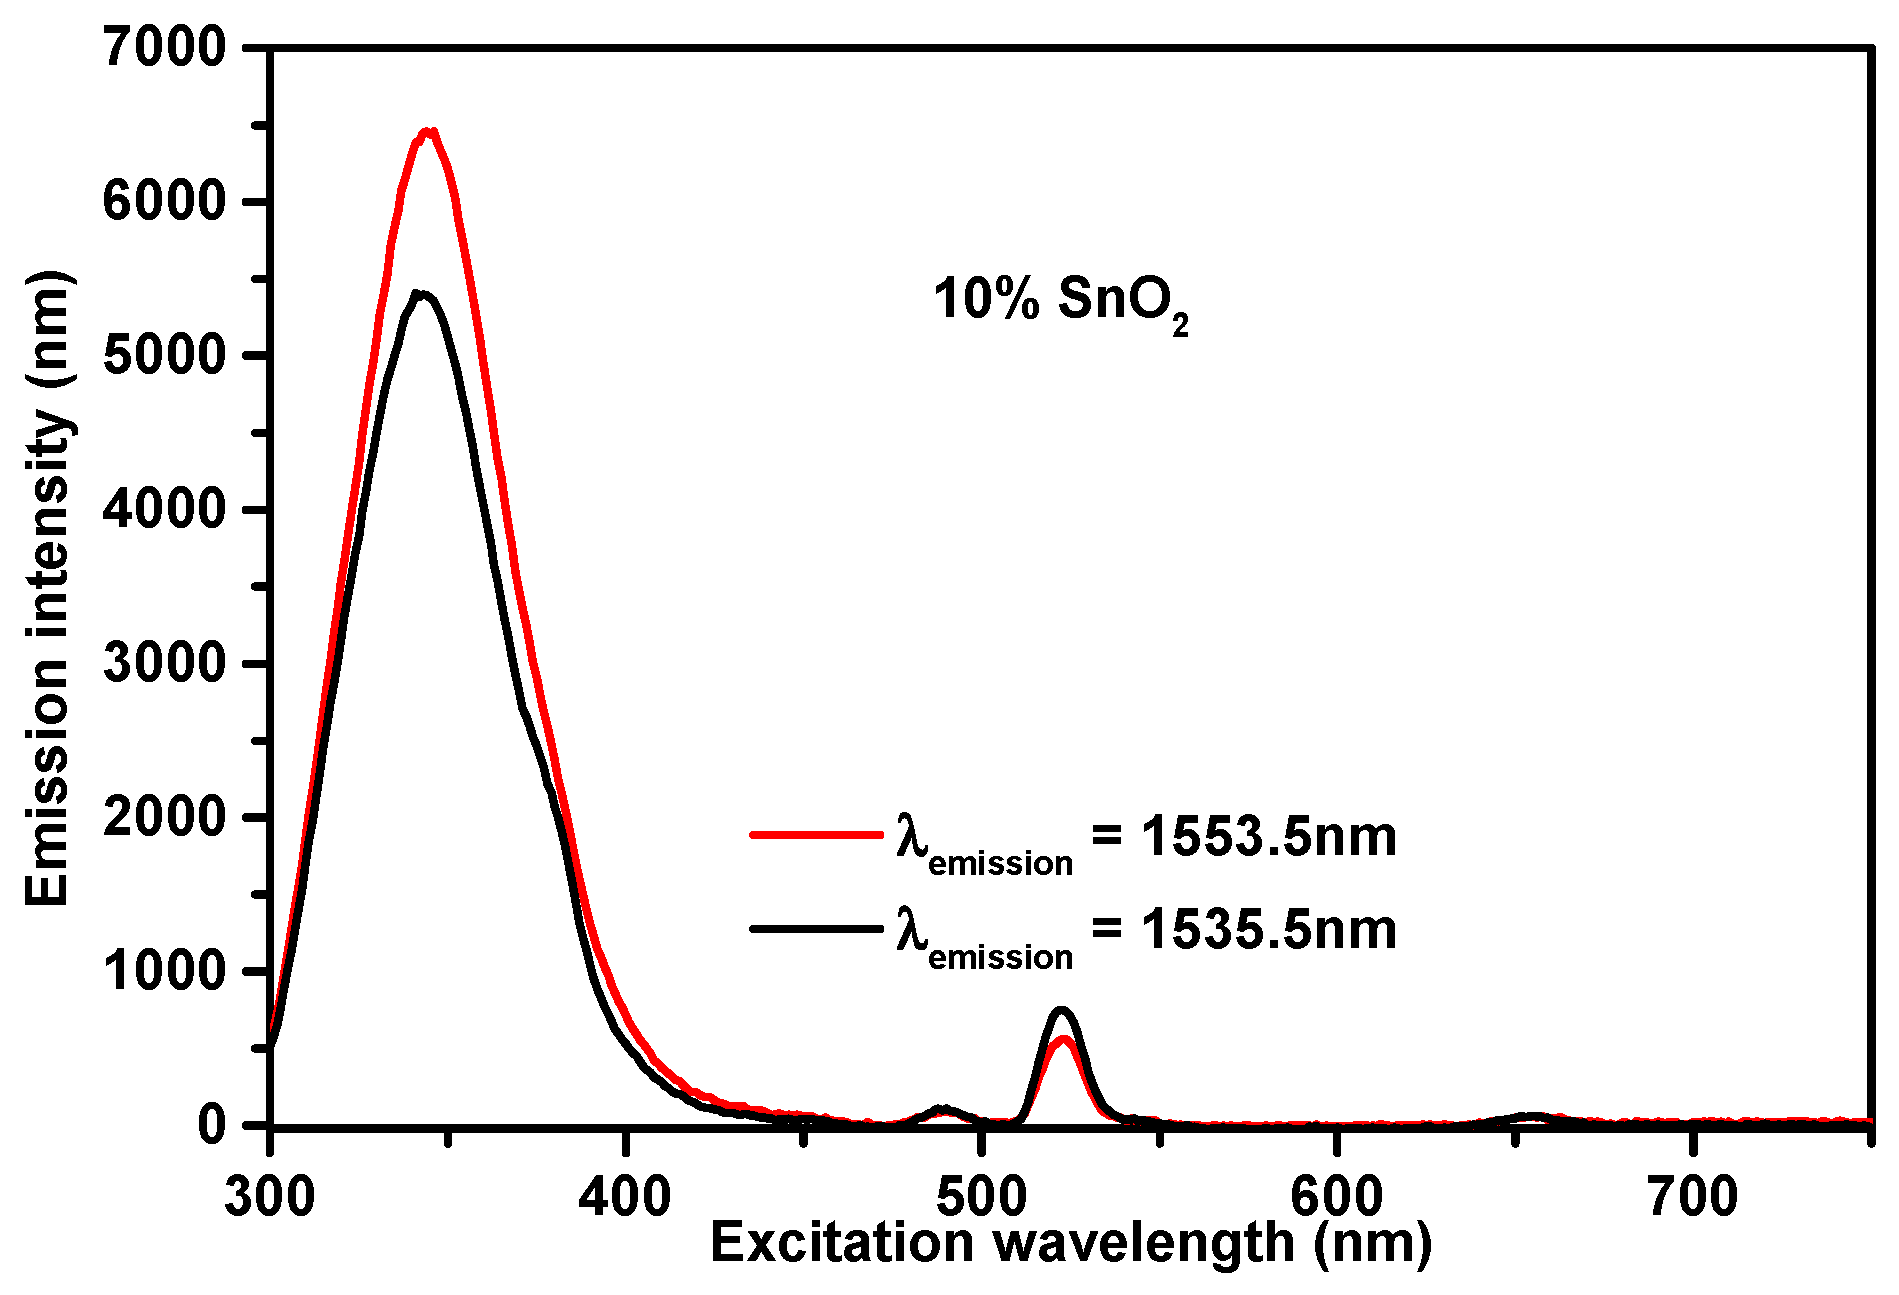
Figure 5 shows the excitation spectra obtained by recording the luminescence signal at 1553.5 nm and 1535.5 nm, respectively. The emission peak at 1535.5 nm is the fingerprint of the 4I13/2 → 4I15/2 transition in silica, i.e., in an amorphous environment, as shown in Figure 3 (black line) and Figure 4 [15]. The detection at 1553.5 nm mainly concerns the Er3+ ion in a crystalline environment, as shown by the red curve in Figure 3 [13,16]. From Figure 5, it is evident that for both the detection wavelengths the more intense emission from the Er3+ metastable state 4I13/2 was achieved by indirect pumping, i.e., by excitation at 330 nm in the SnO2 band gap. The direct excitation in the Er3+ electronic states at 489 nm, 520 nm, and 655 nm resulted in an extremely lower emission intensity, confirming the results presented in Figure 3.
3.3. Lifetime
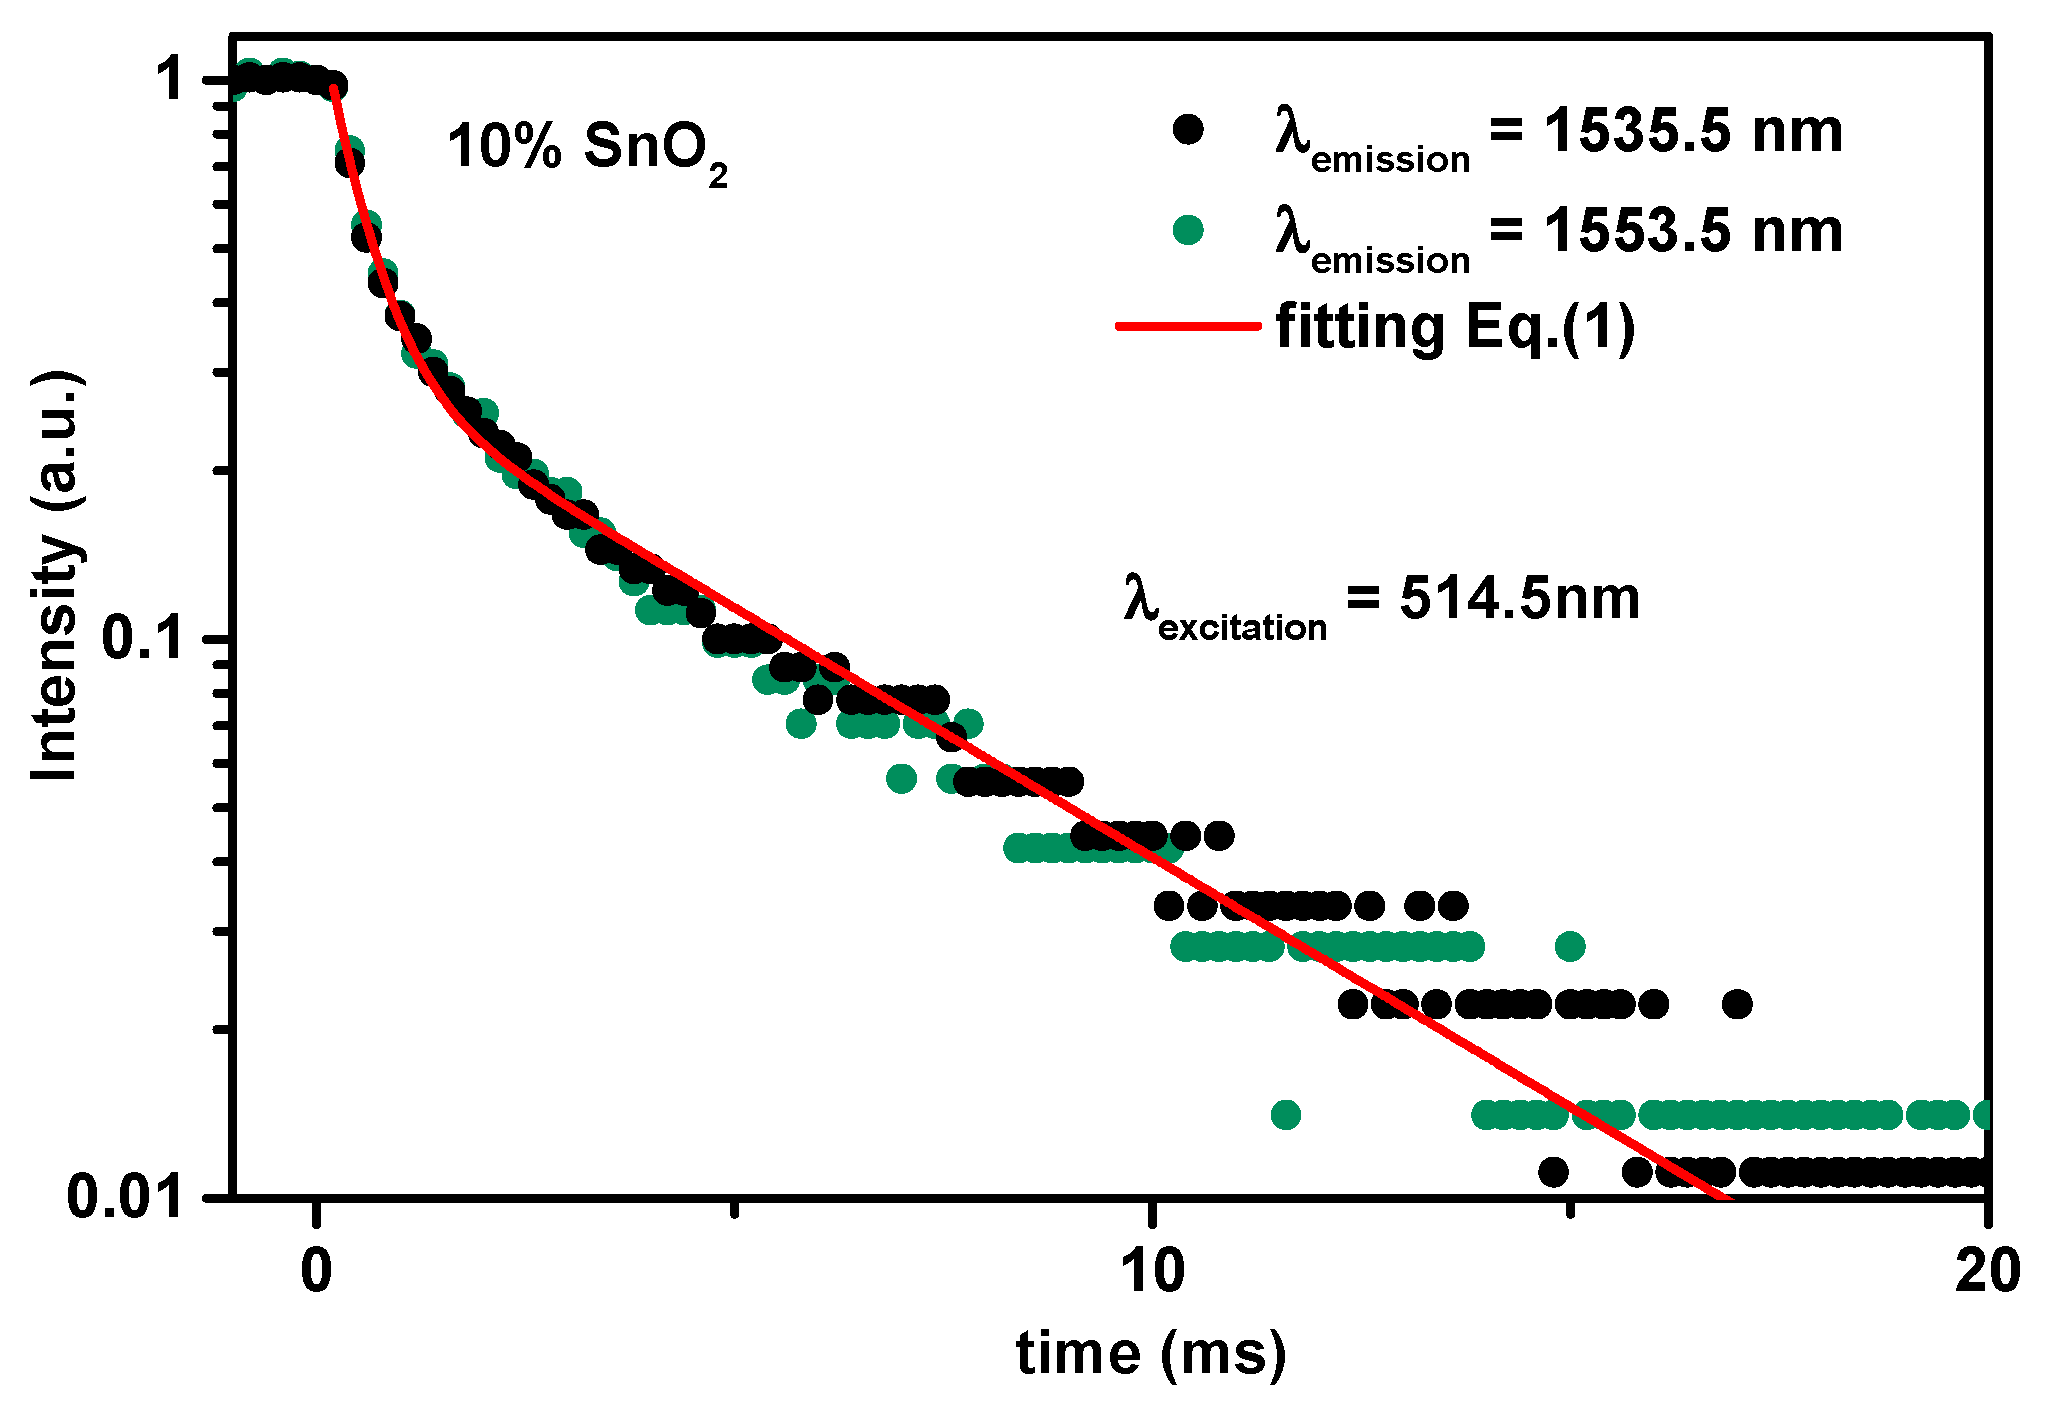
Figure 6 shows the decay curves of the luminescence of the 4I13/2 metastable state of Er3+ recorded at both wavelengths 1535.5 nm and 1553.5 nm, acquired using the 514.5 nm Ar+ laser beam. Considering the 1/e decay time, the two curves exhibit the same value: τ1/e = 1.2 ms. This is not surprising because the direct excitation of the 2H11/2 level of the Er3+ ions involved both the ions embedded in SnO2 suffering different local crystalline fields and those in the silica matrix, also discussed by Joaquín Fernández et al. [17].
The decay curves do not exhibit a single exponential profile but instead they can be described as a sum of two exponentials:
Table 2 summarizes the obtained values of A1, τ1, A2, and τ2. In addition, in this table, the ratio of the numbers N1 and N2 of the ions that decay with the lifetime τ1 and τ2 respectively are also listed following the approximation of the number of the total ions:
4. Discussion
Under the indirect 330 nm excitation, which is associated to the SnO2 band-gap, the 4I13/2 → 4I15/2 emission spectrum exhibits Stark splitting and narrow peaks (see Figure 3). This aspect revealed two important points: (i) the location of Er3+ in the crystalline environment, i.e., SnO2 nanocrystals [13,16,18,19], and (ii) the energy transfer from SnO2 to the rare earth ions. The 1500 nm broad band emission acquired by directly exciting Er3+ ions using the 514 nm emission of the Xenon lamp disclosed the location of Er3+ in a disordered environment. Although the intensity-based analysis can suffer variations from the experimental factors, e.g. light sources, detectors, and refractive indices, the difference in the integrated intensity of Er3+ emission band centered at 1500 nm in the case of the two excitation schemes was evident. The emission intensity was higher for the 330 nm excitation with respect to that recorded in the case of the 514 nm excitation. The more intense emission of Er3+ upon excitation at 330 nm proved the efficient role of SnO2 as a luminescence sensitizer for the rare earth ions. A similar effect was demonstrated in the case of silica-tin oxides waveguides activated by Eu3+ ions [4] and Er3+ ions [10].
4I13/2 → 4I15/2 photoluminescence spectrum obtained upon direct excitation of the 2H11/2 level of the Er3+ ions is shown in Figure 4. The large emission bandwidth, together with less pronounced Stark splittings, are observed. This shows the presence of Er3+ ions in an amorphous environment.
The excitation spectra in Figure 5 clearly show that the dominant contribution to both 1553.5 nm and 1535.5 nm emission was due to energy transfer from the SnO2 nanocrystals to the imbedded Er3+ ions, i.e., the indirect excitation scheme. The weak bands observed at 489 nm, 520 nm, and 655 nm are due to direct excitation of Er3+ electronic states. These results again confirm that SnO2 were efficient sensitizers of Er3+ luminescence.
To assess some parameters that will be useful for the modelling of a possible laser, the lifetimes and the corresponding fractions of the ions in the 4I13/2 metastable state were determined. The decay curve of Figure 6 is similar to the ones already observed in the (100 − x)SiO2-xTiO2-1Er2O3 glass-ceramic system in Reference [20]. The results listed in Table 2 show that about 75% of the Er3+ ions in the 4I13/2 state had an exponential decay of about 4.9 ms. Considering that the lifetime of the metastable state of Er3+ in SnO2 crystals is in the order of 6 ms [21], is reasonable to assume that the majority of the Er3+ ions were imbedded in the SnO2 crystals [22]. The short decay component of 0.5 ms could be assigned to the ion–ion interaction energy transfer or Er-OH centers. As recently discussed by Joaquín Fernández et al. [17], the spectral response of the Er3+ in SnO2 is highly complex and more site-selective spectroscopic measurements are mandatory to accurately define the more suitable pumping schema for a solid-state laser based on the system presented here. It could be that, following the paper already mentioned, besides well-defined narrow band crystalline-like emission, corresponding to substitutional sites, broader band emission is also present, which suggests the presence of a wide variety of crystal fields at the Er3+ sites of SnO2 [17]. In any case, this could be useful for the laser system increasing the number of ions available for the population inversion.
5. Conclusions
A viable sol-gel based fabrication protocol for the SiO2-SnO2:Er3+ glass-ceramic monoliths has been demonstrated. Based on different spectroscopic characterizations, the effective luminescence sensitizer role of SnO2 for Er3+ has been assessed. The emission and excitation spectra showed the luminescence effectiveness of the energy transfer from SnO2 to Er3+ in comparison with the direct excitation of Er3+ ions. About 75% of the Er3+ ions were imbedded in the SnO2 nanocrystals.
Finally, a SiO2-SnO2:Er3+ glass-ceramic is surely a fantastic host for rare earth ions and it appears that a pumping schema resonant with the SnO2 energy gap absorption band could be of some interest in developing solid-state lasers.
Author Contributions
L.T.N.T., M.F., D.Z., and A.L. conceived and designed the experiments; L.T.N.T., D.M., A.C., S.V., and C.A. performed the experiments; D.M., L.T.N.T., and L.Z. analyzed the data; L.T.N.T., M.F., D.Z., A.L., D.M., L.Z., and G.C.R. wrote and revised the paper.
Funding
The research activity is performed in the framework of COST Action MP1401 Advanced fiber laser and coherent source as tools for society, manufacturing, and lifescience (2014–2018) and Centro Fermi MiFo (2017–2020) project. L.T.N. Tran acknowledges the Vietnamese Ministry of Education and Training for her PhD scholarship.
Conflicts of Interest
The authors declare no conflicts of interest.
References
- Zanotto, E.D. A bright future for glass-ceramics. Am. Ceram. Soc. Bull. 2010, 89, 19–27. [Google Scholar]
- De Pablos-Martin, A.; Ferrari, M.; Pascual, M.J.; Righini, G.C. Glass-ceramics: A class of nanostructured materials for photonics. Riv. Del Nuovo Cimento 2015, 28, 311–369. [Google Scholar]
- Ferrari, M.; Righini, G.C. Glass-Ceramic Materials for Guided-Wave Optics. Int. J. Appl. Glass Sci. 2015, 6, 240–248. [Google Scholar] [CrossRef]
- Zur, L.; Tran, L.T.N.; Meneghetti, M.; Varas, S.; Armellini, C.; Ristic, D.; Chiasera, A.; Scotognella, F.; Pelli, S.; Nunzi Conti, G.; et al. Glass and glass-ceramic photonic systems. In Proceedings of the Integrated Optics: Devices, Materials, and Technologies XXI, San Francisco, CA, USA, 30 January–1 February 2017; pp. 1–12. [Google Scholar]
- Cascales, C.; Balda, R.; Lezama, L.; Fernández, J. Site symmetry and host sensitization-dependence of Eu3+ real time luminescence in tin dioxide nanoparticles. Opt. Express 2018, 26, 16155–16170. [Google Scholar] [CrossRef]
- Zur, L.; Thi, L.; Tran, N.; Meneghetti, M. Sol-gel derived SnO2-based photonic systems. In Handbook of Sol-Gel Science and Technology, 2nd ed.; Klein, L., Aparicio, M., Jitianu, A., Eds.; Springer International Publishing AG: Basel, Switzerland, 2017; pp. 1–19. [Google Scholar]
- Gorni, G.; Velázquez, J.J.; Mosa, J.; Balda, R.; Fernández, J.; Durán, A.; Castro, Y. Transparent glass-ceramics produced by Sol-Gel: A suitable alternative for photonic materials. Materials 2018, 11, 212. [Google Scholar] [CrossRef] [PubMed]
- Dymshits, O.; Shepilov, M.; Zhilin, A. Transparent glass-ceramics for optical applications. MRS Bull. 2017, 42, 200–205. [Google Scholar] [CrossRef]
- Gonçalves, M.C.; Santos, L.F.; Almeida, R.M. Rare-earth-doped transparent glass ceramics. Comptes Rendus Chime 2002, 5, 845–854. [Google Scholar] [CrossRef]
- Zur, L.; Tran, L.T.N.; Meneghetti, M.; Tran, V.T.T.; Lukowiak, A.; Chiasera, A.; Zonta, D.; Ferrari, M.; Righini, G.C. Tin-dioxide nanocrystals as Er3+ luminescence sensitizers: Formation of glass-ceramic thin films and their characterization. Opt. Mater. 2017, 63, 95–100. [Google Scholar] [CrossRef]
- Chiodini, N.; Paleari, A.; Brambilla, G.; Taylor, E.R. Erbium doped nanostructured tin-silicate glass-ceramic composites. Appl. Phys. Lett. 2002, 80, 4449–4451. [Google Scholar] [CrossRef]
- Saadeddin, I.; Pecquenard, B.; Manaud, J.P.; Decourt, R.; Labrugère, C.; Buffeteau, T.; Campet, G. Synthesis and characterization of single-and co-doped SnO2 thin films for optoelectronic applications. Appl. Surf. Sci. 2007, 253, 5240–5249. [Google Scholar] [CrossRef]
- Tran, L.T.N.; Zur, L.; Massella, D.; Derkowska-Zielinska, B.; Chiasera, A.; Varas, S.; Armellini, C.; Martucci, A.; Zonta, D.; Tran, T.T.V.; et al. SiO2-SnO2:Er3+ transparent glass-ceramics: fabrication and photonic assessment. In Proceedings of the Fiber Lasers Glass Photonics: Materials through Applications, Strasbourg, France, 22–26 April 2018; pp. 1–10. [Google Scholar]
- Righini, G.C.; Ferrari, M. Photoluminescence of rare-earth-doped glasses. Riv. Del Nuovo Cimento 2005, 28, 1–53. [Google Scholar]
- Duverger, C.; Montagna, M.; Rolli, R.; Ronchin, S.; Zampedri, L.; Fossi, M.; Pelli, S.; Righini, G.G.; Monteil, A.; Armellini, C.; et al. Erbium-activated silica xerogels: Spectroscopic and optical properties. J. Non-Cryst. Solids 2001, 280, 261–268. [Google Scholar] [CrossRef]
- Van, T.T.T.; Turrell, S.; Capoen, B.; Vinh, L.Q.; Cristini-Robbe, O.; Bouazaoui, M.; d’Acapito, F.; Ferrari, M.; Ristic, D.; Lukowiak, A.; et al. Erbium-Doped Tin-Silicate Sol-gel-derived glass-ceramic thin films: Effect of environment segregation on the Er3+ emission. Sci. Adv. Mater. 2015, 7, 301–308. [Google Scholar] [CrossRef]
- Fernández, J.; García-Revilla, S.; Balda, R.; Cascales, C. Rare-earth-doped wide-bandgap tin-oxide nanocrystals: Pumping mechanisms and spectroscopy. In Proceedings of the Optical Components and Materials XV, San Francisco, CA, USA, 30 January–1 February 2018; pp. 1–9. [Google Scholar]
- Tran, T.T.V.; Bui, T.S.; Turrell, S.; Capoen, B.; Roussel, P.; Bouazaoui, M.; Ferrari, M.; Cristini, O.; Kinowski, C. Controlled SnO2 nanocrystal growth in SiO2-SnO2 glass-ceramic monoliths. J. Raman Spectrosc. 2012, 43, 869–875. [Google Scholar] [CrossRef]
- Van, T.T.T.; Turrell, S.; Capoen, B.; Hieu, L.V.; Ferrari, M.; Ristic, D.; Boussekey, L.; Kinowski, C. Environment segregation of Er3+ emission in bulk sol–gel-derived SiO2–SnO2 glass ceramics. J. Mater. Sci. 2014, 49, 8226–8233. [Google Scholar] [CrossRef]
- Zampedri, L.; Ferrari, M.; Armellini, C.; Visintainer, F.; Tosello, C.; Ronchin, S.; Rolli, R.; Montagna, M.; Chiasera, A.; Pelli, S.; et al. Gonçalves, Erbium-activated silica-titania planar waveguides. J. Sol-Gel Sci. Technol. 2003, 26, 1033–1036. [Google Scholar] [CrossRef]
- Bouzidi, C.; Moadhen, A.; Elhouichet, H.; Oueslati, M. Er3+-doped sol-gel SnO2 for optical laser and amplifier applications. Appl. Phys. B 2008, 90, 465–469. [Google Scholar] [CrossRef]
- Chiasera, A.; Alombert-Goget, G.; Ferrari, M.; Berneschi, S.; Pelli, S.; Boulard, B.; Arfuso, C.D. Rare earth–activated glass-ceramic in planar format. Opt. Eng. 2011, 50, 1–10. [Google Scholar] [CrossRef]
Figure 1.
The flow-chart illustrating the synthesis procedure of 90SiO2-10SnO2:0.5Er3+ monoliths.

Figure 2.
Photo of the as-prepared 90SiO2-10SnO2:0.5Er3+ monolithic square with size of 1 × 1 cm2 and thickness of ≈0.3 cm and the cylinder with diameter of 0.5 cm and length of 1.5 cm obtained after the heat treatment at 900 °C for 40 h.
Figure 2.
Photo of the as-prepared 90SiO2-10SnO2:0.5Er3+ monolithic square with size of 1 × 1 cm2 and thickness of ≈0.3 cm and the cylinder with diameter of 0.5 cm and length of 1.5 cm obtained after the heat treatment at 900 °C for 40 h.

Figure 3.
Emission spectra of 90SiO2-10SnO2:0.5Er3+ monolith heat treated at 900 °C for 40 h excited at 330 nm and 514 nm by using a Xenon lamp as an excitation source.
Figure 3.
Emission spectra of 90SiO2-10SnO2:0.5Er3+ monolith heat treated at 900 °C for 40 h excited at 330 nm and 514 nm by using a Xenon lamp as an excitation source.

Figure 4.
Emission spectrum of 90SiO2-10SnO2:0.5Er3+ monolith heat-treated at 900 °C for 40 h excited at 514.5 nm by using an Ar+ laser as an excitation source.
Figure 4.
Emission spectrum of 90SiO2-10SnO2:0.5Er3+ monolith heat-treated at 900 °C for 40 h excited at 514.5 nm by using an Ar+ laser as an excitation source.

Figure 5.
Excitation spectra detected at 1553.5 nm and 1535.5 nm of 90SiO2-10SnO2:0.5Er3+ monoliths heat treated at 900 °C for 40 h.
Figure 5.
Excitation spectra detected at 1553.5 nm and 1535.5 nm of 90SiO2-10SnO2:0.5Er3+ monoliths heat treated at 900 °C for 40 h.

Figure 6.
Decay curves of the luminescence from the 4I13/2 metastable state recorded at 1535.5 nm (black dots) and 1553.5 nm (green dots), acquired using the 514.5 nm Ar+ laser beam, of Er3+ in 90SiO2-10SnO2:0.5Er3+ monolith heat treated at 900 °C for 40 h. The fitting curve is acquired based on Equation (1).


Table 1.
Table of the detailed composition of (100 − x)SiO2-xSnO2:yEr3+ monoliths.
| SnO2 Content x (mol%) | Er3+ Concentration (mol%) | H2O/TEOS | EtOH/TEOS | HCl/TEOS |
|---|---|---|---|---|
| 10 | 0.5 | 10 | 4 | 0.009 |
Table 2.
Table of the obtained values of A1, τ1, A2, τ2, N1, and N2.
| A1 | τ1 (ms) | A2 | τ2 (ms) | |
|---|---|---|---|---|
| 0.32 | 4.9 | 1.03 | 0.5 | 75% |
© 2018 by the authors. Licensee MDPI, Basel, Switzerland. This article is an open access article distributed under the terms and conditions of the Creative Commons Attribution (CC BY) license (http://creativecommons.org/licenses/by/4.0/).
Share and Cite
MDPI and ACS Style
Tran, L.T.N.; Massella, D.; Zur, L.; Chiasera, A.; Varas, S.; Armellini, C.; Righini, G.C.; Lukowiak, A.; Zonta, D.; Ferrari, M. SiO2-SnO2:Er3+ Glass-Ceramic Monoliths. Appl. Sci. 2018, 8, 1335. https://doi.org/10.3390/app8081335
AMA Style
Tran LTN, Massella D, Zur L, Chiasera A, Varas S, Armellini C, Righini GC, Lukowiak A, Zonta D, Ferrari M. SiO2-SnO2:Er3+ Glass-Ceramic Monoliths. Applied Sciences. 2018; 8(8):1335. https://doi.org/10.3390/app8081335
Chicago/Turabian StyleTran, Lam Thi Ngoc, Damiano Massella, Lidia Zur, Alessandro Chiasera, Stefano Varas, Cristina Armellini, Giancarlo C. Righini, Anna Lukowiak, Daniele Zonta, and Maurizio Ferrari. 2018. "SiO2-SnO2:Er3+ Glass-Ceramic Monoliths" Applied Sciences 8, no. 8: 1335. https://doi.org/10.3390/app8081335
Note that from the first issue of 2016, this journal uses article numbers instead of page numbers. See further details here.