Article

Hybrid Prediction Model for Type 2 Diabetes and Hypertension Using DBSCAN-Based Outlier Detection, Synthetic Minority Over Sampling Technique (SMOTE), and Random Forest

1
Department of Industrial and Systems Engineering, Dongguk University, Seoul 100-715, Korea
2
u-SCM Research Center, Nano Information Technology Academy, Dongguk University, Seoul 100-715, Korea
*
Authors to whom correspondence should be addressed.
Appl. Sci. 2018, 8(8), 1325; https://doi.org/10.3390/app8081325
Submission received: 16 July 2018 / Revised: 6 August 2018 / Accepted: 6 August 2018 / Published: 8 August 2018
(This article belongs to the Special Issue Data Analytics in Smart Healthcare)

Abstract

:
As the risk of diseases diabetes and hypertension increases, machine learning algorithms are being utilized to improve early stage diagnosis. This study proposes a Hybrid Prediction Model (HPM), which can provide early prediction of type 2 diabetes (T2D) and hypertension based on input risk-factors from individuals. The proposed HPM consists of Density-based Spatial Clustering of Applications with Noise (DBSCAN)-based outlier detection to remove the outlier data, Synthetic Minority Over-Sampling Technique (SMOTE) to balance the distribution of class, and Random Forest (RF) to classify the diseases. Three benchmark datasets were utilized to predict the risk of diabetes and hypertension at the initial stage. The result showed that by integrating DBSCAN-based outlier detection, SMOTE, and RF, diabetes and hypertension could be successfully predicted. The proposed HPM provided the best performance result as compared to other models for predicting diabetes as well as hypertension. Furthermore, our study has demonstrated that the proposed HPM can be applied in real cases in the IoT-based Health-care Monitoring System, so that the input risk-factors from end-user android application can be stored and analyzed in a secure remote server. The prediction result from the proposed HPM can be accessed by users through an Android application; thus, it is expected to provide an effective way to find the risk of diabetes and hypertension at the initial stage.

1. Introduction

Type 2 diabetes (T2D) is an enduring metabolic disorder wherein the blood glucose level changes, and it might be due to the body’s incompetence to use its generated insulin [1,2,3]. T2D is quite endemic that has plagued the health care systems in developing countries [4]. Diabetes patients are quite vulnerable to stroke and high mortalities [5]. However, the continuous monitoring of blood glucose level performs an eminent part in mitigating and preventing complications of diabetes [6,7,8]. Hypertension, which is a root cause of high blood pressure, is a quite normal and harmful condition. As per a World Health Organization (WHO) report, hypertension could provide bases for cardiac arrest, heart swelling, and eventually the failure of heart [9]. In America alone, around 75 million people (1 in 3) are suffering with high blood pressure [10], which is one of the highest factors of death for Americans [11]. In 2009 alone, it was a key factor of for 348,000 Americans deaths and costs 47.5 billion dollars each year [12].
Due to increasing risk of diabetes and hypertension, recent studies have utilized machine learning algorithms as decision-making tools to diagnose diabetes and hypertension at an early stage, so that preventive action can be taken by individuals. The machine learning algorithms have showed high performance on predicting the diabetes [13,14,15,16] as well as hypertension [17,18,19] based on current conditions of individuals. Furthermore, the machine learning-based algorithm random forest (RF) has been proven to be successful at predicting diabetes [20,21] as well as hypertension [22,23], with the highest model accuracy compared to other classification models. However, the machine learning algorithms encounter challenging problems, such as outlier data and imbalanced datasets, which can reduce accuracy. Several studies have demonstrated that by removing the outliers while using the Density-based Spatial Clustering of Applications with Noise (DBSCAN) method [24,25,26,27,28] and utilizing an oversampling method, such as Synthetic Minority Over Sampling Technique (SMOTE) to balance imbalanced data [21,29,30,31,32,33,34,35,36,37], the performance of prediction system is improved.
Nevertheless, there is no study about model integration between DBSCAN based outlier detection and SMOTE for RF classifier accuracy improvement, specifically for diabetes and hypertension. Thus, this study proposes Hybrid Prediction Model (HPM) by utilizing DBSCAN-based outlier detection, SMOTE, and RF to predict diabetes, as well as hypertension t based on input risk-factors from users. Furthermore, past literature revealed that the recent technologies, such as Internet of Things (IoT), big data, cloud computing, novel biosensors and machine learning can perform a significant part in enhancing the diabetes management [38]. Therefore, the present study has shown that the proposed HPM can be applied to IoT-based healthcare monitoring systems (HMS), offering users an effective way to identify the danger that is involved in high diabetes and hypertension shortly.
The rest of the paper organization is provided in the next. Section 2 explains the related works on prediction models for diabetes and hypertension, outlier detection methods, and SMOTE. Section 3 presents the dataset and feature selection. In Section 4, the proposed HPM is presented, while in Section 5, the results and discussions are explained. In Section 6, concluding remarks are presented and several limitations and remaining challenges are discussed.

2. Literature Review

2.1. Prediction Model for Diabetes and Hypertension

Diabetes has turned into a worldwide pandemic that puts a grave load on healthcare systems, particularly in developing countries [4]. On a global stage, the total number of diabetic patients is estimated to increase from 171 million to 366 million in 2000 and 2030, respectively [39]. T2D is an advanced stage in which the body becomes stiff to normal effects of insulin and slowly loses the capacity to generate enough insulin in the pancreas. It is necessary for persons ≥45 years, with a BMI ≥25 kg/m2, to experience screening to detect pre-diabetes and diabetes [2]. Furthermore, hypertension, which is usually referred as systolic blood pressure ≥140 mmHg and diastolic blood pressure ≥90 mmHg, is a normal long-term disease that presently impacts 77 million Americans [40,41,42]. It is a noteworthy risk element for the lethal cardiovascular diseases, developing heart failure in 91% of cases; it is present in 69% of persons who suffer their first heart attack and in 77% of those having their first stroke [41]. Past studies have shown firm positive relationships among blood pressure, danger of cardiovascular diseases, and mortality [43,44]. Together, hypertension and diabetes are stroke risk factors, but they can be avoided if individuals take a healthy diet as well as physical exercise every day [45]. Therefore, in the future, a prediction model that notifies people on the chance of diabetes and hypertension is required, and it would permit them to take preemptive action. The machine learning algorithms can be used to diagnose diabetes and hypertension that is based on the present condition of patients.
Several studies have shown a positive impact of the application of machine learning for diabetes classification. Patil et al. proposed HPM for T2D [13]. The proposed model consists of a K-means algorithm to remove incorrectly classified instance and C4.5 to classify the diabetes dataset. The Pima Indian dataset and k-fold cross-validation are utilized. The result revealed that the HPM showed the highest accuracy, as high as 92.38%, among other methods. Wu et al. utilized an HPM for predicting T2D [14]. The model consists of an improved K-means and the logistic regression model. The improved K-means algorithm was used to confiscate incorrect clustered data, later the logistic regression algorithm was used to classify the remaining data. The findings indicated that the proposed model demonstrated greater prediction accuracy as compared with past work. Previous literature compared the performance of logistic regression, artificial neural networks (ANNs), and decision tree models for anticipating diabetes or prediabetes employing common risk factors [15]. The dataset was gathered from Guangzhou, China, and 735 patients were validated as having diabetes or prediabetes, while 752 were normal controls. The findings indicated that the greatest classification accuracy as compared to other model is shown by decision tree model C5.0. Finally, past literature proposed a machine learning model to predict the prevalence of diabetes and hypertension, with a dataset having 13,647,408 medical records for diverse ethnicities in Kuwait [16]. The classification models, for example, logistic regression, K-Nearest Neighbors (KNN), Multi-factor Dimensionality Reduction (MDR), and Support Vector Machines (SVM), were used and indicated noteworthy finding on predicting diabetes and hypertension. Besides, the study inferred that ethnicity is a critical ingredient for anticipating diabetes.
Furthermore, several studies have been conducted and revealed that the machine learning algorithms provide early prediction as well as treatment for hypertension. Koren et al. investigated the advantage of machine learning for treatment of hypertension [17]. They used machine learning methods to distinguish determinants that add to the accomplishment of hypertension drug treatment on a massive set of patients. The result showed that a fully connected neural network could achieve AUC as much as 0.82. The result of their study showed that machine learning algorithms can provide the hypertension treatment with combinations of three or four medications. Tayefi et al. built up a decision tree model to distinguish the risk factors that are related to hypertension [18]. A dataset comprising of 9078 subjects was part to 70% as training set and 30% as the testing dataset to assess the performance of the decision tree. Two models are proposed based on different risk factors. The result showed that the accuracy of the decision tree for both models could be as much as 73% and 70%, respectively. The finding is assumed to distinguish the risk factors that are related to hypertension that may be utilized to create programs for hypertension management. Finally, Golino et al. presented the Classification and Regression Tree (CART) to predict hypertension based on several factor such as body mass index (BMI), waist (WC), and hip circumference (HC), and waist hip ratio (WHR) [19]. The finding demonstrates that, for women, BMI, WC, and WHR is the blend that creates the best prediction, while for men, BMI, WC, HC, and WHC are the topmost risk factors.
Random Forest is an ensemble prediction technique by amassing the finding of individual decision trees [46]. Generally, Random Forest works by utilizing the bagging method to generate subsets of training data. For each training dataset, a decision tree algorithm is utilized. Lastly, the prediction results are acquired from the model (most frequent class) of every decision tree in the forest. A study regarding RF for early prediction of diabetes as well hypertension has been conducted and shown significant results. Nai-arun et al. utilized Random Forest as a classifier for diabetes risk prediction [20]. The dataset was gathered from 30,122 persons in Sawanpracharak Regional Hospital, Thailand, between 2012 and 2013. The features comprise of medical information for example BMI, age, weight, height, blood pressure, a history of diabetes, and hypertension in the family, gender, and liquor and smoking patterns. The findings manifest that RF performance is excellent as compared to rest of algorithms. Finally, Alghamdi et al. used an ensembling strategy that consolidated three decision tree classification strategies (RF, Naïve Bayes [NB] Tree, and Logistic Model Tree [LMT]) for foreseeing the diabetes [21]. The finding demonstrated that the performance of the predictive model has accomplished topmost accuracy for anticipating incident diabetes using cardiorespiratory fitness data among models. Furthermore, RF also showed a significant result for hypertension prediction. Sakr et al. evaluated and compared the performance of various machine learning methods on foreseeing the people in danger of growing hypertension [22]. The dataset utilized data of 23,095 patients at Henry Ford Health Systems from 1991 to 2009. Six machine learning methods were researched: LogitBoost (LB), Bayesian Network classifier (BN), Locally Weighted Naïve Bayes (LWB), ANN, SVM, and Random Tree Forest (RTF). The result showed that the RTF model had the best performance (AUC = 0.93) among the machine learning methods that were investigated in this study. Finally, Sun et al. utilized the RF classifier as a model for transitions in hypertension control [23]. The dataset consisted of 1294 patients with hypertension at the Vanderbilt University Medical Center. The result showed that proposed RF accomplished exact forecast of change points of hypertension control status. The result of their study is expected to be used for personalized hypertension management plans.
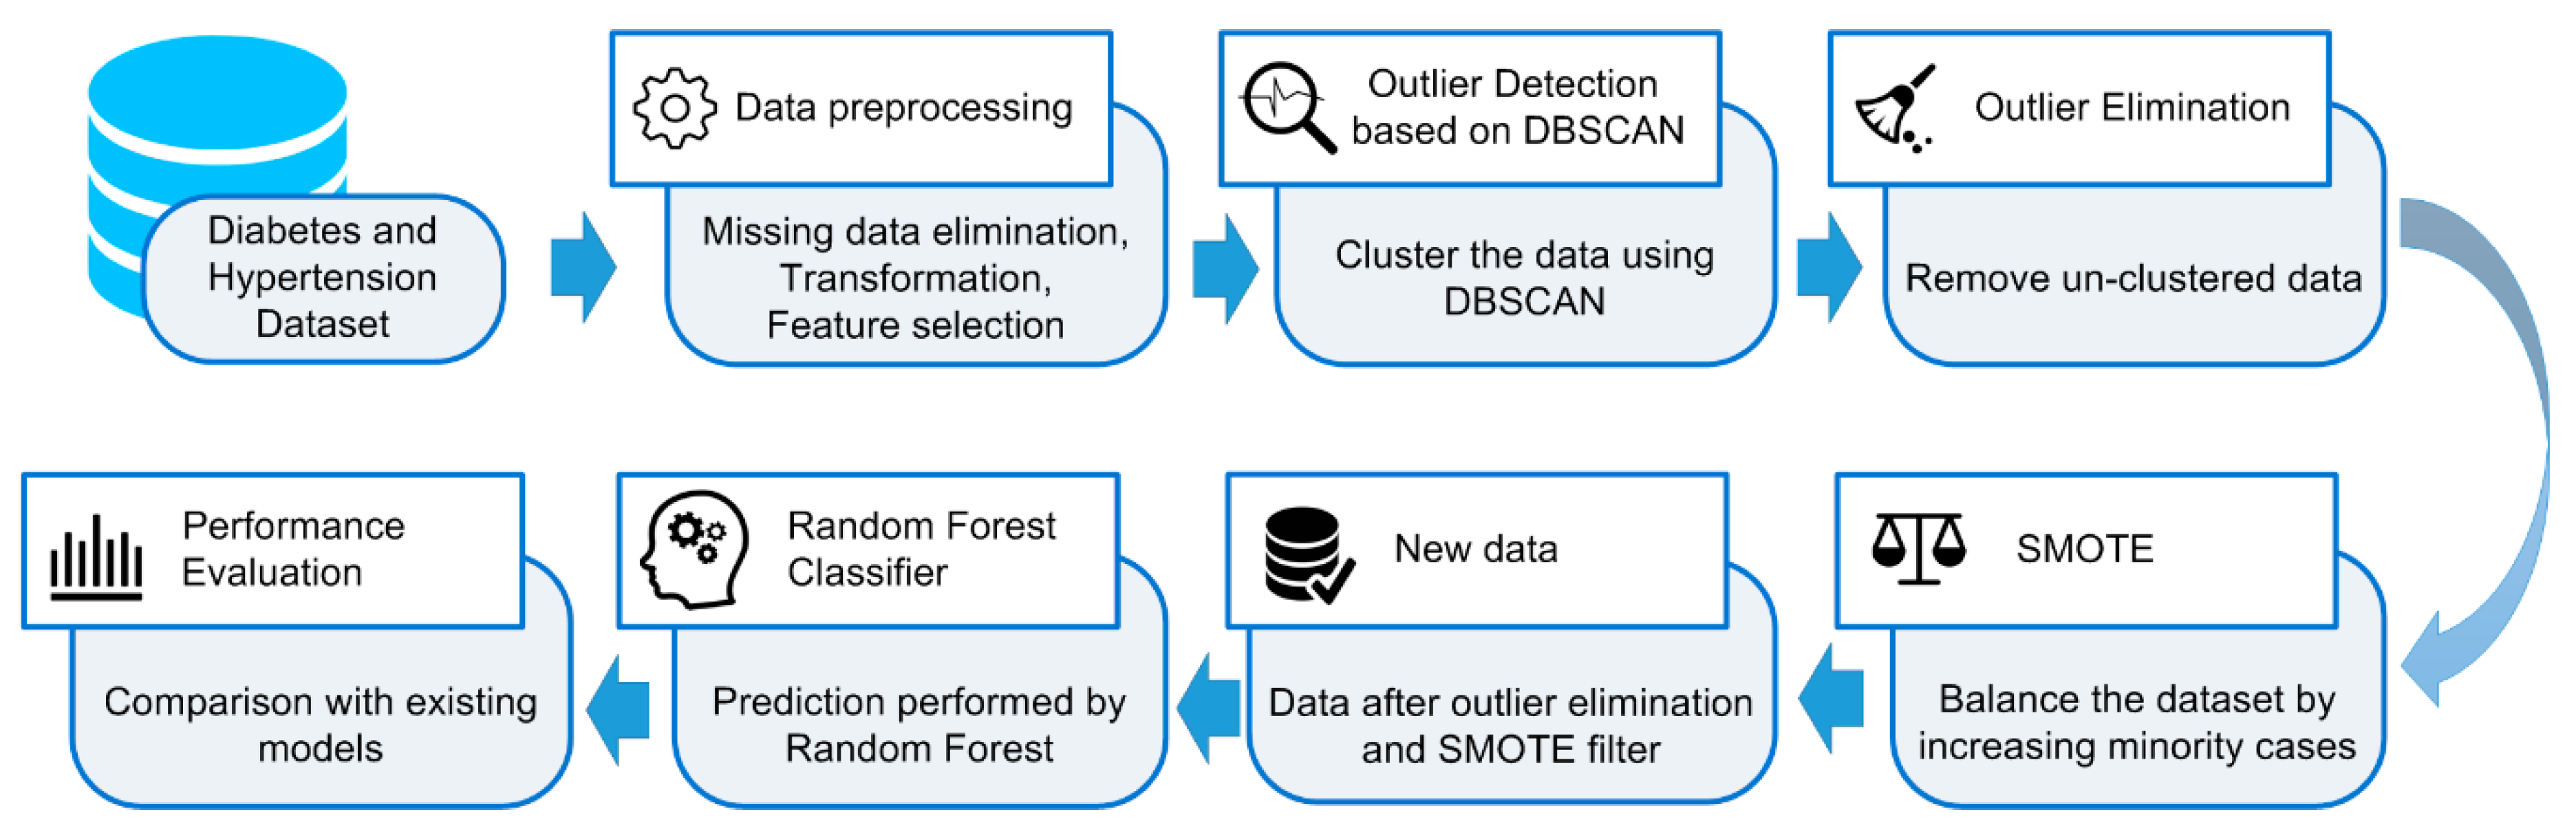
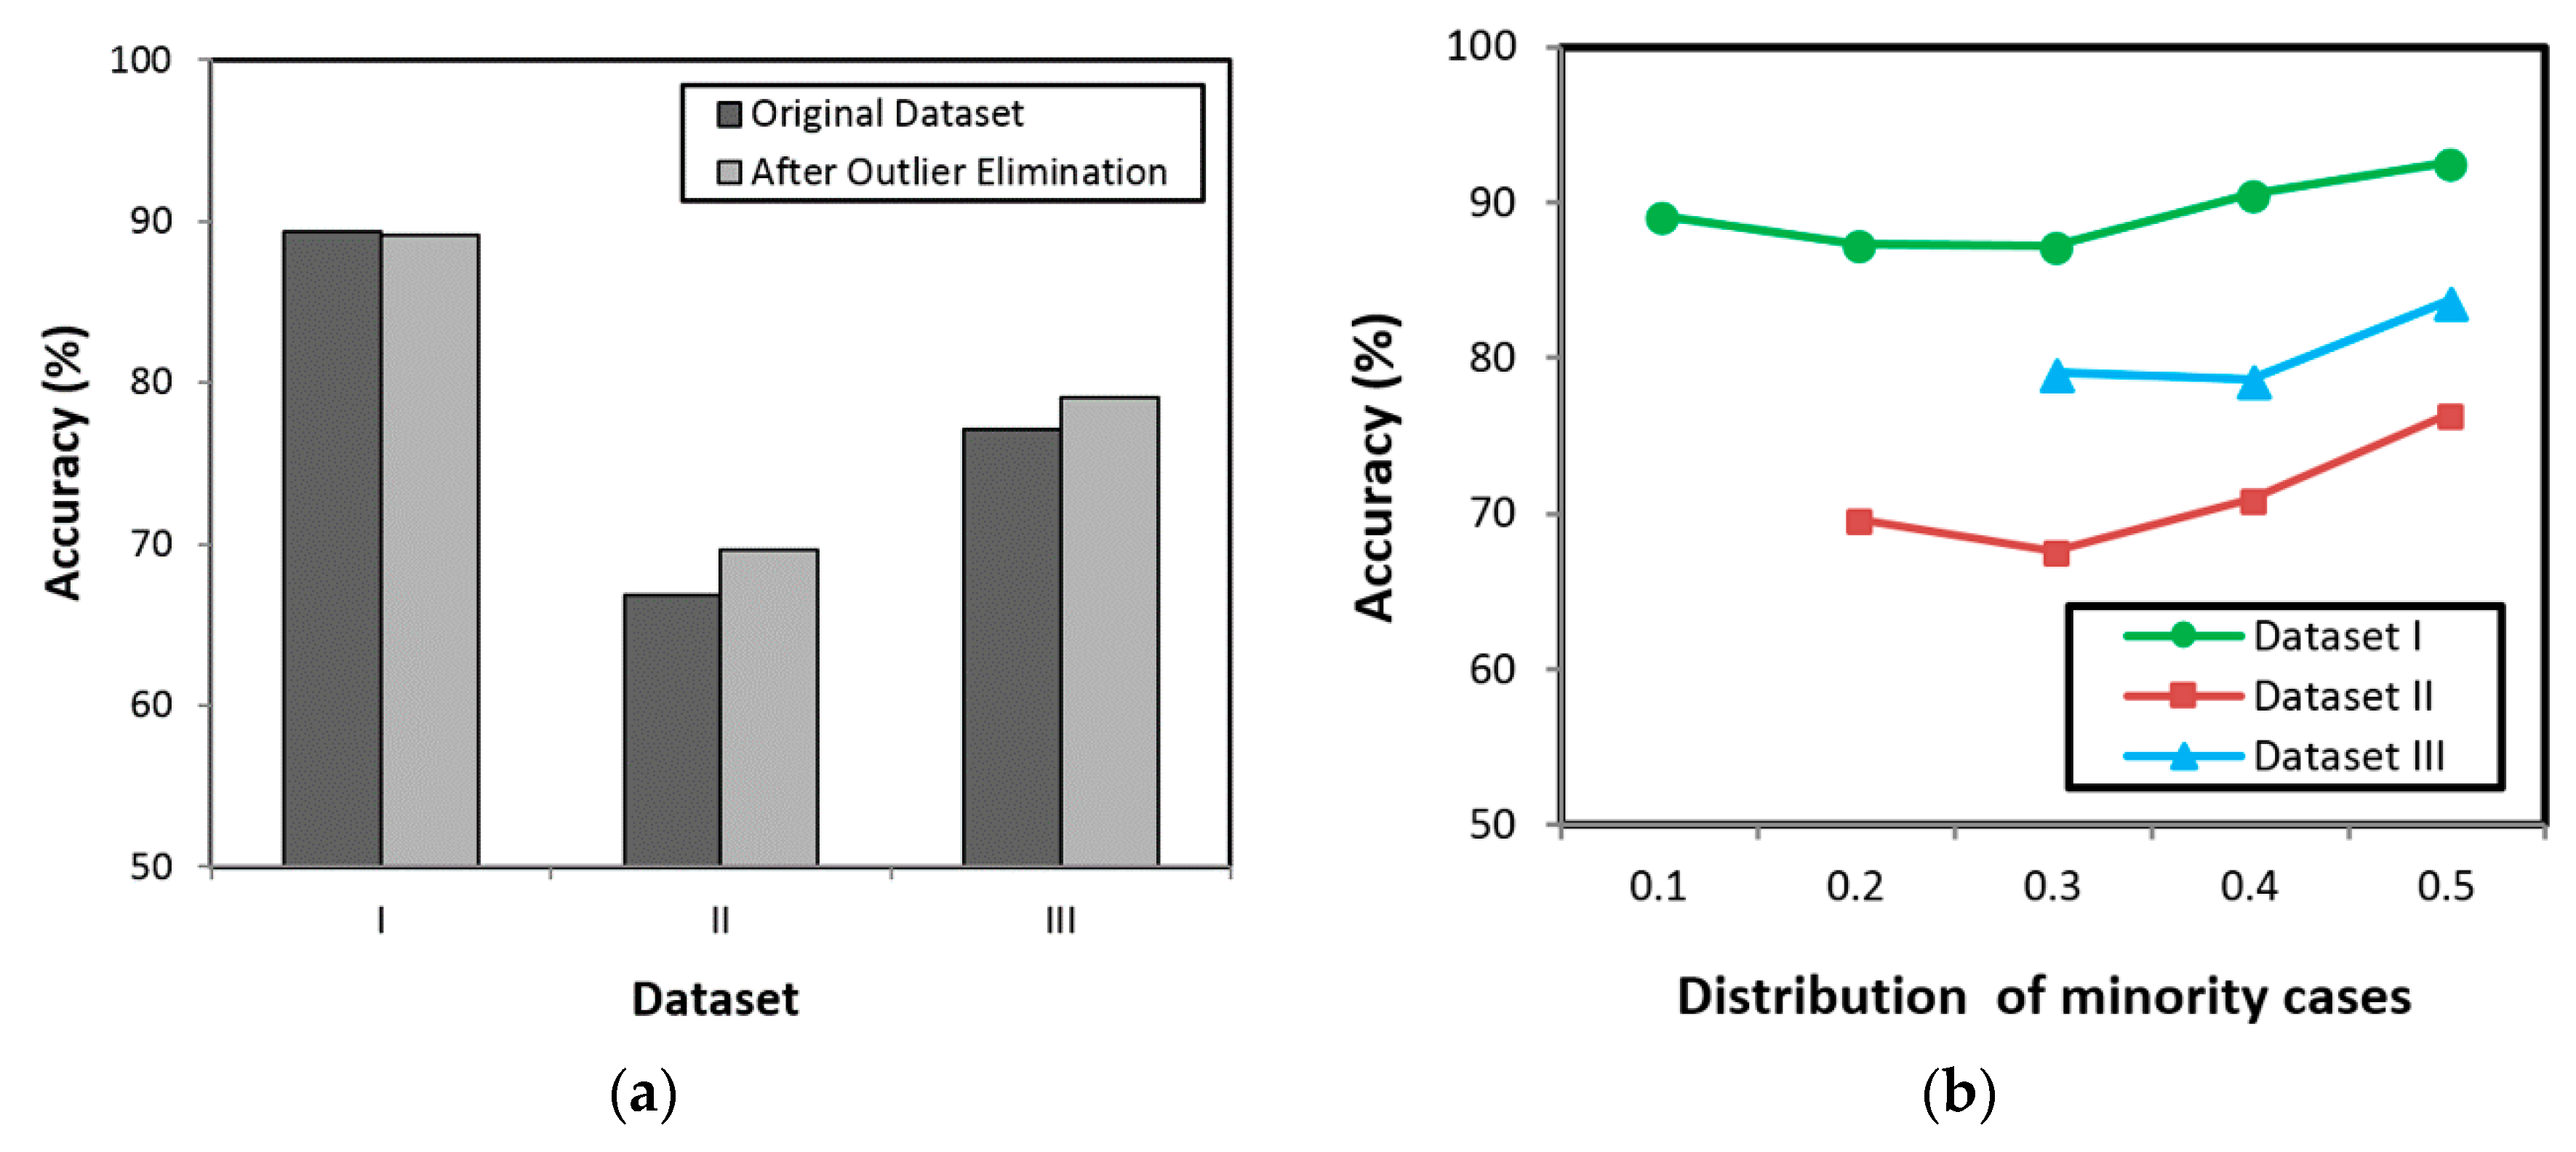
Existing studies show that the RF can be utilized for early prediction of diabetes as well as hypertension with high classification accuracy. However, several studies have revealed that the outlier data as well as imbalanced datasets are challenging problems in classification, as they can reduce the system performance. Hence, the present study proposes an HPM that consists of DBSCAN-based outlier detection to remove the outlier data, SMOTE for balancing the distribution of class, and RF to discover the diabetes and hypertension at an earlier stage. By removing the outlier data as well as balancing the dataset, the RF is expected to provide high classification accuracy.

2.2. Outlier Detection Method

Most existing research focuses on developing more accurate models rather than on the importance of data pre-processing. The outlier detection method can be utilized in the pre-processing step to identify inconsistencies in data/outliers; thus, a good classifier can be generated for better decision making. Eliminating the outliers from the training dataset will enhance the classification accuracy. Outlier detection constitutes an important issue for many research areas, including medical, document management, social network, and sensor networks. Several studies have been conducted and showed significant results of outlier detection on improving the classification accuracy. Shin et al. studied text classification in order to improve document management utilizing outlier detection and kNN classifier [47]. The findings indicated that omitting outliers from the training data considerably refined the kNN classifier. In a general case study, Tallon-Ballesteros and Riquelme evaluated the outlier effect in classification problems [48]. The study proposed a statistical outlier detection method to determine the outliers based on inter-quartile range (lQR) by classes. The result showed that by partially eliminating the outliers from training dataset, the classification performance of C4.5 was enhanced. Furthermore, in the case of medical application, the outlier detection showed significant result. Past literature used an outlier prediction technique that can enhance the classification performance in the medical dataset [49]. The findings showed that, by eliminating the detected outliers from training set, the classification accuracy was enhanced particularly for Naïve Bayes classifier. Finally, past literature builds up a burn tissue classification device to help burn surgeons in planning and executing debridement surgery [50]. The study used the multistage technique to build on Z-test and univariate analysis to recognize and eliminate outliers from the training dataset. The findings demonstrated that the outlier detection and elimination technique lessened the difference of the training data and enhanced the classification accuracy.
Clustering method is a technique that can be used for outlier detection. The clustering method depends on the fundamental supposition that normal cases correspond to big and dense clusters, while outliers make little groups or do not have a place with any cluster whatsoever [
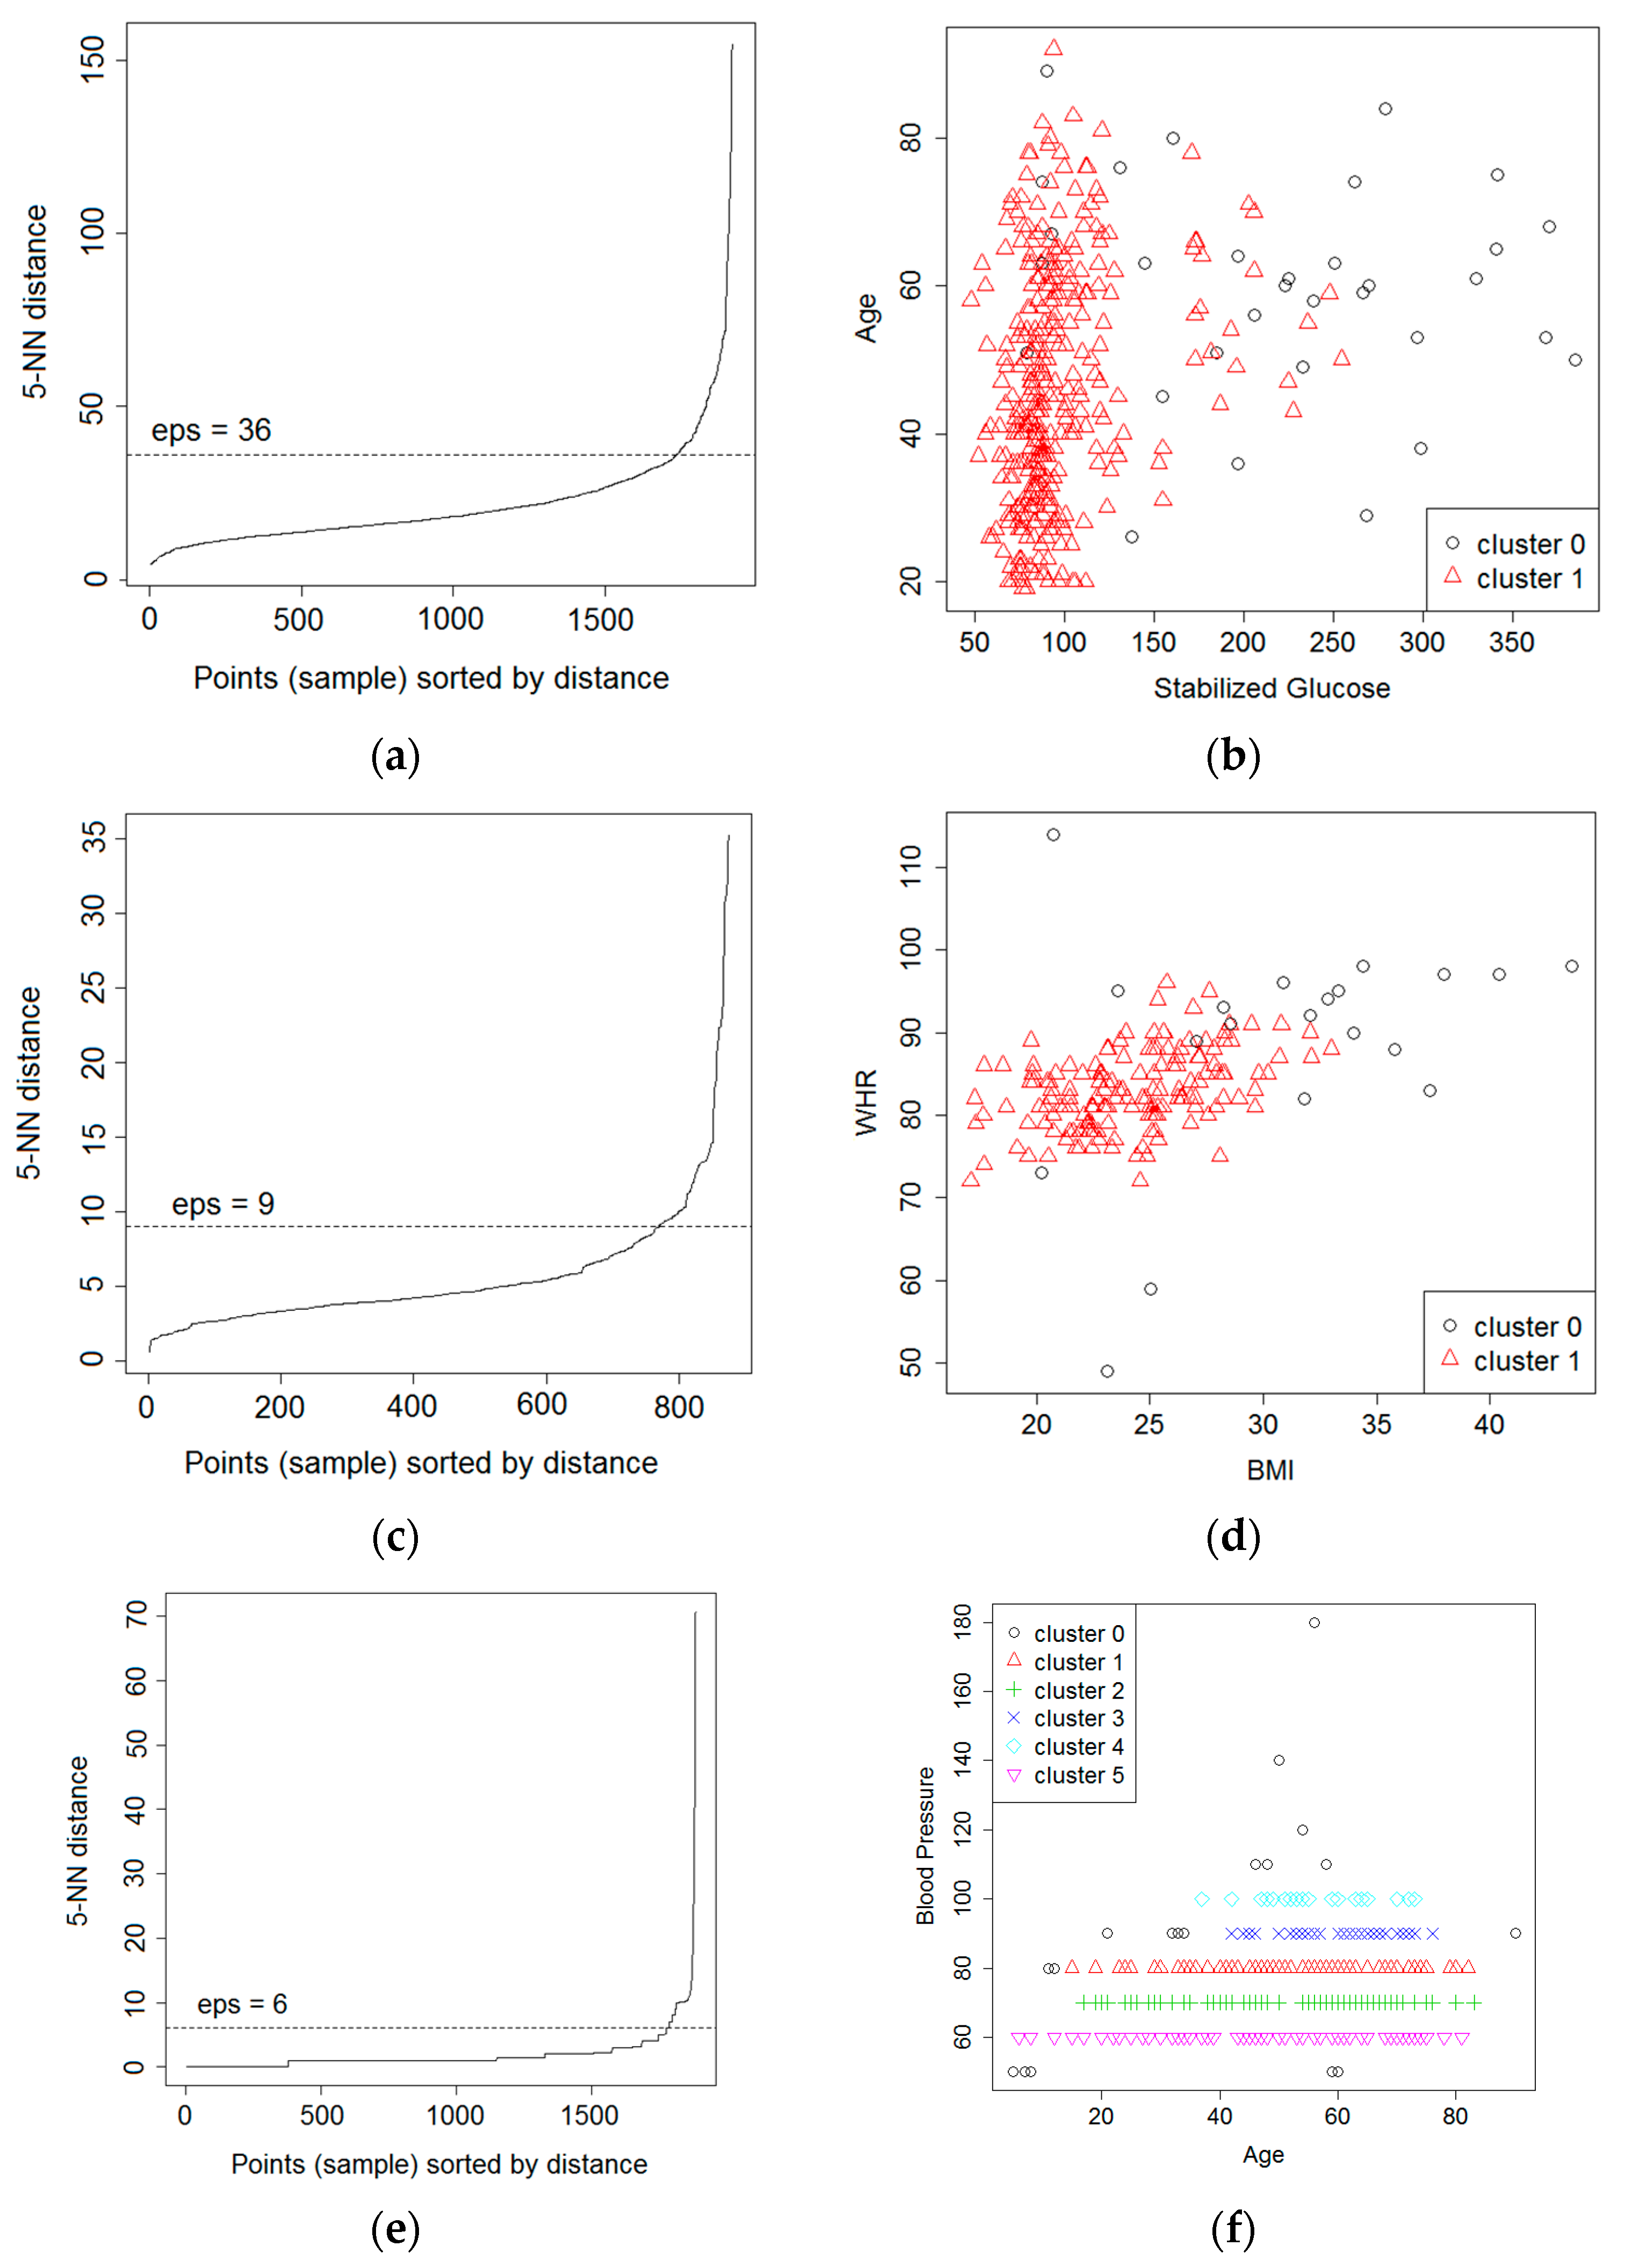
51]. DBSCAN is clustering based outlier detection technique that can be utilized to distinguish the outliers [52]. The objective is to recognize the dense regions, which might be calculated by the quantity of objects near a given point. Outliers are the points that do not belong to any cluster. The DBSCAN relies on two important parameters: epsilon (eps) and minimum points (MinPts). The eps represents the radius of neighborhood about a point x (ε-neighborhood of x), while MinPts represents the minimum number of neighbors within the eps radius.
Regarding application of DBSCAN for outlier detection, several studies have been conducted and showed significant results in identifying outliers as well as improving the classification result. Past literature showed that by removing noise the quality of real datasets is enhanced [24]. Support vector data description (SVDD) was utilized to classify the dataset. The University of California, Irvine (UCI) dataset has been utilized for the experimental scenario and the proposed method showed an efficient result. In the case of social network, ElBarawy et al. utilized DBSCAN to emphasize community detection. The result showed that the DBSCAN successfully identifies outliers [25]. Eliminating the outliers prompts a precise clustering result that assists with the community identification issue in the area of social network analysis. The DBSCAN-based outlier detection also showed significant results on detecting the outlier sensor data. Alfian et al. proposed a real-time monitoring system that is based on smartphone sensors for perishable food [26]. As outliers arise in sensor data due to inadequacies in sensing devices and network communication glitches, Alfian et al. used outlier detection that is based on DBSCAN to refine the outlier data. The findings demonstrated that DBSCAN was utilized to effectively recognize/characterize outlier data as isolated from normal sensor data. Abid et al. proposed outlier detection based on DBSCAN for sensor data in wireless sensor networks [27]. The proposed model successfully separated outliers from normal sensors data. Based on the experiment on synthetic datasets, their proposed model showed significant results in detecting outliers, with an accuracy rate of 99%. Finally, Tian et al. proposed an outlier detection method of soft sensor modeling of time series [28]. They utilized DBSCAN for the outlier detection method. The experiment showed that the proposed outlier detection method generated good performance.
Utilizing DBSCAN-based outlier detection provides an efficient way for detecting the outlier data. The current literatures showed that removing outliers improves the classification accuracy. Furthermore, the majority of real-world datasets are imbalanced; thus, an oversampling method to generate artificial data from minority class is needed to improve the classification accuracy. A previous study showed that the combination data cleaning (outlier removal) and oversampling method generated a significant result [34]. In this manner, combining DBSCAN-based outlier detection and oversampling technique is predicted to enhance the accuracy of classification model.

2.3. Oversampling Method for Imbalance Dataset

Classification datasets usually have great differences of distribution between the quantities of majority class and the minority class, which is alluded as an imbalanced dataset. Learning from imbalanced datasets is a demanding problem in supervised learning as standard classification algorithms are intended to explain balanced class distributions. One of the methods is called oversampling, and it works by creating artificial data to attain a balanced class distribution. SMOTE is a kind of oversampling technique that has appeared to be great and it is generally utilized as a part of machine learning to balance imbalanced data. The SMOTE creates arbitrarily new instances of minority class from the closest neighbors of the minority class sample. These instances are made in view of the features of the original dataset with the goal that they end up like the original instances of the minority class [53].
Regarding the implementation of oversampling method, several studies have been conducted and have showed significant results. The SMOTE has been integrated with classification algorithms and it has improved the performance of prediction systems, such as in network intrusion detection, bankruptcy prediction, credit scoring, and medical diagnosis. Yan et al. proposed Region Adaptive Synthetic Minority Oversampling Technique (RA-SMOTE) and applied it to intrusion detection to recognize the attack behaviours in the network [29]. Three distinct sorts of classifiers, including SVM, BP neural system (BPNN), and RFs, were utilized to test the capability of the algorithm. The findings demonstrated that the proposed algorithm could successfully take care of the class imbalance issue and enhance the detection rate of low-visit attacks. Sun et al. proposed a hybrid model by utilizing SMOTE for imbalanced dataset to be used as a tool for bank to evaluate the enterprise credit [30]. The proposed model was applied to the financial data of 552 Chinese listed companies and outperformed the traditional models. Le et al. used numerous oversampling methods to manage imbalance problems on the financial related dataset that was gathered from Korean organizations between 2016 and 2017 [31]. The findings showed a blend of SMOTE and Edited Nearest Neighbor (SMOTE + ENN), as well as RF achieved highest accuracy on bankruptcy prediction. Finally, a past study proposed a method combining SMOTE with SVM to enhance the predication accuracy for old banknotes [32]. The findings revealed that the proposed method could enhance the performance by as much as 20% when compared with standard SVM algorithm. Generally, greater prediction performance can be attained with balanced data. Past study integrated the SMOTE, the particle swarm optimization (PSO), and radial basis function (RBF) classifier [33]. The experimental results showed that the SMOTE + PSO-RBF provides an extremely well-defined explanation for other present advanced techniques for fighting imbalanced problems. Verbiest et al. utilized data-cleaning before and after applying SMOTE by proposing selection techniques that are based on fuzzy rough set theory to remove the noisy instances from the dataset [34]. The results indicated that their proposed technique upgrades present pre-processing methods for imbalanced classification. Past study proposed the SMOTE–IPF (Iterative-Partitioning Filter), which can tackle the issues that are created by noisy and borderline cases in imbalanced datasets [35]. The findings revealed that the proposed model worked superior than the present SMOTE. Finally, Douzas et al. presented an impressive oversampling method based on k-means clustering and SMOTE, which can prevent the creation of noise and successfully beats imbalances between and within classes [36]. The result showed that their proposed method was applied to 90 datasets and improved the performance of classification.
In the case of medical diagnosis or disease classification, the combination of SMOTE with classification algorithms has shown significant results. Wang et al. proposed hybrid algorithm by utilizing well-known classifier, SMOTE, and particle swarm optimization (PSO) to improve the competence of classification for five-year survivability of breast cancer patients from a gigantic dataset with imbalanced property [37]. The findings revealed that the hybrid algorithm surpassed other algorithms. Moreover, applying SMOTE in appropriate searching algorithms, for example, PSO and classifiers, such as C5, can considerably enhance the efficiency of classification for gigantic imbalanced data sets. Furthermore, Alghamdi et al. investigated the performance of machine learning methods for predicting diabetes incidence while using medical records of cardiorespiratory fitness [21]. The dataset consists of 32,555 patients of whom 5099 have developed diabetes after five years. The dataset contained 62 attributes that are classified into four categories: demographic characteristics, disease history, medication use history, and stress test vital signs. The study utilized SMOTE to deal with imbalance dataset. The result showed that, with the help of SMOTE, the performance of the predictive model was enhanced. Furthermore, the study showed that ensembling and SMOTE approaches achieve the highest accuracy for predicting incident diabetes while using cardiorespiratory fitness data.
The present literature demonstrates that greater prediction performance is attained by utilizing SMOTE to balance data. Therefore, an HPM that consists of DBSCAN-based outlier detection to identify and remove the outlier and SMOTE to balance the distribution dataset is proposed in our study. The hybrid model is predicted to enhance the classification accuracy, in this way helping people to detect the danger of diabetes and hypertension at the initial stage. Along these lines, a person can evade the most exceedingly bad conditions later on.

3. Dataset and Feature Selection

This section explains the dataset description and feature selection procedures. In order to investigate how the diabetes and hypertension can be predicted in early stage, this study was conducted on three different sources. The proposed HPM is applied to the three different dataset and is expected to generalize the robust classifier. The datasets on diabetes, hypertension, and Chronic Kidney Disease (CKD) are considered as dataset I, II, and III, respectively. Dataset I was provided by Dr John Schorling, Department of Medicine, University of Virginia School of Medicine [54,55]. The data contained 403 instances. The subjects were interviewed to understand the prevalence of obesity, diabetes, and other cardiovascular risk factors in central Virginia for African Americans. The original features were 19 features without class variable. We defined the class variable as whether the subject is diagnosed with diabetes or not. This decision is based on the Glycosylated Hemoglobin of the subject, if the value >7.0 is diagnosed as diabetes, otherwise as normal. Based on this scenario, the updated dataset consists of 330 negative (normal) subjects and 73 positive (diabetes) subjects. The proposed HPM is expected to foresee that either the subject is diagnosed with diabetes or is not given several inputs of risk factors. The detail of dataset attributes with its rank is presented in Table 1.
Dataset II is provided by Golino et al. and it is utilized to reveal the relationship of increased blood pressure by BMI, WC, and HC, and WHR on male subject [19,56]. Original dataset consists of nine features with one output class. We have removed the attributes Systolic Blood Pressure (SBP) and Diastolic Blood Pressure (DBP) due to its similarity with output class. The dataset consists of 175 male subjects, of whom 128 tested negatives (regular/normal) and 47 tested positive (hypertension). The hypertension is classified when the systolic blood pressure of subject >140 mmHg. By utilizing this dataset, the HPM is expected to foresee whether the subject is diagnosed with hypertension or not given several features, such as obesity, WHR, HC, BMI, WC, and age. The detail of dataset attributes with their ranks is presented in Table 2.
Finally, dataset III is provided by Dr. P. Soundarapandian, M.D., D.M, from Apollo Hospitals, Tamilnadu, India [57]. The dataset originally has 24 features with 400 instances, where its class is either the subject is diagnosed with chronic kidney disease (CKD) or not. However, our study is focusing on the relationship between hypertension and diabetes; thus, most of the features from original dataset are removed and the class outcome is modified. Finally, the attributes of updated dataset consist of age, bp (blood pressure), and htn (hypertension), while the class is whether the subject is diagnosed with diabetes mellitus. The dataset consists of 261 tested negative (normal), 137 tested positive (diabetes), and two unlabeled data. The HPM is expected to foresee either the subject is diagnosed with diabetes based on risk factor, such as age and hypertension; thus, it can reveal the relationship between hypertension and diabetes. The details of dataset attributes with its rank are presented in Table 3.
By utilizing the above datasets, it is expected to predict the diseases (i.e., diabetes and hypertension) and reveal their risk factors. In this study, the dataset I is utilized by proposed HPM to predict whether the subject is diagnosed with diabetes or not, while the dataset II is utilized to predict whether there is presence of hypertension on the subject or not. Finally, dataset III is utilized to reveal the relationship between the hypertension and diabetes. The proposed HPM is expected to reveal the presence of diabetes given the input risk factors, such as age and hypertension. Furthermore, these benchmark datasets have been utilized by previous machine learning-related studies, thus the performance comparison with previous studies can be presented and the proposed HPM is expected to improve the model accuracy.
The data pre-processing acts a key part as it can improve the classifier accuracy. Feature selection is employed to choose subset of features that contributes considerably to the objective class. The objective of the feature selection technique is to enhance the accuracy, lessens the process length, and the cost computation [58,59]. One method for selecting pertinent features from a dataset is to choose them based on their computed significance. Lastly, the unrelated features can be erased from the dataset.
In this study, the Information Gain (IG) technique is applied to evaluate the significance of features from all the datasets [51]. The Weka version 3.6.15 software is utilized to evaluate the significant of features by using IG [60]. Based on the attributed ranking provided by IG, the final features are selected based on the highest ranked attributes and highlighted in italic font in the Table 1, Table 2 and Table 3 for dataset I, II, and III, respectively. The exception is made for dataset II as the rank only appears for the is.obese attribute. Therefore, we have ignored IG rank result and instead followed a previous approach [19] by utilizing all of the features from the dataset except id (Subject ID) for dataset II.

4. Hybrid Prediction Model

This section explains the detail of proposed HPM. The dataset and feature selection have been presented in the previous section. Furthermore, data pre-processing, which involves removing the inappropriate, inconsistent, and missing-value data has been performed. Figure 1 shows the proposed HPM for T2D and hypertension. The proposed HPM consists of several modules, such as outlier detection based on the DBSCAN, over-sampling the minority class based on SMOTE, and RF model to classify the diabetes, as well as hypertension of the subject. Detailed descriptions of each module and its implementation to datasets are presented in following subsections. Finally, the performance evaluation is presented by comparing the proposed of HPM with other existing models.

4.1. Outlier Detection Based on DBSCAN

In this study, DBSCAN [52] was used to detect the outlier data in a diabetes and hypertension dataset. The goal is to find objects that close to a given point in order to create dense regions. The points that are located outside dense regions are treated as outliers. In DBSCAN, two important parameters must be considered: epsilon (eps), which defines the radius of neighborhood around a point x (ε-neighborhood of x), and minimum points (MinPts), which defines the minimum number of neighbors within the eps radius. For the dataset D, DBSCAN works as explained in Algorithm 1.
Algorithm 1. Pseudocode for DBSCAN
Input: dataset D, minimum point minPts, radius
Output: clustered and outlier data
for each point P in dataset D do
  if P is not visited then
     mark P as visited
    neigbrPts ← points in ∊-neighborhood of P
    if sizeof(neigbrPts) < minPts then
      mark P as outlier
    end
    else
      add P to new cluster C
      for each point P’ in neigbrPts do
        if P’ is not visited then
          mark P’ as visited
          neigbrPts’ ← points in ∊-neighborhood of P’
          if sizeof(neigbrPts’) ≥ minPts then
            neigbrPtsneigbrPts + neigbrPts’
          end
        end
        if P’ is not a member of any cluster then
            add P’ to cluster C
        end
      end
    end
  end
end
In order to perform the outlier detection based on DBSCAN, the optimal value of MinPts and eps must be defined first. We have defined the value of MinPts as 5 (i.e., the cluster is created when the minimum number of data is 5). Next, the optimal number of eps must be defined. First, we calculate the average of the distances of every point to its k-nearest neighbors. The value of k refers to MinPts and it is defined by the user. Finally, these k-distances are plotted in an ascending order and called the sorted k-dist graph. The objective is to calculate the “knee” for estimating the set of eps parameter. A “knee” denotes to a threshold where a sharp change appears beside the k-distance curve. The calculation of k-nearest neighbor distance and DBSCAN are applied in R programming language version 3.4.4 [61]. In order to allow for the DBSCAN to cluster the dataset, all the categorical value in each dataset must be converted into numerical values.
Figure 2a,c,e show the sorted k-dist graph and optimal value of eps for datasets I, II, III, respectively. For dataset I, the “knee” is appearing around the distance of 36, while for dataset II and III, they appear at around 9 and 6, respectively. Furthermore, the DBSCAN technique is applied for each dataset given optimal MinPts and eps. Figure 2b,d shows the result of clustering implementation for datasets I and II plotted in two-dimensional graphs. The result showed that for datasets I and II, the DBSCAN performed clustering by grouping the data into single cluster and presented as cluster 1 (see Figure 2b,d). The outliers are un-clustered data and presented as cluster 0 (see Figure 2b,d). Furthermore, for dataset III, the DBSCAN successfully cluster the dataset into five groups (see Figure 2f). The outlier is defined as un-clustered data (i.e., defined as cluster 0 in Figure 2f). The description of dataset, optimal parameters, and final outlier data are presented Table 4. Finally, for each dataset, the outlier data are removed, and normal data are utilized for further analysis.

4.2. SMOTE for Imbalanced Dataset

In this study, the proposed HPM utilizes SMOTE to balance the imbalance dataset. Table 5 shows the number of instances increase by SMOTE. For all of the datasets, the distribution between minority and majority cases is imbalanced. In datasets I and III, the minority cases are the subjects who are diagnosed with diabetes (class “Yes”), while for dataset II, the minority cases are the subjects who are diagnosed with hypertension (class “Yes”). The original percentage of minority cases over the total number of instances for datasets I, II, and III are 13.67%, 23.87%, and 34.54%, respectively. The SMOTE technique is applied to randomly generate new instances of the minority class from the nearest neighbors of the minority class sample, so that it would increase the number of minority cases. In the present study, SMOTE was employed for every dataset with different percentage to increase the balance of datasets; they are 500%, 200%, and 100% for dataset I, II, and III, respectively. After SMOTE implementation, the total instance of minority cases increases, and the updated datasets I, II, and III become more balanced, with 48%, 48.47%, and 51.35% minority cases, respectively. The application of SMOTE for all of the datasets is performed by utilizing Weka Software version 3.6.15 [60]. The detail impact of SMOTE increase can be seen in Table 5.
The SMOTE ensures that when generating the new artificial data, it will follow the distribution from the original dataset. Figure 3 showed the distribution of all dataset and the data is presented based on the attribute Age. For each dataset, the distribution of age for “Yes” and “No” classes follow normal distribution. Figure 3a showed the distribution of age in minority cases (“Yes” class) before SMOTE implementation and it showed less amount of data compared to majority cases (“No” class). After SMOTE is applied to dataset I, the number of instance in minority cases (class “Yes”) increases, and the updated dataset becomes balanced (Figure 3b). The SMOTE implementation keeps the originality of dataset pattern as Figure 3b showed that, in updated dataset I, the minority cases still follow the original distribution (i.e., normal distribution). The same result applied in dataset II as the similar distribution found in the original dataset (Figure 3c) and updated dataset after SMOTE implementation (Figure 3d). A similar pattern appears in dataset III, as the updated dataset (Figure 3f) still follows the original pattern of the old dataset (Figure 3e). SMOTE algorithm uses oversampling where synthetic instances are added, which are “close to” the given sample of minority cases; thus, it maintains the originality the distribution of dataset. The conventional classification algorithms aim to minimize the number of errors that are made during learning process. Hence, when the dataset is balanced it is expected to enhance the classifier accuracy.

4.3. Random Forest

The RF algorithm is a type of classification method that is formed via combining decision trees. Past study described a randomization approach that works way better with bagging or random space method [46]. The randomization introduced by bootstrap sampling of the original data and at the node level when growing the tree. RF chooses just a random subset of factors at every node and uses them as contenders to locate the best split for the node. The generation of each tree in RF is presented in Algorithm 2.
Algorithm 2. Pseudocode for Random Forest
Input: dataset D, ensemble size T, subspace dimension d
Output: average of prediction from tree models
for t = 1 to T do
  build a bootstrap sample D t from D
  select d features randomly and reduce dimensionality of D t accordingly
  train a tree model M t on D t
  split on the best feature in d
  let the M t growing without pruning
end
The RFs overcome several problems with decision trees, such as reduction in overfitting and generate low variance. In this study, the outlier data from diabetes and hypertension are removed by DBSCAN-based outlier detection, and the SMOTE is utilized to balance the dataset. Finally, RF is utilized to learn from the training set, and the result of prediction is then compared with the testing set in order to obtain the model accuracy.
A single output prediction has four different potential outcomes, as depicted in Table 6. The true positive (TP) and true negative (TN) are correct classifications. False positive (FP) occurs when the output is incorrectly predicted as yes (positive) when it is actually no (negative), while false negative (FN) occurs when the output is incorrectly predicted as no (negative) when it is actually yes (positive). For datasets I and III, the patients that are diagnosed with diabetes are defined as “Yes” class, while for dataset II, the “Yes” class reveal the patients who diagnosed with hypertension. In order to train and test the entire classification model, 10 fold cross validation was used. The final performance measure will be the average of all test performances of all folds. The application of classification models for all dataset is performed by Weka Software 3.6.15 [60]. The performance metrics of the classification model were calculated based on precision, recall, specificity, F1 score, and accuracy, and they are exhibited in Table 7.

5. Results and Discussion

This section is comprised of the performance evaluation of HPM, the impact of DBSCAN-based outlier detection and SMOTE, and managerial implication of the proposed model. The detail discussion of each part is presented one by one as subsection in detail.

5.1. Performance Evaluation of Hybrid Prediction Model

The proposed HPM is compared with other classification algorithms as well as the results from previous studies. The HPM is applied for dataset I to foresee either the subject is diagnosed with diabetes or not with several input of risk factors. Table 8 showed the detail performance of HPM, as well as other conventional classification models. The result showed that the proposed HPM outperformed traditional models such as SVM, Multilayer Perceptron (MLP), Logistic regression, Naïve Bayes, C4.5 and RF in term of precision, recall, F1 score, and accuracy. Furthermore, the proposed HPM is compared to a previous study conducted by Wu et al. [14], and it shows better performance in model accuracy. The accuracy of proposed model achieved highest value as much as 92.555% when compared to the previous study (90.7%). Wu et al. combined K-means and the logistic regression model to predict the existence of diabetes [14]. The improved K-means algorithm was used to eliminate incorrectly clustered data; afterwards, the logistic regression algorithm was applied to classify the remaining data. The feature selection is different compared to our study, as their study utilized 12 significant attributes and the decision was based on the comparison with the attributes of the Pima Dataset [62] and some clinical experience. Our study utilized IG for feature selection, and finally decided that nine significant attributes are utilized to build the classifier model. Overall, we can conclude that the proposed HPM perform better with regard to model accuracy when compared with other models.
In order to validate the prediction accuracy and adaptability of present model, the hypertension dataset (dataset II) that was provided by Golino et al. was used [19]. The classification models are expected to predict whether the subject is diagnosed with hypertension or not given several features, such as Obesity, WHR, HC, BMI, WC, and Age. Table 9 shows the detail performance of proposed HPM as well as other conventional classification models, such as SVM, MLP, Logistic Regression, Naïve Bayes, C4.5, and RF. The findings revealed that the proposed HPM excelled traditional models with respect to precision, recall, F1 score, and accuracy of the model. Furthermore, the proposed HPM is compared with past work by Golino et al., which used Classification and Regression Tree (CART) to predict the hypertension [19]. Regarding the feature selection, we have followed a previous scenario [19] by utilizing all of the features from the dataset. The proposed HPM showed better performance, as the recall and specificity are 70.270% and 82.203%, respectively, when compared the previous study (52.38% and 69.70%). Overall, we can conclude that the proposed HPM achieved highest performance (up to 76.419%) as compared to other models.
Finally, the proposed HPM is compared with conventional classification algorithms and applied to the dataset III to reveal the relationship between age, hypertension, and diabetes. Table 10 showed the detail performance of HPM as well as other conventional classification models, such as SVM, MLP, Logistic Regression, Naïve Bayes, C4.5, and RF. The result showed that the proposed HPM outperformed traditional model as much as 83.665%, 84.677%, 84.168%, and 83.644% for precision, recall, F1 score, and accuracy, respectively. However, for specificity, the C4.5 performed better, as the result achieved as much as 88.123% when compared to 82.553% in our proposed model. Overall, the proposed HPM achieved highest performance (accuracy up to 83.644%) as compared to other models. The attributes of dataset III are age and the current state whether the subject is diagnosed with hypertension, while the output class is whether the subject diagnosed with diabetes or not. In dataset III, the value of hypertension attribute depends on the input blood pressure of the subject. The subject has hypertension when systolic blood pressure ≥140 mmHg and diastolic blood pressure ≥90 mmHg. The proposed HPM successfully predicts the presence of diabetes given input, such as age and blood pressure from users. Finally, we can conclude that there are significant risk factors on diabetes, such as age and blood pressure/hypertension.
A series of experiments were conducted on three datasets and concluded that the proposed HPM showed significant improvement when compared to other classification methods. The proposed HPM consists of DBSCAN-based outlier detection, SMOTE, and RF classifier. In terms of model accuracy, the proposed HPM can be considered as the improvement of conventional RF as it performs consistently better than the traditional one.
The proposed HPM utilizes DBSCAN-based outlier detection to remove the noise/outlier data. Furthermore, the imbalance class distribution appears in three datasets, and the SMOTE is applied to balance the dataset. The combination of DBSCAN-based outlier detection and SMOTE has improved the performance of the model. The details on the impact of DBSCAN-based outlier detection and SMOTE are presented in the following subsection.

5.2. Impact of DBSCAN and SMOTE

In this part, the impact of DBSCAN-based outlier detection on the accuracy of RF classifier is presented. The detail size of original dataset before and after DBSCAN-outlier detection was presented in Table 4. The accuracy of RF classifier for the original dataset are 89.33%, 66.86%, and 77.14% for dataset I, II, and III, respectively. There were slightly improved for two datasets after the implementation of DBSCAN-based outlier detection. After removing the noise/outlier data, the result of RF classifier are 89.17%, 69.68%, and 79.11% for datasets I, II, and III, respectively. The result showed that by integrating DBSCAN-based outlier detection with the RF model, the average from the three datasets increased as much as 1.543% for model accuracy when compared to conventional RF. The detailed impact of DBSCAN-based outlier detection on improving the accuracy of RF classifier can be seen in Figure 4a. Overall, we can conclude that by integrating DBSCAN-based outlier detection on the RF classifier, it will enhance the model accuracy.
Furthermore, we combined the result from DBSCAN-based outlier detection with SMOTE, and the model accuracy is presented for RF Classifier. Table 11 showed the detail of estimation of distribution of minority cases for three datasets. The estimated distribution of minority cases is defined as total number of minority cases over total number of instances. The original size of dataset I, II, and III after outlier removal from DBSCAN are 351, 155, and 359, respectively. As increasing the distribution of minority cases, the number of instance of minority class also increase. Originally, dataset I is an imbalanced dataset where the minority cases (the subjects who diagnoses as diabetes) are 48 instances, while the majority cases (normal subjects) are 303 instances. After SMOTE implementation with 500% increase on minority cases, the updated dataset is becoming more balance with its minority cases is 288 (out of 591). The imbalanced dataset is also present in datasets II and III, in which numbers of minority cases are 37 (out of 155) and 124 (out of 359). By applying SMOTE with 200% and 100% increases, the updated dataset II and III become more balanced, where numbers of minority cases are 111 (out of 229) and 248 (out of 483).
Finally, the model accuracy of DBSCAN-based outlier detection with different percent of SMOTE increase is presented for RF classifier. Figure 4b manifests the model accuracy on different distribution of minority cases. For all three datasets, the small increasing of distribution of minority cases will slightly reduce the model accuracy. However, once the datasets achieve balance condition (when the distribution of minority cases approximately close to 0.5), the model accuracy of RF classifier presents its best performance. As average from three dataset, by applying SMOTE, there was increasing as much as 4.885% for the model accuracy when compared to conventional RF without SMOTE integration. After SMOTE integration, the RF classifier can achieve the model accuracy by up to 92.555%, 76.419%, and 83.644% for dataset I, II, and III, respectively. Overall, we can conclude that integrating DBSCAN-based outlier detection, SMOTE for balancing the dataset and RF for classifier model will improve the accuracy of the model.

5.3. Managerial Implications

Rodriguez-Rodriguez et al. revealed that recent technologies, such as IoT, big data, cloud computing, novel biosensors, and machine learning can perform significant part in improving the diabetes management [38]. The previous studies have shown significant results with the implementation of IoT in healthcare systems. Dziak et al. proposed an IoT-based Information System for Healthcare Applications that enables the localization of a monitored person [63]. The proposed system successfully categorizes present activities of patients as normal, suspicious, or dangerous, which are utilized to inform the healthcare staff about potential problems. Park et al. proposed an IoT System for the remote monitoring of patients at home and utilized Personal Healthcare Devices (PHDs) that sense and calculate persons’ biomedical signals [64]. The proposed system informs medical staffs when the patients encounter emergency situations in real-time. Due to successful IoT implementation from previous studies, the results of our study also could be applied to IoT-based Health-care Monitoring Systems. Figure 5a showed the proposed IoT-based Health-care Monitoring that can be utilized by individuals to record their risk factors as well as predicting the presence of hypertension and diabetes. The final end-user application, such as an Android app, collects the vital signs data from sensor device: i.e., weight scale through Bluetooth Low Energy (BLE) communication. The user weight data from BLE-based sensor device is combined with other risk factors some of which are DOB (date of birth), height, HC (hip circumference), and WC (waist circumference) are sent to the Representational State Transfer (REST API) to be stored in a secure remote server. As the count of devices gathering health data of patient grows, the chances of using new kind of applications that can handle the input of big amounts of health data (big data), such as NoSQL database, also grows. The proposed IoT-based Health-care Monitoring system utilized NoSQL MongoDB to store the user data, including their detail of health condition. Finally, the proposed HPM is utilized to predict the presence of hypertension and diabetes by providing risk factors input by the user. The result of prediction is delivered to individual’s smartphone app.
Figure 5b shows the weight data from BLE-based sensor device is combined with other risk factors that are manually defined by the user. The sensor data from BLE-based weight scale (i.e., Mi Scale) is delivered to the Android app by BLE communication. BLE is the right option for sending sensor data wirelessly while keeping low power consumption [65,66,67]. Communication between the BLE-based sensors and a smartphone is explained with the help of Generic Attributes (GATT) [68]. A prototype of an Android app was developed to retrieve the weight data from BLE-based sensor devices to smartphone. By pressing the “send” button, the input user risk factors are stored in the remote server, and the proposed HPM is triggered to predict the presence of hypertension as well as diabetes for the user. Figure 5c shows the interface of the app when the user receives the prediction from HPM. By utilizing the IoT-based Health-care Monitoring System, the history of user health data can be presented. Also, the prediction results from the proposed HPM can be accessed by user through their Android app; thus, it is expected to help users in finding the danger of diabetes and hypertension efficiently at initial phase.

6. Conclusions

The present study proposed HPM by combining DBSCAN-based outlier detection, SMOTE, and RF classifier. The proposed model is believed to help users to find the danger of diabetes and hypertension at the initial phase. Three datasets that are related with diabetes and hypertension are utilized in this study. The HPM is applied for dataset I, to foresee the existence of diabetes given input of several risk factors. Dataset II reveals risk factor for hypertension, and the proposed HPM is expected to predict the presence of hypertension. Finally, dataset III revealed the relationship between age, hypertension, and diabetes. The result showed that the proposed HPM outperformed the conventional classification models as well as models that are presented from previous studies with an accuracy up to 92.555%, 76.419%, and 83.644% for datasets I, II, and III, respectively. In addition, the IG technique can be applied to evaluate the significant of features from all datasets; thus, the highest risk factors of diabetes as well as hypertension can be extracted. Furthermore, the result of this study also revealed a significant relationship between the age, hypertension/blood pressure, and diabetes as presented in dataset III. The proposed HPM successfully detected the presence of diabetes given age and blood pressure as inputs. Therefore, the age and blood pressure can be considered as high-risk factors for detecting diabetes.
The proposed HPM could be integrated with an IoT-based Health-care Monitoring System. The IoT-based Health-care Monitoring System utilizes an Android app to gather the vital signs data (i.e., weight data) from sensor devices through Bluetooth Low Energy (BLE) communication. The data is then combined with other risk factors and stored in a remote server, which utilizes NoSQL MongoDB, so that the voluminous incoming health data can be handled efficiently. Finally, the IoT-based Health-care monitoring system provides the prediction result from the proposed HPM and transmits it to the user’s Android app; thus, it would assist users in finding the danger of diabetes and hypertension in efficient way.
The comparison with other prediction models, as well as evaluation of other clinical datasets, needs to be considered in the near future. Furthermore, once the model validation is performed in other datasets, other risk factors that are affecting hypertension as well as diabetes can be revealed.

Author Contributions

J.R. conceived and designed the experiments; G.A. and M.S. performed the experiments; M.F.I. analyzed the data; G.A. and M.F.I. wrote the paper.

Funding

This research was financially supported by the Ministry of Trade, Industry and Energy (MOTIE) and Korea Institute for Advancement of Technology (KIAT) through the International Cooperative R&D program (N0002301); 2018 Research Fund Program (Strategy Research Group) through Dongguk University.

Conflicts of Interest

The authors declare no conflict of interest.

References

  1. World Health Organization. Definition, Diagnosis, and Classification of Diabetes Mellitus and Its Complications. Part 1: Diagnosis and Classification of Diabetes Mellitus; World Health Organization: Geneva, Switzerland, 1999. [Google Scholar]
  2. American Diabetes Association. Standards of medical care in diabetes—2006. Diabetes Care 2006, 29, s4–s42. [Google Scholar]
  3. Acciaroli, G.; Vettoretti, M.; Facchinetti, A.; Sparacino, G. Calibration of minimally invasive continuous glucose monitoring sensors: State-of-the-art and current perspectives. Biosensors 2018, 8, 24. [Google Scholar] [CrossRef] [PubMed]
  4. Rubino, F. Is type 2 diabetes an operable intestinal disease? A provocative yet reasonable hypothesis. Diabetes Care 2008, 31, S290–S296. [Google Scholar] [CrossRef] [PubMed]
  5. Tun, N.N.; Arunagirinathan, G.; Munshi, S.K.; Pappachan, J.M. Diabetes mellitus and stroke: A clinical update. World J. Diabetes 2017, 8, 235. [Google Scholar] [CrossRef] [PubMed]
  6. American Diabetes Association. Introduction: Standards of Medical Care in Diabetes—2018. Diabetes Care 2018, 41, S1–S2. [Google Scholar] [CrossRef]
  7. Hayes, C.; Kriska, A. Role of physical activity in diabetes management and prevention. J. Am. Diet. Assoc. 2008, 108, S19–S23. [Google Scholar] [CrossRef] [PubMed]
  8. Ley, S.H.; Hamdy, O.; Mohan, V.; Hu, F.B. Prevention and management of type 2 diabetes: Dietary components and nutritional strategies. Lancet 2014, 383, 1999–2007. [Google Scholar] [CrossRef]
  9. A Global Brief on Hypertension: Silent Killer, Global Public Health Crisis: World Health Day 2013. Available online: http://ish-world.com/downloads/pdf/global_brief_hypertension.pdf (accessed on 3 July 2018).
  10. Merai, R.; Siegel, C.; Rakotz, M.; Basch, P.; Wright, J.; Wong, B.; DHSc; Thorpe, P. CDC Grand Rounds: A Public Health Approach to Detect and Control Hypertension. MMWR Morb. Mortal. Wkly. Rep. 2016, 65, 1261–1264. [Google Scholar] [CrossRef] [PubMed] [Green Version]
  11. Yoon, S.S.; Fryar, C.D.; Carroll, M.D. Hypertension Prevalence and Control among Adults: United States, 2011–2014. NCHS Data Brief 2015, 220, 1–8. Available online: https://www.cdc.gov/nchs/data/databriefs/db220.pdf (accessed on 3 July 2018).
  12. Go, A.; Mozaffarian, D.; Roger, V.; Benjamin, E.; Berry, J.; Borden, W.B.; Bravata, D.M.; Dai, S.; Ford, E.S.; Fox, C.S.; et al. Heart disease and stroke statistics—2013 update: A report from the American Heart Association. Circulation 2013, 127, 143–152. [Google Scholar] [CrossRef] [PubMed]
  13. Patil, B.M.; Joshi, R.C.; Toshniwal, D. Hybrid prediction model for Type-2 diabetic patients. Expert Syst. Appl. 2010, 37, 8102–8108. [Google Scholar] [CrossRef]
  14. Wu, H.; Yang, S.; Huang, Z.; He, J.; Wang, X. Type 2 diabetes mellitus prediction model based on data mining. Inform. Med. Unlocked 2018, 10, 100–107. [Google Scholar] [CrossRef]
  15. Meng, X.; Huang, Y.; Rao, D.; Zhang, Q.; Liu, Q. Comparison of three data mining models for predicting diabetes or prediabetes by risk factors. Kaohsiung J. Med. Sci. 2013, 29, 93–99. [Google Scholar] [CrossRef] [PubMed]
  16. Farran, B.; Channanath, A.M.; Behbehani, K.; Thanaraj, T.A. Predictive models to assess risk of type 2 diabetes, hypertension and comorbidity: Machine-learning algorithms and validation using national health data from Kuwait—A cohort study. BMJ Open 2013, 3, e002457. [Google Scholar] [CrossRef] [PubMed]
  17. Koren, G.; Nordon, G.; Radinsky, K.; Shalev, V. Machine learning of big data in gaining insight into successful treatment of hypertension. Pharmacol. Res. Perspect. 2018, 6, e00396. [Google Scholar] [CrossRef] [PubMed] [Green Version]
  18. Tayefi, M.; Esmaeili, H.; Karimian, M.S.; Zadeh, A.A.; Ebrahimi, M.; Safarian, M.; Nematy, M.; Parizadeh, S.M.R.; Ferns, G.A.; Ghayour-Mobarhan, M. The application of a decision tree to establish the parameters associated with hypertension. Comput. Methods Programs Biomed. 2017, 139, 83–91. [Google Scholar] [CrossRef] [PubMed]
  19. Golino, H.F.; Amaral, L.S.B.; Duarte, S.F.P.; Gomes, C.M.A.; Soares, T.J.; Reis, L.A.; Santos, J. Predicting Increased Blood Pressure Using Machine Learning. J. Obes. 2014, 2014, 637635. [Google Scholar] [CrossRef] [PubMed]
  20. Nai-arun, N.; Moungmai, R. Comparison of classifiers for the risk of diabetes prediction. Procedia Comput. Sci. 2015, 69, 132–142. [Google Scholar] [CrossRef]
  21. Alghamdi, M.; Al-Mallah, M.; Keteyian, S.; Brawner, C.; Ehrman, J.; Sakr, S. Predicting diabetes mellitus using SMOTE and ensemble machine learning approach: The Henry Ford ExercIse Testing (FIT) project. PLoS ONE 2017, 12, e0179805. [Google Scholar] [CrossRef] [PubMed]
  22. Sakr, S.; Elshawi, R.; Ahmed, A.; Qureshi, W.T.; Brawner, C.; Keteyian, S.; Blaha, M.J.; Al-Mallah, M.H. Using machine learning on cardiorespiratory fitness data for predicting hypertension: The Henry Ford ExercIse Testing (FIT) Project. PLoS ONE 2018, 13, e0195344. [Google Scholar] [CrossRef] [PubMed]
  23. Sun, J.; McNaughton, C.D.; Zhang, P.; Perer, A.; Gkoulalas-Divanis, A.; Denny, J.C.; Kirby, J.; Lasko, T.; Saip, A.; Malin, B.A. Predicting changes in hypertension control using electronic health records from a chronic disease management program. J. Am. Med. Inform. Assoc. 2014, 21, 337–344. [Google Scholar] [CrossRef] [PubMed] [Green Version]
  24. Hao, S.; Zhou, X.; Song, H. A new method for noise data detection based on DBSCAN and SVDD. In Proceedings of the 2015 IEEE International Conference on Cyber Technology in Automation, Control, and Intelligent Systems (CYBER), Shenyang, China, 8–12 June 2015; pp. 784–789. [Google Scholar] [CrossRef]
  25. ElBarawy, Y.M.; Mohamed, R.F.; Ghali, N.I. Improving social network community detection using DBSCAN algorithm. In Proceedings of the 2014 World Symposium on Computer Applications & Research (WSCAR), Sousse, Tunisia, 18–20 January 2014; pp. 1–6. [Google Scholar] [CrossRef]
  26. Alfian, G.; Syafrudin, M.; Rhee, J. Real-Time Monitoring System Using Smartphone-Based Sensors and NoSQL Database for Perishable Supply Chain. Sustainability 2017, 9, 2073. [Google Scholar] [CrossRef]
  27. Abid, A.; Kachouri, A.; Mahfoudhi, A. Outlier detection for wireless sensor networks using density-based clustering approach. IET Wirel. Sens. Syst. 2017, 7, 83–90. [Google Scholar] [CrossRef]
  28. Tian, H.X.; Liu, X.J.; Han, M. An outliers detection method of time series data for soft sensor modeling. In Proceedings of the 2016 Chinese Control and Decision Conference (CCDC), Yinchuan, China, 28–30 May 2016; pp. 3918–3922. [Google Scholar] [CrossRef]
  29. Yan, B.; Han, G.; Sun, M.; Ye, S. A novel region adaptive SMOTE algorithm for intrusion detection on imbalanced problem. In Proceedings of the 3rd IEEE International Conference on Computer and Communications (ICCC), Chengdu, China, 13–16 December 2017; pp. 1281–1286. [Google Scholar] [CrossRef]
  30. Sun, J.; Lang, J.; Fujita, H.; Li, H. Imbalanced enterprise credit evaluation with DTE-SBD: Decision tree ensemble based on SMOTE and bagging with differentiated sampling rates. Inf. Sci. 2018, 425, 76–91. [Google Scholar] [CrossRef]
  31. Le, T.; Lee, M.Y.; Park, J.R.; Baik, S.W. Oversampling Techniques for Bankruptcy Prediction: Novel Features from a Transaction Dataset. Symmetry 2018, 10, 79. [Google Scholar] [CrossRef]
  32. Jin, O.; Qu, L.; He, J.; Li, X. Recognition of New and Old Banknotes Based on SMOTE and SVM. In Proceedings of the 2015 IEEE 12th International Conference on Ubiquitous Intelligence and Computing and 2015 IEEE 12th International Conference on Autonomic and Trusted Computing and 2015 IEEE 15th International Conference on Scalable Computing and Communications and Its Associated Workshops (UIC-ATC-ScalCom), Beijing, China, 10–14 August 2015; pp. 213–220. [Google Scholar] [CrossRef]
  33. Gao, M.; Hong, X.; Chen, S.; Harris, C.J. A combined SMOTE and PSO based RBF classifier for two-class imbalanced problems. Neurocomputing 2011, 74, 3456–3466. [Google Scholar] [CrossRef]
  34. Verbiest, N.; Ramentol, E.; Cornelis, C.; Herrera, F. Preprocessing noisy imbalanced datasets using SMOTE enhanced with fuzzy rough prototype selection. Appl. Soft Comput. 2014, 22, 511–517. [Google Scholar] [CrossRef]
  35. Sáez, J.A.; Luengo, J.; Stefanowski, J.; Herrera, F. SMOTE–IPF: Addressing the noisy and borderline examples problem in imbalanced classification by a re-sampling method with filtering. Inf. Sci. 2015, 291, 184–203. [Google Scholar] [CrossRef]
  36. Douzas, G.; Bacao, F.; Last, F. Improving Imbalanced Learning Through a Heuristic Oversampling Method Based on K-Means and SMOTE. Inf. Sci. 2018, 465, 1–20. [Google Scholar] [CrossRef]
  37. Wang, K.-J.; Makond, B.; Chen, K.-H.; Wang, K.-M. A hybrid classifier combining SMOTE with PSO to estimate 5-year survivability of breast cancer patients. Appl. Soft Comput. 2014, 20, 15–24. [Google Scholar] [CrossRef]
  38. Rodríguez-Rodríguez, I.; Zamora-Izquierdo, M.-Á.; Rodríguez, J.-V. Towards an ICT-based platform for type 1 diabetes mellitus management. Appl. Sci. 2018, 8, 511. [Google Scholar] [CrossRef]
  39. Wild, S.; Roglic, G.; Green, A.; Sicree, R.; King, H. Global prevalence of diabetes: Estimates for the Year 2000 and projections for 2030. Diabetes Care 2004, 27, 1047–1053. [Google Scholar] [CrossRef] [PubMed]
  40. Chobanian, A.V.; Bakris, G.L.; Black, H.R.; Cushman, W.C.; Green, L.A.; Izzo, J.L., Jr.; Jones, D.W.; Materson, B.J.; Oparil, S.; Wright, J.T., Jr.; et al. Seventh report of the Joint National Committee on prevention, detection, evaluation, and treatment of high blood pressure. Hypertension 2003, 42, 1206–1252. [Google Scholar] [CrossRef] [PubMed]
  41. Roger, V.L.; Go, A.S.; Lloyd-Jones, D.M.; et al. American Heart Association Statistics Committee and Stroke Statistics Subcommittee. Heart disease and stroke statistics—2012 update: A report from the American Heart Association. Circulation 2012, 125, e2–e220. [Google Scholar] [CrossRef] [PubMed]
  42. Yoon, S.S.; Burt, V.; Louis, T.; Carroll, M.D. Hypertension among Adults in the United States, 2009–2010. NCHS Data Brief 2012, 1–8. Available online: https://www.cdc.gov/nchs/data/databriefs/db107.pdf (accessed on 3 July 2018).
  43. Lewington, S.; Clarke, R.; Qizilbash, N.; Peto, R.; Collins, R.; Prospective Studies Collaboration. Age-specific relevance of usual blood pressure to vascular mortality: A meta-analysis of individual data for one million adults in 61 prospective studies. Lancet 2002, 360, 1903–1913. [Google Scholar] [CrossRef] [PubMed]
  44. Wei, Y.-C.; George, N.I.; Chang, C.-W.; Hicks, K.A. Assessing sex differences in the risk of cardiovascular disease and mortality per increment in systolic blood pressure: A systematic review and meta-analysis of follow-up studies in the United States. PLoS ONE 2017, 12, e0170218. [Google Scholar] [CrossRef] [PubMed]
  45. Alloubani, A.; Saleh, A.; Abdelhafiz, I. Hypertension and diabetes mellitus as a predictive risk factors for stroke. Diabetes Metab. Syndr. Clin. Res. Rev. 2018, 12, 577–584. [Google Scholar] [CrossRef] [PubMed]
  46. Breiman, L. Random Forests. Mach. Learn. 2001, 45, 5–32. [Google Scholar] [CrossRef] [Green Version]
  47. Shin, K.; Abraham, A.; Han, S.Y. Improving kNN Text Categorization by Removing Outliers from Training Set. In Computational Linguistics and Intelligent Text Processing, CICLing 2006; Gelbukh, A., Ed.; Lecture Notes in Computer Science; Springer: Berlin/Heidelberg, Germany, 2006; Volume 3878. [Google Scholar]
  48. Tallón-Ballesteros, A.J.; Riquelme, J.C. Deleting or keeping outliers for classifier training? In Proceedings of the 2014 Sixth World Congress on Nature and Biologically Inspired Computing (NaBIC 2014), Porto, Portugal, 30 July–1 August 2014; pp. 281–286. [Google Scholar] [CrossRef]
  49. Podgorelec, V.; Hericko, M.; Rozman, I. Improving mining of medical data by outliers prediction. In Proceedings of the 18th IEEE Symposium on Computer-Based Medical Systems (CBMS’05), Dublin, Ireland, 23–24 June 2005; pp. 91–96. [Google Scholar] [CrossRef]
  50. Li, W.; Mo, W.; Zhang, X.; Squiers, J.J.; Lu, Y.; Sellke, E.W.; Fan, W.; DiMaio, J.M.; Thatcher, J.E. Outlier detection and removal improves accuracy of machine learning approach to multispectral burn diagnostic imaging. J. Biomed. Opt. 2015, 20, 121305. [Google Scholar] [CrossRef] [PubMed]
  51. Han, J.; Kamber, M.; Pei, J. Data Mining: Concepts and Techniques, 3rd ed.; Morgan Kaufmann Publishers: Burlington, MA, USA, 2011. [Google Scholar]
  52. Ester, M.; Kriegel, H.; Sander, J.; Xu, X. A density-based algorithm for discovering clusters in large spatial databases with noise. In Proceedings of the KDD’96 Proceedings of the Second International Conference on Knowledge Discovery and Data Mining, Portland, OR, USA, 2–4 August 1996. [Google Scholar]
  53. Chawla, N.V.; Bowyer, K.W.; Hall, L.O.; Kegelmeyer, W.P. SMOTE: Synthetic Minority Over-Sampling Technique. J. Artif. Intell. Res. 2002, 16, 321–357. [Google Scholar] [CrossRef]
  54. Willems, J.P.; Saunders, J.T.; Hunt, D.E.; Schorling, J.B. Prevalence of coronary heart disease risk factors among rural blacks: A community-based study. South. Med. J. 1997, 90, 814–820. [Google Scholar] [CrossRef] [PubMed]
  55. Diabetes Data. Available online: http://staff.pubhealth.ku.dk/~tag/Teaching/share/data/Diabetes.html (accessed on 3 July 2018).
  56. Men’s Dataset from the “Predicting Increased Blood Pressure Using Machine Learning” Paper. Available online: https://figshare.com/articles/Men_s_dataset_from_the_Predicting_increased_blood_pressure_using_Machine_Learning_paper/845665/1 (accessed on 3 July 2018).
  57. Chronic_Kidney_Disease Data Set. Available online: https://archive.ics.uci.edu/ml/datasets/chronic_kidney_disease (accessed on 3 July 2018).
  58. Blum, A.L.; Langley, P. Selection of relevant features and examples in machine learning. Artif. Intell. 1997, 97, 245–271. [Google Scholar] [CrossRef]
  59. Guyon, I.; Elisseeff, A. An introduction to variable and feature selection. J. Mach. Learn. Res. 2003, 3, 1157–1182. [Google Scholar]
  60. Weka 3: Data Mining Software in Java. Available online: https://www.cs.waikato.ac.nz/ml/weka/ (accessed on 3 July 2018).
  61. The R Project for Statistical Computing. Available online: https://www.r-project.org/ (accessed on 3 July 2018).
  62. Smith, J.W.; Everhart, J.E.; Dickson, W.C.; Knowler, W.C.; Johannes, R.S. Using the ADAP learning algorithm to forecast the onset of diabetes mellitus. In Proceedings of the Symposium on Computer Applications in Medical Care, Washington, DC, USA, 9 November 1988; Greenes, R.A., Ed.; IEEE Computer Society Press: Los Alamitos, CA, USA, 1988; pp. 261–265. Available online: https://www.ncbi.nlm.nih.gov/pmc/articles/PMC2245318/ (accessed on 1 March 2018).
  63. Dziak, D.; Jachimczyk, B.; Kulesza, W.J. IoT-Based Information System for Healthcare Application: Design Methodology Approach. Appl. Sci. 2017, 7, 596. [Google Scholar] [CrossRef]
  64. Park, K.; Park, J.; Lee, J. An IoT System for Remote Monitoring of Patients at Home. Appl. Sci. 2017, 7, 260. [Google Scholar] [CrossRef]
  65. Patel, M.; Wang, J. Applications, challenges, and prospective in emerging body area networking technologies. IEEE Wirel. Commun. 2010, 17, 80–88. [Google Scholar] [CrossRef]
  66. Liu, J.; Chen, C. Energy Analysis of Neighbor Discovery in Bluetooth Low Energy Networks; Technical Report; Nokia Research Center/Radio System Lab: Beijing, China, 2012. [Google Scholar]
  67. Gomez, C.; Oller, J.; Paradells, J. Overview and evaluation of Bluetooth low energy: An emerging low-power wireless technology. Sensors 2012, 12, 11734–11753. [Google Scholar] [CrossRef]
  68. GATT Overview. Available online: https://www.bluetooth.com/specifications/gatt/generic-attributes-overview (accessed on 14 May 2018).
Figure 1. Hybrid Prediction Model (HPM) for type 2 diabetes (T2D) and Hypertension.
Applsci 08 01325 g001
Figure 2. Optimal eps value and outliers are presented respectively for each dataset I (a,b); dataset II (c,d) and dataset III (e,f).
Applsci 08 01325 g002
Figure 3. Attribute Age before and after SMOTE implementation are presented, respectively, for each dataset I (a,b); II (c,d); and, III (e,f).
Applsci 08 01325 g003
Figure 4. Impact of outlier elimination (a) and distribution of minority cases (b) on model accuracy.
Applsci 08 01325 g004
Figure 5. Internet of Things (IoT)-based Health-care Monitoring System (a); input of risk factors (b), and the proposed HPM model predicts the presence of hypertension as well as diabetes (c).
Applsci 08 01325 g005
Table 1. The feature of dataset I and its Information Gain (IG) Rank.
FeatureExplanationIG Rank
stab.gluStabilized Glucose (mg/dL)0.24978
ageAge (years)0.076107
ratioCholesterol/ High Density Lipoproteins (HDL) Ratio0.044198
waistWaist (inches)0.035667
cholTotal Cholesterol (mg/dL)0.034227
bp.1sFirst Systolic Blood Pressure (mmHg)0.030449
frameA factor with levels (small, medium, large)0.014988
locationLocation of subject (Buckingham, Louisa)0.002732
genderGender of subject (male, female)0.000697
hdlHigh Density Lipoprotein (mg/dL)0
time.ppnPostprandial time when labs were drawn (minutes)0
heightHeight (inches)0
hipHip (inches)0
bp.2dSecond Diastolic Blood Pressure (mmHg)0
bp.2sSecond Diastolic Blood Pressure (mmHg)0
bp.1dFirst Diastolic Blood Pressure (mmHg)0
weightWeight (pounds)0
idSubject ID0
Table 2. The feature of dataset II and its Information Gain (IG) Rank.
FeatureExplanation IG Rank
is.obeseThe subject is obese (yes, no)0.0203
whrWaist hip ratio0
hcHip circumference (cm)0
bmiBody mass index (kg/m2)0
wcWaist circumference (cm)0
ageAge (years)0
idSubject ID0
Table 3. The feature of dataset III and its Information Gain (IG) Rank.
FeatureExplanationIG Rank
htnHypertension (yes, no)0.2732
ageAge (years)0.1199
bpBlood pressure (mmHg)0.0542
Table 4. The result of DBSCAN-based outlier detection.
Dataset# Instance (Original)# Instances (After Data Cleaning)MinPtseps# Outlier Data# Normal Data
I40338453633351
II1751755920155
III4003775618359
Table 5. Number of instances increase by Synthetic Minority Over Sampling Technique (SMOTE).
DatasetPercentage of SMOTE Increase (%)Class “Yes”Class “No”Total Instances
# Instance%# Instance%
I04813.6730386.33351
50028848.7330351.27591
II03723.8711876.13155
20011148.4711851.53229
III012434.5423565.46359
10024851.3523548.65483
Table 6. Different outcomes of two-class prediction.
Predicted as “Yes”Predicted as “No”
Actual “Yes”True Positive (TP)False Negative (FN)
Actual “No”False Positive (FP)True Negative (TN)
Table 7. Performance metrics for the classification model.
Performance MetricFormula
Precision TP / ( TP + FP )
Recall/Sensitivity TP / ( TP + FN )
Specificity/True Negative RateTN/(TN + FP)
F1 Score2 * (Precision * Recall)/(Precision + Recall)
Accuracy ( TP + TN ) / ( TP + TN + FP + FN )
Table 8. Performance evaluation of classification model for dataset I.
MethodPrecision (%)Recall/Sensitivity (%)Specificity (%)F1 Score (%)Accuracy (%)
SVM88.23541.09698.78856.07588.337
MLP74.54556.16495.75764.06288.586
Logistic Regression84.78353.42597.87965.54689.826
Naïve Bayes73.33360.27495.15166.16588.834
C4.568.42153.42594.5456087.097
Random Forest78.84656.16496.66765.689.33
Wu et al. (2018)91.696.4--90.7
Proposed HPM91.49793.40391.74992.44092.555
Table 9. Performance evaluation of classification model for dataset II.
MethodPrecision (%)Recall/Sensitivity (%)Specificity (%)F1 Score (%)Accuracy (%)
SVM16.6672.12896.0943.77470.857
MLP35.71410.63892.96916.39370.857
Logistic Regression408.51195.31214.03572
Naïve Bayes42.30823.40488.28130.13770.857
C4.528.5714.25596.0947.40771.429
Random Forest2814.89485.93719.44466.857
Golino et al. (2014)-52.3869.70--
Proposed HPM78.78870.27082.20374.28676.419
Table 10. Performance evaluation of classification model for dataset III.
MethodPrecision (%)Recall/Sensitivity (%)Specificity (%)F1 Score (%)Accuracy (%)
SVM72.10977.37284.29174.64881.909
MLP73.38174.45285.82473.91381.909
Logistic Regression71.72475.91284.29173.75981.407
Naïve Bayes73.05075.18285.44174.10181.909
C4.575.59070.07388.12372.72781.909
Random Forest67.16465.69383.14266.42177.136
Proposed HPM83.66584.67782.55384.16883.644
Table 11. Distribution of minority cases.
DatasetEstimated Distribution of Minority Cases% SMOTE Increase# Minority Cases (“Yes” Class)# Majority Cases (“No” Class)Total Number of Instance
I0.1048303351
0.27076303379
0.3170129303432
0.4350216303519
0.5500288303591
II0.2037118155
0.35055118173
0.413085118203
0.5200111118229
III0.30124235359
0.450186235421
0.5100248235483

