Experimental Research on Resilient Modulus of Silty Clay Modified by Oil Shale Ash and Fly Ash after Freeze-Thaw Cycles

1
College of transportation, Jilin University, Changchun 130022, China
2
Loess Earthquake Engineering Key Laboratory of China Earthquake Administration, Gansu 730030, China
*
Author to whom correspondence should be addressed.
Appl. Sci. 2018, 8(8), 1298; https://doi.org/10.3390/app8081298
Submission received: 10 July 2018
/
Revised: 30 July 2018
/
Accepted: 2 August 2018
/
Published: 4 August 2018
(This article belongs to the Section Materials Science and Engineering)
Abstract
:To dispose of the large amount of OSA (oil shale ash) and FA (fly ash) in Northeast China, a novel subgrade material obtained by modifying SC (silty clay) with OSA and FA was produced. First, the effect of F-T (freeze-thaw) cycles and stress states on the resilient modulus of unmodified SC and the modified SC were investigated. Second, the damage ratio was introduced to describe the relationship of resilient modulus versus F-T cycles. Third, the effect of F-T cycles on the microstructure of soils was investigated. The results indicate that in addition to stress state, resilient modulus is significantly influenced by F-T cycles. For unmodified SC, the resilient modulus continually decreases with increasing F-T cycles. As for the modified soil, the resilient modulus decreases sharply after the first F-T cycle and then tends to be stable. The damage ratio and its fitting equation are effectively adopted to describe the variation characteristic of the resilient modulus after F-T cycles. As observed from SEM testing, the effect of F-T cycles on soils is to destroy the initial structure and increase the porosity of soils. It could be concluded that the microstructure change during F-T cycles is the main factor that results in the decrease of the resilient modulus.
1. Introduction
Northeastern China is one of the most important energy production and consumption regions of China. An increasing number of industrial wastes are produced year on year, such as fly ash (FA), slag, and oil fuel ash [1,2]. Oil shale ash (OSA) is the by-product of oil shale, which is considered as a substitute for conventional oil. Because of the low oil extraction from oil shale, a large amount of OSA has accumulated, which has been an urgent problem to be solved [3,4].
Soil stabilization is an effective measure to recycle residue wastes [5,6]. Compared with use in construction materials, such as cement, asphalt, and concrete, the application of waste residues in soil stabilization has the advantages of high utilization, low price, and simple technology. The stabilized soils often possess greater strength, swell properties, or resistance to erosion after freeze–thaw (F-T) cycles [7]. FA is one of the most commonly used additives. Parsons and Milburn [8] stabilized several different types of soils by using Class C FA. The strength and durability tests indicated that the FA-treated soils showed substantial improvement in soil performance for multiple soils. Prabakar et al. [9] mixed different percentages of FA with soft soils and investigated the usefulness of FA as a soil additive. The result revealed that the CBR (California bearing ratio) and shear strength of the mixed soils increased with increasing FA percentage.
Many attempts have also been made to utilize OSA in soil stabilization. Turner [10] studied the viability of using soils stabilized by OSA as subgrade filling based on compaction, unconfined compression, durability, and resilient modulus test. It was found that the significant increase in strength, durability, and resilient modulus was due to the cementing property of OSA. The testing data and the mixture design of the modified soil are an important reference for use in highway construction. Mymrin et al. [11] investigated the physicochemical interaction and structure formation processes of several types of clayed soils with OSA. The obtained results showed that after hydration, the strength of the mixture increased as a result of the partial dissolution of the surface of hard particles and the growth of flocculation formations. In fact, the great engineering property of OSA-stabilized soils is mainly attributed to the cementing property of OSA [10,12,13]. It has been revealed in previous literature that the combination of fuel ash waste and FA as additives has a significant effect on soil stabilization [14,15]. However, research on the application of soils stabilized by both OSA and FA is scarce, especially on the dynamic resilient modulus of the modified soil.
As the most important index in pavement structure design, dynamic resilient modulus can truly reflect the dynamic mechanical property of subgrade materials subjected to repeated traffic loading. Previous studies have focused on the influencing factors of resilient modulus, such as stress state, moisture content, and physical properties of subgrade materials. Uzan [16] established the prediction model of resilient modulus relating to shear stress and bulk stress. This model was then revised by introducing confining pressure and deviator stress [17]. In consideration of the main influencing factors of resilient modulus, a formula was also given to predict the resilient modulus in pavement design by AASHTO (American Association of State Highway and Transportation Officials) [18]. According to the deformation characteristics for a series of subbase and subgrade materials, Lee et al. [19] created the relationship between resilient modulus and elastic modulus. Subgrade materials are usually subjected to partially saturated conditions or regular moisture variation affected by seasonal variation. To obtain more effective constitutive models for unsaturated soils, an enhanced method incorporating matric suction with stress factors to calculate resilient modulus was proposed [20]. Zhu et al. [21] discussed the influence of initial modulus and stress path on resilient modulus by comparing the strength and deformation of two coarse-grained soils.
In addition to stress states and physical properties of subgrade materials, resilient modulus is significantly affected by external environmental factors, especially F-T cycles. For materials in seasonally frozen areas, the performance reduction caused by F-T cycles should be considered in construction design. Qi et al. [22,23] measured the resilient modulus after one F-T cycle and recognized a significant modulus reduction. Moreover, he found that after F-T cycles, the porosity of compacted soils became larger, but the porosity of loose soils became smaller. Lee et al. [24] defined Su1%, which represents the stress at the axial strain of 1% in unconfined compression tests. Their studies demonstrated that the performance reduction effect exhibited after the first F-T cycle is about 50% when Su1% is greater than 103 kPa. The obvious reduction effect was also verified by Simonsen et al. based on measuring properties of several road materials after F-T cycles [25]. Existing experimental studies about the influence of F-T cycles on soil property have provided valuable results. The physical and mechanical property of soils modified by multiple additives such as FA and OSA are unknown and worth studying. To evaluate the performance of a modified material as subgrade filling in seasonally frozen regions, it is necessary and crucial to master the variation characteristics of its dynamic resilient modulus after multiple F-T cycles.
In this study, a novel subgrade material obtained by modifying silty clay (SC) with OSA and FA was produced. The dynamic resilient moduli of unmodified SC and the modified SC under different stress states and F-T cycles were measured. The influence of various factors such as confining pressure, deviator stress, and F-T cycles on the resilient modulus for the two materials were analyzed. The damage ratio and its fitting equation were adopted to describe the relationship of resilient modulus versus F-T cycles. To better investigate the influence of F-T cycles on resilient modulus for test soils, SEM testing was conducted to analyze the variation characteristics of microstructure and pore distribution of soils.
2. Materials and Methods
2.1. Materials
2.1.1. Raw Materials
The SC used in this text is the typical subgrade material in Northeast China, which has the characteristics of low liquid limit and frost heave sensitivity. The strength of SC is high but decreases significantly with the increase of moisture content. Its CBR (California bearing ratio) value soaked after 96 hours is 1%, which is far lower than the allowable value of subgrade filling in Chinese specifications [26]. The physical properties of SC were obtained by parallel tests, and the results are listed in Table 1.
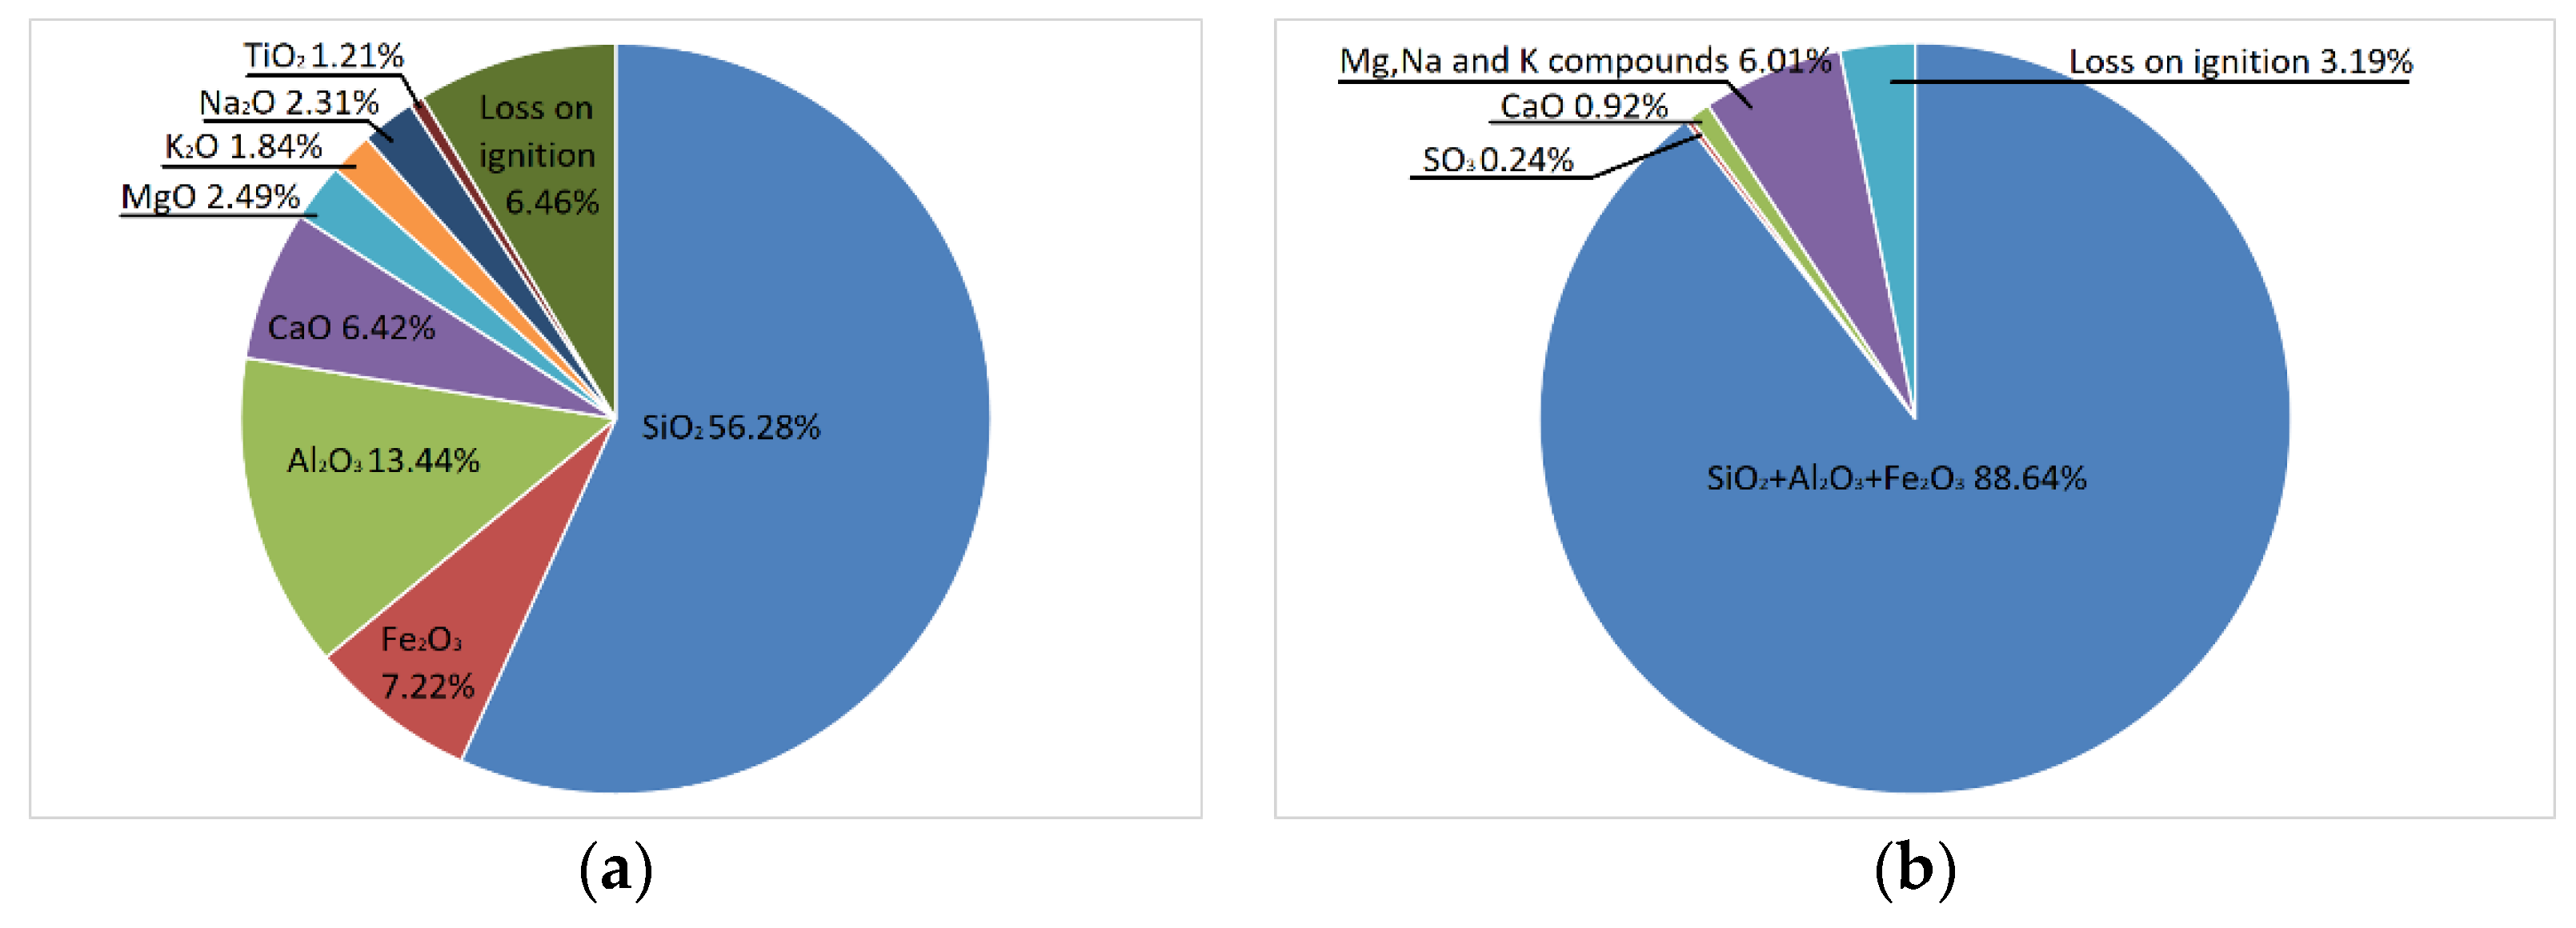
OSA was crushed to filter size from OSSC (oil shale semi-coke), which was provided by Wangqing County of Jilin Province. The OSSC is black solids characterized by a considerable carbon content, a high number of mineral compounds, and a small amount of sulphide [27,28]. FA was obtained from Changchun power plant of Jilin province, the classification of which is Class F Grade 1 [29]. The chemical composition of OSA and FA are shown in Figure 1.
2.1.2. Mixed Materials
First, all raw materials were dried and sieved through the size of 2 mm. Then, the materials were mixed at the dry mass ratio of OSA/FA/SC of 2:1:2 in the optimum moisture of 15%. This dry mass ratio was determined by a serious of conventional physical and mechanical property tests [30,31]. The modified soil at this ratio possesses the highest CBR value, great shear strength, appropriate physical properties, and a balanced usage ratio of FA, OSA, and SC. Consequently, the mixed soils were wrapped in plastic bags and put in the humidor for 3 days to diffuse the moisture through the soils evenly. This humidor is widely used for materials curing, such as soils, concrete, and so on. The settings for temperature and humidity were 20 °C and 70%, respectively. Its CBR value after soaking for 96 h is about 20%, which meets the standard of subgrade for the highest-grade highway [26]. The physical properties of the modified soils were also obtained by parallel tests, and are listed in Table 1.
2.2. Methods
2.2.1. Preparing of Test Samples
According to the impact molding method of Chinese specifications [32], the test soils were made into cylinder samples (diameter of 50 mm, height of 100 mm) with their optimum moisture contents (the optimum moisture contents of unmodified soil and the modified soil are 12.2% and 15.0%, respectively). They were compacted at the lowest compaction standard of high-grade highway subgrade (96%).
2.2.2. Test Procedures
Following the latest revised “Specifications for Design of Highway Subgrades” of China [26], the resilient modulus test is divided into two parts: preloading and testing. First, the cyclic half pulse load with the maximum axial stress of 66 kPa was applied to samples 1000 times at the confining pressure of 30 kPa. Then, the similar half pulse load with target axial stress was applied 100 times. The frequency of the half sine pulse load was 1 Hz. The load time and load interval were 0.2 s and 0.8 s, respectively (shown in Figure 2). Finally, the last 5 waveforms of stress–strain curves were recorded. The resilient modulus of the modified soil and unmodified soil could be calculated using Equation (1):
where is the amplitude of axial stress (MPa), is the average amplitude of axial strain (mm/mm), and is the dynamic resilient modulus (MPa).
The testing loading waveform in Figure 2b indicates that the triaxial instrument can respond well to the theoretical setting. The stress states of subgrade materials under different traffic load conditions are usually different. To simulate the traffic load variation conditions and collect more test data [33], a loading sequence of resilient modulus testing was determined and is listed in Table 2. There are three loading processes of 40-1, 50-2, and 40-3 in this study. The numbers 40 and 50 represent the confining pressure of 40 and 50 kPa, and 1, 2, 3 represent the loading sequence. Three parallel specimens were designed for testing the resilient modulus under each stress state. The error between the mean value and each test value should not exceed 5%. The mean value is considered as the representative test value for further analysis.
2.2.3. Process of Freeze-Thaw (F-T) Cycles
Referring to previous studies [25,34], seven F-T cycles in total were designed in this experiment. In the freezing process, the soil sample was put in the apparatus with a quick temperature variation from 15 °C to −15 °C. Cooling was propagated inside the sample from three dimensions, which lasted 24 h. For the thawing process, the temperature of the apparatus was set at 15 °C. This process also lasted 24 h. To keep the moisture content of samples unchanged during F-T cycles, the samples were wrapped in waterproof films and placed in an F-T cycle box. Before testing, visual inspection was performed to ensure that there were no obvious cracks on the surface of the test sample.
2.2.4. Damage Ratio of Resilient Modulus
To evaluate the effect of F-T cycles on material properties, the damage ratio is defined as follows:
where is the damage ratio, is the resilient modulus after n-many F-T cycles (MPa), and is the resilient modulus before F-T cycles (MPa).
In order to grasp the resilient modulus variation trend with F-T cycles, fitting equations under different stress states are given. The equations can be fitted in the form of exponential decay, which is expressed as follows:
where is the damage ratio of the resilient modulus; n is the number of F-T cycles; , , and are constant terms; and represents the value of the damage ratio of the resilient modulus for materials after sufficiently many F-T cycles.
2.2.5. Image Processing Technology for SEM Testing
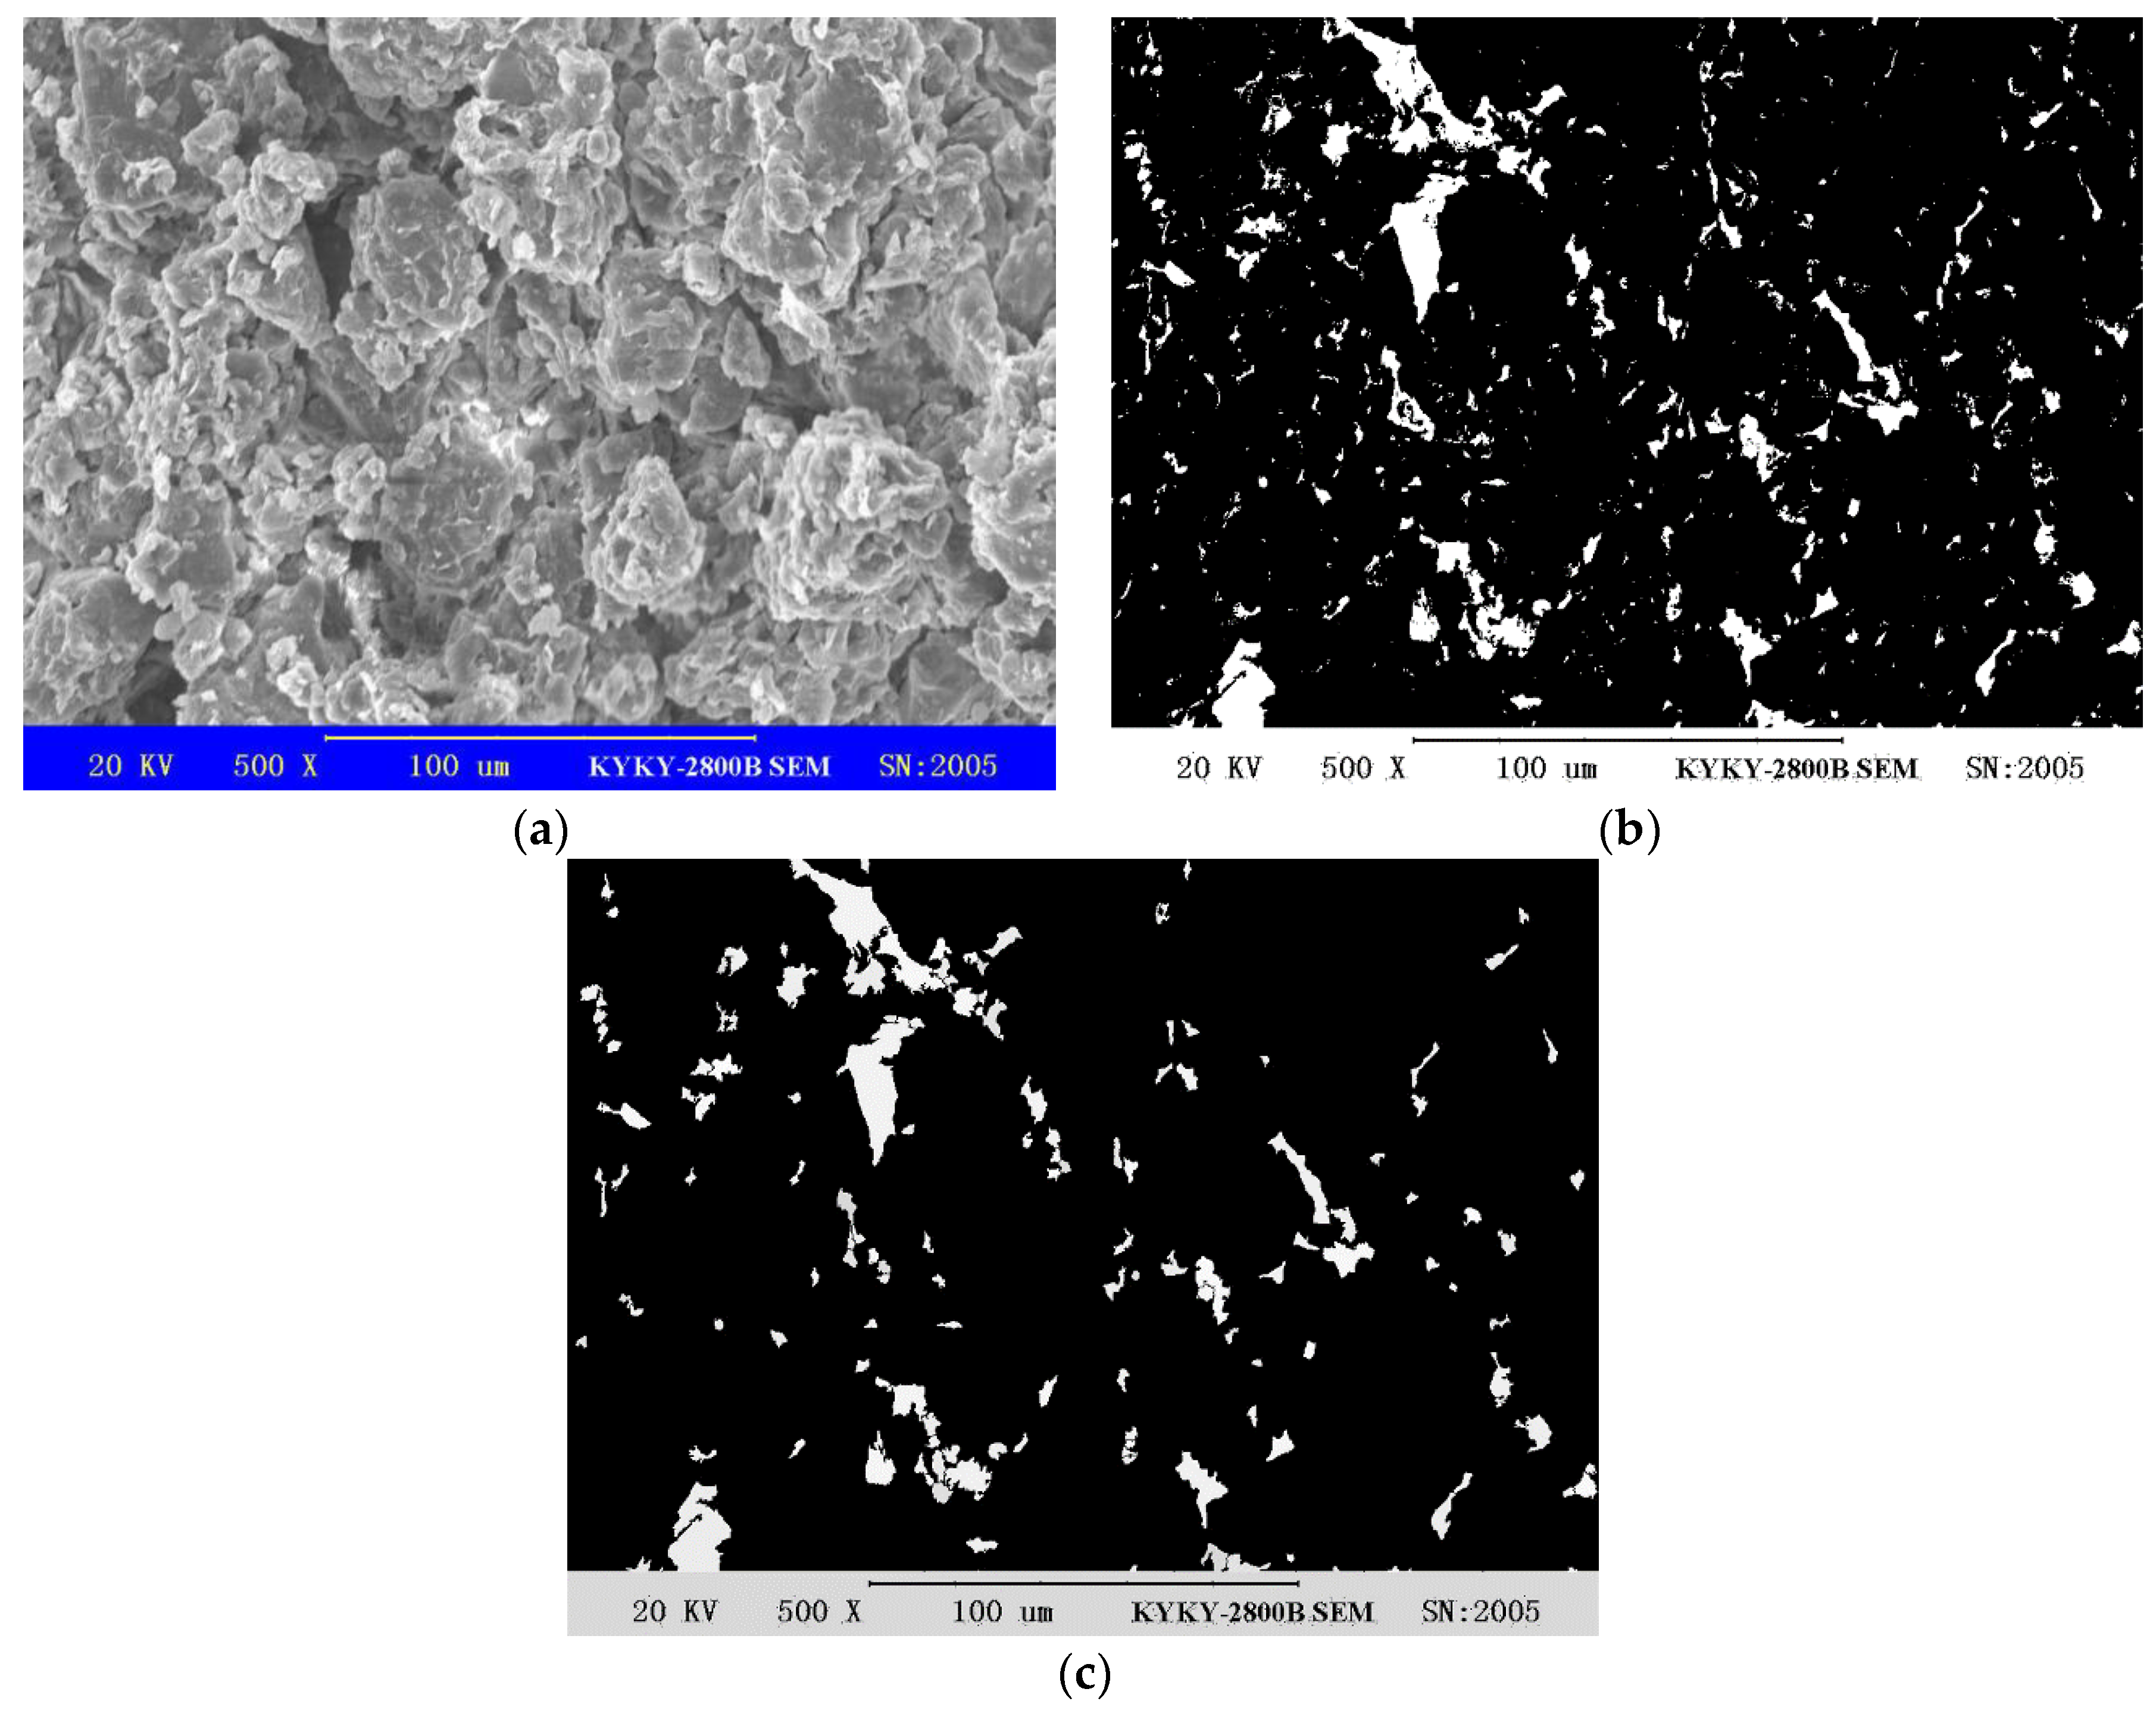
It is widely recognized that F-T cycles can lead to changes of pores in soils. In order to investigate the influence of F-T cycles on the microstructure and pore distribution of soils, test data of samples (σ3 = 50 kPa, σd = 25 kPa) were adopted to conduct the SEM tests after F-T cycles. After the resilient modulus test, the soil samples were naturally dried. Small rectangular samples with a size of 10 mm × 5 mm × 5 mm (height × length × width) were cut from the specimens. They were glued on trays and gilded for scanning. To observe the microstructure of cohesive soils, the magnification of 500× to 1000× is suitable. In this manuscript, the test samples were captured at the magnification of 500× and 600×. Three evenly distributed points in each test sample were selected and scanned by electron microscopy. Images with no delta points (points containing specific information, such as cracks) and clearly reflecting the typical structure of soils were obtained as the representative images for further imaging analysis. The scanned images are processed as follows:
Firstly, the original image was obtained and processed to binarization (shown in Figure 3a).
Secondly, the appropriate threshold values for test soils were manually adjusted to make the dark particles in the binary image (shown in Figure 3b) the same as those in the original image. The threshold value could be first set near the gray average of the image and then adjusted to obtain the optimum value. In this study, the threshold values of unmodified soil range from 68 to 72, while the average threshold values of the modified soil vary from 85 to 94.
Thirdly, small and irregular miscellaneous points of the image caused by impurities and image noise were removed to avoid influencing the analysis and statistical results. In this paper, pores with area less than 30 pixels were removed (shown in Figure 3c).
Finally, the porosity and mean diameter were calculated by the IPP (Image Pro Plus) software to analyze the change of pores.
3. Results and Discussion
The resilient modulus and the corresponding standard deviation of unmodified SC and the modified SC are listed in Table 3 and Table 4, respectively.
The standard deviations of unmodified SC vary from 0.68 to 2.21, but most of them are between 1.0 and 2.0, while the standard deviations of the modified SC vary from 0.59 to 2.03, but most of them are less than 1.0. This demonstrates that the dispersion degree of the measured data is low. The result is reliable to be used for further analysis. Moreover, the standard deviations of the modified SC are lower and more stable than those of unmodified SC, especially after freeze–thaw cycles. This means that the stability of the resilient modulus with freeze–thaw cycles for the modified SC is better than that of unmodified soil. More detailed analysis is carried out in the following parts.
3.1. Effect of Stress State on Resilient Modulus
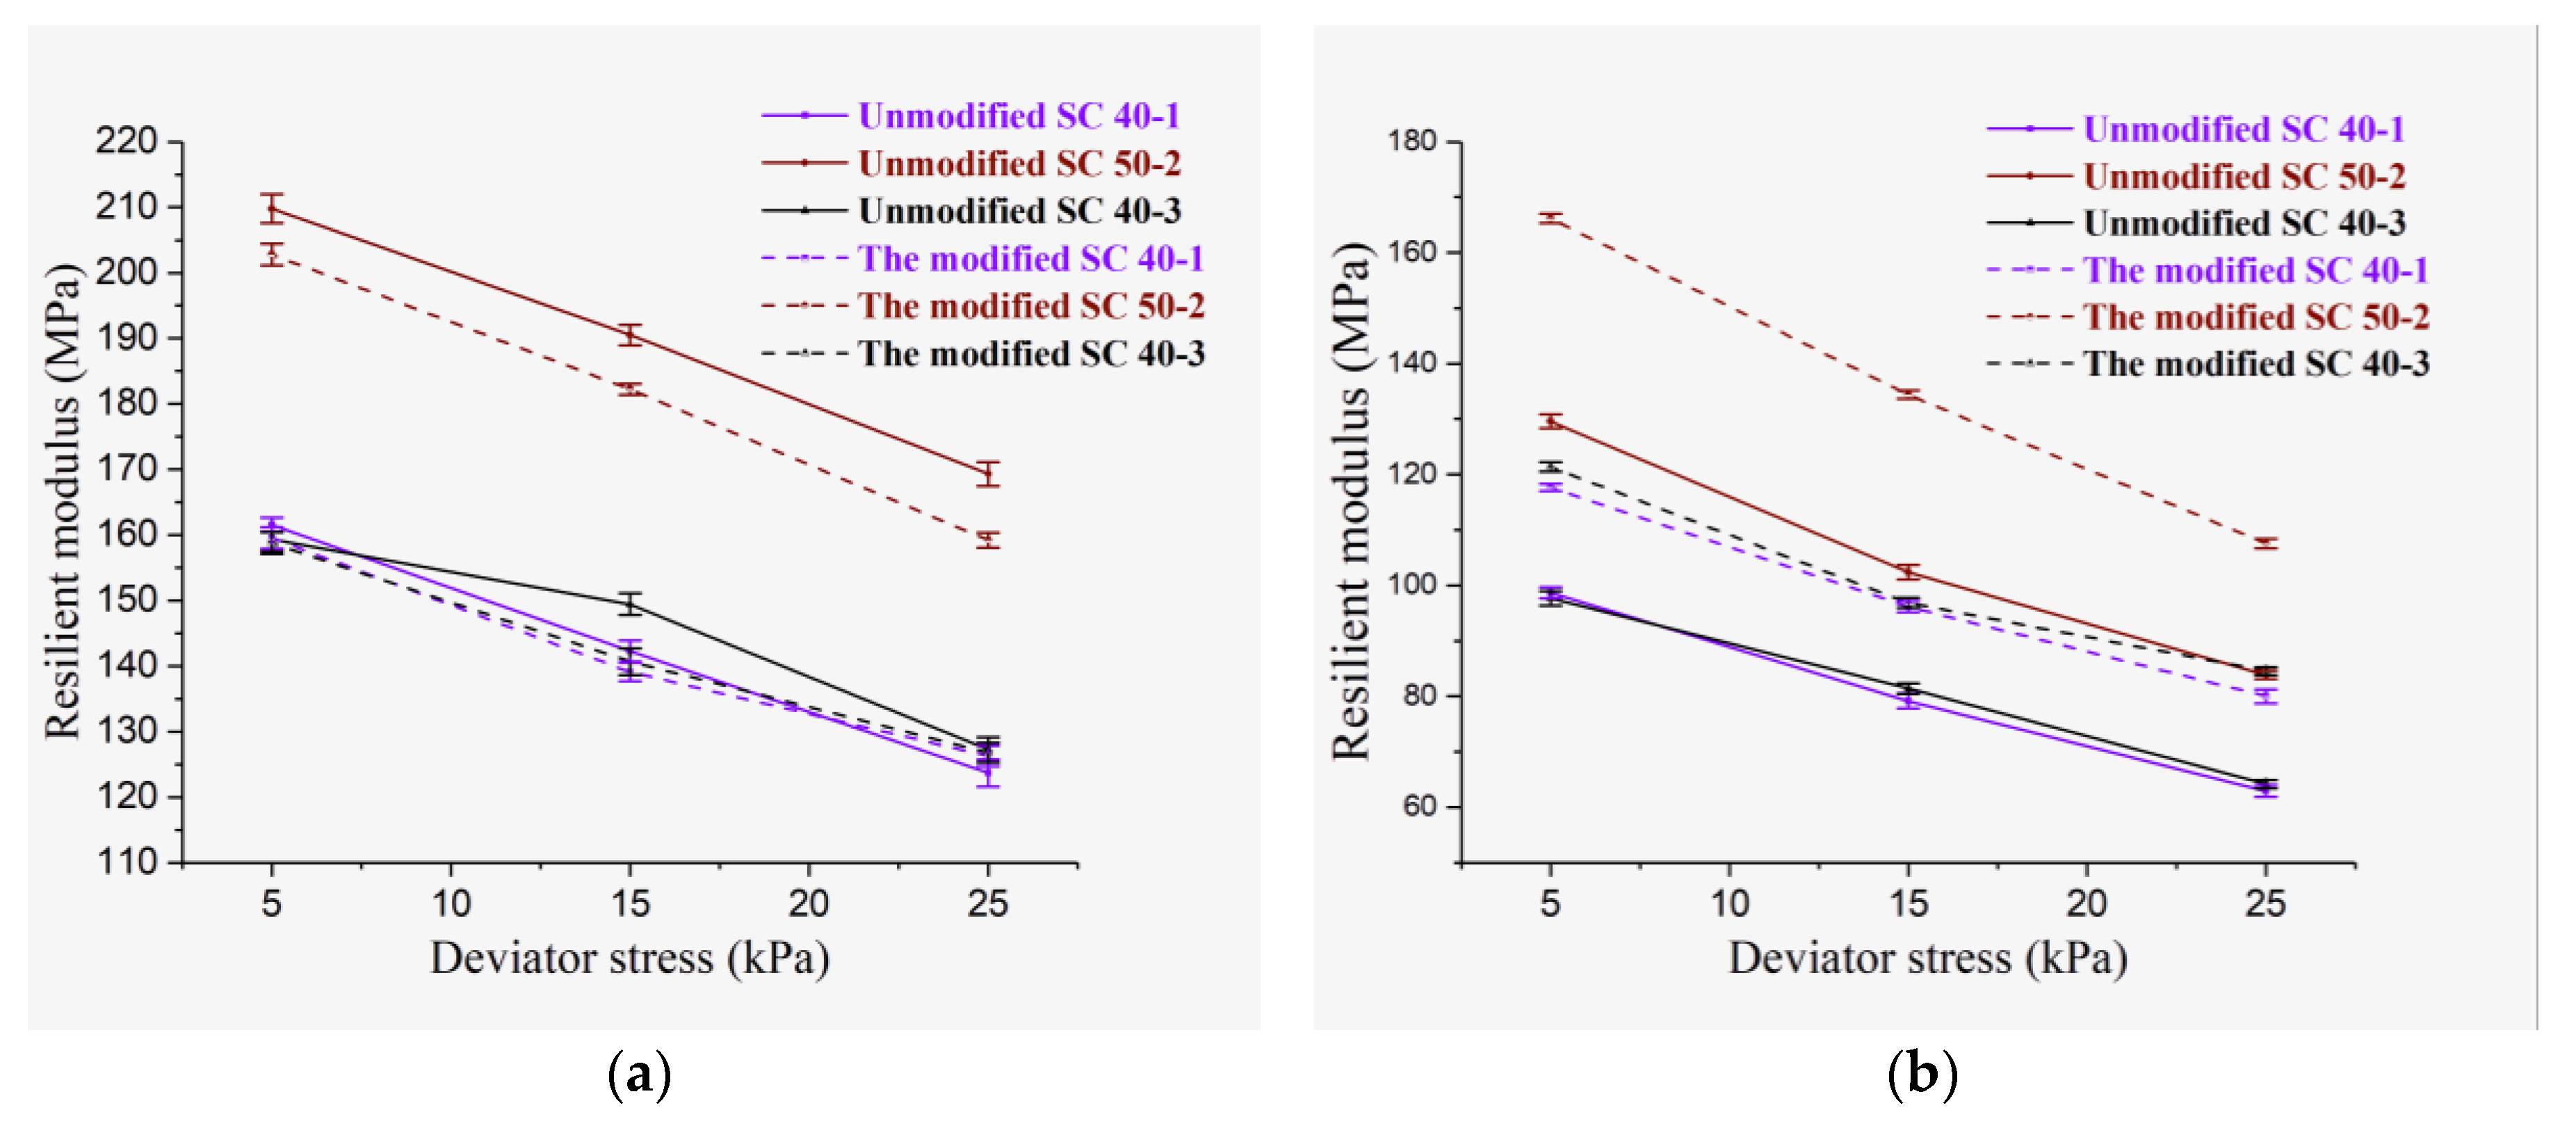
To investigate the effect of confining pressure and deviator stress on the variation trend of resilient modulus, the resilient moduli of two materials in an unfrozen state and after 1 to 7 F-T cycles were analyzed. The variation curves of resilient modulus versus deviator stress and bulk stress (θ = σ1 + σ2 + σ3) are shown in Figure 4 and Figure 5, respectively.
From Figure 4, the resilient moduli of both unmodified SC and the modified SC decrease with increasing deviator stress. The resilient modulus in high confining pressure (σc = 50 kPa) is higher than that in low confining pressure (σc = 40 kPa). From Figure 5, the resilient modulus increases with the increase of bulk stress. The variation trends of resilient modulus versus deviator stress and bulk stress are still significant after F-T cycles. In Figure 5, It should be noted that the shape of each data curve in Figure 5 is a break-line of horizontal “Λ”. The starting point and end point of the “Λ” curve are the resilient moduli of loading sequences 40-1 and 40-3, respectively. When the horizontal “Λ” curve is close to an “I” shape, it means that the resilient modulus values of 40-1 and 40-3 are exactly equal. This phenomenon is in accordance with the coincident curves of 40-1 and 40-3 in Figure 4, which illustrates that the influence of loading path on resilient modulus is insignificant under the same stress state. In consideration of the close resilient modulus values of 40-1 and 40-3, the data of process 40-3 is not analyzed in the following parts.
Reasons for the variation characteristics of the resilient modulus lie in the fact that the particle structure of soils is significantly influenced by stress states. Soils are compacted by high confining pressure, hence resulting in denser particle structure and bigger resilient modulus, while the particle structure of soils is easily destroyed and rearranged by deviator stress. The rearrangement of structure could lead to the decrease of the resilient modulus. The results in this study are similar to the results of existing literature [20,35].
The influence of stress state on the resilient modulus is still significant after F-T cycles. Furthermore, the effect of F-T cycles on the resilient modulus of both materials is reduction, but the reduction variation characteristics are slightly different. The resilient modulus of unmodified SC drops gradually and stabilizes after 7 F-T cycles, while the resilient modulus of the modified soil decreases fast and then tends to be stable.
3.2. Effect of F-T Cycles on Resilient Modulus
To better investigate the effect of F-T cycles on resilient modulus for the two materials, the variation curves of resilient modulus versus F-T cycles under different stress states are drawn in Figure 6.
As Figure 6 and Figure 7 show, the resilient modulus of unmodified SC is slightly higher than that of the modified soil under the same deviator stress before F-T cycles. With increasing F-T cycles, the test data for the two materials show different variation characteristics. After the first F-T cycle, the resilient moduli of both materials decrease sharply. The resilient modulus value of unmodified SC is still higher than that of the modified soil. As F-T cycles continue, the resilient modulus of unmodified SC decreases continually, while the resilient modulus of the modified soil has remained stable. After 7 F-T cycles, the resilient modulus of unmodified SC is lower than that of the modified SC. This means that after sufficient numbers of F-T cycles, the mechanical performance of the modified soil is better than that of unmodified soil.
The calculated damage ratios of resilient modulus and the corresponding fitting equations for unmodified SC and the modified SC are listed in Table 5 and Table 6.
In Table 5 and Table 6, the damage ratios of unmodified SC increase gradually with increasing F-T cycles, while the calculated data of the modified soil decrease after the first F-T cycle and then remain stable. For unmodified SC, the damage ratios in low confining pressure (σc = 40 kPa) are close to those under the same deviator stress (σd) in high confining pressure (σc = 50 kPa). As for the modified SC, the damage ratios in high confining pressure (σc = 50 kPa) are slightly less than those in low confining pressure (σc = 40 kPa). Furthermore, the damage ratios of both materials under the deviator stress of 25 kPa (σd = 25 kPa) are higher than those under the deviator stresses of 15 and 5 kPa (σd = 15 kPa and σd = 5 kPa). It revealed that for both materials, deviator stress is the main factor affecting the damage ratio of the resilient modulus after F-T cycles.
The correlation coefficients of the fitting equations for both materials are strong. The constant term y0 represents the damage ratio of materials after sufficient numbers of F-T cycles. It can be called a stable damage ratio after F-T cycles. The fitting results indicate that the stable damage ratios of the modified soil are better than those of unmodified soil. Therefore, the modified SC will have better application potential than unmodified SC in seasonally frozen regions.
3.3. Significance Analysis of Influencing Factors on Resilient Modulus
The effect of confining pressure, deviator stress, and F-T cycles on resilient modulus is worth comparing and discussing. The variance of confining pressure, deviator stress, and F-T cycles on resilient modulus is analyzed using SPSS (Statistical Product and Service Solutions) 20.0 software. The resilient modulus is regarded as a dependent variable. Confining pressure, deviator stress, and F-T cycles are fixed factors. The results are listed in Table 7.
From Table 7, the significance analysis results for the two materials are similar. It illustrates that confining pressure, deviator stress, and F-T cycles all have a significant influence on the resilient modulus, which is consistent with the previous analysis. Furthermore, the magnitude of the F value reflects the level of significance. The greater value of F, the greater the significance of the effect. Based on the confidence interval of 95%, the significance result for the two materials is slightly different. For unmodified SC, the significance of confining pressure is the greatest, followed by F-T cycles and deviator stress. For the modified soil, the significance of confining pressure is also the greatest, then followed by deviator stress and F-T cycles.
The obtained results show that stress states are the most important factors affecting the resilient modulus, especially confining pressure. The effect of F-T cycles on the resilient modulus is determined by the property of materials. In comparison, the effect of F-T cycles on the resilient modulus of the modified SC is less significant than on that of unmodified SC. This is due to the difference in microstructure for the two materials, which will be discussed in the following part.
3.4. Effect of F-T Cycles on Microstructure for Soil Samples
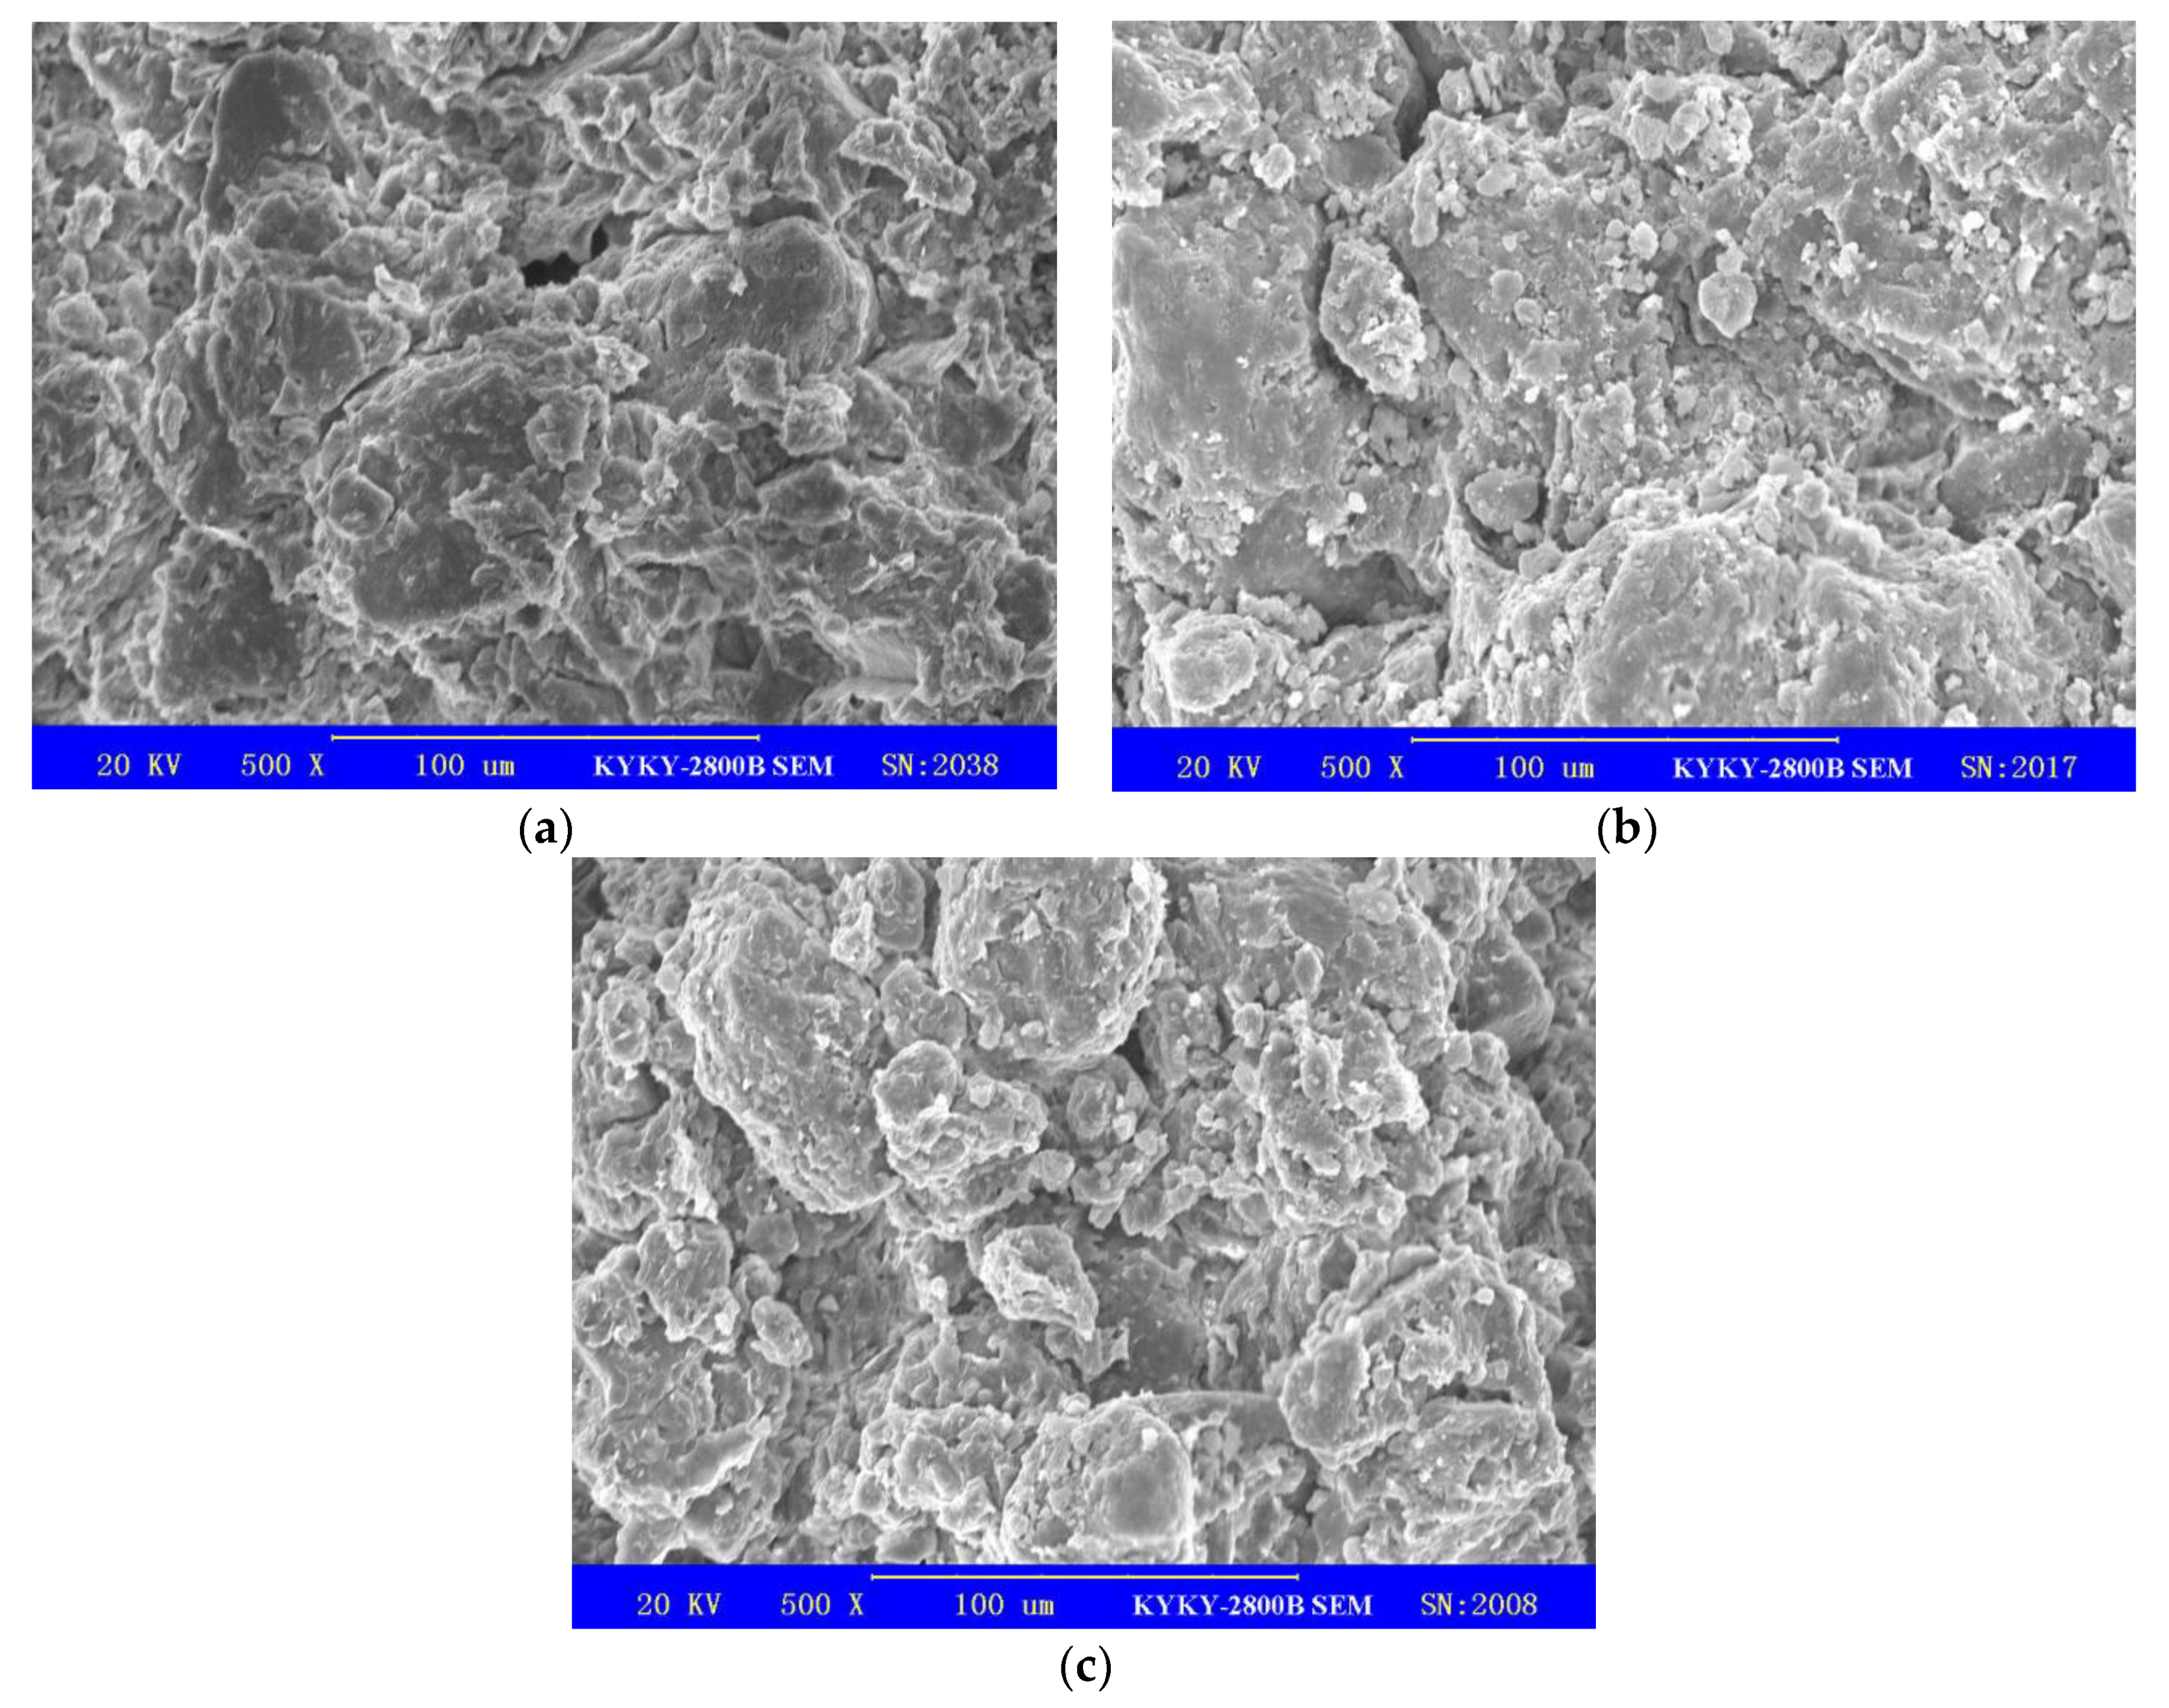
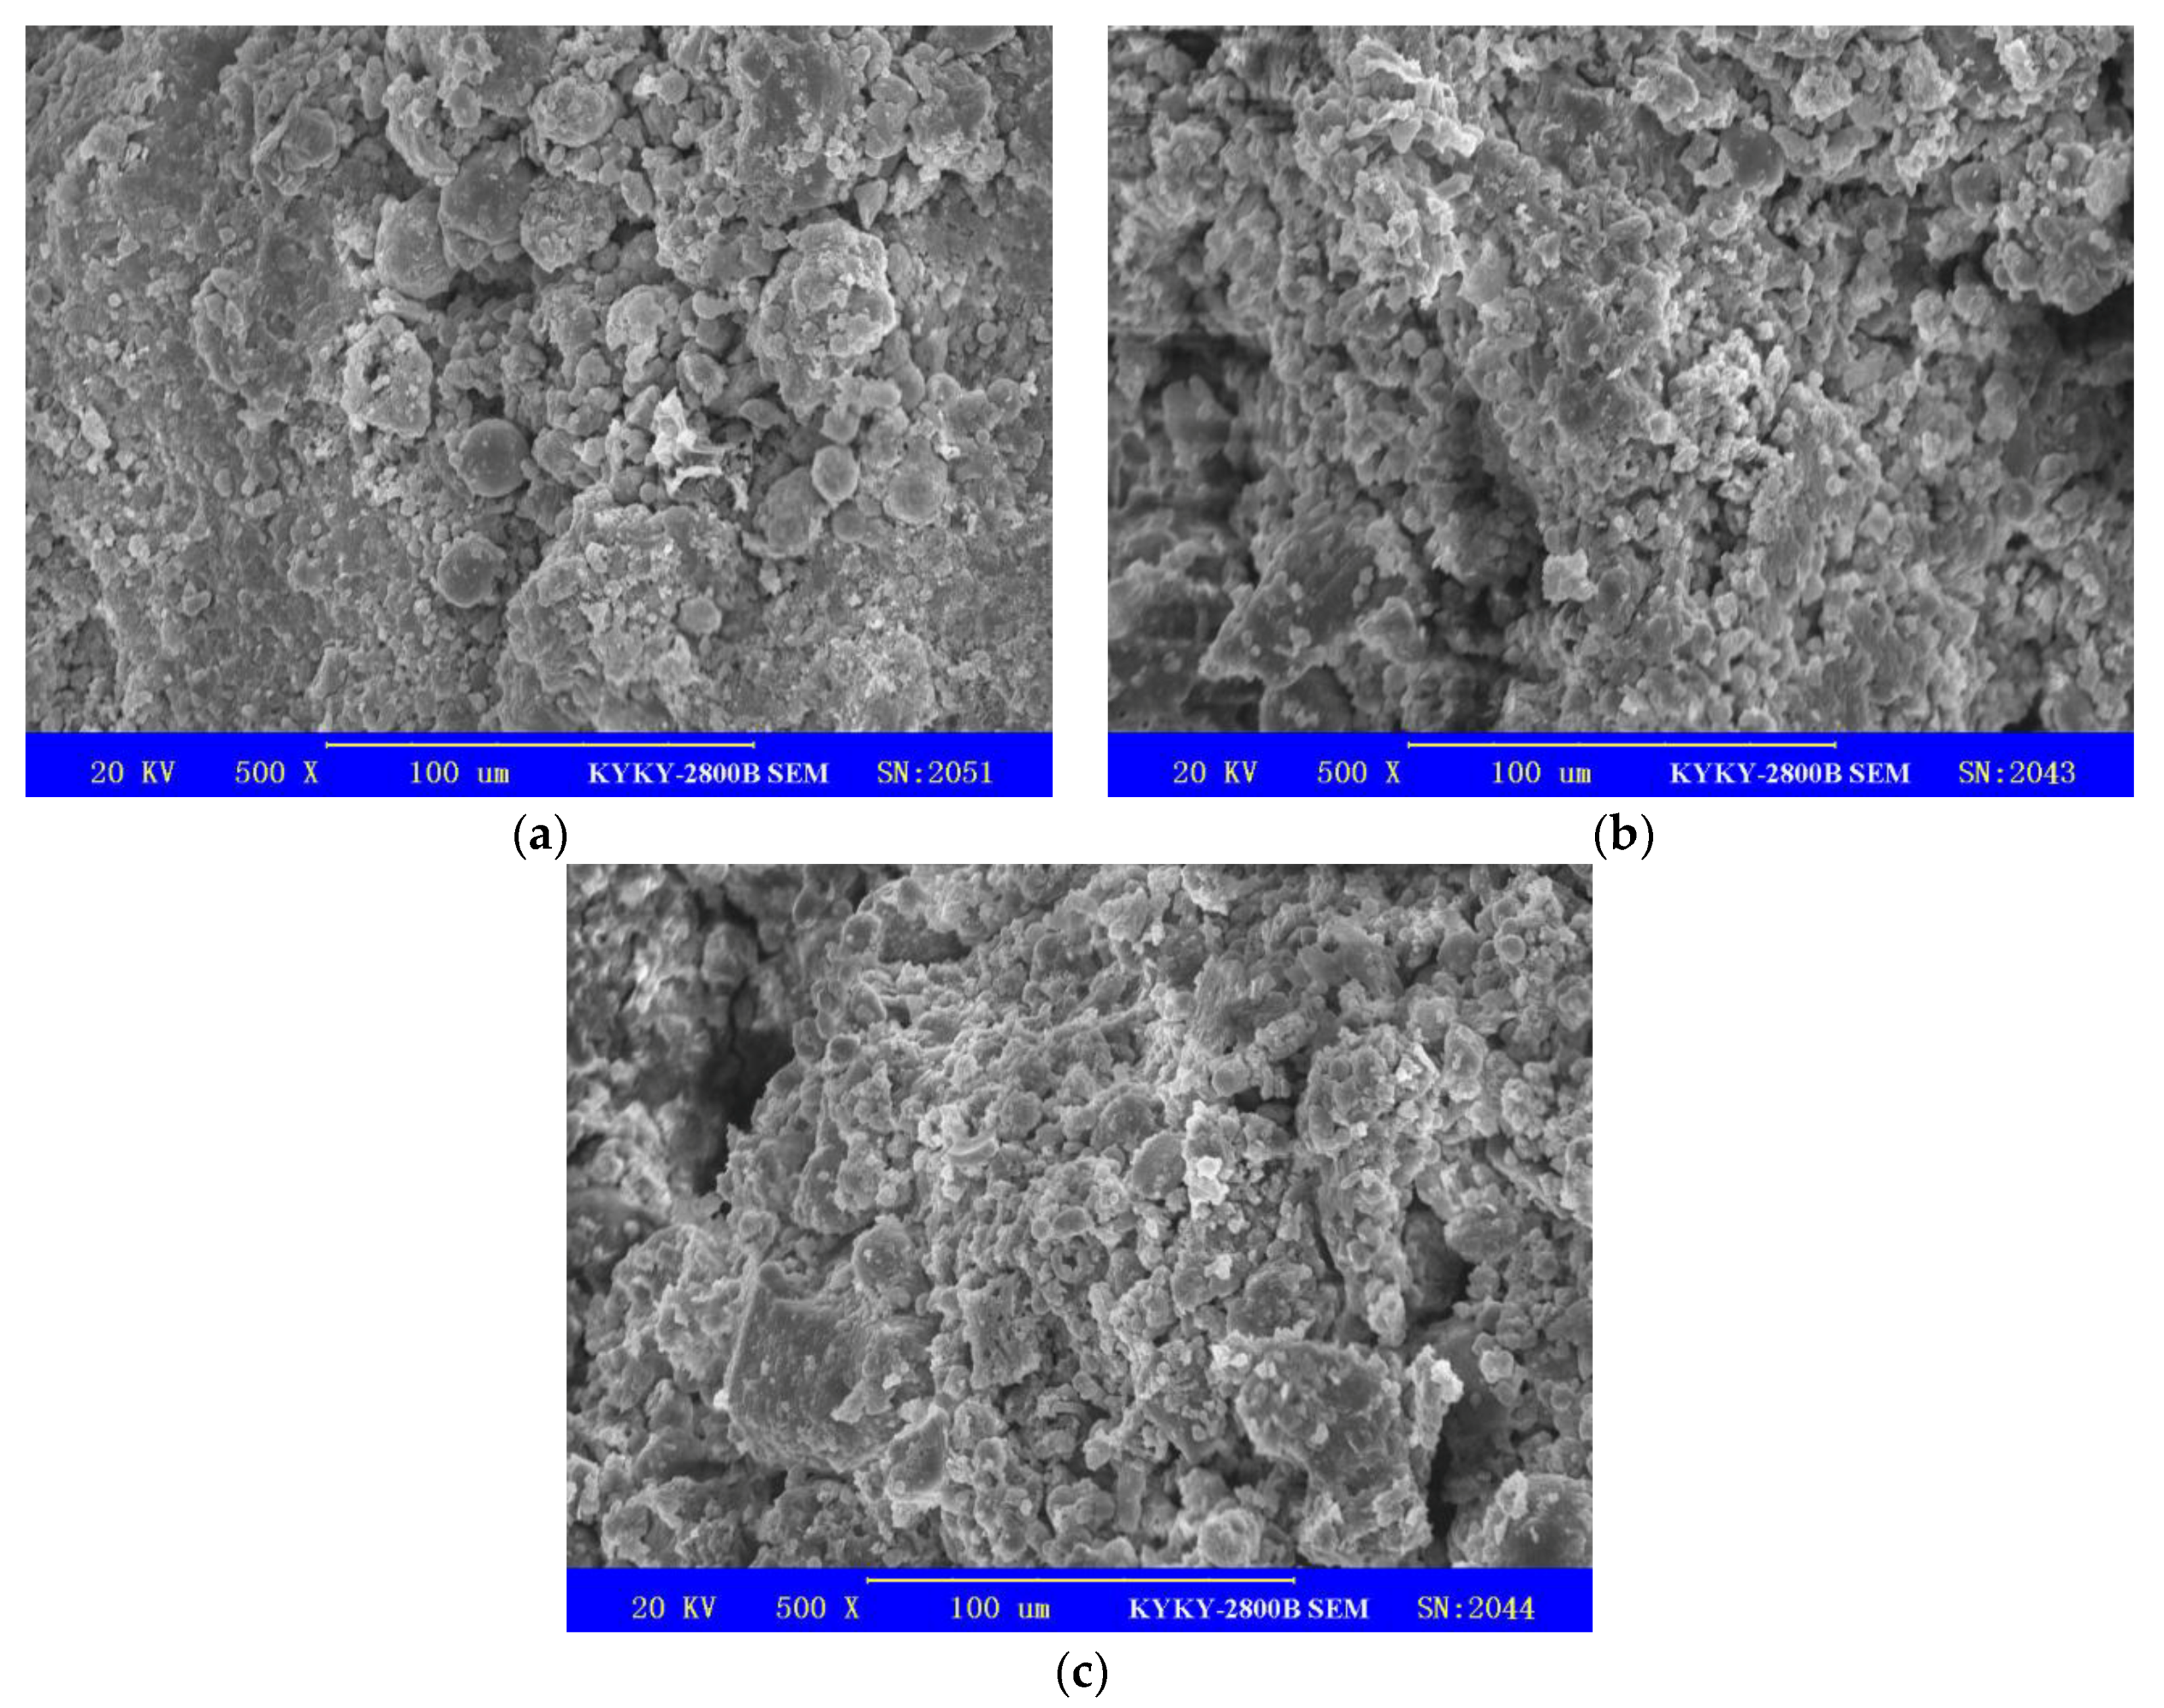
It has been demonstrated that the significant decrease in resilient modulus after F-T cycles is mainly related to the water transfer, volume, and microstructure change of soils during the freezing and thawing process [23,25]. To investigate the effect of F-T cycles on microstructure change for the two materials, SEM tests were conducted to scan the soil samples after F-T cycles. The original scanning images for the two materials after 0, 1, and 5 F-T cycles are shown in Figure 7 and Figure 8.
As seen from Figure 7a, the microstructure of unmodified SC is a whole platy structure with layered structures. It is dense and connected strongly with soil particles. After the first F-T cycle, there are cracks on the surface of the platy structure, and the dense particle arrangement is slightly destroyed (shown in Figure 7b). As F-T cycles continue, cracks develop rapidly. The dense structure becomes loose and a lot of pores appear. Afterwards, the connection force between particles decreases. In the modified soil, there are a lot of fine particles and agglomerates. They connect with each other and contribute to the strength of soil samples. After the first F-T cycle, there are more small particles and pores, but the interlock structure of small particles and agglomerates possesses great stability. So, there are no distinct differences in the distribution of cracks and pores for samples after several F-T cycles (shown in Figure 8b,c).
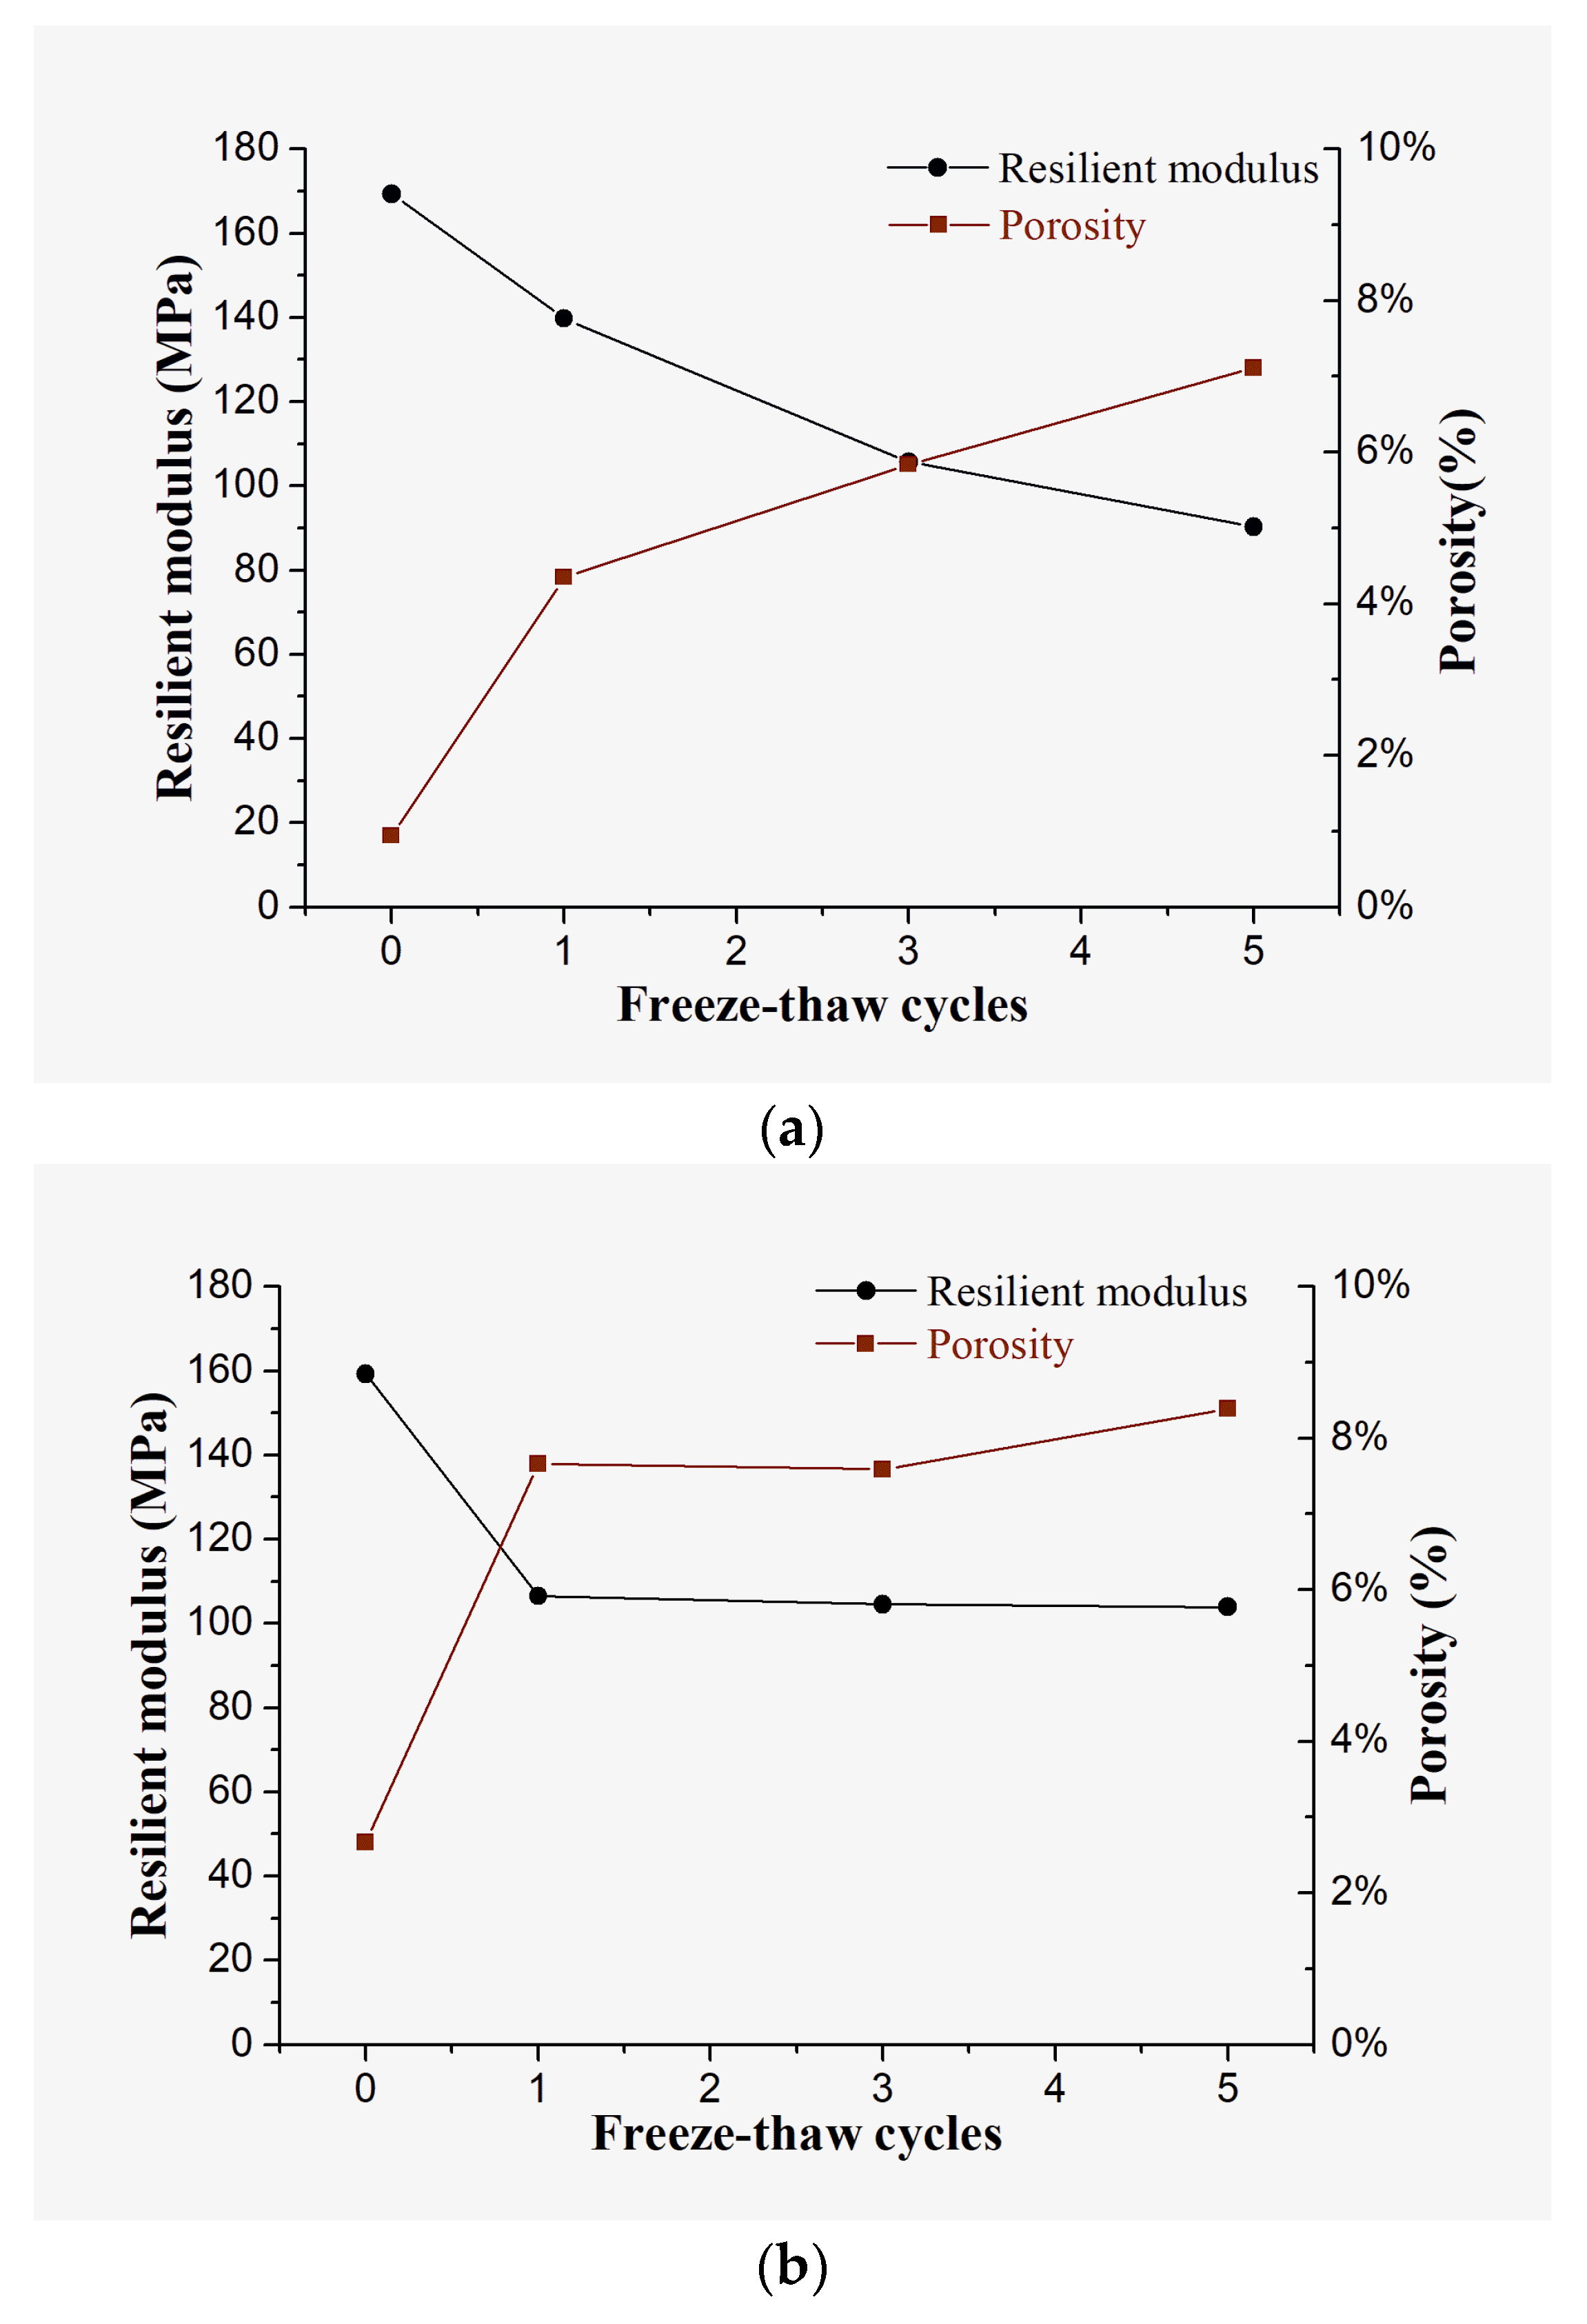
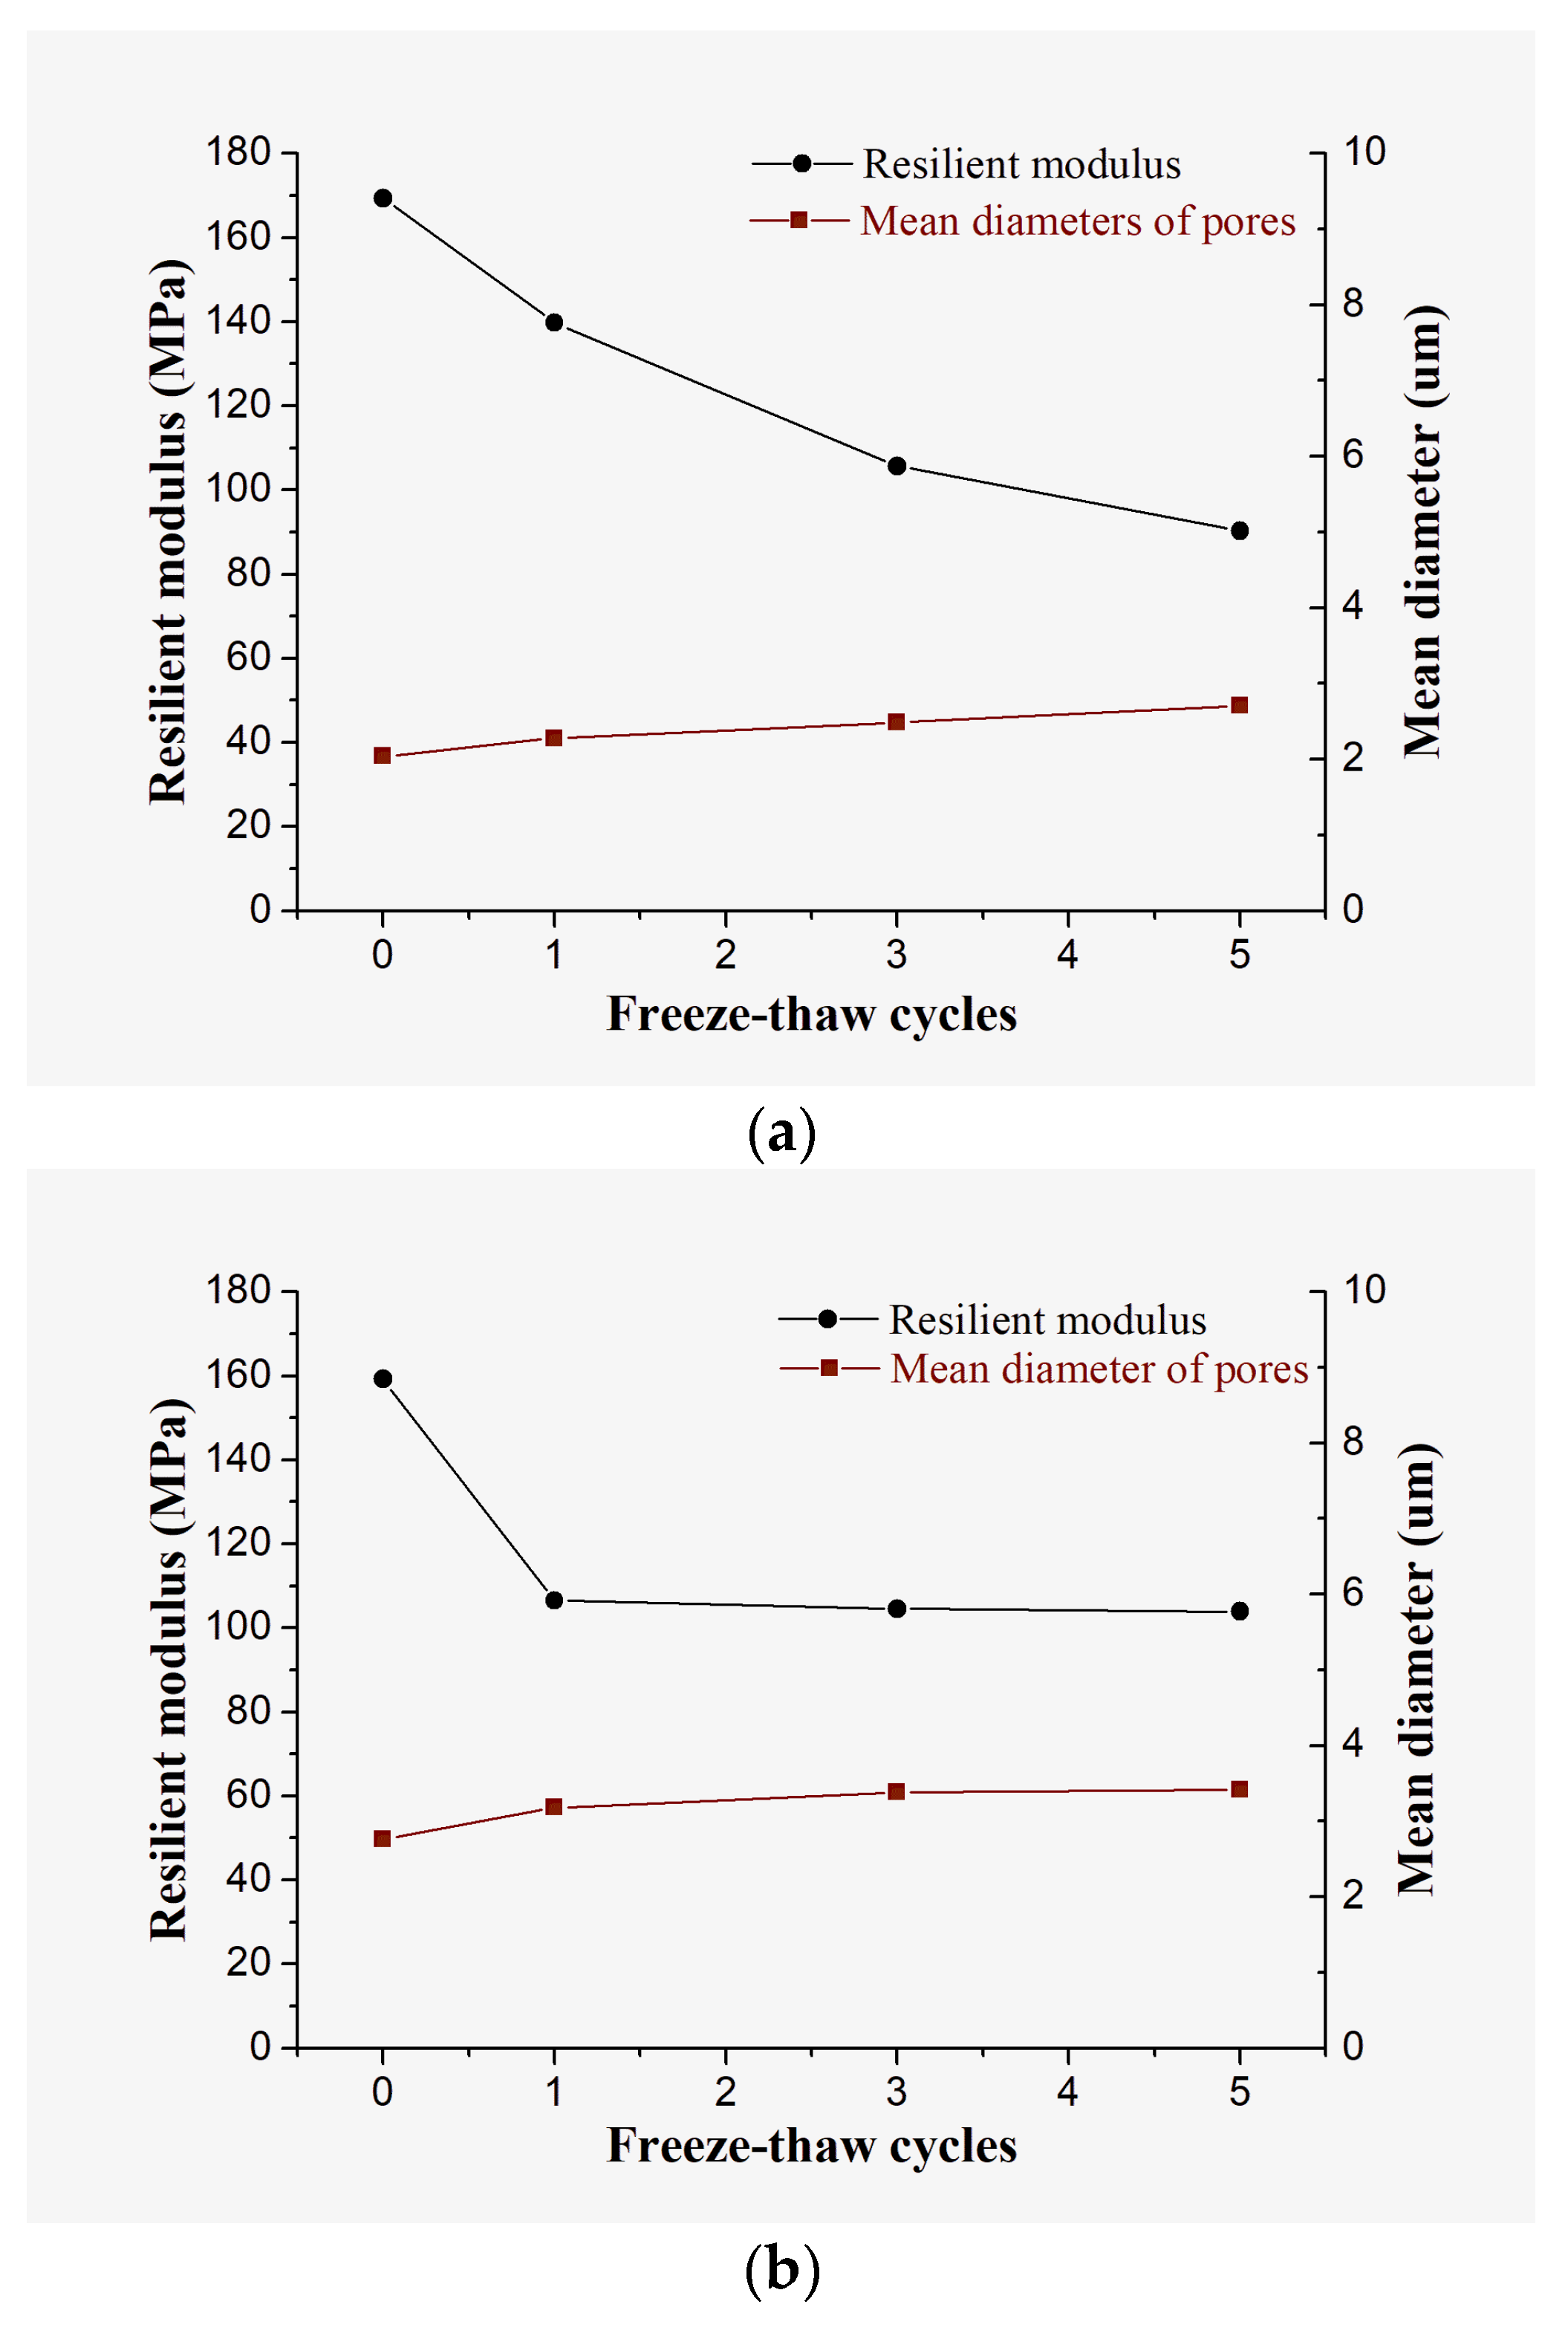
Pore distributions of soils are closely related to the performance change of the materials. Based on the image processing technology, the porosity and pore size of samples for the two materials after 0, 1, 3, and 5 F-T cycles were analyzed. The variation curves of resilient modulus (σd = 25 kPa, σc = 50 kPa) and pore parameters versus F-T cycles are drawn in Figure 9 and Figure 10.
In Figure 9 and Figure 10, the values of porosity and mean diameter of pores for the two materials are low before F-T cycles. With the increase of F-T cycles, the porosity and mean diameter of pores all increase. The growth trend of both porosity and mean diameter of pores seems correlated to the reduction trend of the resilient modulus. For unmodified SC, the variation trends of resilient modulus and pore parameters are opposite: the resilient modulus decreases with the increase of F-T cycles, but the porosity and mean diameter of pores increase with increasing F-T cycles. This trend is more significant in the variation trend of porosity. For the modified SC, the resilient modulus decreases sharply after the first F-T cycle, then it remains stable. The porosity and mean diameter show the similar opposite variation characteristics after F-T cycles. To better investigate this relationship, correlation analysis between resilient modulus and pore parameters was conducted; the results are shown in Table 8 and Table 9.
As shown from the results, the significance values (2-tailed) are 0.021, 0.007, 0.010, and 0.049, respectively, which are all lower than 0.05. This means that the resilient modulus is correlated with porosity and mean diameter at the level of 0.05 (2-tailed). The Pearson correlation coefficients of both unmodified SC and the modified SC are negative. The absolute values of them are all higher than 0.95. This means that there is very strong negative correlation of resilient modulus versus porosity and mean diameter.
To discuss the pore distribution change characteristics after F-T cycles, the pores of the two materials after F-T cycles were counted and classified into small pores (d < 2 µm), medium pores (2 µm < d < 5 µm), and large pores (d > 5 µm). The results are listed in Table 10.
For unmodified SC, there are mainly small and medium pores before F-T cycles. With increasing F-T cycles, the amounts of medium and large pores increase and that of small pores decreases. The situation for the modified soil is slightly different. Compared with unmodified SC, the amounts of medium and large pores in the modified soil are larger than those in silty clay before F-T cycles. The mean diameter of pores for the modified soil is larger as well. As F-T cycles increase, the distribution of pores tends to be stable: the amounts of small pores slightly decrease, and the amounts of medium and large pores increase.
From the SEM test, the effect of F-T cycles on soils is mainly to destroy the initial structure, increasing the porosity and mean diameters of pores. It can be concluded that the microstructure change during F-T cycles is the main factor that results in the decrease of the resilient modulus.
4. Conclusions
In this study, the resilient moduli of unmodified SC and modified SC after F-T cycles were measured. The effects of stress state and F-T cycles on the resilient modulus were investigated. Some conclusions were obtained as follows:
- (1)
- The resilient moduli of both two materials are significantly influenced by their stress states. The resilient modulus always increases with the increase of confining pressure, and is inverse to the deviator stress, which is in accord with other research. F-T cycles are also an important factor affecting the resilient modulus of test soils. With increasing F-T cycles, the resilient modulus of unmodified SC decreases continually, while the resilient modulus of the modified SC decreases sharply after the first F-T cycle and then tends to be stable.
- (2)
- Damage ratio can be effectively adopted to describe the resilient modulus reduction after F-T cycles. For unmodified SC and the modified SC, their damage ratio variation trends after F-T cycles can be effectively fitted in the form of exponential decay equations.
- (3)
- The significance analysis demonstrates that the significance of confining pressure, deviator stress, and F-T cycles on resilient moduli for the two materials are great. For unmodified SC, the variance significance of confining pressure is the greatest, followed by F-T cycles and deviator stress. For the modified SC, the significance of confining pressure is also the greatest, then followed by deviator stress and F-T cycles.
- (4)
- From the SEM testing, the microstructure of unmodified SC is a whole platy structure with layered structures, while the microstructure of modified SC consists of a lot of fine particles and agglomerates, which possess greater stability after F-T cycles than unmodified SC. With increasing F-T cycles, the initial structure of soils is destroyed and the porosity also increases. The correlation analysis shows that the porosity and mean diameter of pores are strongly negatively correlated with the resilient modulus. The SEM testing also reflects the variation characteristics of pores for compacted soils after F-T cycles: the small pores gradually develop into medium and large pores.
In summary, the resilient modulus of SC modified by OSA and FA is superior to that of unmodified SC after F-T cycles. The modified soil can be used for road construction in seasonally frozen areas. Additionally, more research will be conducted to investigate the strength and deformation characteristics of the modified silty clay.
Author Contributions
H.W. and Y.Z. conducted the resilient modulus test and prepared the original draft. F.W. performed the SEM testing and revised the manuscript. G.C. and Q.L. consulted the research program and proofread the manuscript.
Funding
This work was supported by the National Natural Science Foundation of China [grant number 51578263]; Transportation Science & Technology Program of Jilin Province [grant number 2015-1-11]; Scientific and Technological Planning Project of Ji Lin Province [grant number 20180201026SF]; and Open Fund Project of Loess Earthquake Engineering Key Laboratory of China Earthquake Administration, Gansu Province, China [grant number KLLEE-17-002].
Conflicts of Interest
The authors declare no conflict of interest.
References
- Gobinath, V.; Stalin, V.K. Performance of geogrid reinforced rubber waste as subgrade material. In Indian Geotechnical Conference 2009; Guntur, India, 2009; pp. 178–182. Available online: https://www.tib.eu/en/search/id/TIBKAT%3A643919082/Indian-Geotechnical-Conference-IGC-2009-held-in/.
- Kua, T.A.; Arulrajah, A.; Horpibulsuk, S.; Du, Y.J.; Suksiripattanapong, C. Engineering and environmental evaluation of spent coffee grounds stabilized with industrial by-products as a road subgrade material. Clean Technol. Environ. Policy 2017, 19, 63–75. [Google Scholar] [CrossRef]
- Arro, H.; Prikk, A.; Pihu, T.; Öpik, I. Utilization of semi-coke of Estonian shale oil industry. Oil Shale 2002, 19, 117–125. [Google Scholar]
- Trikkela, A.; Kuusika, R.; Martinsb, A.; Stenceld, P.J.M. Utilization of Estonian oil shale semicoke. Fuel Process. Technol. 2008, 89, 756–763. [Google Scholar] [CrossRef]
- Yarbaşı, N.; Kalkan, E.; Akbulut, S. Modification of the geotechnical properties, as influenced by freeze–thaw, of granular soils with waste additives. Cold Reg. Sci. Technol. 2007, 48, 44–54. [Google Scholar] [CrossRef]
- Ghazavi, M.; Roustaie, M. The influence of freeze-thaw cycles on the unconfined compressive strength of fiber-reinforced clay. Cold Reg. Sci. Technol. 2010, 61, 125–131. [Google Scholar] [CrossRef]
- Olufowobi, J.; Ogundoju, A.; Michael, B.; Aderinlewo, O. Clay soil stabilization using powdered glass. J. Eng. Sci. Technol. 2014, 9, 541–558. [Google Scholar]
- Parsons, R.; Milburn, J. Engineering Behavior of Stabilized Soils. Transp. Res. Rec.: J. Transp. Res. Board 2003, 1837, 20–29. [Google Scholar] [CrossRef]
- Prabakar, J.; Dendorkar, N.; Morchhale, R.K. Influence of fly ash on strength behavior of typical soils. Constr. Build. Mater. 2004, 18, 263–267. [Google Scholar] [CrossRef]
- Turner, J.P. Soil stabilization using oil Shale solid wastes: Laboratory evaluation of engineering properties. J. Geotech. Eng. 1994, 120, 646–660. [Google Scholar] [CrossRef]
- Mymrin, V.A.; Ponte, H.A. Oil-shale fly ash utilization as independent binder of natural clayey soils for road and airfield base construction. Part. Sci. Technol. 2005, 23, 99–107. [Google Scholar] [CrossRef]
- Reinik, J.; Irha, N.; Koroljova, A.; Meriste, T. Use of oil shale ash in road construction: Results of follow-up environmental monitoring. Environ. Monit. Assess. 2018, 190, 59. [Google Scholar] [CrossRef] [PubMed]
- Kaljuvee, T.; Štubňa, I.; Somelar, P.; Mikli, V.; Kuusik, R. Thermal behavior of some Estonian clays and their mixtures with oil shale ash additives. J. Therm. Anal. Calorim. 2014, 118, 891–899. [Google Scholar] [CrossRef]
- Balo, F.; Yucel, H.L.; Ucar, A. Determination of the thermal and mechanical properties for materials containing epoxidised palm oil, clay and fly ash. Int. J. Sustain. Eng. 2010, 3, 47–57. [Google Scholar] [CrossRef]
- Jafer, H.; Atherton, W.; Sadique, M.; Ruddock, F.; Loffill, E. Stabilisation of soft soil using binary blending of high calcium fly ash and palm oil fuel ash. Appl. Clay Sci. 2018, 152, 323–332. [Google Scholar] [CrossRef]
- Uzan, J. Characterization of granular material. Transp. Res. Rec. 1985, 1022, 52–59. [Google Scholar]
- Ni, B.; Hopkins, T.C.; Sun, L.; Bechham, T.L. Modeling the resilient modulus of soils. In Proceedings of the 6th International Conference of the Bearing Capacity of Roads and Airfields, Lisbon, Portugal, 24–26 June 2002; pp. 1131–1142. [Google Scholar]
- American Association of State Highway and Transportation Officials (AASHTO). Resilient Modulus as Function of Soil. Guide for Mechanistic-Empirical Design of New and Rehabilitated Pavement Structures; American Association of State Highway and Transportation Officials: Washington, DC, USA, 2000; pp. 56–66. [Google Scholar]
- Lee, J.; Kim, J.; Kang, B. Normalized resilient modulus model for subbase and subgrade based on stress-dependent modulus degradation. ASCE Transp. Eng. J. 2009, 135, 600–610. [Google Scholar] [CrossRef]
- Li, Z.Y.; Dong, C.; Zou, J.R.; Zou, W.L. Research on experiment and prediction model of dynamic resilient modulus of laterite soil in Southern Hunan. Rock Soil Mech. 2015, 36, 1840–1846. [Google Scholar]
- Zhu, J.G.; Wang, Y.L.; Jia, H.; Zhang, B. Experimental study on resilience behaviour of coarse grained soils. Chin. J. Geotech. Eng. 2011, 33, 950–954. [Google Scholar]
- Qi, J.; Vermeer, P.A.; Cheng, G. A review of the influence of freeze-thaw cycles on soil geotechnical properties. Permafr. Periglac. Processes 2010, 17, 245–252. [Google Scholar] [CrossRef]
- Qi, J.; Wei, M.; Song, C. Influence of freeze–thaw on engineering properties of a silty soil. Cold Reg. Sci. Technol. 2008, 53, 397–404. [Google Scholar] [CrossRef]
- Lee, W.; Bohra, N.C.; Altschaeffl, A.G.; White, T.D. Resilient modulus of cohesive soils and the effect of freeze–thaw. Can. Geotech. J. 1995, 32, 559–568. [Google Scholar] [CrossRef]
- Simonsen, E.; Janoo, V.C.; Isacsson, U. Resilient properties of unbound road materials during seasonal frost conditions. J. Cold Reg. Eng. 2002, 16, 28–50. [Google Scholar] [CrossRef]
- Ministry of Transport of the People’s Republic of China. Specifications for Design of Highway Subgrades (JTG D30-2015); China Communications Press: Beijing, China, 2015; p. 7. (In Chinese) [Google Scholar]
- Sun, P.; Liu, Z.; Gratzer, R.; Xu, Y.; Liu, R.; Li, B.; Meng, Q.; Xu, J. Oil yield and bulk geochemical parameters of oil shales from the Songliao and Huadian Basins, China: A grade classification approach. Oil Shale 2013, 30, 402–418. [Google Scholar] [CrossRef]
- Taciuk, W. Does oil shale have a significant future? Oil Shale 2013, 30, 1–5. [Google Scholar] [CrossRef]
- Ministry of Housing Urban-Rural Development of Republic of China. Technical Code for Application of Fly Ash Concrete (GB/T 50146-2014); China Planning Press: Beijing, China, 2014; pp. 4–5. (In Chinese) [Google Scholar]
- Cui, J.H. Research on Stability of Subgrade Soil Modified by Oil Shale Waste Residue and Fly Ash. Master’s Thesis, Jilin University, Changchun, China, May 2018. [Google Scholar]
- Wei, H.B.; Zhang, Y.P.; Cui, J.H.; Han, L.L.; Li, Z.Q. Engineering and environmental evaluation of silty clay modified by waste fly ash and oil shale ash as a road subgrade material. Constr. Build. Mater. 2018. under review. [Google Scholar]
- Ministry of Transport of the People’s Republic of China. Test. Methods of Soils for Highway Engineering (JTG E40-2007); China Communications Press: Beijing, China, 2007; pp. 7, 223–226. (In Chinese) [Google Scholar]
- Chen, S.K.; Ling, J.M.; Zhang, S.Z. Fixing loading sequence for resilient modulus test of subgrade soil. Highway 2006, 11, 153–157. [Google Scholar]
- Othman, M.A.; Benson, C.H. Effect of freeze-thaw on the hydraulic conductivity of three compacted clays from Wisconsin. Transp. Res. Rec. 1992, 1369, 118–125. [Google Scholar]
- Salour, F.; Erlingsson, S. Resilient modulus modelling of unsaturated subgrade soils: Laboratory investigation of silty sand subgrade. Road Mater. Pavement Des. 2015, 16, 553–568. [Google Scholar] [CrossRef]
Figure 1.
Chemical composition of (a) oil shale ash (OSA) and (b) fly ash (FA).

Figure 2.
Half pulse waveform of (a) theoretical loading and (b) actual loading.
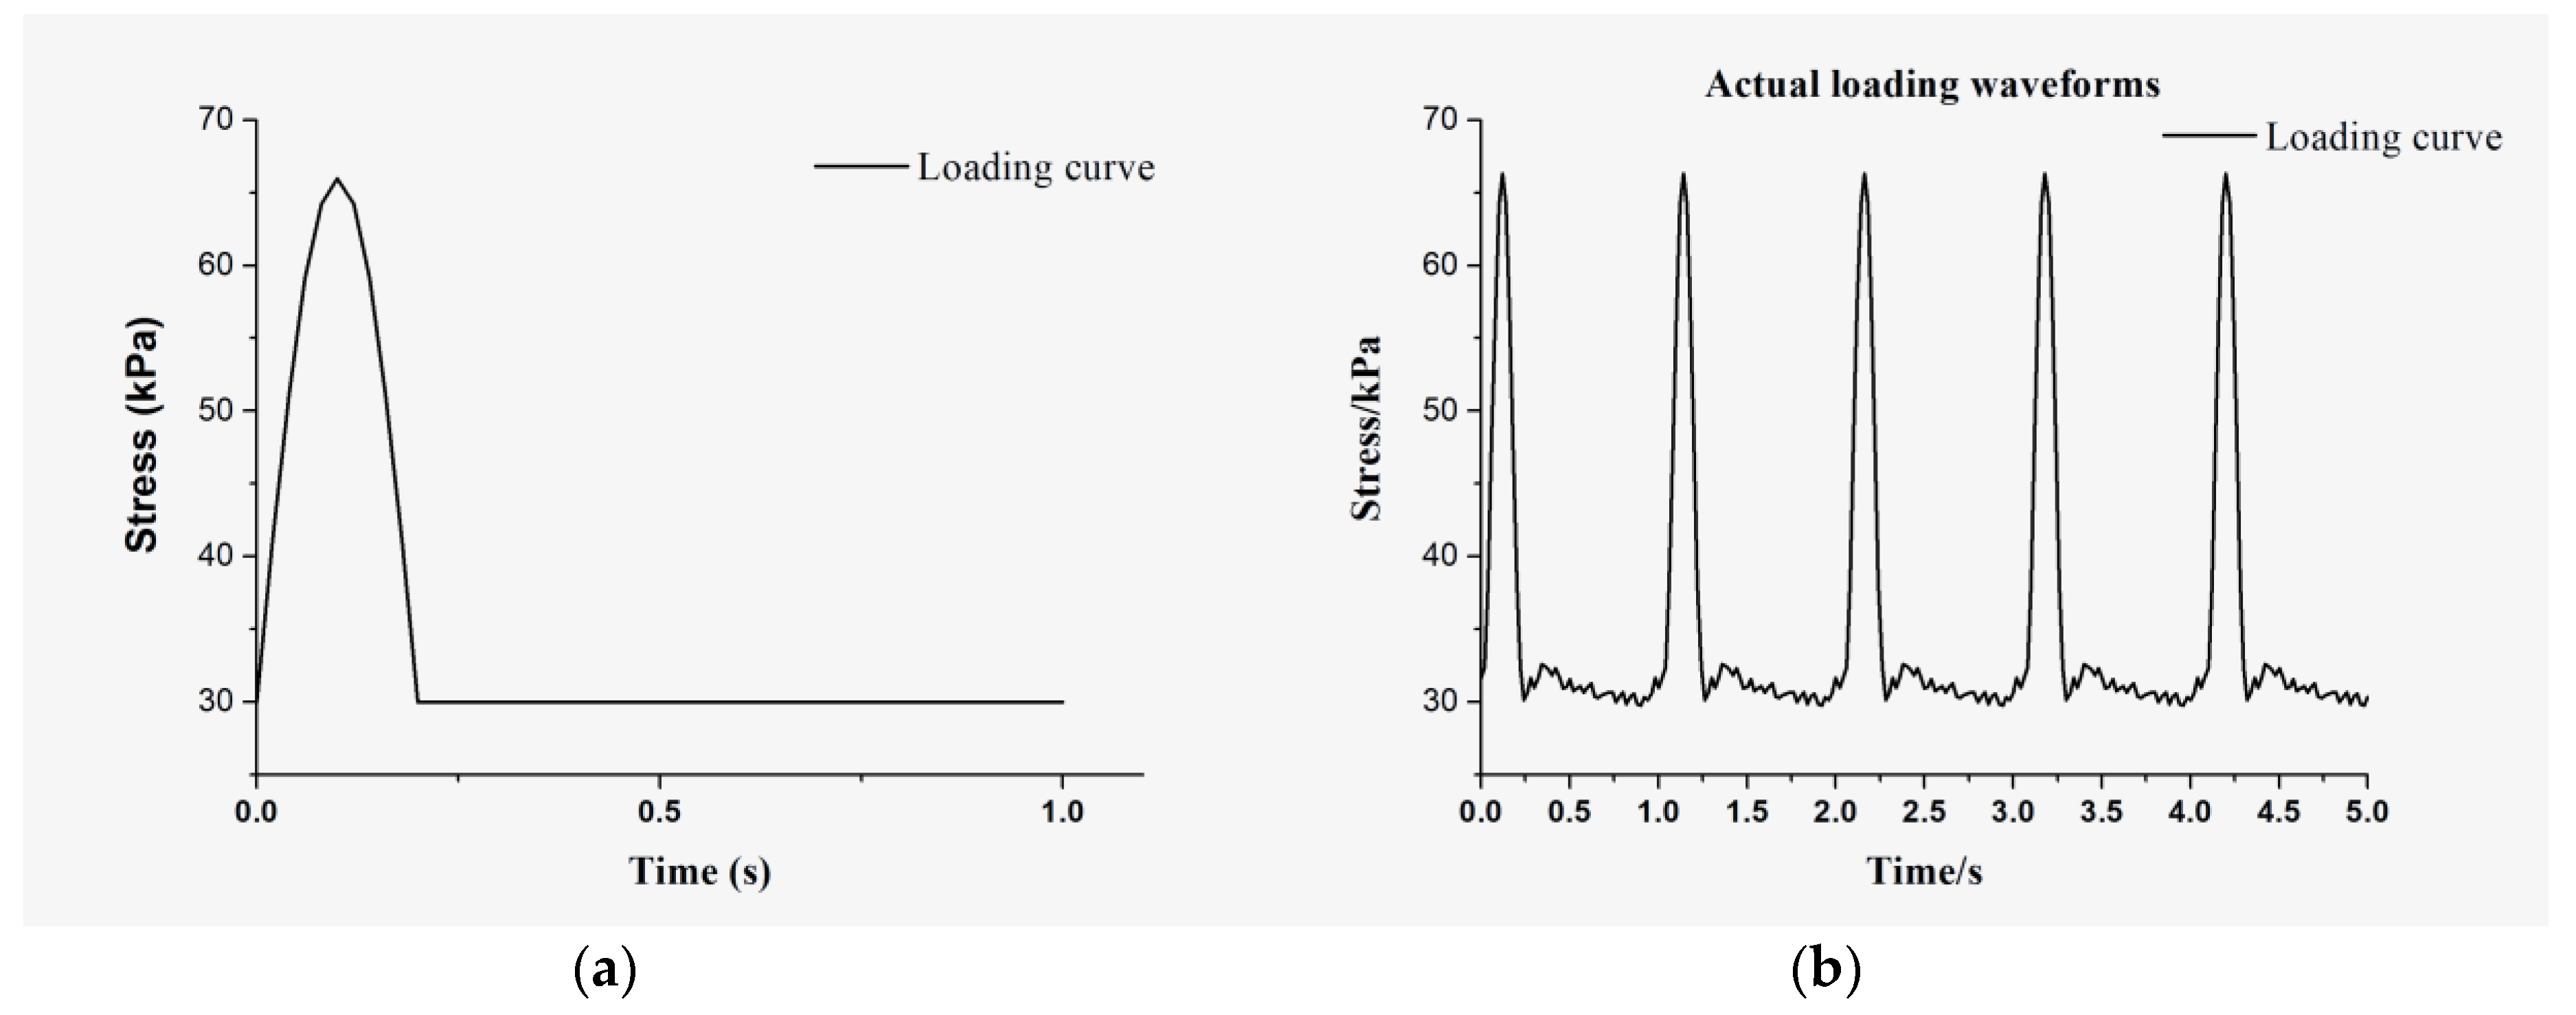
Figure 3.
Procedure of image processing for SEM testing: (a) original image; (b) binarization processing; and (c) removing points and small pores.
Figure 3.
Procedure of image processing for SEM testing: (a) original image; (b) binarization processing; and (c) removing points and small pores.

Figure 4.
Variation curve of resilient modulus versus deviator stress for test soils after (a) 0, (b) 1, and (c) 7 F-T cycles.
Figure 4.
Variation curve of resilient modulus versus deviator stress for test soils after (a) 0, (b) 1, and (c) 7 F-T cycles.

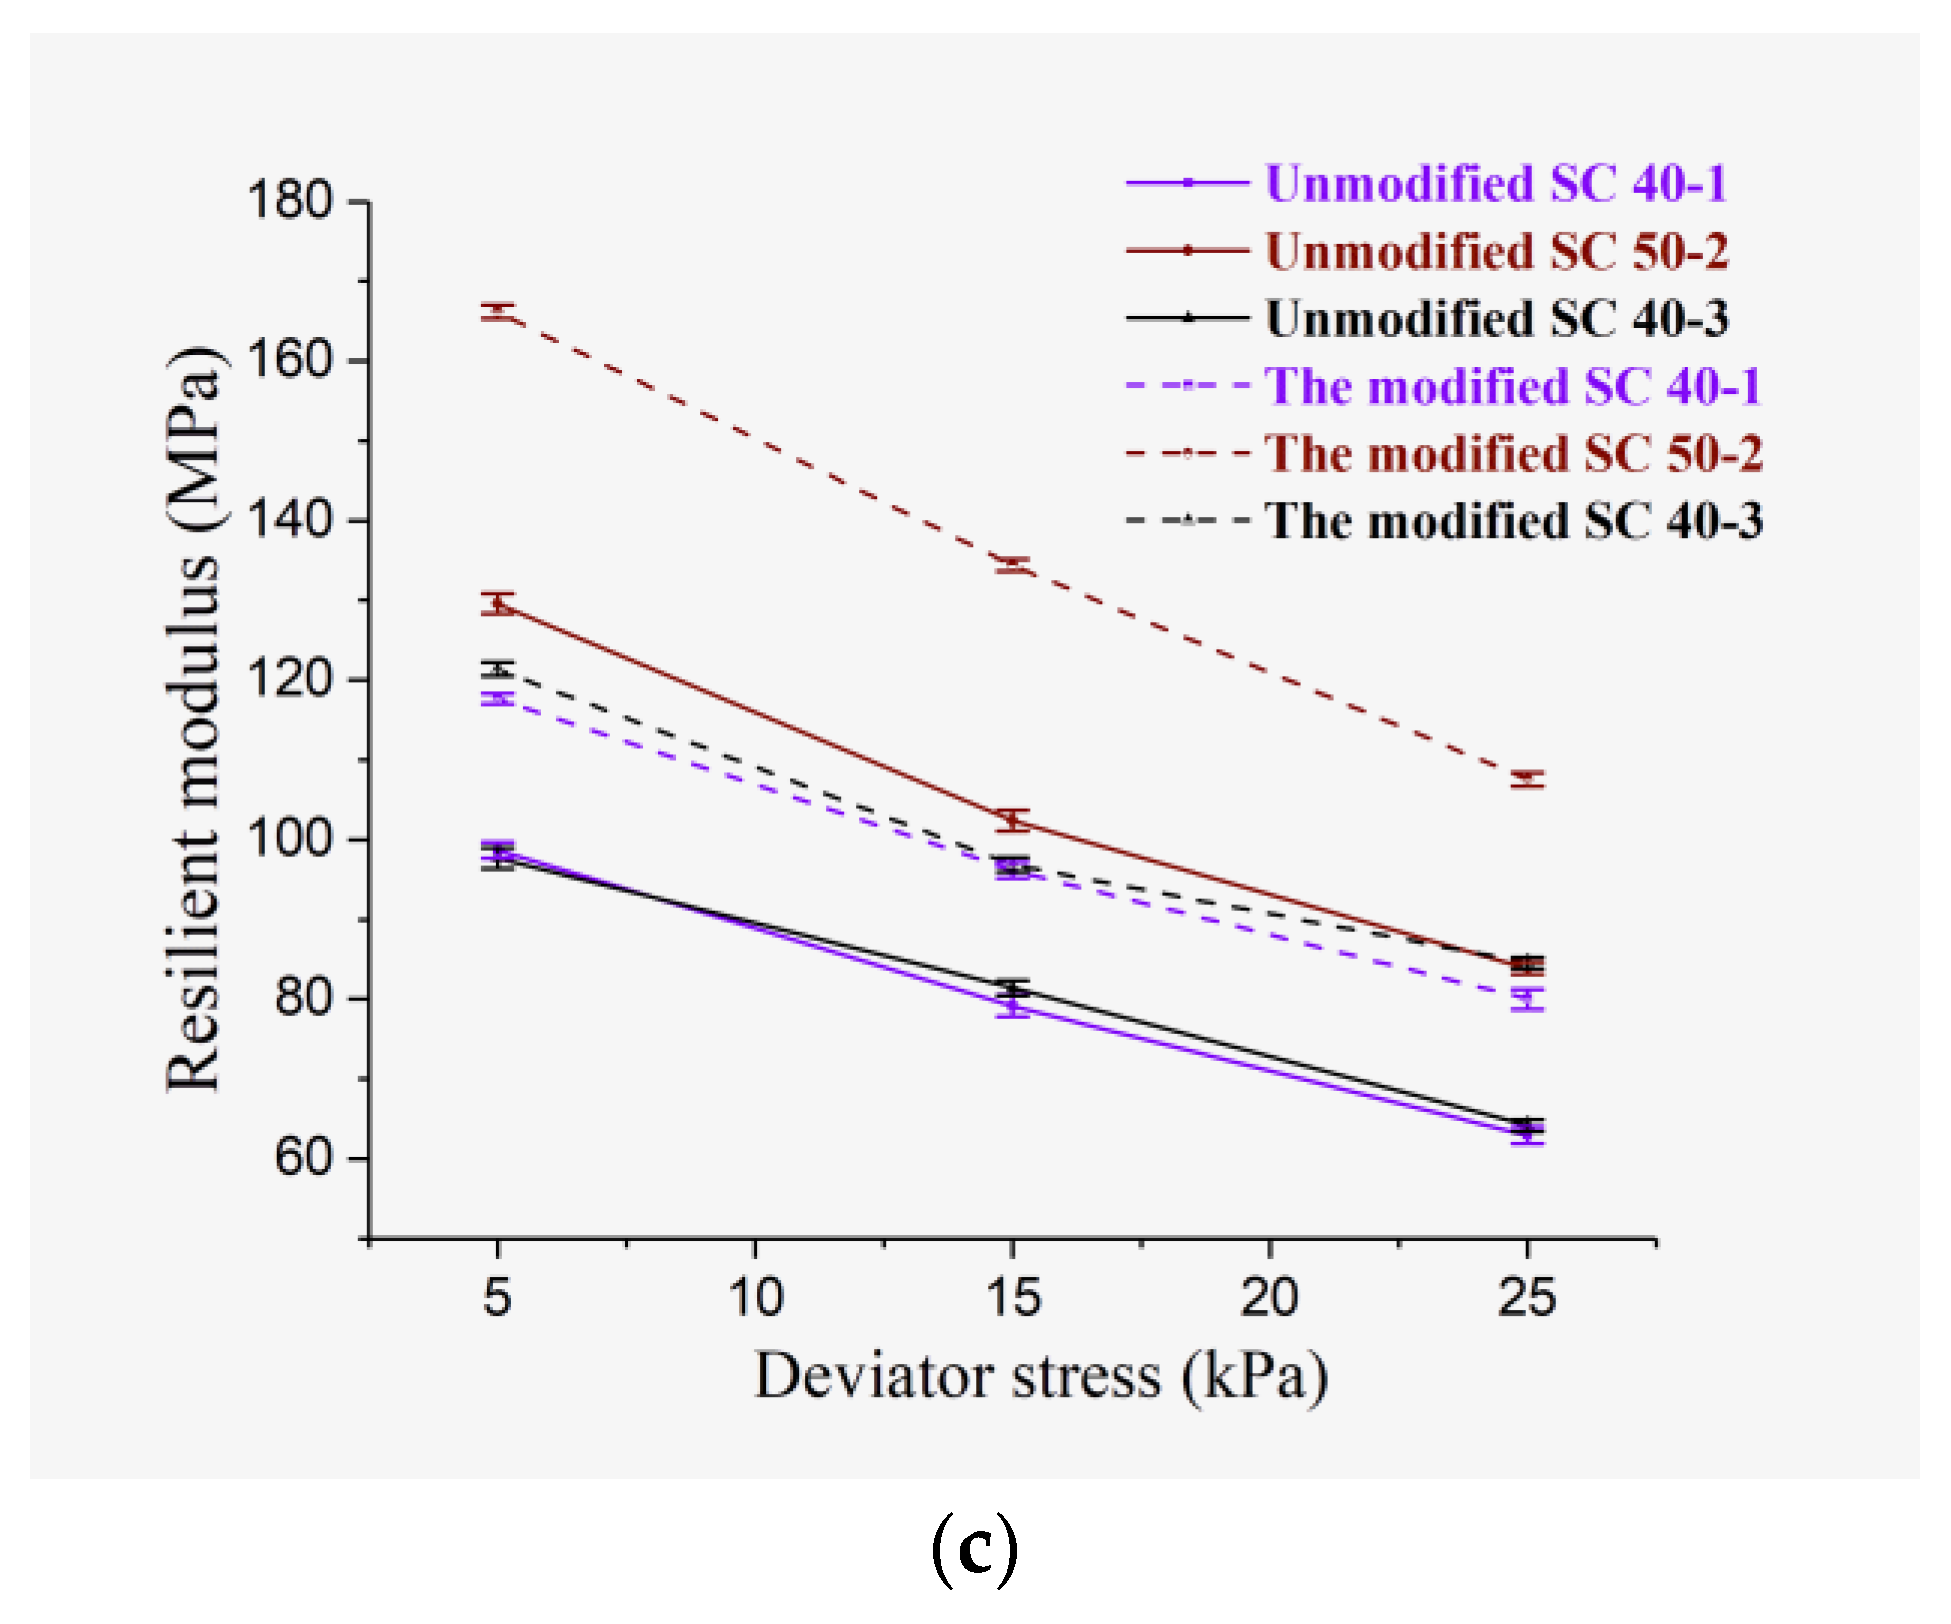
Figure 5.
Variation curve of resilient modulus versus bulk stress for test soils after (a) 0, (b) 1, and (c) 7 F-T cycles.
Figure 5.
Variation curve of resilient modulus versus bulk stress for test soils after (a) 0, (b) 1, and (c) 7 F-T cycles.
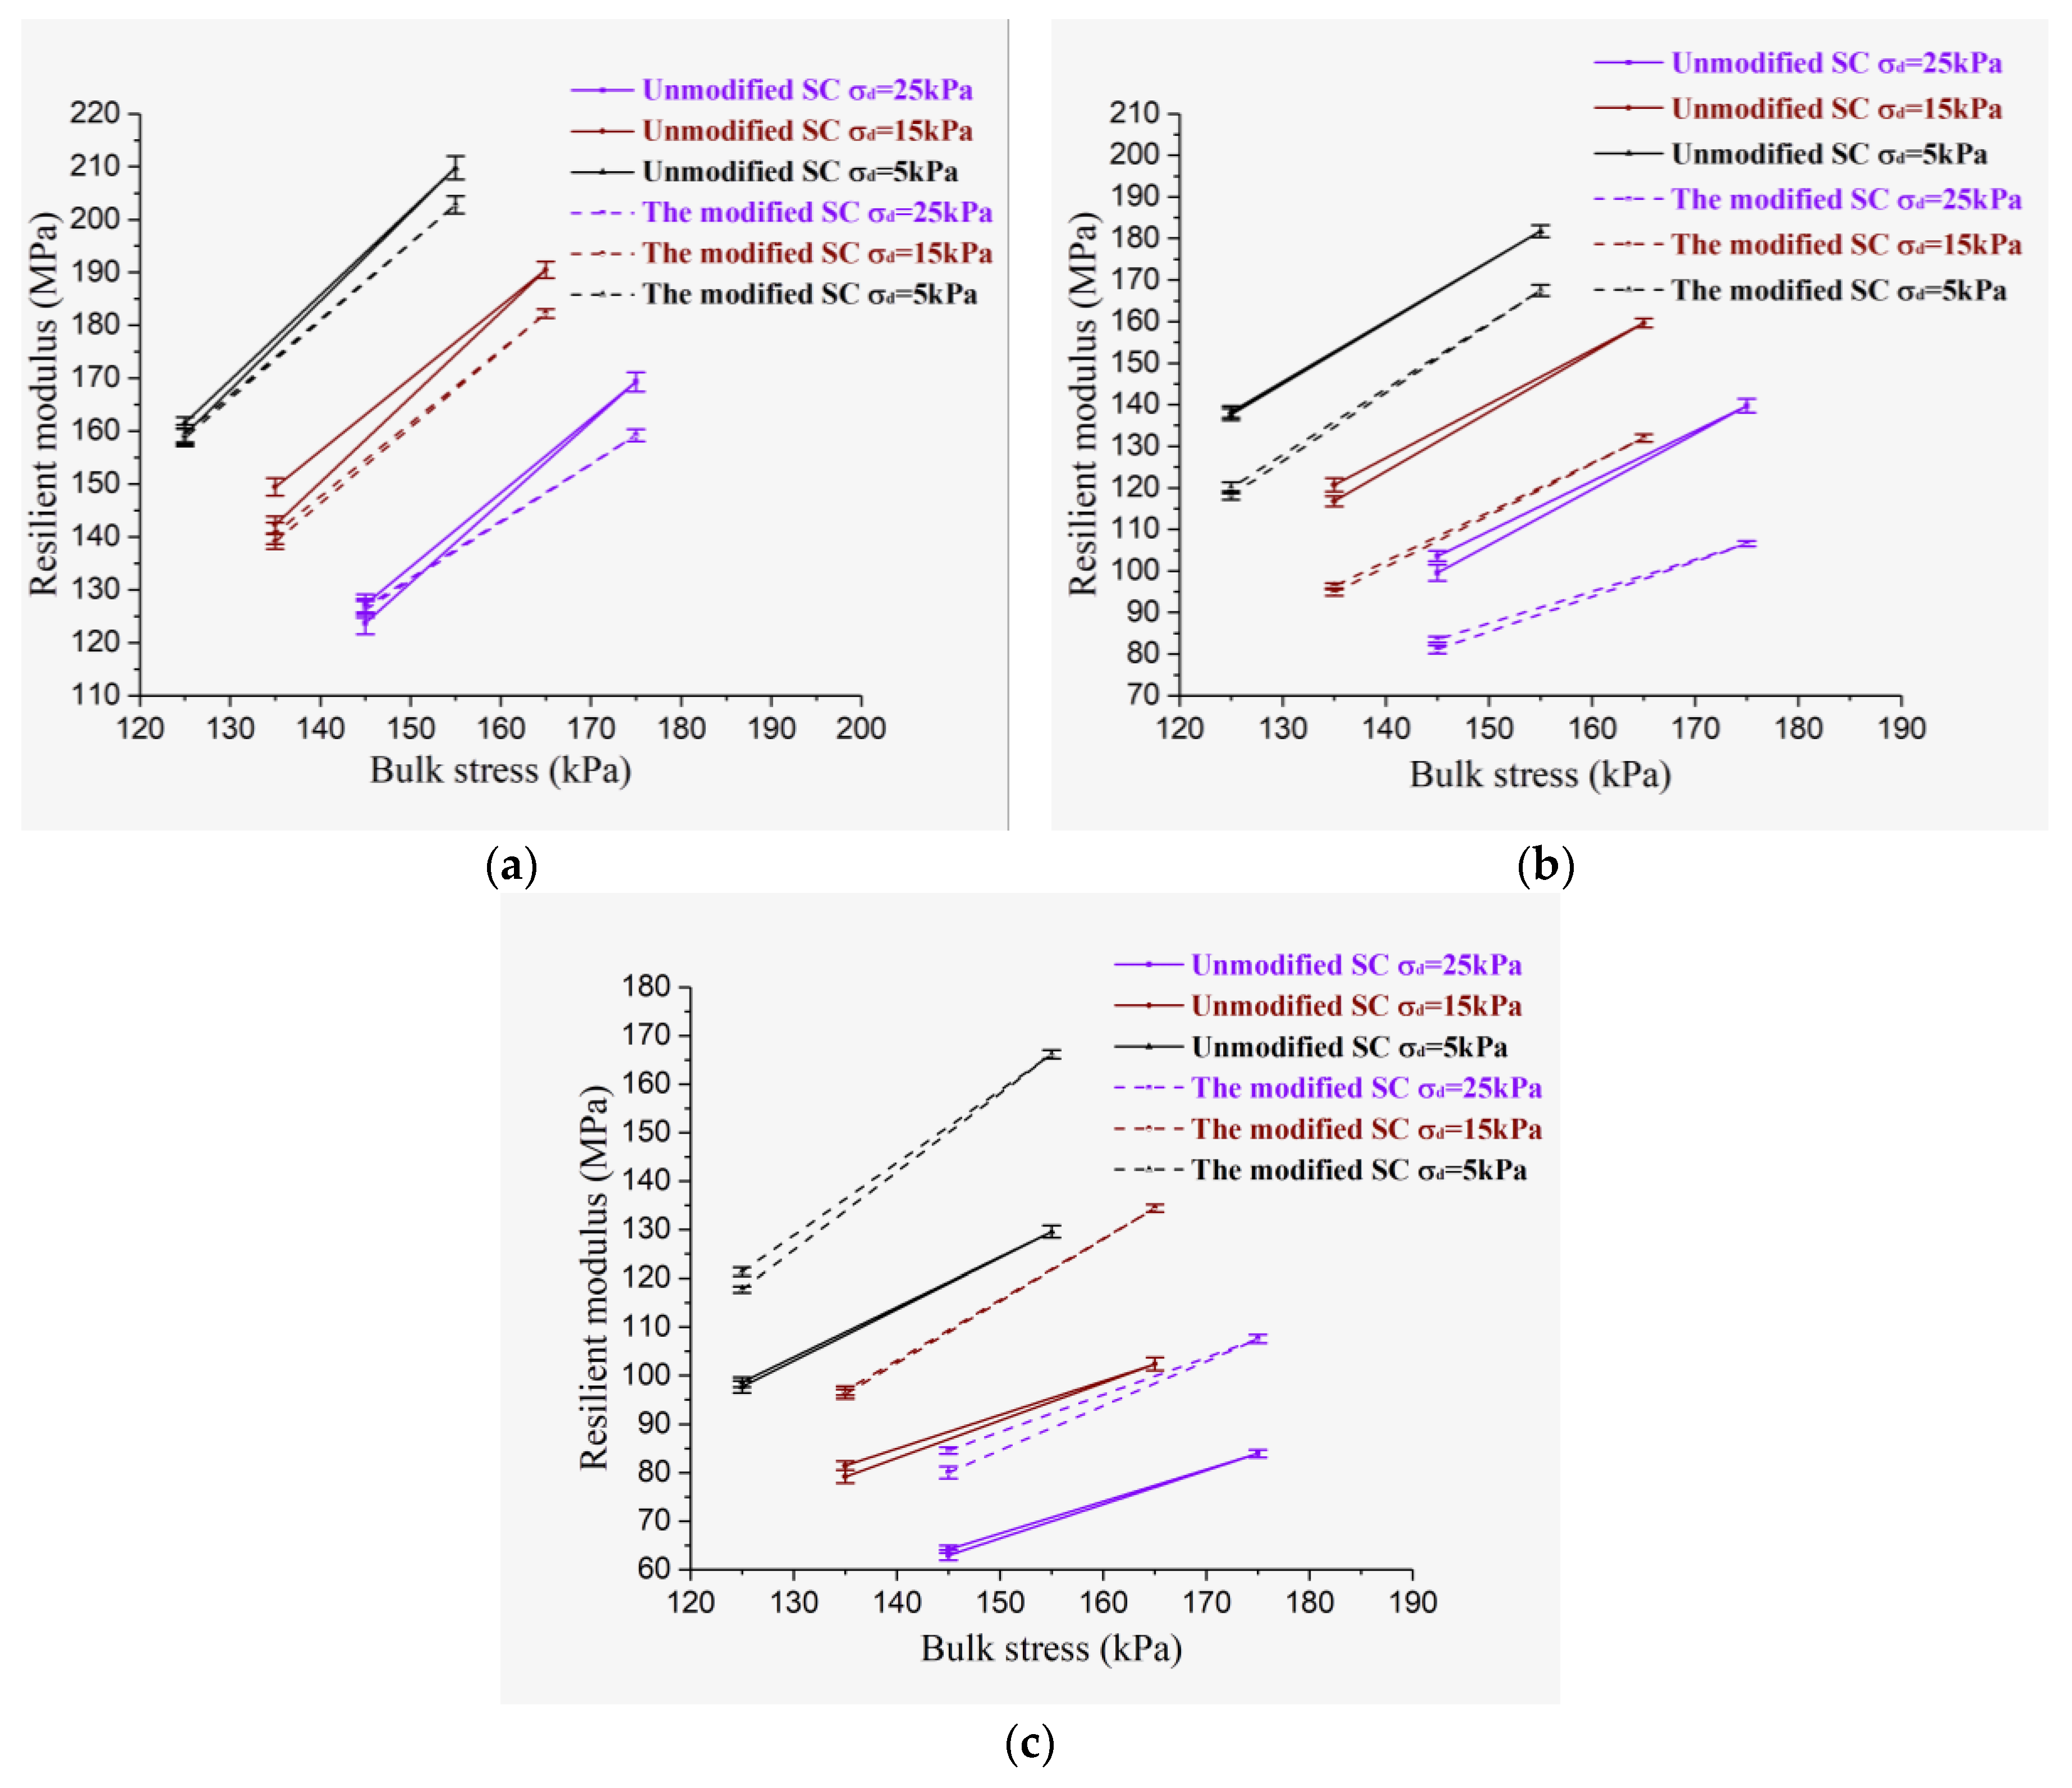
Figure 6.
Variation curves of resilient modulus for test soils after F-T cycles of loading process (a) 40-1 and (b) 50-2.
Figure 6.
Variation curves of resilient modulus for test soils after F-T cycles of loading process (a) 40-1 and (b) 50-2.
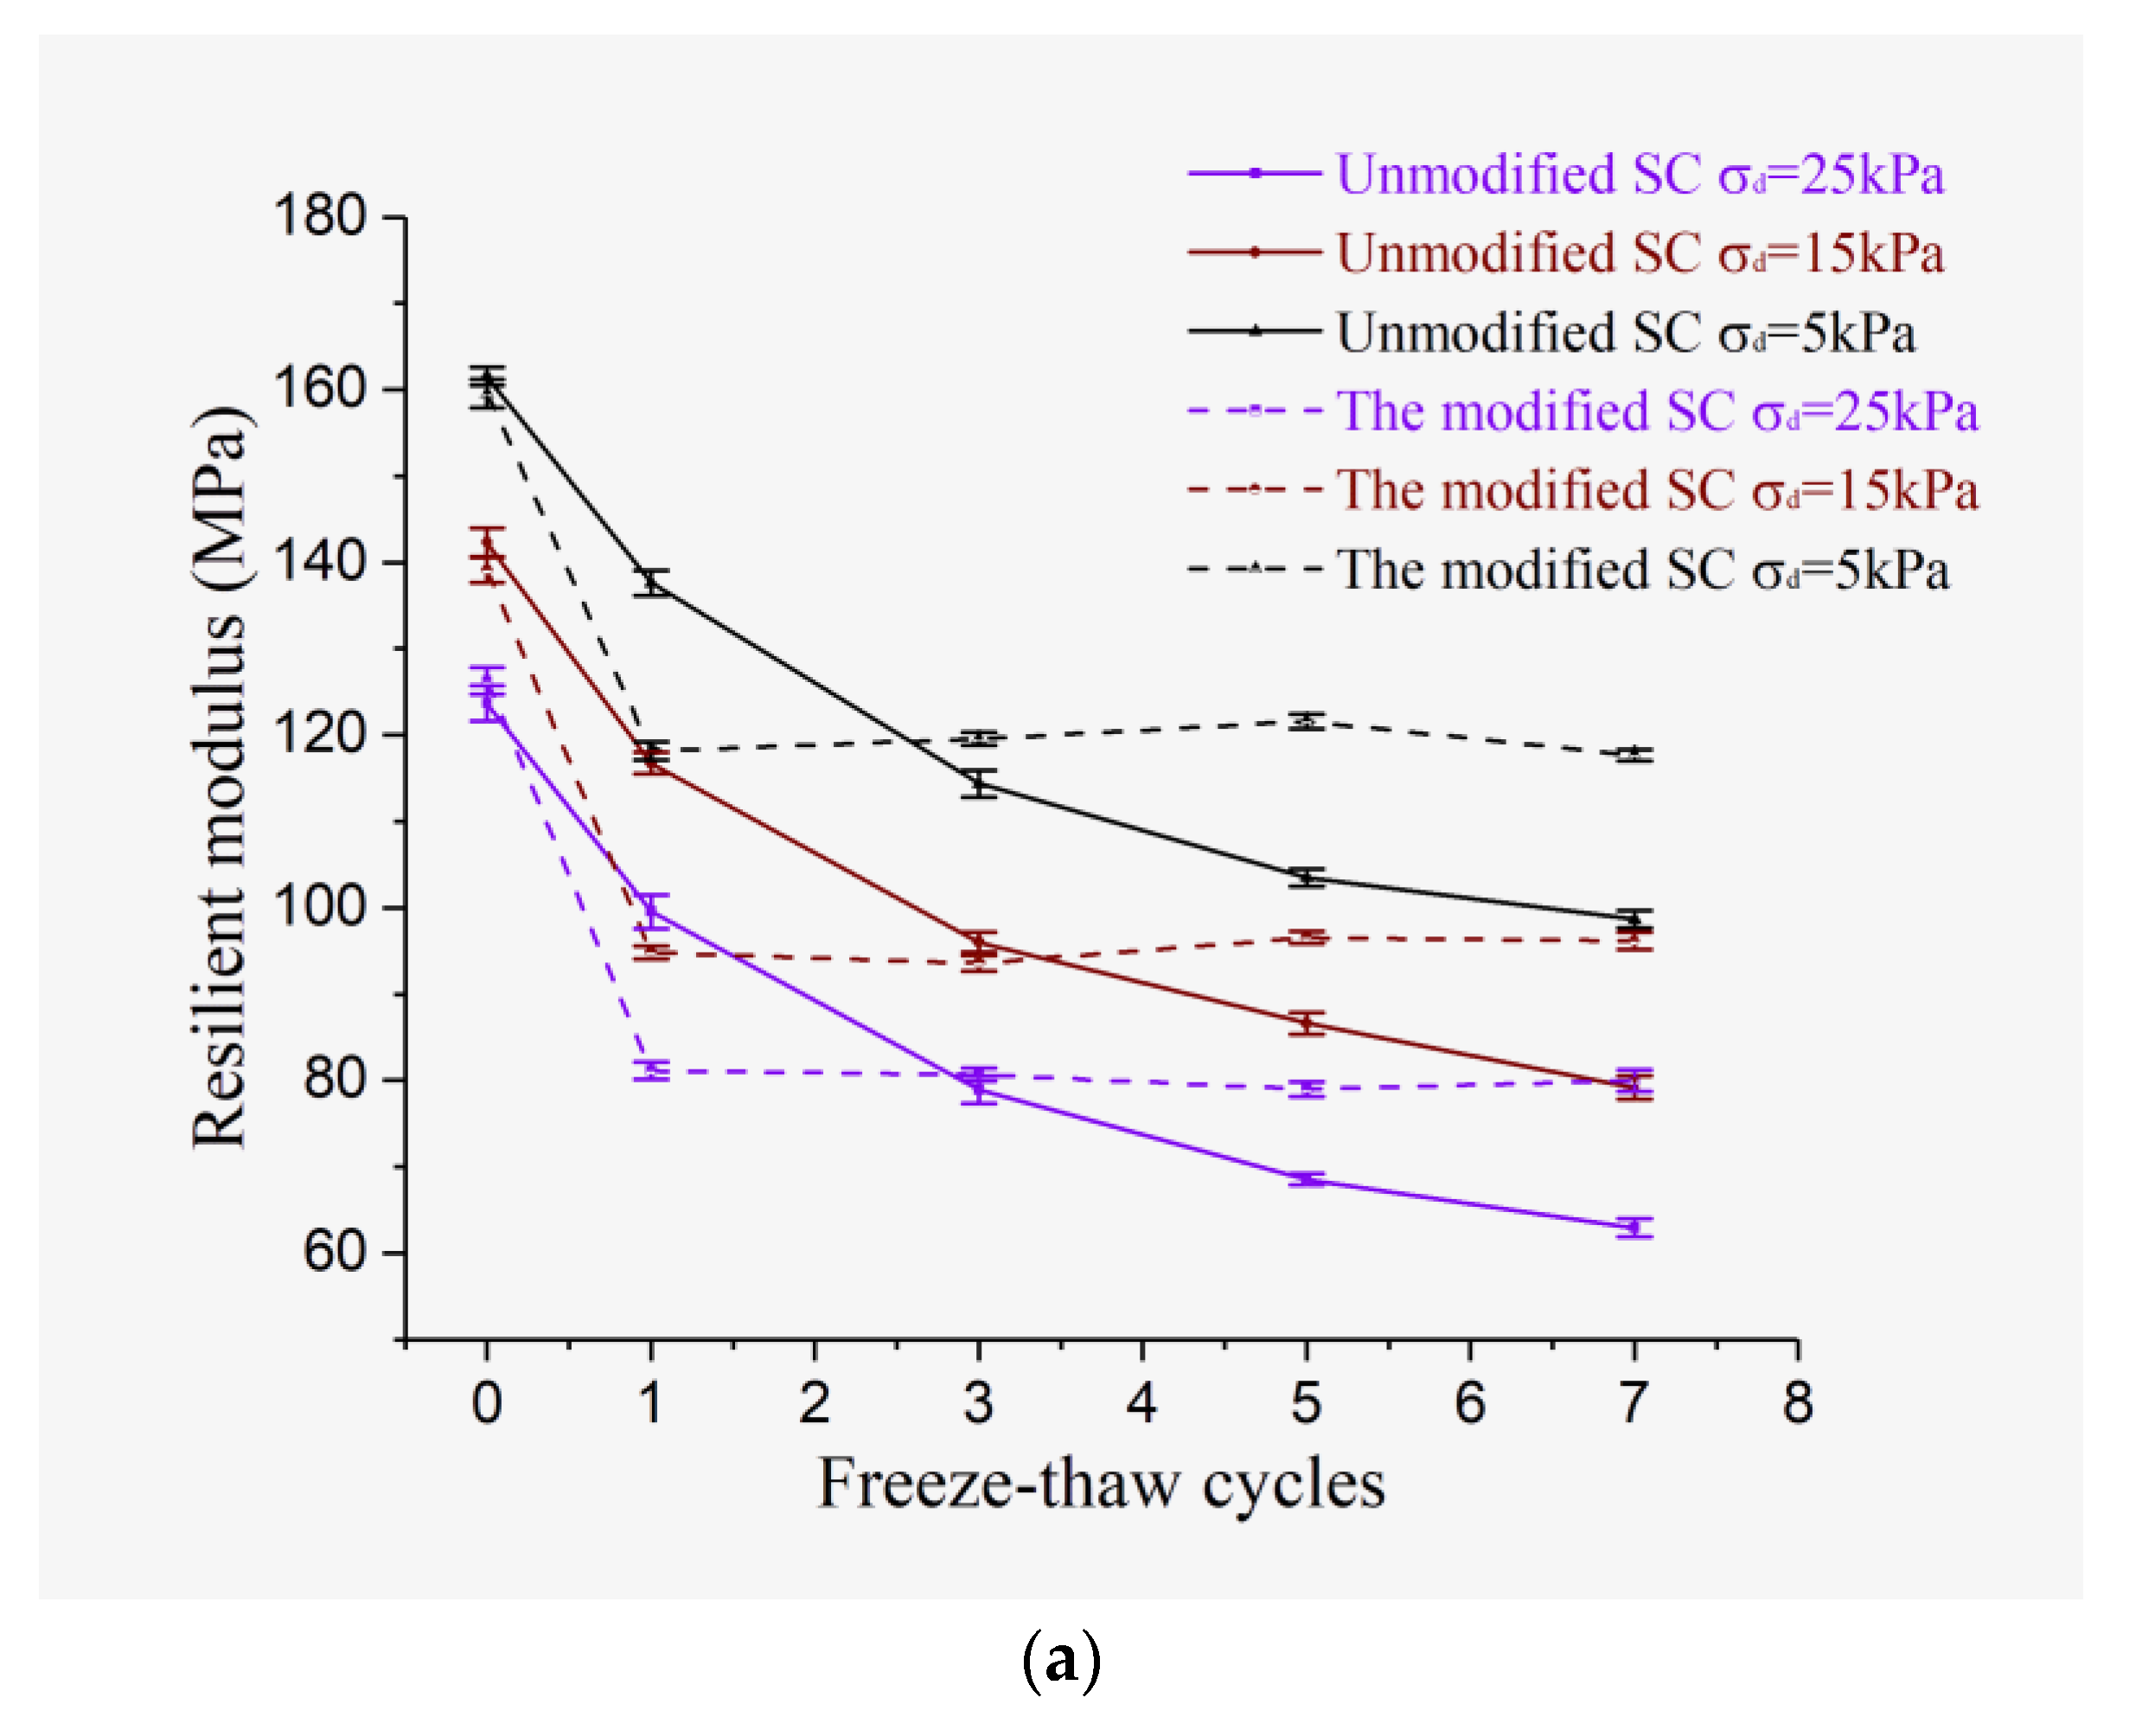
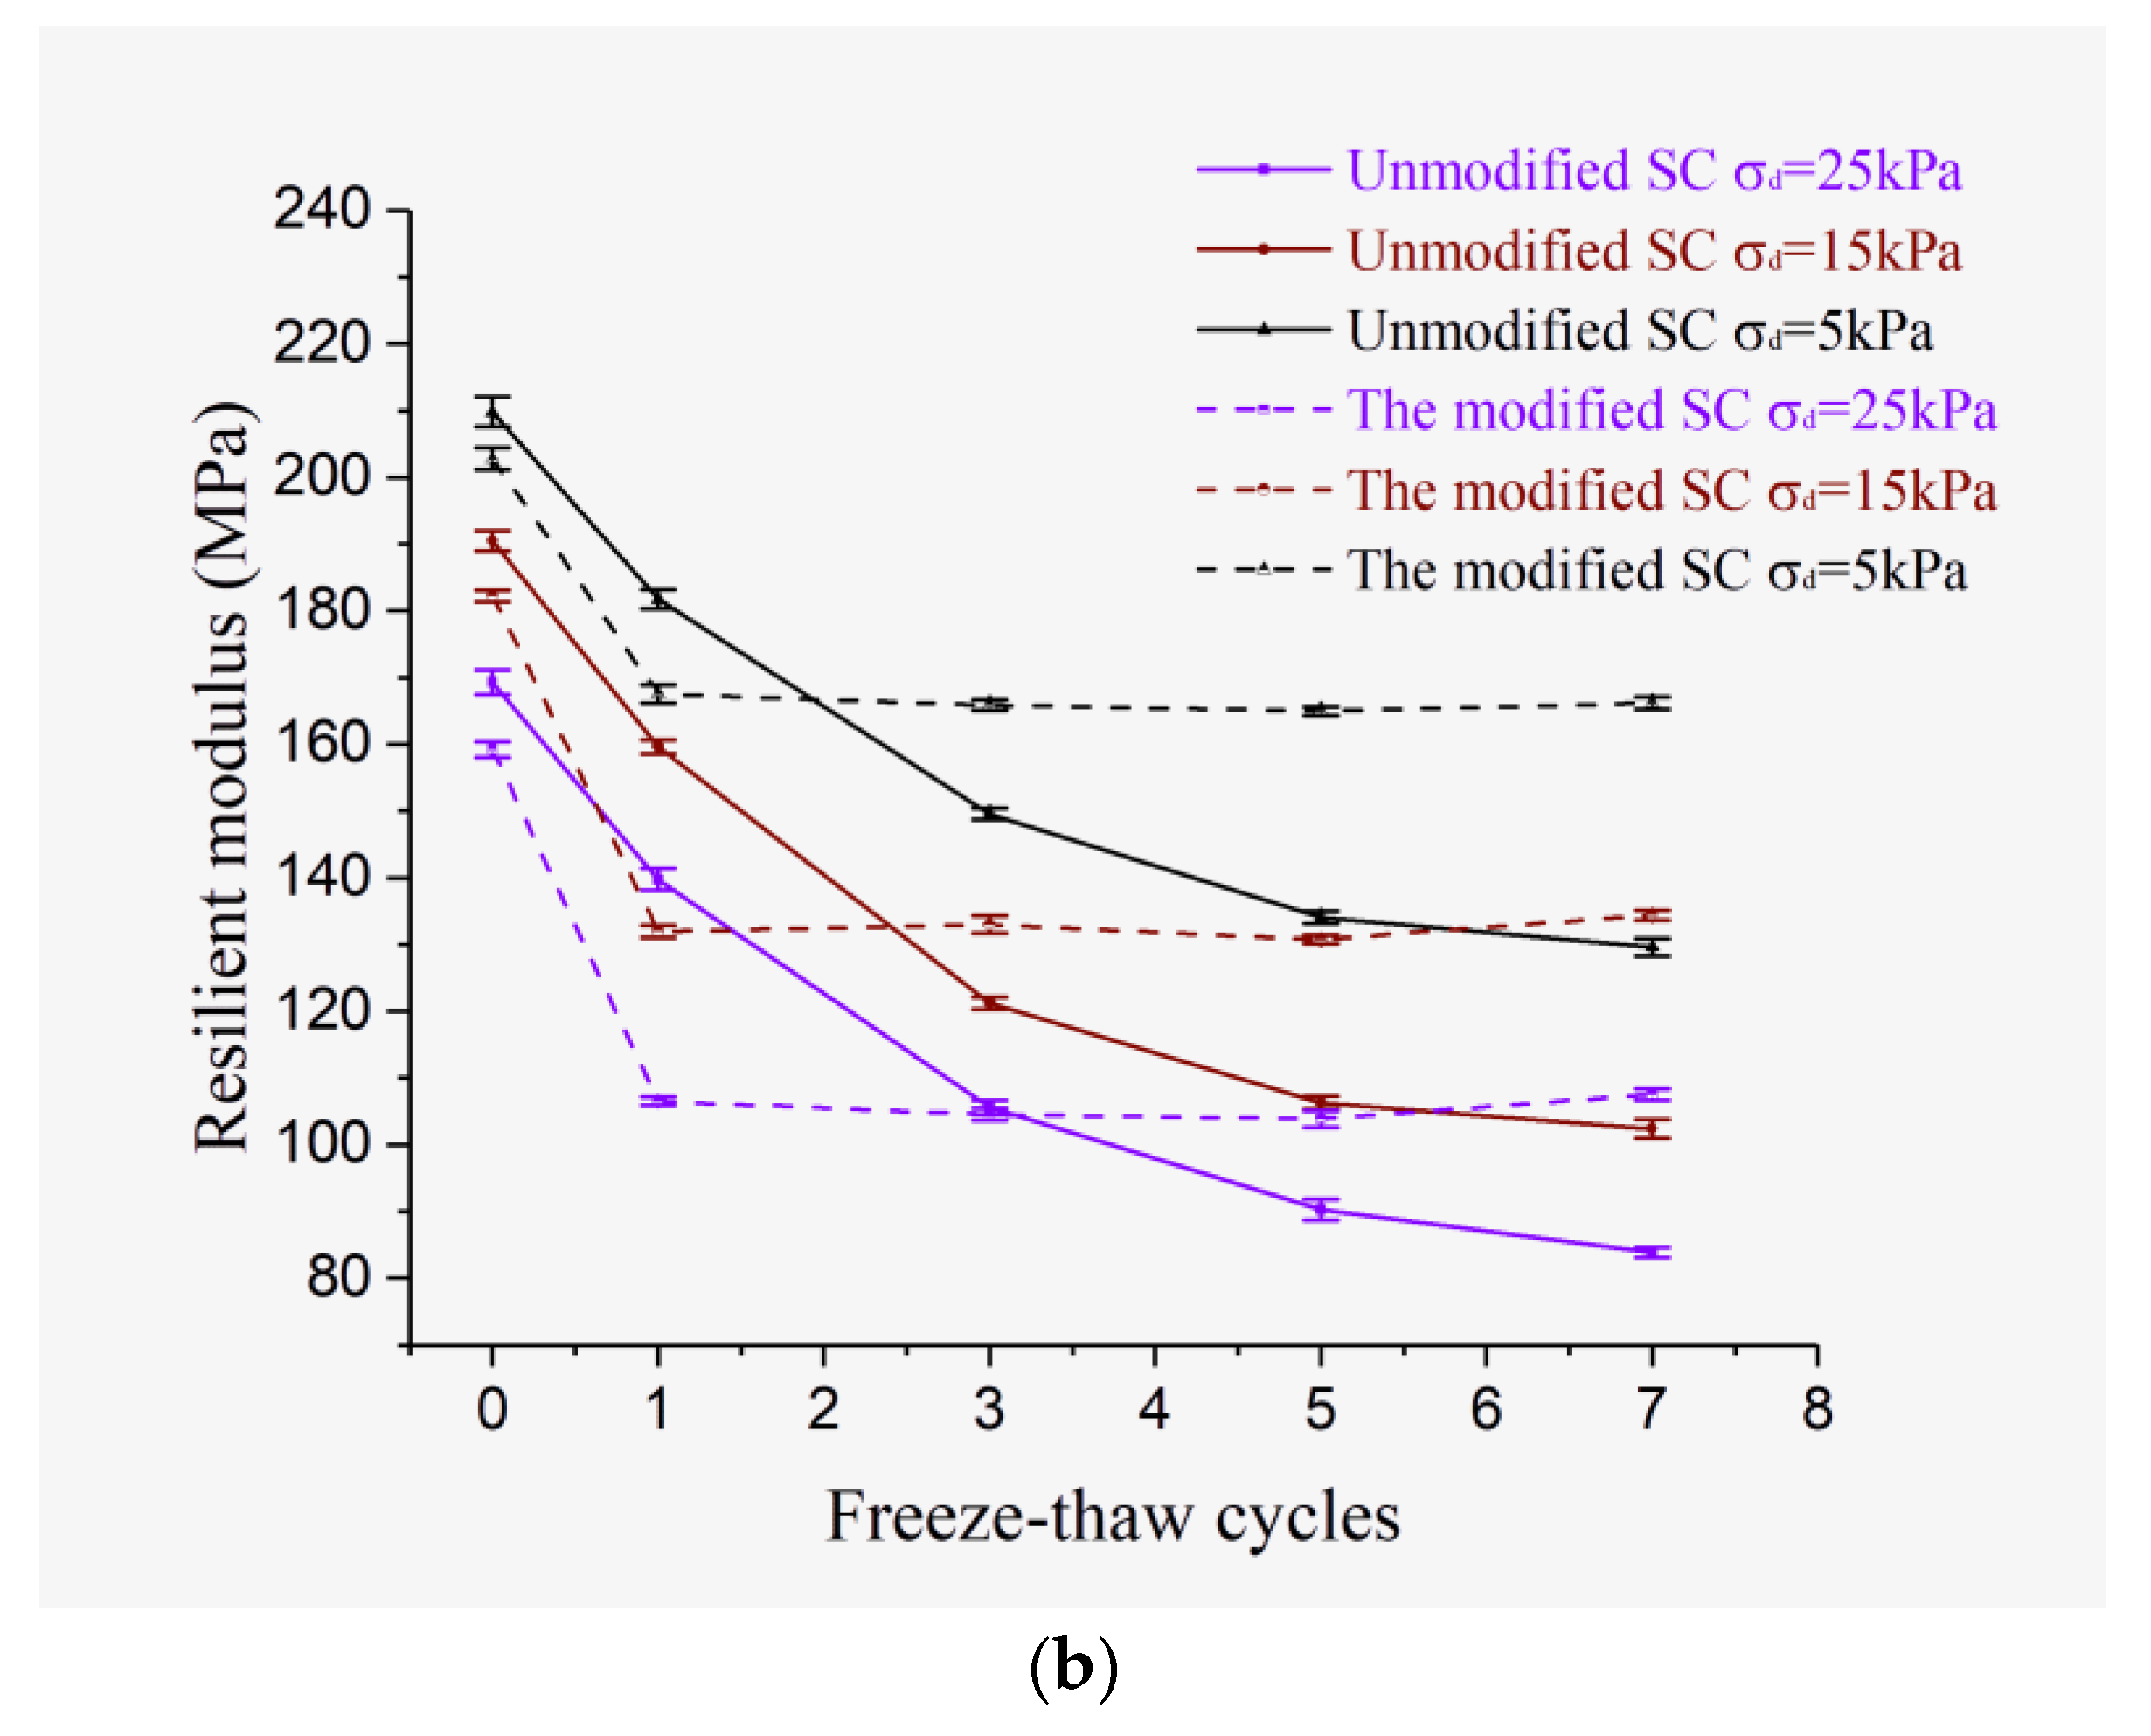
Figure 7.
SEM images for unmodified SC after (a) 0, (b) 1, and (c) 5 F-T cycles.

Figure 8.
SEM images for the modified SC after (a) 0, (b) 1, and (c) 5 F-T cycles.

Figure 9.
Variation curves of resilient modulus and porosity versus F-T cycles for (a) unmodified SC and (b) the modified SC.
Figure 9.
Variation curves of resilient modulus and porosity versus F-T cycles for (a) unmodified SC and (b) the modified SC.

Figure 10.
Variation curves of resilient modulus and mean diameter versus F-T cycles for (a) unmodified SC and (b) the modified SC.
Figure 10.
Variation curves of resilient modulus and mean diameter versus F-T cycles for (a) unmodified SC and (b) the modified SC.


Table 1.
Physical properties of test soils (SC: silty clay).
| Samples | Plastic Limit (%) | Liquid Limit (%) | Plasticity (%) | Optimum Moisture (%) | Maximum Density (g/cm3) | |||||
|---|---|---|---|---|---|---|---|---|---|---|
| Mean | SD | Mean | SD | Mean | SD | Mean | SD | Mean | SD | |
| Unmodified SC | 22.4 | 0.408 | 34.0 | 0.374 | 11.6 | 0.294 | 12.2 | 0.294 | 1.93 | 0.008 |
| The modified SC | 20.2 | 0.283 | 32.6 | 0.294 | 12.4 | 0.327 | 15.0 | 0.283 | 1.52 | 0.014 |
Table 2.
Loading sequence of resilient modulus test.
| Sequence | Confining Pressure σc (kPa) | Cyclic Deviator Stress σd (kPa) | Axial Stress σ1 (kPa) | Loading Cycles |
|---|---|---|---|---|
| 0-Preloading | 30 | 36 | 66 | 1000 |
| 1 | 40 | 25 | 65 | 100 |
| 40 | 15 | 55 | 100 | |
| 40 | 5 | 45 | 100 | |
| 2 | 50 | 5 | 55 | 100 |
| 50 | 15 | 65 | 100 | |
| 50 | 25 | 75 | 100 | |
| 3 | 40 | 25 | 65 | 100 |
| 40 | 15 | 55 | 100 | |
| 40 | 5 | 45 | 100 |
Table 3.
Resilient modulus for unmodified SC.
| Process | Deviator Stress (kPa) | Resilient Modulus after Several Freeze-Thaw (F-T) Cycles (MPa) | |||||||||
|---|---|---|---|---|---|---|---|---|---|---|---|
| 0 | 1 | 3 | 5 | 7 | |||||||
| Mean | SD | Mean | SD | Mean | SD | Mean | SD | Mean | SD | ||
| 40-1 | 25 | 123.69 | 2.09 | 99.56 | 1.98 | 78.92 | 1.60 | 68.55 | 0.68 | 62.96 | 1.05 |
| 15 | 142.31 | 1.63 | 116.77 | 1.23 | 96.03 | 1.13 | 86.63 | 1.23 | 79.15 | 1.34 | |
| 5 | 161.56 | 1.06 | 137.65 | 1.45 | 114.38 | 1.56 | 103.47 | 1.03 | 98.66 | 1.04 | |
| 50-2 | 25 | 169.33 | 1.84 | 139.72 | 1.67 | 105.65 | 1.03 | 90.3 | 1.56 | 83.89 | 0.76 |
| 15 | 190.51 | 1.53 | 159.65 | 1.09 | 121.23 | 0.96 | 106.32 | 0.96 | 102.39 | 1.35 | |
| 5 | 209.77 | 2.21 | 181.75 | 1.45 | 149.57 | 0.86 | 134.05 | 0.93 | 129.58 | 1.26 | |
| 40-3 | 25 | 127.24 | 1.89 | 103.58 | 1.23 | 80.35 | 1.18 | 74.8 | 0.76 | 64.17 | 0.78 |
| 15 | 149.45 | 1.65 | 120.71 | 1.68 | 95.98 | 1.63 | 85.65 | 1.36 | 81.42 | 0.95 | |
| 5 | 159.38 | 1.86 | 138.31 | 1.40 | 117.28 | 0.85 | 102.63 | 1.56 | 97.69 | 1.35 | |
Table 4.
Resilient modulus for SC modified by OSA and FA. OSA: oil shale ash; FA: fly ash.
| Process | Deviator Stress (kPa) | Resilient Modulus after Several F-T Cycles (MPa) | |||||||||
|---|---|---|---|---|---|---|---|---|---|---|---|
| 0 | 1 | 3 | 5 | 7 | |||||||
| Mean | SD | Mean | SD | Mean | SD | Mean | SD | Mean | SD | ||
| 40-1 | 25 | 126.28 | 1.56 | 81.12 | 0.98 | 80.68 | 0.76 | 78.98 | 0.86 | 80.01 | 1.24 |
| 15 | 139.09 | 1.43 | 94.82 | 0.76 | 93.58 | 0.86 | 96.54 | 0.69 | 96.18 | 0.98 | |
| 5 | 159.55 | 1.67 | 118.17 | 1.03 | 119.56 | 0.74 | 121.58 | 0.89 | 117.69 | 0.65 | |
| 50-2 | 25 | 159.22 | 1.13 | 106.53 | 0.62 | 104.56 | 0.89 | 103.87 | 1.26 | 107.55 | 0.86 |
| 15 | 182.24 | 0.85 | 131.97 | 0.89 | 132.98 | 1.32 | 130.75 | 0.65 | 134.39 | 0.74 | |
| 5 | 202.79 | 1.67 | 167.51 | 1.35 | 165.88 | 0.78 | 164.99 | 0.68 | 166.16 | 0.87 | |
| 40-3 | 25 | 126.82 | 1.48 | 83.54 | 0.69 | 84.12 | 1.13 | 82.95 | 0.74 | 84.56 | 0.69 |
| 15 | 140.69 | 2.03 | 96.42 | 0.59 | 97.01 | 0.69 | 95.58 | 0.95 | 96.87 | 0.93 | |
| 5 | 158.78 | 1.67 | 120.03 | 1.36 | 122.45 | 0.83 | 118.84 | 0.92 | 121.36 | 0.84 | |
Table 5.
Damage ratio of resilient modulus for unmodified SC after F-T cycles.
| Process | Deviator Stress (kPa) | F-T Cycles | Fitting Equations | |||
|---|---|---|---|---|---|---|
| 1 | 3 | 5 | 7 | |||
| 40-1 | 25 | 19.49% | 36.18% | 44.57% | 49.09% | y = 0.5077 − 0.5024e^(−n/2.3014), R2 = 0.99 |
| 15 | 17.95% | 32.52% | 39.13% | 44.38% | y = 0.4524 − 0.4461e^(−n/2.2711), R2 = 0.99 | |
| 5 | 14.80% | 29.20% | 35.96% | 38.93% | y = 0.4074 − 0.4056e^(−n/2.3252), R2 = 0.99 | |
| 50-2 | 25 | 17.49% | 37.61% | 46.67% | 50.46% | y = 0.5393 − 0.5400e^(−n/2.5156), R2 = 0.99 |
| 15 | 16.20% | 36.37% | 44.19% | 46.25% | y = 0.4928 − 0.4967e^(−n/2.3014), R2 = 0.99 | |
| 5 | 13.36% | 28.70% | 36.10% | 38.23% | y = 0.4103 − 0.4113e^(−n/2.4765), R2 = 0.99 | |
Table 6.
Damage ratio of resilient modulus for the modified SC after F-T cycles.
| Process | Deviator Stress (kPa) | F-T cycles | Fitting Equations | |||
|---|---|---|---|---|---|---|
| 1 | 3 | 5 | 7 | |||
| 40-1 | 25 | 35.76% | 36.11% | 37.46 | 36.64% | y = 0.3674 − 0.3674e^(−n/0.2756), R2 = 0.99 |
| 15 | 31.38% | 32.72% | 30.59% | 30.85% | y = 0.3056 − 0.3010e^(−n/0.0224), R2 = 0.98 | |
| 5 | 25.94% | 25.06% | 23.80% | 26.24% | y = 0.2506 − 0.2503e^(−n/0.0080), R2 = 0.98 | |
| 50-2 | 25 | 33.09% | 34.33% | 34.76% | 32.45% | y = 0.3385 − 0.3385e^(−n/0.2630), R2 = 0.99 |
| 15 | 27.58% | 27.03% | 28.25% | 26.26% | y = 0.2718 − 0.2718e^(−n/0.0253), R2 = 0.99 | |
| 5 | 17.40% | 18.20% | 18.64% | 18.06% | y = 0.1830 − 0.1830e^(−n/0.3327), R2 = 0.99 | |
Table 7.
Results of significance analysis for test soils.
| Soil Types | Group | Fixed Factors | Sum of Squares | Variance | Mean Square | F Value | p Value |
|---|---|---|---|---|---|---|---|
| Unmodified SC | 40-1 and 50-2 | Confining pressure | 8447.723 | 1 | 8447.723 | 235.677 | <0.05(Significant) |
| Deviator stress | 7943.085 | 2 | 3971.542 | 110.799 | <0.05(Significant) | ||
| F-T cycles | 22731.808 | 4 | 5682.952 | 158.545 | <0.05(Significant) | ||
| The modified SC | 40-1 and 50-2 | Confining pressure | 10362.438 | 1 | 10362.438 | 348.872 | <0.05(Significant) |
| Deviator stress | 11361.213 | 2 | 5680.606 | 191.249 | <0.05(Significant) | ||
| F-T cycles | 9734.423 | 4 | 2433.606 | 81.932 | <0.05(Significant) |
Table 8.
Correlations between resilient modulus and porosity.
| Soil Types | Factors | Porosity | Resilient Modulus | |
|---|---|---|---|---|
| Unmodified SC | Porosity | Pearson correlation coefficient | 1 | −0.979 |
| Significance (2-tailed) | 0.021 | |||
| N | 4 | 4 | ||
| Resilient Modulus | Pearson correlation coefficient | −0.979 | 1 | |
| Significance (2-tailed) | 0.021 | |||
| N | 4 | 4 | ||
| The modified SC | Porosity | Pearson correlation coefficient | 1 | −0.993 |
| Significance (2-tailed) | 0.007 | |||
| N | 4 | 4 | ||
| Resilient Modulus | Pearson correlation coefficient | −0.993 | 1 | |
| Significance (2-tailed) | 0.007 | |||
| N | 4 | 4 |
Table 9.
Correlations between resilient modulus and mean diameter of pores.
| Soil types | Factors | Mean Diameter | Resilient Modulus | |
|---|---|---|---|---|
| Unmodified SC | Mean diameter | Pearson correlation coefficient | 1 | −0.990 |
| Significance (2-tailed) | 0.010 | |||
| N | 4 | 4 | ||
| Resilient Modulus | Pearson correlation coefficient | −0.990 | 1 | |
| Significance (2-tailed) | 0.010 | |||
| N | 4 | 4 | ||
| The modified SC | Mean diameter | Pearson correlation coefficient | 1 | −0.951 |
| Significance (2-tailed) | 0.049 | |||
| N | 4 | 4 | ||
| Resilient Modulus | Pearson correlation coefficient | −0.951 | 1 | |
| Significance (2-tailed) | 0.049 | |||
| N | 4 | 4 |
Table 10.
Results of pore distribution analysis for the two materials.
| Soil Types | F-T Cycles | Porosity (%) | Mean Diameter (mm) | Small Pore Proportion d < 2 µm | Medium Pore Proportion 2 µm < d < 5 µm | Large Pore Proportion d > 5 µm |
|---|---|---|---|---|---|---|
| Unmodified SC | 0 | 0.94 | 2.04 | 83.51% | 16.49% | 0 |
| 1 | 4.35 | 2.28 | 73.24% | 25.91% | 0.85% | |
| 3 | 5.84 | 2.49 | 72.40% | 23.04% | 4.56% | |
| 5 | 7.11 | 2.71 | 66.59% | 25.70% | 7.71% | |
| The modified SC | 0 | 2.67 | 2.76 | 74.30% | 23.77% | 1.93% |
| 1 | 7.66 | 3.18 | 68.66% | 28.28% | 2.46% | |
| 3 | 7.59 | 3.36 | 67.58% | 29.62% | 2.80% | |
| 5 | 8.39 | 3.42 | 64.29% | 32.67% | 3.04% |
© 2018 by the authors. Licensee MDPI, Basel, Switzerland. This article is an open access article distributed under the terms and conditions of the Creative Commons Attribution (CC BY) license (http://creativecommons.org/licenses/by/4.0/).
Share and Cite
MDPI and ACS Style
Wei, H.; Zhang, Y.; Wang, F.; Che, G.; Li, Q. Experimental Research on Resilient Modulus of Silty Clay Modified by Oil Shale Ash and Fly Ash after Freeze-Thaw Cycles. Appl. Sci. 2018, 8, 1298. https://doi.org/10.3390/app8081298
AMA Style
Wei H, Zhang Y, Wang F, Che G, Li Q. Experimental Research on Resilient Modulus of Silty Clay Modified by Oil Shale Ash and Fly Ash after Freeze-Thaw Cycles. Applied Sciences. 2018; 8(8):1298. https://doi.org/10.3390/app8081298
Chicago/Turabian StyleWei, Haibin, Yangpeng Zhang, Fuyu Wang, Gaofeng Che, and Qinglin Li. 2018. "Experimental Research on Resilient Modulus of Silty Clay Modified by Oil Shale Ash and Fly Ash after Freeze-Thaw Cycles" Applied Sciences 8, no. 8: 1298. https://doi.org/10.3390/app8081298
Note that from the first issue of 2016, this journal uses article numbers instead of page numbers. See further details here.