Research on Stagger Coupling Mode of Pulse Duration and Tool Vibration in Electrochemical Machining

College of mechanical and Electrical Engineering, Nanjing University of Aeronautics and Astronautics, Nanjing 210016, China
*
Author to whom correspondence should be addressed.
Appl. Sci. 2018, 8(8), 1296; https://doi.org/10.3390/app8081296
Submission received: 13 July 2018
/
Revised: 31 July 2018
/
Accepted: 2 August 2018
/
Published: 3 August 2018
(This article belongs to the Section Mechanical Engineering)
Abstract
:Tuning the coupling of pulse duration and tool vibration in electrochemical machining (PVECM) is an effective method to improve machining accuracy and surface quality. In general, the pulse is set at the same frequency as the tool vibration, and a symmetrical distribution is attained at the minimum inter-electrode gap. To analyse the characteristics of the electrolyte fluid flow and of the electrolysis products in the oscillating inter-electrode gap, a dynamic simulation of the PVECM process was carried out. The simulation results indicated that the electrolyte pressure and gas void fraction when the pulse arrived as the inter-electrode gap was narrowing clearly differed from those when the inter-electrode gap was expanding. Therefore, in addition to the traditional symmetry coupling mode, two other coupling modes called the pre-position and the post-position coupling modes are proposed which use a pulse either just before or just after the minimum inter-electrode gap. Comparative experiments involving the feed rate and machining localization were carried out to evaluate the influence of the three coupling modes. In addition, current waveforms were recorded to analyse the differences between the three coupling modes. The results revealed that the highest feed rate and the best machining localization were achieved by using the pre-position coupling mode.
1. Introduction
Electrochemical machining (ECM) is a non-traditional machining process that removes workpiece material via a controlled electrochemical anodic dissolution reaction. With its special characteristics (e.g., no tool wear, high material removal rate, and independence of material hardness [1,2,3]), ECM has been widely applied in aviation, aerospace, energy, healthcare, and other high-tech fields [4,5]. Adjusting the coupling of pulse duration and tool vibration in ECM (PVECM) is an effective method to improve machining accuracy and surface quality [6,7,8,9]. The PVECM process can achieve electrochemical machining in smaller inter-electrode gaps, and can remove electrolysis products and Joule heat from major inter-electrode gaps. Alternating the machining and scouring processes has a positive and beneficial effect on improving the electrolyte flow field.
Numerous studies have evaluated the effect of tool vibration. For example, Hewidy et al. presented a mathematical model that included vibration to investigate how input parameters affect the efficacy of tool vibration [10]. By using low-frequency tool vibration, Liu et al. significantly improved electrolyte velocities in the inter-electrode gap to improve the removal rate of electrolytic products [11]. Natsu et al. investigated how vibration direction, amplitude, and tool feed rate affect the replicating accuracy and processing speed by applying ultrasonic vibration to ECM [12]. Zhao et al. proposed different feed modes with vibration to improve the stability and localization of ECM [13]. Pan et al. presented an electrochemical micro-machining method with cathode vibration feed based on the mechanics of vibration and the electrochemical principle [14]. Yang et al. improved electrolyte diffusion and convection by applying ultrasonic vibrations [15], and Liu et al. improved the flow field of machining regions in the process with tool vibration [16].
Previous research into PVECM focused on how pulse and vibration parameters such as vibration frequency, vibration amplitude, and pulse duration affect machining accuracy and surface quality [10,17,18,19]. There are few studies on the effects of coupling modes of pulse duration and tool vibration. The traditional coupling mode of pulse duration always uses a symmetrical distribution at the moment when the cathode attains the minimum inter-electrode gap. In this coupling mode, the pulse duration consists of two different stages: one where the inter-electrode gap narrows and one where it expands. The electrolyte flow field and the electrolysis products should differ in each stage. The traditional symmetry coupling mode may not be the optimal one. Other than the traditional symmetry coupling mode, two other modes of coupling pulse duration and tool vibration are presented: the pre-position and post-position coupling modes. In the pre-position (post-position) coupling mode, the pulse occurs before (after) the cathode attains the minimum inter-electrode gap.
For this study, simulation analysis and comparative experiments involving the three coupling modes of pulse duration and tool vibration were carried out. In this document, a multi-physical model that couples fluid flow, electricity, and heat is presented. The simulation results indicated that the electrolyte pressure and gas void fraction when the inter-electrode gap was narrowing differed clearly from those when the inter-electrode gap was expanding. Next, three coupling modes are presented: pre-position coupling, traditional symmetry coupling, and post-position coupling. Finally, the results of the experiments investigating machining localization are discussed to evaluate these three coupling modes.
2. Analysis of the Simulation of a Dynamic PVECM Process
2.1. Traditional Coupling Mode
Figure 1 depicts the traditional symmetry coupling mode of pulse duration and tool vibration. One period of the pulse goes from point B to point D. The amplitude is A. The minimum gap ∆ between the tool and workpiece is at point C. The durations of stages B–C and C–D are the same, but their statuses clearly differ. In general, the machining process contains two stages: a gap-narrowing stage (B–C) and a gap-expanding stage (C–D). In the narrowing stage, the inter-electrode gap narrows quickly with the accumulation of electrolysis products and bubbles. In the expanding stage, the gap pressure decreases, and the accumulation of products slows down. Different machining conditions are expected if the pulse is completely in the gap-narrowing or gap-expanding stage. The dynamics of the PVECM process were simulated in order to analyse the characteristics of the electrolyte flow and of the electrolysis products in the periodic inter-electrode gap.
2.2. Physical Model
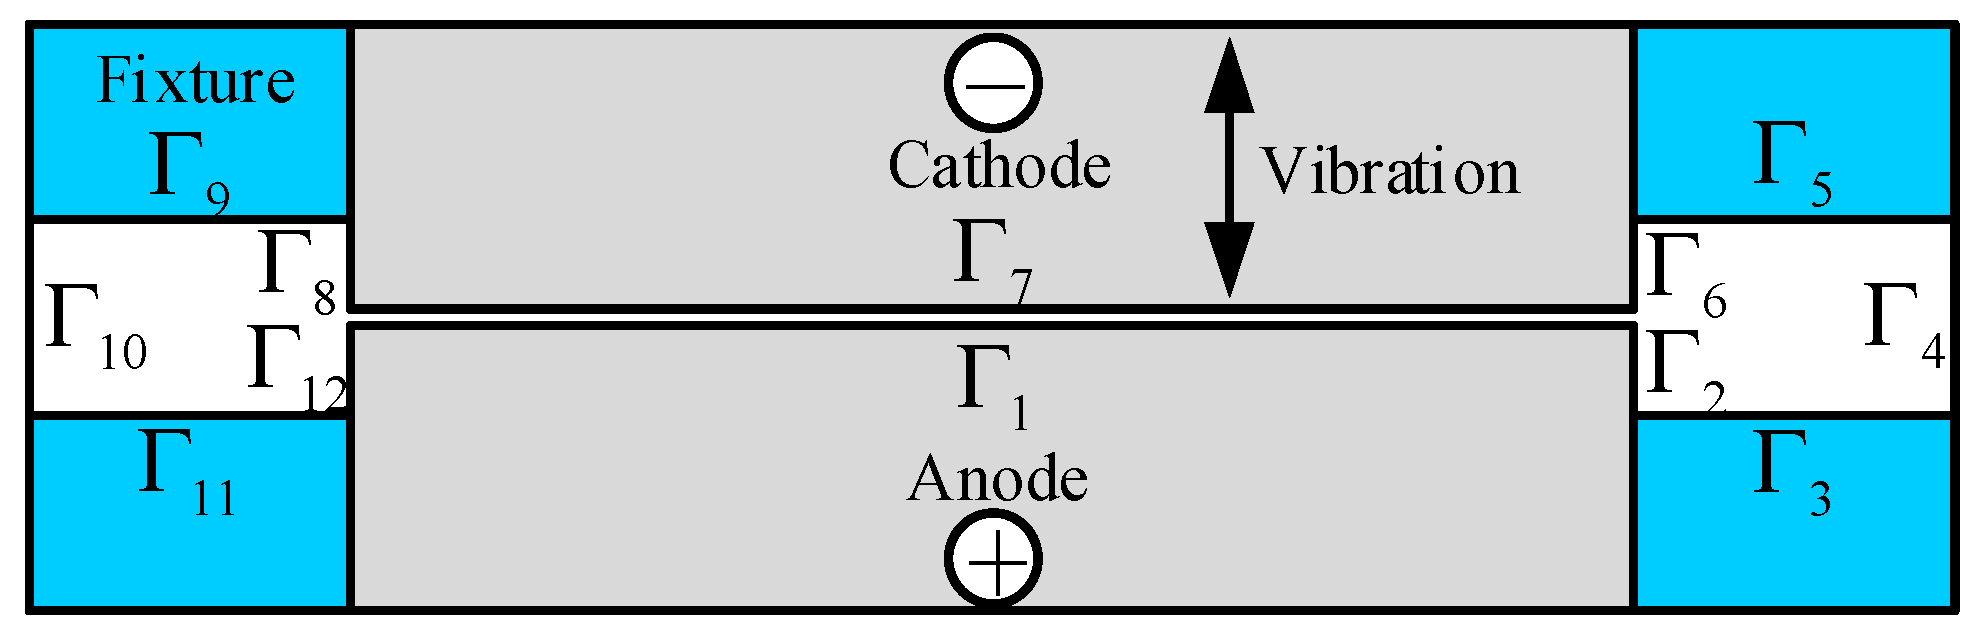
Figure 2 shows a schematic diagram of the PVECM process. The electrolyte was pumped through the inlet (boundary 10) to the outlet (boundary 4). The inlet was 30 mm from the outlet, the initial inter-electrode gap was 0.1 mm, and the cathode and workpiece were both 20 mm long. To analyse how the coupling mode of pulse duration and tool vibration affected the gas void fraction, the following assumptions were made.
- The bubbles are evenly distributed in the liquid phase, and no mass transfer occurs between gas and liquid.
- The cathode and workpiece surfaces are electric equipotential surfaces.
- The current efficiency η = 100%.
The electric potential in the inter-electrode gap is given by the Laplace equation: [20]
The corresponding boundary conditions are
The gas void fraction β is
where Q is the total volume, Q1 is the gas volume, and Q2 is the liquid volume [21]. The relationship between electrolyte conductivity and gas void fraction is
where κ is the electrolyte conductivity, κ0 is the initial electrolyte conductivity, β is the gas void fraction, m is the coefficient of gas void fraction on conductivity (typically, m = 1.5), λ is the degree of temperature dependence, T is the electrolyte temperature, and T0 is the initial electrolyte temperature.
The current density i is expressed by Ohm’s law:
where U is the applied voltage and Δ is the inter-electrode gap between cathode and workpiece.
In the ECM process, the cathode electrochemical reaction is
Compared with hydrogen, the volume of oxygen generated during the ECM process can be neglected. The hydrogen generated at the cathode can be described by Faraday’s law [22]:
where F is Faraday’s constant.
The equation describing the tool vibration is
where A is the amplitude of the displacement of the tool cathode, t is the machining time, and f is the vibration frequency.
All models were analysed using the COMSOL software. The pulse duration was one-half of a vibration period when the cathode was near the workpiece, so the duty cycle was 50%. Table 1 lists the parameter values used in the calculations.
2.3. Variation of Electrolyte Pressure and Gas Void Fraction
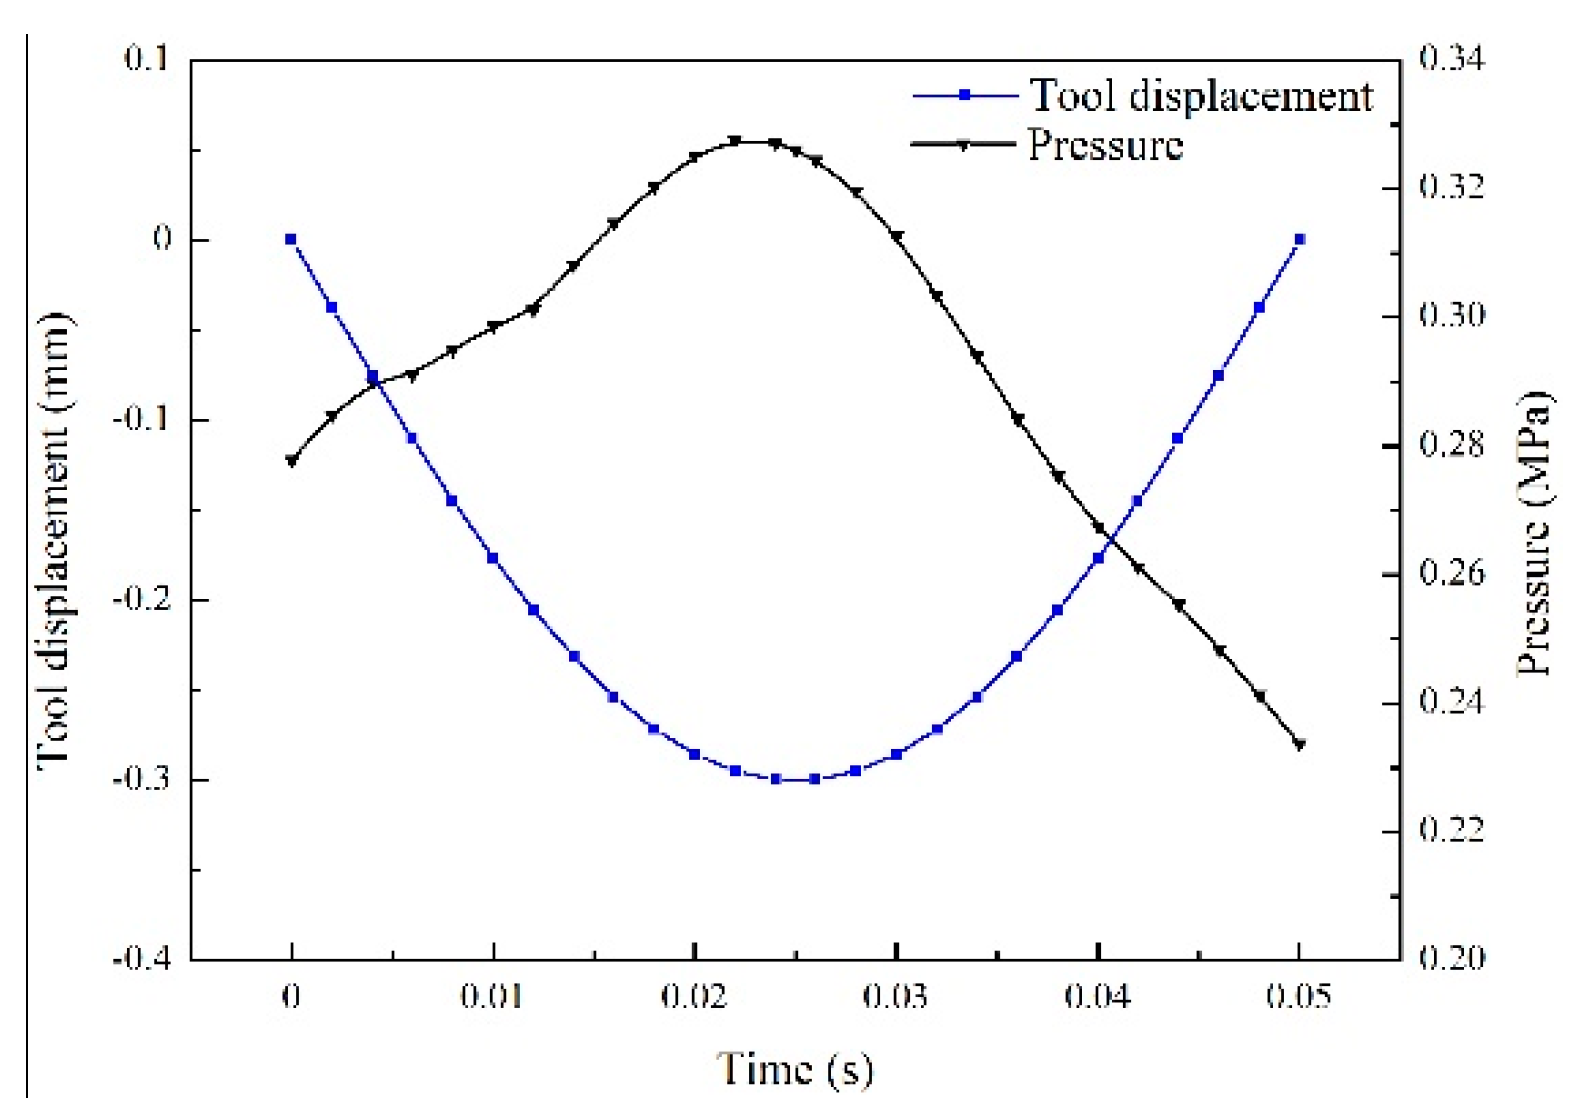
The electrolyte pressure and gas void fraction in the inter-electrode gap were calculated during the PVECM process. As shown in Figure 3, the electrolyte pressure changed between the different machining stages. The electrolyte pressure gradually increased as the inter-electrode gap decreased. When the cathode attained the minimum inter-electrode gap, the electrolyte pressure in the inter-electrode gap was at maximum. Figure 4 shows the average electrolyte pressure in the inter-electrode gap during one half-period of tool vibration. As the gap narrowed (0 to 0.025 s), the electrolyte pressure was higher than it was as the gap expanded (0.025 to 0.05 s). The inter-electrode gap at 0 s was the same as at 0.05 s, but the electrolyte pressure differed clearly because the inter-electrode gap was narrowing after 0 s but expanding at 0.05 s.
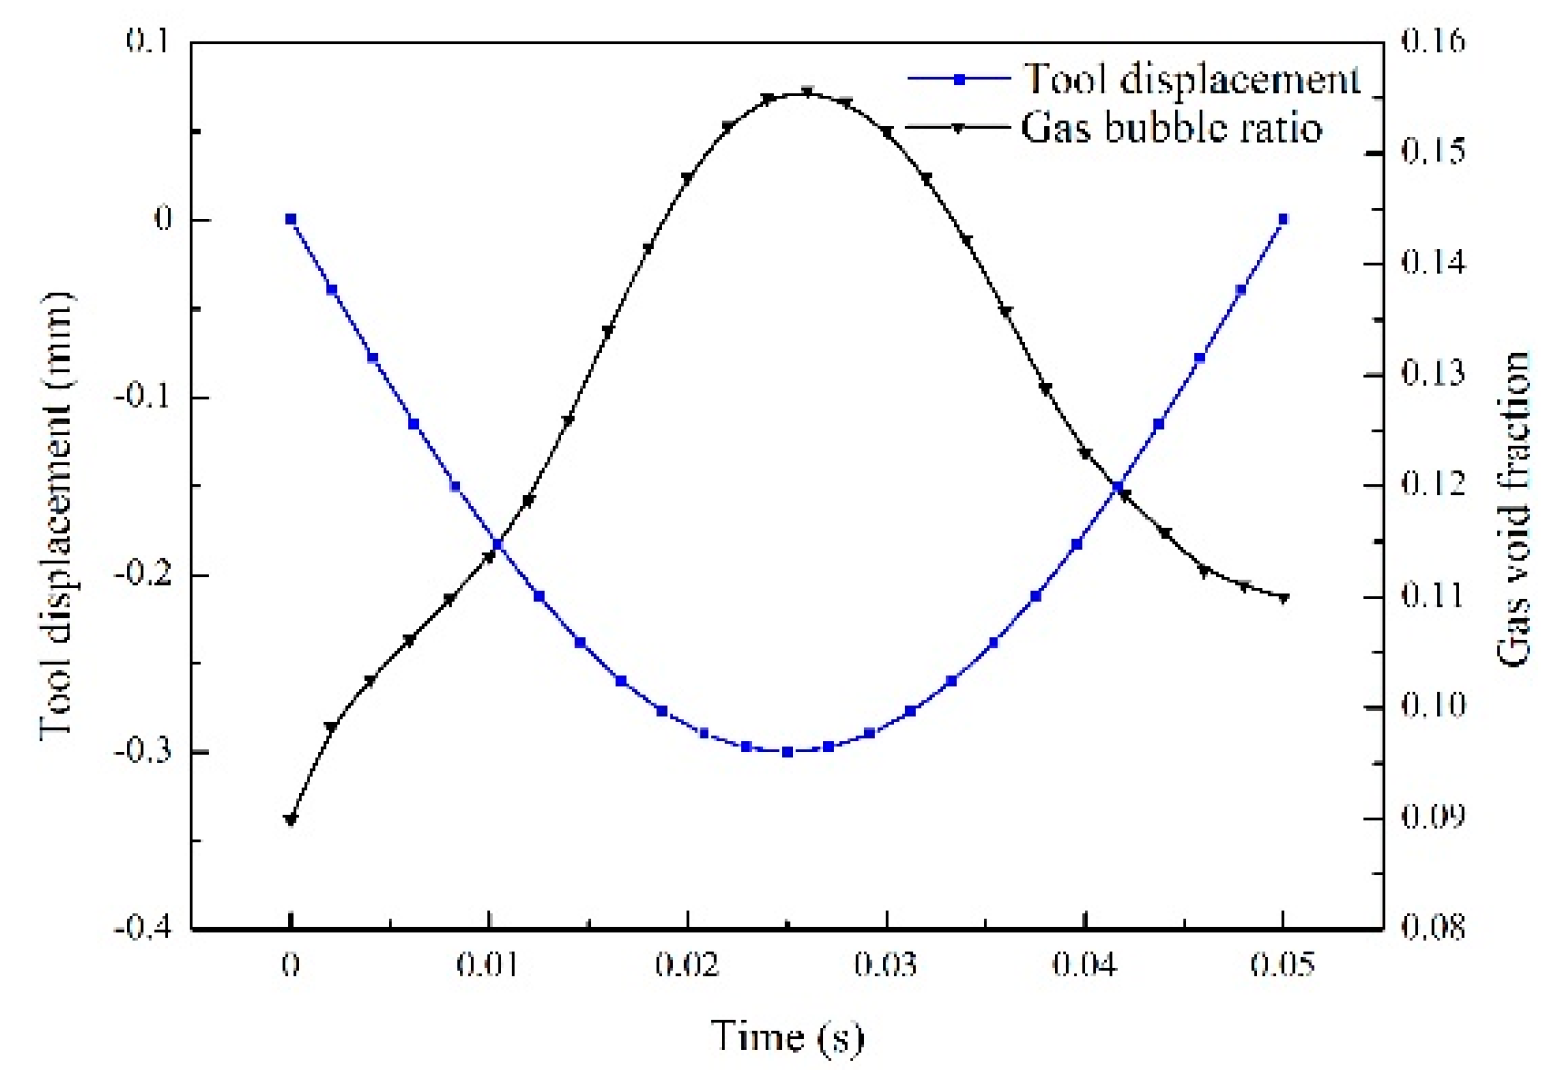
Figure 5 shows that the gas bubbles during the different machining stages mainly accumulated in the second half of the flow channel. The vibration of the tool cathode significantly influenced the accumulation of gas bubbles. As the cathode approached the workpiece, the gas void fraction started to rise, and the maximum gas void fraction occurred at the minimum inter-electrode gap. Figure 6 presents the average gas void fraction and tool displacement as a function of time over one half-period. The gas void fraction was not symmetrical at about t = 0.025 s, and the gas void fraction at 0 s was less than that at 0.05 s. This distinction had two main causes: first, the inter-electrode gap differed when the power was first turned on, and second, the inter-electrode gap narrowed from 0 to 0.025 s and expanded from 0.025 to 0.05 s.
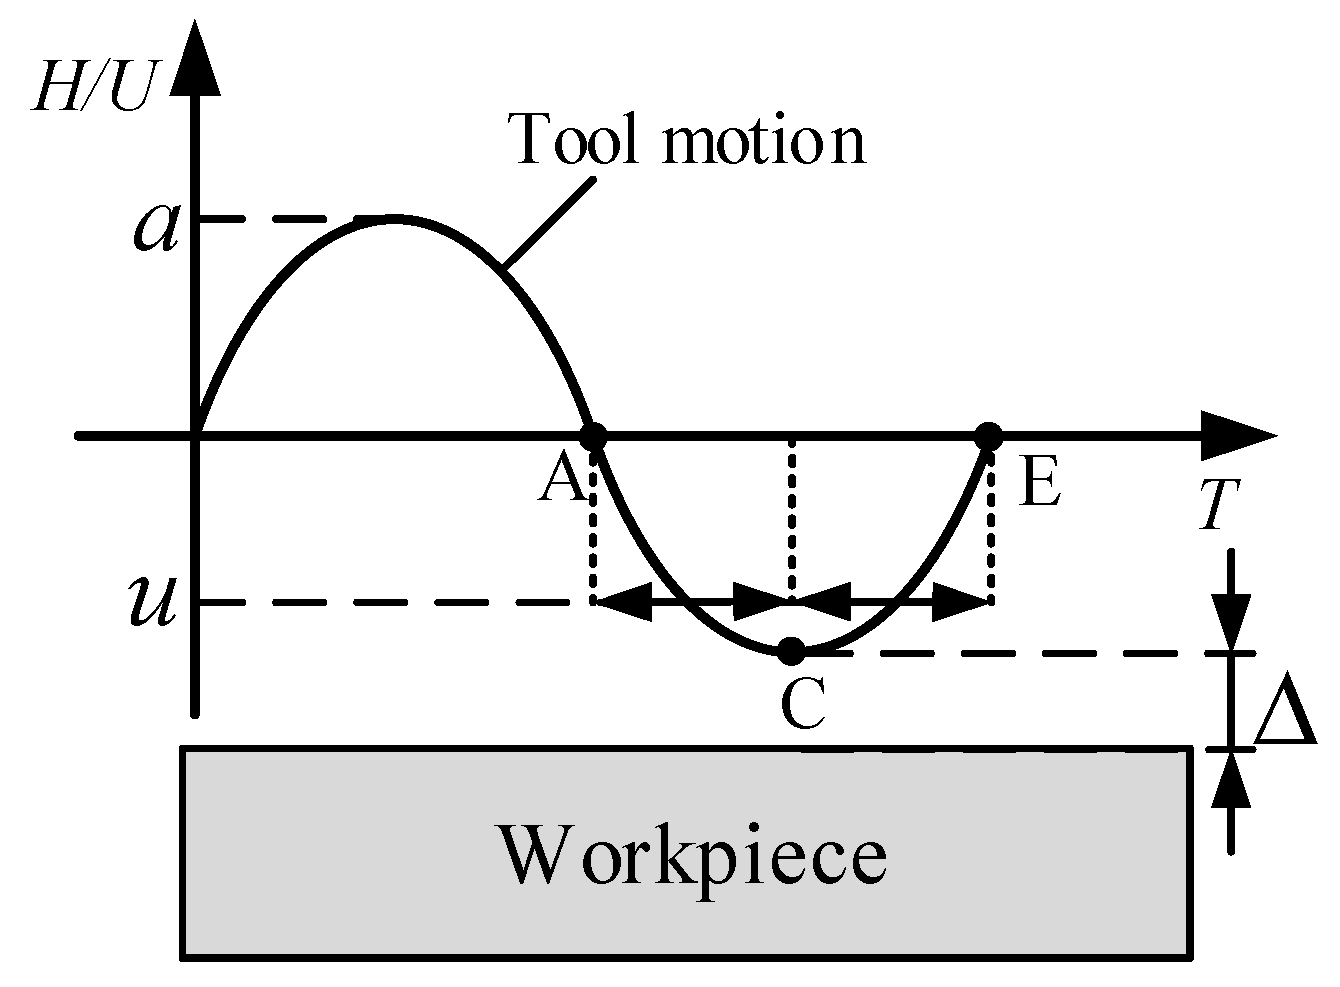
The analysis of electrolyte pressure and gas void fraction showed that the machining conditions as the gap narrowed differed from the electrolyte pressure and gas void fraction as the gap expanded. Therefore, two stagger coupling modes (i.e., the pre-position and the post-position coupling modes) of pulse duration and tool vibration in the PVECM process were investigated. Figure 7 shows a schematic diagram of the coupling of tool motion and pulse duration. The same pulse duration for the two stagger coupling modes was adopted. In the pre-position coupling mode, the machining is conducted during stages A–C and stops at point C. The decrease of the inter-electrode gap caused an increase in gap pressure. In the post-position coupling mode, the machining begins at point C and is conducted during stages C–E. Contrary to the pre-position coupling mode, the inter-electrode gap increased during the post-position coupling mode.
Based on the above analysis, the symmetry coupling mode contained a gap-narrowing stage and a gap-expanding stage, which were quite distinct from each other. However, the pre-position coupling mode contained only a gap-narrowing stage and the post-position coupling mode contained only a gap-expanding stage. Thus, to evaluate the influence of the different coupling modes, three sets of comparative experiments were used to investigate the feed rate and machining localization.
3. Experimental Procedures
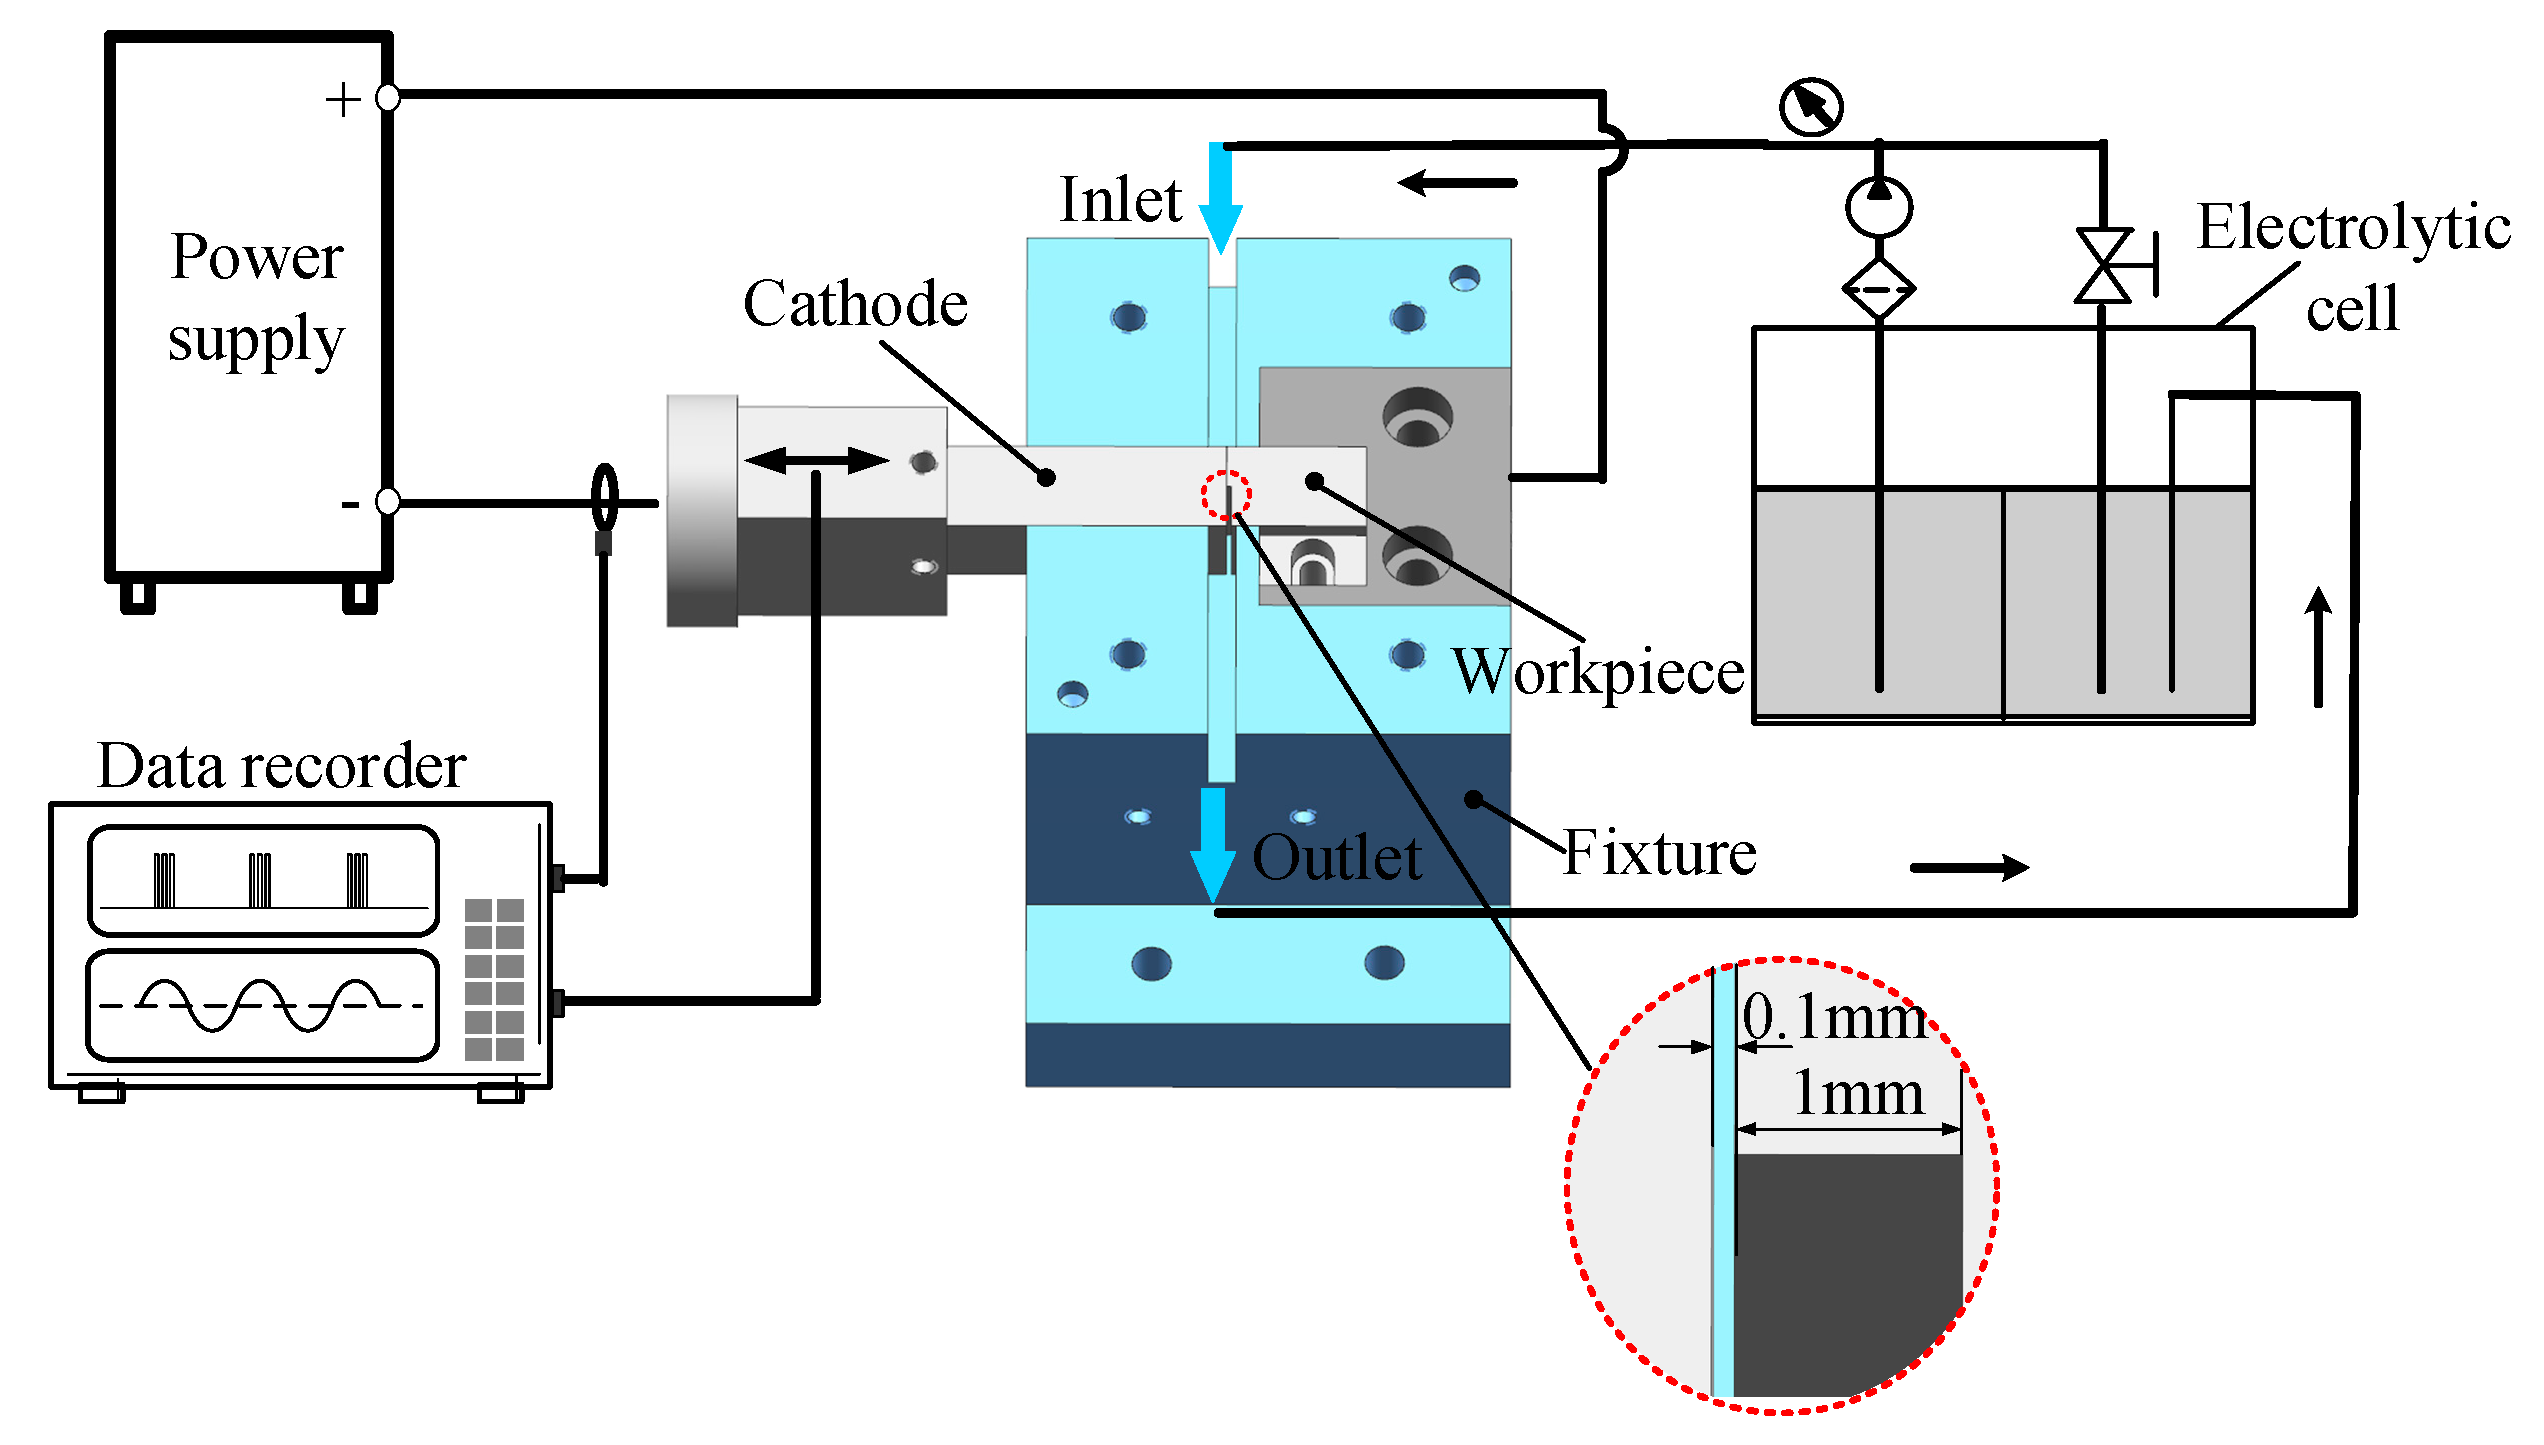
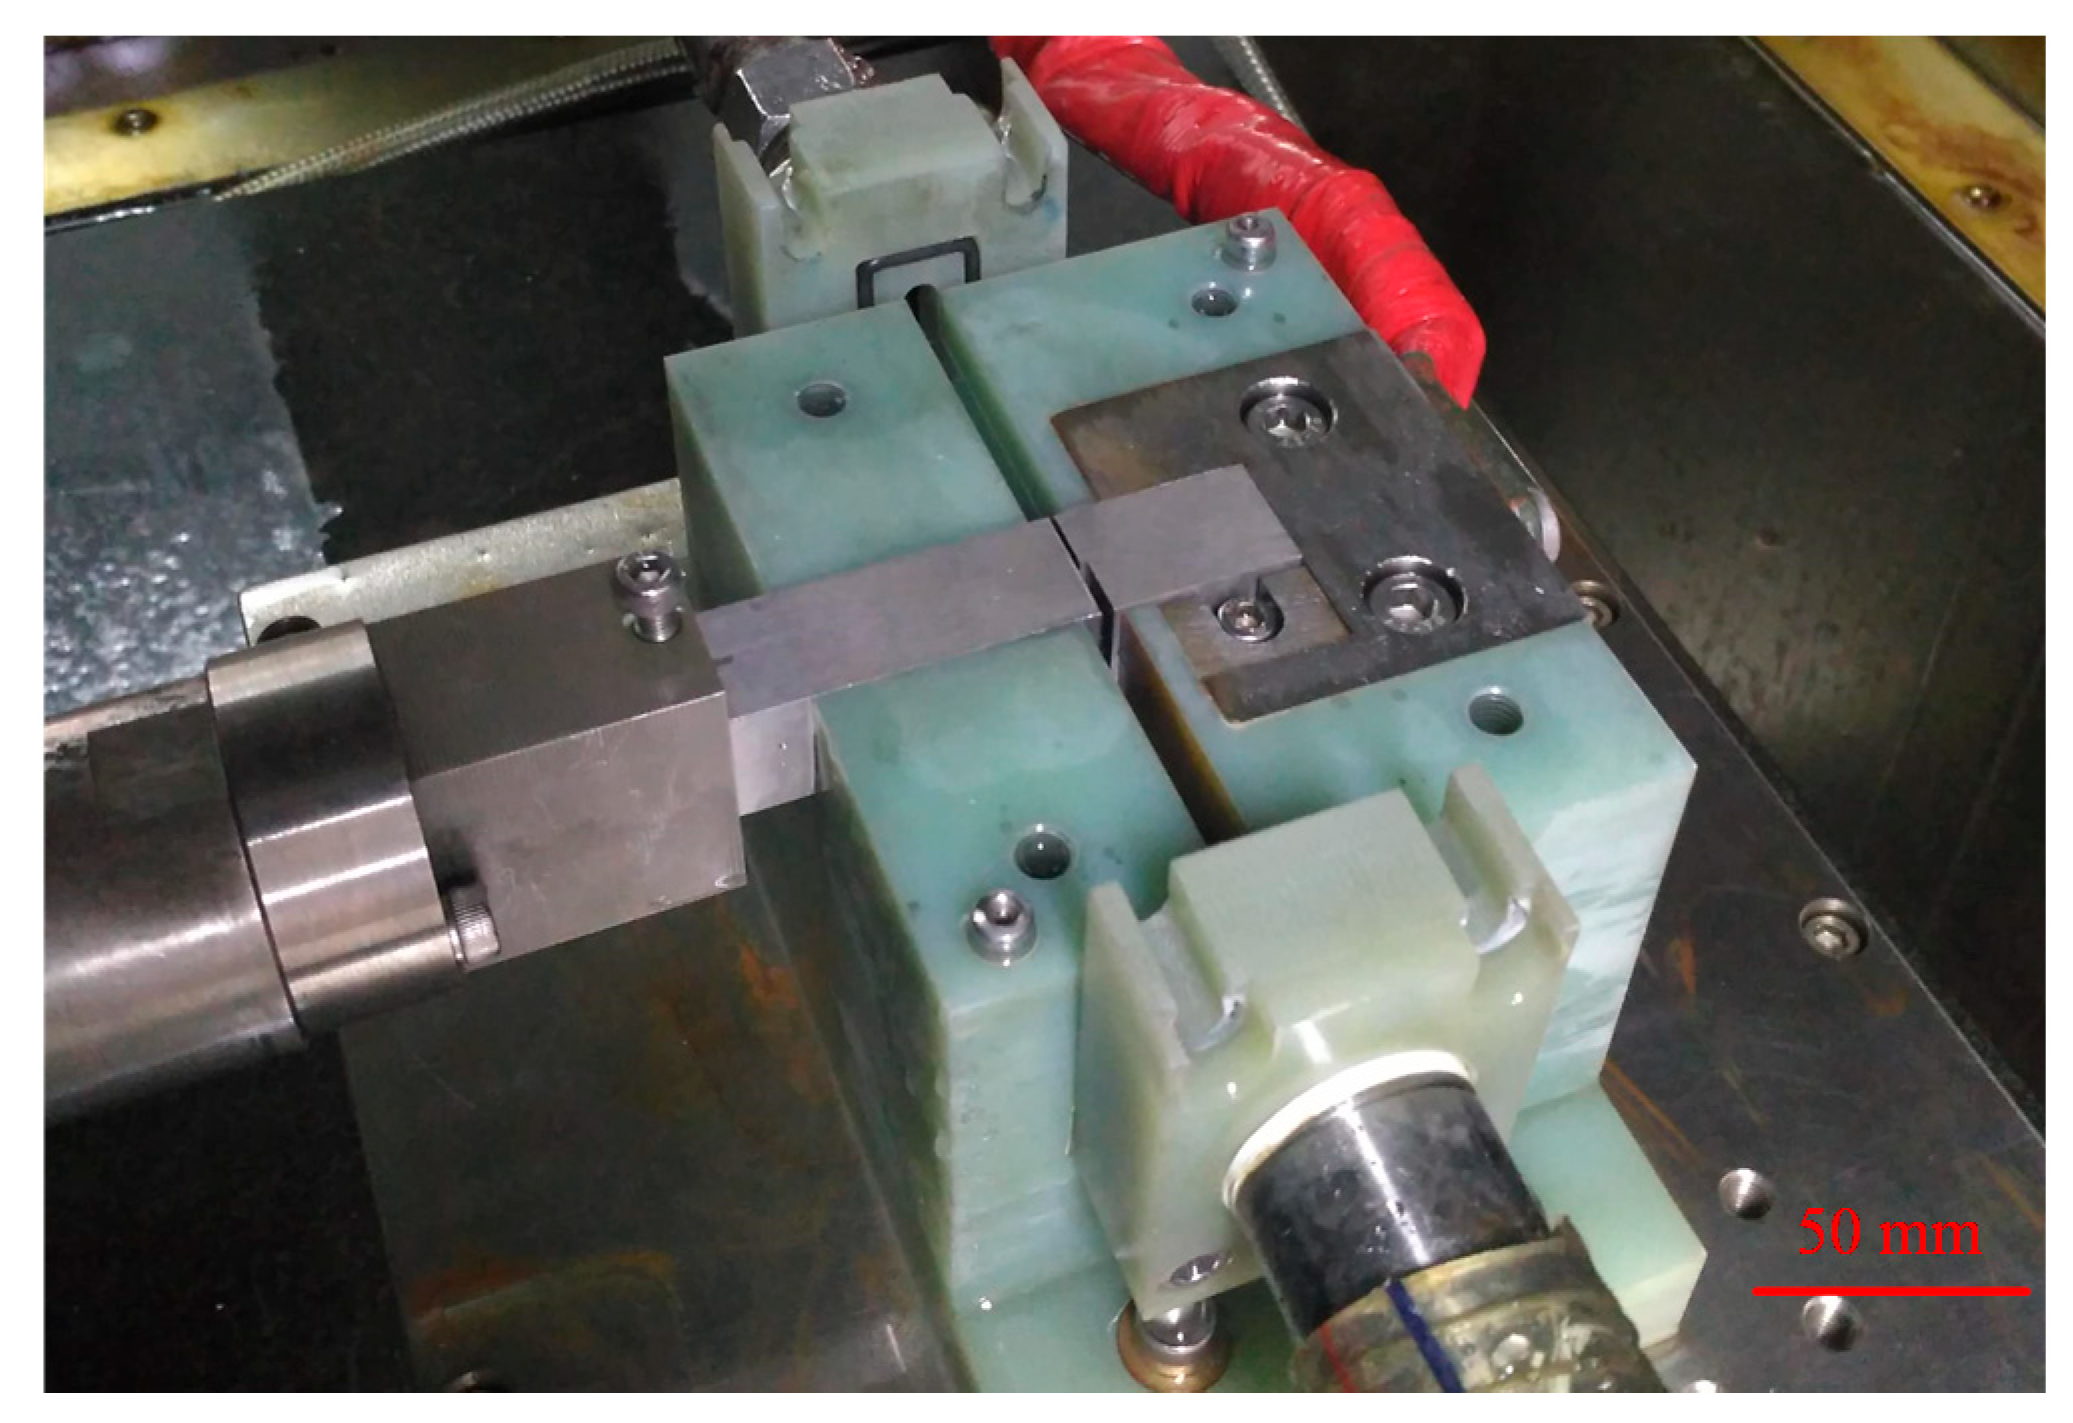
Figure 8 shows a schematic diagram of the experimental setup. The different coupling modes of pulse duration and tool vibration were carried out by the equipment, and the results were researched independently. The electrical signals created by the pulse current and tool motion were recorded using a Memory HiCorder (Model 8861-50, Hioki, Japan). During the PVECM process, the workpiece did not move, and the tool cathode moved toward the workpiece at a special feed rate and at a single vibration frequency. At the same time, electrolyte was pumped at a high velocity into the inter-electrode gap between the cathode and the workpiece to remove electrolysis products and Joule heat [13]. The cathode and the workpiece were made of stainless steel 304 and the nickel-based alloy GH4169, respectively. The ECM fixture and important components of the experimental apparatus are shown in Figure 9. The main part of fixture was made of epoxy materials, which had small rates of deformation and good size stability.
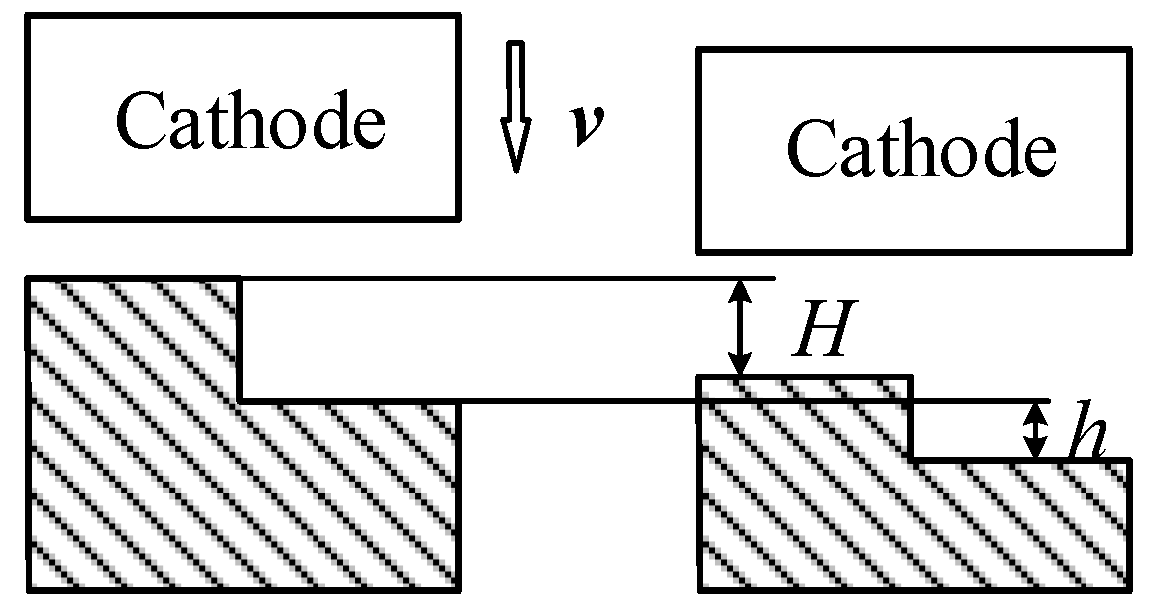
As shown in Figure 8, the initial inter-electrode gap was 0.1 mm, and the workpiece machining surface had a height difference of 1 mm. Based on previous experiments involving tool vibration [14], the machining conditions were chosen as listed in Table 2.
In this study, the factor , which represents the ratio of the depth of material removed at the low surface on the workpiece to that removed at the high surface on the workpiece, was introduced to evaluate the machining localization of PVECM, and is defined as
where h is the depth of material removed at the low surface and H is the depth of material removed at the high surface. In ECM, different inter-electrode gaps lead to different corrosion abilities. A higher feed rate could lead to a smaller inter-electrode gap. The smaller h and the larger H express the higher concentrated corrosion ability and the better machining localization. Thus, a smaller Ψ is better. Figure 10 shows a schematic diagram of the machining layout.
4. Results and Discussion
To get the highest feed rate, the feed rate was varied from 0.15 mm/min with a step of 0.05 mm/min, and the increase was continued in steps of 0.01 mm/min until a short circuit occurred in the next 0.05 mm/min. The experimental results showed that the highest feed rates for the pre-position coupling mode, symmetry coupling mode, and post-position coupling mode were 0.37, 0.32, and 0.30 mm/min, respectively.
Figure 11 shows the instantaneous current for the three coupling modes at the end of machining and with the highest feed rate. The current for the three coupling modes had similar trends. In one vibration period, with the power on, the machining current rapidly reached a maximum and then had a trend from low to high. The peak current occurred shortly after the power was turned on because, its conductivity was high after filtering the electrolyte. Due to the sharp accumulation of electrolysis products, the conductivity decreased rapidly. Figure 11 shows that a higher peak current occurred in the pre-position coupling mode. In addition, just before the power was turned off, the current in the pre-position coupling mode was higher than that in the other modes.
Figure 12 shows the average current for the three coupling modes with their highest feed rate at the end of machining. It can be seen that the average current of the pre-position coupling mode was higher than that of the other two modes. Associated with the instantaneous current of the three coupling modes, the pre-position coupling mode had a higher current density and dissolution velocity than the symmetry or post-position coupling modes, and maintained a small, stable inter-electrode gap, which could allow a better control of accuracy [23]. Thus, at the highest feed rate, the pre-position coupling mode could make machining more uniform and stable. The analysis of machining current therefore indicated that the pre-position coupling mode was more suitable than the symmetry or the post-position coupling modes for the PVECM process, even at the highest feed rate.
Figure 13 shows the factor for the three coupling modes and the corresponding workpieces. It also shows that, for all coupling modes, gradually decreased with increasing feed rate. Compared with the symmetry coupling mode and the post-position coupling mode, the pre-position coupling mode had a higher feed rate and a smaller . The smallest of the pre-position coupling mode was 0.076 at a feed rate of 0.37 mm/min, whereas the smallest for the symmetry and the post-position coupling modes was 0.088 and 0.107 at feed rates of 0.32 and 0.30 mm/min, respectively. Thus, the pre-position coupling mode took machining efficiency and quality into account and offered a higher feed rate and a better machining localization.
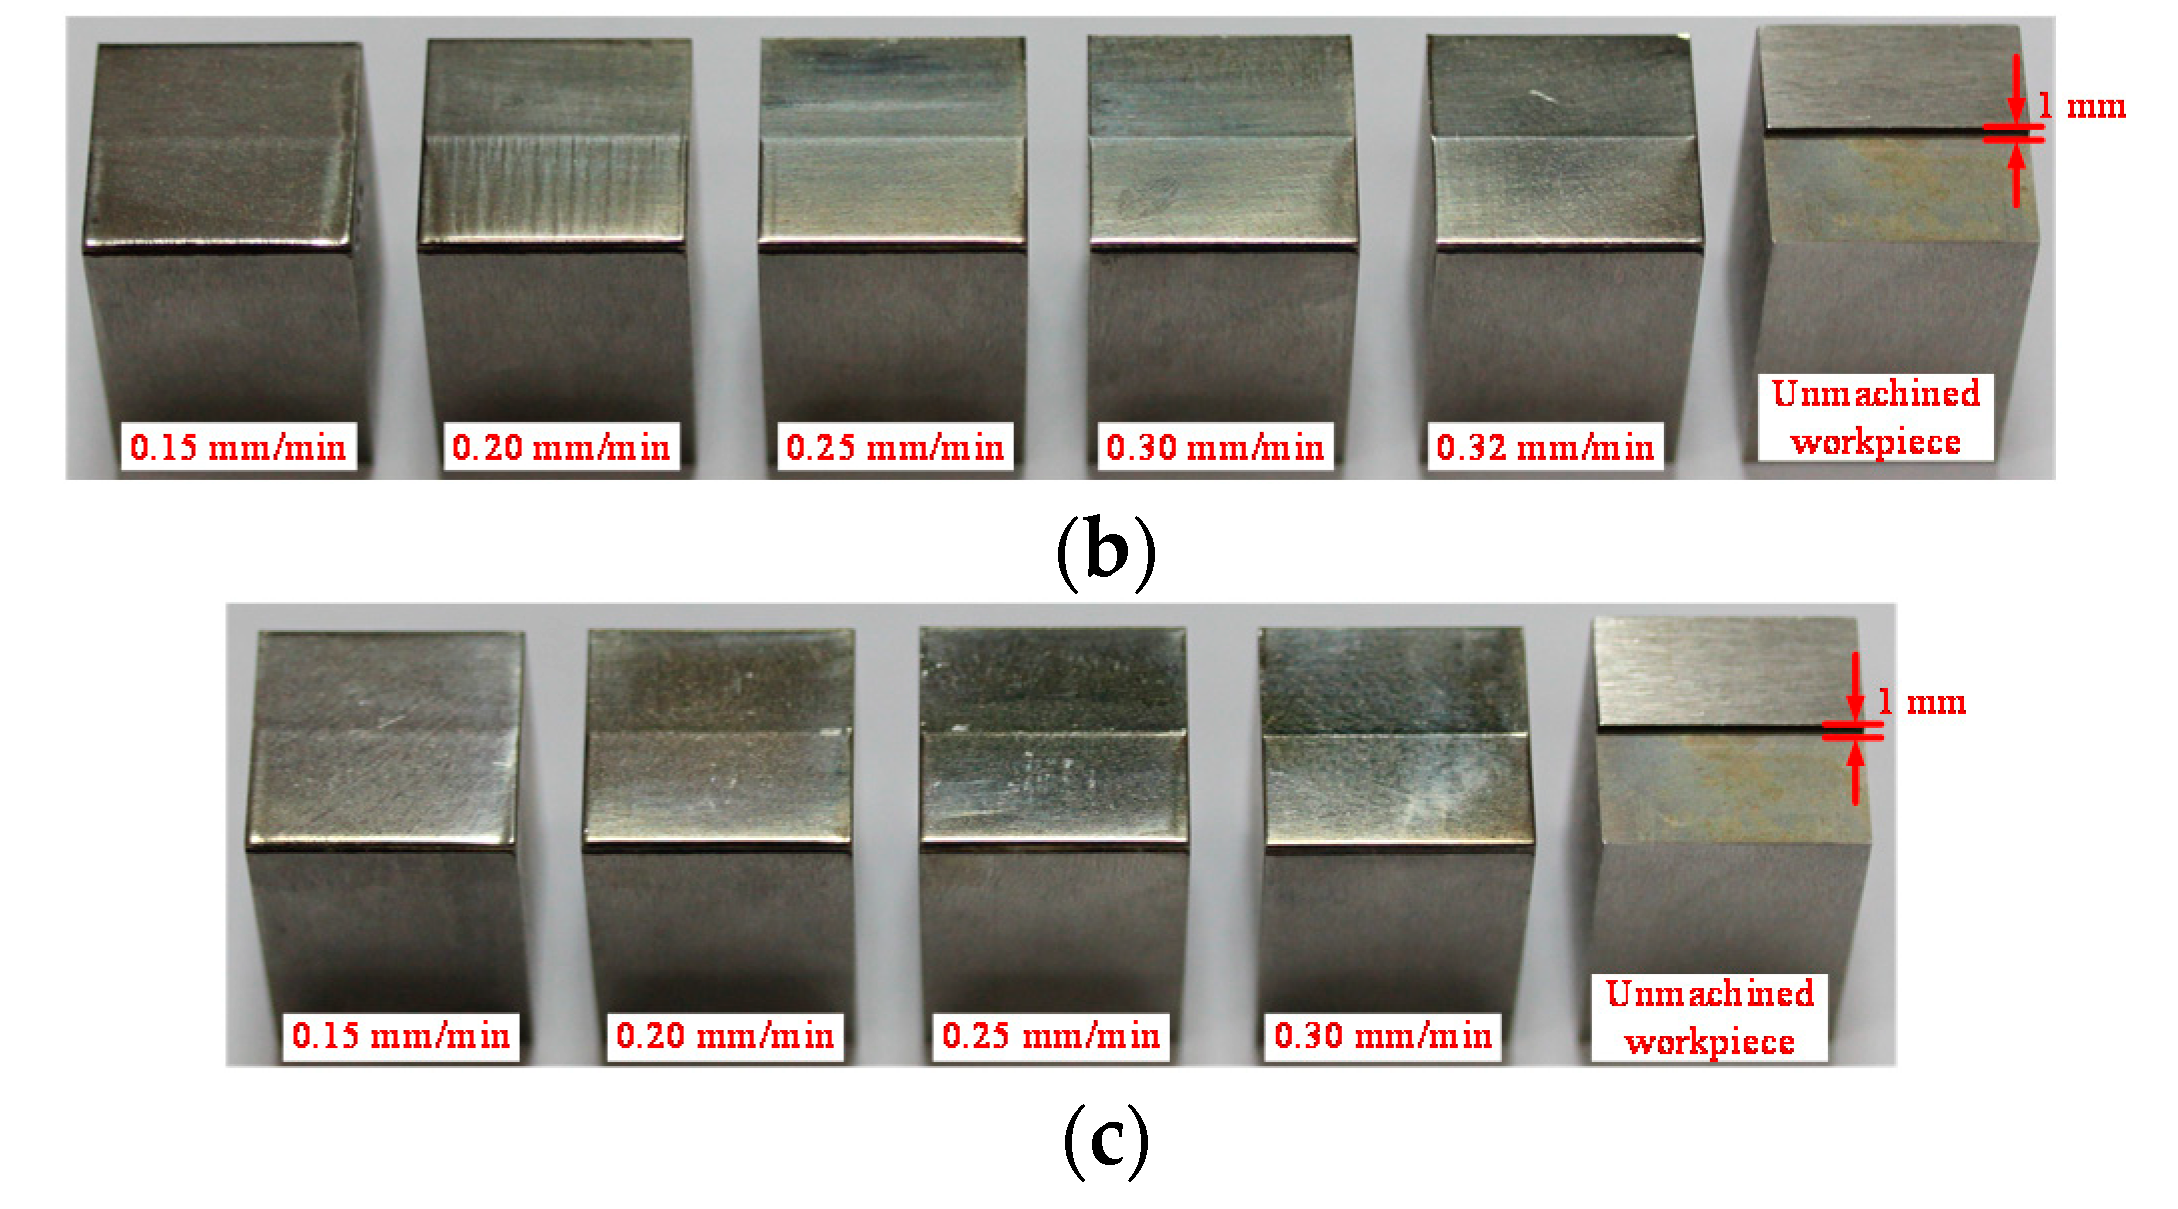
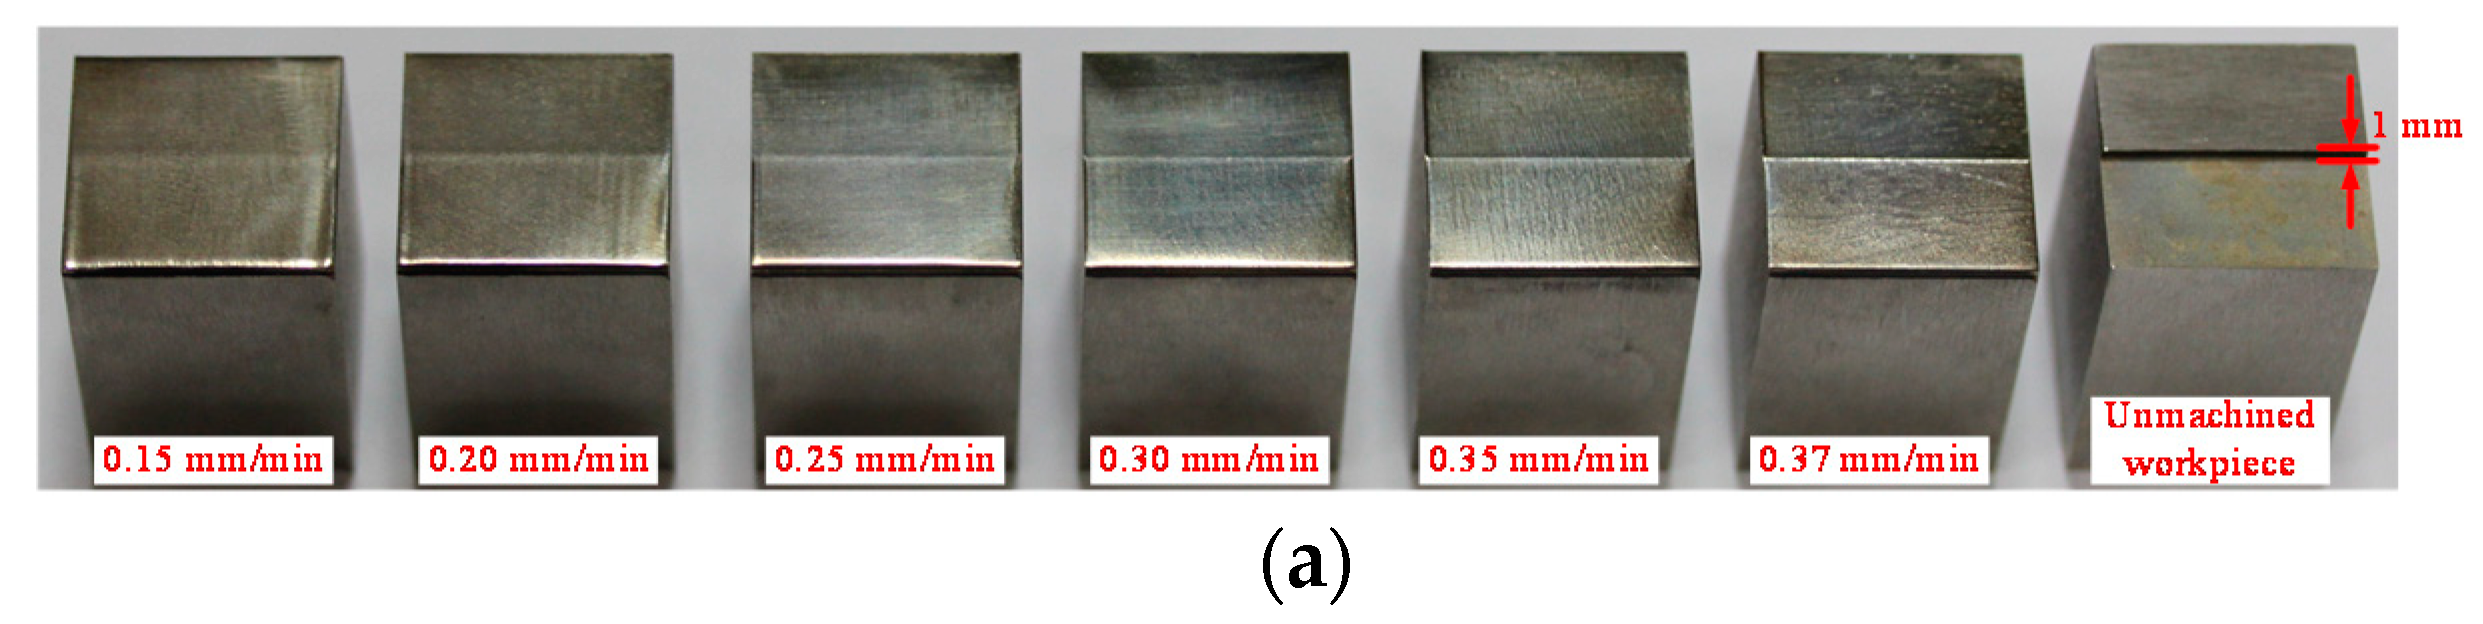
Figure 14 show the workpieces for the different coupling modes with different feed rates. A serious overcut occurred with the lower feed rate. The height difference of the workpiece surface was almost invisible (e.g., for the workpiece at 0.15 mm/min). The height difference was more obvious for the higher feed rate in one coupling mode. Thus, a better machining localization was obtained at higher feed rates.
The results also showed that at a given feed rate for the three coupling modes, for the pre-position coupling mode was greater than for the symmetry coupling mode and the post-position coupling mode, and the smallest occurred in the post-position coupling mode. For example, for a feed rate of 0.25 mm/min, = 0.187, 0.184, and 0.148 in the pre-position, symmetry, and post-position coupling modes, respectively. This result indicated that the post-position coupling mode was closer to the limit and had a smaller inter-electrode gap than the other two coupling modes at the same feed rate. Thus, a smaller inter-electrode gap helped to improve machining localization.
5. Conclusions
In this study, the coupling adjustment of pulse duration and tool vibration was analysed and a method was proposed to improve the machining accuracy of ECM with vibration. After analysing the results of a machining dynamics simulation and a comparison of the ratio for the three coupling modes, the conclusions can be summarized as follows:
- As the inter-electrode gap narrows, the electrolyte pressure and gas void fraction differ from those as the gap widens. In the pre-position coupling mode, the fluid conditions are better than in the post-position coupling mode.
- In each coupling mode, decreases with increasing feed rate. A higher feed rate corresponds to a better machining localization.
- At a given feed rate, the post-position coupling mode offers a better machining localization than either the pre-position coupling mode or the symmetry coupling mode.
- The best machining localization and highest feed rate are obtained by the pre-position coupling mode, closely followed by the symmetry coupling mode and the post-position coupling mode.
Author Contributions
X.J. and J.L. conceived and designed the experiments; X.J. and M.W. performed the experiments; X.J. and M.W. analysed the data; X.J. wrote the paper with the help of J.L., D.Z. and N.Q.
Funding
This research was funded by the National Natural Science Foundation of China (No. 51535006) and Key Research & Development Plan of Jiangsu Province (No. BE2015160).
Conflicts of Interest
The authors declare no conflict of interest.
References
- Rajurkar, K.P.; Zhu, D.; Mcgeough, J.A.; Kozak, J.; Silva, A.D. New developments in electro-chemical machining. CIRP Ann.Manuf. Technol. 1999, 48, 567–579. [Google Scholar] [CrossRef]
- Xu, Z.; Liu, J.; Xu, Q.; Gong, T.; Zhu, D.; Qu, N. The tool design and experiments on electrochemical machining of a blisk using multiple tube electrodes. Int. J. Adv. Manuf. Technol. 2015, 79, 531–539. [Google Scholar] [CrossRef]
- Zhu, D.; Zhu, D.; Xu, Z. Optimal design of the sheet cathode using w-shaped electrolyte flow mode in ecm. Int. J. Adv. Manuf. Technol. 2012, 62, 147–156. [Google Scholar] [CrossRef]
- Qu, N.S.; Xu, Z.Y. Improving machining accuracy of electrochemical machining blade by optimization of cathode feeding directions. Int. J. Adv. Manuf. Technol. 2013, 68, 1565–1572. [Google Scholar] [CrossRef]
- Rajurkar, K.P.; Zhu, D. Improvement of electrochemical machining accuracy by using orbital electrode movement. CIRP Ann.Manuf. Technol. 1999, 48, 139–142. [Google Scholar] [CrossRef]
- Bhattacharyya, B.; Munda, J. Experimental investigation on the influence of electrochemical machining parameters on machining rate and accuracy in micromachining domain. Int. J. Mach. Tools Manuf. 2003, 43, 1301–1310. [Google Scholar] [CrossRef]
- Demyantseva, N.G.; Kuzmin, S.M.; Balmasov, A.V. Evaluation of shaping accuracy upon electrochemical machining of metals. Surf. Eng. Appl. Electrochem. 2012, 48, 230–233. [Google Scholar] [CrossRef]
- Zhu, D.; Xu, H.Y. Improvement of electrochemical machining accuracy by using dual pole tool. J. Mater. Process. Technol. 2002, 129, 15–18. [Google Scholar] [CrossRef]
- Ebeid, S.J.; Hewidy, M.S.; El-Taweel, T.A.; Youssef, A.H. Towards higher accuracy for ecm hybridized with low-frequency vibrations using the response surface methodology. J. Mater. Process. Technol. 2004, 149, 432–438. [Google Scholar] [CrossRef]
- Hewidy, M.S.; Ebeid, S.J.; El-Taweel, T.A.; Youssef, A.H. Modelling the performance of ecm assisted by low frequency vibrations. J. Mater. Process. Technol. 2007, 189, 466–472. [Google Scholar] [CrossRef]
- Liu, J.; Jiang, X.; Zhu, D. Electrochemical machining of multiple slots with low-frequency tool vibrations. Procedia Cirp 2016, 42, 799–803. [Google Scholar]
- Natsu, W.; Nakayama, H.; Yu, Z. Improvement of ecm characteristics by applying ultrasonic vibration. Int. J. Precis. Eng. Manuf. 2012, 13, 1131–1136. [Google Scholar] [CrossRef]
- Zhao, J.; Zhang, X.; Yang, Z.; Lü, Y.; He, Y. Experimental research on the optimization of precision electrochemical machining feed mode of diamond-hole grille. Int. J. Adv. Manuf. Technol. 2017, 91, 147–153. [Google Scholar] [CrossRef]
- Pan, Y.; Xu, L. Vibration analysis and experiments on electrochemical micro-machining using cathode vibration feed system. Int. J. Precis. Eng. Manuf. 2015, 16, 143–149. [Google Scholar] [CrossRef]
- Yang, I.; Min, S.P.; Chu, C.N. Micro ecm with ultrasonic vibrations using a semi-cylindrical tool. Int. J. Precis. Eng. Manuf. 2009, 10, 5–10. [Google Scholar] [CrossRef]
- Liu, G.; Zhang, Y.; Deng, Y.; Wei, H.; Zhou, C.; Liu, J.; Luo, H. The tool design and experiments on pulse electrochemical machining of micro channel arrays on metallic bipolar plate using multifunctional cathode. Int. J. Adv. Manuf. Technol. 2016, 89, 407–416. [Google Scholar] [CrossRef]
- Wang, F.; Zhao, J.; Zhang, X.; Yang, Z.; Gan, W.; Tian, Z. Electrochemical machining of a narrow slit by cathodic compound feeding. Int. J. Adv. Manuf. Technol. 2017, 90, 971–978. [Google Scholar]
- Bhattacharyya, B.; Malapati, M.; Munda, J.; Sarkar, A. Influence of tool vibration on machining performance in electrochemical micro-machining of copper. Int. J. Mach. Tools Manuf. 2007, 47, 335–342. [Google Scholar] [CrossRef]
- Ruszaj, A.; Zybura, M.; Żurek, R.; Skrabalak, G. Some aspects of the electrochemical machining process supported by electrode ultrasonic vibrations optimization. Proc. Inst. Mech. Eng. Part B J. Eng. Manuf. 2003, 217, 1365–1371. [Google Scholar] [CrossRef]
- Fang, X.; Qu, N.; Zhang, Y.; Xu, Z.; Zhu, D. Improvement of hole exit accuracy in electrochemical drilling by applying a potential difference between an auxiliary electrode and the anode. J. Mater. Process. Technol. 2014, 214, 556–564. [Google Scholar] [CrossRef]
- Roušar, I. Choked two-phase flow during electrochemical machining. J. Appl. Electrochem. 1987, 17, 1304–1314. [Google Scholar] [CrossRef]
- Tijum, R.V.; Pajak, P.T. Simulation of production processes using the multiphysics approach: The electrochemical machining process. Am. J. Phys. Med. Rehabilitation 2012, 84, 287–293. [Google Scholar]
- Rajurkar, K.P.; Wei, B.; Kozak, J.; Mcgeough, J.A. Modelling and monitoring interelectrode gap in pulse electrochemical machining. CIRP Ann.Manuf. Technol. 2015, 44, 177–180. [Google Scholar] [CrossRef]
Figure 1.
Traditional symmetry coupling mode of pulse duration and tool vibration.
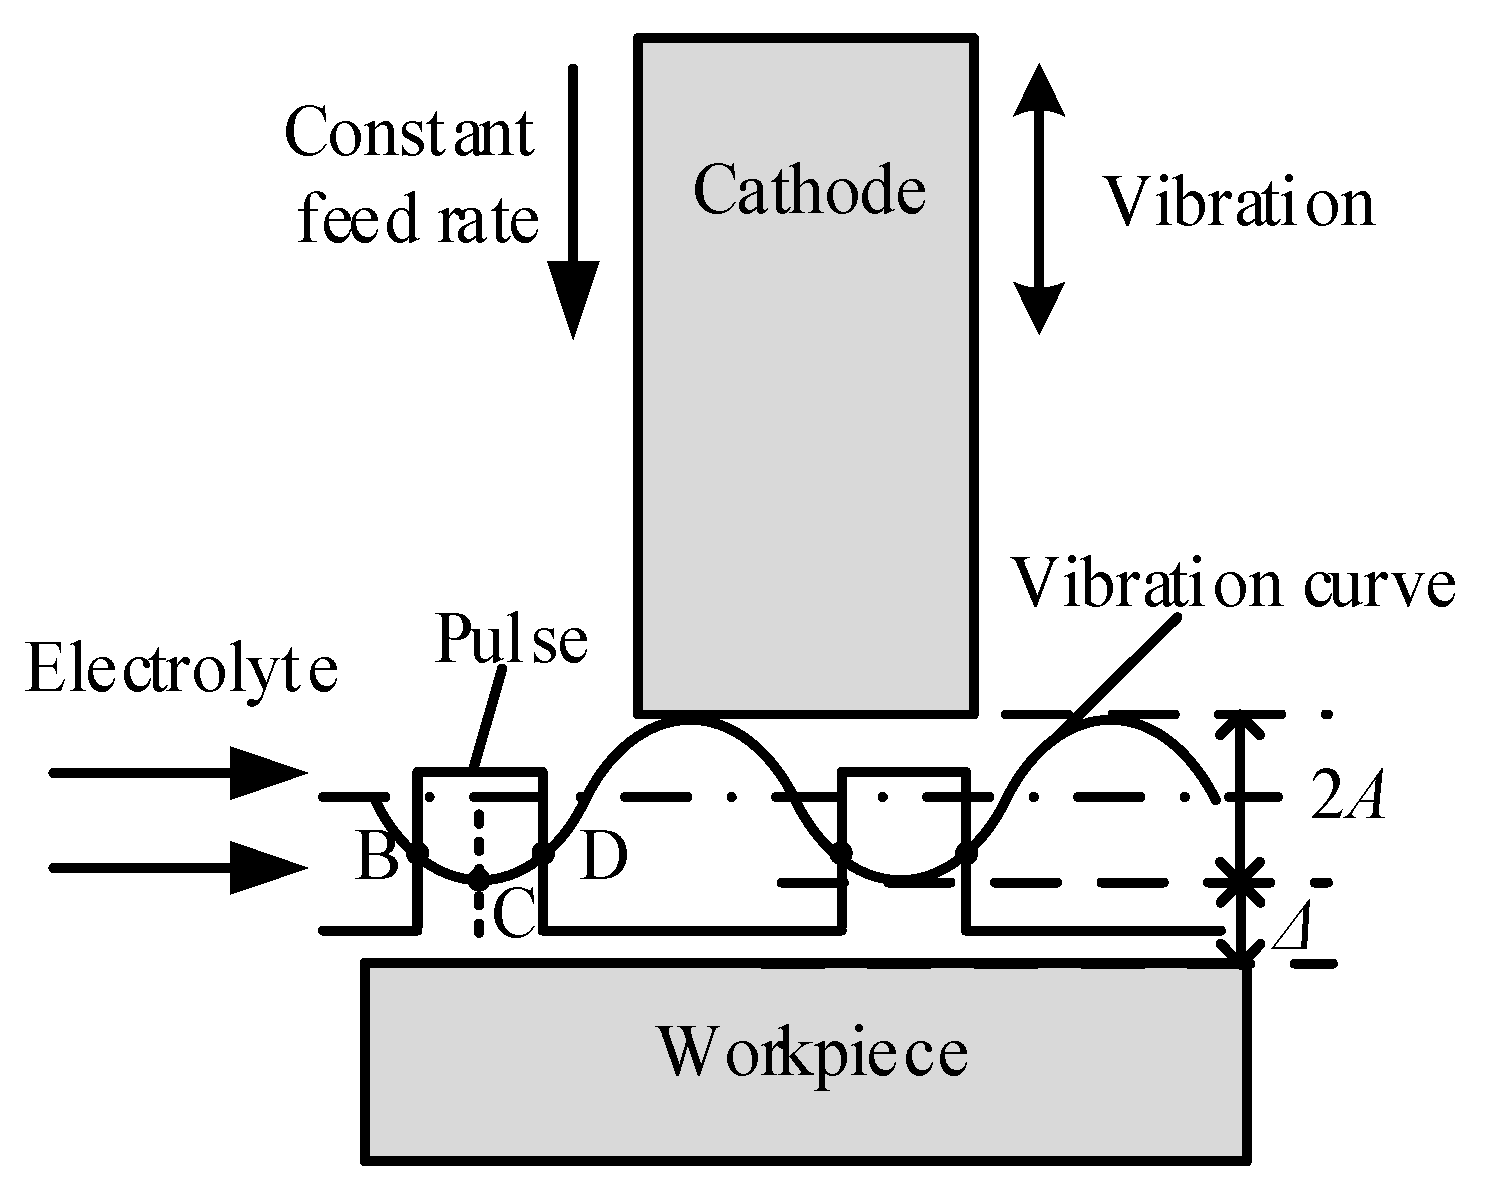
Figure 2.
Schematic diagram of the pulse duration and tool vibration in electrochemical machining (PVECM) process.
Figure 2.
Schematic diagram of the pulse duration and tool vibration in electrochemical machining (PVECM) process.

Figure 3.
Electrolyte pressure during the different machining stages with tool vibration.
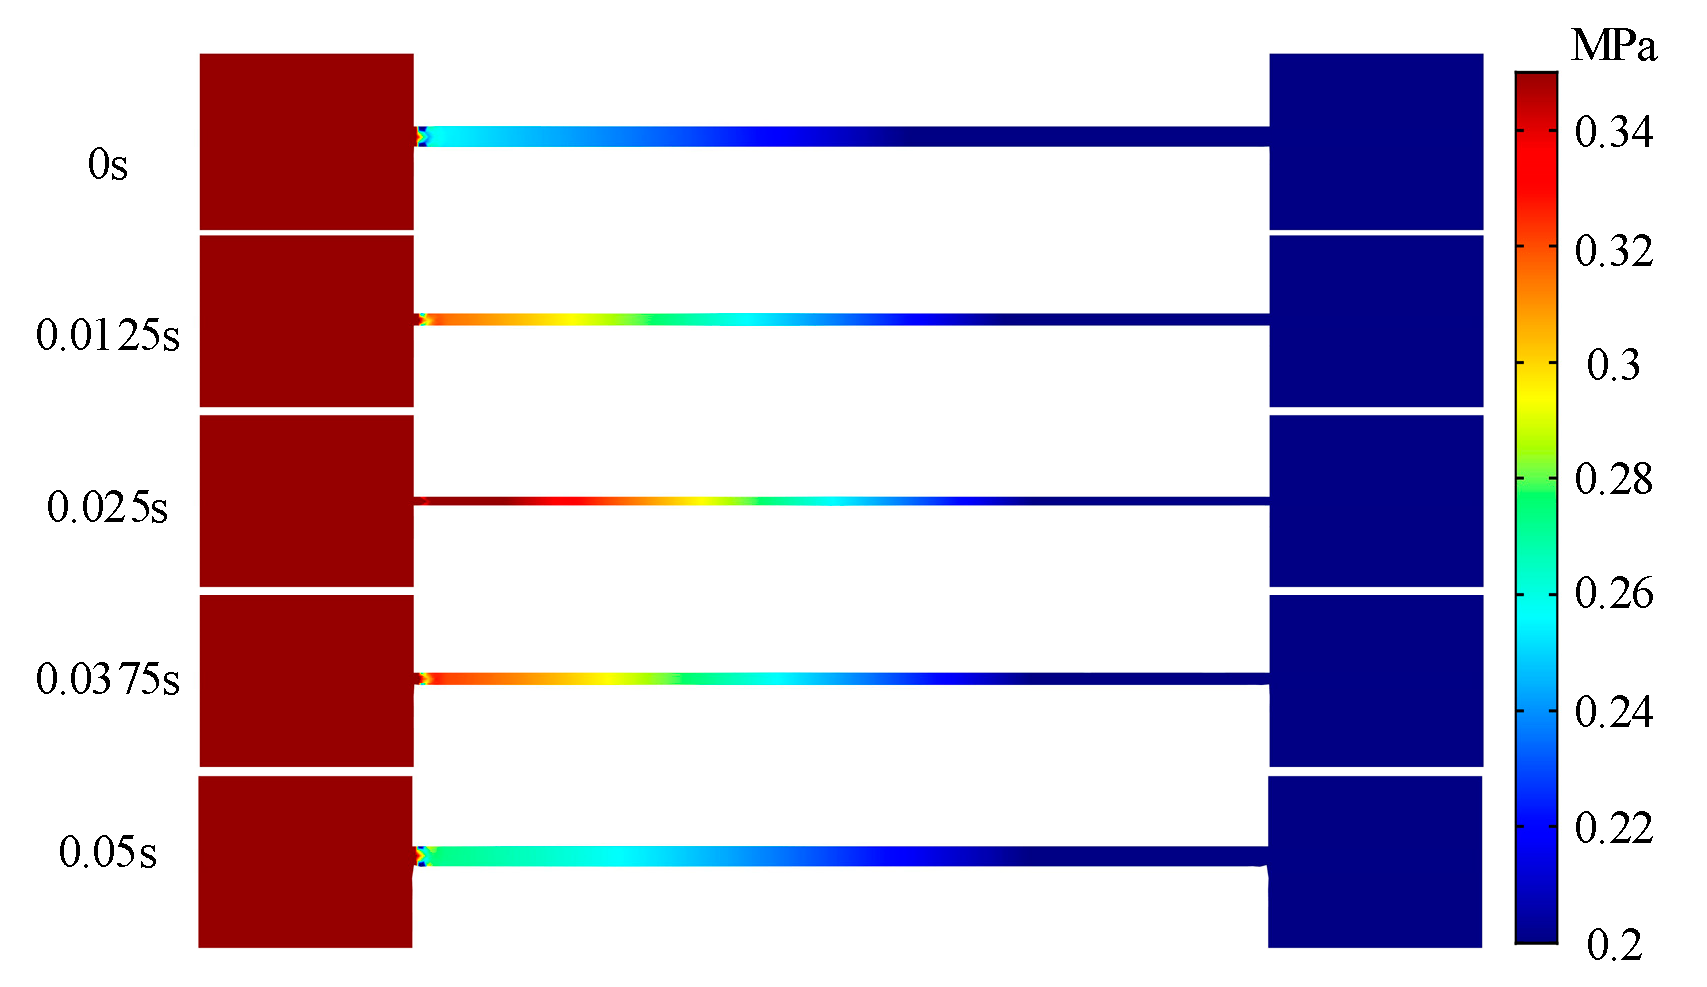
Figure 4.
Average pressure in the inter-electrode gap and tool displacement as a function of time during one half-period of tool vibration.
Figure 4.
Average pressure in the inter-electrode gap and tool displacement as a function of time during one half-period of tool vibration.

Figure 5.
Gas void fraction during the different machining stages with tool vibration.
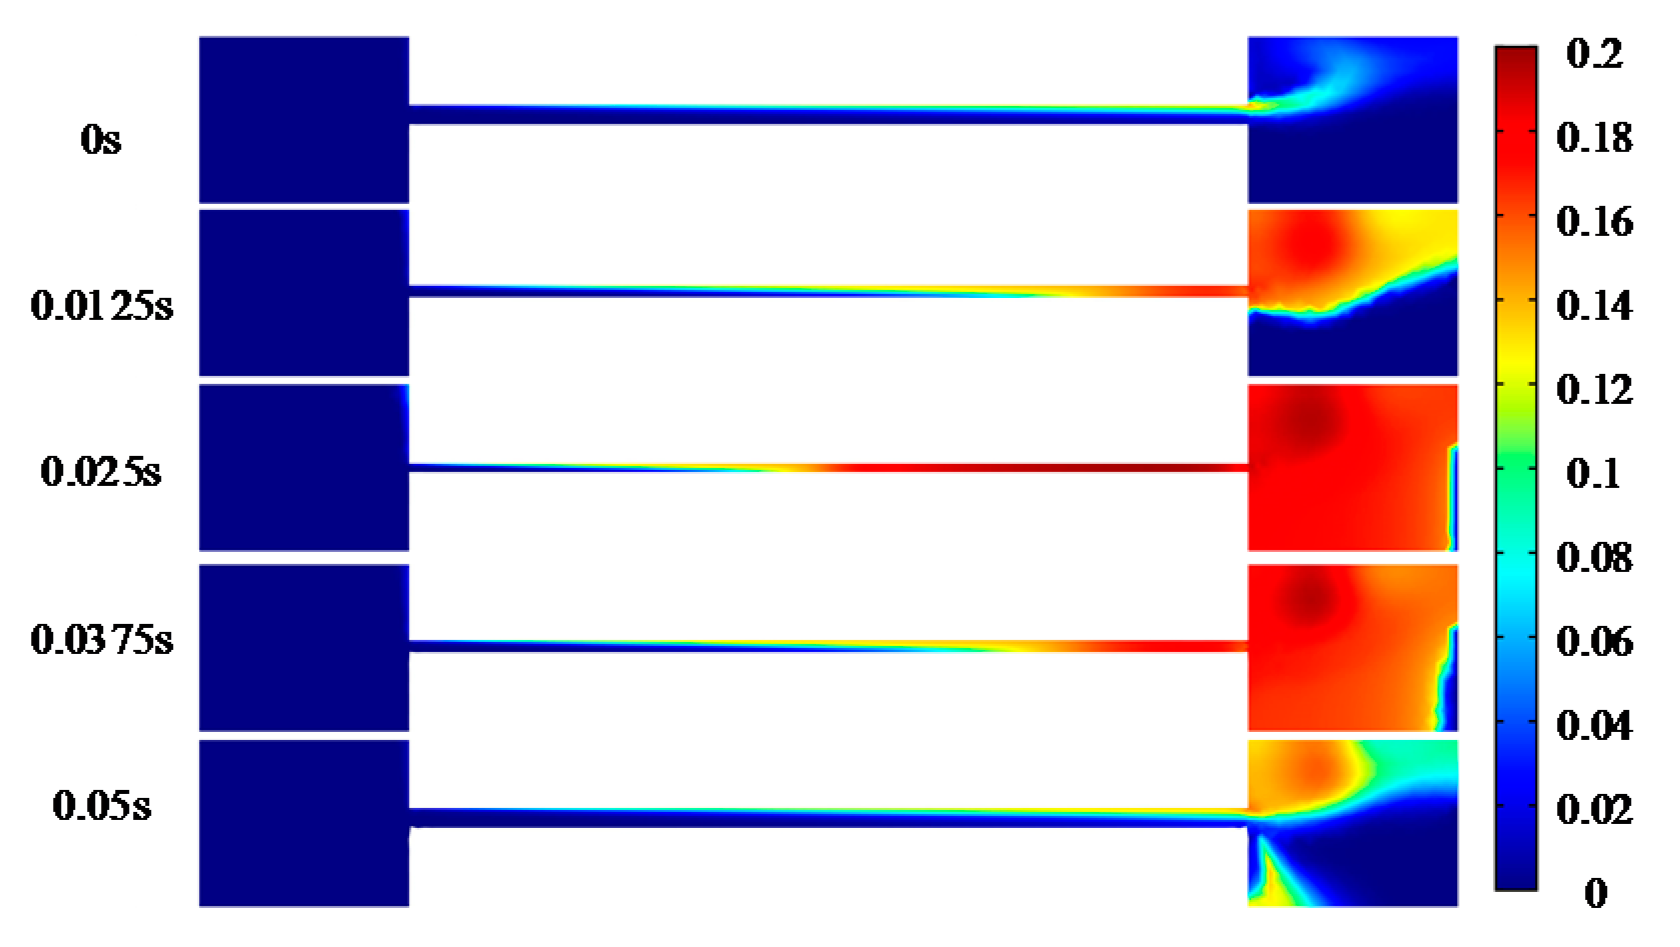
Figure 6.
Average gas void fraction and tool displacement as a function of time during one half-period of tool vibration.
Figure 6.
Average gas void fraction and tool displacement as a function of time during one half-period of tool vibration.

Figure 7.
Schematic diagram showing tool motion and pulse duration.

Figure 8.
Schematic diagram of the experimental setup.

Figure 9.
Photograph of the ECM fixture and important components of experimental apparatus.

Figure 10.
Schematic diagram showing the dimensions involved in the calculation of .

Figure 11.
Instantaneous current as a function of time for the three coupling modes at the end of machining and with the highest feed rate.
Figure 11.
Instantaneous current as a function of time for the three coupling modes at the end of machining and with the highest feed rate.
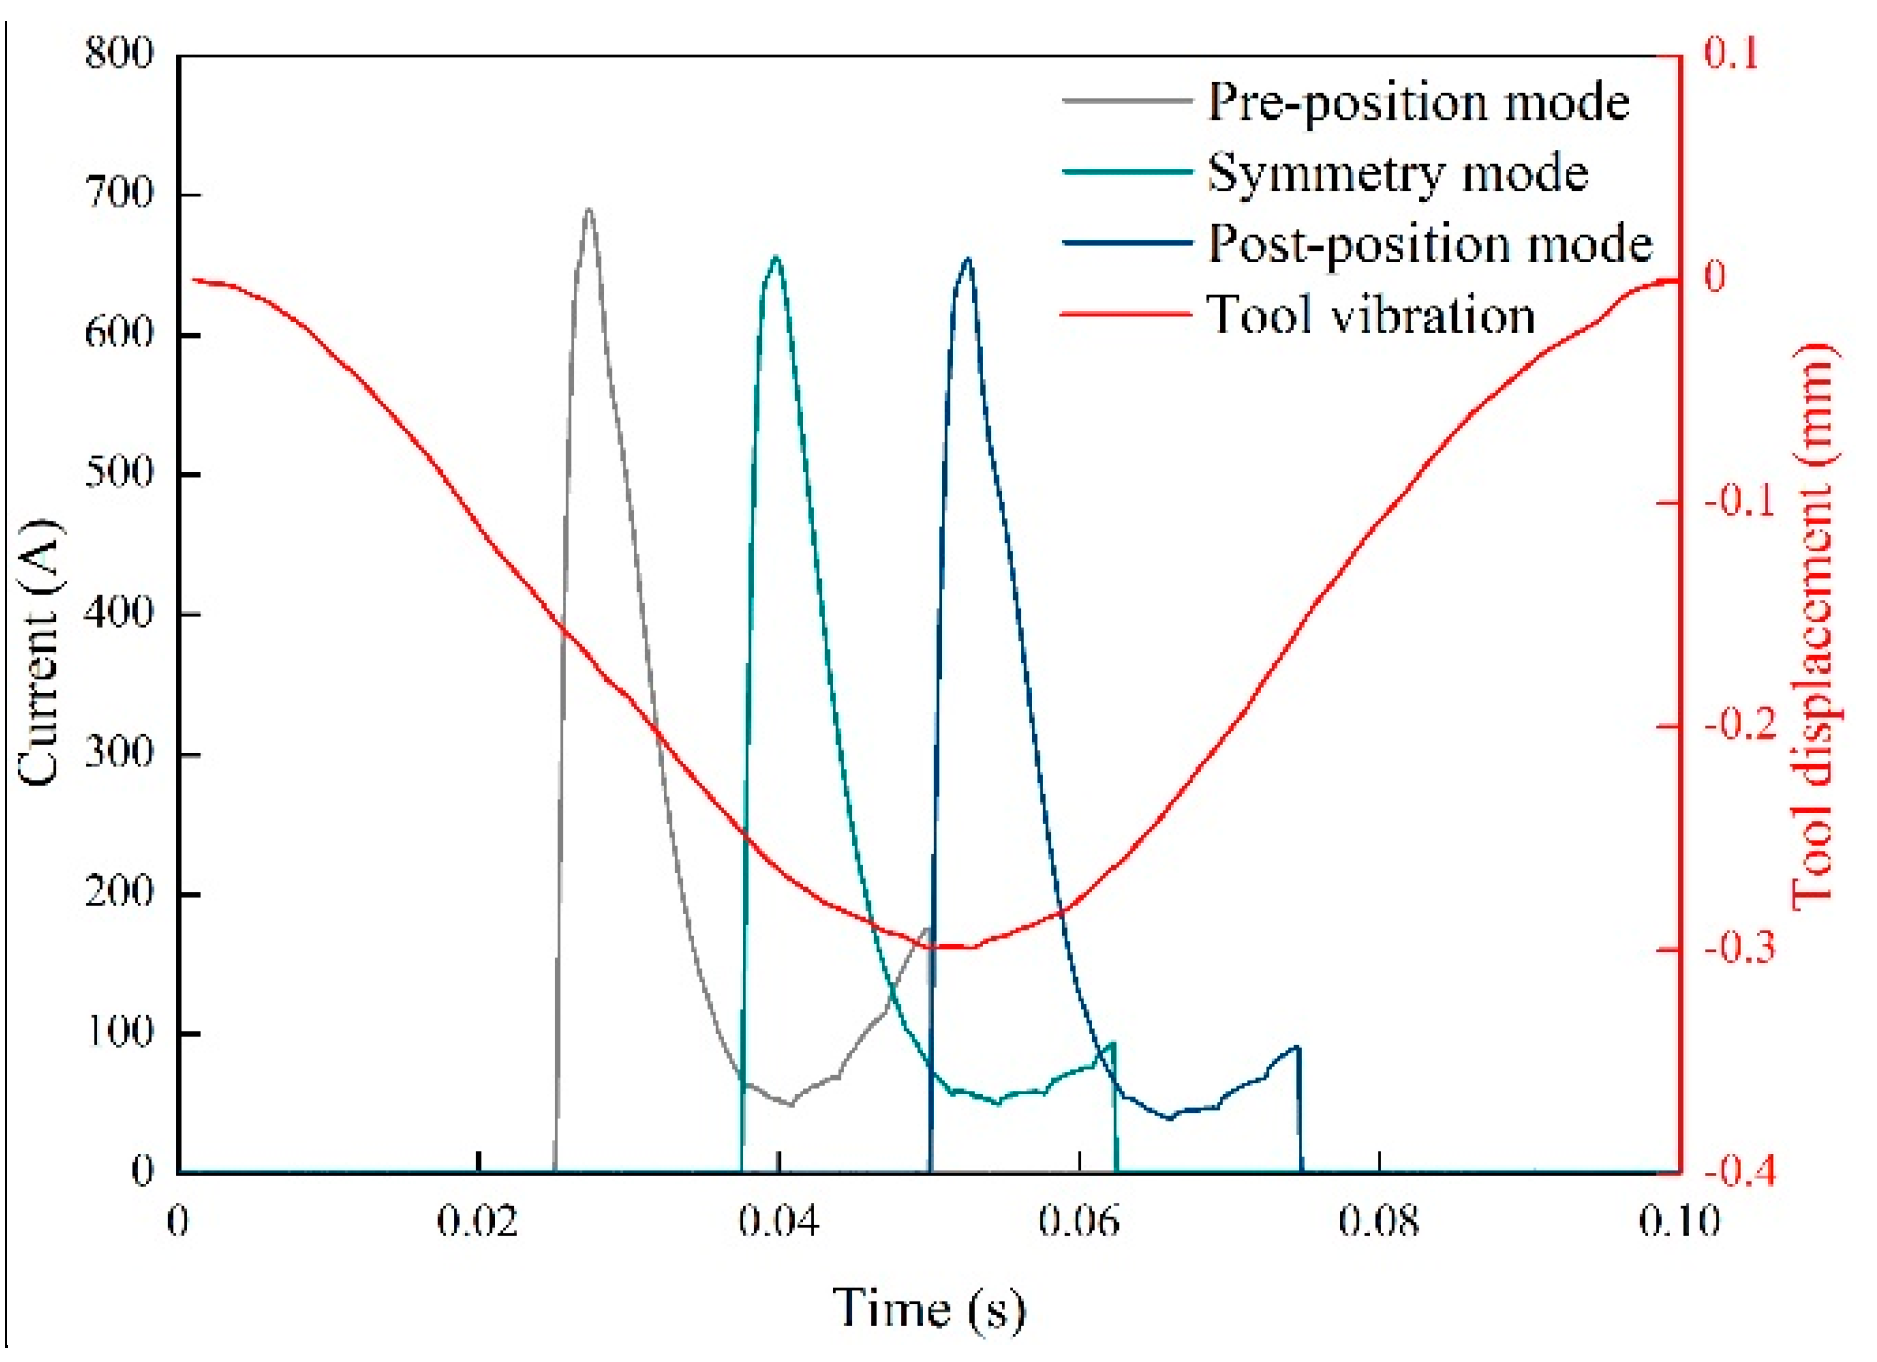
Figure 12.
Average current for the three coupling modes with their highest feed rate at the end of machining.
Figure 12.
Average current for the three coupling modes with their highest feed rate at the end of machining.
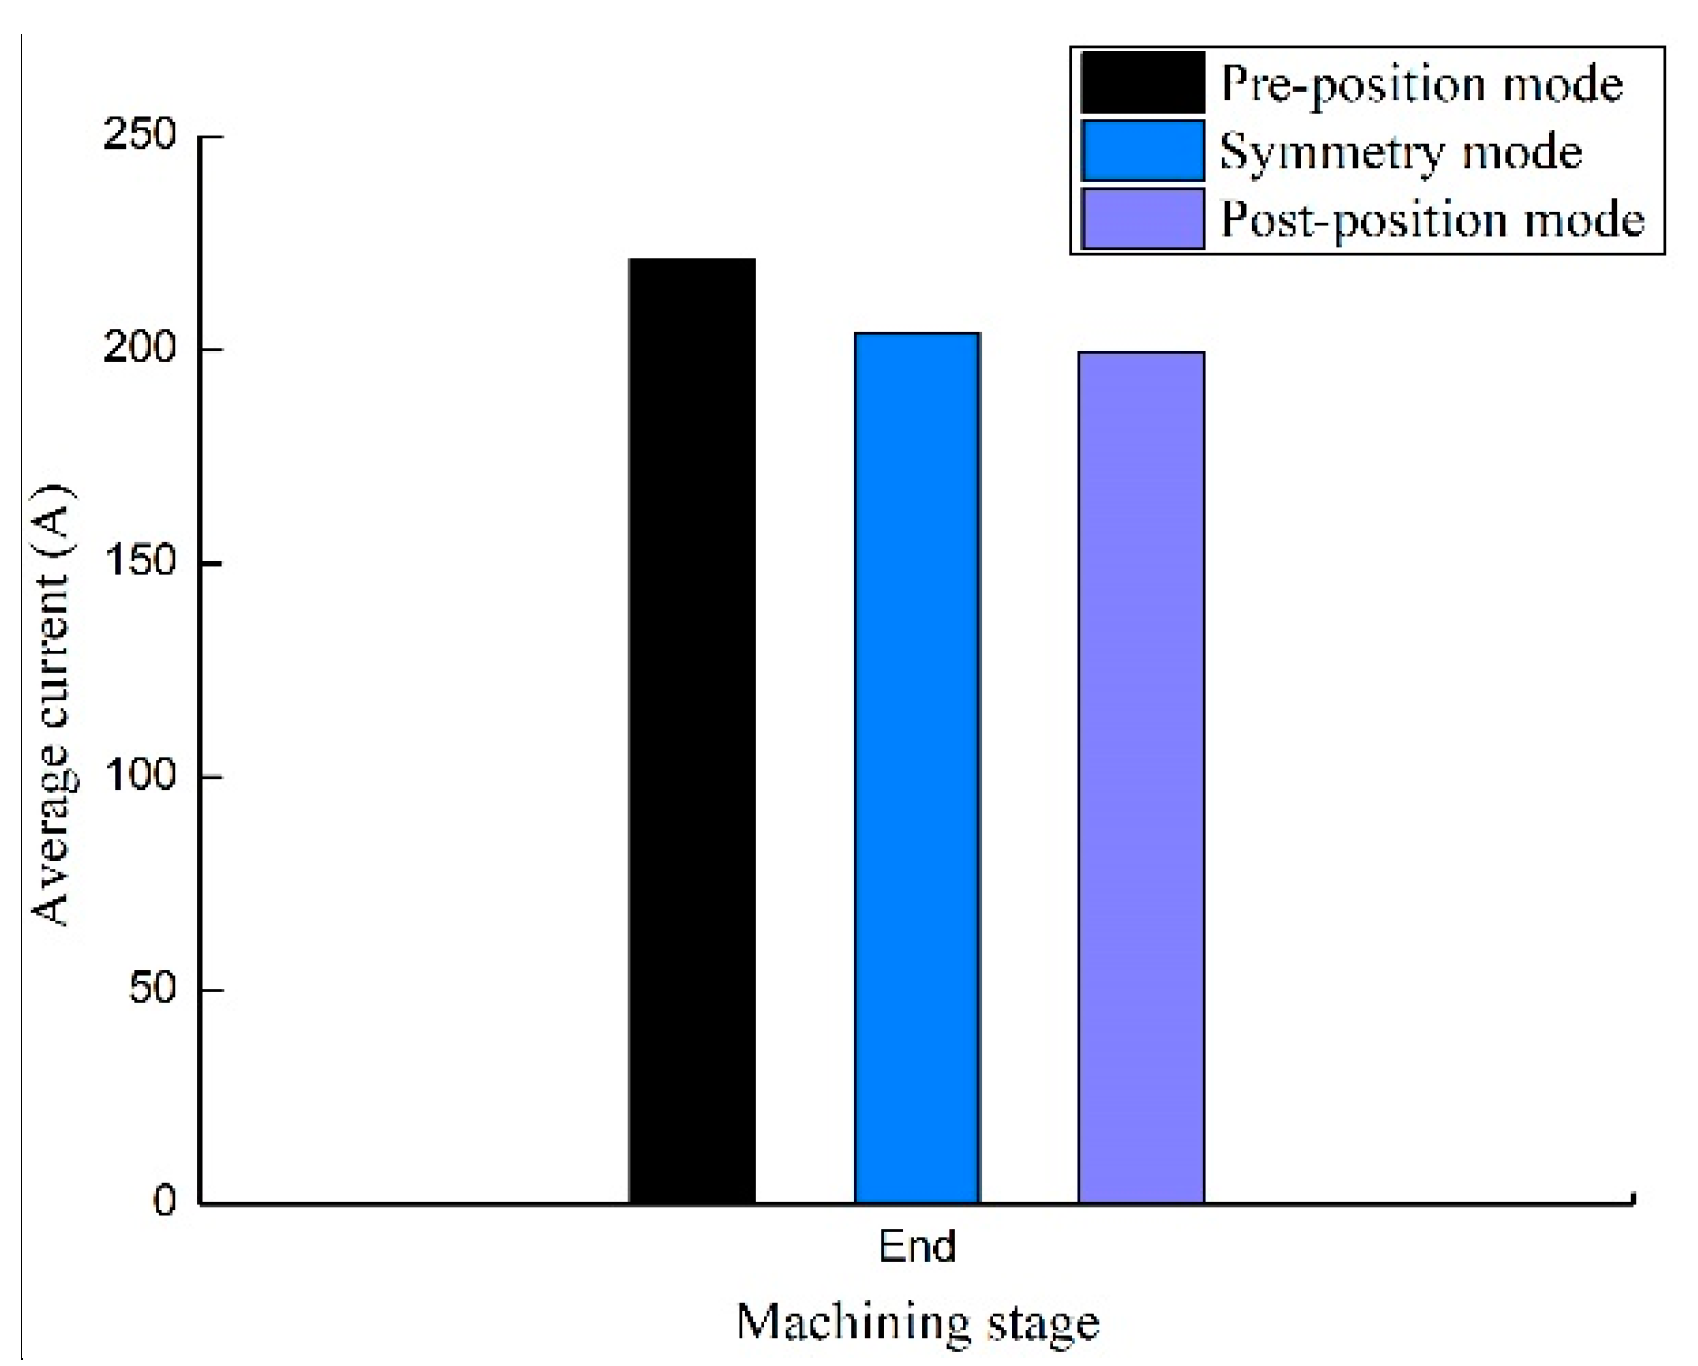
Figure 13.
vs. feed rate for the three coupling modes.
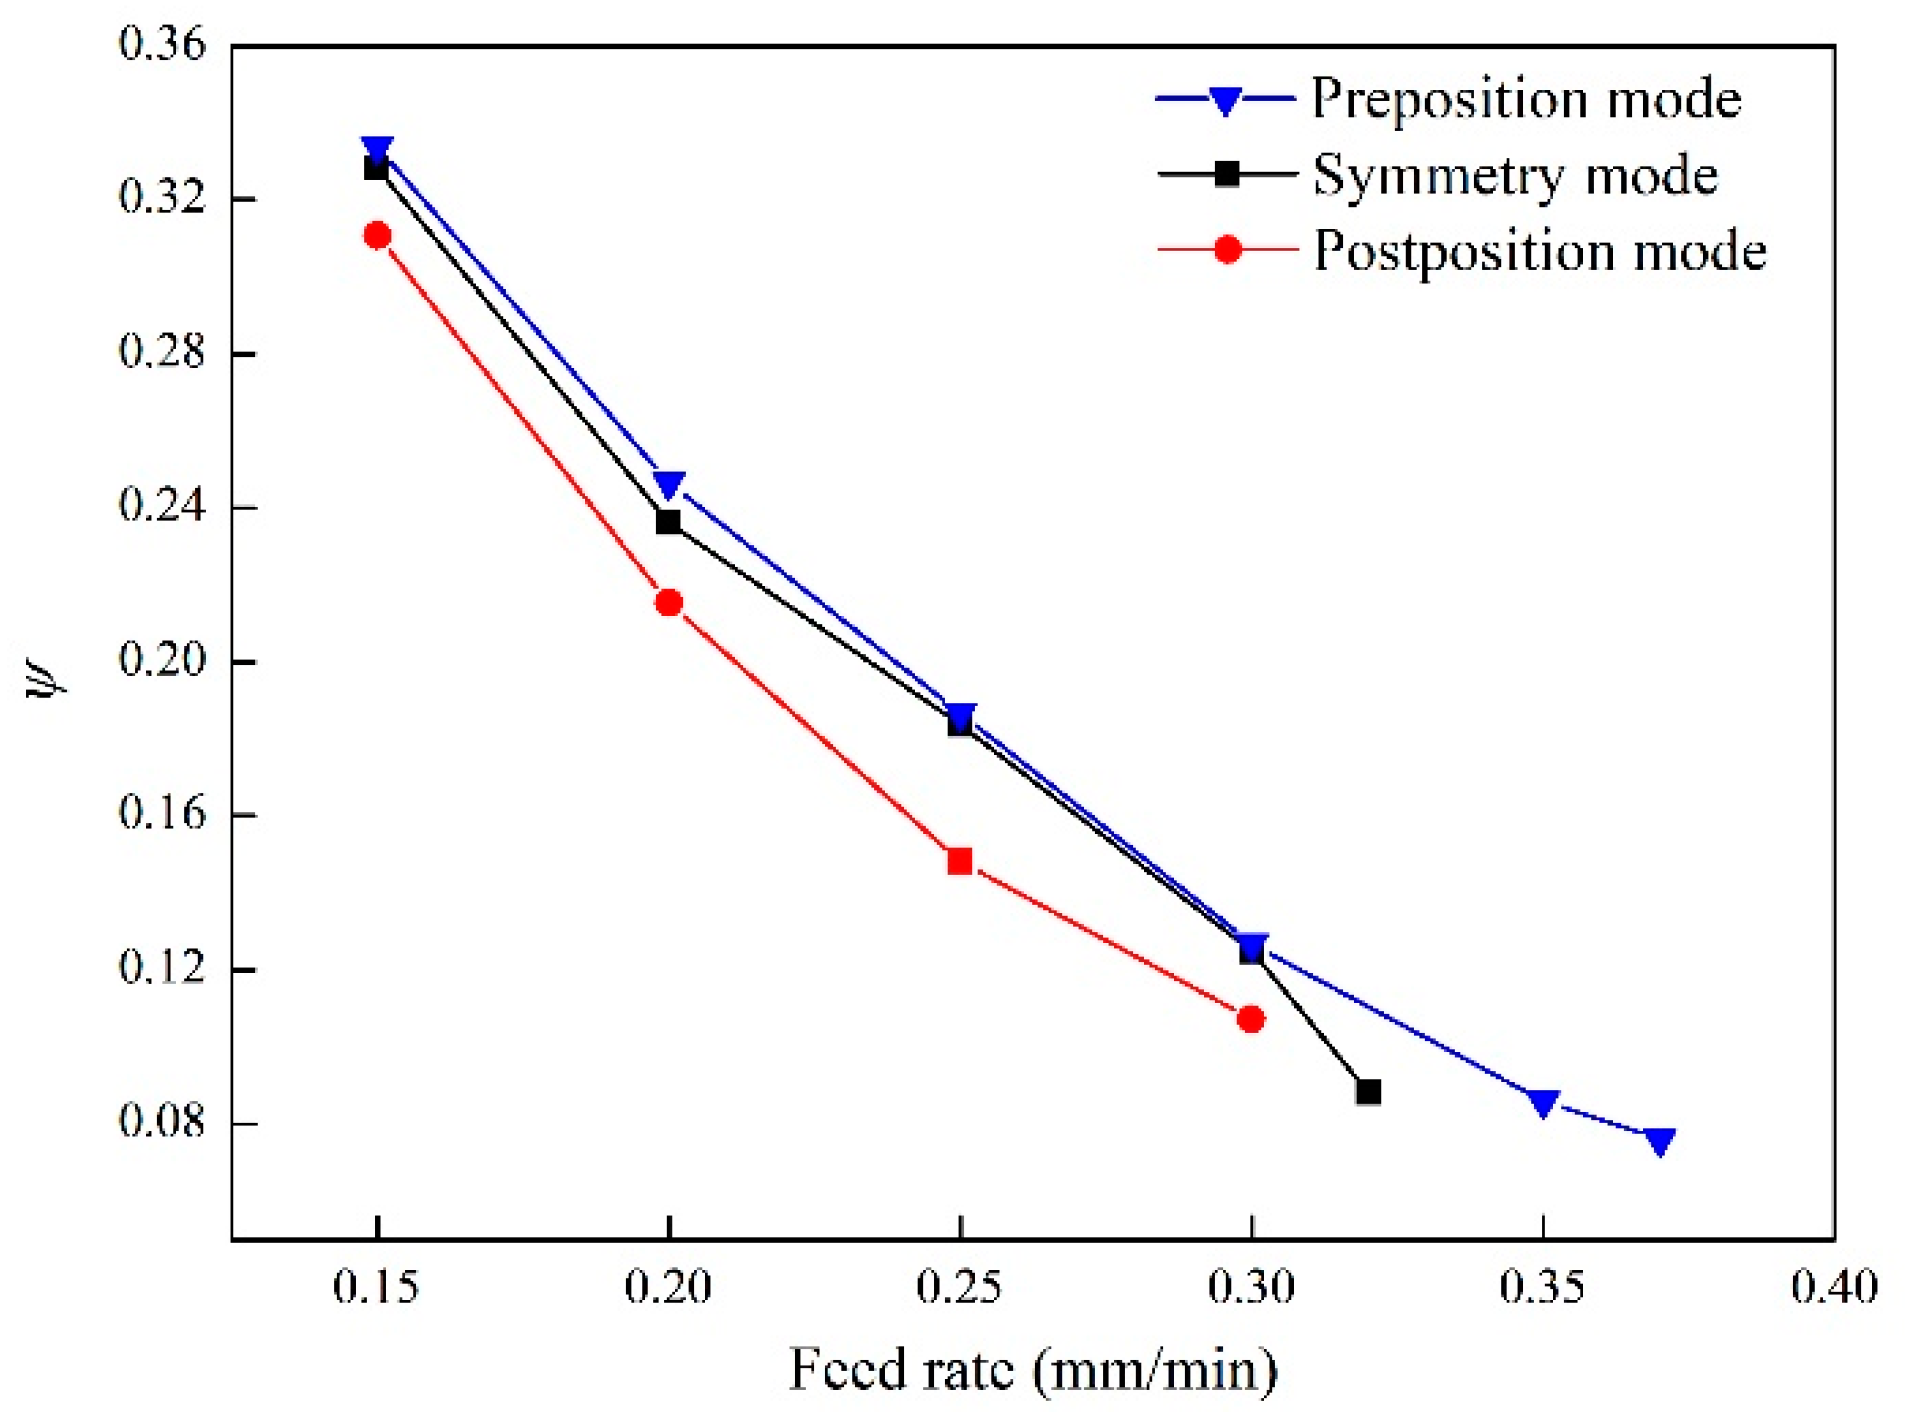
Figure 14.
Corresponding workpieces for the three coupling modes. (a) Workpieces with different feed rates in the pre-position coupling mode. (b) Workpieces with different feed rates in the symmetry coupling mode. (c) Workpieces with different feed rates in the post-position coupling mode.
Figure 14.
Corresponding workpieces for the three coupling modes. (a) Workpieces with different feed rates in the pre-position coupling mode. (b) Workpieces with different feed rates in the symmetry coupling mode. (c) Workpieces with different feed rates in the post-position coupling mode.


Table 1.
Parameter values used in calculations.
| Parameter | Value |
|---|---|
| Applied voltage (V) | 20 |
| Electrolyte conductivity | 16.1 S/m at 30 °C |
| Electrolyte inlet pressure (MPa) | 0.6 |
| Electrolyte outlet pressure (MPa) | 0.1 |
| Initial gap (mm) | 0.1 |
| Vibration frequency (Hz) | 10 |
| Vibration amplitude (mm) | 0.3 |
| Coefficient m | 1.5 |
Table 2.
Machining conditions.
| Conditions | Value |
|---|---|
| Electrolyte | NaNO3 |
| Electrolyte conductivity | 16.1 S/m at 30 °C |
| Voltage (V) | 20 |
| Electrolyte inlet pressure (MPa) | 0.6 |
| Electrolyte outlet pressure (MPa) | 0.1 |
| Electrolyte temperature (°C) | 30 ± 1 |
| Initial gap (mm) | 0.1 |
| Amount of feed (mm) | 1 |
| Vibration frequency (Hz) | 10 |
| Vibration amplitude (mm) | 0.3 |
| Duty cycle | 25% |
© 2018 by the authors. Licensee MDPI, Basel, Switzerland. This article is an open access article distributed under the terms and conditions of the Creative Commons Attribution (CC BY) license (http://creativecommons.org/licenses/by/4.0/).
Share and Cite
MDPI and ACS Style
Jiang, X.; Liu, J.; Zhu, D.; Wang, M.; Qu, N. Research on Stagger Coupling Mode of Pulse Duration and Tool Vibration in Electrochemical Machining. Appl. Sci. 2018, 8, 1296. https://doi.org/10.3390/app8081296
AMA Style
Jiang X, Liu J, Zhu D, Wang M, Qu N. Research on Stagger Coupling Mode of Pulse Duration and Tool Vibration in Electrochemical Machining. Applied Sciences. 2018; 8(8):1296. https://doi.org/10.3390/app8081296
Chicago/Turabian StyleJiang, Xiaochen, Jia Liu, Di Zhu, Mingming Wang, and Ningsong Qu. 2018. "Research on Stagger Coupling Mode of Pulse Duration and Tool Vibration in Electrochemical Machining" Applied Sciences 8, no. 8: 1296. https://doi.org/10.3390/app8081296
Note that from the first issue of 2016, this journal uses article numbers instead of page numbers. See further details here.