Single-Pixel Color Imaging Method with a Compressive Sensing Measurement Matrix

1
College of Information Science and Engineering, Northeastern University, No.3-11, WenHua Road, Heping District, Shenyang 110819, China
2
Shenyang Institute of Automation Chinese Academy of Science, No.114, NanTa Street, ShenHe District, Shenyang 110016, China
*
Author to whom correspondence should be addressed.
Appl. Sci. 2018, 8(8), 1293; https://doi.org/10.3390/app8081293
Submission received: 18 June 2018
/
Revised: 28 July 2018
/
Accepted: 30 July 2018
/
Published: 3 August 2018
(This article belongs to the Section Optics and Lasers)
Abstract
:Compressive sensing theory has addressed the limitations of traditional methods in the field of information technology, and led to a revolution. On the basis of compressive sensing theory research, this study utilized the exterior determinacy and inherent randomness of chaotic sequences, designed a pseudo-random circulant measurement matrix based on chaotic sequence. Compared with other deterministic measurement matrices, the restoration effect of the designed measurement matrix remarkably improved and showed advantages in hardware and storage. Then, this study developed a single-pixel imaging scheme that could accurately obtain color information. The proposed improved measurement matrix combined with the hardware system could accurately reconstruct color images and had good robustness according to various experimental data.
1. Introduction
The rapid development of signal processing technology has caused an increase in people’s demand for information. Currently, the large amount of information has challenged integrated information storage and effective transmission of information, and caused immense difficulties for traditional signal processing technology to meet practical demands. In 2004, Donoho et al. [1,2,3,4] proposed a simultaneous sampling and compressing theory, called compressive sensing (CS). The proposed new theory has enabled scientists to overcome the compression limit of Shannon-Nyquist sampling theorem. Currently, studies on CS theory and its application have dynamically increased, and the theory has been applied and developed in fields, such as remote sensing [5,6,7], modern telecommunications [8,9,10], pattern recognition [11], and magnetic resonance imaging [12,13,14].
CS has attracted the attention of many scholars and organizations and has been ranked in the top 10 scientific and technological developments in 2017. For example, Mahyar [15] proposed a network node deployment method using CS. It is applicable to large real-world and unknown networks in which the global approaches are usually unrealizable. But the recovery probabilities for the constructed measurement matrices is not high. Zhang et al. [16] proposed a super-resolution method for remote sensing images in the CS framework. The method has a good super-resolution quality and efficiency. But the optimization method can be improved to achieve better image quality. Petrantonakis et al. [17] proposed a grid cell firing field detection method using CS. The aim of this study is to present a methodology for unraveling the complete firing field of a grid cell even when it is poorly represented by the recorded spikes. But further experimentation is still needed towards the improvement of sampling process. Chai et al. [18] proposed an image encryption method on CS. But the processing speed intend to be improved and make the method more proper for real-time encryption fields. Well-known companies, such as Intel, Bell Labs, and Google also applied CS theory in various fields.
The single-pixel camera [19,20] developed by Rice University in the US, is the impressive achievement of CS theory. The system has verified the practical significance of CS theory, and established a new set of imaging systems. Compared with the characteristics of traditional cameras, those of the single-pixel imaging system specifically possess favorable natural conditions. For example, the sampling information required by the single-pixel camera is less than that of traditional imaging equipment, which enables immense development potential in fields such as wireless sensor networks [21], intelligent monitoring, and military affairs. The capability of a single-pixel camera to capture pictures by using a single sensor enables it with immense development space in imaging equipment that require remarkable sensor capability, such as infrared imaging [22] and terahertz imaging [23] equipment, thereby reducing the cost and avoiding the sensor development limitation in the development of imaging techniques. Currently, the single-pixel camera cannot be utilized in practical applications due to its technological limitations. Specifically, the image restoration effect of the single-pixel camera is less efficient than that of traditional cameras because the performance of measurement matrix immensely restrains the restoration effect of the camera. Moreover, the present single-pixel imaging equipment is incapable of collecting and acquiring color information. This condition imposes substantial limitations on the application fields of single-pixel imaging equipment.
This study proposes a pseudo-random circulant structure on the basis of Toeplitz matrix, and introduces a method of pseudo-random circulant measurement matrix design based on chaotic sequence. The designed deterministic measurement matrix is applicable for the single-pixel camera, and has better measurement and restoration effects. On the basis of the original single-pixel camera system, the design scheme of the single-pixel color camera is utilized in this study to acquire color information and restore real images and scenes.
2. Introduction to CS Theory
The core of CS theory is completing the compression during data sampling. In mathematics, CS theory uses a specific matrix to project the sparse or compressible signals into low-dimension space for compression. When restoring, CS theory uses the sparsity of the original signal as a priori condition to restore the original signal based on linear or nonlinear restoration model algorithm.
Original signal X is used as N dimension, that is, X RN, and Y refers to the measurement signal in M dimension, that is Y RM. Y is a linear projection of X, and M ≤ N. The relationship between X and Y can be expressed as Formula (1):
where Φ is the measurement matrix of M × N. Formula (2) is an underdetermined issue, and a direct solution will result in infinitely many groups of solution.
If signal X is sparse in a conversion Ψ domain, then,
where Ψ is the corresponding conversion domain matrix, and α is the linear indication of original signal X in Ψ domain, and is sparse. The restoration of signal X can be accomplished by solving norm l0.
Measurement matrix A is defined, as indicated in Formula (3).
Tao and Candès [24] proved that the projection measurement matrix must meet the restricted isometry property (RIP) for the precise reconstruction of sparse signal.
Assume A is a matrix with as the dimension. If for all ,
Then, matrix A meets the RIP of k order.
3. Design of Pseudo-Random Circulant Measurement Matrix Based on Chaotic Sequence
3.1. Design of Measurement Matrix Based on Chaotic Sequence
Common chaotic sequences include Chua, Lorenz, logistic and Rösser chaotic sequences [25]. The measurement matrix generated by using logistic chaotic sequence can best fit CS reconstruction [26] and can be produced with hardware.
The logistic chaos system is a deterministic system, with pseudo-random features. The form of 1D logistic chaos system is expressed as follows.
The logistic map enters chaos state when the original values are 0.23, 0.37, and 0.70 under system parameter u [1.872, 2.0]. The chaotic sequence is distributed on interval (−1, 1), the logistic map is the full map, and the chaotic performance is the best when u = 2.0. The simulation results show that the logistic map has period doubling bifurcation, ergodicity, and averaging properties.
The probability density function when u = 2.0 is shown in Formula (6).
The probability of chaotic sequence between (−1, 0) and (0, 1) equals each other, which is 1/2, by using the properties of random various that conform to uniform distribution. Then, binarization is conducted on the chaotic sequence generated by Formula (5), as indicated in Formula (7).
Thus, the sequence probability of using +1 and −1 is 1/2, and the sequence generated by logistic chaos system can satisfy Bernoulli distribution. The uniformity and stability of the logistic chaotic sequence are better than that of the random Bernoulli sequence.
Ref. [27] demonstrated that an M × N Bernoulli matrix can meet the RIP with high probability when , with probability at least
where constants 0 exist that only depend on .
The sequence has statistical independence, satisfies Bernoulli sequence, and meets the RIP. Thus, the measurement matrix in CS can be constructed by chaotic sequence. The form of the constructed measurement matrix A is indicated follows:
where is the normalization coefficient, and the matrix element arranges the chaotic sequence based on column. The measurement matrix based on logistic chaotic sequence (LCS-MM) requires the hardware to generate at least elements of chaotic sequence, and the required measurement matrix is formed by ranking based on column. The measurement matrix has image restoration capability, which is the same as that of random Bernoulli sequence. However, the measurement matrix requires considerable calculated amount, and causes immense burden on the hardware system.
3.2. Design of Pseudo-Random Circulant Measurement Matrix Based on Chaotic Sequence
LCS-MM is combined with the Toeplitz matrix to construct a circulant measurement matrix (LCS-CMM), as indicated in Formula (10).
A is an LCS-CMM, that consists of two elements, 1 and −1, and is a deterministic measurement matrix of binarization.
On the basis of the Toeplitz matrix structure, the RIP of order 3k for every is satisfied for an M × N Bernoulli Toeplitz-structured matrix when M with probability at least
where constants 0 exist that depend only on [28].
After the combination of chaotic sequence with the Toeplitz matrix, simple number calculation is used to generate the first line, and a common cyclic shift is used to accomplish the generation of the entire measurement matrix. Compared with the method without combining circulant structure, the generated LCS-MM immensely reduces the pressure on hardware, and improved production speed of the measurement matrix. However, the recovery capability is relatively poor.
LCS-CMM is improved to reduce matrix coherence. Compared with a matrix obtained from random exchange of lines and columns of an orthogonal matrix with any given matrix, incoherence is immensely improved [29]. Thus, the random circulant is introduced based on common Toeplitz matrix to maintain low coherence between the columns and between lines. Specifically, the elements in Line 2-M of the matrix are obtained through the random cycle of elements in the first line. However, the chaotic sequence is introduced in conducting the random circulant on deterministic matrix, to pseudo-randomly select the number of cycles each time. In this way, the pseudo-random circulant measurement matrix based on chaotic sequence (LCS-PRC-MM) is formed. The specific generation method is expressed as follows:
Step 1: The required measurement matrix should be M × N when the resolution ratio of the target recovered image is N × N, and the number of measurements is M. The logistic chaos system used to generate sequence S1 in inverted order consists of N elements, and acts as the first line of measurement matrix, where S1 {}.
Step 2: Circulate based on the Toeplitz matrix is conducted to generate line i, with original value of 2, where 1 < i < N.
Step 3: Determine whether the vector of circulant line generated at Step 2 can act as Line h of the measurement matrix based on the value of the next element generated by logistic chaotic sequence(multiple cycles can be set). Line i generated through circulation is taken as line h of the measurement matrix, h = h + 1, when the condition is met, and the process moves to Step 4. It directly proceeds to Step 4 when the condition is not met. The original value of h is 2, 2 < h < M;
Step 4: If I = i + 1, return to Step 2. If I = N, then h = h + 1 and I = 2. The chaotic sequence regenerates a sequence Sh in inverted order to act as Line h of the measurement matrix, and return to Step 2. If h > M, turn to Step 5;
Step 5: Generated matrix M × N is actually the required measurement matrix. Finally, each line of the matrix in turn into a matrix N × N, and total of M N × N matrixes are generated.
The measurement matrix utilizes the exterior determinacy and inherent randomness of chaotic sequence. In this way, the measurement matrix improves the image reconstruction capacity, and makes the camera adaptive in capturing images with a different sparsity by setting multiple of cycles.
4. Experimental Results and Analysis
4.1. Design of Single-Pixel Color Imaging System
The single-pixel camera can be divided into several parts, namely, spatial light modulator, light path consisting of optical lens, signal acquisition and processing module, and signal recovery and reconstruction module.
The single-pixel imaging system uses DMD(Digital Micro Mirror) device as spatial light modulator, and adopts DLP7000 from Texas Instruments of USA. DLP7000 comprises 1024 × 768 micro-mirrors, in which each mirror can turn over through process control between left and right for +12° or −12°, and the binary frame frequency can reach 32 KHz. The optical sensor used here is silicon photoelectric diode FDS1010 from Thorlabs, with sensitization area of 10 × 10 mm. Weak optical signal processing is designed by using an LF411 amplifier, which amplifies and filters the optical signal and outputs differential signals to A/D digital-to-analogue conversion module. To achieve a better imaging effect, the camera uses two lenses of digital single-lens Reflex to form a light path.
The existing single-pixel imaging equipment only can take grey-scale map, and cannot record color information, which restrains its application. The single-pixel color imaging system is designed based in the investigation and research on traditional imaging and projection equipment. Image processing and mixing methods are used to reconstruct the color image by collecting three kinds of color information of Red, Green, Blue (RGB). To better capture the color image, two groups of implementation scheme are designed based on the original single-pixel camera.
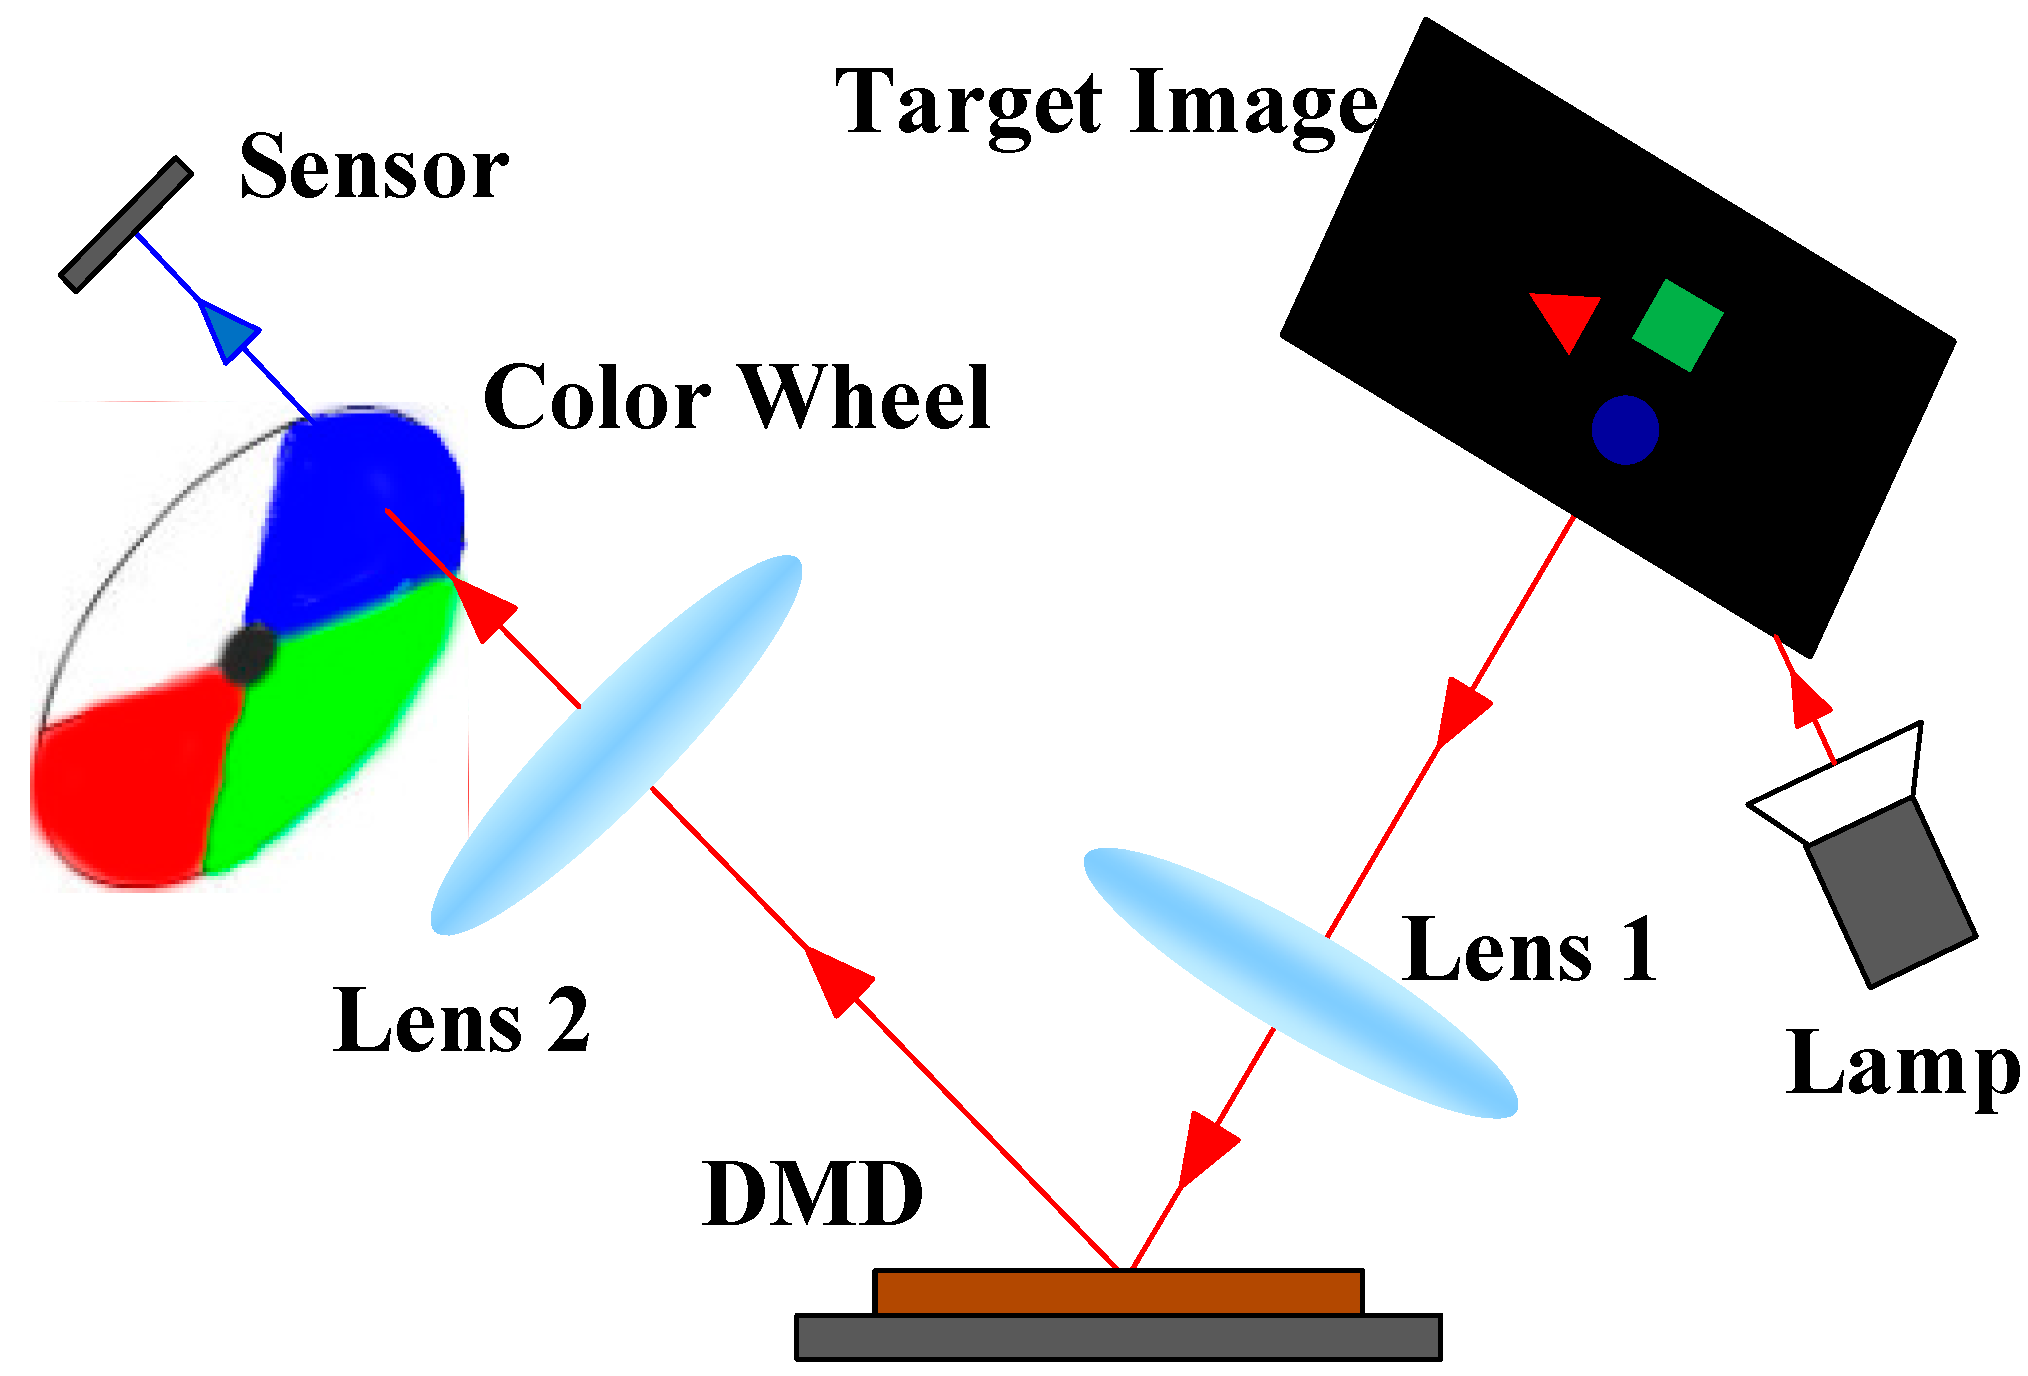
Figure 1: The design is based on the operating principle of DLP projector. Images are captured in red, green, and blue by using an optical filter with three RGB colors on the color wheel, and three groups of data are mixed to obtain the RGB image. The disadvantages of this scheme is poor instantaneity and ability to shoot static color targets only.
Figure 2: This scheme is designed to obtain better color information. In this scheme, chromatic dispersion theory is used to disintegrate the incident light into monochromatic light with different wavelengths, and sampled lights with different wavelengths are integrated to recover and obtain the original image. Specifically, this scheme uses a spectroscope to separate red, green, and blue light, and three optical sensors are used to sample the three kinds of light. The integration of three groups of data results in an RGB image. The sampling rate of this scheme is remarkably improved compared with that of Figure 1. Under 2000 sampling times, the shooting rate of the constructed single-pixel color imaging system is approximately 10 FPS. In addition, methods such as weighting should be used to calibrate the collected data by using sensors to make the recovered image reproduce the color information of the target because different spectroscopes have different dispersive powers on incident light.
4.2. Performance Comparison of Measurement Matrices
A number of measurement matrices have been proposed. These matrices can be classified into two main categories: random and deterministic [30,31,32]. On the one hand, Random matrices are generated by identical or independent distributions such as Fourier matrix, Bernoulli and Hadamard sparse random matrices. Random matrices are easy to satisfy the RIP with high probability. However, because of the randomness, they present some drawbacks such as high computation and costly hardware implementation. On the other hand, deterministic matrices are constructed deterministically to have a small mutual coherence or satisfy the RIP. In this study, we designed a pseudo-random circulant measurement matrix based on chaotic sequence. It belongs to the deterministic measurement matrix. The advantage of the measurement matrix easily generates hardware on the basis of ensuring better reconstruction effect and is suitable for the single-pixel imaging system.
In this study, two image quality models, namely, peak signal-to-noise ratio (PSNR) and structural similarity (SSIM) [33], are used to conduct the analysis and comparison of results.
PSNR is defined as following.
where m n is the image size, I, K represent the target image and reconstructed image respectively, MSE represents the mean square error between two images, i and j represent the image row and column pixel position respectively, k is the number of bits of each sample value. The value of PSNR is inversely proportional to the degree of image distortion obtained by reconstruction. The magnitude of PSNR value is positively correlated with the quality of image reconstruction. PSNR is widely used objective measure of quality evaluation.
PSNR = 10 log10 ((2k − 1)2/MSE),
SSIM (structural similarity index) is a measure of the similarity between two images. It is defined as following.
where x and y represent the target and reconstructed images respectively, μx and μy represent the mean value of images x and y respectively, σx and σy represent the variance of images x and y respectively, σxy is the covariance of images x and y, and c1, c2, and c3 are constants as shown in Formula (15). To avoid the case where the denominator is 0, K1 = 0.01, K2 = 0.03, and L = 255 are generally used. The SSIM value range is [0, 1], and the larger the value is, the smaller the image distortion becomes.
l(x, y) = (2μx μy + c1)/(μx2 + μy2 + c1),
c(x, y) = (2σx σy + c2)/(σx2 + σy2 + c2),
s(x, y) = (σxy + c3)/(σx σy + c3),
SSIM = l(x, y) × c(x, y) × s(x, y),
c1 = (K1 × L)2, c2 = (K2 × L)2, c3 = c2/2,
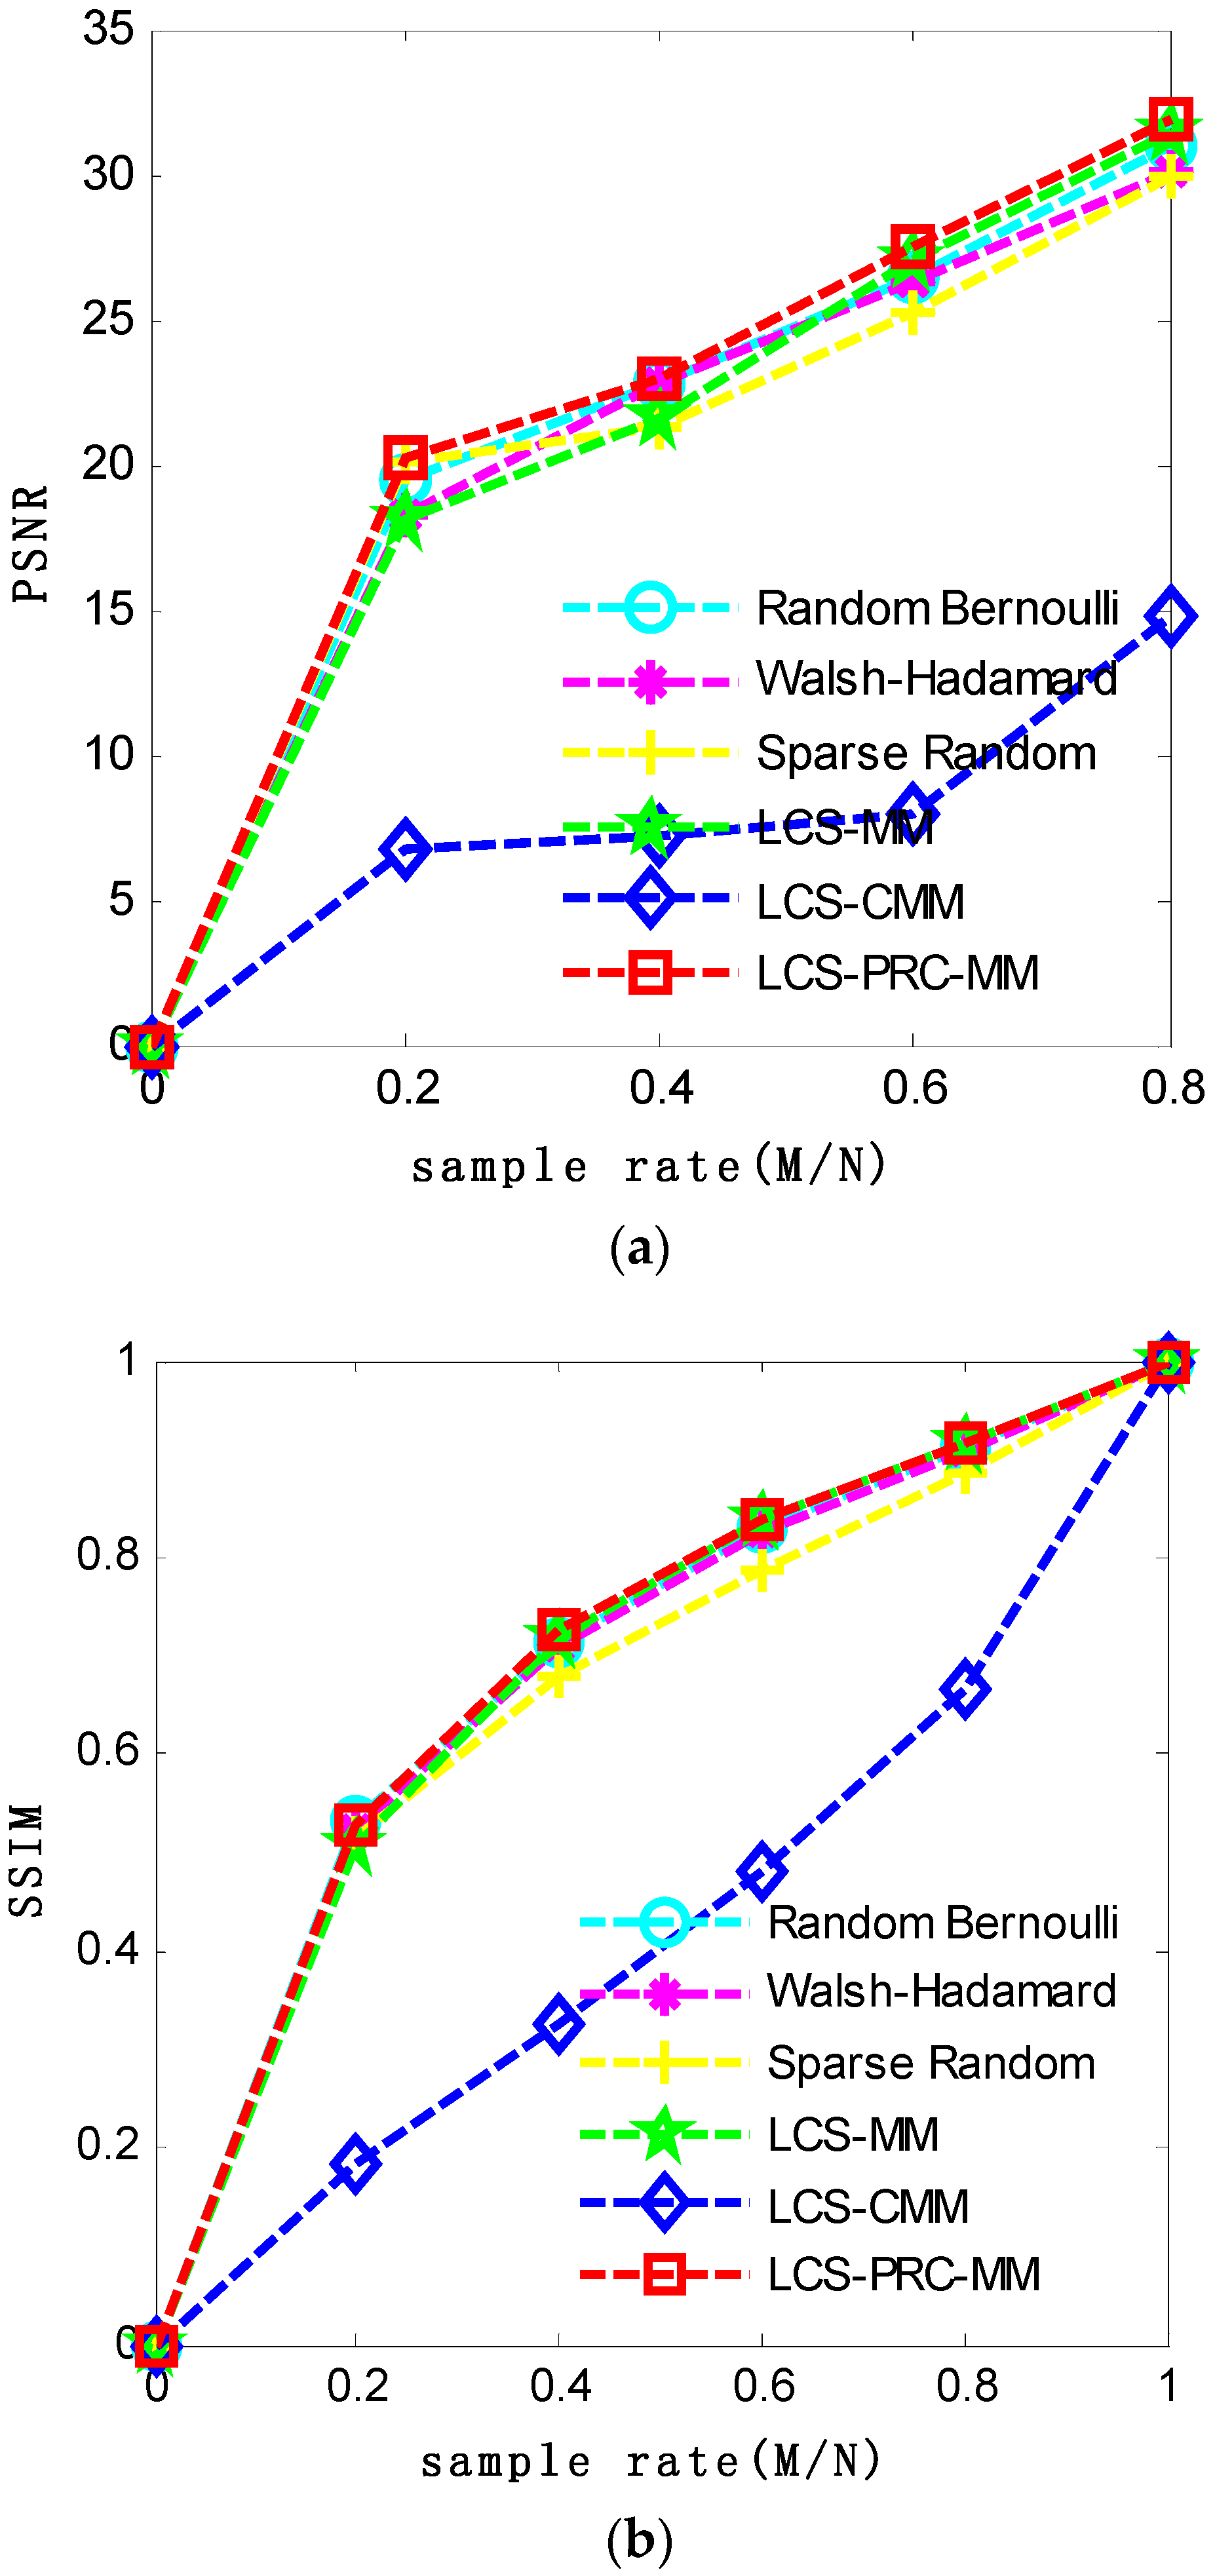
The last process aims to recover the original signal from a small set of measurement matrices [34,35,36,37,38,39]. Because the TVAL3 algorithm has a higher reconstruction rate and better reconstruction effect, it is widely used as a recovery algorithm in the single-pixel imaging system [40]. In the comparison experiment, TVAL3 is therefore used as the recovery algorithm, and the resolution ratio of target pictures is 128 × 128. Bernoulli matrix, sparse random matrix, Walsh–Hadamard measurement matrix, LCS-MM, LCS-CMM and LCS-PRC-MM are compared. The results are shown in Figure 3 and Figure 4.
The experimental results show that the improved LCS-PRC-MM has better image restoration effect than LCS-CMM, with average increase of 2–3 times. This finding is approximately the same as the recovery results of random Bernoulli matrix, especially under the sampling rate of 40% or 60%. The improved deterministic measurement matrix has better recovery effect than the random Bernoulli matrix. The present application scenario of single-pixel camera is generally static and simple. LCS-PRC-MM can be favorably compared with the Bernoulli matrix under a specific scene, and has advantages in hardware and storage, which makes it suitable for single-pixel imaging equipment.
4.3. Color Camera Imaging Experiment
A group of measurement matrices is constructed by using the designed LCS-PRC-MM, which consists of 64 × 64 black and white diamonds (resolution ratio of recovered images is 64 × 64) with resolution ratio of 1024 × 768 (the measurement matrices are designed as 1024 × 768, with each pixel corresponding to a micro-mirror, and each diamond is composed of 16 × 12 pixels because DLP7000 comprises 1024 × 768 micro-mirrors).
The experiment is conducted by using the established single-pixel imaging system, and the resolution ratio of the reconstructed results is 64 × 64. After sampling by LCS-MM, LCS-MM, and LCS-PRC-MM and restoration by the TVAL3 algorithm, the measurement ratio under 2000 pieces of sampling matrices (sampling matrix refers to one line in the measurement matrix) is 48.8281% (2000/64 × 64), as shown in Figure 5 and Figure 6.
Based on the established single-pixel imaging system, the single-pixel color camera system is constructed by adding modules, such as beam splitter prism, and the aforementioned experimental method is repeated. The resolution ratio of the recovered images is 64 × 64 and the sampling frequency is 48.8281%, as shown in Figure 7 and Figure 8.
The previous experimental data showed that the measurement and recovery effect of LCS-PRC-MM in the original single-pixel camera and single-pixel color camera improved compared with two other kinds of deterministic measurement matrix. The designed single-pixel color imaging system can effectively restore the target image color with an uncomplicated background. The improved measurement matrix can effectively recover the color and structural information of the target image.
5. Conclusions
A pseudo-random loop measurement matrix based on chaotic sequence is designed by utilizing the external determinism and inherent randomness of chaotic sequences. Compared with other deterministic measurement matrices, it has a remarkabe recovery effect and advantages in hardware integration. On the basis of the integration of this measurement matrix, a single-pixel imaging method is proposed in this paper, which can accurately reconstruct the RGB image. Image restoration and reconstruction methods based on FPGA will be investigated in future research to improve the imaging rate of the single-pixel camera and achieve real-time video filming function.
Author Contributions
Conceptualization, T.J.; Methodology, T.J. and D.C.; Software, J.W.; Validation, D.X.; Formal Analysis, T.J.; Investigation, T.J.; Writing-Original Draft Preparation, T.J. and D.C.; Writing-Review & Editing, J.W. and D.X.; Visualization, J.W.; Supervision, T.J.; Project Administration, T.J.; Funding Acquisition, T.J.
Funding
This research was funded by the National Natural Science Foundation of China under Grant U1613214 and party funded by Shenyang City Science and Technology Plan under Grant F16-2051-04 by the 111 Project under Grant B16009.
Acknowledgments
This research was supported by the National Natural Science Foundation of China under Grant U1613214 and partly supported by the Fundamental Research Funds for the Central Universities of China under Grant N170402008, by the Fund for the Shenyang City Science and Technology Plan under Grant F16-2051-04. We would like to thank the Liaoning Engineering Laboratory of Operations Analytics and Optimization for Smart Industry.
Conflicts of Interest
The authors declare no conflicts of interest.
References
- Donoho, D.L. Compressed sensing. IEEE Trans. Inf. Theory 2006, 52, 1289–1306. [Google Scholar] [CrossRef]
- Candès, E.J.; Romberg, J. Robust signal recovery from incomplete observations. In Proceedings of the IEEE International Conference on Image Processing, Atlanta, GA, USA, 8–11 October 2006; pp. 1281–1284. [Google Scholar]
- Candès, E.J. Compressive sampling. In Proceedings of the International Congress of Mathematicians, Madrid, Spain, 22–30 August 2006; pp. 1433–1452. [Google Scholar]
- Candès, E.J.; Romberg, J.K.; Tao, T. Stable signal recovery from incomplete and inaccurate measurements. Commun. Pure Appl. Math. 2006, 59, 1207–1223. [Google Scholar] [CrossRef] [Green Version]
- Yu, H.Y.; Wang, G. HYCA: A New Technique for Hyperspectral Compressive Sensing. IEEE Trans. Geosci. Remote Sens. 2015, 53, 2819–2831. [Google Scholar]
- Ma, R.Q.; Cheng, B.; Liu, X.N.; Liu, Y.M.; Jiang, W.; Yang, C. Research on GF-1 remote sensing HIS image fusion algorithm based on compressed sensing. Remote Sens. Land Resour. 2017, 29, 26–32. [Google Scholar]
- Wang, L.; Zhou, X. Analysis of infrared remote sensing image reconstruction algorithms based on compressive sensing. Tele-Commun. Eng. 2018, 58, 332–337. [Google Scholar]
- Guariglia, E. Entropy and Fractal Antennas. Entropy 2016, 18, 84. [Google Scholar] [CrossRef]
- Berry, M.V.; Lewis, Z.V. On the Weierstrass-Mandelbrot fractal function. Proc. R. Soc. Lond. Ser. A 1980, 370, 459–484. [Google Scholar] [CrossRef]
- Fazel, F.; Fazel, M.; Stojanovic, M. Random Access Compressed Sensing over Fading and Noisy Communication Channels. IEEE Trans. Wirel. Commun. 2012, 12, 2114–2125. [Google Scholar] [CrossRef]
- Mairal, J.; Bach, F.; Ponce, J.; Sapiro, G.; Zisserman, A. Discriminative learned dictionaries for local image analysis. In Proceedings of the IEEE Conference on Computer Vision and Pattern Recognition (CVPR), Anchorage, AK, USA, 23–28 June 2008. [Google Scholar]
- Qin, J.; Guo, W.H. An efficient compressive sensing MR image reconstruction scheme. In Proceedings of the IEEE, International Symposium on Biomedical Imaging, San Francisco, CA, USA, 7–11 April 2013; pp. 306–309. [Google Scholar]
- Zhang, H.Y. Based on sparse vector and low-rank matrix compressed sensing magnetic resonance image reconstruction algorithm. J. Tianjin Univ. Technol. 2017, 33, 25–29. [Google Scholar]
- Wang, J.; Liu, J.-C. A Survey of Magnetic Resonance Imaging Based on Compressed Sensing. Electron. Qual. 2018, 373, 65–69. [Google Scholar]
- Mahyar, H.; Hasheminezhad, R. Compressive sensing of high betweenness centrality nodes in networks. Stat. Mech. Appl. 2018, 497, 166–184. [Google Scholar] [CrossRef]
- Xu, D.; Zhang, J.X.; Li, C.; Xu, R.; Zhang, Y.; Liu, S.; Wang, J. MEMS-based super-resolution remote sensing system using compressive sensing. Opt. Commun. 2018, 426, 410–417. [Google Scholar]
- Petrantonakis, P.C. Grid cell firing field detection using compressed sensing. Biomed. Signal Process. Control 2018, 44, 221–228. [Google Scholar] [CrossRef]
- Chai, X.L.; Zheng, X.Y.; Gan, Z.; Han, D.; Chen, Y. An image encryption algorithm based on chaotic system and compressive sensing. Signal Process. 2018, 148, 124–144. [Google Scholar] [CrossRef]
- Takhar, D.; Laska, J.N.; Wakin, M.B.; Duarte, M.F.; Baron, D.; Sarvotham, S.; Kelly, K.F.; Baraniuk, R.G. A new compressive imaging camera architecture using optical-domain compression. Electron. Imaging Int. Soc. Opt. Photonics 2006, 6065, 43–52. [Google Scholar]
- Duarte, M.F.; Davenport, M.A.; Takhar, D.; Laska, J.N.; Sun, T.; Kelly, K.F.; Baraniuk, R.G. Single-pixel imaging via compressive sampling. IEEE Signal Process. Mag. 2008, 25, 83–91. [Google Scholar] [CrossRef] [Green Version]
- Xiang, S.; Cai, L. Transmission Control for Compressive Sensing Video over Wireless Channel. IEEE Trans. Wirel. Commun. 2013, 3, 1429–1437. [Google Scholar] [CrossRef]
- Chen, H.; Xi, N.; Song, B.; Chen, L.; Zhao, J.; Lai, K.W.C.; Yang, R. Infrared Camera Using a Single Nano-Photodetector. IEEE Sensors J. 2013, 13, 949–958. [Google Scholar] [CrossRef]
- Withayachumnankul, W.; Abbott, D. Terahertz imaging: Compressing onto a single pixel. Nat. Photon. 2014, 8, 593–594. [Google Scholar] [CrossRef]
- Candès, E.J.; Romberg, J.; Tao, T. Robust uncertainty principles: Exact signal reconstruction from highly incomplete frequency information. IEEE Trans. Inf. Theory 2006, 52, 489–509. [Google Scholar] [CrossRef]
- Kafedziski, V.; Stojanovski, T. Compressive sampling with chaotic dynamical systems. Teleconmmn. Forum 2011, 42, 495–989. [Google Scholar]
- Yu, L.; Barbot, J.P.; Zheng, G.; Sun, H. Compressive sensing with chaotic sequence. IEEE Signal Process. Lett. 2010, 17, 731–734. [Google Scholar]
- Baraniuk, R.; Davenport, M.; Devore, R.; Wakin, M. A Simple Proof of the Restricted Isometry Property for Random Matrices. Constr. Approx. 2008, 3, 253–263. [Google Scholar] [CrossRef]
- Bajwa, W.U.; Haupt, J.D.; Raz, G.M.; Wright, S.J.; Nowak, R.D. Toeplitz-structured compressed sensing matrices. In Proceedings of the 14th IEEE/SP Workshop on Statistical Signal Processing, Madison, WI, USA, 26–29 August 2007; pp. 294–298. [Google Scholar]
- Emmanuel, J.C.; Michael, B.W. An introduction to compressive sampling. IEEE Signal Process. Mag. 2008, 25, 21–30. [Google Scholar]
- Nguyen, T.L.N.; Shin, Y. Deterministic Sensing Matrices in Compressive Sensing: A Survey. Sci. World J. 2013, 2013, 192795. [Google Scholar] [CrossRef] [PubMed]
- Arjoune, Y.; Kaabouch, N.; el Ghazi, H.; Tamtaoui, A. A performance comparison of measurement matrices in compressive sensing. WILEY Int. J. Commun. Syst. 2018, 31, e3576. [Google Scholar] [CrossRef]
- Abo-Zahhad, M.M.; Hussein, A.I.; Mohamed, A.M. Compressive sensing algorithms for signal processing applications: A survey. Int. J. Commun. Netw. Syst. Sci. 2015, 8, 197–216. [Google Scholar]
- Tong, Y.B.; Zhang, Q.S.; Qi, Y.P. Image Quality Assessing by Combing PSNR with SSIM. J. Image Gr. 2006, 12, 1758–1763. [Google Scholar]
- Ji, S.; Xue, Y.; Carin, L. Bayesian compressive sensing. IEEE Trans. Signal Process. 2008, 56, 2346–2356. [Google Scholar] [CrossRef]
- Ajoune, Y.; Kaabouch, N.; el Ghazi, H.; Tamtaoui, A. Compressive sensing: A performance comparison of recovery algorithm. In Proceedings of the Computing and Communication Workshop and Conference, Las Vegas, NV, USA, 9–11 January 2017; pp. 1–7. [Google Scholar]
- Babaan, S.D.; Molina, R.; Katsaggelos, A.K. Bayesian compressive sensing using Laplace priors. IEEE Trans. Image Process. 2010, 19, 53–63. [Google Scholar] [CrossRef] [PubMed]
- Baro, D.; Sarvotham, S.; Baraniuk, R.G. Bayesian compressive sensing via belief propagation. IEEE Trans. Signal Process. 2010, 58, 269–280. [Google Scholar] [CrossRef]
- Trop, J.A.; Gilbert, A.C. Signal recovery from random measurements via orthogonal matching pursuit. IEEE Trans. Inf. Theory 2007, 53, 4655–4666. [Google Scholar] [CrossRef]
- Neeell, D.; Tropp, J.A. CoSaMP: Iterative signal recovery from incomplete and inaccurate samples. Appl. Comput. Harmon. Anal. 2009, 26, 301–321. [Google Scholar] [CrossRef]
- Li, C. An Efficient Algorithm for Total Variation Regularization with Applications to the Single Pixel Camera and Compressive Sensing. Ph.D. Thesis, Rice University, Houston, TX, USA, 2009. [Google Scholar]
Figure 1.
Single-pixel color imaging system with color wheel.

Figure 2.
Single-pixel color imaging system with chromatic dispersion theory.
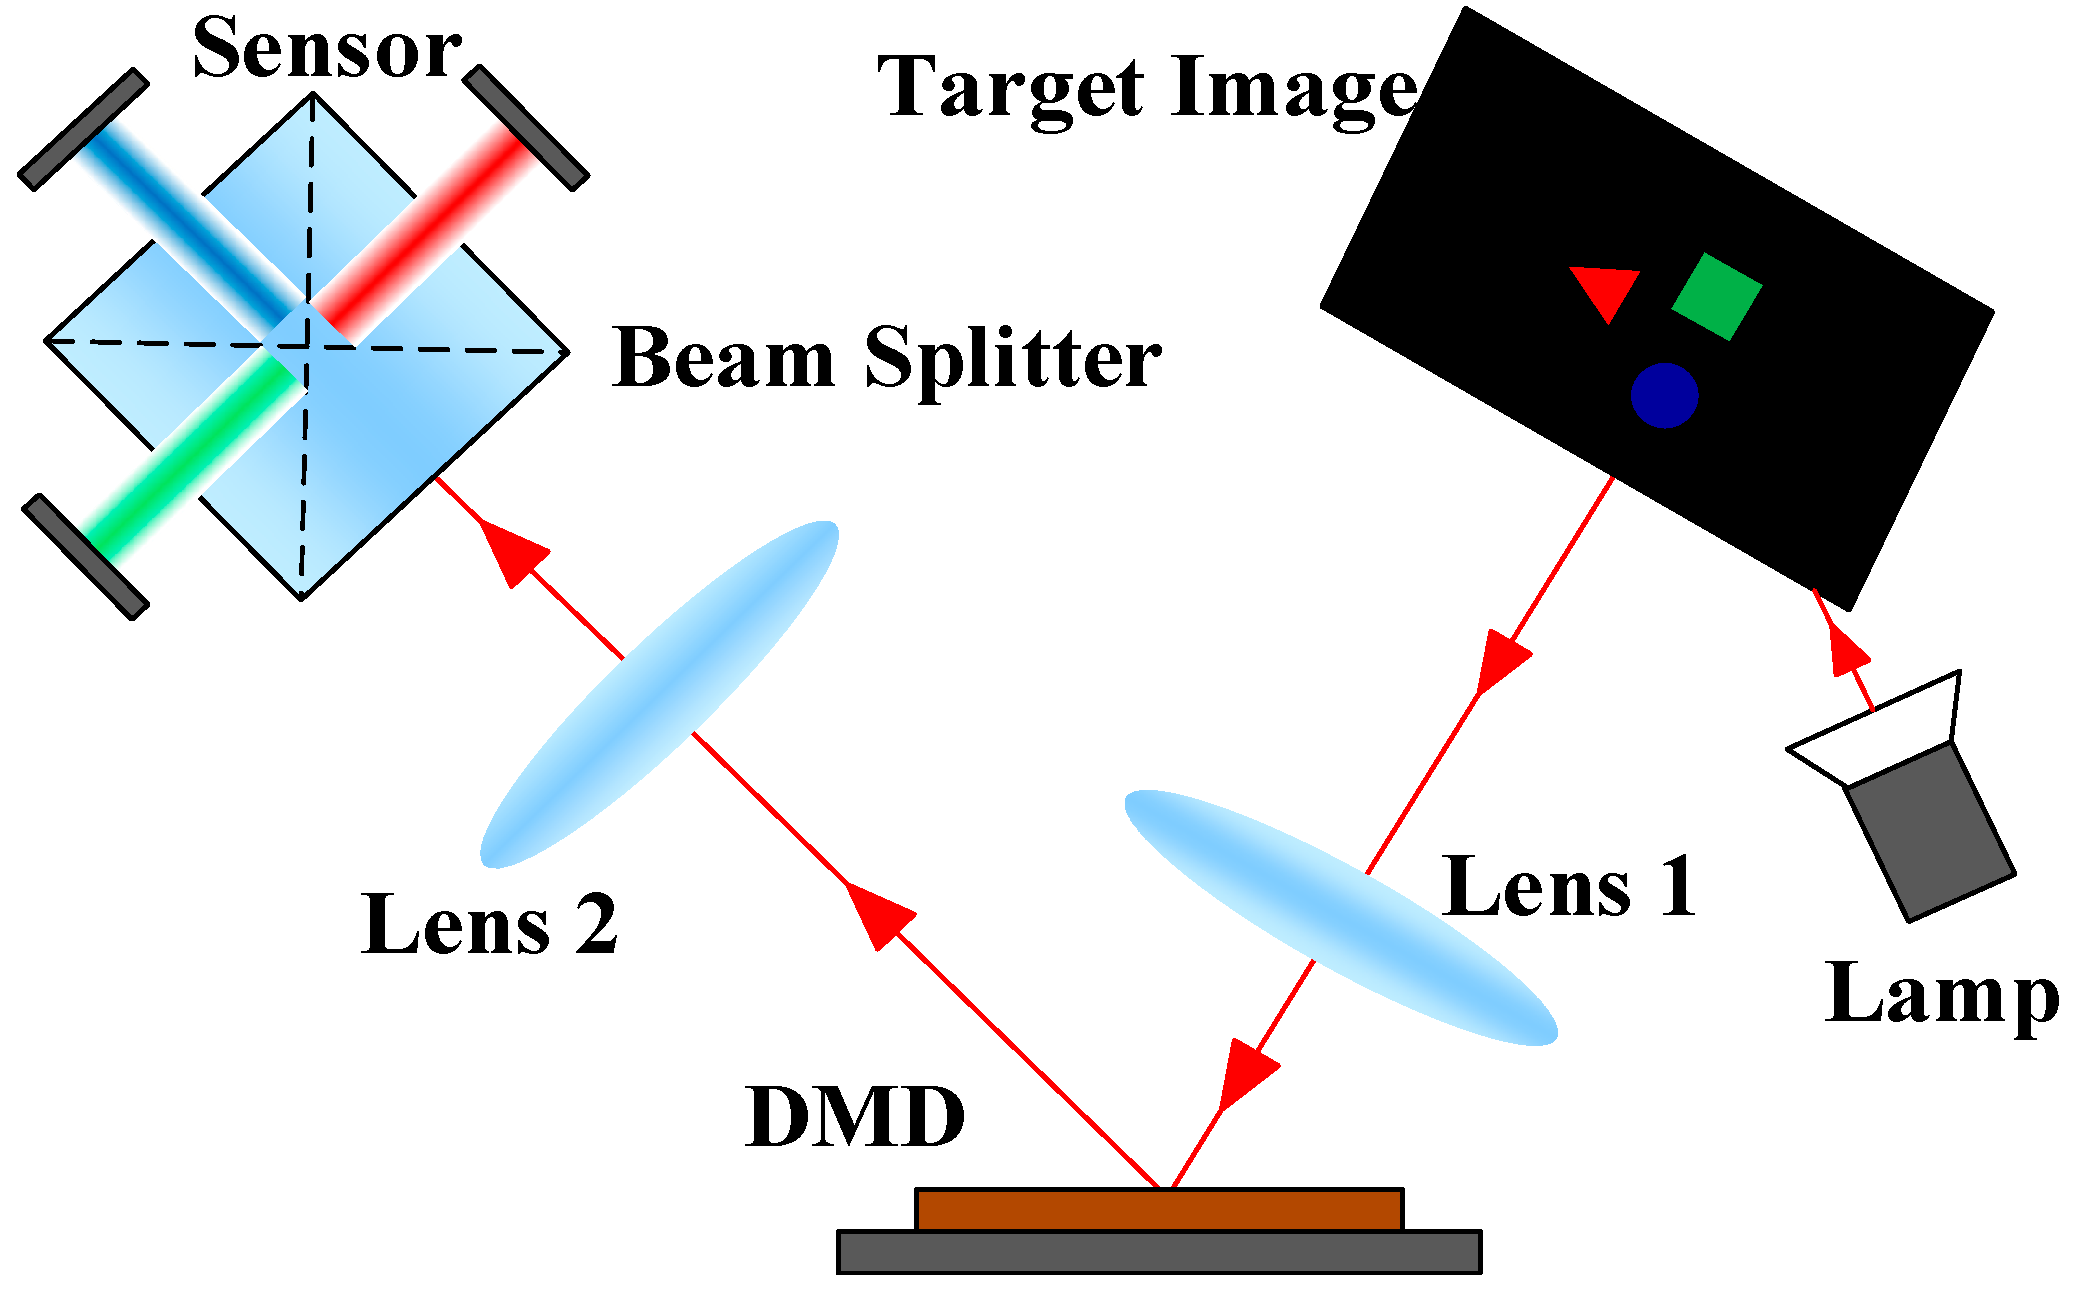
Figure 3.
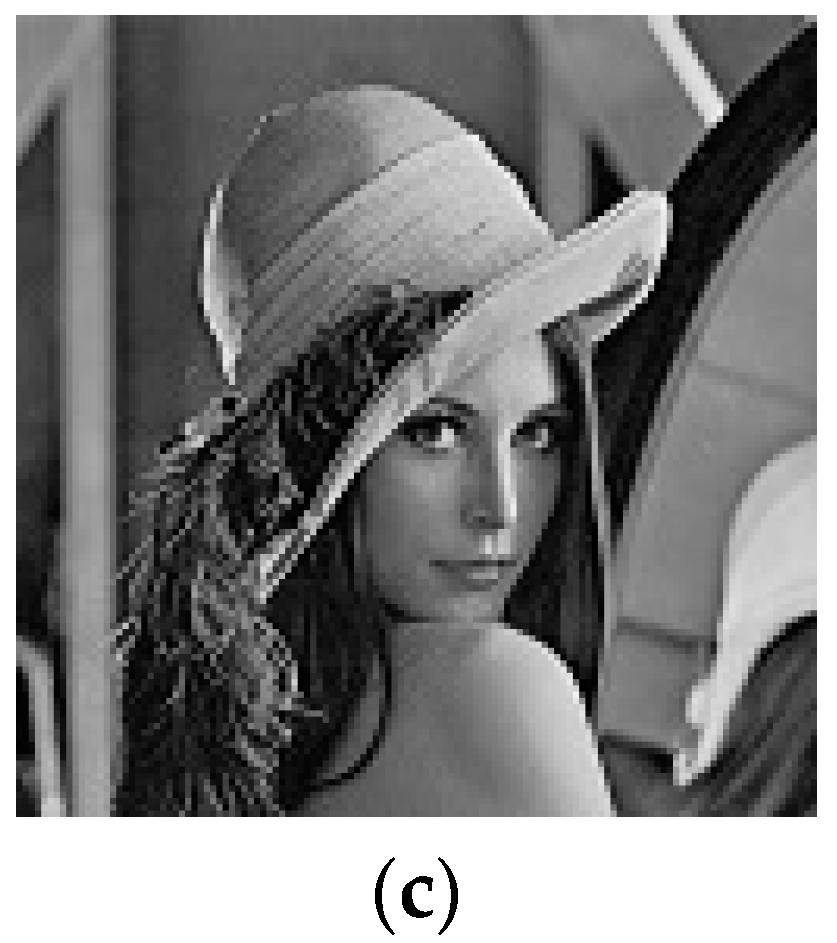
Comparison of reconstruction of the target image with the TVAL3 recovery algorithm under different measurement matrices: (a) analysis of reconstruction results by using peak signal-to-noise ratio (PSNR), (b) analysis on reconstruction results by using structural similarity (SSIM), and (c) target image.
Figure 3.
Comparison of reconstruction of the target image with the TVAL3 recovery algorithm under different measurement matrices: (a) analysis of reconstruction results by using peak signal-to-noise ratio (PSNR), (b) analysis on reconstruction results by using structural similarity (SSIM), and (c) target image.

Figure 4.
Comparison of the reconstruction of the target image with the TVAL3 recovery algorithm under different measurement matrices: (a) analysis of reconstruction results by using PSNR, (b) analysis of reconstruction results by using SSIM, and (c) target image.
Figure 4.
Comparison of the reconstruction of the target image with the TVAL3 recovery algorithm under different measurement matrices: (a) analysis of reconstruction results by using PSNR, (b) analysis of reconstruction results by using SSIM, and (c) target image.
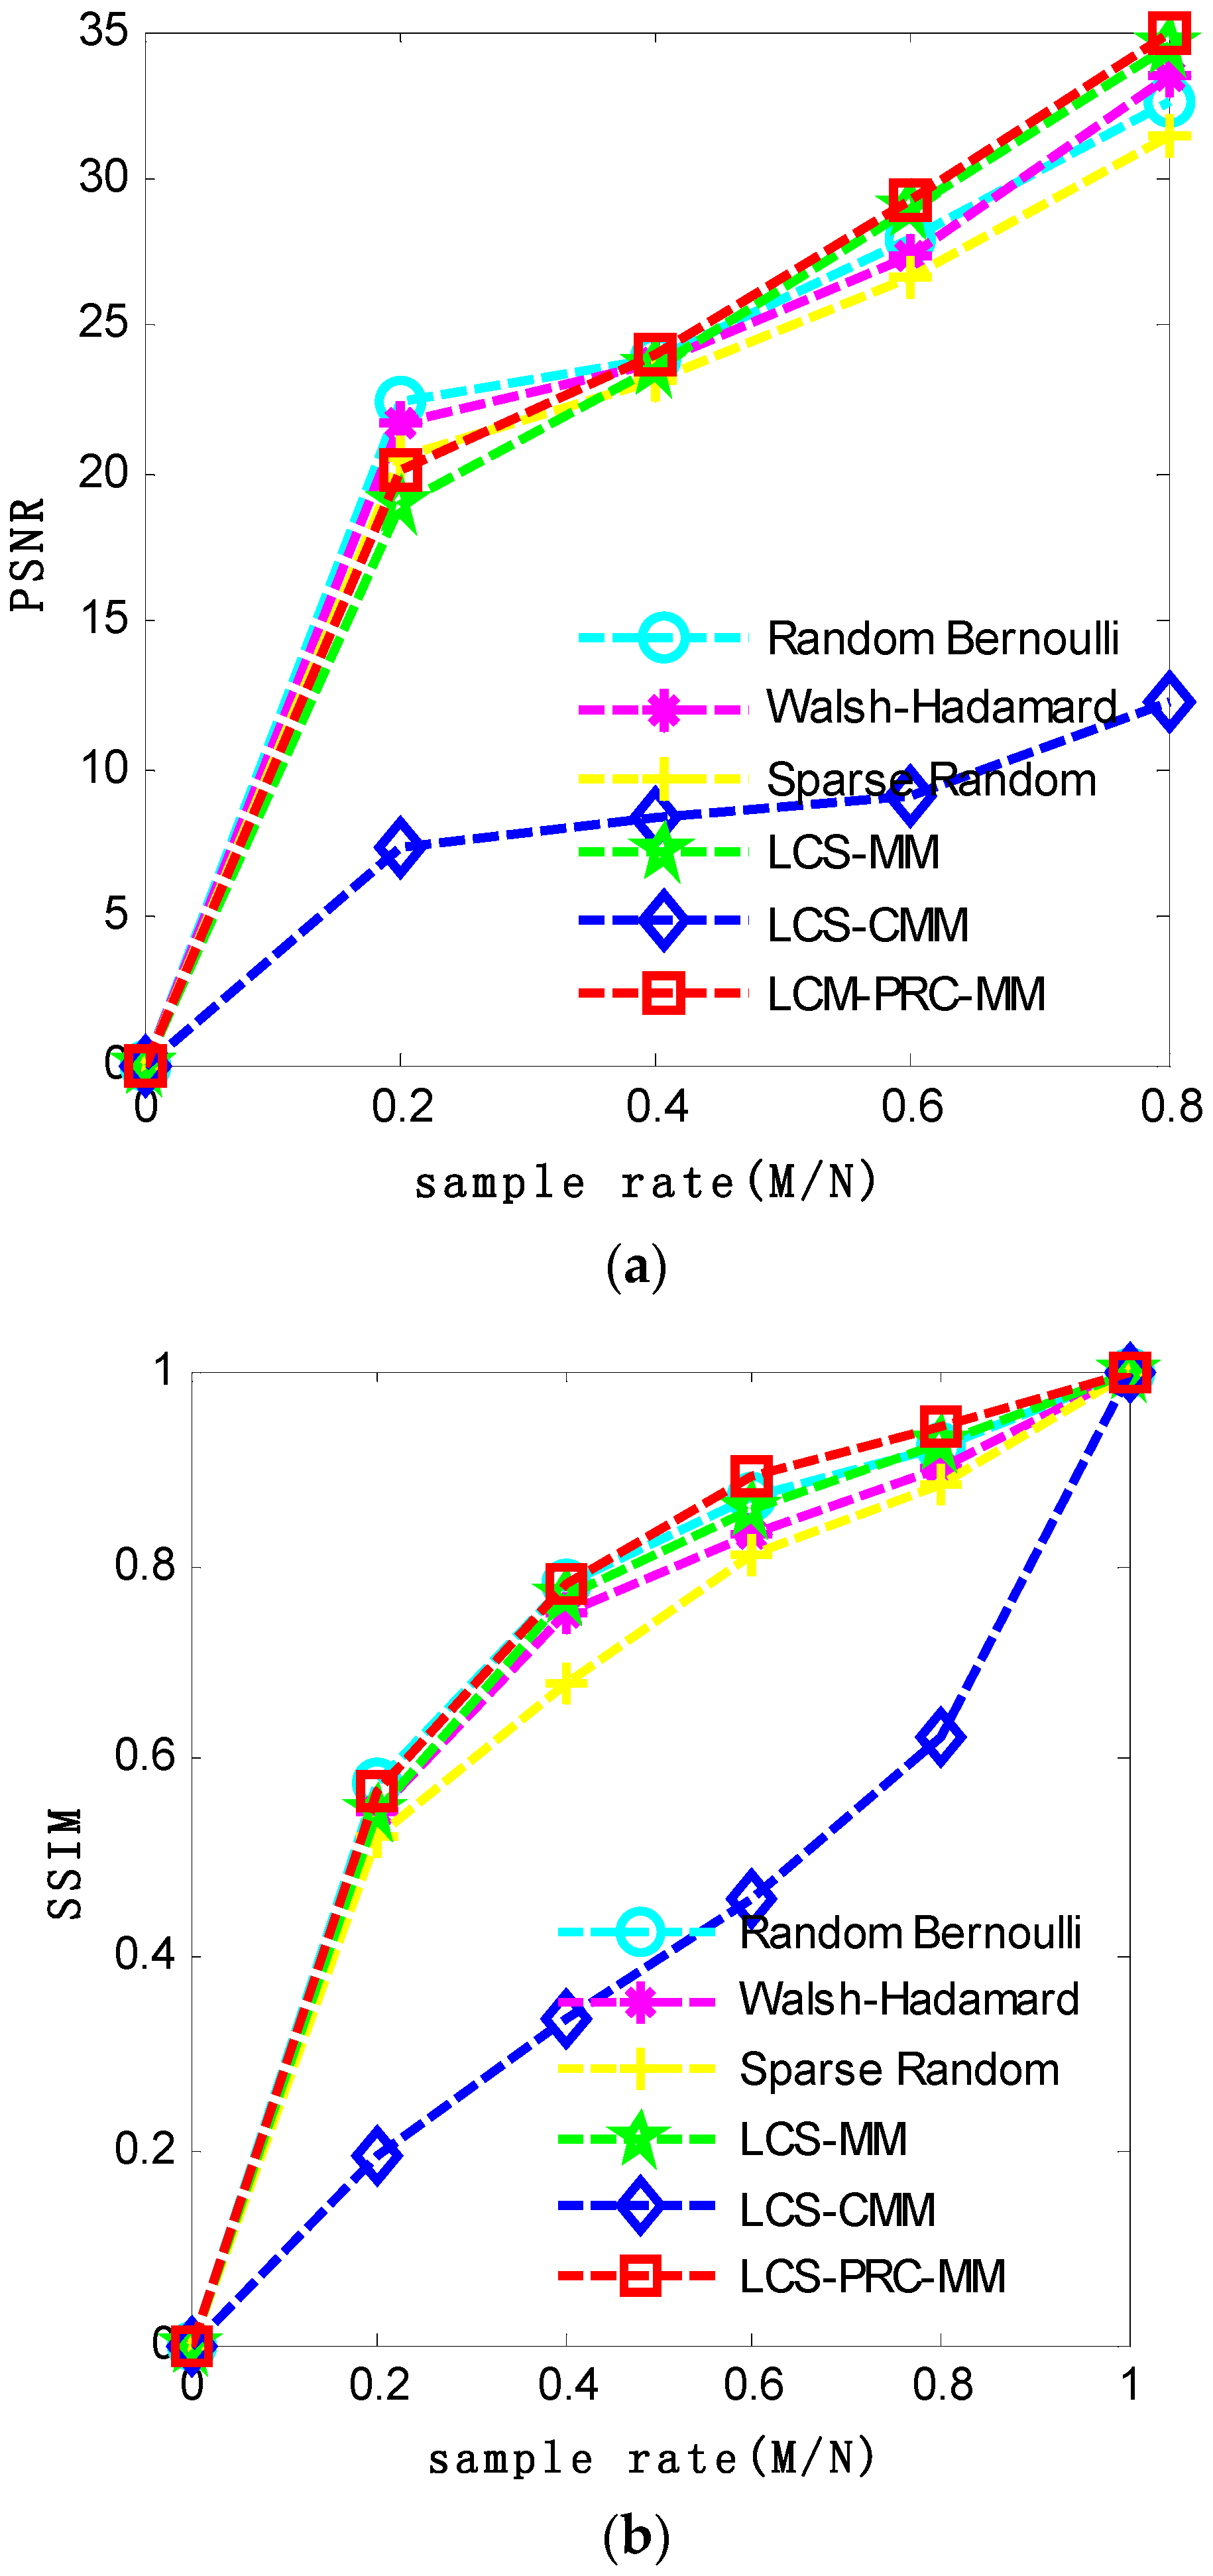
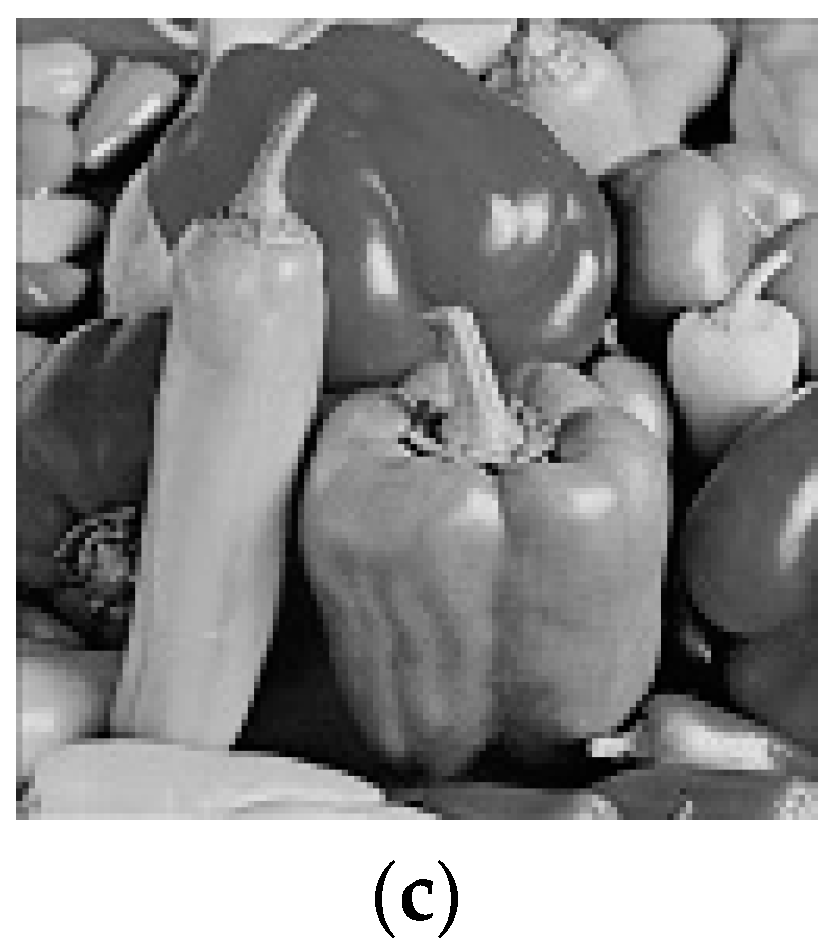
Figure 5.
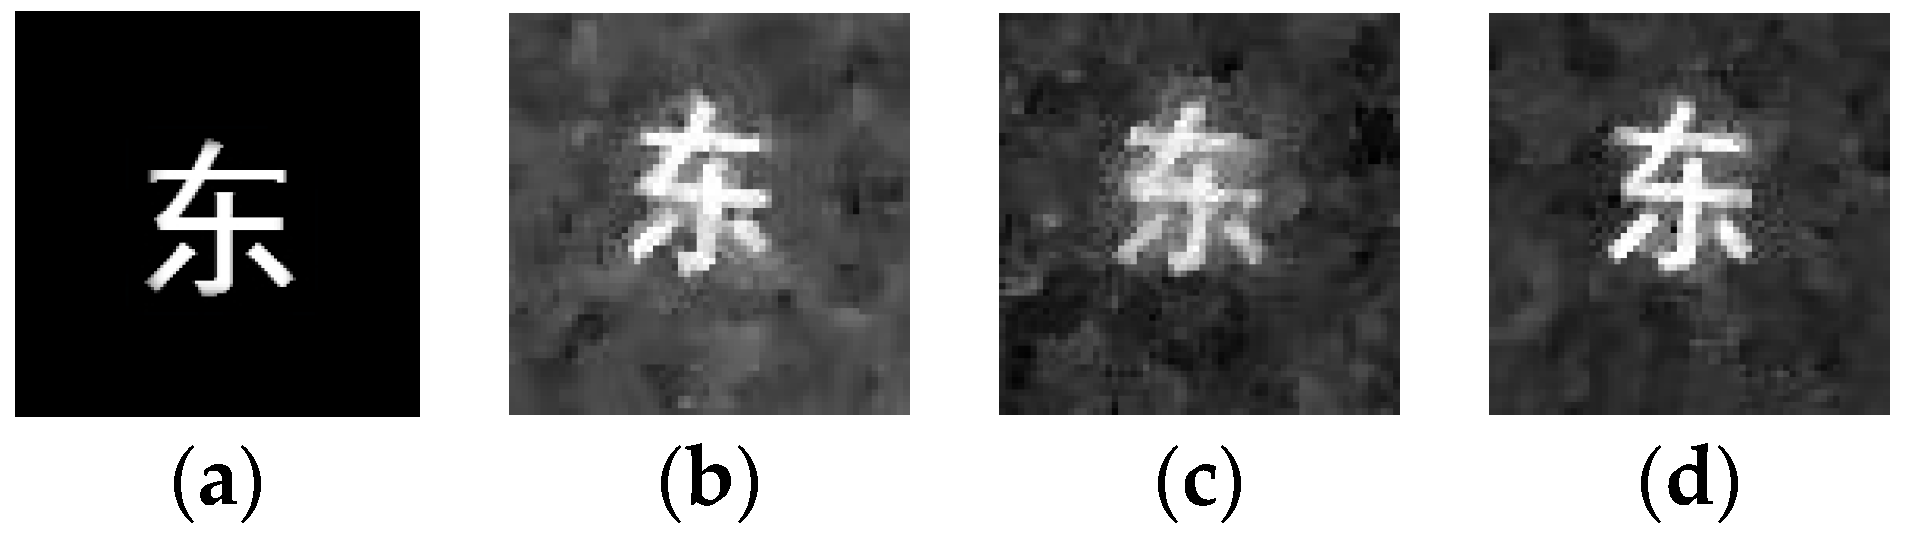
Results obtained by the single-pixel camera: (a) target image; (b) recovered images using logistic chaotic sequence (LCS-MM), PSNR = 10.60 dB, SSIM = 0.10; (c) recovered images using LCS-CMM, PSNR = 9.07 dB, SSIM = 0.06; (d) recovered images using LCS-PRC-MM, PSNR = 12.98 dB, SSIM = 0.11.
Figure 5.
Results obtained by the single-pixel camera: (a) target image; (b) recovered images using logistic chaotic sequence (LCS-MM), PSNR = 10.60 dB, SSIM = 0.10; (c) recovered images using LCS-CMM, PSNR = 9.07 dB, SSIM = 0.06; (d) recovered images using LCS-PRC-MM, PSNR = 12.98 dB, SSIM = 0.11.

Figure 6.
Results obtained by the single-pixel camera: (a) target image; (b) recovered images using LCS-MM, PSNR = 13.13 dB, SSIM = 0.11; (c) recovered images using LCS-CMM, PSNR = 11.59 dB, SSIM = 0.08; (d) recovered images using LCS-PRC-MM, PSNR = 14.72 dB, SSIM = 0.13.
Figure 6.
Results obtained by the single-pixel camera: (a) target image; (b) recovered images using LCS-MM, PSNR = 13.13 dB, SSIM = 0.11; (c) recovered images using LCS-CMM, PSNR = 11.59 dB, SSIM = 0.08; (d) recovered images using LCS-PRC-MM, PSNR = 14.72 dB, SSIM = 0.13.
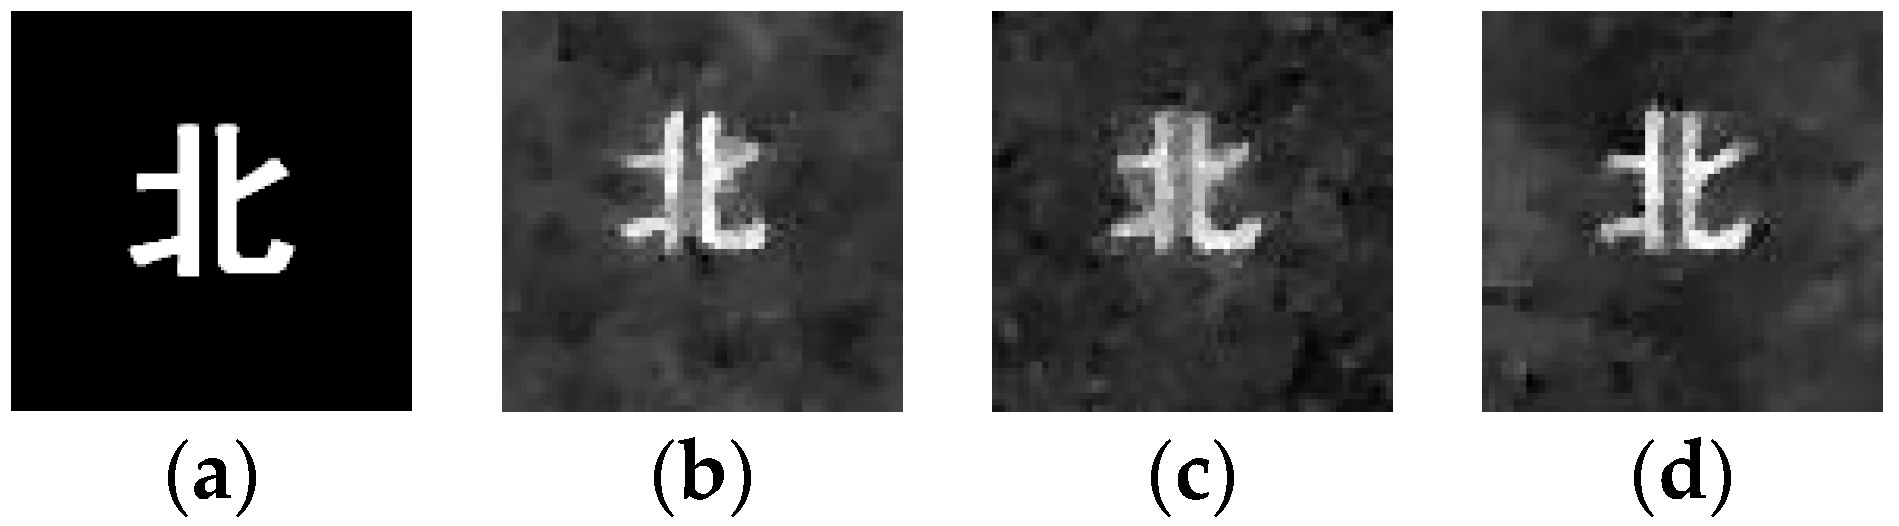
Figure 7.
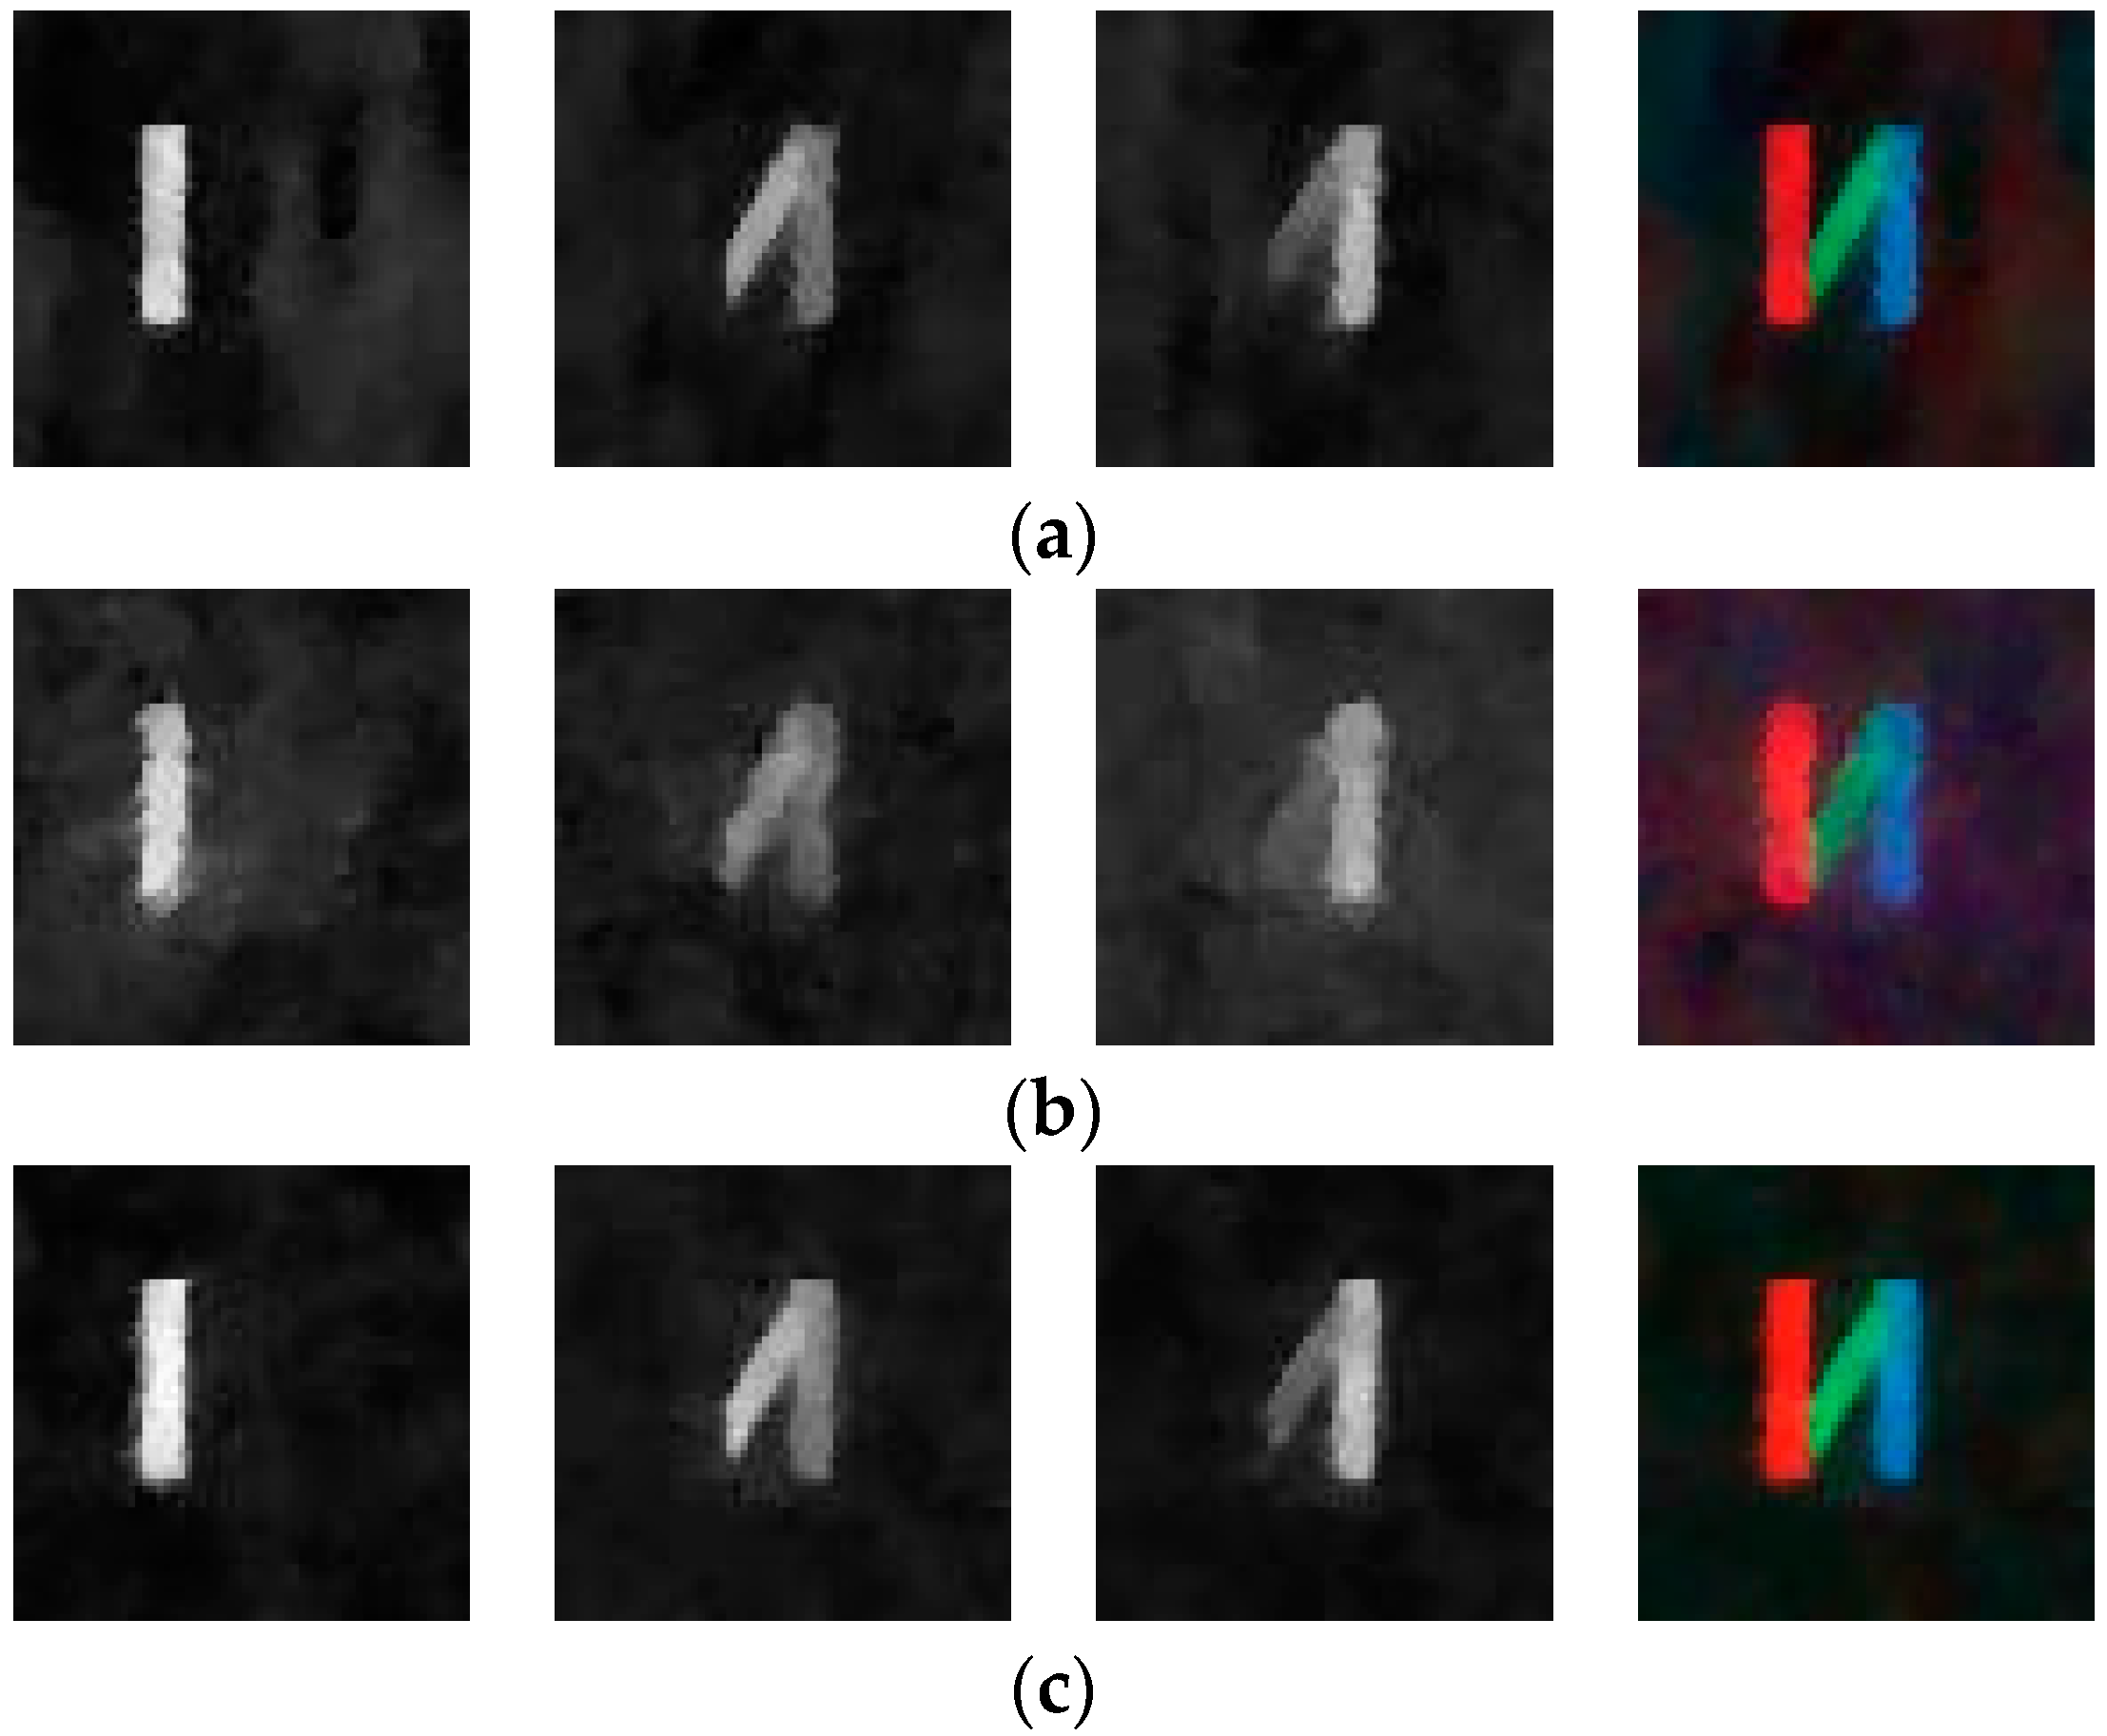
Results obtained by the single-pixel color camera, and the target image is color letter N: (a) recovered images using LCS-MM, PSNR = 19.80 dB, SSIM = 0.19; (b) recovered images using LCS-CMM, PSNR = 18.18 dB, SSIM = 0.08; (c) recovered images using LCS-PRC-MM, PSNR = 20.17 dB, SSIM = 0.20.
Figure 7.
Results obtained by the single-pixel color camera, and the target image is color letter N: (a) recovered images using LCS-MM, PSNR = 19.80 dB, SSIM = 0.19; (b) recovered images using LCS-CMM, PSNR = 18.18 dB, SSIM = 0.08; (c) recovered images using LCS-PRC-MM, PSNR = 20.17 dB, SSIM = 0.20.

Figure 8.
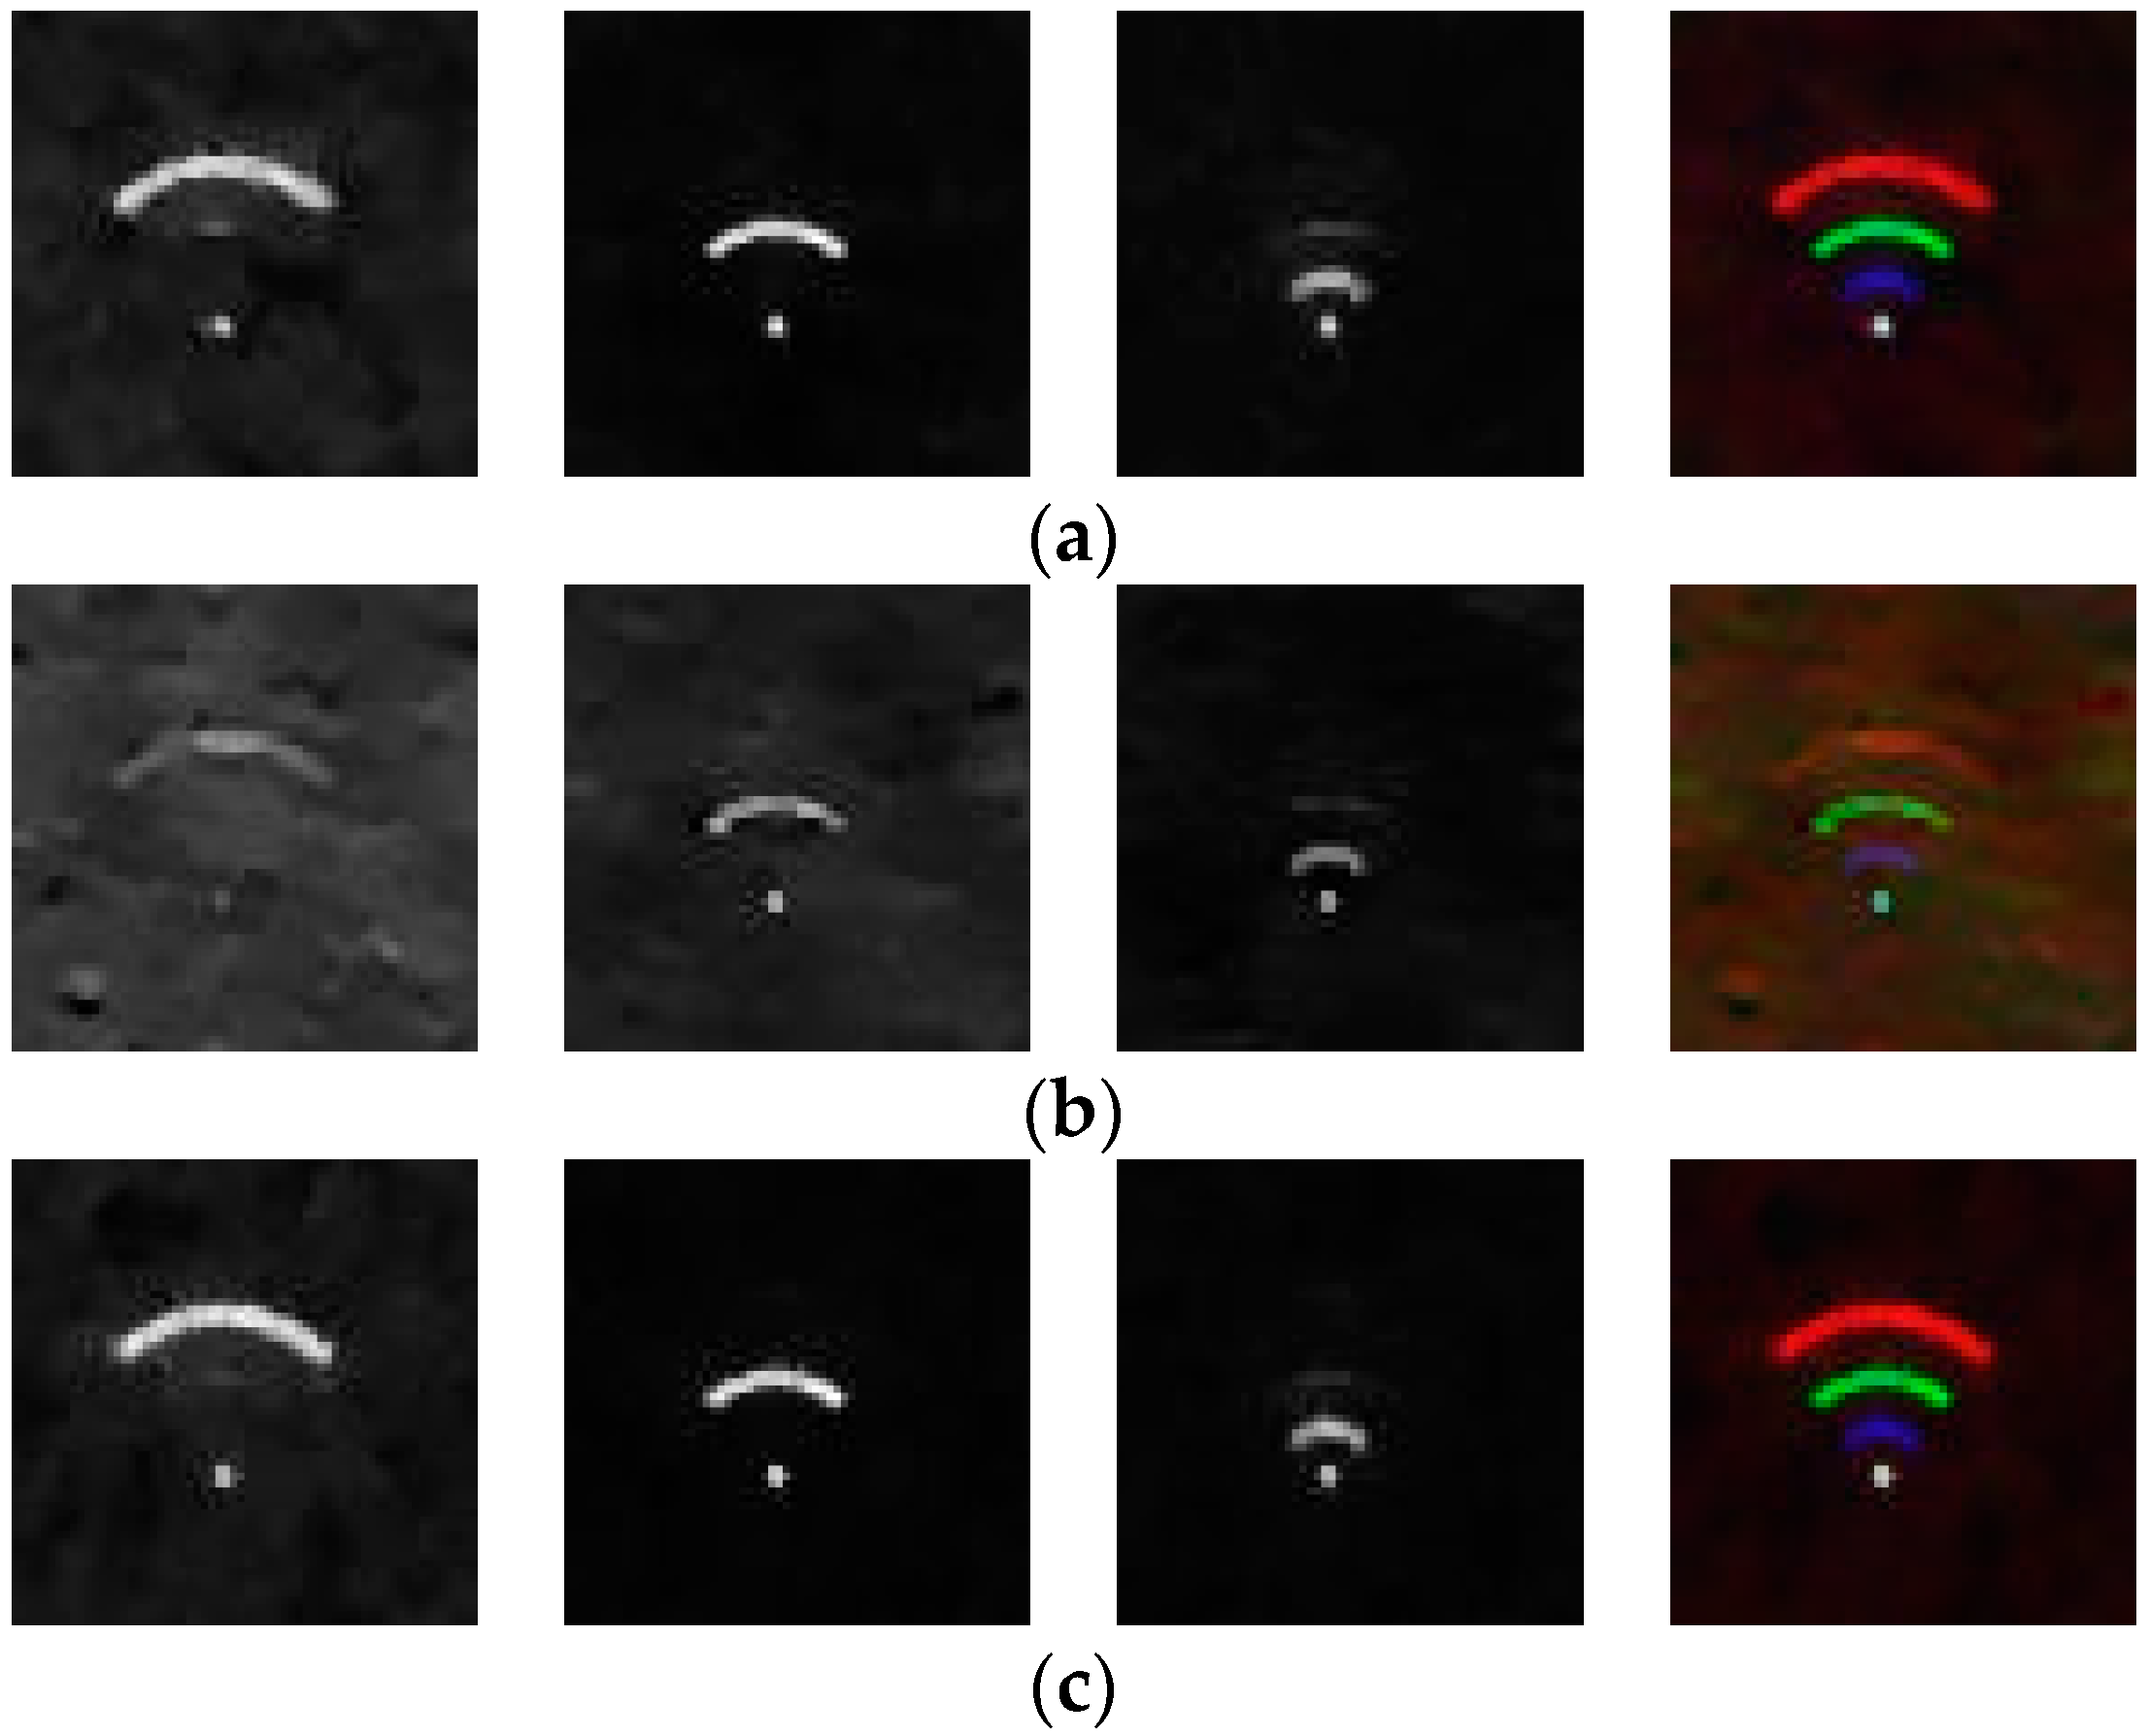
Results obtained by single-pixel color camera, and the target image is colored Wi-Fi logo: (a) recovered images using LCS-MM, PSNR = 23.40 dB, SSIM = 0.13; (b) recovered images using LCS-CMM, PSNR = 20.52 dB, SSIM = 0.07; (c) recovered images using LCS-PRC-MM, PSNR = 23.81 dB, SSIM = 0.14.
Figure 8.
Results obtained by single-pixel color camera, and the target image is colored Wi-Fi logo: (a) recovered images using LCS-MM, PSNR = 23.40 dB, SSIM = 0.13; (b) recovered images using LCS-CMM, PSNR = 20.52 dB, SSIM = 0.07; (c) recovered images using LCS-PRC-MM, PSNR = 23.81 dB, SSIM = 0.14.
© 2018 by the authors. Licensee MDPI, Basel, Switzerland. This article is an open access article distributed under the terms and conditions of the Creative Commons Attribution (CC BY) license (http://creativecommons.org/licenses/by/4.0/).
Share and Cite
MDPI and ACS Style
Jia, T.; Chen, D.; Wang, J.; Xu, D. Single-Pixel Color Imaging Method with a Compressive Sensing Measurement Matrix. Appl. Sci. 2018, 8, 1293. https://doi.org/10.3390/app8081293
AMA Style
Jia T, Chen D, Wang J, Xu D. Single-Pixel Color Imaging Method with a Compressive Sensing Measurement Matrix. Applied Sciences. 2018; 8(8):1293. https://doi.org/10.3390/app8081293
Chicago/Turabian StyleJia, Tong, Dongyue Chen, Ji Wang, and Dong Xu. 2018. "Single-Pixel Color Imaging Method with a Compressive Sensing Measurement Matrix" Applied Sciences 8, no. 8: 1293. https://doi.org/10.3390/app8081293
Note that from the first issue of 2016, this journal uses article numbers instead of page numbers. See further details here.