Demonstration of Subretinal Injection Using Common-Path Swept Source OCT Guided Microinjector

Department of Electrical and Computer Engineering, Johns Hopkins University, Baltimore, MD 21218, USA
*
Author to whom correspondence should be addressed.
Appl. Sci. 2018, 8(8), 1287; https://doi.org/10.3390/app8081287
Submission received: 28 June 2018
/
Revised: 31 July 2018
/
Accepted: 1 August 2018
/
Published: 2 August 2018
(This article belongs to the Special Issue Advanced Biophotonics Technology for Therapeutic and Surgical Applications)
Abstract
:In this paper, we present the development of a handheld common-path swept source optical coherence tomography (CP-SSOCT) guided microinjector system and demonstrated its utility by precisely injecting fluorescein dye in the subretinal layer of ex vivo bovine eyes. The system enables precise subretinal injection with micron-level injection depth control. This was achieved by using a high-resolution CP-SSOCT distal sensor and signal processing using a graphics-processing unit (GPU), which made a real-time smart motion control algorithm possible. The microinjector performance was first evaluated using a gelatin phantom in terms of its ability for dynamic depth targeting and injection depth. This is followed by using an ex vivo bovine eye model to perform multiple consecutive subretinal injections of fluorescein dye. The results validated the OCT guided injector’s ability to precisely guide and lock in the needle tip to the target depth during injection. The ex vivo evaluation tests demonstrate that an OCT-guided injector can consistently guide the injecting needle to the desired depth and is able to maintain the position with 9.38 μm average root mean square error during the injections.
1. Introduction
Needle-based devices to inject therapeutic and diagnostic agents to patients are among the most commonly used medical devices. By delivering therapeutic materials directly to target areas, it is expected that maximal efficacy, while minimizing drug dose and side effects, will be achieved. In ocular surgery, the ability to consistently perform intraretinal microinjection with precision is not yet established, although the capability could revolutionize the treatment of degenerative retinal diseases that cause blindness. At present, there are many degenerative retinal diseases that cannot be treated completely and ocular gene therapy has emerged as a promising method to manage such untreatable inherited retinal diseases [1,2]. Various gene vectors have been developed that are delivered to target areas by microinjection [3]. At present, subretinal injection is commonly performed to achieve gene therapy. During subretinal injection, the surgeon is totally dependent on manual manipulation of the tools and visual feedback through a stereomicroscope. However, these two requirements for success are limited by physiological hand tremor and the limited human ability to visually resolve on the micron scale in the axial axis. Moreover, there is potential obscuration of the injecting site by the tool shaft and needle tip [4].
A variety of microinjection systems have been proposed. In bench cell biology, accurate injection of foreign materials such as DNA, RNAi, protein, and drug compounds is fundamental to achieve successful expression of desired properties [5,6,7,8,9]. Wang et al. developed a computer vision-based microinjection system and successfully performed zebrafish embryo injection with a 99% success rate [5]. However, this type of application was in a stable and predictable environment; a surgical environment requires a more dynamic system. The “Steady-Hand Eye-Robot” system has demonstrated its potential to remove physiological inaccuracy and guide a microneedle to small veins in the chorioallantoic membranes of chicken embryos [6]. In particular, Riviere et al. have developed a fully handheld micromanipulator, “Micron”, and have demonstrated various handheld applications including retinal cannulation [8]. However, the solution does not address the limited visualization of the target through the microscope and additional supportive information is required. An example of relevant additional information may be provided by a force-sensing method [9] to assist retinal microinjection, but it is still not sufficient for precise depth control.
Optical coherence tomography (OCT) has micron-levels of precision, subsurface imaging capability, as well as fast imaging speeds that can provide solutions to overcome existing limitations [10,11,12,13,14]. In particular, we have been developing an array of Sensorized Micromanipulation Aided Robotic-surgery Tool (SMART) that uses a common-path OCT (CP-OCT) distal sensor for axial motion sensing and guidance [15,16]. We have also adopted a parallel programming technique using a graphics-processing unit (GPU) to reduce the processing time for real-time guidance [17]. This distal sensing approach is distinguished from typical OCT “B-scan” imaging in that the distal sensing system measures a distance value from the acquired A-scan data [18,19,20,21,22,23,24]. Motion sensitive interference patterns are sequentially measured at consistent time intervals and continuously converted to series of A-scans. The system counts the pixel distance in the image domain and then converts the number to a physical distance. Then, the measured distance is utilized for intraoperative motion guidance. Integrating CP-SSOCT feedback with a SMART injector via an intuitive control system that allows the tip of the injector to lock onto the desired depth, regardless of involuntary user and target motion, has been the goal of this development process. A SMART injector approach is therefore a logical extension for future development of handheld instruments.
2. Materials and Methods
2.1. Limitation of Freehand Manipulation
Figure 1 shows the position-tracking data of a retinal surgeon manipulating the SMART injector under the microscope view. The aim of the study is to insert the SMART injector needle into a gelatin phantom for the comparison of precise depth targeting between human control vs. human control assisted by SMART system to target designated depth and to maintain its position during the injection. Considering that the average thickness of human retina is about 250 µm, the manual results shown in Figure 1 are unsatisfactory and demonstrate the difficulty of freehand microinjection manipulation in the absence of normal visual cues that are used effectively by surgeons on patients with a high level of success. As Figure 1b shows, a surgeon cannot maintain the target position during the injection due to physiological hand tremor and motion in the absence of orienting visual cues. Hand tremor translates into vibrational motion (5–15 Hz) of the needle tip that prevents the surgeon from maintaining a needle stably in a fixed position. Absence of unawareness of the absolute position of the needle tip in this model induces gradual drift of the position as shown in Figure 1a. Thus, accurate depth targeting and robust depth locking are technical objectives required to be achieved for a successful microinjection.
2.2. Microinjector System Configuration
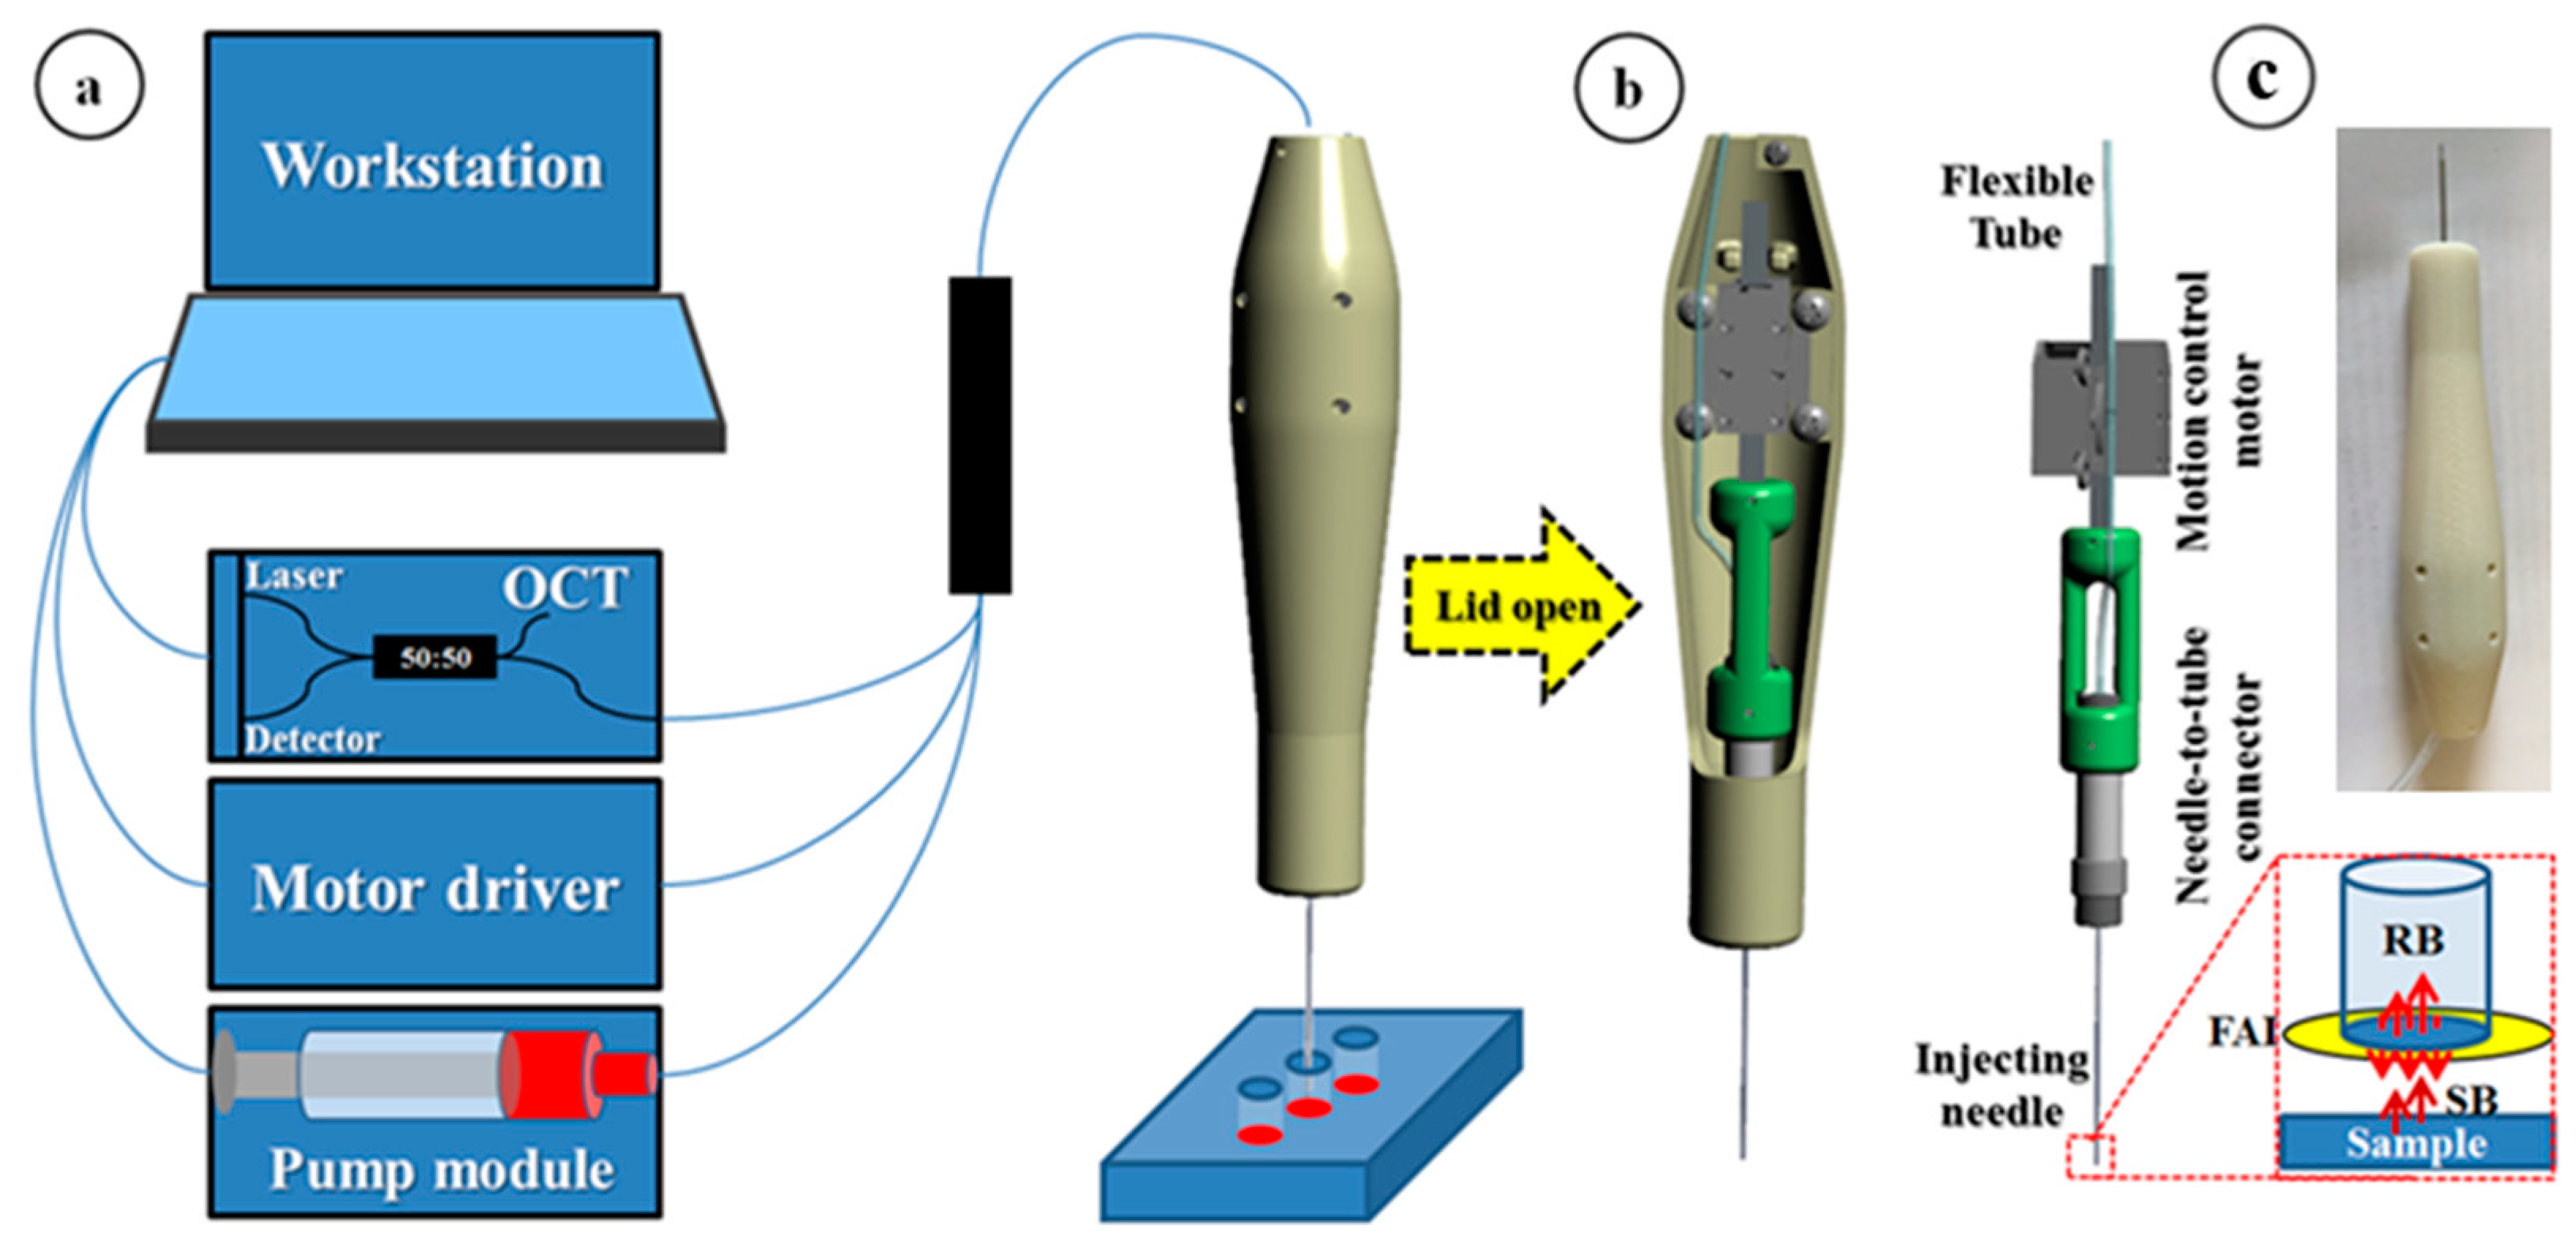
The SMART injection system consists of three main modules: (1) fiberoptic OCT probe for distal sensing, (2) microinjector and pump for fluid delivery, and (3) workstation for computing and control. The OCT probe consists of a swept source OEM engine (AXSUN, Billerica MA USA, central wavelength λ0: 1060 nm, sweeping rate: 100 kHz, 3 dB axial resolution: 8 µm, scan range: 3.7 mm in air), a balanced photodetector and a digitizer with a sampling rate of up to 500 MSPS with 12-bit resolution, a Camera Link DAQ Board, and a Camera Link frame grabber (PCIe-1433, National Instruments, Austin, TX USA). In contrast to typical 2D imaging OCT setup, the OCT setup for distal sensing does not require the scanning module, which has to be synchronized with OCT module including swept source engine and digitizer. Thus, the distal-sensing setup is simpler than the imaging setup. Additionally, the common-path fiberoptic OCT probe is advantageous for the system to be compact in that the system does not require a reference arm since it uses the reflection beam from the interface between fiber and outside medium as a reference beam. Additionally, both reference and sample reflected light share the same beam path; as a result, CP-OCT is naturally immune to dispersion and polarization noises [15,16].
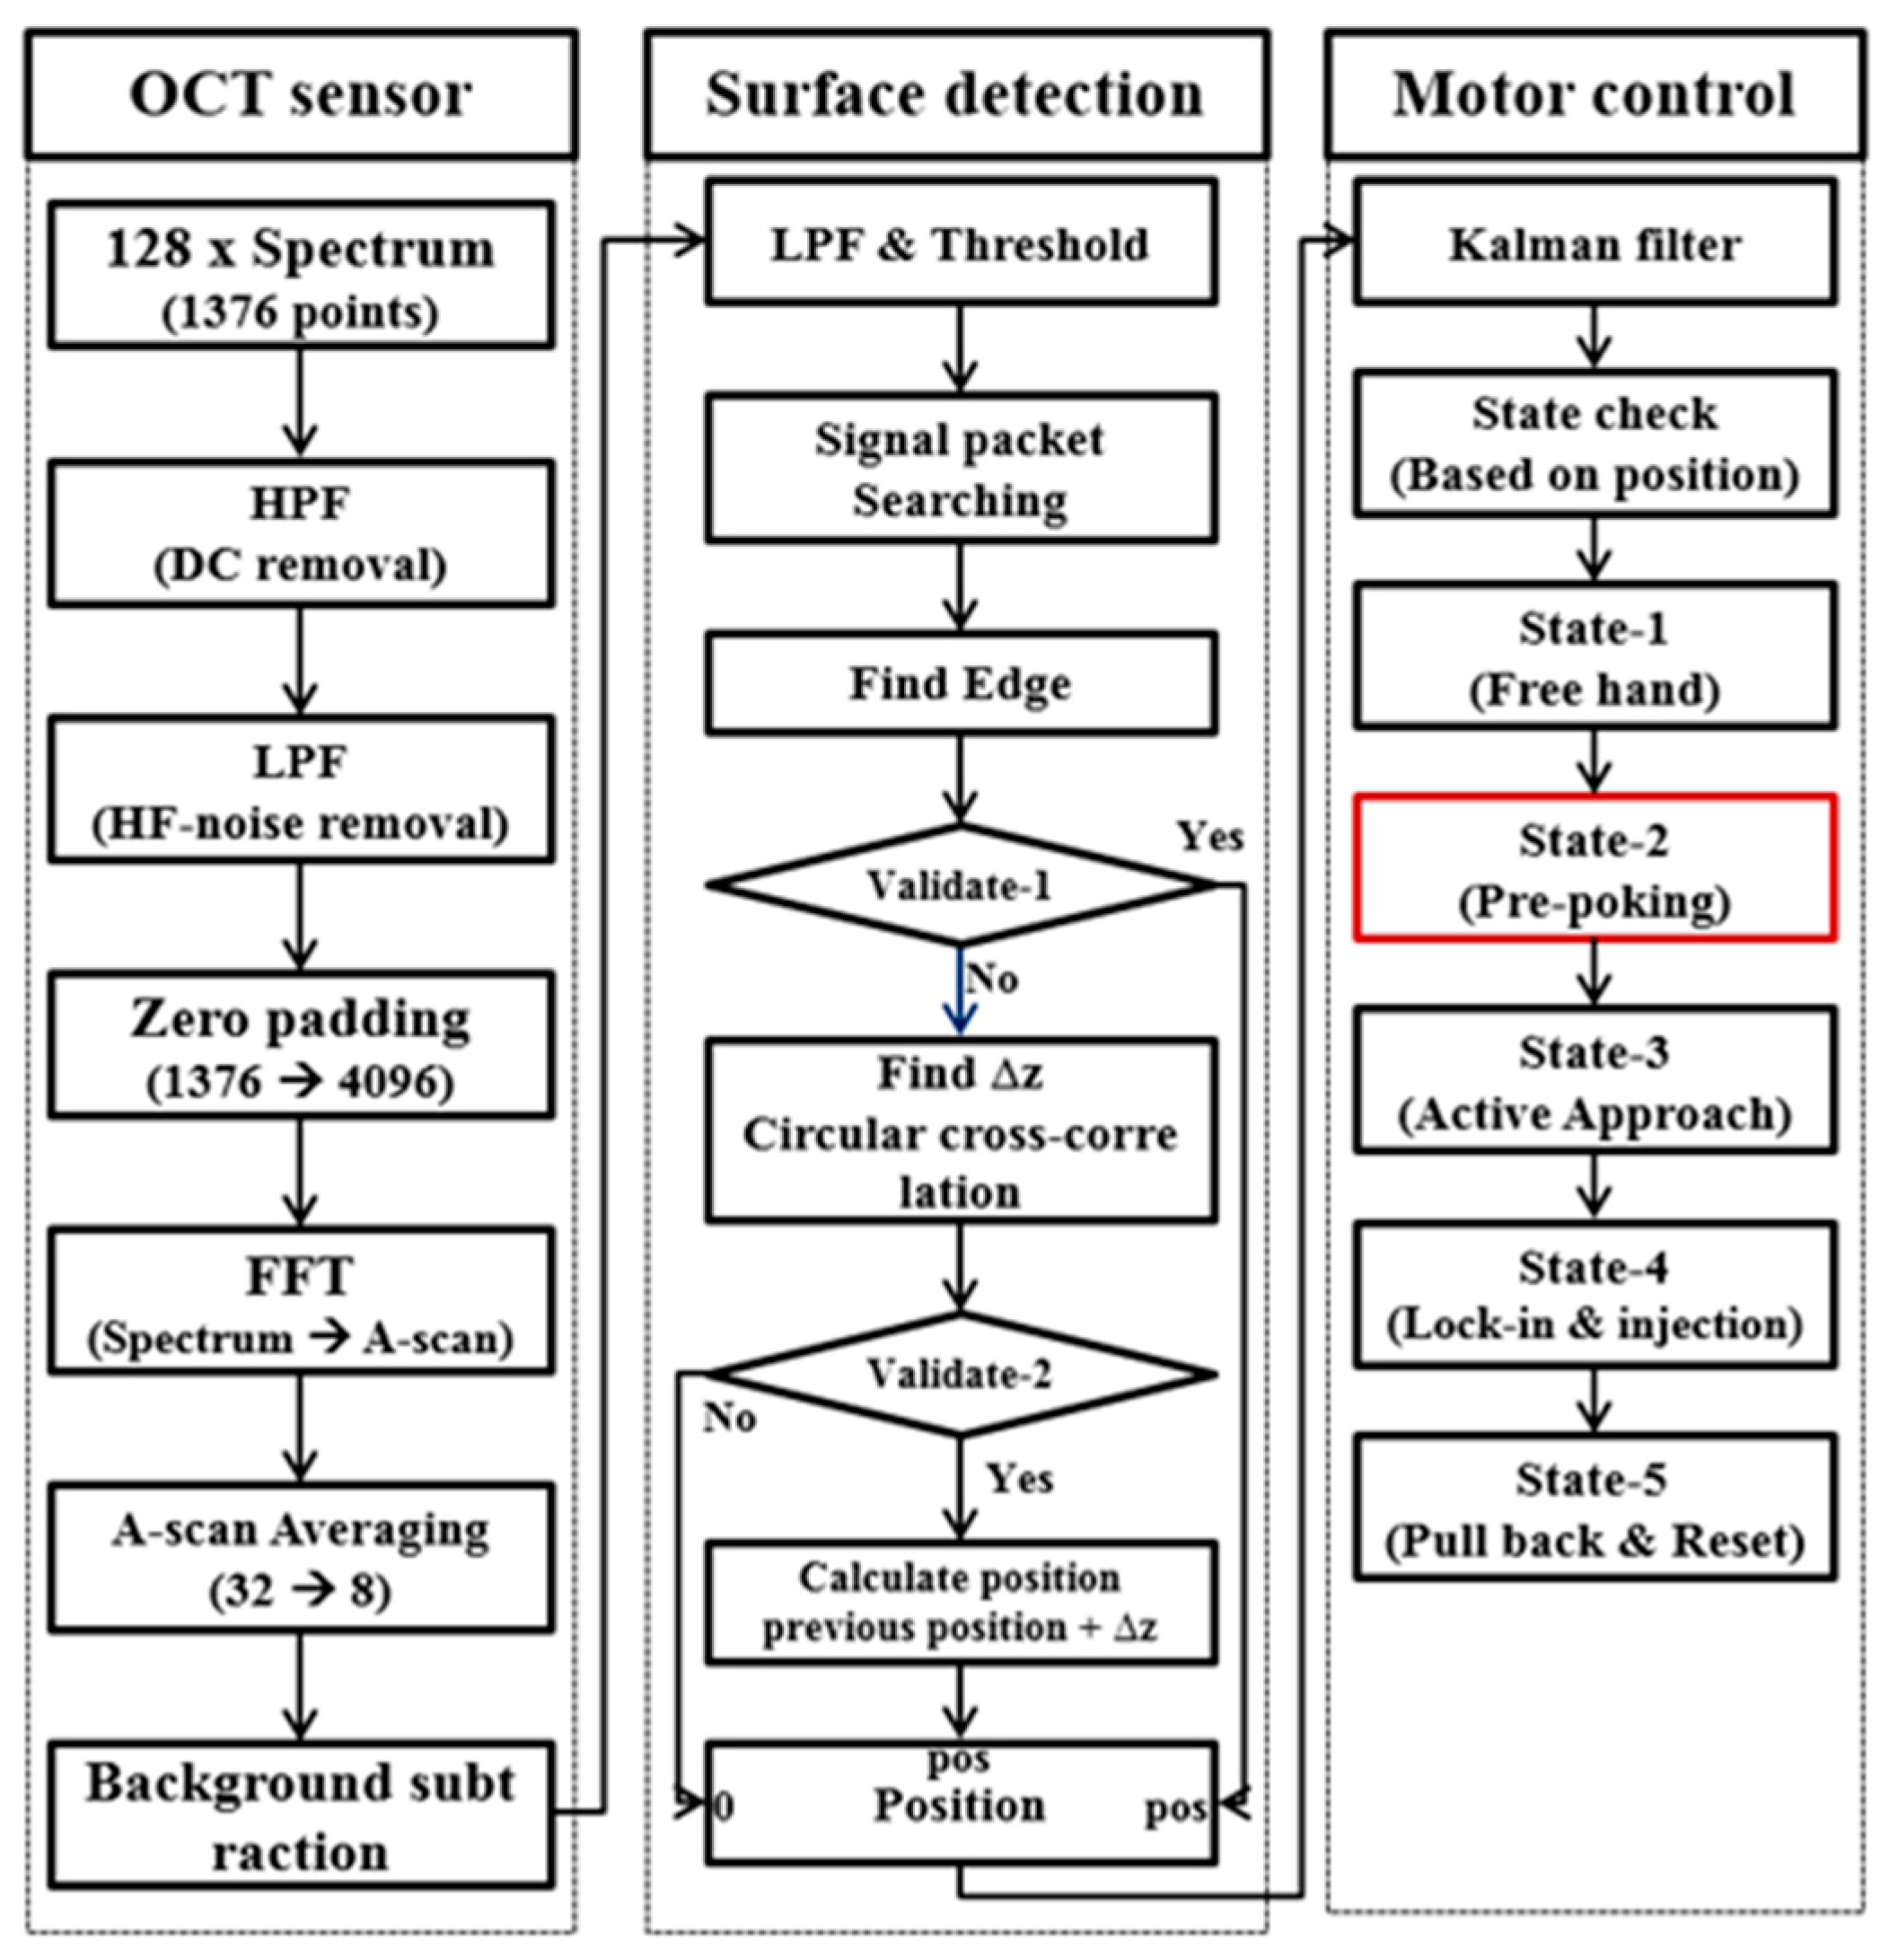
The design of the microinjector, as shown in Figure 2b, involves a 34 G needle (Hamilton, Reno NV USA, OD: 0.1842 mm, ID: 0.0826 mm) inside a 26 G guide needle (Hamilton, OD: 0.4636 mm, ID: 0.260 mm), a needle-to-tube connector (RN Coupler-p/n 55752-01, Hamilton), linear piezoelectric motors (LEGS-LL1011A, PiezoMotor, Uppsala Sweden), a fiberoptic probe, and a handpiece of the injector. A prototype was 3D printed using acrylonitrile butadiene styrene (ABS) thermoplastic. The pump module is composed of a 100 μL capacity syringe (Hamilton) with a 1.46 mm inner barrel diameter and 0.60 mm forward push, which corresponds to 1 μL volume injection. A 1 μm-precision linear actuator (850 G Actuator, Newport, Irvine CA USA) was used to accurately drive the syringe. To connect the injection needle remotely from the syringe, we used a 1 m length of 1/16-inch PEEK tube (Tub PEEK Blu, IDEX, Lake Forest, IL USA). The sampled OCT spectral data for the distal sensing is sequentially processed in the workstation following the three main steps as shown in Figure 3. The detail of the signal processing is precisely described in our previous work [24]. The first step of the processing is to transform the spectral data to A-scan data. As the sweeping rate is 100 kHz, the OCT engine returns 128 buffered spectral data every 1.28 ms. These oversampled data are useful to increase the signal-to-noise ratio because the temporally and spatially averaged data within a restricted window based on target size and speed effectively remove speckle noise, which is the one of the main noise factors in A-scan. However, the increased processing time due to the oversampled data has serious adverse effects on intraoperative guidance capabilities. Parallel processing using a GPU significantly reduces the processing time. In detail, 128 consecutive spectra consisting of 1376 data points transmitted from the frame grabber to the GPU in the workstation are passed to a high-pass filter in order to remove the high DC component in the spectrum data. Then, low-pass filtering is consecutively applied to remove the high-frequency noise components. Next, zero padding, FFT, averaging, and background subtraction are conducted on the A-scan data. This produces an A-scan with 2048 data points that covers a 3686.4 μm axial distance from the end of the fiber probe. The processed A-scan is passed to the next step that detects the tissue surface. As mentioned in earlier work, the A-scan of the tissue has a multilayered structure with a complex signature. Thus, we used not only surface detection to determine the absolute position of the surface but also a shifted cross-correlation method to determine distance variation (relative position) between temporally adjacent data. Of significance, the method based on cross-correlation is advantageous in that it uses the features of the A-scan that reflect deep-tissue anatomical structure, and detect distance variance robustly, where each A-scan point is vulnerable to noise. Finally, the calculated position value is transmitted to the third step for motion control. Instead of using the position value directly to control the motor, the output of a Kalman predictor is used to make up for the computational and communication time delay between the spectrum measurement and the actuator operation. Then, the system sends a command to motor driver to operate the linear motor based on the predicted position. The axial motion guidance is controlled based on the distance between needle tip and sample surface as shown in Figure 3. The distance is first sectioned by two virtual lines: (1) “Active-Line” and (2) “Safety Barrier-Line” for motor control. The distance between the safety barrier line and the active line is proportionally determined by the depth of the safety barrier. After injection, a user withdraws the needle tip and the system discontinues the compensatory motion. A stop signal is generated when the summation of the compensating length exceeds the preset threshold value.
2.3. Gelatin Phantom Injection Test
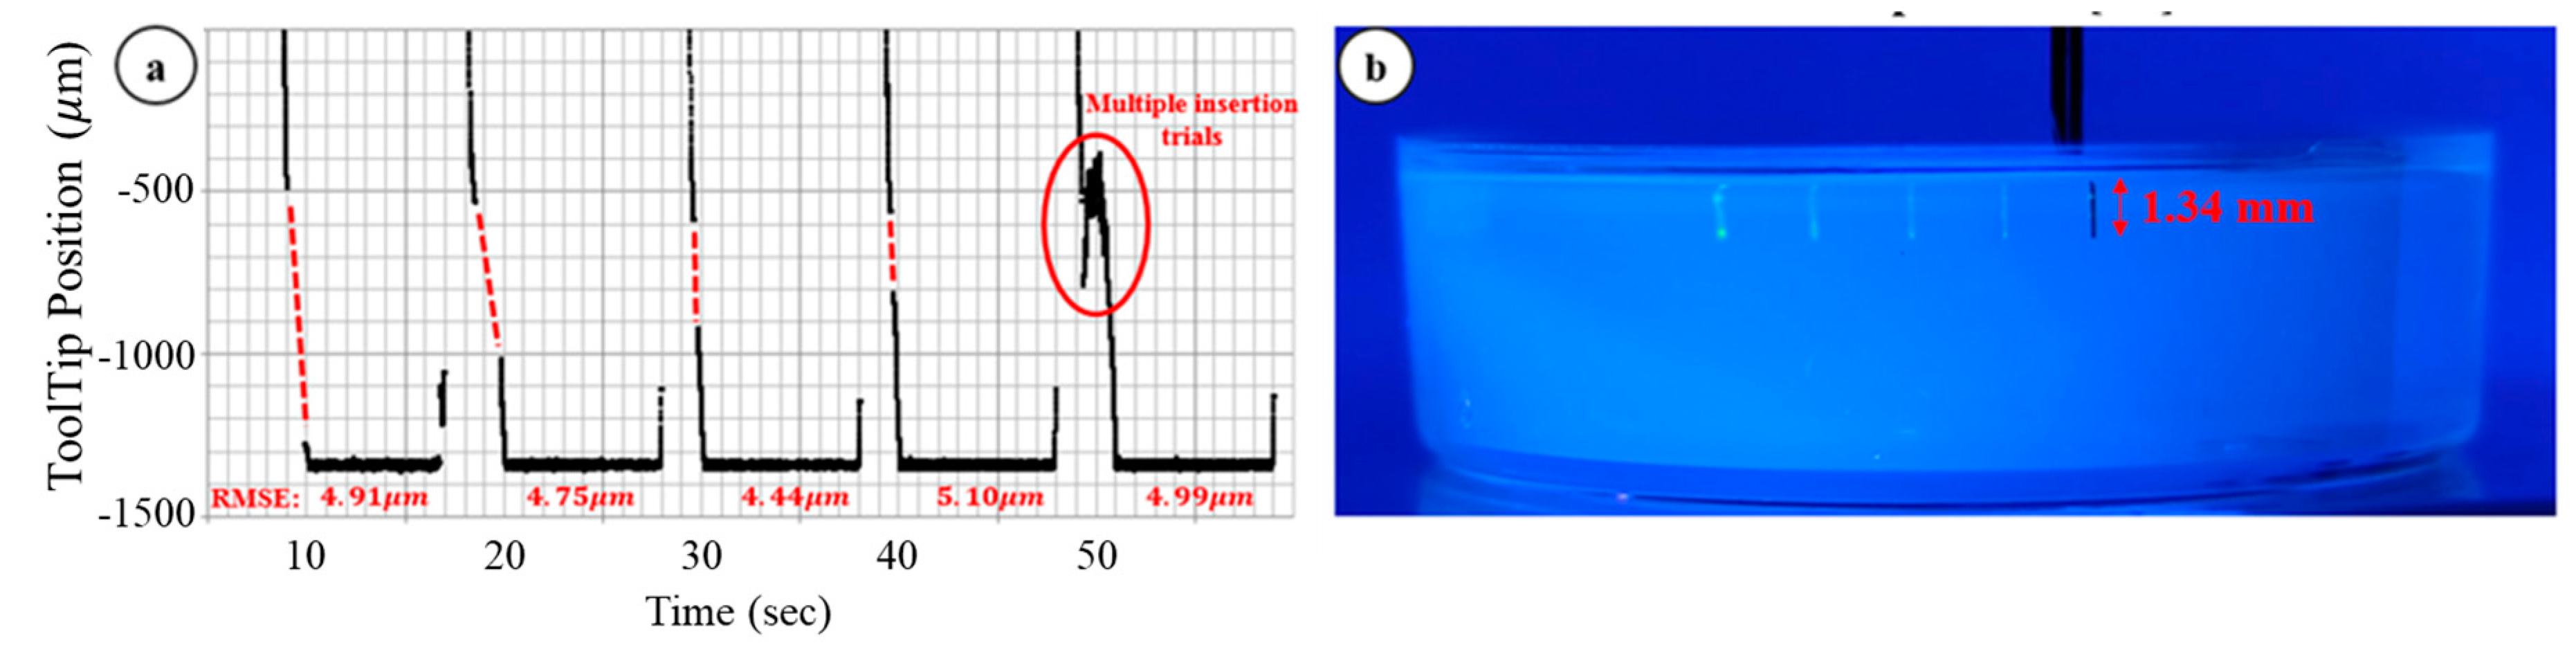
As shown in Figure 4, we first conducted a fluorescein dye injection test to assess SMART injector characteristics. We used 10% gelatin as a phantom to mimic biological tissue. Five injections were conducted serially and the system stably maintained the desired position of the needle tip during the injections. The system was held in position for 1 sec to ensure the stability of the needle tip prior to injection and then it automatically injected 50 nL of fluorescein dye at the desired depth into the translucent gelatin. The system provided auditory feedback to signal injection completion. We measured the root mean square error (RMSE) during the lock-in state in order to evaluate the stability of the needle tip and the equation of the RMSE:
where N, xi, and y are the total number of data, i-th position data, and the desired depth, respectively. The RMSE values for the five trials are denoted in the Figure 4a and the total average is 4.84 µm. This value is smaller than the value in our previous work [23]. The main reason is that the friction between the gelatin phantom and inserted needle tip decrease the vibrational motion. However, there was an undesirable phenomenon during the inserting process. As shown by the red dotted lines in Figure 4a, there was an OCT blind zone during the needle insertion. In particular, the gelatin sample was homogeneous and had specular reflection; as a result, the OCT signal was susceptible to any tilted angle of the surface. Depending on the sample properties, the above signal loss issue is not critical, especially in that biological tissue typically gives a predominantly diffuse reflection. However, surface deformation is still problematic in that precise needle-tip positioning in thin tissues, such as retinas, will need to account for both surface deformation as well as port position in the various needles and sizes available.
2.4. Modified Needle Guidance Method
Surface deformation is a well-known and predictable issue in the mechanics of needle insertion and is, in part, explained by fracture mechanics [25,26]. There are several parameters that reduce the surface deformation and we focused on the sharpness of the needle and insertion speed in this work as they were easily modified. Based on prior work [26], the equations related to the sharpness of the needle and insertion speed:
where fn is force of rupture and we need to decrease this value to mitigate the surface deformation. R, Kc, and Ac are fracture toughness, crack energy-intensification factor, and contact area, respectively.
where δ, k, v, τs, and fs are deformation depth, spring constant, insertion speed, relaxation time, and nonlinear force deformation function, respectively. As shown in Equations (2) and (3), the force for rupture is decreased by a smaller contact area (more sharp) and faster insertion speed. For these reasons, we first changed the 34 G needle from a blunt tip to a 45-degree bevel tip. However, there is a tradeoff because a sharper needle tip causes a less accurate injection depth, largely due to port position. At the same time, we programmed one more step, “prepoking”, a rapid-speed acceleration stage into the motor control to increase insertion speed. The acceleration step added in motor control is shown as a red box in Figure 3 and its result is shown in Figure 5b. Prepoking with regard to the gelatin matrix refers to controlling the motor to move at its maximum velocity to the prescribed depth relative to the surface. As shown in Figure 5b, the result is that the motor can achieve much faster insertion speed with greater accuracy and also diminish the “blind zone”.
3. Results
Based on the modified motion-guidance algorithm, we conducted three types of experiments to evaluate our microinjector system: (1) dynamic insertion, (2) multiple gelatin injections, and (3) ex vivo bovine eye injection tests.
3.1. Dynamic Insertion Test
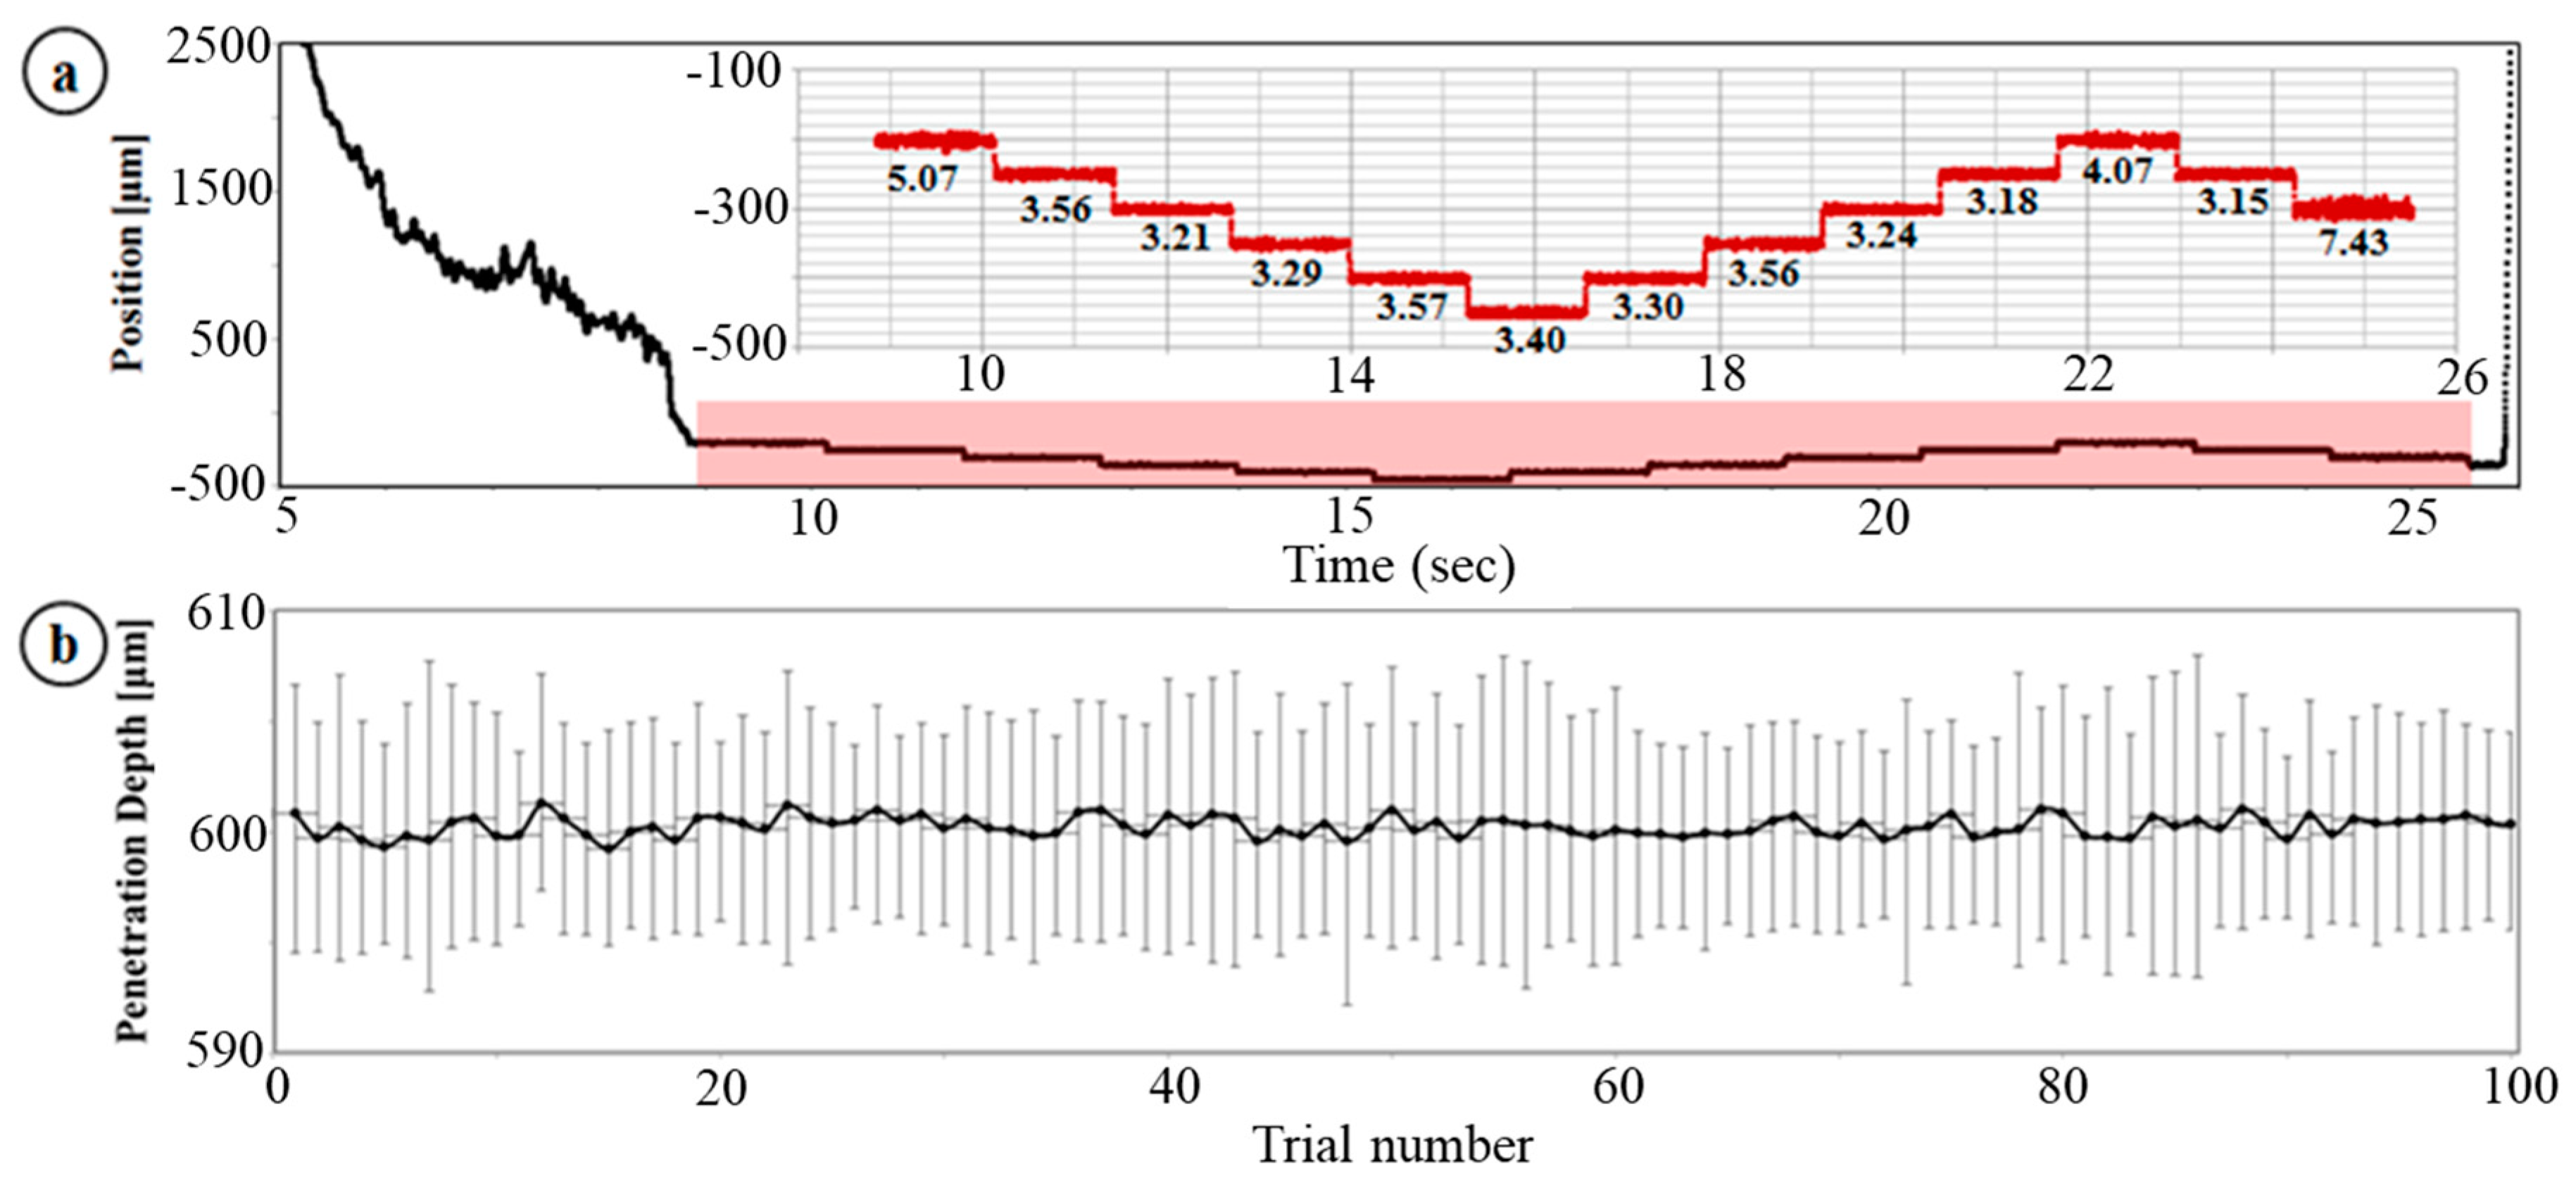
Similar to the prior work [24], we tested the dynamic targeting ability of our microinjector system as shown Figure 6a. In the prior work, we evaluated the depth-targeting and depth-locking abilities of the system. In this test, however, we intended to evaluate the system performance under the condition that it has interaction between the tool tip (34 G, 45-degree bevel-tip needle) and the sample material (10% gelatin); specifically, the friction and deformation of the gelatin surface caused by the needle motion and friction. With the modified motion-guidance method, there is no blind area and we can see a steep slope for the prepoking step followed by a gentle slope for the active approach. The axial depth profile shown in magnified red graph of Figure 6a was programmed in advance; specifically, the test was started at −200 µm (under the gelatin surface) and conducted five insertions with 50 µm interval after 1.28 ms depth locking. Once the needle tip reached −450 µm, the needle was withdrawn. Depicted are 12 injections and 13 depth-locking events. The RMSE of each trial is shown in the magnified graph in Figure 6a. The total average of the RMSE is 3.85 µm and this value is much smaller than the result of the prior test that was conducted with a floating needle. Thus, the friction between the needle and gelatin decreased the micron-level vibration and was helpful in stabilizing the needle tip position. Additionally, the incorporation of fast motion diminishes surface deformation; as a result, stability was no longer an issue when the needle tip moved to the next depth-locking position.
3.2. Multiple Injection, Gelatin Test
Next, we performed a test of multiple injections into gelatin. The experiment was designed to perform multiple injections continuously in order to simulate a potential clinical application in which multiple adjacent injections into a tissue might be therapeutic. We also test the motion guidance components of our system, which is necessary to recognize the injecting manipulation steps including the approach, depth locking-in during injection, and withdrawal or reset motions based on the distal information, in addition to the accuracy of the injecting depth. Specifically, one set of tests consisted of 10 consecutive injection trials. In total, we present 10 sets (=100 injections) of trials. The predetermined target injection depth was 600 µm. Like the prior gelatin injection test, the system was programmed to wait for 1 s in order to assure needle tip stability after it attains the target depth. Then, an auditory stimulus informed the user of completion of the injection. Based on the distal information during this depth-locking stage, we can calculate the RMSE to evaluate the accuracy and stability of the system. The result is shown in Figure 6b. The measured total mean injecting depth is 600.26 µm. The error bars in the graph are the positive and negative RMSE values. The total average of the RMSE is 5.31 µm and the maximum RMSE is 7.48 µm. This result shows that our SMART injector system can consistently guide the injecting needle.
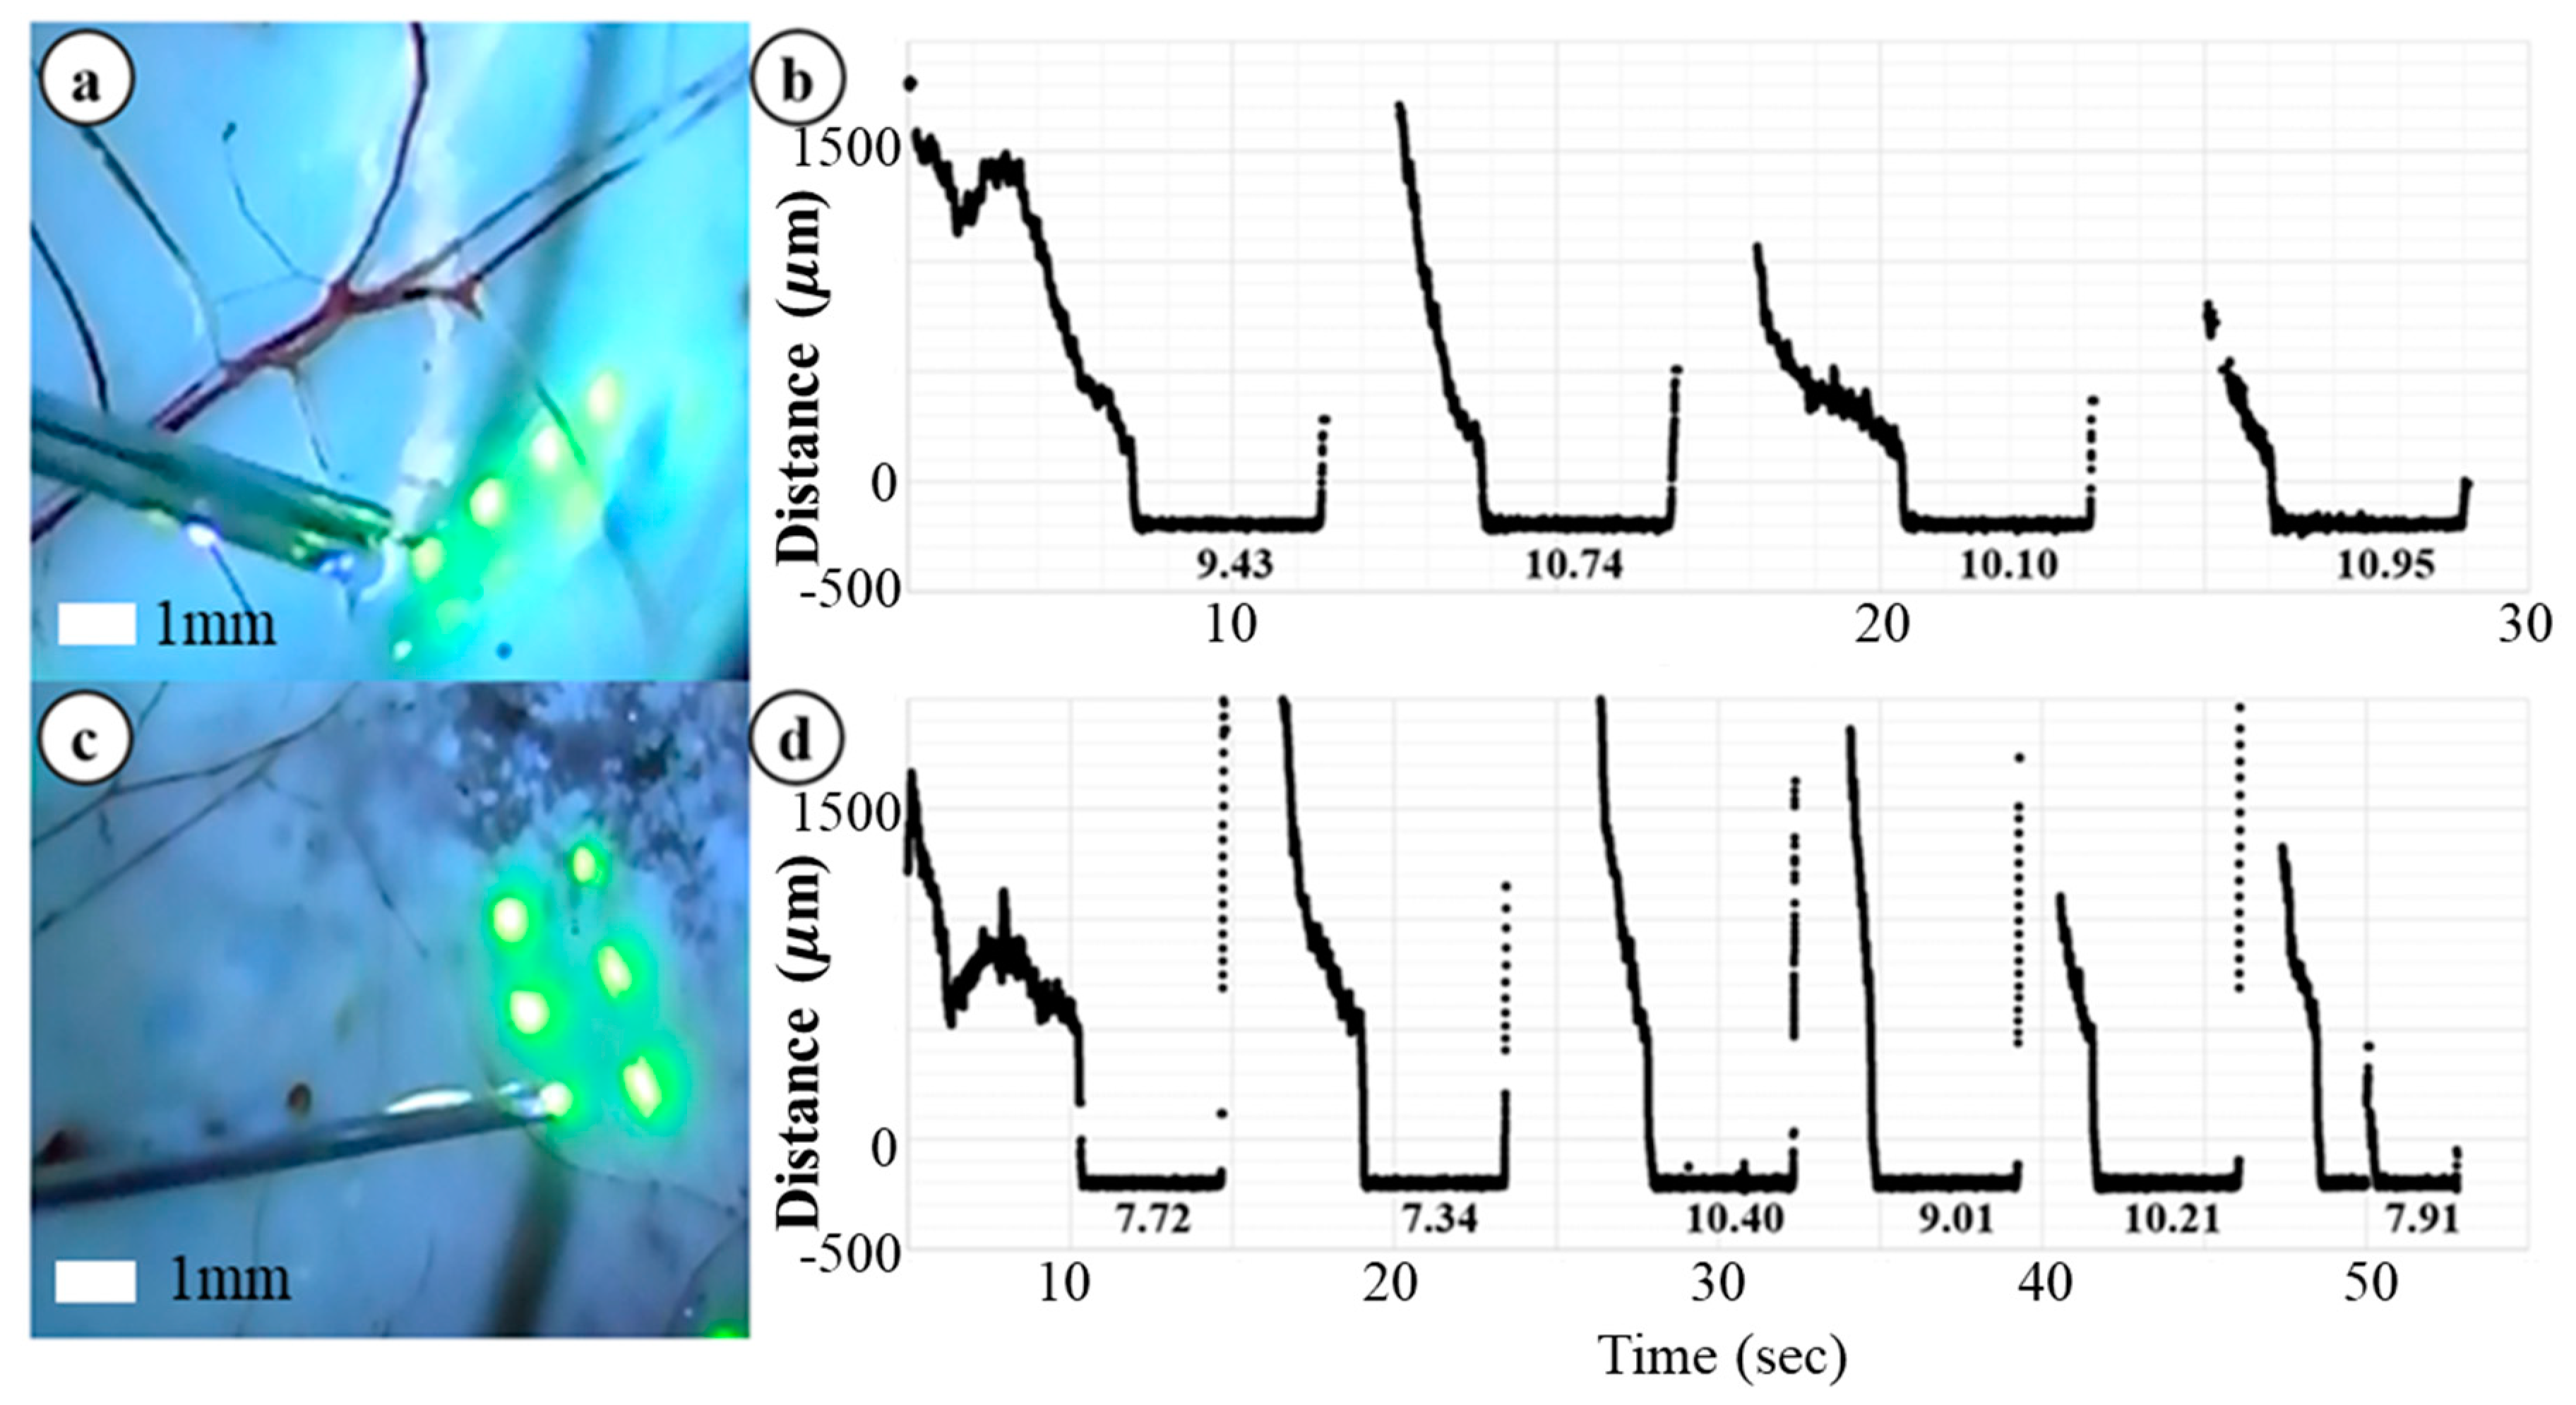
3.3. Ex-Vivo Bovine Eye Injection Test
Finally, we performed an ex-vivo bovine retina injection test in order to evaluate the effectiveness of the SMART injector system in a biological sample, as shown in Figure 7. To preserve the structure of the bovine retina, the experiment was conducted on the same day as death. In this test, we removed cornea, lens and vitreous humor and the needle tip had direct access to the bovine retina. This experimental setup is different from the actual surgical environment that a surgeon performs vitrectomy in so much as it occurs in air and the surgeon operates in fluid. In application, the needle passes through a trocar. The trocar provides both access to the interior of the eye and provides a stabilizing influence to the tool shaft. Despite these differences the interaction of the SMART with biological tissue provides useful information with regard to tool development and performance. During this test we injected small volumes of fluorescein into bovine retina and illuminated it with a blue light to excite the fluorescein and thereby increase its visibility; as a result, the injected volume is clearly shown in Figure 7a,c. We predetermined the injecting target depth to be 200 µm, as this would constitute an intra-retinal injection in bovine tissue [27]. The intended injecting volume was 50 nL but it was not tightly controlled due to capillary effect. Figure 7 shows ten representative injection trials and corresponding distance tracing data. The RMSEs during the depth-locking are shown in the graph. The units of each value is microns. The total average of the RMSE is 9.38 µm and the maximum RMSE is 10.95 µm. Prior knowledge regarding the typical thickness of the human retina and also the spacing between the various well described layers [28,29], demonstrates the theoretical potential of SMART injector system to target individual retinal layers.
4. Discussion
In this paper, we demonstrate how a handheld OCT-guided SMART approach can be applied to a microinjector. A simple and intuitive control algorithm for providing multiple injections was developed based on distance information. Additionally, a prepoking motion was added to the control system to resolve problems resulting from tissue deformation at the point of needle tissue first contact. To evaluate the performance of the developed system, three types of experiments including dynamic depth targeting, multiple injection, and bovine eye injections were performed. There is a huge gap between our animal model or bovine eye injection experiments and real vitrectomy surgery in terms of OCT sensor that the distal sensor locates not in the air but inside of vitreous humor; as a result, the reduced refractive index difference between the outside medium, which are air (1.0) and vitreous humor (1.337), and fiber glass (1.44) reduces the intensity of reference beam and deteriorates signal-to-noise ratio. Additionally, sharply cleaved fiber tip is vulnerable to frictional stress in a fluidic environment. Multiple solutions for the potential issues will be further navigated in future work. For example, we can attach a ball lens or create a lens-shape attachment using high refractive index epoxy at the fiber tip to overcome the decreased refractive index difference between the fiber material and outside medium. The lens shape will also be helpful to prevent the illumination beam from rapidly diverging right after getting out of the fiber. Furthermore, a pump system is also required to work with negative pressure to prevent unnecessary liquid agent outflow due to capillary effect. In early development stage, however, the experiments are sufficient to show how consistently the conceptual device operates and what the potential issues and their solutions are in the injecting process. The results of the experiments show that our system accurately guided the needle tip to the target depth and significantly suppressed motion artifacts while injecting small volumes of fluorescein dye. Although the experiments were all in a stationary environment, the motion artifact even generated by target motion or patient motion can be managed by our system because the system response speed surpasses the frequency of hand tremors and human motion. These extended injector functions have the potential to overcome fundamental limitations in current surgical systems. Notable are the solutions to limited depth information through the surgical microscope and limitations in ultraprecise tool control. This approach to augmenting the surgeon’s control and precision represents a significant advance in the development of sensorized surgical tools with augmented haptic functions.
Author Contributions
Conceptualization, J.U.K.; methodology, J.U.K. and G.W.C.; software, G.W.C.; validation, G.W.C.; resources, J.U.K.; writing-original draft preparation, J.U.K. and G.W.C.; visualization, G.W.C.; project administration, J.U.K.; funding acquisition, J.U.K.
Funding
This research was funded by NIH/NEI grant 1R01 EY021540 and Coulter Translational Research grant.
Conflicts of Interest
The authors declare no conflict of interest.
References
- Boye, S.E.; Boye, S.L.; Lewin, A.S.; Hauswirth, W.W. A comprehensive review of retinal gene therapy. Mol. Ther. 2013, 21, 509–519. [Google Scholar] [CrossRef] [PubMed]
- Cideciyan, A.V.; Jacobson, S.G.; Beltran, W.A.; Sumaroka, A.; Swider, M.; Iwabe, S.; Roman, A.J.; Olivares, M.B.; Schwartz, S.B.; Komaromy, A.M.; et al. Human retinal gene therapy for Leber congenital amaurosis shows advancing retinal degeneration despite enduring visual improvement. Proc. Natl. Acad. Sci. USA 2012, 110, 517–525. [Google Scholar] [CrossRef] [PubMed]
- Seow, Y.; Wood, M.J. Biological gene delivery vehicles: Beyond viral vectors. Mol. Ther. 2009, 17, 767–777. [Google Scholar] [CrossRef] [PubMed]
- Singh, S.P.N.; Riviere, C.N. Physiological tremor amplitude during retinal microsurgery. In Proceedings of the IEEE 28th Annual Northeast Bioengineering Conference, Philadelphia, PA, USA, 21 April 2002; pp. 171–172. [Google Scholar]
- Wang, W.; Liu, X.; Gelinas, D.; Ciruna, B.; Sun, Y. A fully automated robotic system for microinjection of zebrafish embryos. PLoS ONE 2007, 2, e862. [Google Scholar] [CrossRef] [PubMed]
- Fleming, I.; Balicki, M.; Koo, J.; Iordachita, I.; Mitchell, B.; Handa, J.; Hager, G.; Taylor, R. Cooperative robot assistance for retinal microsurgery. Proc. Med. Image Comput. Comput. Assist. Interv. 2008, 11, 543–550. [Google Scholar]
- Ota, T.; Patronick, N.A.; Schwartzman, D.; Riviere, C.N.; Zenati, M.A. Minimally invasive epicardial injections using a novel semiautonomous robotic device. Circulartion 2008, 118, 115–120. [Google Scholar] [CrossRef] [PubMed]
- Becker, B.C.; Yang, S.; MacLachlan, R.A.; Riviere, C.N. Towards vision-based control of a handheld micromanipulator for retinal cannulation in an eyeball phantom. In Proceedings of the 4th IEEE RAS and EMBS International Conference on Biomedical Robotics and Biomechatronics (BioRob), Rome, Italy, 24–27 June 2012; pp. 44–49. [Google Scholar]
- Gonenc, B.; Gehlbach, P.L.; Handa, J.; Taylor, R.H.; Iordachita, I. Force-sensing microneedle for assisted retinal vein cannulation. Proc. IEEE Sens. 2014, 698–701, 698–701. [Google Scholar]
- Ehlers, J.P.; Tao, Y.K.; Farsiu, S.; Maldonado, R.; Izatt, J.A.; Toth, C.A. Integration of a spectral domain optical coherence tomography system into a surgical microscope for intraoperative imaging. Investig. Ophthalmol. Vis. Sci. 2011, 52, 3153–3159. [Google Scholar] [CrossRef] [PubMed]
- Hahn, P.; Migacz, J.; O’Connell, R.; Izatt, J.A.; Toth, C.A. Unprocessed real-time imaging of vitreoretinal surgical maneuvers using a microscope-integrated spectral-domain optical coherence tomography system. Graefes Arch. Clin. Exp. Ophthalmol. 2013, 251, 213–220. [Google Scholar] [CrossRef] [PubMed]
- Hahn, P.; Migacz, J.; O’Donnell, R.; Day, S.; Lee, A.; Lin, P.; Vann, R.; Kuo, A.; Fekrat, S.; Mruthyunjaya, P.; et al. Preclinical evaluation and intraoperative human retinal imaging with a highresolution microscope-integrated spectral domain optical coherence tomography device. Retina 2013, 33, 1328–1337. [Google Scholar] [CrossRef] [PubMed]
- Joos, K.M.; Shen, J.H. Miniature real-time intraoperative forward-imaging optical coherence tomography probe. Biomed. Opt. Express 2013, 4, 1342–1350. [Google Scholar] [CrossRef] [PubMed]
- Yu, H.; Shen, J.; Shah, R.J.; Simaan, N.; Joos, K.M. Evaluation of microsurgical tasks with OCT-guided and/or robot-assisted ophthalmic forceps. Biomed. Opt. Express 2015, 6, 457–472. [Google Scholar] [CrossRef] [PubMed]
- Vakhtin, A.B.; Kane, D.J.; Wood, W.R.; Peterson, K.A. Common-path interferometer for frequency-domain optical coherence tomography. Appl. Opt. 2003, 42, 6953–6958. [Google Scholar] [CrossRef] [PubMed]
- Sharma, U.; Fried, N.M.; Kang, J.U. All-Fiber Common-Path Optical Coherence Tomography: Sensitivity Optimization and System Analysis. IEEE J. Sel. Top. Quantum Electron. 2005, 11, 799–805. [Google Scholar] [CrossRef]
- Zhang, K.; Kang, J.U. Graphics processing unit accelerated non-uniform fast Fourier transform for ultrahigh-speed, real-time Fourier-domain OCT. Opt. Express 2010, 18, 23472–23487. [Google Scholar] [CrossRef] [PubMed]
- Zhang, K.; Wang, W.; Han, J.; Kang, J.U. A surface topology and motion compensation system for microsurgery guidance and intervention based on common-path optical coherence tomography. IEEE Trans. Biomed. Eng. 2009, 56, 2318–2321. [Google Scholar] [CrossRef] [PubMed]
- Zhang, K.; Kang, J.U. Common-path low-coherence interferometry fiber-optic sensor guided microincision. J. Biomed. Opt. 2011, 16, 095003. [Google Scholar] [CrossRef] [PubMed] [Green Version]
- Huang, Y.; Zhang, K.; Lin, C.; Kang, J.U. Motion compensated fiber-optic confocal microscope based on a common-path optical coherence tomography distance sensor. Opt. Eng. 2011, 50, 083201. [Google Scholar] [CrossRef]
- Huang, Y.; Liu, X.; Song, C.; Kang, J.U. Motion-compensated hand-held common-path Fourier-domain optical coherence tomography probe for image-guided intervention. Biomed. Opt. Express 2012, 3, 3105–3118. [Google Scholar] [CrossRef] [PubMed]
- Song, C.; Gehlbach, P.L.; Kang, J.U. Active tremor cancellation by a “smart” handheld vitreoretinal microsurgical tool using swept source optical coherence tomography. Opt. Express 2012, 20, 23414–23421. [Google Scholar] [CrossRef] [PubMed]
- Song, C.; Park, D.Y.; Gehlbach, P.L.; Park, S.J.; Kang, J.U. Fiber-optic OCT sensor guided “SMART” micro-forceps for microsurgery. Biomed. Opt. Express 2013, 4, 1045–1050. [Google Scholar] [CrossRef] [PubMed] [Green Version]
- Cheon, G.W.; Huang, Y.; Cha, J.; Gehlbach, P.L.; Kang, J.U. Accurate real-time depth control for CP-SSOCT distal sensor based handheld microsurgery tools. Biomed. Opt. 2015, 6, 1942–1953. [Google Scholar] [CrossRef] [PubMed]
- Mahvash, M.; Dupont, P.E. Fast needle insertion to minimize tissue deformation and damage. In Proceedings of the IEEE International Conference on Robotics and Automation, Kobe, Japan, 12–17 May 2009; pp. 3097–3102. [Google Scholar]
- Mahvash, M.; Dupont, P.E. Mecahnics of dynamic needle insertion into a biological material. IEEE Trans. Biomed. Eng. 2010, 57, 934–943. [Google Scholar] [CrossRef] [PubMed]
- Chauhan, D.S.; Marshall, J. The interpretation of optical coherence tomography images of the retina. Investig. Ophthalmol. Vis. Sci. 1999, 40, 2332–2342. [Google Scholar]
- Bagci, A.M.; Shahidi, M.; Ansari, R.; Blair, M.; Zelkha, R. Thickness profiles of reintal layers by optical coherence tomography image segmentation. Am. J. Ophthalmol. 2008, 146, 679–687. [Google Scholar] [CrossRef] [PubMed]
- Fernandez, D.C.; Salinas, H.M.; Puliafito, C.A. Automated detection of retinal layer structures on optical coherence tomography images. Opt. Express 2005, 13, 10200–10216. [Google Scholar] [CrossRef]
Figure 1.
Free hand insertion test performed by a retinal surgeon: (a) Needle tip position tracking data during the insertion trial, (b) a magnified area in red ellipse of graph (a). The two red dotted lines mark the range of insertion depth variation during the microinjection.
Figure 1.
Free hand insertion test performed by a retinal surgeon: (a) Needle tip position tracking data during the insertion trial, (b) a magnified area in red ellipse of graph (a). The two red dotted lines mark the range of insertion depth variation during the microinjection.
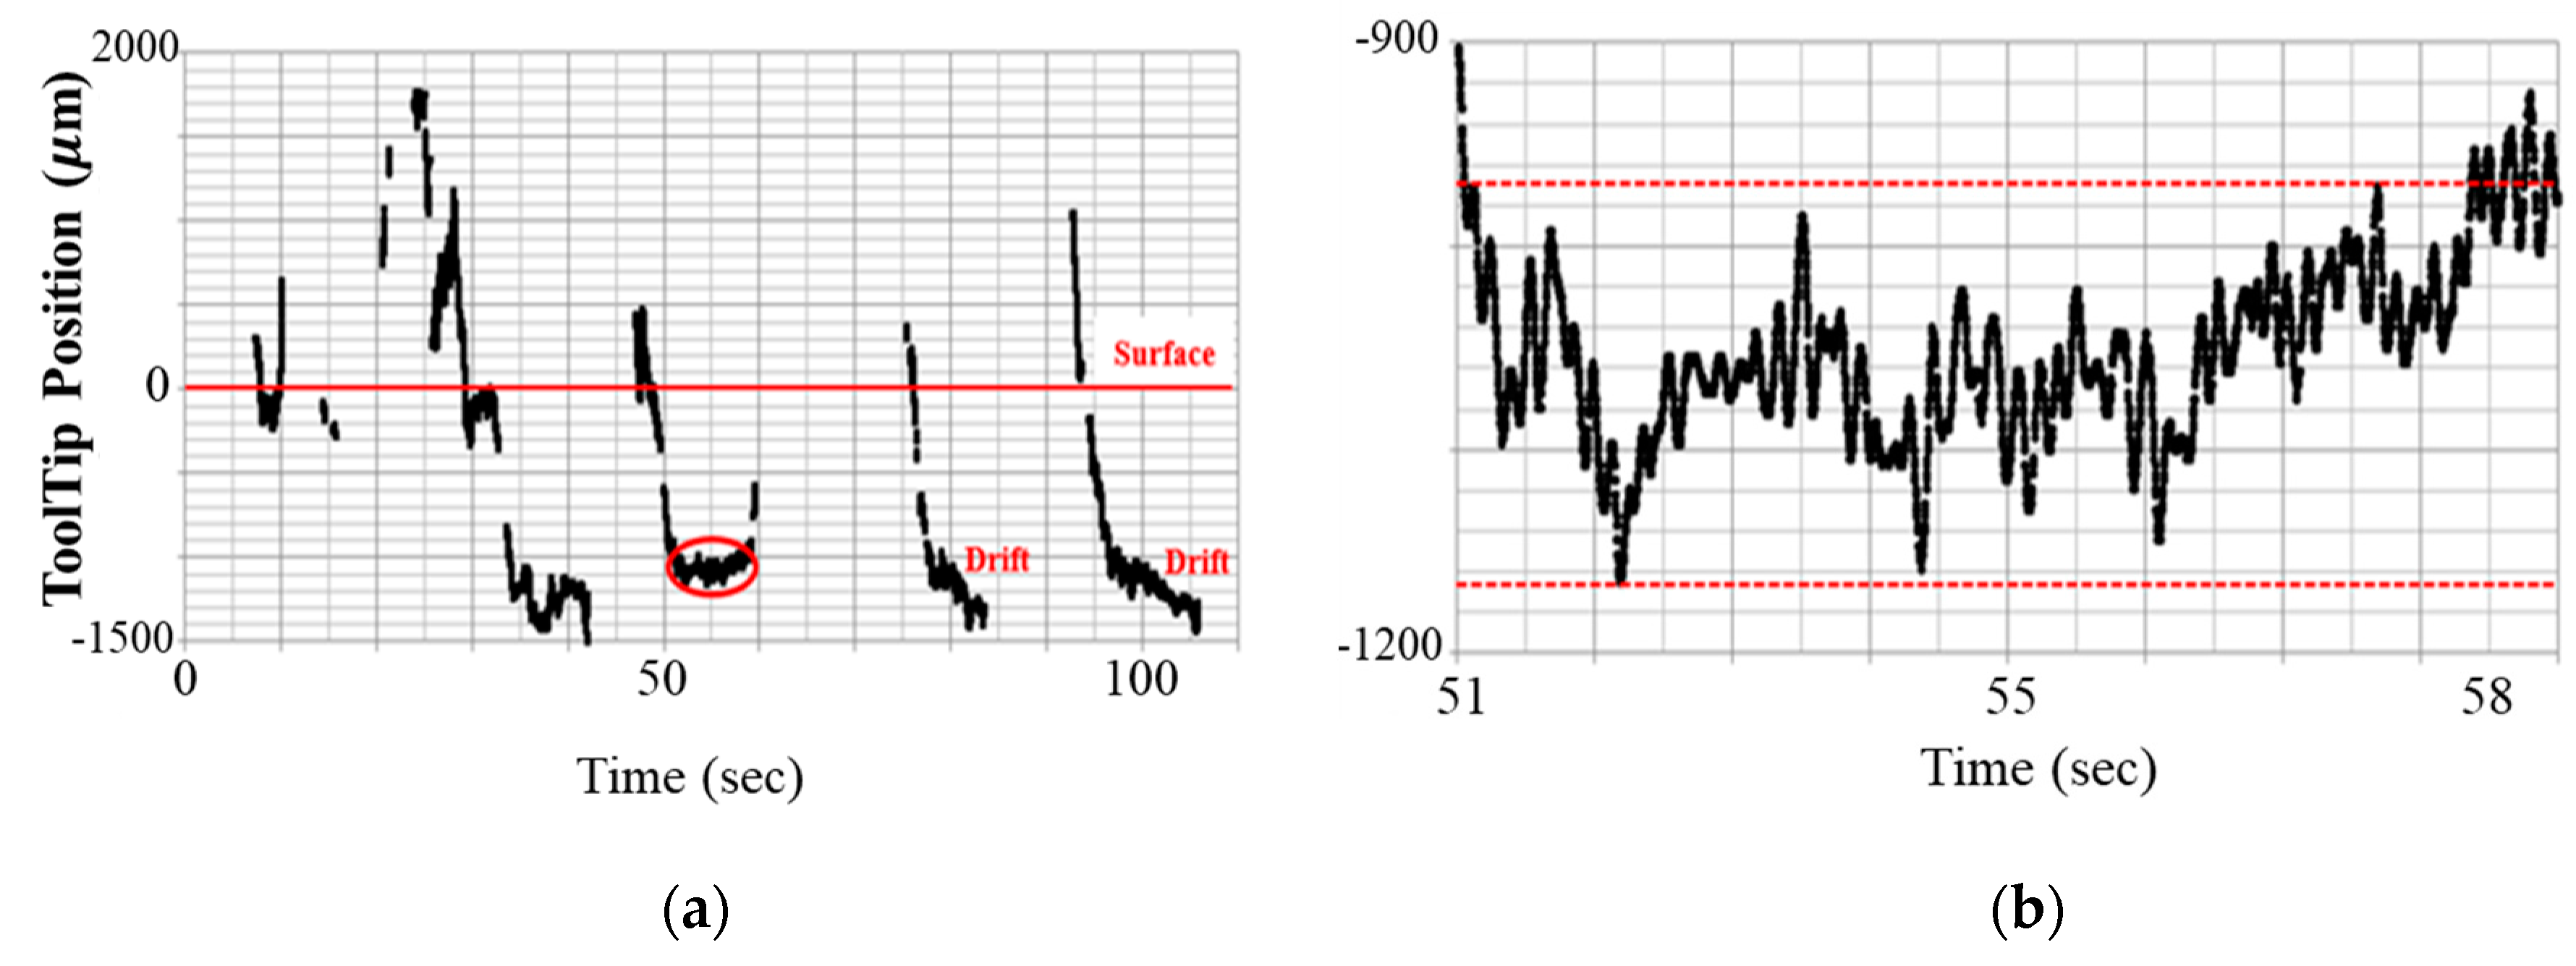
Figure 2.
(a) System overview of the common-path swept source optical coherence tomography (CP-SSOCT) depth-guided microinjector; (b) internal structure of the microinjector and CP-SSOCT fiberoptic sensor: RB (reflected beam), FAI (Fiber-Air Interface), SB (sample reflected beam); and (c) picture of implemented injector handpiece.

Figure 3.
Flowchart of OCT data processing for distal sensing and motion control. The processing consists of three main parts: (1) OCT data transformation from measured spectral data, (2) distal information extraction from the OCT data, and (3) motion control based on the distal information. HPF: high-pass filter, LPF: low-pass filter, and FFT: Fast Fourier Transformation.
Figure 4.
Preliminary 10% gelatin phantom injection test: (a) distance tracking data that has blind area caused by surface deformation, (b) five consecutive injection trials on a gelatin sample. The preset penetration depth was 1.34 mm.
Figure 4.
Preliminary 10% gelatin phantom injection test: (a) distance tracking data that has blind area caused by surface deformation, (b) five consecutive injection trials on a gelatin sample. The preset penetration depth was 1.34 mm.

Figure 5.
Needle-tip depth position graphs in one cycle of injection with different stages of needle guidance. The system engaged in the depth control once the needle tip was significantly close to the target defined by active line. In the lock-in stage, the depth position of the needle tip is fixed with the compensating motion by system and the effect of hand tremor and target motion is eliminated: (a) tracking data without prepoking stage and there is a blind area due to surface deformation of the sample, (b) tracking data with prepoking stage and the system achieves maximum speed during this stage to reduce the surface deformation.

Figure 6.
(a) Dynamic insertion test under the condition that it has interaction between needle tip and sample material. The upper inserted graph is a partial magnified graph of area in red square in lower entire graph. (b) The average deviation error of 100 injections with error bar consisting a positive and negative RMSE.

Figure 7.
The ex-vivo bovine eye injection experiment: (a,c) are snap shots displaying the multiple fluorescein injections. Fluorescein was excited by blue light for fluorescence emission, (b,d) are tracking data of the needle-tip. Each graph has root mean square error (RMSE) below it during depth locking.
© 2018 by the authors. Licensee MDPI, Basel, Switzerland. This article is an open access article distributed under the terms and conditions of the Creative Commons Attribution (CC BY) license (http://creativecommons.org/licenses/by/4.0/).
Share and Cite
MDPI and ACS Style
Kang, J.U.; Cheon, G.W. Demonstration of Subretinal Injection Using Common-Path Swept Source OCT Guided Microinjector. Appl. Sci. 2018, 8, 1287. https://doi.org/10.3390/app8081287
AMA Style
Kang JU, Cheon GW. Demonstration of Subretinal Injection Using Common-Path Swept Source OCT Guided Microinjector. Applied Sciences. 2018; 8(8):1287. https://doi.org/10.3390/app8081287
Chicago/Turabian StyleKang, Jin U., and Gyeong Woo Cheon. 2018. "Demonstration of Subretinal Injection Using Common-Path Swept Source OCT Guided Microinjector" Applied Sciences 8, no. 8: 1287. https://doi.org/10.3390/app8081287
Note that from the first issue of 2016, this journal uses article numbers instead of page numbers. See further details here.