Methods for Aggregation and Remuneration of Distributed Energy Resources


1
GECAD—Research Group on Intelligent Engineering and Computing for Advanced Innovation and Development, Polytechnic of Porto, Porto 4200-072, Portugal
2
School of Engineering, Polytechnic of Porto, Porto 4200-072, Portugal
*
Author to whom correspondence should be addressed.
Appl. Sci. 2018, 8(8), 1283; https://doi.org/10.3390/app8081283
Submission received: 14 May 2018
/
Revised: 26 July 2018
/
Accepted: 30 July 2018
/
Published: 1 August 2018
(This article belongs to the Special Issue Distribution Power Systems)
Abstract
:Distributed energy resource integration in power systems has advantages and challenges in both the economic and the technical operation of the system. An aggregator, as in the case of a Virtual Power Player, is essential in order to support the operation of these small size resources. Innovative approaches capable of supporting the decisions made in terms of resource scheduling, aggregation and remuneration are needed. The present paper addresses a methodology capable of managing resources through the activities of an aggregator, providing different choices of aggregation and remuneration strategies. The methodology is validated in a case study regarding a 21-bus network, composed of 20 consumers and 26 producers.
1. Introduction
Aggregators are entities introduced by the energy market liberalization, opening the way to resource management by internal and external players in a given market. The term aggregator is defined in the European energy efficiency directive (2012/27/EU), as follows: “aggregator means a demand response service provider that combines multiple short-duration consumer loads for sale or auction in organized energy markets”.
1.1. Background
Although the term aggregator usually only refers to the manager of consumers, at the same time, this entity can also be a virtual power plant, i.e., a manager of multiple generators or an aggregator of producers [1,2,3].
An aggregator of producers usually deals with the management of distributed generation, which is defined in the European electricity directive (2009/72/EC) as “generation plants connected to a distribution system”.
Aggregators can be of several types, for which different responsibilities are assumed [4]:
- Parallel Aggregator—can participate at the same time in distinct markets (electricity, water, heat);
- Large-scale Aggregator—can aggregate large dimension production units that are connected in HV or VHV;
- Micro Aggregator—aggregates small production units;
- Global Aggregator—aggregates both production and consumption units.
In this paper, it is considered that the aggregator is of a micro and global type, dealing with small production and consumption resources.
The aggregator’s role starts with the scheduling of its resources. However, the main features are the aggregation and remuneration, namely, on which basis these are performed [5,6]. The aggregation process defines how the resources are joined together and thus the final energy scheduled per group. The aggregator can then use this energy in an auction in energy markets, giving the possibility of negotiation at the level of larger resources when comparing with individual consumers or distributed generators [7,8].
The goal of an electric power system is always to provide electricity to its consumers, taking into account certain levels of security and quality. For the aggregator, the consumers are seen as a double-faced resource, since they have to be supplied by a given amount, but can provide flexibility regarding that consumption [9,10]. This gives robustness to the aggregator’s operation, allowing him several options of scheduling and load management [11,12,13]. Distributed generators allow a similar flexibility, because of the penetration of renewable energy sources they provide. These resources are more easily placed in and out of the network’s operation, with reduced costs for the aggregator, when compared with thermal or other major power plants.
1.2. Related Literature
With the aim of aggregating resources, the way to create groups can consider several approaches and distinct features, namely, on which basis the resources are grouped and the number of groups [14]. These issues are part of the activities of an aggregator; thus, decision support techniques or tools capable of helping the aggregator in these matters are needed. A usual way of creating these kinds of tools is using clustering methods in order to find the similarities/patterns in large amounts of data, and then join the related resources [15,16,17,18]. Another major feature of the aggregator is the remuneration of resources, i.e., if the consumers and distributed generators are a part of the aggregator’s schedule, these will require remuneration for the service they are providing [19,20,21]. In this way, besides the scheduling and aggregation, decision support regarding the strategies implemented for the remuneration of resources (e.g., the resources can be paid individually, by type, according to the group, etc.) is needed.
In [22], the authors present work regarding the scheduling of resources in a microgrid, considering flexible loads of several types (load curtailment and shifting). Also, the forecast of electricity prices is made in order to minimize the microgrid operation costs. In [23], the authors refer to aggregators as a player oriented for the integration of demand response in energy markets, by presenting a model for the frequency regulation with the use of this type of resource. This is currently one of the main activities in European markets; several demand response programs presented by the system operator are related to frequency regulation. In [23], the authors perform a scheduling of resources, and compute their remuneration, proposing a business model for distributed resources in the energy markets.
In fact, other methods can be found in the literature concerning the aggregation and remuneration of resources, namely, the ones based on Locational Marginal Pricing (LMP). The authors in [24] proposed a methodology for the distributed generation remuneration with LMP, in radial distribution systems. This method was applied to a 34-bus network. In [25], a similar study, with concern for demand response, was applied to a 12-bus system with real-time pricing. These works, [24,25], have focused on the use of LMPs for the network cost and optimal resource allocation in a planning phase in order to optimize the use of the grid. With focus on congestion management and pricing, the authors in [26] considered both active and reactive power in a distribution system addressing also the voltage support. In [27], according to the calculated congestion, demand response is scheduled, also considering the interactions between the aggregator and distribution system operator. In this way, signals are given to the consumers/producers in the day-ahead in order to efficiently manage the congestion situations. In many works, like in [28], the use of LMP is mainly driven by the marginal cost of non-renewable resources. These works are very relevant in the field, considering the assumptions of the main objective of the work. In the present paper, the authors assume that distributed generators and demand response resources are available randomly in the network, so we are not aiming at deciding the optimal allocation of the resources. Also, we are not focusing on congestion management and voltage support; in fact, our main concern is the remuneration of active power/real energy. Additionally, for a fair remuneration of the resources, the authors in the present paper assume that all the consumers in the same tariff are paid the same price, disregarding the location in the network. The power-flow implemented in the proposed methodology is needed in order to ensure that there is no overuse of line capacity and violations in voltages. In this way, calculating an average price in each group and comparing it with the traditional payment by type of resource are drivers in the developed work, instead of calculating LMP remuneration which would not be so clear for the small size resource owners that are paid for active energy.
Another important topic is the use of parallel and distributed processing approaches in order to overcome the issues that can be raised with the scalability of the increasing the number of distributed generation and demand response resources in a mixed-integer non-linear algorithm used for the optimization. Such methodologies can be used as single methods, as in [29], or hybrid approaches, as in [30]. With application of the LMP definition, a parallel processing approach was proposed in [31] for energy storage systems. Relevant focus is given to non-dispatchable resources in [32]. A very relevant survey in the field has been published in [33]. The implemented distributed algorithms are driven to power flow problems, frequency and voltage control, and wide-area control.
In fact, storage systems are a key resource in the scope of distributed energy resources, allowing a more flexible management of the resources as a whole [34]. Such flexibility is a great advantage of storage systems; however, several issues and challenges must be overcome, as discussed in [34,35]. The authors in the present paper assume that the tariff definition, and therefore the aggregation and remuneration of resources, is made offline so the time and computing resources needed to run the proposed methodology are not critical. However, in a very large scenario of implementation, the proposed methodology will require adequate processing means similar to the ones referred to.
As the distributed energy resources are owned by market players, which can change the aggregator that manages the resources, remunerating them, it is also important to refer to the fact that a dynamic aggregation should be made so the resources do not lose their strategic behavior and therefore reduce the social welfare that normally comes from the active behavior of resources. Such a problem has been addressed in the literature, namely, by applying game theory to the strategic players’ behavior [36,37].
1.3. Contribution
In the current paper, it is considered that the aggregator has no profitability objective. The implemented tool is composed of a methodology that approaches the three major activities of the aggregator: scheduling, aggregation and remuneration, with special focus on the latter two, by providing a comparison between distinct methods. In this way, the following contributions are identified, compared with previous related works in [38,39]:
- Including demand response based on shifting of consumption (Equations (10)–(12));
- Validating the network operation limits for line capacity and bus voltages (Equations (2)–(4));
- Proposal of three distinct aggregation considerations, reporting their influence on the aggregation outcome. In previous works, the aggregation is made for each scenario, one by one, for each period. In the present paper, it is made for multiple scenarios;
- Evaluation and comparison of four different remuneration methods is based on the aggregation. In the previous papers, maximum and average prices were approached. In this paper, additional methods are implemented and compared.
2. Proposed Methodology
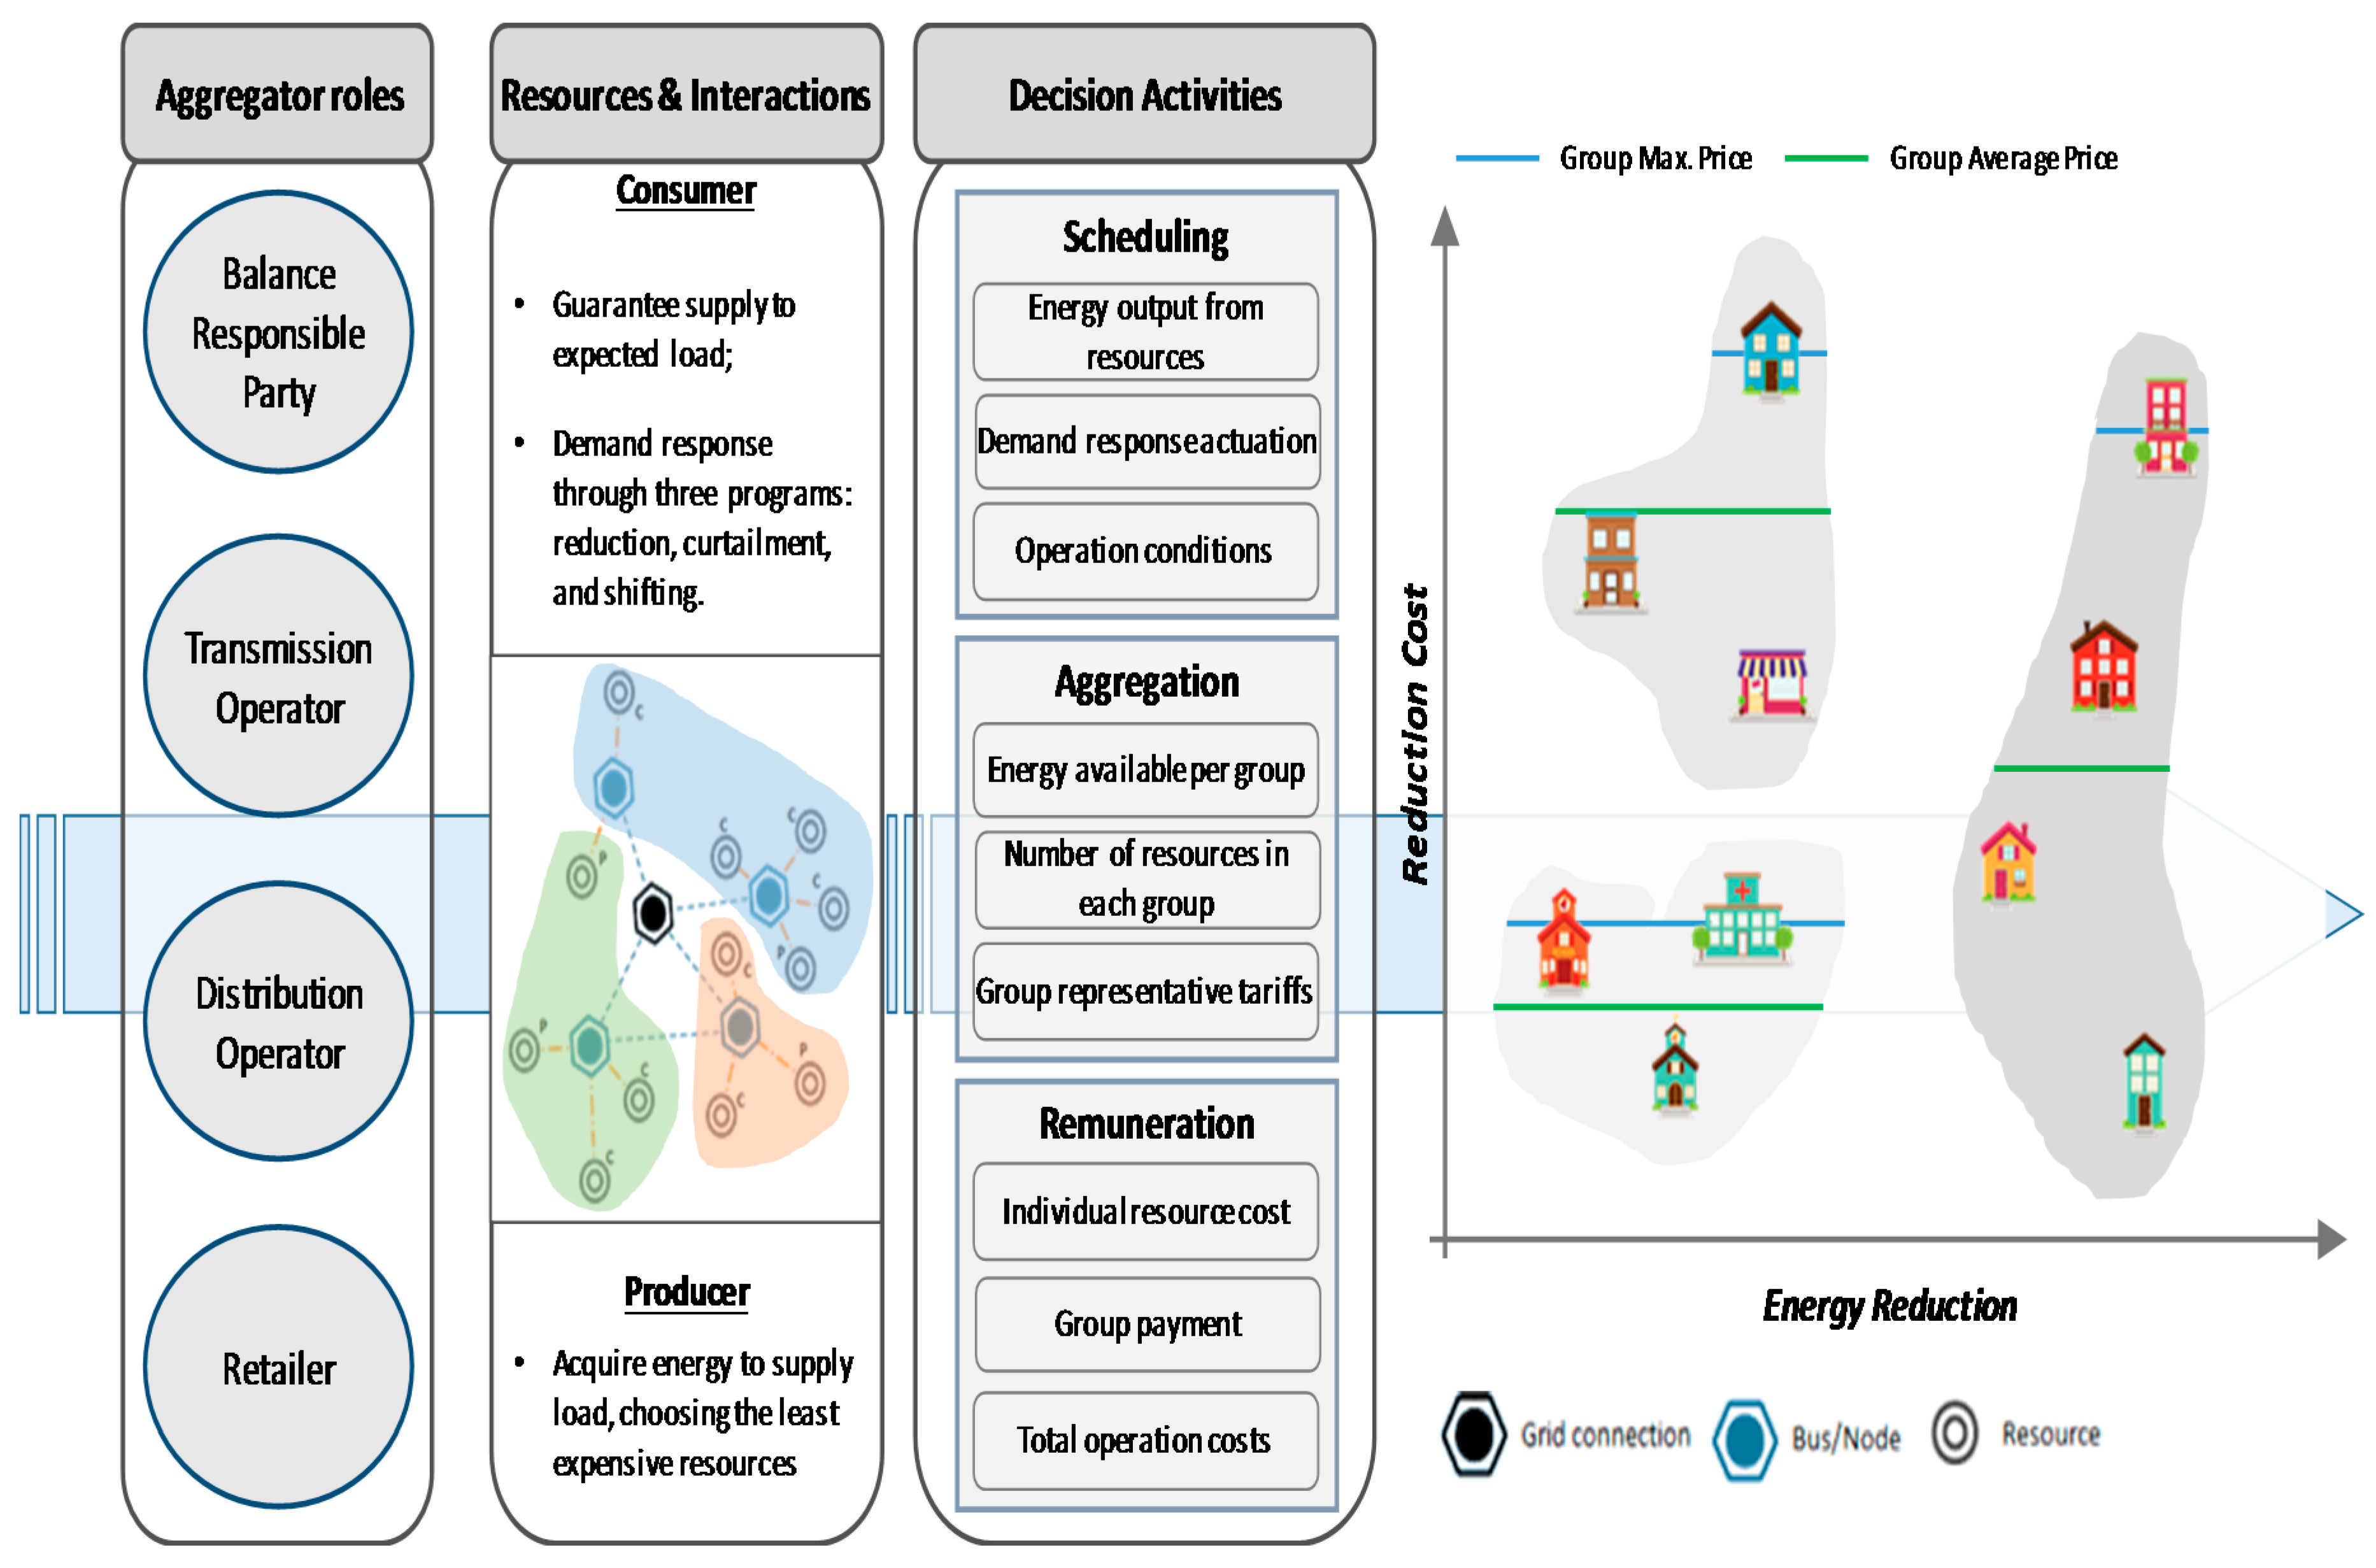
In the present section the implemented methodology is defined. We consider demand response programs and distributed generators, in a mixed-integer nonlinear problem, involving an aggregator managing the technical conditions of a region. In this way, the aggregator assumes a role of operator and resource manager. This perspective is also applicable to a Balance Responsible Party (BRP) [40,41]. The need for several definitions of an aggregator arises as it also can assume multiple roles in the energy system’s operation. Figure 1 shows the implemented concept.
In the scheduling of resources, the authors propose the introduction of three demand response programs: load reduction, curtailment, and shifting. Thus, a multi-period optimization is considered and performed simultaneously for all the periods considered. Regarding generation-side resources, the main grid suppliers and distributed generators are considered, in order to satisfy consumption in any given period, allied with the use of the demand response program flexibility. For the aggregation and remuneration, based on the aggregator for the contribution of its resources, the authors propose distinct methods that allow different outcomes for the aggregator’s cost and consumer/producer’s benefit. Depending on the specific actual scenario, the aggregator may choose different methods for the aggregation and remuneration of its resources.
The aggregation variables, i.e., the features upon which the aggregation will be made, are the energy scheduled for each resource and the costs of this schedule. The aggregation is made separately for each type of resource, producer and consumer. In this way, the costs considered for the first are the linear costs of each producer, while for the latter, one considers the costs of each demand response program.
Table 1 shows the aggregation and remuneration methods that will be applied after the resource scheduling. These methods will be discussed in the results section. The consideration and comparison of several aggregation and remunerations methods is also an improvement from previous published work, in [14]. Thus, the influence of different data in the aggregation and remuneration process is analyzed rather than just chosen and presented.
The methodology is fully developed in MATLAB, based on the use of its optimization tool, TOMSYM programming. The aggregation is performed using the clustering algorithm K-Means, available through an embedded MATLAB function. The use of matrix-based software in these kinds of applications allows a clearer and easier definition of the problem, since the issues addressed here, often involve multiple dimensions and variables.
3. Scheduling Formulation
In the present section the mathematical formulation is defined, which performs the resource scheduling. In this way, we begin with the objective function presented in Equation (1). For each period t, the operation costs are minimized according to the resource availability. Since load shifting considers changes and/or transfers of consumption amongst distinct periods, the optimization is made for all periods at the same time, which increases the methodological complexity and amount of input data.
Equations presented in (2) and (3) are related to the network operation conditions defining the power flows, active and reactive, respectively.
These equations take into account the voltage and respective angle limits, assuring quality in the energy delivery to the consumers—Equation (4). Equation (5) shows how the energy transitions occur in each bus, maintaining the balance of the network. For this, the aggregator can use several available resources, such as DR and distributed generators. The equations in (6) reflect the operation conditions of the distributed generators, regarding active and reactive components. The same applies to the equations presented in (7), in relation to the external suppliers.
Now concerning the demand response programs, in Equation (8) it is shown the conditions for a load reduction program, where energy curtailment is continuous, instead of discrete as in the load curtailment program—Equation (9), subject to a binary variable for decision making regarding the scheduling or not of a given consumer.
The load shifting program conditions are defined by Equations (10) to (12), based on [42]. This program intends to allow the consumer to transfer loads between the periods considered, thus improving the aggregator operation flexibility.
4. Case Study
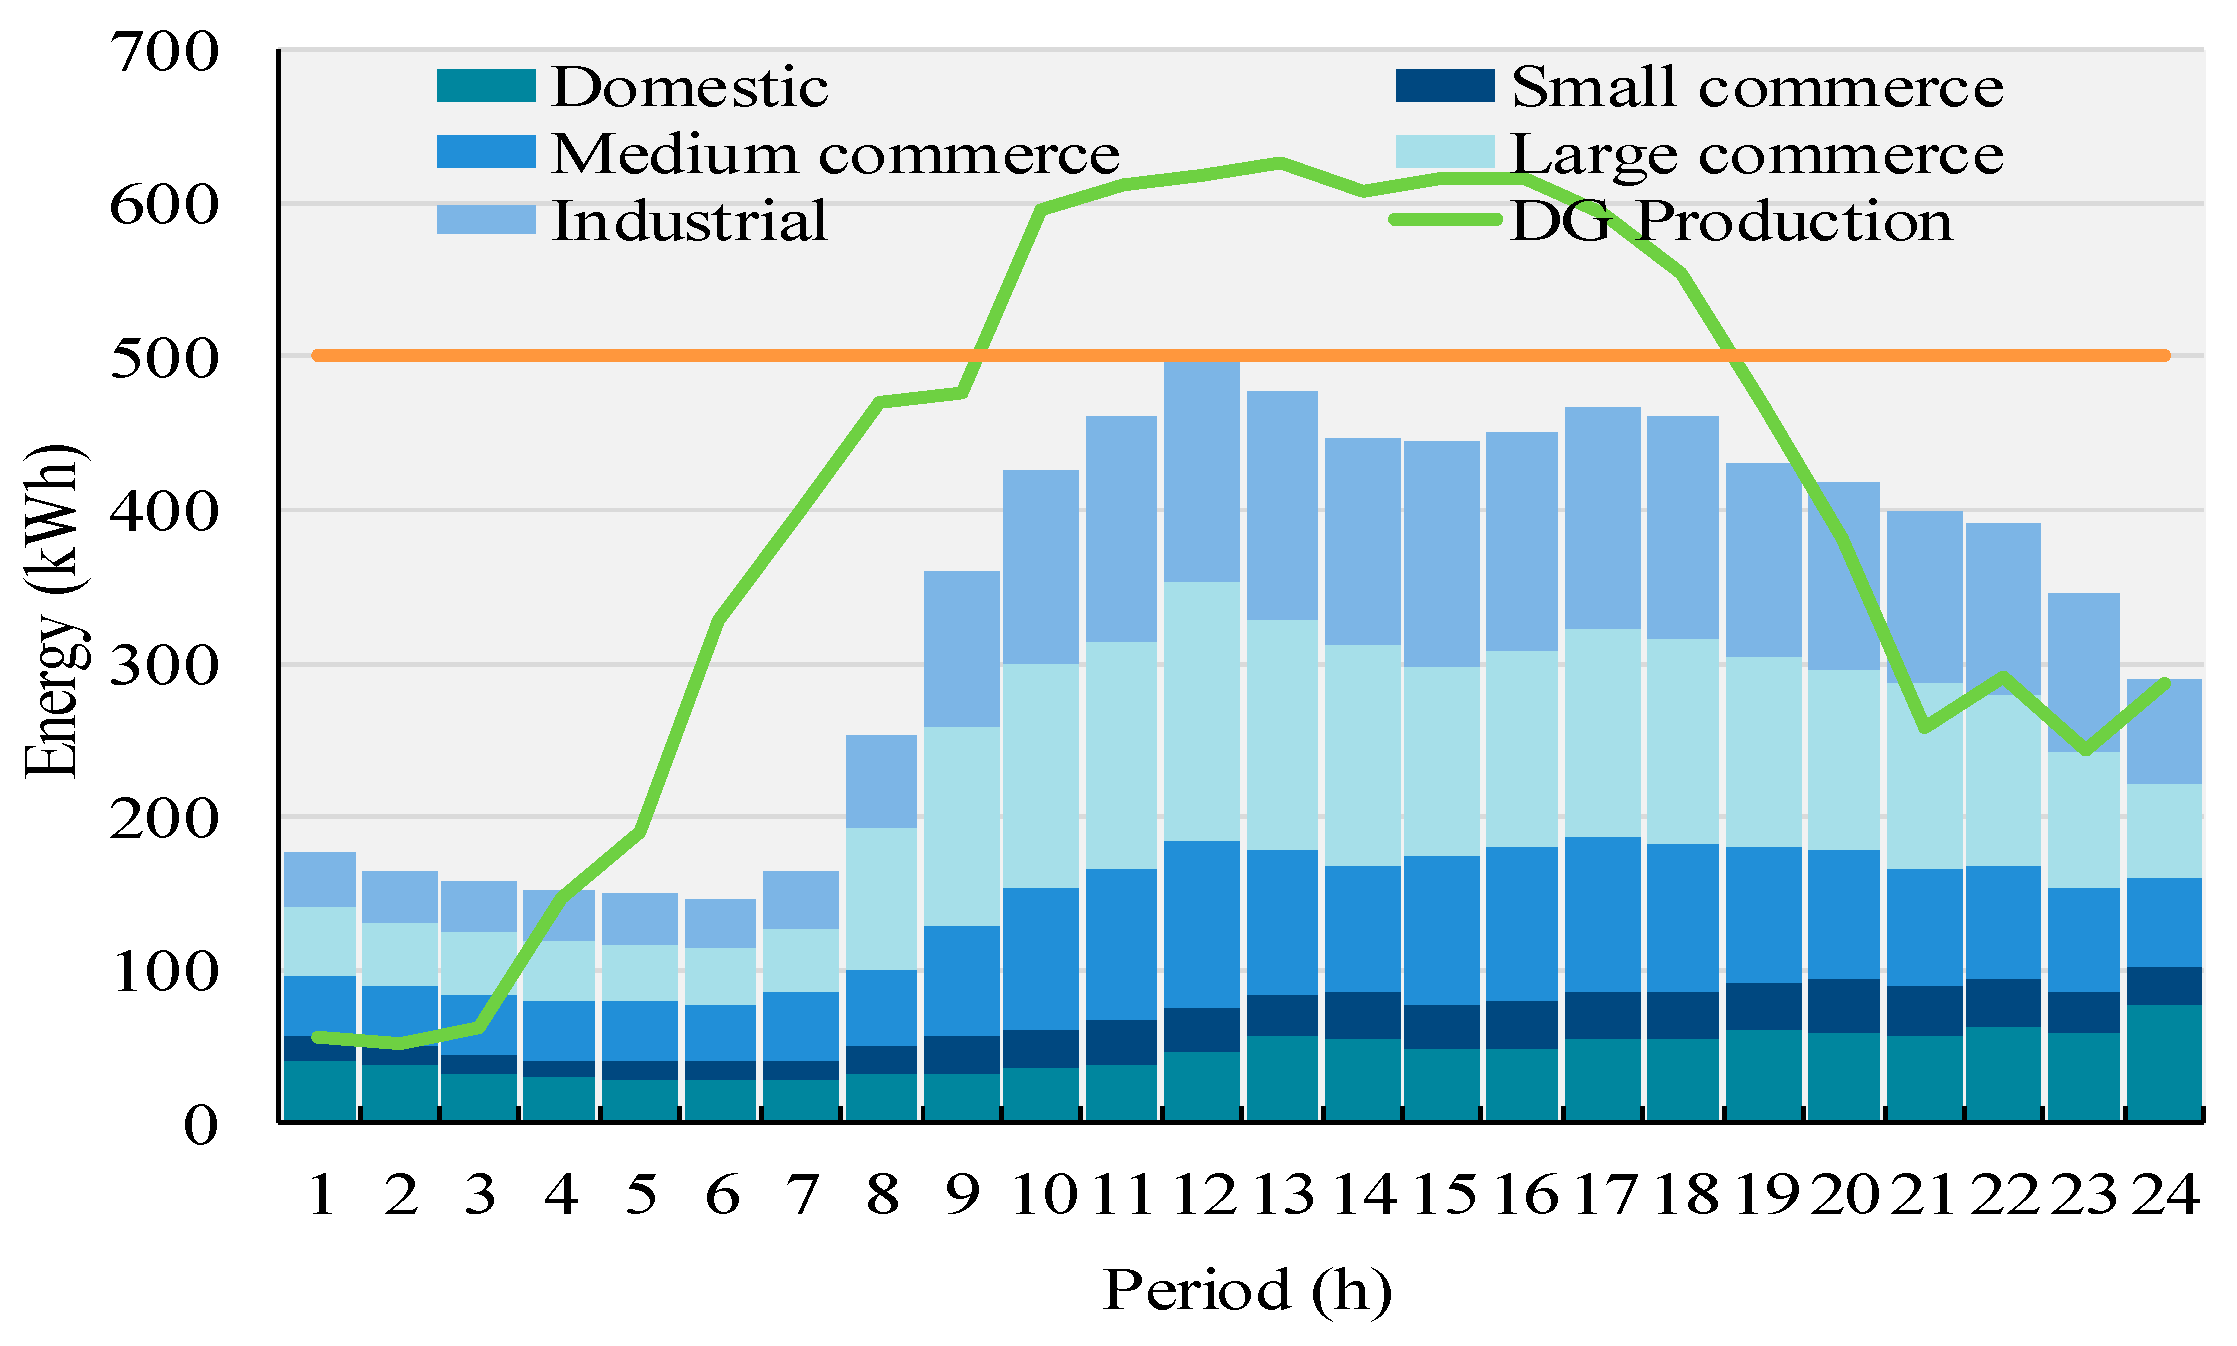
The case study used to validate the proposed methodology corresponds to a Portuguese university campus [43]. The network is composed by 21 buses, allocating 20 consumers and 26 production units. The consumers and producers are classified according to Table 2. The consumers will be defined by their average daily consumption. In Figure 2, the data for consumption and production are presented for the considered periods.
The same figure shows that consumption tends to increase during the day, mainly in the morning until noon, after which it decreases slightly through the afternoon, rising again at the end of the afternoon.
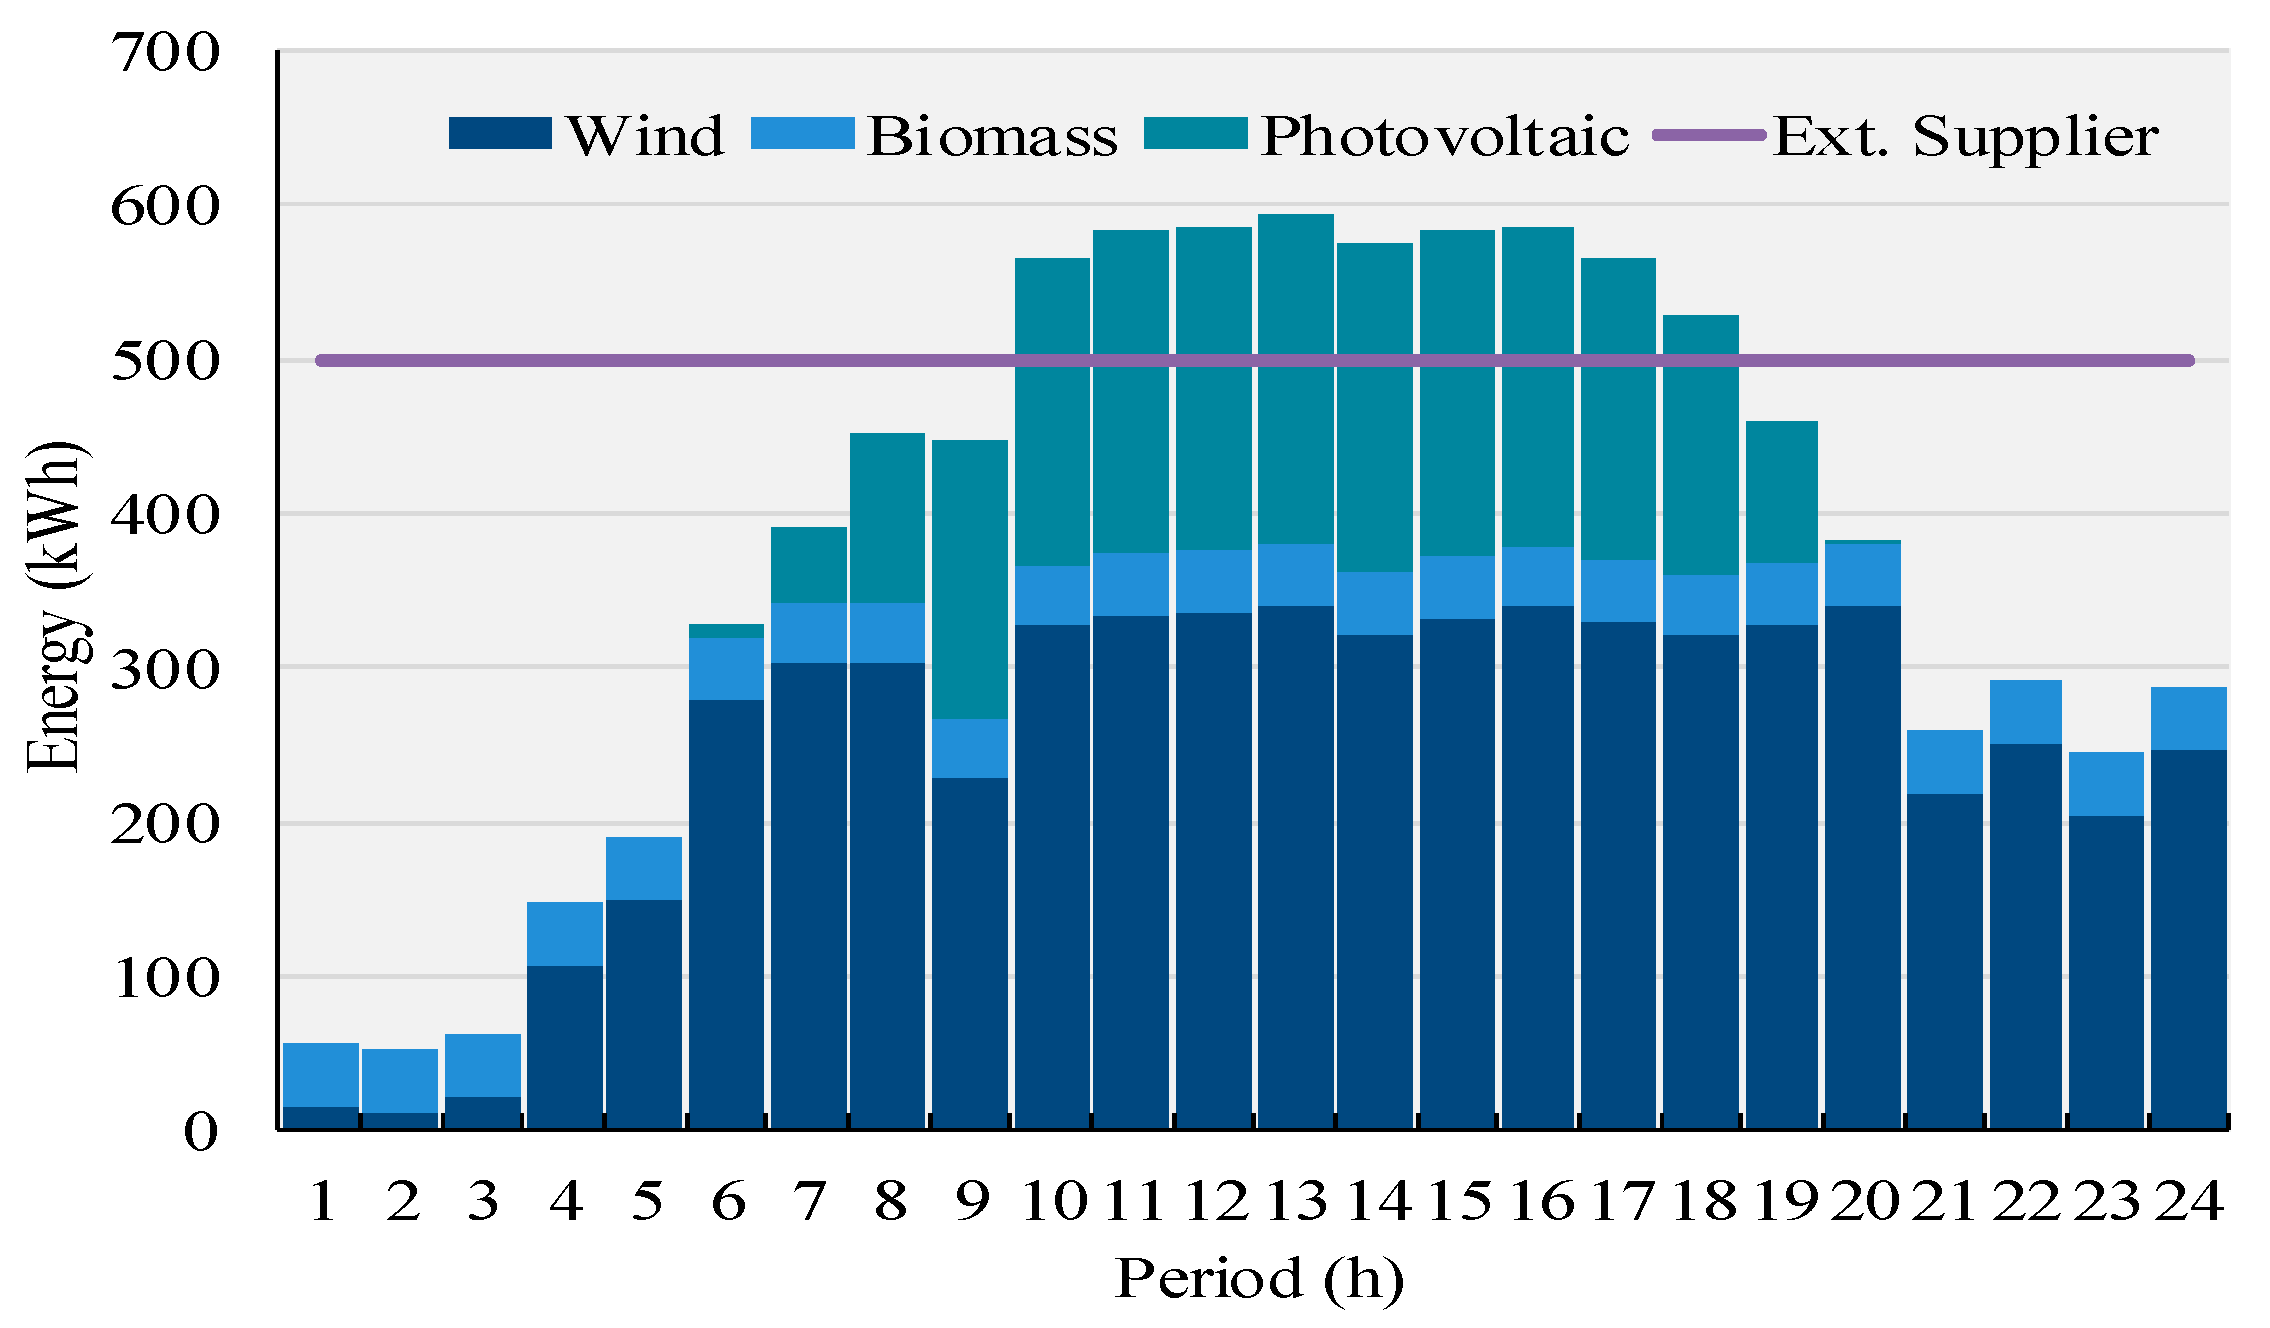
At night, the consumption is residual due to consumer’s behavior, as the generation is also affected due to the lack of photovoltaic production. The external supplier makes available a constant output equal to 500 kWh in all periods, thus providing a solution for when distributed generation is not sufficient to satisfy consumption. Figure 3 shows the available production along the considered periods.
In terms of network characteristics, Table 3 shows the considered parameters regarding the branches and buses that compose the network. The voltage limits in every bus are from 0.95 to 1.05 p.u., while voltage angle limits are from to .
5. Results
In this section, the results are shown and analyzed for the considered case study. The scheduling of resources is discussed in Subsection 5.1, the results for aggregation are presented in Subsection 5.2, and the remuneration of resources is presented in Subsection 5.3.
The proposed methodology is classified as a mixed-integer non-linear problem, since there are binary variables and non-linear operations in some constraints. These considerably increase the complexity of the problem. As for the objective function, all of its components are linear. This methodology is fully implemented in MATLAB®, through the use of the TOMLAB®/TOMSYM environment.
5.1. Scheduling of Resources
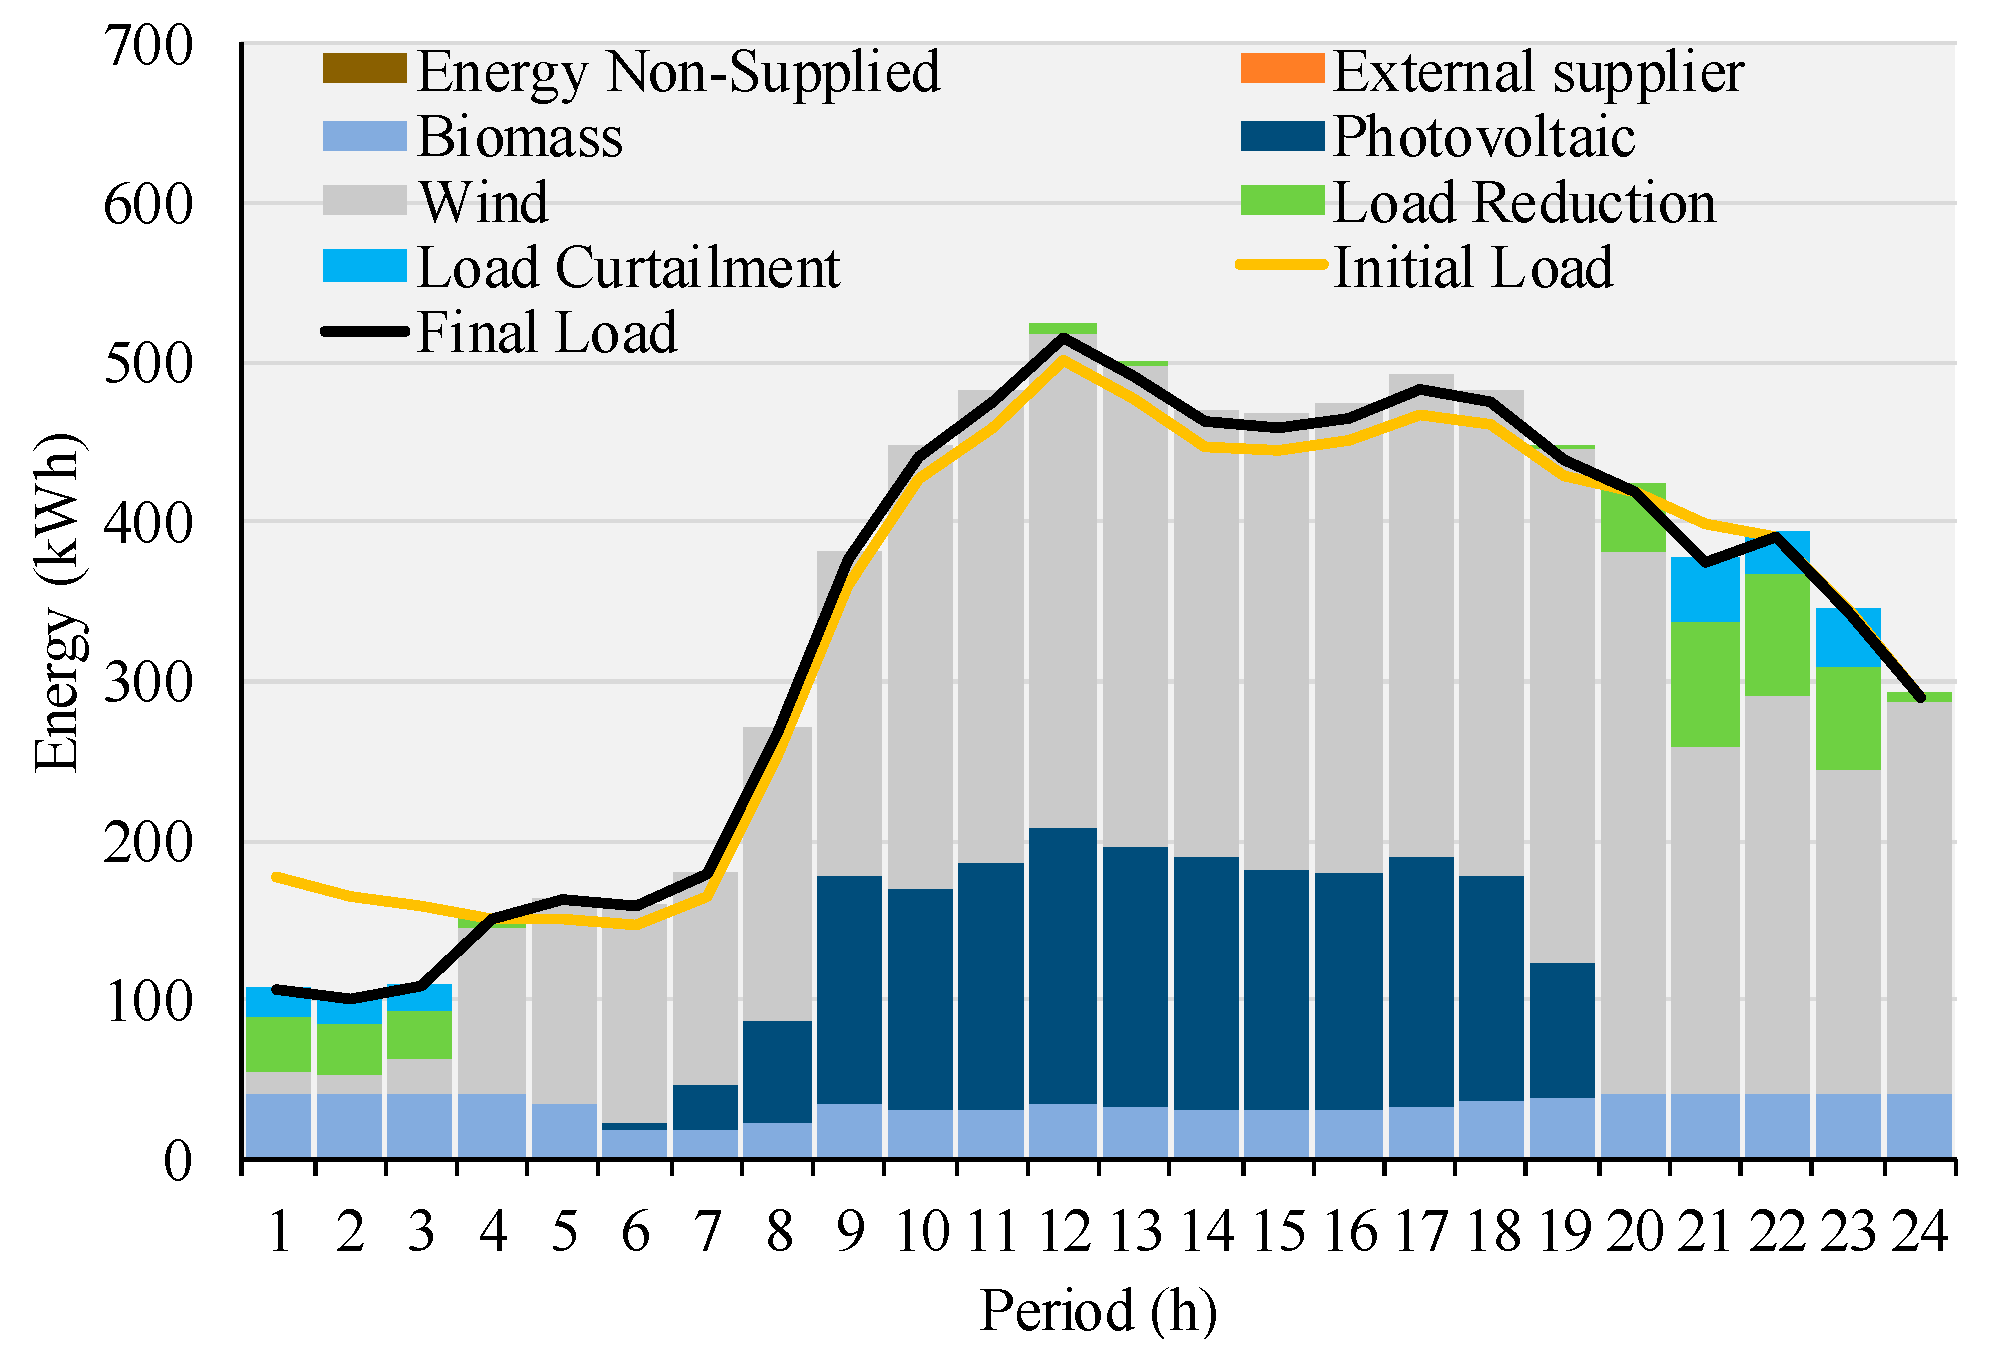
In this subsection, the results of the scheduling are addressed, taking into account the energy scheduled for the several types of resources considered, for each period. In this way, results are shown in Figure 4.
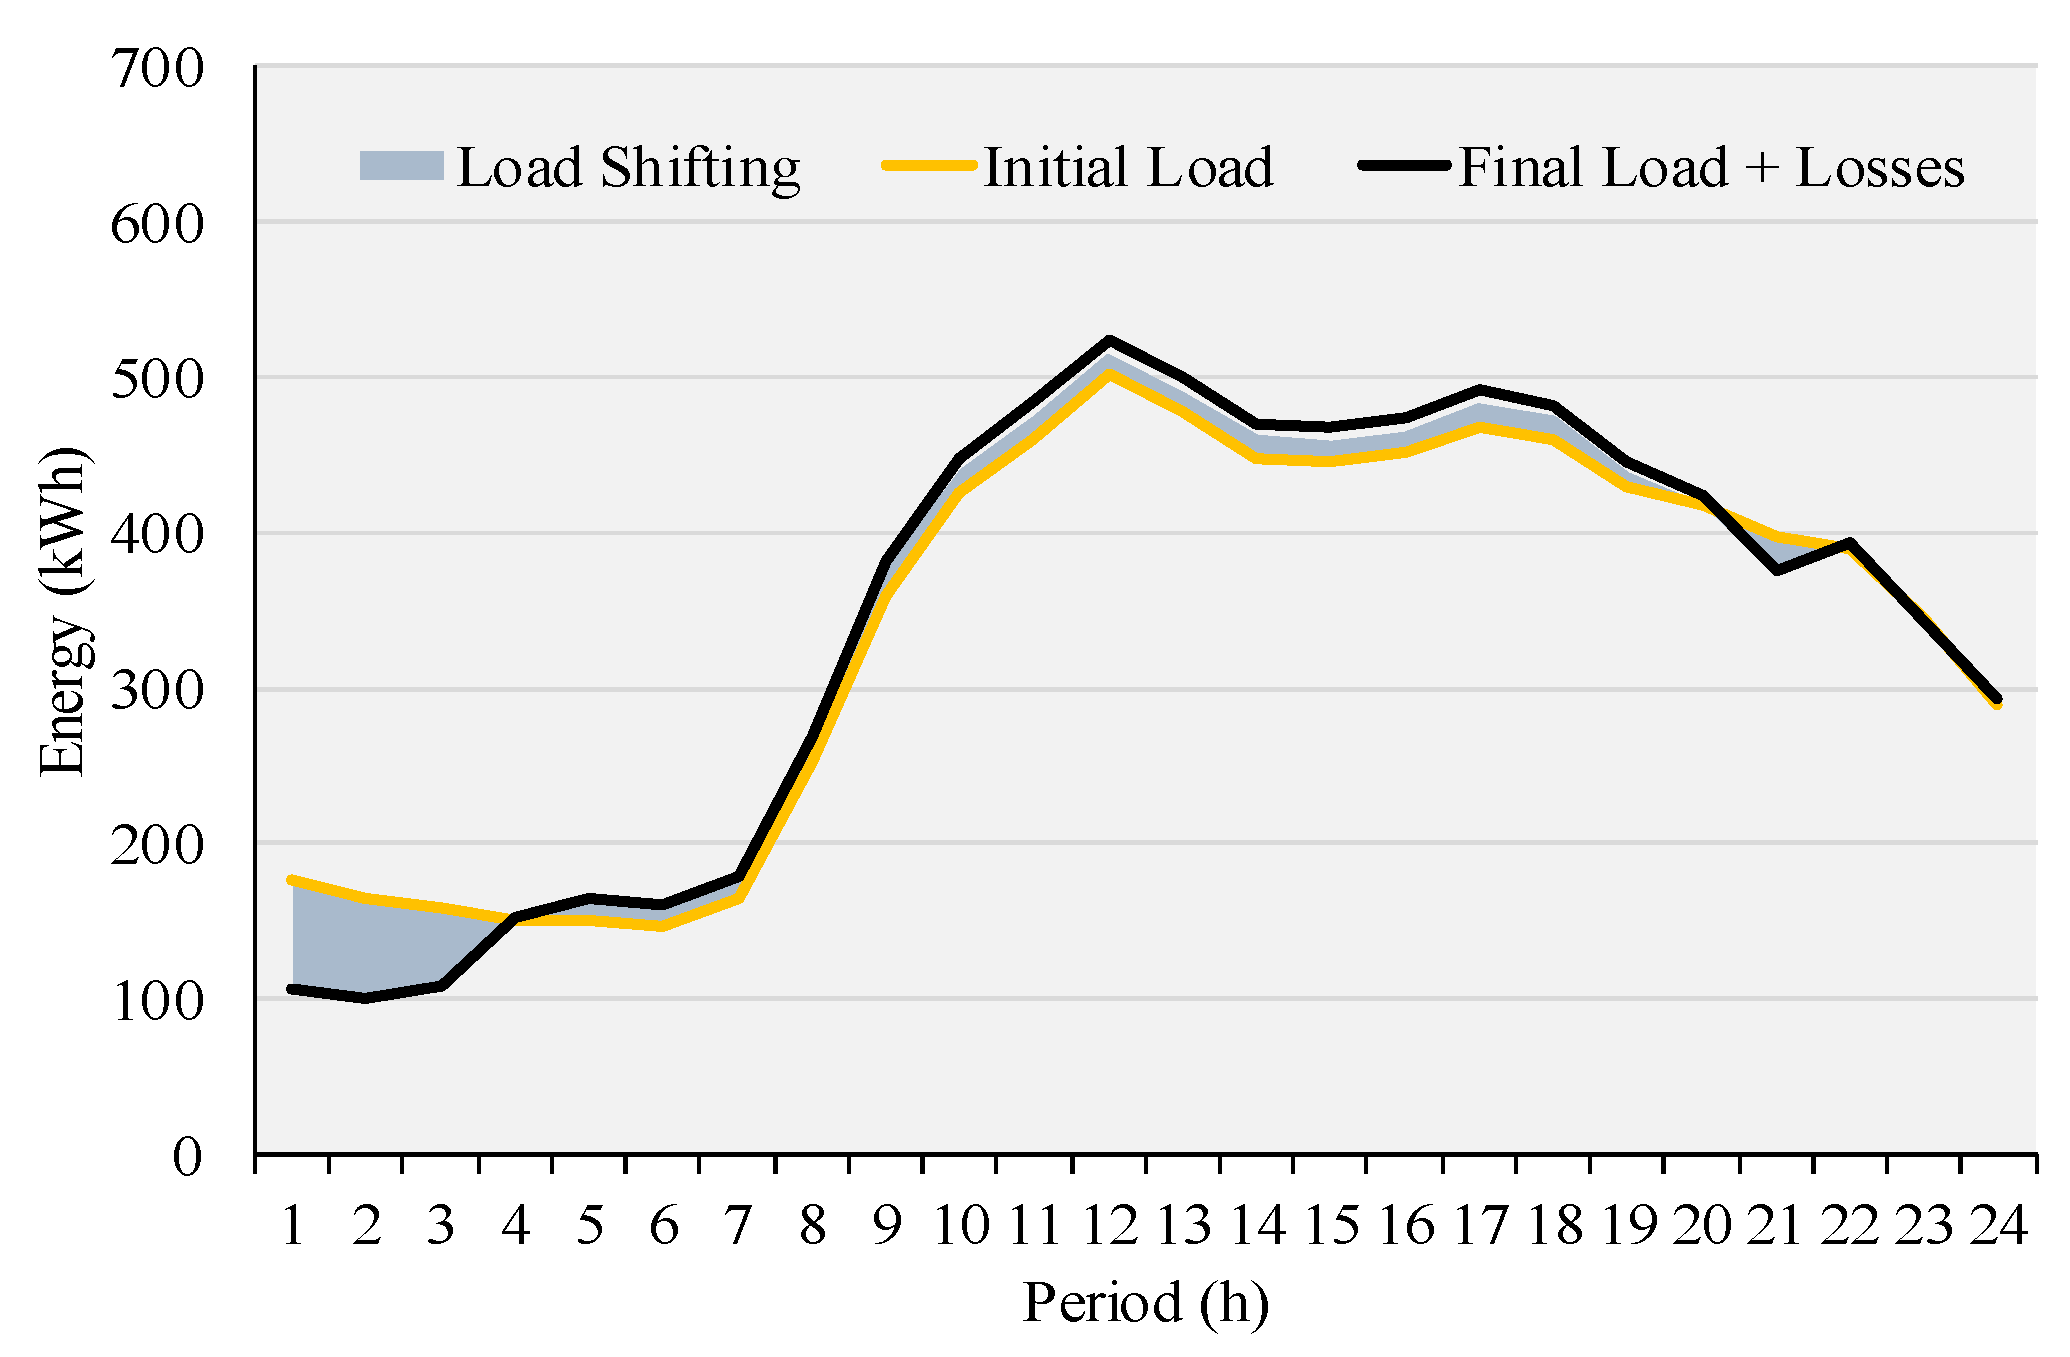
The scheduling results show a large penetration of distributed generation, with a certain level of demand response utilization, namely, through load reduction and curtailment programs. Also, regarding the shifting of consumption, results show that certain periods are more convenient to consume energy than others, namely, the optimization shows that consumption in the night (hours 1 to 3) has been reduced in order to be consumed, in its majority, along the day taking advantage of the available photovoltaic energy.
The energy losses are also accounted, being summed to the initial consumption values, according to the load shifting made, as shown in Figure 5.
In this way, the aggregator obtains the cost minimization through the use of distributed resources, with a focus on distributed generation, but using demand flexibility to adjust consumption according to the context of available production-side resources. The optimization run time is 55 min for the proposed case study, obtaining a total cost of 64.56 m.u. for the aggregator. This shows that currently, the optimization is not suitable to be applied in closer to real-time problems, i.e., the aggregator must have enough time to obtain the solution and deal with other issues regarding the implementation of resources and market participation.
The complexity of the problem increases significantly when considering that the aggregator is responsible for the technical verification of the network, i.e., the solution presented by it regarding the scheduling of resources must be in accordance with technical limits of the physical network. In this way, the equations of AC power flow make the optimization problem become included in the class of mixed-integer non-linear programming (MINLP), which increases significantly the complexity, and consequently requires a higher computation time. In real applications, the entities (transmission system operators, distribution system operators, balance responsible parties, aggregators) that manage the physical operation of the network are not keen on using AC power flow calculations due to the issues referred to above (computation time and complexity), for which results may be needed with more time in advance. Instead they commonly use DC power flow calculation, allowing some simplifications regarding its implementation when compared with the AC. The choice of using AC power flow in this paper is based on the consideration of day-head planning by the aggregator and the dimension of the network being relatively small. Thus, the computation time and the complexity of the problem can be solved in useful time, taking into consideration the planning horizon and network considered.
5.2. Aggregation of Resources
The aggregation results are related to the resource distributions inside each group, for a total of K number of groups. The aggregation is based on the K-Means clustering algorithm, and its inputs are the scheduled energy obtained before in the optimization, and the respective costs considered. The aggregation methods are applied for each period individually, i.e., a period must be chosen to undertake the aggregation analysis. Thus, the results shown in this subsection are relative to period 12. Firstly, it is presented the results regarding the method that does not require the clustering algorithm, the third, shown in Table 4. Regarding the methods 1 and 2, these are shown in Table 5.
The results regarding all the methods for producers show that the resource distribution starts to be affected in the third cluster scenario; the total number of groups equal to 6. For consumers, the type of method used and the cluster scenario change the distribution of resources amongst the groups.
One can see that in the third method of aggregation, it is obtained the groups according to the resource classification; however, this can also be seen through the other methods. Taking into consideration each group’s total schedule, there are groups with the same amount in the different methods, for example, 34.34 kWh is the biomass resource group in aggregation method 3, but also group 3 in method 1, and group 3 in method 2 has the same total energy scheduled. This can also be seen considering the photovoltaic resource’s group in method 3 (310.26), with group 2 and 1 from method 1 and 2, respectively.
This suggests that the clustering k-means, given the energy scheduled and cost, can identify this pattern of producer’s type without actually being served as input. These group similarities between methods starts to fade with the increase in the number of groups when considering the methods 1 and 2, since method 3 remains the same. Regarding the consumer’s clustering, these similarities mentioned before can also be seen, especially for industrial consumers that retain the same amount of energy schedule through the different methods and clustering scenarios.
5.3. Remuneration of Resources
In this subsection, it is presented the remuneration methods mentioned before in Section 2. In this way, four different sets of results are obtained, where two of these are applicable without aggregation results (methods 1 and 4), and the other two are applicable based on the groups formed (methods 2 and 3).
The results obtained for the remuneration methods are presented in Table 6. The results show that the clustering scenarios and remuneration methods have an influence on the aggregator’s operation costs.
6. Discussion
In Table 6, the “Total” rows always represent the total remuneration value in monetary units (m.u.). In methods, the headline is “Payment”; the row mentioned before is the sum of these values, whereas in the methods the headline is “Tariff”; the row mentioned before is the sum of the product between the tariff obtained and energy in each group.
In the remuneration results, the similarities between the methods are less evident and noticeable, since they consider different approaches to the resource remuneration, i.e., distinct price designs are applied. One can see that for the case study and clustering scenarios considered, the total remuneration amongst the several methods does not change until the total number of groups formed is equal to 6, and even so, few methods modify (method 3 for producers and method 2 for consumers), i.e., for a total number of groups equal to 4 and 5, the remuneration results stay the same. Also, one can notice that when a change in remuneration occurs due to clustering scenarios, this remuneration decreases regarding the previous clustering scenario. However, this observation is only valid for the case study considered with its resource’s characteristics, since this analysis can be different when addressing other networks or set of resources.
The aggregator with this price information can then choose the most beneficial regarding its actual operation context, for example, if the aggregator has the need to induce more participation from consumers in future demand response events, the maximum price per group method (method 2) guarantees that consumers will most likely want to participate due to the incentive that this method produces by over-remunerating some of the participants (with a price lower than the highest in the group).
In order to discuss the relevance and actual value of the proposed methodology in comparison with other remuneration approaches, the comparison with an approach where the resources are paid according to their availability must be done. In fact, this is a common approach that considers a non-discriminatory use of all the resources by paying all of them for all of the available generation and for all the provided demand reduction. In this way, if the aggregator is using such an approach instead of using the proposed scheduling/aggregation/remuneration methodology in which the resources are used as optimally scheduled, the remuneration costs would be 33.31 m.u. and 3.85 m.u., respectively, for producers and consumers. These remuneration values, compared to the ones in Table 6, show that the proposed methodology can provide lower remuneration costs of the aggregator, which is an advantage for the proposed methodology.
7. Conclusions
This paper presents an approach for decision support regarding the aggregator’s activities that include several tools for the context of its operation. The aggregator is seen as the manager of a small network region, acting as an operator in what concerns the scheduling computation. Distributed generation and distinct demand response resources and programs are considered in this paper to address the scheduling by the aggregator, later developing clustering and remuneration methods to allow the aggregator to better fit these processes given its operation context.
In this way, the presented methodology aims at the minimization of operation costs for the aggregator using the available distributed resources and others that may exist, such as external suppliers, while implementing and insuring the correct solution given the restrictions of operation and of the resources included. The optimization is performed for every period considered at the same time, allowing changes amongst these with the implementation of a load shifting program. This allows the aggregator to be aware of every modification in the controlled region, and thus make easier the balance of that region even with the application of demand response programs that alter the expected consumption level.
A case study with 20 consumers and 26 generators (of which 25 are distributed and are included in the network) of several types has been used to show the application of the presented methodology. The network parameters are also considered in order to guarantee that the solution obtained is feasible for the network’s operation.
The clustering and remuneration results presented allow an analysis of the distributed resources being used in market negotiation and support the viable and successful operation of the aggregator together with the scheduling of the resources.
Author Contributions:
Conceptualization, P.F. and Z.V.; Methodology, P.F.; Software, J.S.; Validation, P.F.; Formal Analysis, P.F.; Data Curation, J.S.; Writing-Original Draft Preparation, J.S.; Writing-Review & Editing, P.F.
Funding
This work has received funding from the following projects: GREEDi Project (ANI | P2020); and from FEDER Funds through COMPETE program and from National Funds through FCT under the project UID/EEA/00760/2013. This work was also supported by the European Union’s Horizon 2020 Research and Innovation Programme under the Marie Sklodowska-Curie Grant Agreement 641794–DREAM-GO Project.
Conflicts of Interest
The authors declare no conflict of interest.
Nomenclature
| Variables | |
| Amount of active energy acquired from the distributed generator p, in period t | |
| Amount of reactive energy acquired from the distributed generator p, in period t | |
| Amount of active energy acquired from the external supplier s, in period t | |
| Amount of reactive energy acquired from the external supplier s, in period t | |
| Amount of energy reduced by the consumer c, in period t | |
| Amount of energy curtailed by the consumer c, in period t | |
| Binary variable, deciding when to perform curtailment of the consumer c, in period t | |
| Amount of energy non-supplied to the consumer c, in period t | |
| Amount of energy shifted by the consumer c, from period t to period d | |
| Voltage level in bus i, in period t | |
| Voltage angle level in bus i, in period t | |
| Parameters | |
| Linear cost for the distributed generator p, in period t | |
| Cost from acquiring energy from the external supplier s, in period t | |
| Cost from reducing energy supply from the consumer c, in period t | |
| Cost from curtailing energy supply from the consumer c, in period t | |
| Cost from energy non-supplied to the consumer c, in period t | |
| Cost from shifting energy supply from the consumer c, in period t | |
| Conductance value of the line connecting bus i to bus j | |
| Susceptance value of the line connecting bus i to bus j | |
| Amount of expected active consumption from consumer c, in period t | |
| Amount of expected reactive consumption from consumer c, in period t | |
| Minimum value for voltage at bus i, in period t | |
| Minimum value for voltage angle at bus i, in period t | |
| Maximum value for voltage at bus i, in period t | |
| Maximum value for voltage angle at bus i, in period t | |
| Minimum amount of active energy available for the on-site or distributed generator p, in period t | |
| Minimum amount of reactive energy available for the on-site or distributed generator p, in period t | |
| Maximum amount of active energy available for the on-site or distributed generator p, in period t | |
| Maximum amount of reactive energy available for the on-site or distributed generator p, in period t | |
| Minimum amount of active energy available by the external supplier s, in period t | |
| Minimum amount of reactive energy available for the external supplier s, in period t | |
| Maximum amount of active energy available for the external supplier s, in period t | |
| Maximum amount of reactive energy available for the external supplier s, in period t | |
| Maximum amount of consumption reduction from consumer c, in period t | |
| Maximum amount of consumption curtailment from consumer c, in period t | |
| Minimum amount of energy shifted from period t to period d, by consumer c | |
| Maximum amount of energy shifted from period t to period d, by the consumer c | |
| Maximum amount of energy shifted from period t to all other periods, by the consumer c | |
| Maximum amount of energy shifted to period t from all other periods, by the consumer c | |
| Indexes | |
| Total number of distributed generators | |
| Total number of external suppliers | |
| Total number of consumers | |
| Total number of periods | |
| Total number of buses | |
Acronyms
| DR | Demand Response |
| DG | Distributed Generation |
| HV | High Voltage |
| VHV | Very High Voltage |
References
- Loßner, M.; Böttger, D.; Bruckner, T. Economic assessment of virtual power plants in the German energy market—A scenario-based and model-supported analysis. Energy Econ. 2017, 62, 125–138. [Google Scholar] [CrossRef]
- Othman, M.M.; Hegazy, Y.G.; Abdelaziz, A.Y. Electrical energy management in unbalanced distribution networks using virtual power plant concept. Electr. Power Syst. Res. 2017, 145, 157–165. [Google Scholar] [CrossRef]
- Shayegan-Rad, A.; Badri, A.; Zangeneh, A. Day-ahead scheduling of virtual power plant in joint energy and regulation reserve markets under uncertainties. Energy 2017, 121, 114–125. [Google Scholar] [CrossRef]
- Oliveira, P.; Pinto, T.; Morais, H.; Vale, Z.A.; Praca, I. MASCEM—An Electricity Market Simulator providing Coalition Support for Virtual Power Players. In Proceedings of the 2009 15th International Conference on Intelligent System Applications to Power Systems, Curitiba, Brazil, 8–12 November 2009; pp. 1–6. [Google Scholar]
- Roos, A.; Ottesen, S.Ø.; Bolkesjø, T.F. Modeling Consumer Flexibility of an Aggregator Participating in the Wholesale Power Market and the Regulation Capacity Market. Energy Procedia 2014, 58, 79–86. [Google Scholar] [CrossRef]
- Tang, Y.; Zhang, S.; Liu, Y. Incentive payment design for electricity demand response. In Proceedings of the 2011 International Conference on Management and Service Science (MASS 2011), Wuhan, China, 12–14 August 2011. [Google Scholar]
- Mahmoudi, N.; Heydarian-Forushani, E.; Shafie-khah, M.; Saha, T.K.; Golshan, M.E.H.; Siano, P. A bottom-up approach for demand response aggregators’ participation in electricity markets. Electr. Power Syst. Res. 2017, 143, 121–129. [Google Scholar] [CrossRef]
- Santos, G.; Pinto, T.; Morais, H.; Sousa, T.M.; Pereira, I.F.; Fernandes, R.; Praca, I.; Vale, Z. Multi-agent simulation of competitive electricity markets: Autonomous systems cooperation for European market modeling. Energy Convers. Manag. 2015, 99, 387–399. [Google Scholar] [CrossRef]
- Lakshmanan, V.; Marinelli, M.; Kosek, A.M.; Nørgård, P.B.; Bindner, H.W. Impact of thermostatically controlled loads’ demand response activation on aggregated power: A field experiment. Energy 2016, 94, 705–714. [Google Scholar] [CrossRef] [Green Version]
- Bel, C.Á.; Ortega, M.A.; Escrivá, G.E.; Marín, A.G. Technical and economical tools to assess customer demand response in the commercial sector. Energy Convers. Manag. 2009, 50, 2605–2612. [Google Scholar] [Green Version]
- Morais, H.; Sousa, T.; Soares, J.; Faria, P.; Vale, Z. Distributed energy resources management using plug-in hybrid electric vehicles as a fuel-shifting demand response resource. Energy Convers. Manag. 2015, 97, 78–93. [Google Scholar] [CrossRef]
- Paterakis, N.G.; Erdinç, O.; Catalão, J.P.S. An overview of Demand Response: Key-elements and international experience. Renew. Sustain. Energy Rev. 2017, 69, 871–891. [Google Scholar] [CrossRef]
- Liu, Y. Demand response and energy efficiency in the capacity resource procurement: Case studies of forward capacity markets in ISO New England, PJM and Great Britain. Energy Policy 2017, 100, 271–282. [Google Scholar] [CrossRef]
- Faria, P.; Spínola, J.; Vale, Z. Aggregation and Remuneration of Electricity Consumers and Producers for the Definition of Demand-Response Programs. IEEE Trans. Ind. Inform. 2016, 12, 952–961. [Google Scholar] [CrossRef]
- Vergados, D.J.; Mamounakis, I.; Makris, P.; Varvarigos, E. Prosumer clustering into virtual microgrids for cost reduction in renewable energy trading markets. Sustain. Energy Grids Netw. 2016, 7, 90–103. [Google Scholar] [CrossRef]
- Gan, G.; Ma, C.; Wu, J. Data Clustering: Theory, Algorithms, and Applications; Society for Industrial and Applied Mathematics: Philadelphia, PA, USA, 2007. [Google Scholar]
- Xu, R.; Wunsch, D. Survey of clustering algorithms. IEEE Trans. Neural Netw. 2005, 16, 645–678. [Google Scholar] [CrossRef] [PubMed]
- Ramos, S.; Duarte, J.M.M.; Soares, J.; Vale, Z.; Duarte, F.J. Typical load profiles in the smart grid context—A clustering methods comparison. In Proceedings of the 2012 IEEE Power and Energy Society General Meeting, San Diego, CA, USA, 22–26 July 2012; pp. 1–8. [Google Scholar]
- Grünewald, P.; Torriti, J. Demand response from the non-domestic sector: Early UK experiences and future opportunities. Energy Policy 2013, 61, 423–429. [Google Scholar] [CrossRef]
- Fera, M.; Macchiaroli, R.; Iannone, R.; Miranda, S.; Riemma, S. Economic evaluation model for the energy Demand Response. Energy 2016, 112, 457–468. [Google Scholar] [CrossRef]
- Favuzza, S.; Galioto, G.; Ippolito, M.G.; Massaro, F.; Milazzo, F.; Pecoraro, G.; Sanseverino, E.R.; Telaretti, E. Real-time pricing for aggregates energy resources in the Italian energy market. Energy 2015, 87, 251–258. [Google Scholar] [CrossRef]
- Jin, M.; Feng, W.; Liu, P.; Marnay, C.; Spanos, C. MOD-DR: Microgrid optimal dispatch with demand response. Appl. Energy 2017, 187, 758–776. [Google Scholar] [CrossRef]
- Motalleb, M.; Thornton, M.; Reihani, E.; Ghorbani, R. Providing frequency regulation reserve services using demand response scheduling. Energy Convers. Manag. 2016, 124, 439–452. [Google Scholar] [CrossRef]
- Mancera, C.T.; Monroy, A.C. Pricing of distribution networks with distributed generation: Application of nodal pricing. In Proceedings of the 2011 IEEE PES Conference on Innovative Smart Grid Technologies Latin America (ISGT LA), Medellin, Colombia, 19–21 October 2011. [Google Scholar]
- Sahriatzadeh, F.; Nirbhavane, P.; Srivastava, A.K. Locational marginal price for distribution system considering demand response. In Proceedings of the 2012 North American Power Symposium (NAPS), Champaign, IL, USA, 9–11 September 2012. [Google Scholar]
- Bai, L.; Wang, J.; Wang, C.; Chen, C.; Li, F. Distribution Locational Marginal Pricing (DLMP) for Congestion Management and Voltage Support. IEEE Trans. Power Syst. 2018, 33, 4061–4073. [Google Scholar] [CrossRef]
- Liu, W.; Wu, Q.; Wen, F.; Østergaard, J. Day-Ahead Congestion Management in Distribution Systems through Household Demand Response and Distribution Congestion Prices. IEEE Trans. Smart Grid 2014, 5, 2739–2747. [Google Scholar] [CrossRef]
- Mercure, J.; Salas, P. On the global economic potentials and marginal costs of non-renewable resources and the price of energy commodities. Energy Policy 2013, 63, 469–483. [Google Scholar] [CrossRef]
- Giselsson, P.; Boyd, S. Linear Convergence and Metric Selection for Douglas-Rachford Splitting and ADMM. IEEE Trans. Autom. Control 2017, 62, 532–544. [Google Scholar] [CrossRef] [Green Version]
- Wang, Y.; Boyd, S. Fast Model Predictive Control Using Online Optimization. IEEE Trans. Control Syst. Technol. 2010, 18, 267–278. [Google Scholar] [CrossRef] [Green Version]
- Sathyanarayana, B.R.; Heydt, G.T. Sensitivity-Based Pricing and Optimal Storage Utilization in Distribution Systems. IEEE Trans. Power Deliv. 2013, 28, 1073–1082. [Google Scholar] [CrossRef]
- Caramanis, M.; Ntakou, E.; Hogan, W.W.; Chakrabortty, A.; Schoene, J. Co-Optimization of Power and Reserves in Dynamic T&D Power Markets with Nondispatchable Renewable Generation and Distributed Energy Resources. Proc. IEEE 2016, 104, 807–836. [Google Scholar]
- Molzahn, D.K.; Dörfler, F.; Sandberg, H.; Low, S.H.; Chakrabarti, S.; Baldick, R.; Lavaei, J. A Survey of Distributed Optimization and Control Algorithms for Electric Power Systems. IEEE Trans. Smart Grid 2017, 8, 2941–2962. [Google Scholar] [CrossRef]
- Agamah, S.; Ekonomou, L. Energy storage system scheduling for peak demand reduction using evolutionary combinatorial optimization. Sustain. Energy Technol. Assess. 2017, 23, 73–82. [Google Scholar]
- Nieto, A.; Vita, V.; Ekonomou, L.; Mastorakis, N.E. Economic analysis of energy storage system integration with a grid connected intermittent power plant, for power quality purposes. WSEAS Trans. Power Syst. 2016, 11, 65–71. [Google Scholar]
- Bjerketvedt, V.S.; Kristiansen, M.; Korpaas, M. Analyzing the investment impact of strategic players with market power. In Proceedings of the 51st International Universities Power Engineering Conference (UPEC), Coimbra, Portugal, 6–9 September 2016. [Google Scholar]
- Caramanis, M.C.; Goldis, E.; Ruiz, P.A.; Rudkevich, A. Power market reform in the presence of flexible schedulable distributed loads. New bid rules, equilibrium and tractability issues. In Proceedings of the 50th Annual Allerton Conference on Communication, Control, and Computing (Allerton), Monticello, IL, USA, 1–5 October 2012. [Google Scholar]
- Spínola, J.; Faria, P.; Vale, Z. Remuneration of distributed generation and demand response resources considering scheduling and aggregation. In Proceedings of the IEEE Power and Energy Society General Meeting, Denver, CO, USA, 26–30 July 2015. [Google Scholar]
- Faria, P.; Vale, Z. Remuneration structure definition for distributed generation units and demand response participants aggregation. In Proceedings of the 2014 IEEE PES General Meeting|Conference & Exposition, National Harbor, MD, USA, 27–31 July 2014; pp. 1–5. [Google Scholar]
- Scherer, M.; Haubensak, O.; Staake, T. Assessing distorted trading incentives of balance responsible parties based on the example of the Swiss power system. Energy Policy 2015, 86, 792–801. [Google Scholar] [CrossRef]
- Patrinos, P.; Bernardini, D.; Maffei, A.; Jokic, A.; Bemporad, A. Two-time-scale MPC for Economically Optimal Real-time Operation of Balance Responsible Parties. IFAC Proc. 2012, 45, 741–746. [Google Scholar] [CrossRef] [Green Version]
- Faria, P.; Vale, Z.; Baptista, J. Constrained consumption shifting management in the distributed energy resources scheduling considering demand response. Energy Convers. Manag. 2015, 93, 309–320. [Google Scholar] [CrossRef] [Green Version]
- Silva, M.; Fernandes, F.; Morais, H.; Ramos, S.; Vale, Z. Hour-ahead energy resource management in university campus microgrid. In Proceedings of the 2015 IEEE Eindhoven PowerTech, Eindhoven, The Netherlands, 29 June–2 July 2015; pp. 1–6. [Google Scholar]
Figure 1.
Possible aggregator roles in the energy system.

Figure 2.
Consumption and production data considered before scheduling.

Figure 3.
Available production by type of source.

Figure 4.
Results of the scheduling of resources.

Figure 5.
Consumption and losses detail.


Table 1.
Considerations for the application of the aggregation and remuneration methods.
| Methods | Description | # | |
|---|---|---|---|
| Aggregation | Observation Average (individual) | Only one observation of the variables considered will enter the aggregation algorithm | 1 |
| Nº periods = Nº of observations | All observations from the variables considered will enter the aggregation algorithm | 2 | |
| Type | The resources are grouped based on their type (domestic, wind, etc.), thus without application of K-Means algorithm | 3 | |
| Remuneration | Individual Price | The resources in any group are remunerated at their cost considered in the scheduling | 1 |
| Max. Price in Group | The resources in each group are remunerated based on the highest price in that group | 2 | |
| Price average in group | The resources in each group are remunerated based on the average price in that group | 3 | |
| Type | The resources in any group are remunerated according to their type, as in the third aggregation method | 4 | |
Table 2.
Consumers and Producers characterization.
| Resources | No. of Units | Average Price (m.u./kWh) | Load/Capacity (kWh) | ||
|---|---|---|---|---|---|
| Red. | Cut. | ||||
| Consumers | Domestic | 8 | 0.0701 | 0.0804 | 5.85 |
| Small commerce | 2 | 0.0696 | 0.0804 | 11.88 | |
| Medium commerce | 4 | 0.0678 | 0.0795 | 17.96 | |
| Large commerce | 4 | 0.0686 | 0.0807 | 24.98 | |
| Industrial | 2 | 0.0671 | 0.0798 | 48.23 | |
| Producers | Photovoltaic | 20 | 0.0509 | 5.42 | |
| Wind | 4 | 0.0567 | 62.40 | ||
| Biomass | 1 | 0.0521 | 40 | ||
| Ext. Supplier | 1 | 0.1000 | 500 | ||
Table 3.
Branch characterization.
| Line ID | R (p.u.) | X (p.u.) | Max. Power (kVA) |
|---|---|---|---|
| 1 | 0.00017 | 0.00002 | 120.6 |
| 2 | 0.00007 | 0.00004 | 276.4 |
| 3 | 0.00025 | 0.00004 | 142.7 |
| 4 | 0.00042 | 0.00006 | 133.0 |
| 5 | 0.00042 | 0.00006 | 133.0 |
| 6 | 0.00197 | 0.00004 | 37.4 |
| 7 | 0.00007 | 0.00004 | 315.9 |
| 8 | 0.00226 | 0.00008 | 52.0 |
| 9 | 0.00029 | 0.00006 | 170.4 |
| 10 | 0.00052 | 0.00007 | 133.0 |
| 11 | 0.00052 | 0.00007 | 133.0 |
| 12 | 0.00014 | 0.00009 | 251.5 |
| 13 | 0.00035 | 0.00005 | 142.7 |
| 14 | 0.00024 | 0.00010 | 239.7 |
| 15 | 0.00024 | 0.00010 | 239.7 |
| 16 | 0.00013 | 0.00005 | 237.6 |
| 17 | 0.00198 | 0.00011 | 69.3 |
| 18 | 0.00225 | 0.00012 | 69.3 |
| 19 | 0.00079 | 0.00011 | 133.0 |
| 20 | 0.00019 | 0.00012 | 251.5 |
| 21 | 0.00124 | 0.00004 | 52.0 |
| 22 | 0.00065 | 0.00008 | 120.6 |
| 23 | 0.00106 | 0.00006 | 78.3 |
Table 4.
Results for the Third Aggregation Method.
| Group | Scheduled (kWh) | # of Resources | ||
|---|---|---|---|---|
| Distributed Generation | Wind | 1 | 310.26 | 4 |
| Photovoltaic | 2 | 173.81 | 20 | |
| Biomass | 3 | 34.34 | 1 | |
| Total | 518.42 | 25 | ||
| Demand Response | Domestic | 1 | 12.21 | 8 |
| Small commerce | 2 | 3.34 | 2 | |
| Medium commerce | 3 | 12.23 | 4 | |
| Large commerce | 4 | 13.18 | 4 | |
| Industrial | 5 | 10.56 | 2 | |
| Total | 51.53 | 20 | ||
Table 5.
Results for the aggregation methods 1 and 2.
| Producers | Consumers | ||||||||
|---|---|---|---|---|---|---|---|---|---|
| Method 1 | Method 2 | Method 1 | Method 2 | ||||||
| Cluster Scenario | Group | Scheduled (kWh) | # of Resources | Scheduled (kWh) | # of Resources | Scheduled (kWh) | # of Resources | Scheduled (kWh) | # of Resources |
| K = 4 | 1 | 145.42 | 12 | 310.26 | 4 | 13.80 | 9 | 7.18 | 4 |
| 2 | 310.26 | 4 | 145.42 | 12 | 10.56 | 2 | 25.41 | 8 | |
| 3 | 34.34 | 1 | 34.34 | 1 | 13.18 | 4 | 8.37 | 6 | |
| 4 | 28.39 | 8 | 28.39 | 8 | 13.98 | 5 | 10.56 | 2 | |
| 5 | - | - | - | - | - | - | - | - | |
| 6 | - | - | - | - | - | - | - | - | |
| Total | 518.42 | 25 | 518.42 | 25 | 51.53 | 20 | 51.53 | 20 | |
| K = 5 | 1 | 28.39 | 8 | 310.26 | 4 | 13.87 | 5 | 19.27 | 6 |
| 2 | 58.40 | 5 | 12.79 | 4 | 8.37 | 6 | 3.15 | 1 | |
| 3 | 310.26 | 4 | 34.34 | 1 | 7.18 | 4 | 10.56 | 2 | |
| 4 | 34.34 | 1 | 145.42 | 12 | 10.56 | 2 | 4.74 | 2 | |
| 5 | 87.02 | 7 | 15.60 | 4 | 11.54 | 3 | 13.80 | 9 | |
| 6 | - | - | - | - | - | - | - | - | |
| Total | 518.42 | 25 | 518.42 | 25 | 51.53 | 20 | 51.53 | 20 | |
| K = 6 | 1 | 58.40 | 5 | 87.02 | 7 | 8.37 | 6 | 7.89 | 3 |
| 2 | 74.58 | 1 | 235.69 | 3 | 6.25 | 2 | 7.46 | 4 | |
| 3 | 28.39 | 8 | 34.34 | 1 | 10.56 | 2 | 6.59 | 3 | |
| 4 | 34.34 | 1 | 28.39 | 8 | 6.93 | 2 | 6.34 | 5 | |
| 5 | 235.69 | 3 | 74.58 | 1 | 5.43 | 3 | 10.56 | 2 | |
| 6 | 87.02 | 7 | 58.40 | 5 | 13.98 | 5 | 12.69 | 3 | |
| Total | 518.42 | 25 | 518.42 | 25 | 51.53 | 20 | 51.53 | 20 | |
Table 6.
Results for all the remuneration methods.
| Method | Producers | Consumers | |||||||||
|---|---|---|---|---|---|---|---|---|---|---|---|
| M1 | M2 | M3 | M4 | Schedule (kWh) | M1 | M2 | M3 | M4 | |||
| K | Group | Schedule (kWh) | Payment (m.u.) | Tariff (m.u./kWh) | Tariff (m.u./kWh) | Payment (m.u.) | Payment (m.u.) | Tariff (m.u./kWh) | Tariff (m.u./kWh) | Payment (m.u.) | |
| 4 | 1 | 145.42 | 6.18 | 0.0500 | 0.0425 | 6.25 | 9.20 | 0.64 | 0.0900 | 0.0711 | 7.36 |
| 2 | 310.26 | 19.36 | 0.0700 | 0.0625 | 19.39 | 7.04 | 0.48 | 0.0900 | 0.0700 | 5.63 | |
| 3 | 34.34 | 1.72 | 0.0500 | 0.0500 | 1.72 | 8.79 | 0.62 | 0.0900 | 0.0650 | 7.03 | |
| 4 | 28.39 | 1.26 | 0.0600 | 0.0438 | 1.22 | 8.83 | 0.64 | 0.0900 | 0.0740 | 8.25 | |
| 5 | - | - | - | - | - | - | - | - | - | - | |
| 6 | - | - | - | - | - | - | - | - | - | - | |
| Total | 518.42 | 28.52 | 32.41 | 28.53 | 28.58 | 33.86 | 2.38 | 3.05 | 2.37 | 28.27 | |
| 5 | 1 | 28.39 | 1.26 | 0.0600 | 0.0438 | 1.22 | 9.25 | 0.64 | 0.0900 | 0.0680 | 7.40 |
| 2 | 58.40 | 2.57 | 0.0500 | 0.0440 | 2.51 | 5.58 | 0.41 | 0.0900 | 0.0733 | 4.47 | |
| 3 | 310.26 | 19.36 | 0.0700 | 0.0625 | 19.39 | 4.29 | 0.28 | 0.0900 | 0.0700 | 4.62 | |
| 4 | 34.34 | 1.72 | 0.0500 | 0.0500 | 1.72 | 7.04 | 0.48 | 0.0900 | 0.0700 | 5.63 | |
| 5 | 87.02 | 3.61 | 0.0500 | 0.0414 | 3.74 | 7.69 | 0.57 | 0.0900 | 0.0700 | 6.15 | |
| 6 | - | - | - | - | - | - | - | - | - | - | |
| Total | 518.42 | 28.52 | 32.41 | 28.52 | 28.58 | 33.86 | 2.38 | 3.05 | 2.37 | 28.27 | |
| 6 | 1 | 58.40 | 2.57 | 0.0500 | 0.0440 | 2.51 | 5.58 | 0.41 | 0.0900 | 0.0733 | 4.47 |
| 2 | 74.58 | 5.22 | 0.0700 | 0.0700 | 4.66 | 4.16 | 0.25 | 0.0700 | 0.0600 | 3.33 | |
| 3 | 28.39 | 1.26 | 0.0600 | 0.0438 | 1.22 | 7.04 | 0.48 | 0.0900 | 0.0700 | 5.63 | |
| 4 | 34.34 | 1.72 | 0.0500 | 0.0500 | 1.72 | 4.62 | 0.37 | 0.0900 | 0.0700 | 3.70 | |
| 5 | 235.69 | 14.14 | 0.0700 | 0.0600 | 14.73 | 3.62 | 0.23 | 0.0900 | 0.0667 | 2.90 | |
| 6 | 87.02 | 3.61 | 0.0500 | 0.0414 | 3.74 | 8.83 | 0.64 | 0.0900 | 0.0740 | 8.25 | |
| Total | 518.42 | 28.52 | 32.41 | 28.49 | 28.58 | 33.86 | 2.38 | 2.96 | 2.37 | 28.27 | |
© 2018 by the authors. Licensee MDPI, Basel, Switzerland. This article is an open access article distributed under the terms and conditions of the Creative Commons Attribution (CC BY) license (http://creativecommons.org/licenses/by/4.0/).
Share and Cite
MDPI and ACS Style
Faria, P.; Spínola, J.; Vale, Z. Methods for Aggregation and Remuneration of Distributed Energy Resources. Appl. Sci. 2018, 8, 1283. https://doi.org/10.3390/app8081283
AMA Style
Faria P, Spínola J, Vale Z. Methods for Aggregation and Remuneration of Distributed Energy Resources. Applied Sciences. 2018; 8(8):1283. https://doi.org/10.3390/app8081283
Chicago/Turabian StyleFaria, Pedro, João Spínola, and Zita Vale. 2018. "Methods for Aggregation and Remuneration of Distributed Energy Resources" Applied Sciences 8, no. 8: 1283. https://doi.org/10.3390/app8081283
Note that from the first issue of 2016, this journal uses article numbers instead of page numbers. See further details here.