Automated Diabetic Retinopathy Screening System Using Hybrid Simulated Annealing and Ensemble Bagging Classifier


1
Faculty of Engineering, King Mongkut’s Institute of Technology Ladkrabang, Bangkok 10520, Thailand
2
School of Information and Telecommunication Engineering, Tokai University, Tokyo 108-8619, Japan
3
Department of Ophthalmology, Bhumibol Adulyadej Hospital, Royal Thai Air Force, Bangkok 10220, Thailand
*
Author to whom correspondence should be addressed.
Appl. Sci. 2018, 8(7), 1198; https://doi.org/10.3390/app8071198
Submission received: 5 July 2018
/
Revised: 18 July 2018
/
Accepted: 19 July 2018
/
Published: 22 July 2018
(This article belongs to the Special Issue Advanced Intelligent Imaging Technology)
Abstract
:Diabetic Retinopathy (DR) is the leading cause of blindness in working-age adults globally. Primary screening of DR is essential, and it is recommended that diabetes patients undergo this procedure at least once per year to prevent vision loss. However, in addition to the insufficient number of ophthalmologists available, the eye examination itself is labor-intensive and time-consuming. Thus, an automated DR screening method using retinal images is proposed in this paper to reduce the workload of ophthalmologists in the primary screening process and so that ophthalmologists may make effective treatment plans promptly to help prevent patient blindness. First, all possible candidate lesions of DR were segmented from the whole retinal image using a combination of morphological-top-hat and Kirsch edge-detection methods supplemented by pre- and post-processing steps. Then, eight feature extractors were utilized to extract a total of 208 features based on the pixel density of the binary image as well as texture, color, and intensity information for the detected regions. Finally, hybrid simulated annealing was applied to select the optimal feature set to be used as the input to the ensemble bagging classifier. The evaluation results of this proposed method, on a dataset containing 1200 retinal images, indicate that it performs better than previous methods, with an accuracy of 97.08%, a sensitivity of 90.90%, a specificity of 98.92%, a precision of 96.15%, an F-measure of 93.45% and the area under receiver operating characteristic curve at 98.34%.
1. Introduction
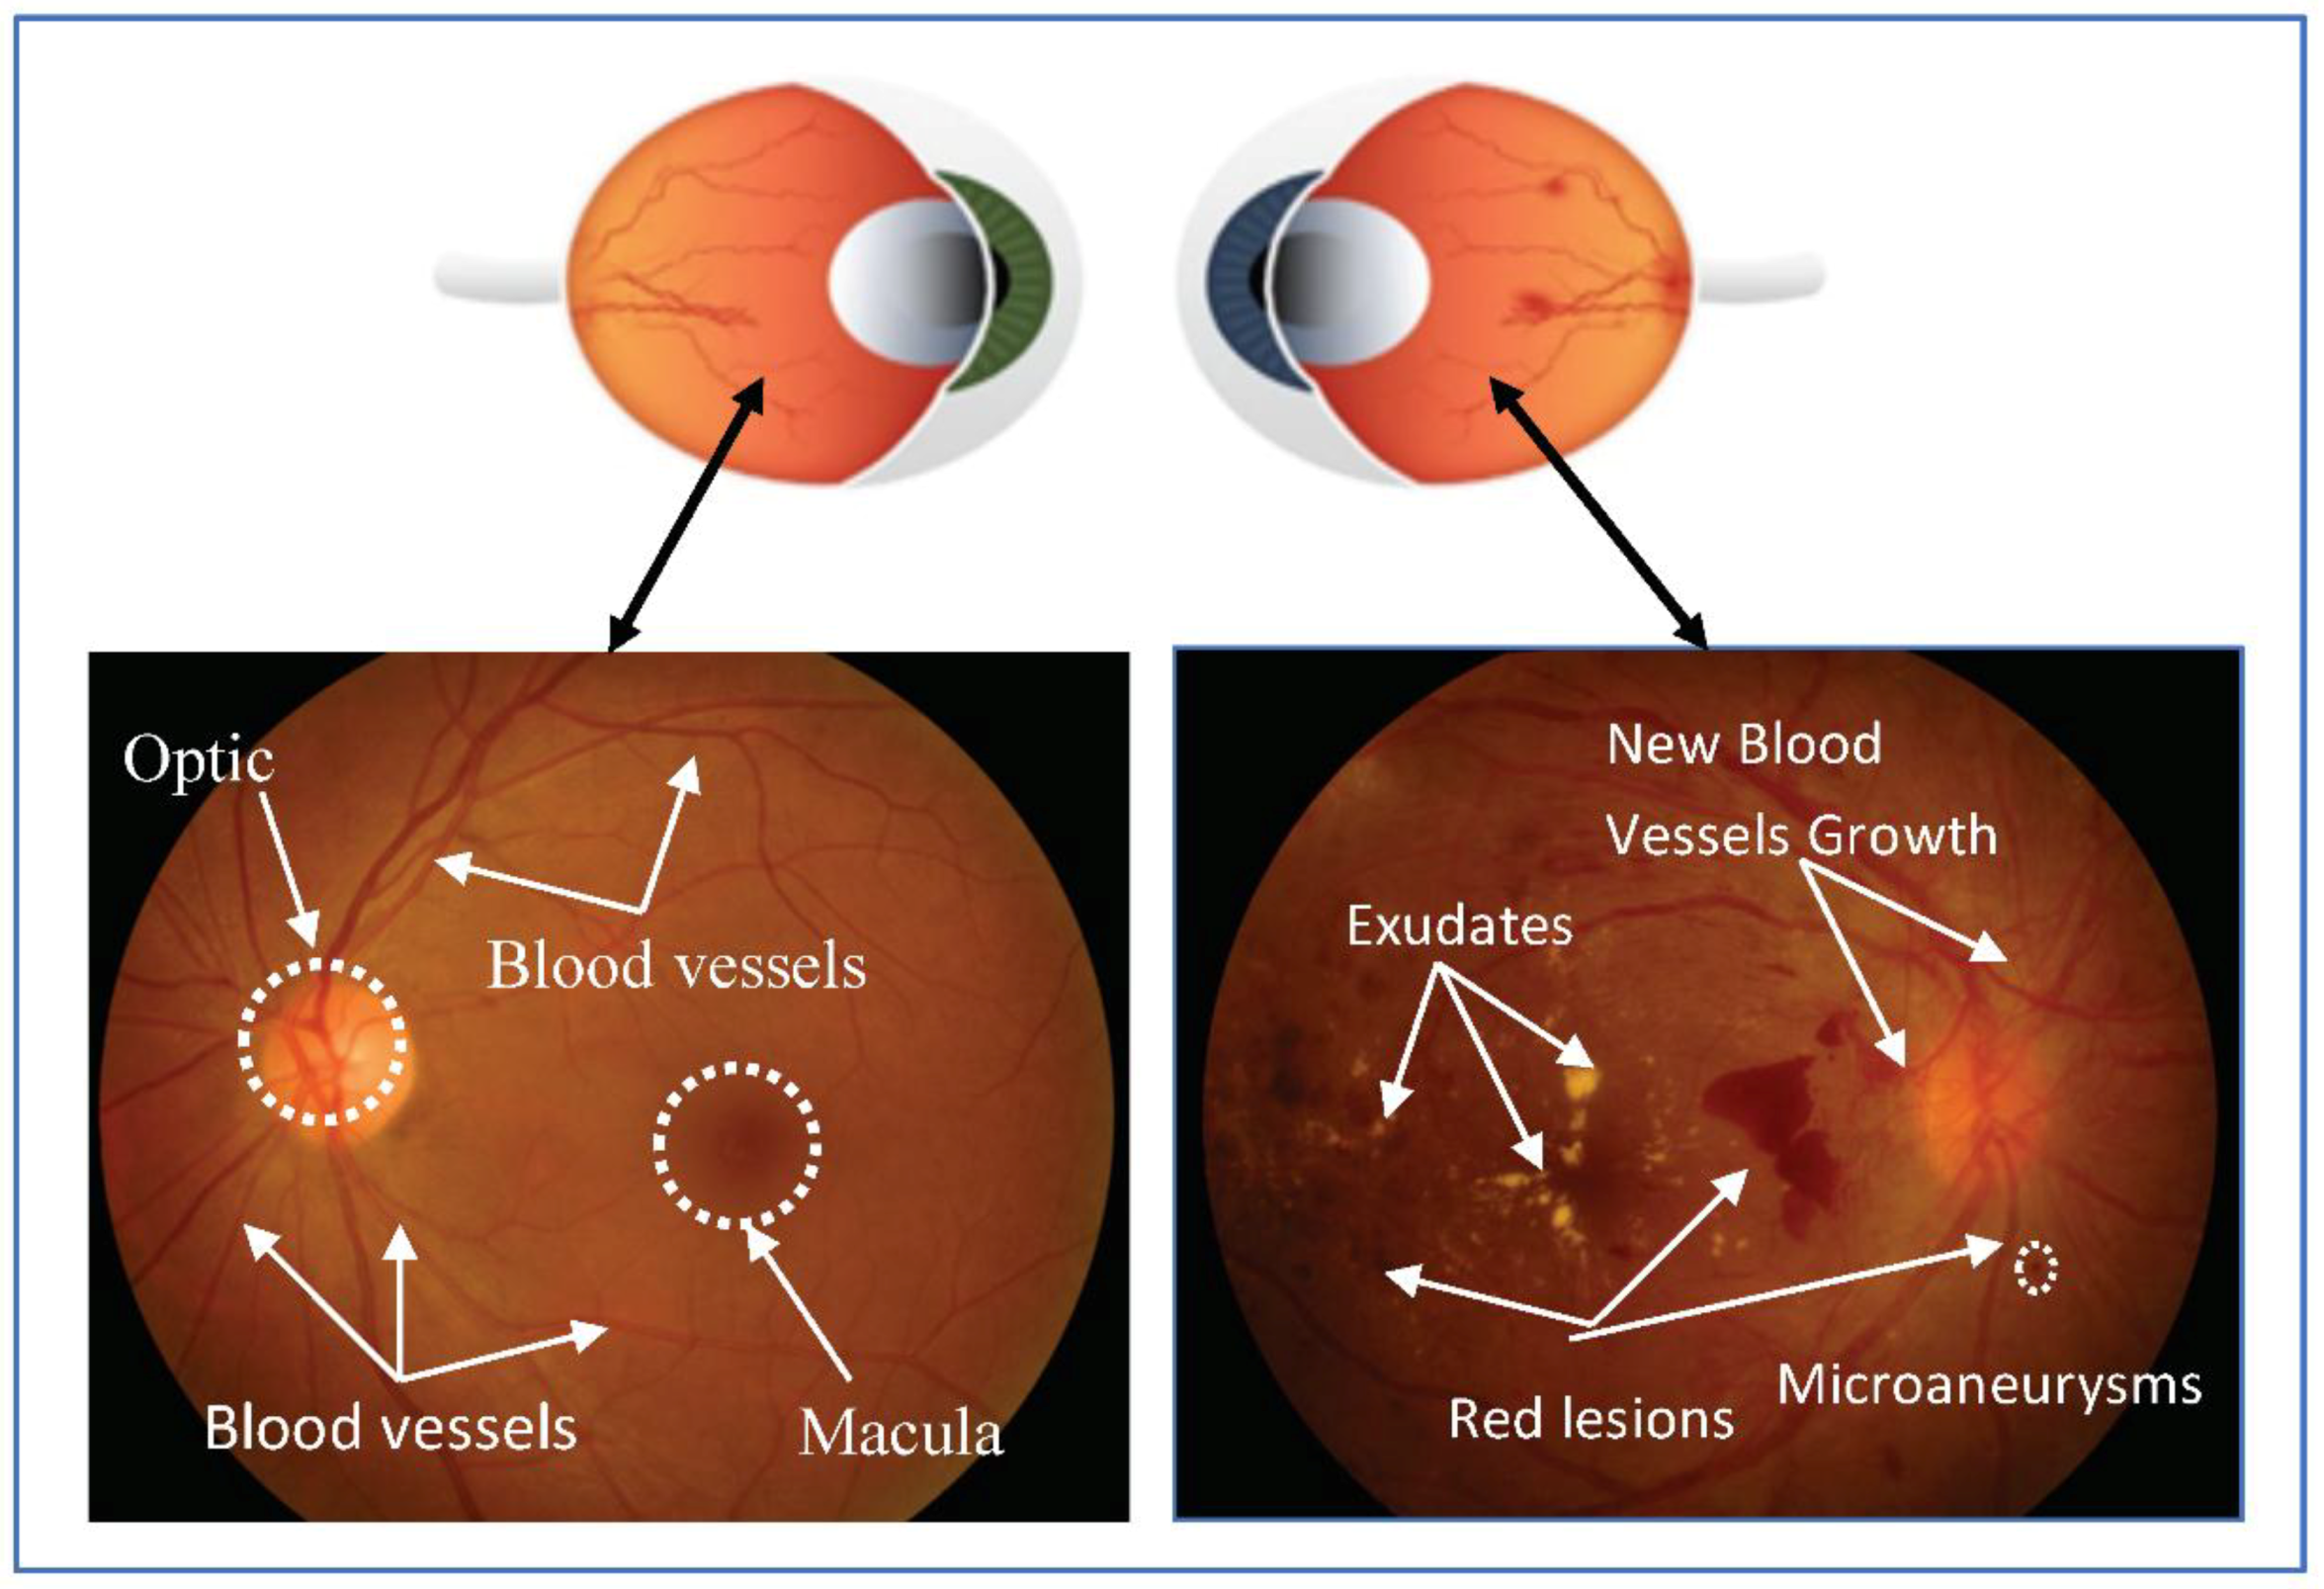
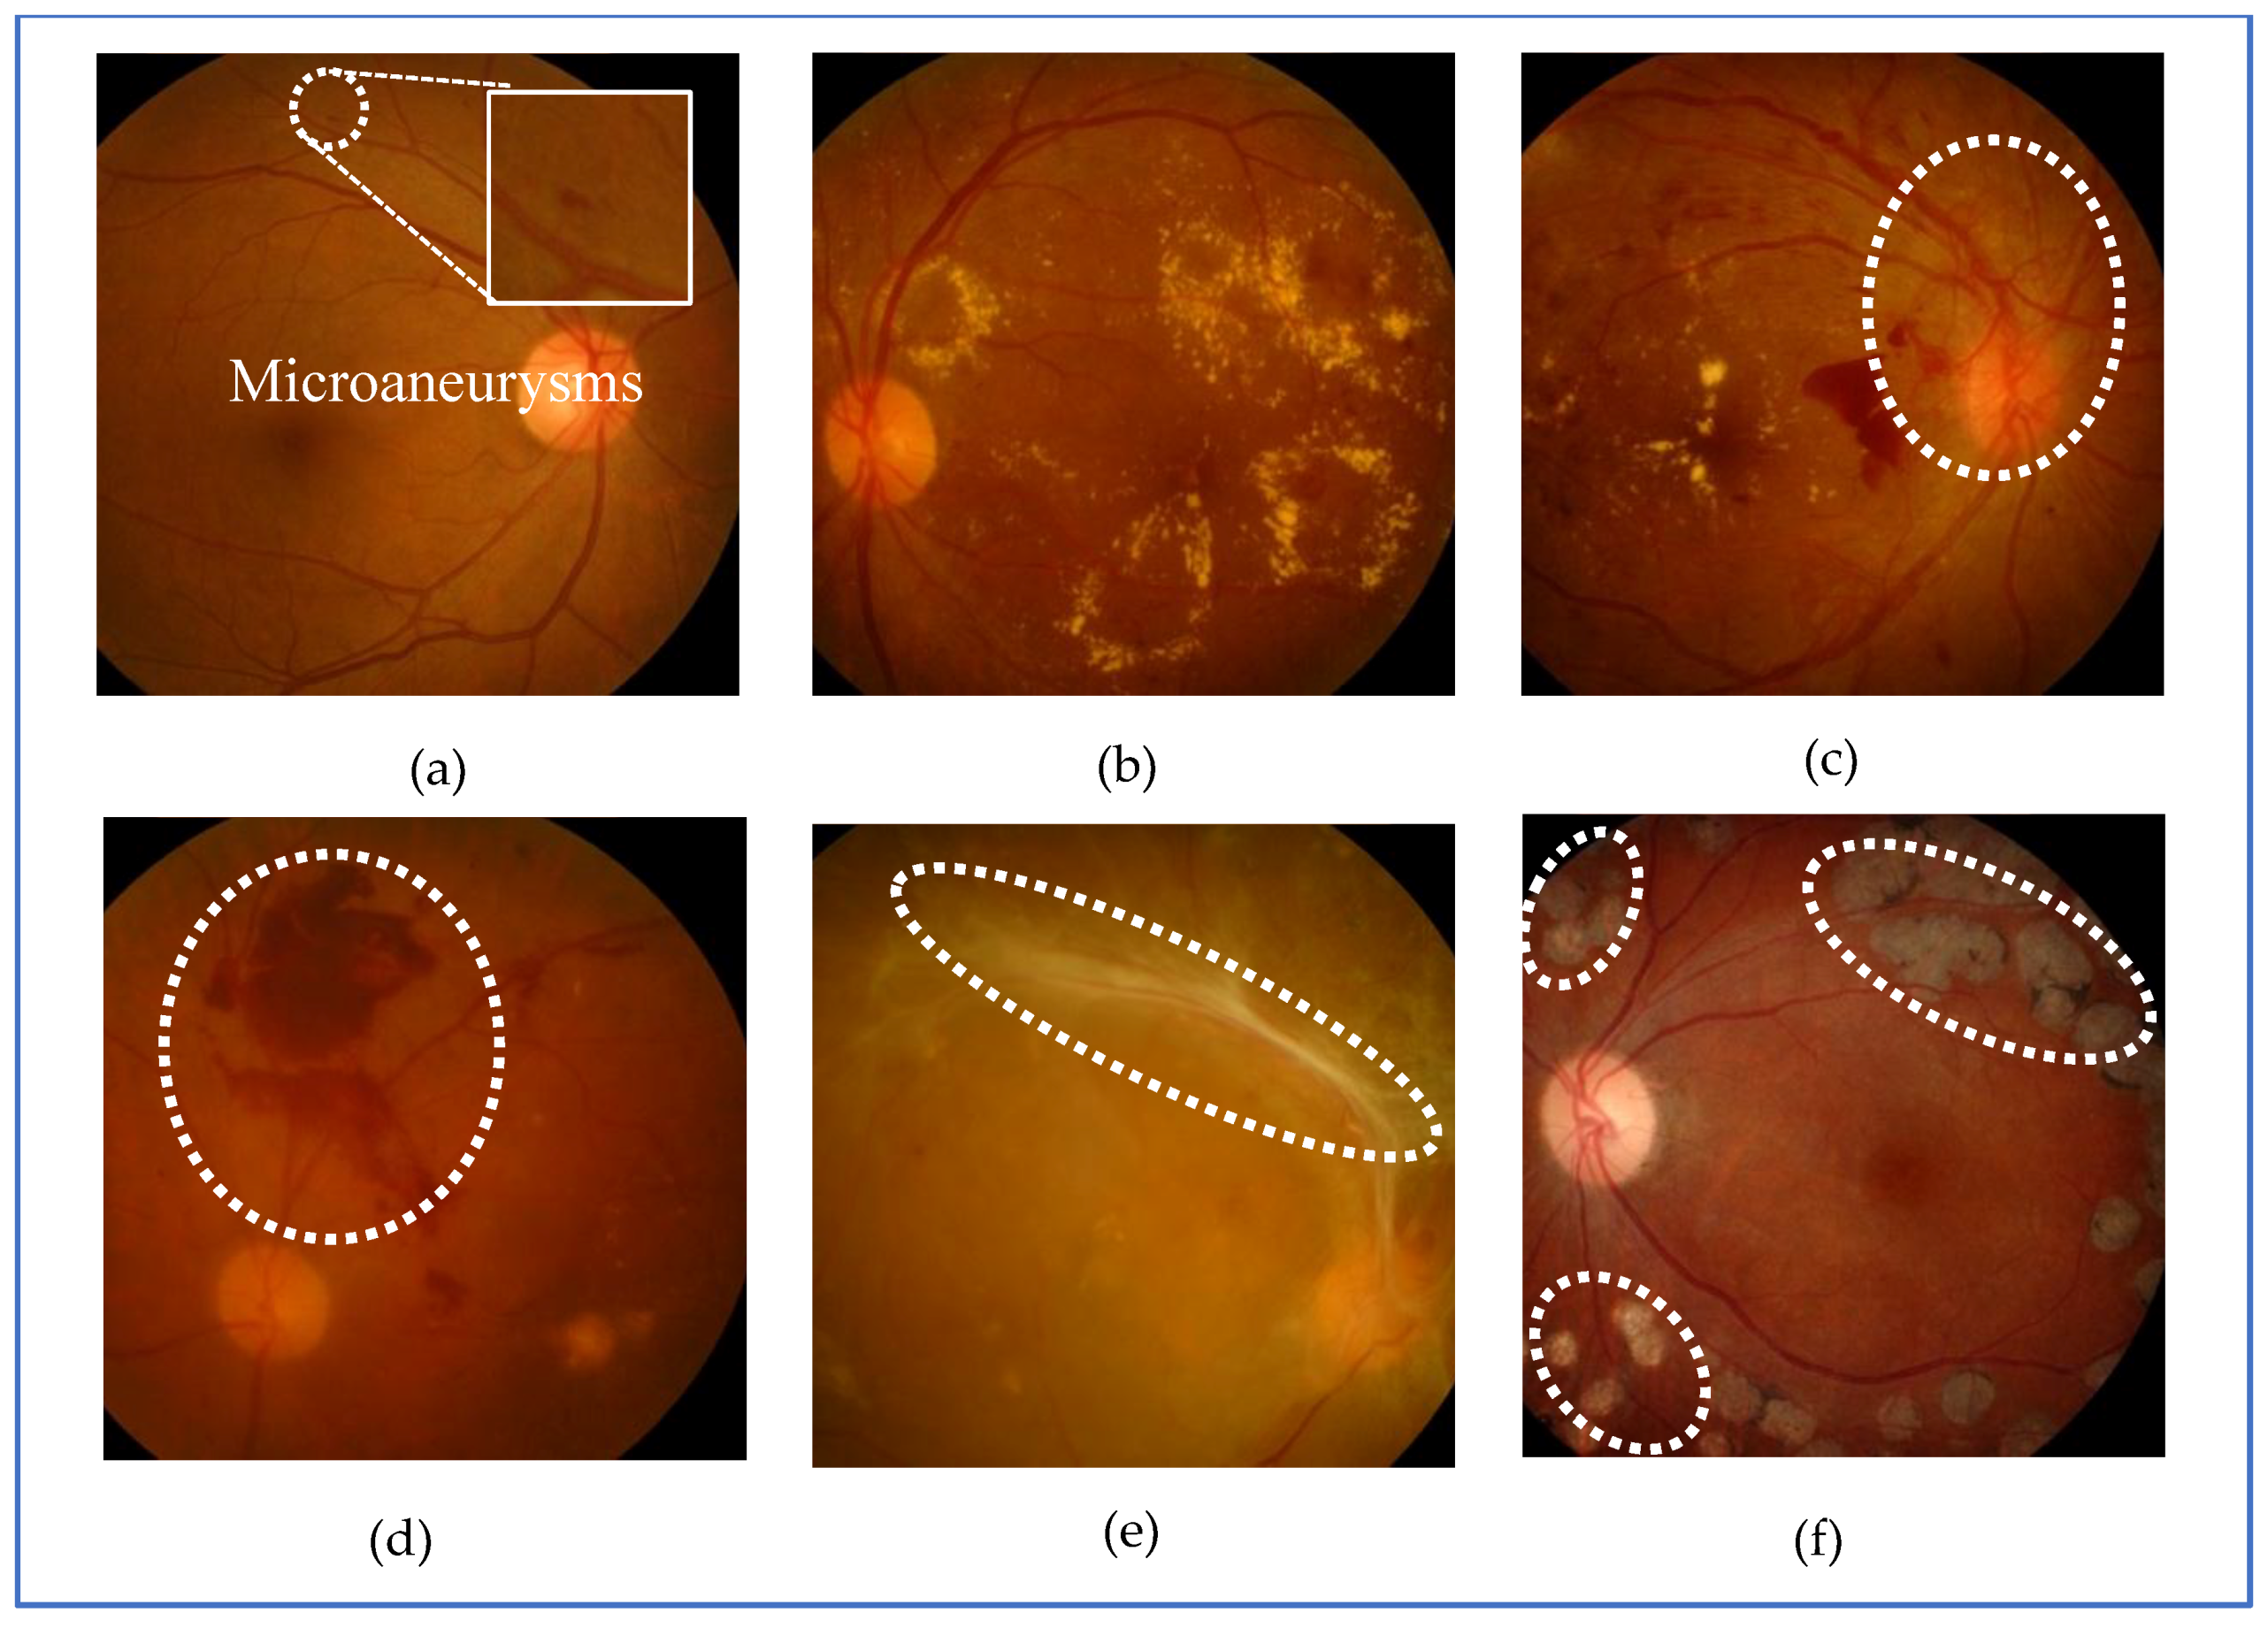
Diabetes is a lifelong disease which has been identified as one of the leading causes of many health problems including renal failure, heart attacks, strokes and eye complications. It occurs when sugar in the blood is not digested properly, either because the pancreas is unable to produce sufficient insulin, or because the body is not using the insulin it produces correctly [1]. When diabetes affects the eye, it is called Diabetic Retinopathy (DR). It is the main cause of blindness in working-age adults globally and is categorized into two stages. Microaneurysms (MAs), Exudates (EXs), and Hemorrhages (HMs) are the early signs of DR known as Non-Proliferative Diabetic Retinopathy (NPDR), while neovascularization, vitreous hemorrhages, and fibrous proliferation occur during the advanced stage of DR known as Proliferative Diabetic Retinopathy (PDR). MAs are the first visible sign of DR and defined as dark red fundus spots. HMs are also dark red lesions, which appear as dots, blot or flame-shaped in the fundus image. They are the results of blood vessels bleeding either from superficial or deep capillary plexus.
EXs are MAs exuded combined with the leakage of lipids in the retina. They appear as pale white or fluffy patches (soft EXs) or bright yellowish dots (hard EXs) in the inner retina. Neovascularization is the development of immature blood vessels which usually occur as a result of generalized retinal ischemia. Vitreous hemorrhage is the result of hemorrhage or blood bleeding into the vitreous humor, and fibrous proliferation is fibrous tissue opaque enough to be seen at the Optic Disc (OD) area or somewhere around the OD margin with or without accompanying new blood vessels. OD, macula, and Blood Vessels (BV) are normal retinal structures. The anatomy of a healthy retinal image and the pathological signs of DR images are shown in Figure 1 and Figure 2.
As reported in the International Diabetes Federation Diabetes Atlas 2017 [2], an estimated 425 million adults were living with diabetes as of 2017, and approximately one-third of diabetes patients had some degree of diabetic retinopathy. Consequently, it is recommended that people with diabetes undergo eye-screening at regular yearly intervals to help prevent vision loss. This eye screening is currently labor-intensive, time-consuming, as well as subjective and can be performed by a retina specialist either directly or by first using a fundus camera to capture the retinal image, followed by a screening process [3]. However, the number of ophthalmologists available is insufficient in many countries, especially in developing countries and rural areas where eye specialists are rarely available. To overcome these limitations, this paper proposes an automatic DR screening system to identify DR more objectively and enable ophthalmologists to make effective treatment plans in order to help prevent patient blindness.
In our review of previous works, we found that several papers aimed to detect each pathological sign of DR: EXs, MAs, and HMs. However, only a few papers were devoted to differentiating between healthy and unhealthy retinal images.
Acharya et al. [4] proposed an automated screening system to discriminate healthy retinal images using a support vector machine for three different eye diseases namely DR, glaucoma and age-related macular degeneration. First, an image was preprocessed using adaptive-histogram equalization, and then a bi-dimensional empirical mode decomposition technique was applied to decompose the image due to pixel variations. Texture features were later extracted from 2D intrinsic mode functions and ranked as inputs for feeding the support vector machine. The paper reported an accuracy of 88.63%, a sensitivity of 86.25% and a specificity of 91%. The improved version of this paper was published in [5]. A 2D-continuous wavelet transform was used first to decompose the fundus images, and then 15 features from entropies and energy features were extracted. These significant features were ranked and selected using particle swarm optimization. Finally, an adaptive synthetic sampling approach was applied to balance the input data which was then differentiated into two data classes using a random forest classifier. The updated results showed an accuracy of 92.48%, a sensitivity of 89.37% and a specificity of 95.58%.
Kumar et al. [6] classified DR or healthy images from retinal images using the aggregate of the extracted lesions. The OD and BV were first detected. Then the white lesions and red lesions were detected through modification of their previous work presented in [7,8] respectively. Finally, the detected lesions were classified based on a waterfall model based classification. Rates of 80% and 50% for sensitivity and specificity were reported respectively.
Imani et al. [9] presented a DR screening system based on morphological component analysis. Without using any segmentation methods, the structural information was exploited to evaluate performance. The blood vessels and lesions were then separated using morphological component analysis. Finally, a support vector machine was employed to distinguish healthy retinal images from abnormal ones. It achieved an accuracy of 92.82%, sensitivity of 92.01% and specificity of 95.45%.
Goh et al. [10] filtered the retinal healthy images from DR based on the result of exudates detection using the features of the sub-images locally as the input to multiple classifiers. The paper obtained sensitivity of 92% and specificity of 91%.
A grading system for DR was presented by Akram et al. [11] which used the number of each detected DR lesion as determined through morphological operation. Aliahmad et al. [12] presented the automatic analysis of fundus images for modeling early changes in retinal blood vessels resulting from diabetes based on the total number of branching angles and average acute branching angles in addition to patient demographic information. Linear regression was applied in this study. Similarly, Raja et al. [13] proposed a method to detect BV for the diagnosis of DR.
Taking into account the works mentioned above and the methods in Reference [10], the authors attempted to detect only the EXs while other DR lesions including MIs, HMs, and CWSs were ignored. When ignoring other associated lesions, the detection system is not robust. The papers in [6,9] filtered any abnormal signs of DR using all extracted features whether significant differences existed or not. The use of all features without the use of feature selection may lead to heavy computation time, redundancy, and poor predictive performance. The papers in [4,5] applied a feature selection to select the optimal feature set to feed to the classifiers. However, more feature selection methods should be studied and the results compared.
In this paper, we proposed an automated DR screening system based on five processing steps: (i) preprocessing, (ii) lesion detection, (iii) feature extraction, (iv) feature selection and (v) classification. Image preprocessing is completed first so as to standardize image size and improve retinal image quality. Then, bright and dark lesions are segmented using a combination of morphological-top-hat and Kirsch edge-detection methods using a Boolean operation. Post-processing is further applied to filter out only DR lesions. After the DR lesions are segmented, eight feature sets with a total of 208 features are extracted, and hybrid simulated annealing is utilized to select the optimal feature set for input to the ensemble bagging classifier.
2. Methodology
The flowchart of the proposed method is depicted in Figure 3. It composes five processing steps: Image processing, image segmentation, feature extraction, feature selection and classification. The detail of each processing step is described below.
2.1. Image Preprocessing
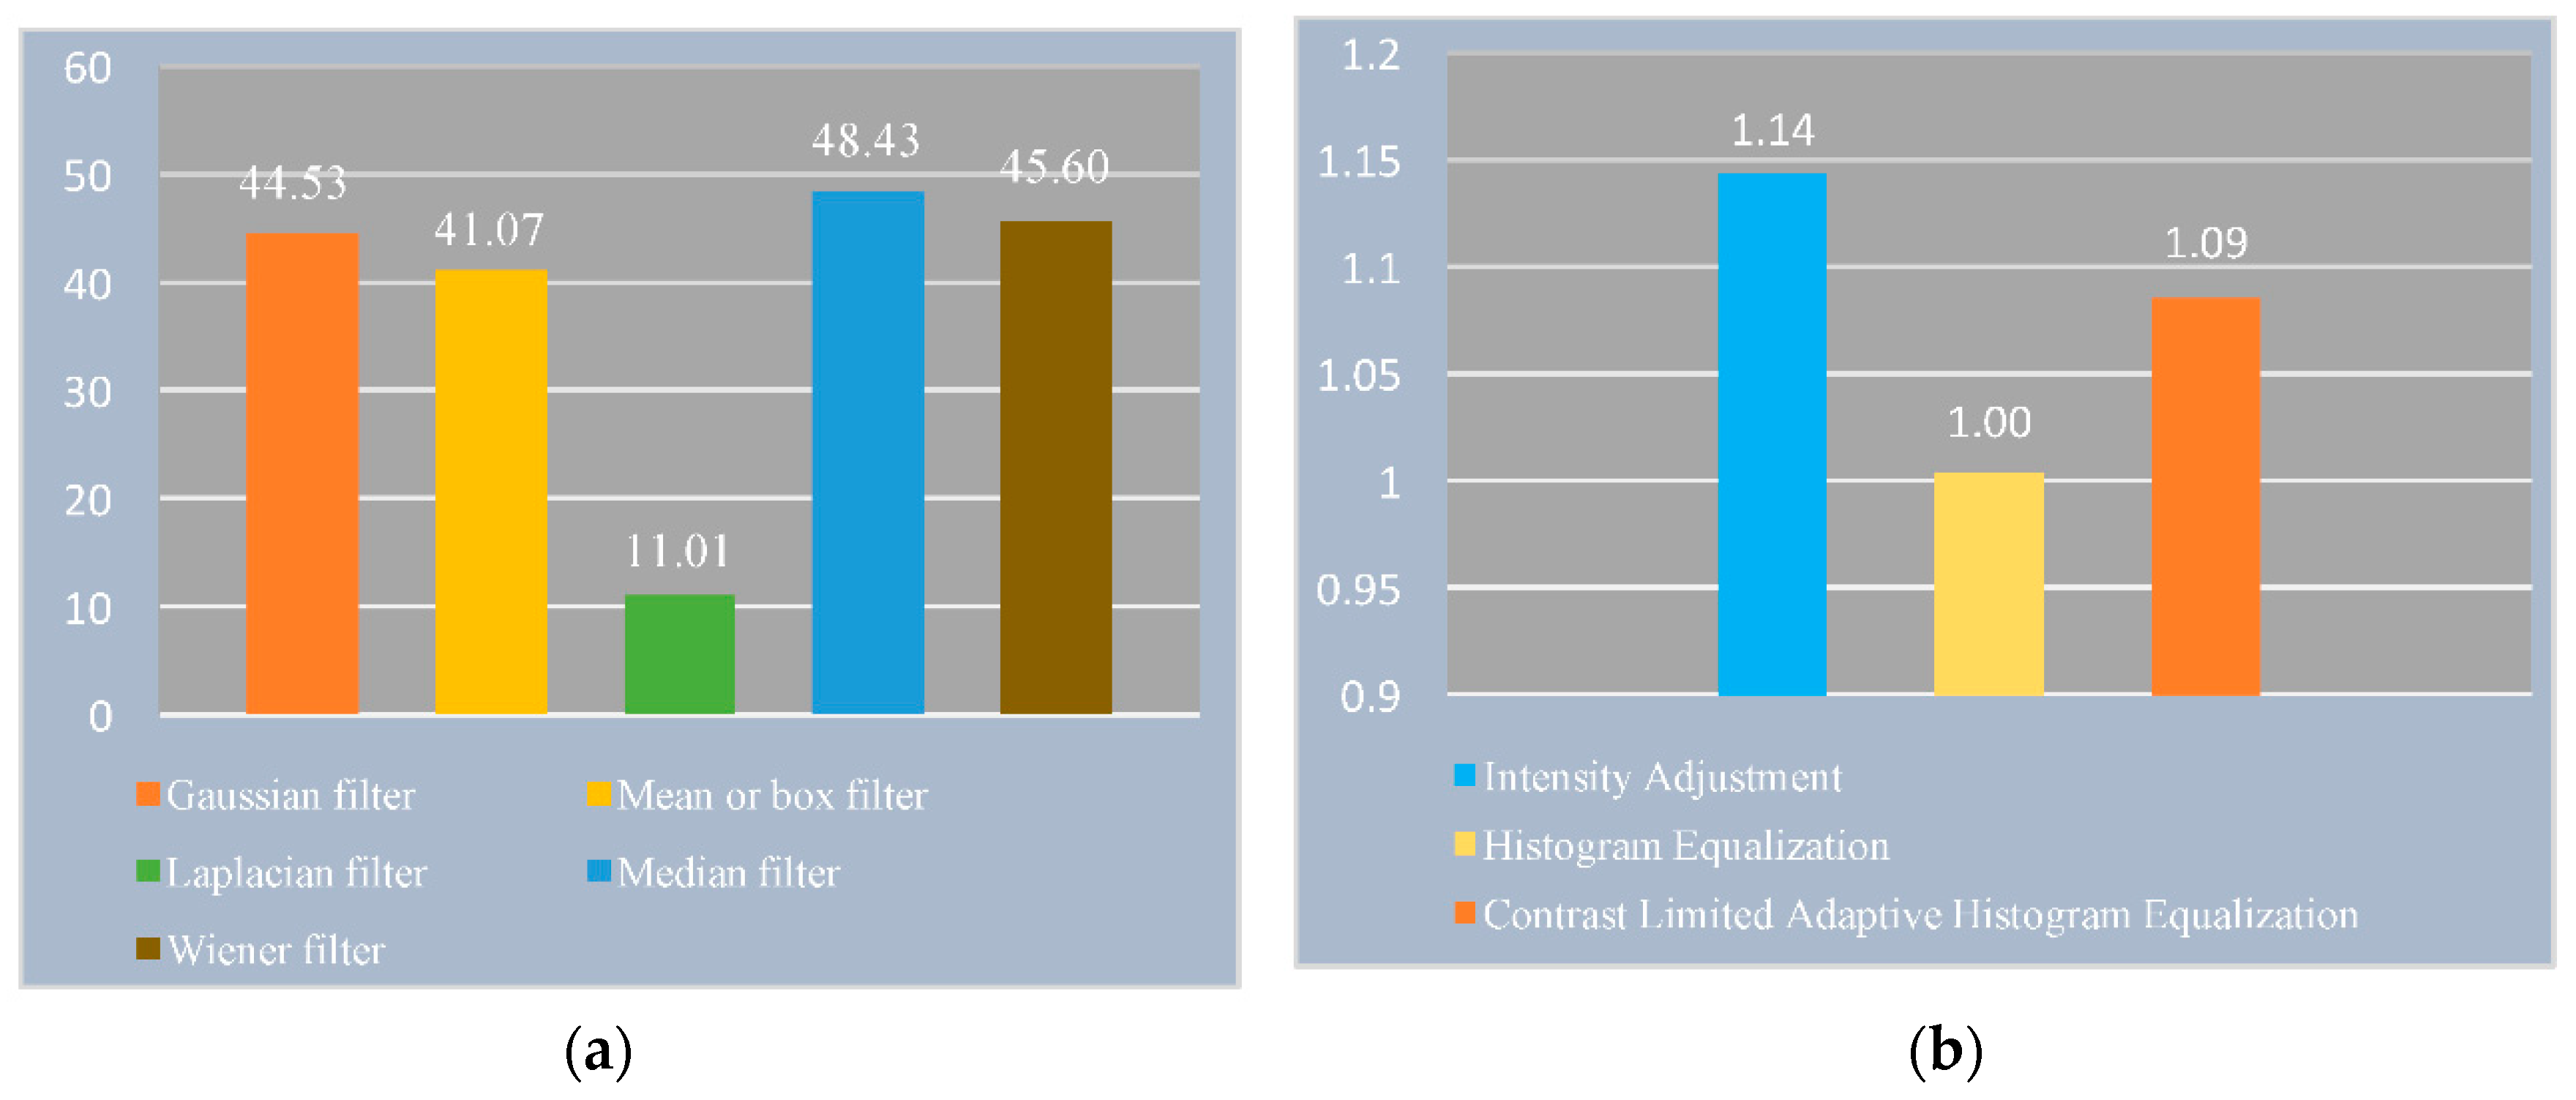
The uneven illumination inside the retinal images is usually caused by the process of image acquisition and the main focus of retinal image analysis (nasal view and macula view) [3]. In our dataset, most images were captured for the purpose of macular view in which the illumination is highly focused on the macular area and image pixels at the outer ring of pixels saturation [14]. Thus, image preprocessing is done first to standardize the image size and improve the retinal image quality. The following procedures are used to preprocess the retinal images based on the image quality assessment metrics [15], as shown in Figure 4.
- Image resizing to 576 720 pixels to standardize the image size and reduce the computation time.
- RGB color image conversion to the green channel, followed by removal of small noise using a median filter.
- Gamma correction to improve the intensity values for image binarization.
2.2. Image Segmentation
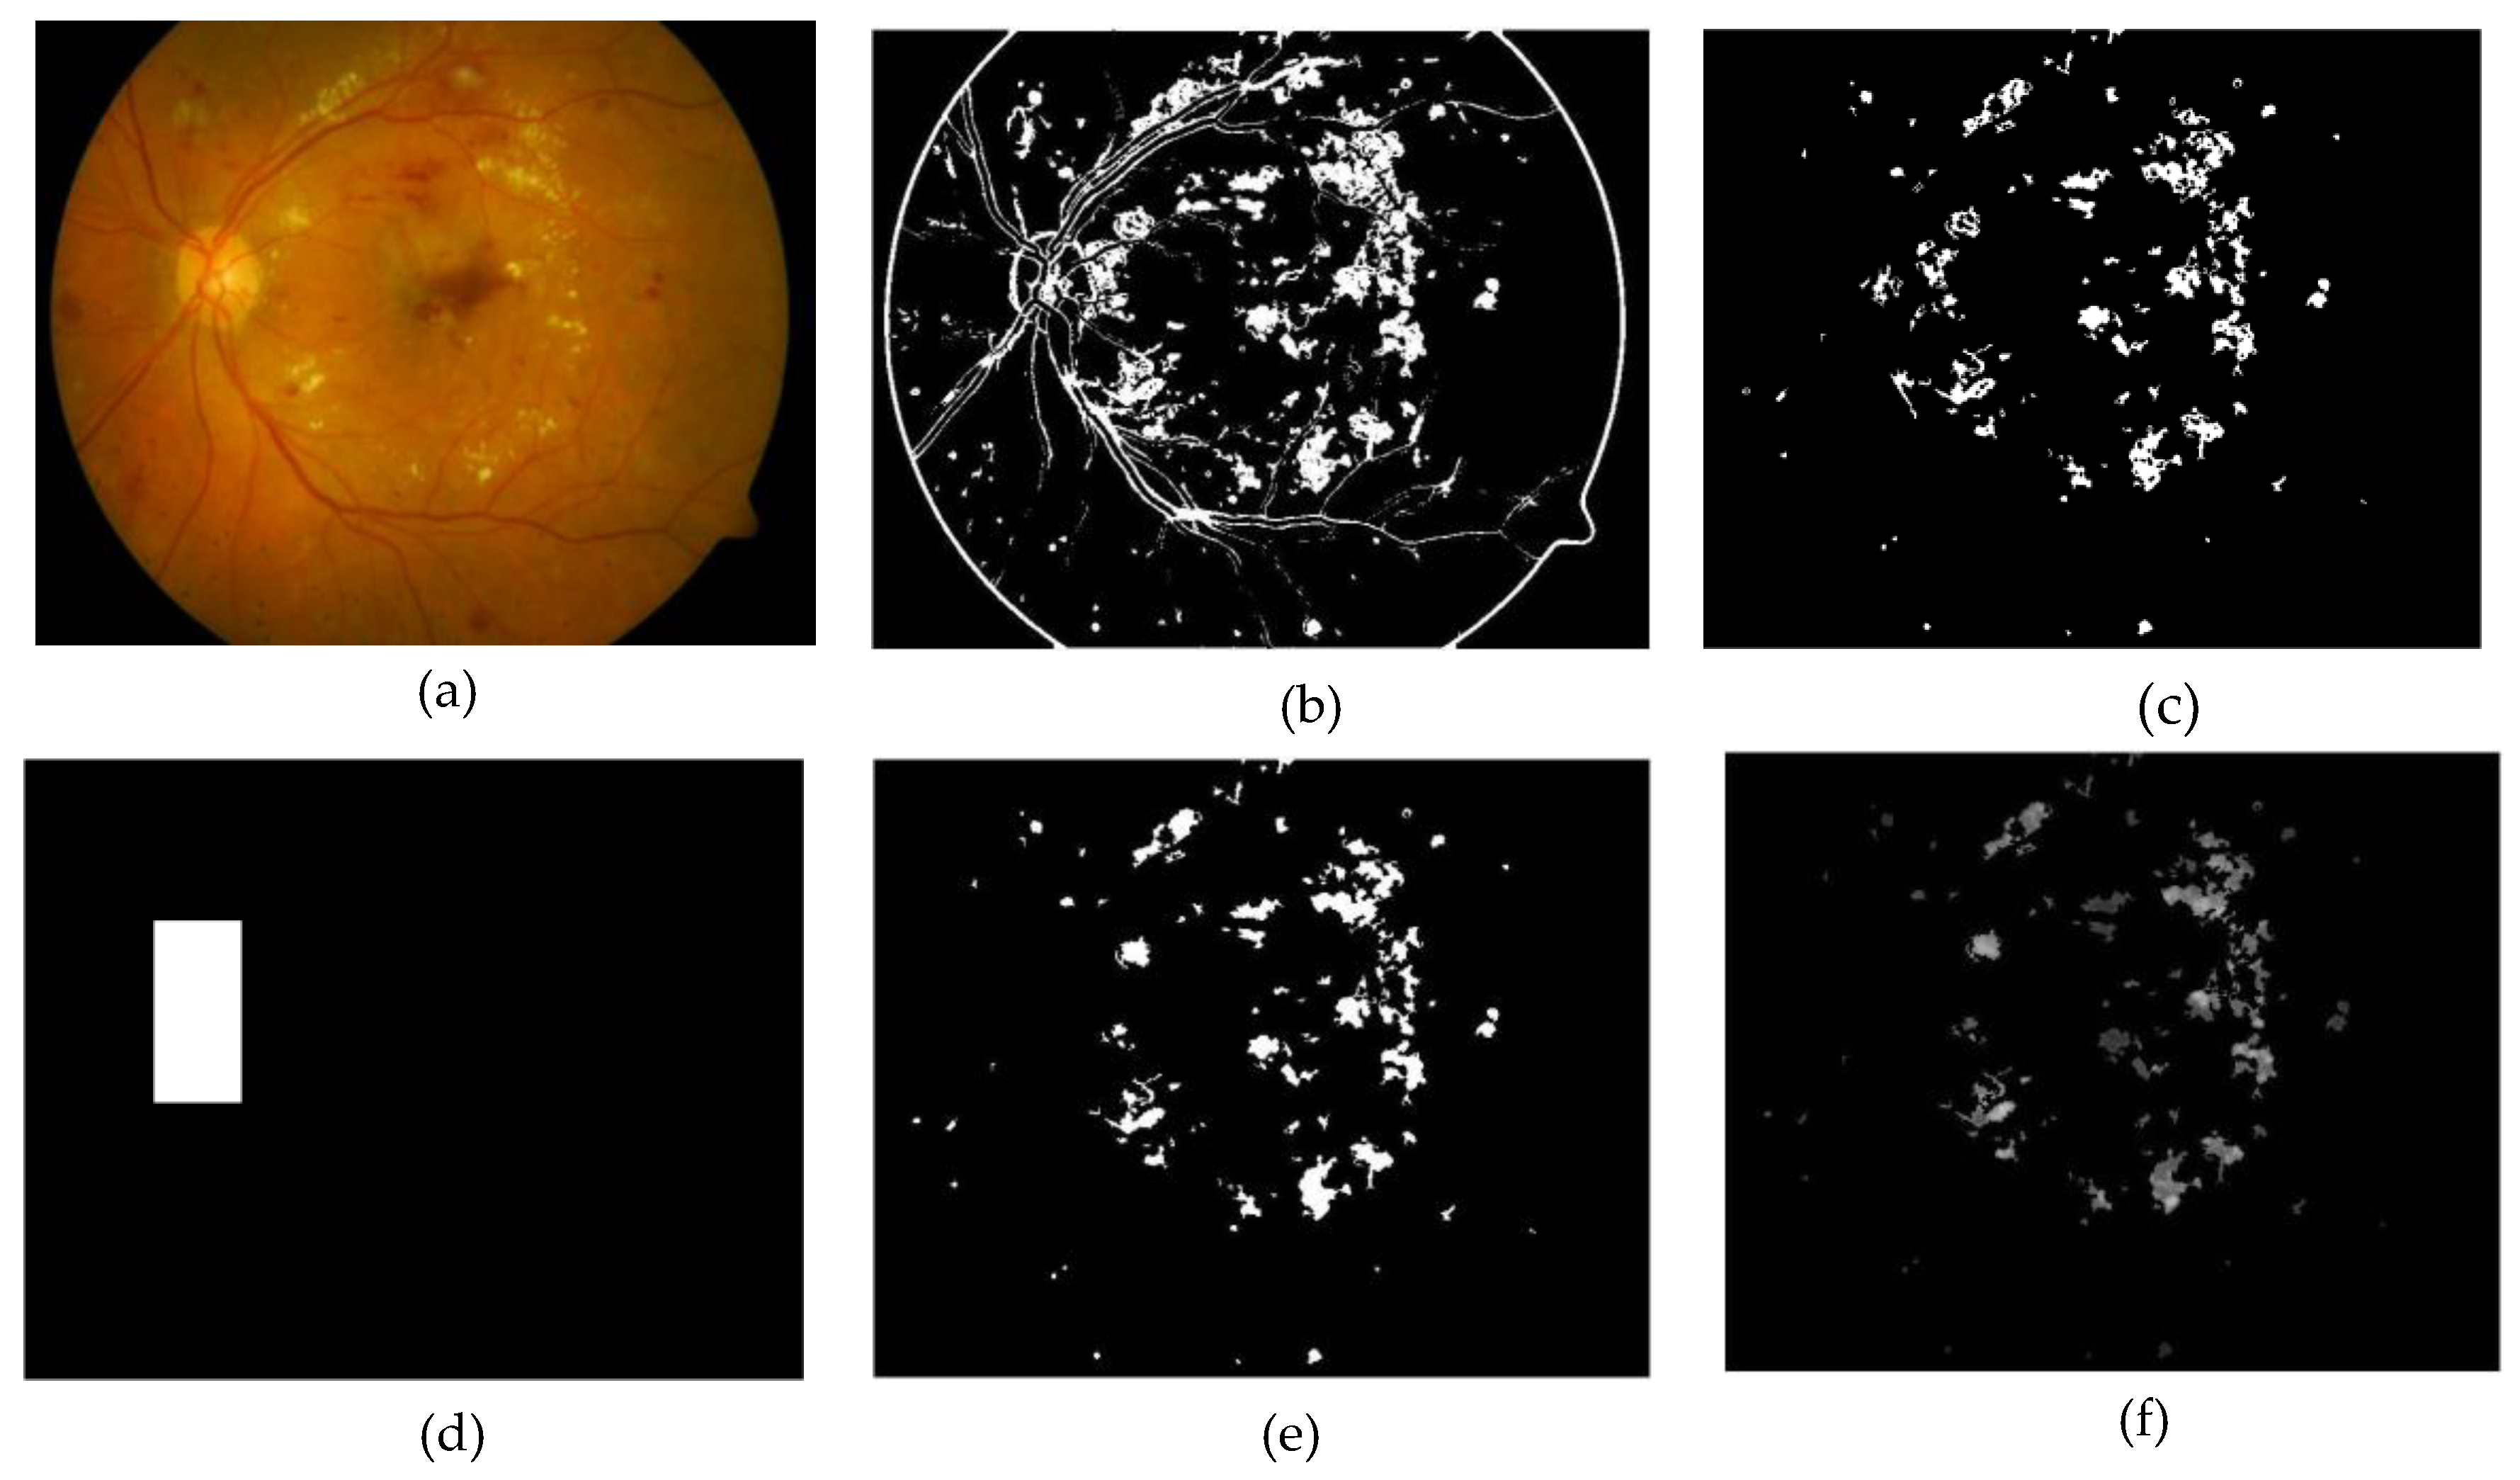
Image segmentation can be considered as the main processing step in many applications of image processing [16]. Numerous applications have been presented in the segmentation methods based on image intensity, color, edges, and texture. In this paper, the lesions of DR are segmented based on our previous work [17] by using Kirsch edges detection and morphological top hat. However, the segmentation results still contain significant amounts of noise (BV and artifacts in the vicinity of the OD). Therefore, post-processing is used. In the previous work, we removed the BV using the area measurement where the largest region of the image segmented result was eliminated. Then we used the property of axis length to remove short blood vessels. Assuming that the largest region has the highest occurrence of BV may wrongly remove the DR lesions when the lesions deposit next to BV. To deal with this issue, morphological operation was applied. The main BV was first eroded by a disk-shaped structuring element with the radius equal to one. Then the remaining parts of BV were further removed using the ratio between the major axis length and minor axis length. Finally, we removed the artifacts in the vicinity of the OD by first localizing the OD using our method proposed in [18], and then built a rectangular mask from the center of the detected OD area. By combining the rectangular mask with the result after eliminating BV, we could remove all noise attached to the rectangular mask. The processing steps of image segmentation are presented in Figure 5.
2.3. Feature Extraction
After image segmentation, we reconstructed the binary image into a grayscale image using morphological reconstruction, and then we differentiated the retinal health and DR images based on the pixel density in binary image (see in Figure 4e) and the information of texture, color, and intensity of the detected regions (see in Figure 4f). As illustrated in Table 1, 208 features from eight feature extractors namely morphological features, intensity features, color features, first order statistical features, Gray Level Co-occurrence Matrix (GLCM) features, Gray Level Run Length Matrix (GLRLM) features, local binary pattern features and Tamura’s texture features were extracted.
2.4. Feature Selection
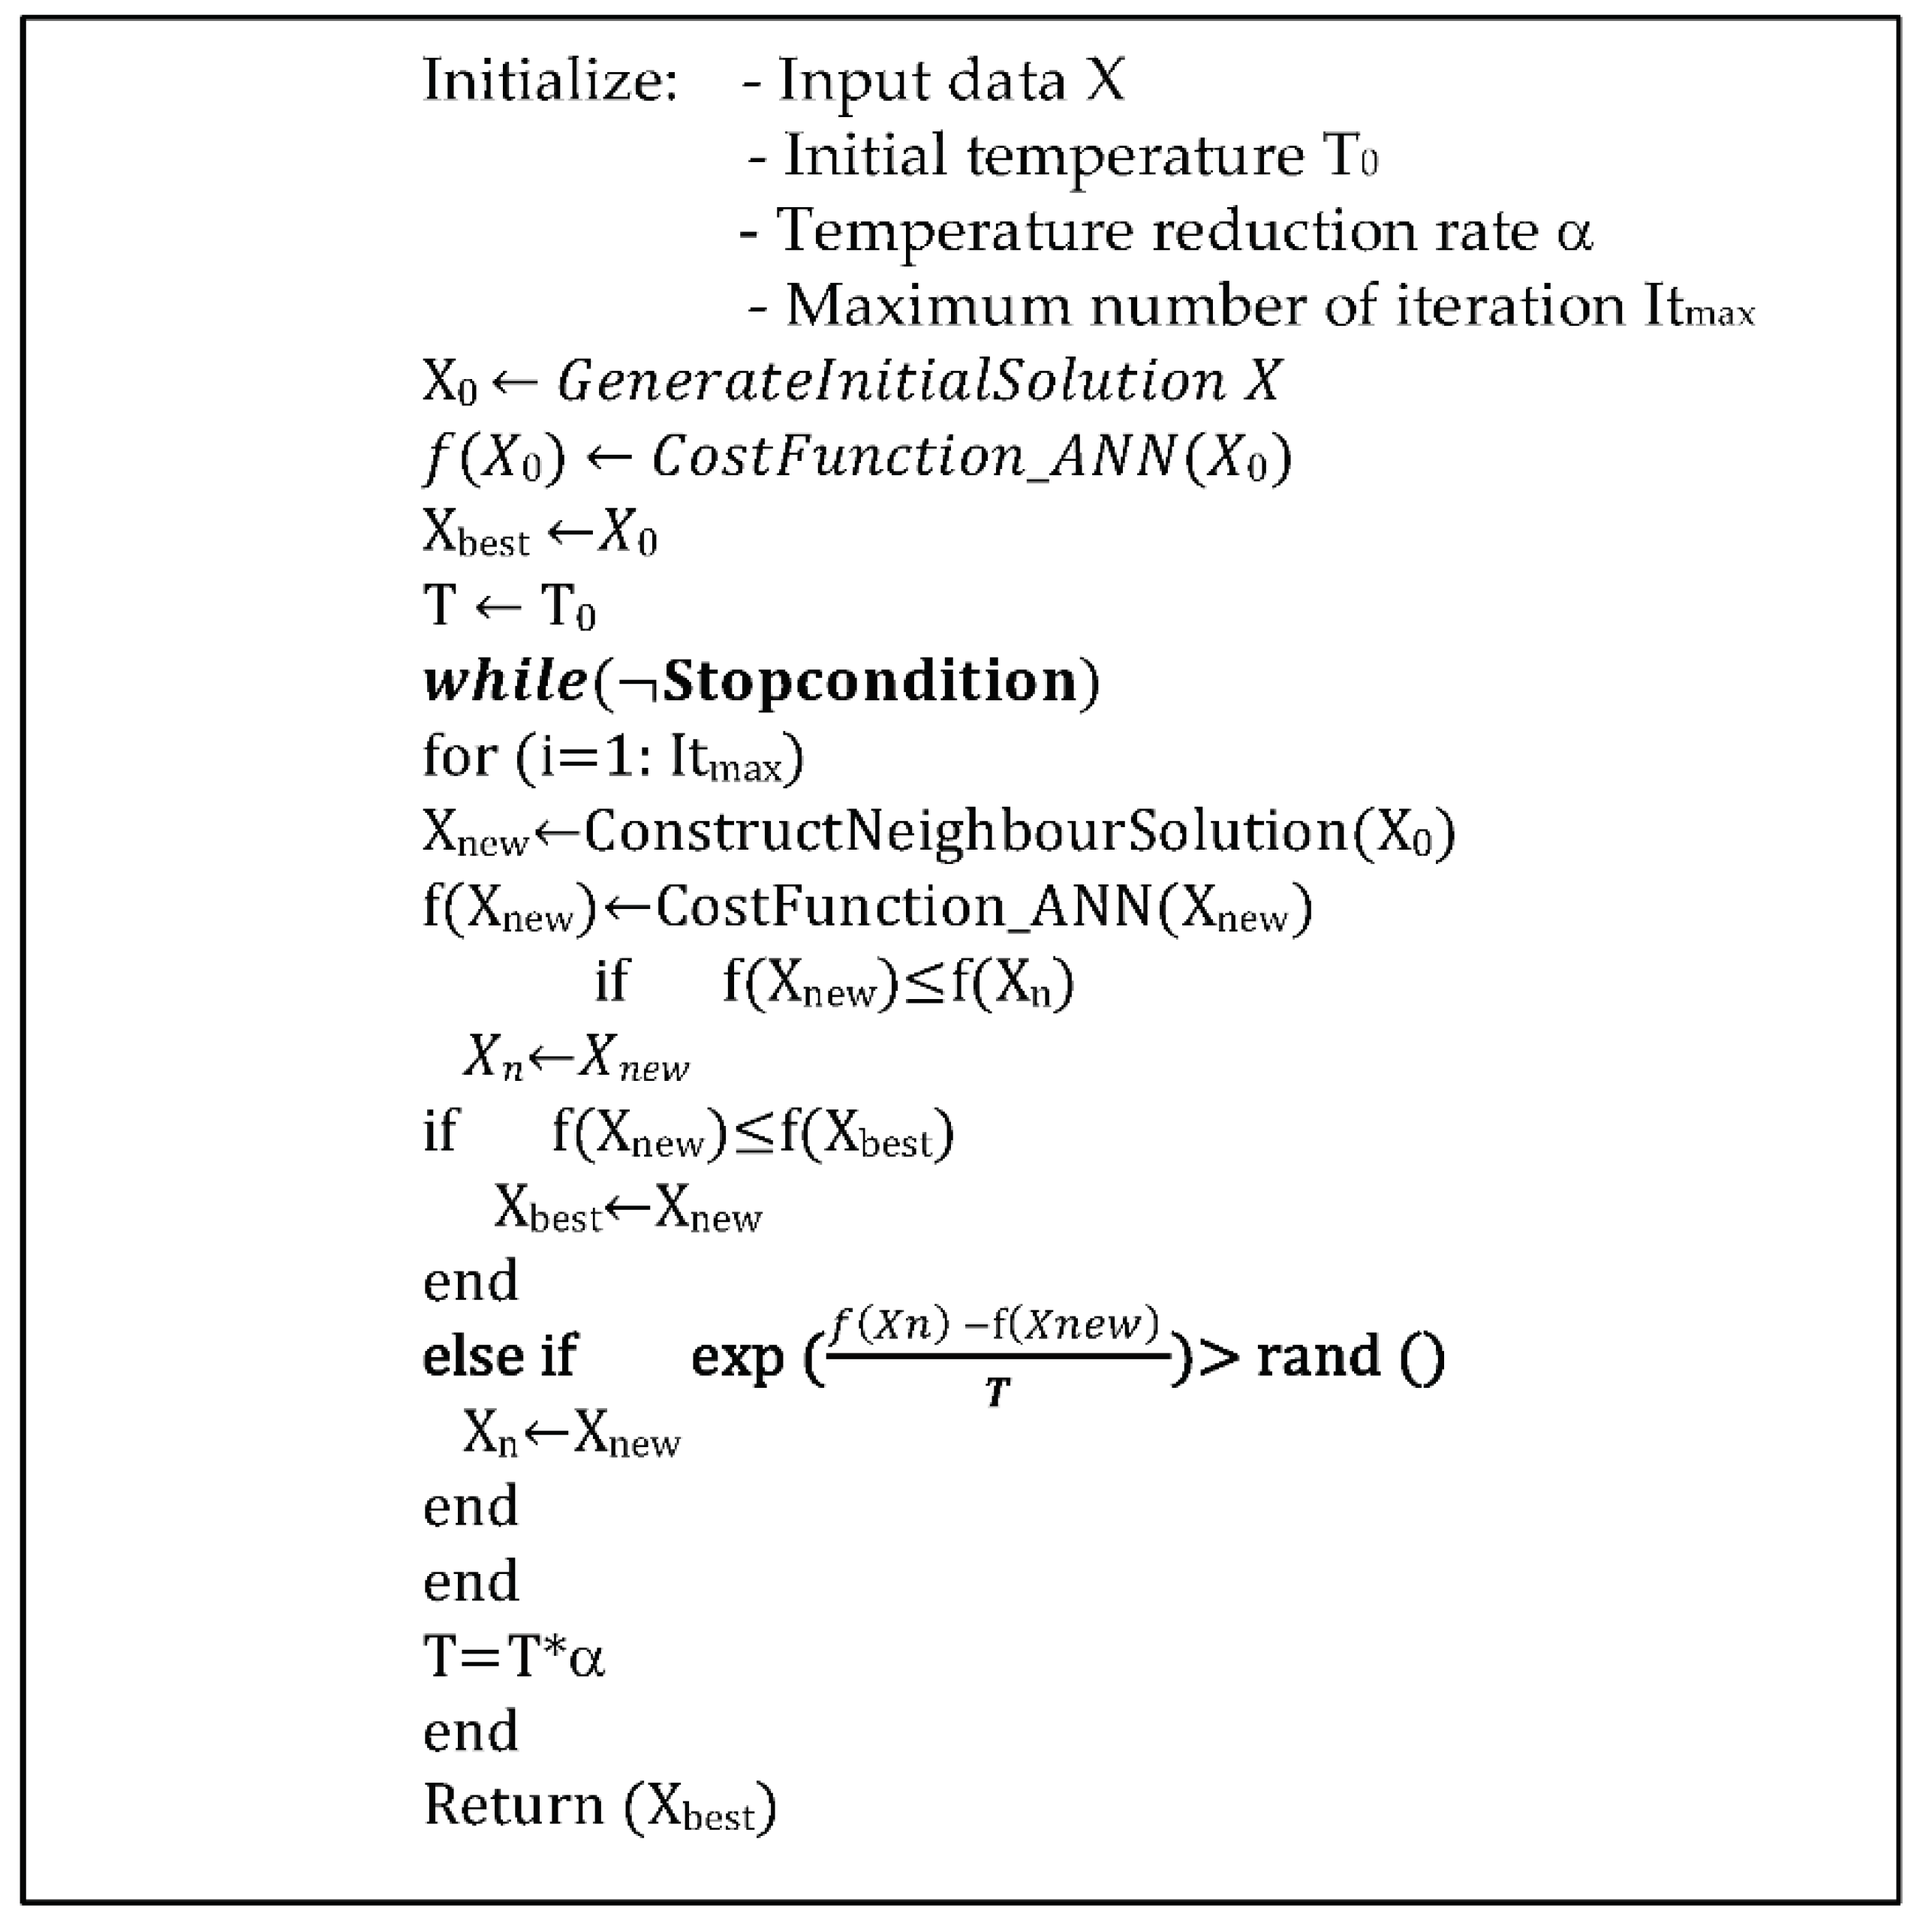
The process of feature selection is to choose the optimal feature set as the input for classification. Directly using all features may include the irrelevant features, which can cause heavy computation time, redundancy, and even reduce the predictive performance. To remedy the aforementioned problems, the initial feature set of 208 features from feature extraction was filtered by Hybrid Simulated Annealing (HSA) optimization. Simulated Annealing (SA), introduced by Kirkpatrick et al., is one of the metaheuristic algorithms inspired by the process of annealing in metallurgy [23].
The main advantage of SA over other methods is its ability to avoid being trapped at local optima. However, the use of a single method sometimes fails to optimize the problems when a huge number of features are applied or there is a high degree of epistasis between features [24]. For this reason, many researchers have proposed the hybrid approaches to combine complementary strengths and to overcome the drawbacks of single methods by embedding in them one or more steps involving alternative techniques [25]. In this study, we implemented the HSA similar to Yarpiz in Reference [26] by embedding a multi-layer perceptron neural network in SA as presented in Figure 6.
2.5. Classification
Once the features were selected, they were fit as input to the ensemble bagging classifier. It is one of the best classifiers for unbalanced data classification and was first introduced by Leo Breiman [27]. The basic concept of bagging is illustrated in Figure 7. First, bootstrap samples were drawn from the original training data to form an ensemble then each bootstrap sample was trained by a decision tree classifier separately, and finally the classifier outputs were combined and selected using majority vote.
3. Experimental Results
A total of 1200 retinal images with the resolution of 3872 × 2592 pixels in 24-bit JPEG format from Bhumibol Adulyadej Hospital were used to evaluate our proposed method in which 70% of images were used for training and the remaining images were used for testing. The images were separated into 7 groups by the ophthalmologists as illustrated in Table 2.
In this paper, the proposed method was tested using MATLAB R2016b on a laptop with i3 processor and 2 GB RAM. The experiment was conducted as outlined in the following procedure:
- All appeared lesions were segmented by improving our previous method in Reference [17].
- Eight feature sets namely morphological features, intensity features, color features, first order statistical features, Gray Level Co-occurrence Matrix (GLCM) features, Gray Level Run Length Matrix (GLRLM) features, local binary pattern features and Tamura’s texture features were extracted.
- The optimal feature set was used as input to classifiers. Support Vector Machine (SVM), Decision Tree (DT), Logistic Regression (LR), Linear Discriminant Analysis (LDA), K-Nearest Neighbors (KNN), Ensemble Bagging (EB) based classifiers were employed.
- The performance of each classifiers coupling GA, PSO, HACO, and HSA were respectively evaluated using six performance measures: sensitivity, specificity, accuracy, F-measure, precision and the Area Under Receiver Operating Characteristic curve (AUROC).
To make the quantitative evaluation of the classification performance of the proposed method, we compared the classification results with five performance measures: sensitivity, specificity accuracy, F-measure, and precision. The performance measures were obtained based on the combination of different classifiers and feature selections as tabulated in Table 3, Table 4, Table 5 and Table 6 respectively. The performance measures were also evaluated using AUROC as presented in Table 7. The experimental results in Table 3, Table 4, Table 5 and Table 6 show that HSA coupling with EB achieved the best performance compared to other coupling pairs in this study as well as compared to the related works in the literature as given in Table 8.
4. Discussion
An automatic screening system of DR is essential and a difficult task for computer-aided diagnosis systems due to the uneven illumination inside the image caused by the process of image acquisition and the main focus of retinal analysis (nasal view or macula view). In this study, we proposed a framework (see Figure 3) that differentiates DR and Non-DR automatically using fundus images. The proposed method comprised five processing steps.
Image preprocessing was applied to standardize the image size and improve the retinal image quality. Then DR lesions were segmented using an improved approach over our previous work in [15]. Post-processing was further applied to eliminate any remaining noise causing poor image quality.
After the DR lesions were segmented, the healthy retinal and DR images were differentiated based on the pixel density of the binary image (see Figure 4e) and the information of texture, color, and intensity of the detected regions (see Figure 4f), in which eight feature sets with a total of 208 features were extracted. Directly using all features from feature extraction may include the irrelevant features, which cause heavy computation time, redundancy, and even reduce predictive performance.
To deal with this problem, we studied and compared the performance of four famous feature selection methods namely GA, PSO, HSA and HACO to select the optimal feature set as the input to the classifiers. Since the input data set is unbalanced (960 DR images and only 240 non-DR images), an EB based classifier was selected. To evaluate the performance of EB classifier, GA, PSO, HAS and HACO coupling with SVM, DT, LR, LDA, KNN and EB based classifiers were employed as reported in Table 3, Table 4, Table 5 and Table 6 and the AUROC as depicted in Table 7.
To evaluate the performance of the proposed method, six performance measures were compared using: sensitivity, specificity, accuracy, F-measure, precision and AUROC. As presented in Table 8, our methods give better results compared to the conventional methods because we carefully investigate and experiment throughout each step of the process.
5. Conclusions
This paper presents an automated DR screening system for quantitative analysis of retinal images. First, during the image segmentation step, all possible candidate lesions of DR are segmented using an approach that improves over our previous method. The proposed method uses eight feature extractors to extract a total of 208 features based on the density of the pixels, texture, color, and intensity of the segmented lesions. A hybrid feature selection algorithm based on simulated annealing is utilized to select the optimal feature set as the input to ensemble bagging classifier. The proposed method is evaluated using a dataset containing 1200 images and achieves an accuracy of 97.08%, a sensitivity of 90.90%, a specificity of 98.92%, a precision of 96.15%, an F-measure of 93.45% and an AUROC of 98.34%. The classification results also reveal that the optimal feature set obtained through a hybrid simulated annealing algorithm can significantly discriminate between healthy and DR retinal images and has better performance compared to previous methods and other metaheuristic based hybrid feature selection algorithms. In future, we will further extend our research to grade the severity of DR.
Author Contributions
S.S., N.M. and K.H. conceived and designed this study. S.S. carried out the experiments, performed the simulation and data analysis, and drafted the paper; while R.P. performed the image acquisition and prepared the ground truth images.
Funding
This research received no external funding.
Acknowledgments
The authors would like to acknowledge AUN/SEED-NET for financial support of one of the authors (Mr. Syna Sreng) for his study at King Mongkut’s Institute of Technology Ladkrabang (KMITL), THAILAND, and Bhumibol Adulyadej Hospital for providing the fundus images.
Conflicts of Interest
The authors declare no conflict of interest.
References
- World Health Organization. Global Report on Diabetes; WHO: Geneva, Switzerland, 2016. [Google Scholar]
- International Diabetes Federation. IDF Diabetes Atlas, 8th ed.; IDF: Brussels, Belgium, 2017; Available online: http://www.diabetesatlas.org (accessed on 27 June 2018).
- Scanlon, P.H.; Aldington, S.; Wilkinson, C.; Matthews, D. Practical Manual of Diabetic Retinopathy Management; John Wiley & Sons: Chichester, UK, 2009; pp. 46–57. ISBN 978-1-405-17035-2. [Google Scholar]
- Acharya, U.R.; Mookiah, M.R.K.; Koh, J.E.; Tan, J.H.; Bhandary, S.V.; Rao, A.K.; Fujita, H.; Hagiwara, Y.; Chua, C.K.; Laude, A. Automated screening system for retinal health using bi-dimensional empirical mode decomposition and integrated index. Comput. Biol. Med. 2016, 75, 54–62. [Google Scholar] [CrossRef] [PubMed]
- Koh, J.E.; Acharya, U.R.; Hagiwara, Y.; Raghavendra, U.; Tan, J.H.; Sree, S.V.; Bhandary, S.V.; Rao, A.K.; Sivaprasad, S.; Chua, K.C.; et al. Diagnosis of retinal health in digital fundus images using continuous wavelet transform (CWT) and entropies. Comput. Biol. Med. 2017, 84, 89–97. [Google Scholar] [CrossRef] [PubMed]
- Kumar, P.S.; Deepak, R.U.; Sathar, A.; Sahasranamam, V.; Kumar, R.R. Automated Detection System for Diabetic Retinopathy Using Two Field Fundus Photography. Procedia Comput. Sci. 2016, 93, 486–494. [Google Scholar] [CrossRef]
- Kumar, P.S.; Kumar, R.R.; Sathar, A.; Sahasranamam, V. Automatic detection of exudates in retinal images using histogram analysis. In Proceedings of the 2013 IEEE Recent Advances in Intelligent Computational Systems (RAICS), Trivandrum, India, 19–21 December 2013; pp. 277–281. [Google Scholar]
- Kumar, P.S.; Kumar, R.R.; Sathar, A.; Sahasranamam, V. Automatic detection of red lesions in digital color retinal images. In Proceedings of the Contemporary Computing and Informatics (IC3I), Mysore, India, 27–29 November 2014; pp. 1148–1153. [Google Scholar]
- Imani, E.; Pourreza, H.R.; Banaee, T. Fully automated diabetic retinopathy screening using morphological component analysis. Comput. Med. Imaging Graph. 2015, 43, 78–88. [Google Scholar] [CrossRef] [PubMed]
- Goh, J.; Tang, L.; Saleh, G.; Al Turk, L.; Fu, Y.; Browne, A. Filtering normal retinal images for diabetic retinopathy screening using multiple classifiers. In Proceedings of the 9th International Conference on Information Technology and Applications in Biomedicine, Larnaca, Cyprus, 4–7 November 2009; pp. 1–4. [Google Scholar]
- Akram, M.U.; Khalid, S.; Tariq, A.; Khan, S.A.; Azam, F. Detection and classification of retinal lesions for grading of diabetic retinopathy. Comput. Biol. Med. 2014, 45, 161–171. [Google Scholar] [CrossRef] [PubMed]
- Aliahmad, B.; Kumar, D.K.; Jain, R. Automatic analysis of retinal vascular parameters for detection of diabetes in Indian patients with no retinopathy sign. Int. Sch. Res. Not. 2016, 2016, 8423289. [Google Scholar] [CrossRef] [PubMed]
- Siva Sundhara Raja, D.; Vasuki, S. Automatic detection of blood vessels in retinal images for diabetic retinopathy diagnosis. Comput. Math. Methods Med. 2015, 2015, 419279. [Google Scholar] [CrossRef] [PubMed]
- Rajashekar, D.; Srinivasa, G.; Vinekar, A. Comprehensive Retinal Image Analysis for Aggressive Posterior Retinopathy of Prematurity. PLoS ONE 2016, 11, e0163923. [Google Scholar] [CrossRef] [PubMed]
- Li, H.; Liu, K.R.; Lo, S.C. Fractal modeling and segmentation for the enhancement of microcalcifications in digital mammograms. IEEE Trans. Med. Imaging 1997, 16, 785–798. [Google Scholar] [CrossRef] [PubMed] [Green Version]
- Akram, F.; Garcia, M.A.; Puig, D. Active contours driven by local and global fitted image models for image segmentation robust to intensity inhomogeneity. PLoS ONE 2017, 12, e0174813. [Google Scholar] [CrossRef] [PubMed]
- Sreng, S.; Maneerat, N.; Isarakorn, D.; Hamamoto, K.; Panjaphongse, R. Primary screening of diabetic retinopathy based on integrating morphological operation and support vector machine. In Proceedings of the International Conference on Intelligent Informatics and Biomedical Sciences (ICIIBMS), Okinawa, Japan, 24–26 November 2017; pp. 250–254. [Google Scholar]
- Sreng, S.; Maneerat, N.; Isarakorn, D.; Pasaya, B.; Takada, J.I.; Panjaphongse, R.; Varakulsiripunth, R. Automatic exudate extraction for early detection of Diabetic Retinopathy. In Proceedings of the International Conference on Information Technology and Electrical Engineering (ICITEE), Yogyakarta, Indonesia, 7–8 October 2013; pp. 31–35. [Google Scholar]
- GLCM texture features. Available online: https://www.mathworks.com/matlabcentral/fileexchange/22187-glcm-texture-features (accessed on 8 June 2018).
- Tang, X. Texture information in run-length matrices. IEEE Trans. Image Process. 1998, 7, 1602–1609. [Google Scholar] [CrossRef] [PubMed]
- Ojala, T.; Pietikainen, M.; Maenpaa, T. Multiresolution Gray Scale and Rotation Invariant Texture Classification With Local Binary Patterns. IEEE Trans. Pattern Anal. Mach. Intell. 2002, 24, 971–987. [Google Scholar] [CrossRef]
- Ojala, T.; Pietikäinen, M.; Harwood, D. A comparative study of texture measures with classification based on featured distributions. Pattern Recognit. 1996, 29, 51–59. [Google Scholar] [CrossRef]
- Kirkpatrick, S.; Gelatt, C.D.; Vecchi, M.P. Optimization by simulated annealing. Science 1983, 220, 671–680. [Google Scholar] [CrossRef] [PubMed]
- Lee, J.S.; Park, C.H.; Ebrahimi, T. Theory and applications of hybrid simulated annealing. In Handbook of Optimization; Springer: Berlin, Heidelberg, 2013; pp. 395–422. [Google Scholar]
- Anghinolfi, D.; Paolucci, M. Simulated Annealing as an Intensification Component in Hybrid Population-Based Metaheuristics. In Simulated Annealing; InTechOpen: Vienna, Austria, 2008. [Google Scholar]
- Kalami, S.M. Feature Selection using Metaheuristics and EAs. Available online: www.yarpiz.com (accessed on 7 May 2018).
- Breiman, L. Bagging predictors. Machine Learn. 1996, 24, 123–140. [Google Scholar] [CrossRef] [Green Version]
- Holland, J.H. Adaptation in Natural and Artificial Systems: An Introductory Analysis with Applications to Biology, Control, and Artificial Intelligence; University Michigan Press: Ann Arbor, MI, USA, 1975. [Google Scholar]
- Kennedy, J. Particle swarm optimization. In Encyclopedia of Machine Learning; Springer: Boston, MA, USA, 2011; pp. 760–766. [Google Scholar]
Figure 1.
Healthy fundus image and diabetic retinopathy image.

Figure 2.
Representative pathological signs of DR: (a) mild non-proliferative diabetic retinopathy; (b) severe non-proliferative diabetic retinopathy; (c) neovascularization; (d) vitreous hemorrhages; (e) fibrous proliferations and (f) laser scars after treatment.
Figure 2.
Representative pathological signs of DR: (a) mild non-proliferative diabetic retinopathy; (b) severe non-proliferative diabetic retinopathy; (c) neovascularization; (d) vitreous hemorrhages; (e) fibrous proliferations and (f) laser scars after treatment.

Figure 3.
Flowchart of the proposed system.

Figure 4.
Image quality assessment metrics: (a) peak signal to noise ratio (PSNR) comparison for filtering methods, and (b) contrast improvement index (CII) comparison for contrast enhancement methods.
Figure 4.
Image quality assessment metrics: (a) peak signal to noise ratio (PSNR) comparison for filtering methods, and (b) contrast improvement index (CII) comparison for contrast enhancement methods.

Figure 5.
The processing steps of image segmentation: (a) Retinal image; (b) DR lesions detection; (c) blood vessels elimination; (d) rectangular mask (e) resulted image after post processing step and (f) segmented result in grayscale image.
Figure 5.
The processing steps of image segmentation: (a) Retinal image; (b) DR lesions detection; (c) blood vessels elimination; (d) rectangular mask (e) resulted image after post processing step and (f) segmented result in grayscale image.

Figure 6.
Pseudo code for hybrid simulated annealing.

Figure 7.
Flowchart of ensemble bagging classifier.


Table 1.
Features extraction and its description.
| Features | Description | |
|---|---|---|
| Morphological features | F1 | Total area of detected regions |
| F2 | Total length of boundary of detected regions | |
| Intensity features | F3–F5 | The mean values of maximum intensity, mean intensity and minimum intensity of the segmented image. |
| Color features | F6–F8 | The mean intensity in hue, saturation and value in HSV color space of the segmented image. |
| First order statistical features | F9–F15 | The mean, standard deviation, smoothness, variance, skewness, kurtosis and energy of intensity of the segmented image. |
| Gray Level Co-occurrence Matrix (GLCM) features | F16–F103 | Four orientations of 22 features in GLCM matrix of the segmented image [19] |
| Gray Level Run Length Matrix (GLRLM) features | F104–F147 | Four orientations of 11 features in GLRLM matrix of the segmented image [20] |
| Local Binary Pattern Features | F148–F206 | 59 features from local binary pattern features [21] |
| Tamura’s Texture Features | F207–F208 | Coarseness value and Contrast value from Tamura’s texture features of the segmented image [22] |
Table 2.
Number of each pathological signs of retinal images.
| Pathological Signs of Retinal Images | Number of Images |
|---|---|
| Healthy retinal images | 218 |
| Mild and Moderate NPDR | 318 |
| Severe NPDR | 312 |
| New blood vessels growing | 36 |
| Neovascularization | 115 |
| Fibrous proliferations | 160 |
| Scar | 41 |
| Total | 1200 |
Table 3.
Classification results based on hybrid simulated annealing coupling with different classifiers.
Table 3.
Classification results based on hybrid simulated annealing coupling with different classifiers.
| Classifiers | Sensitivity | Specificity | Accuracy | Precision | F-measure |
|---|---|---|---|---|---|
| SVM | 89.09% | 96.75% | 95.00% | 89.09% | 89.09% |
| DT | 87.27% | 94.05% | 92.50% | 81.35% | 84.21% |
| LR | 72.72% | 94.59% | 89.58% | 80.00% | 76.19% |
| LDA | 90.90% | 68.64% | 73.75% | 46.29% | 61.35% |
| KNN | 85.45% | 95.13% | 92.91% | 83.92% | 84.68% |
| EB | 90.90% | 98.92% | 97.08% | 96.15% | 93.45% |
Table 4.
Classification results based on genetic algorithm coupling with different classifiers.
| Classifiers | Sensitivity | Specificity | Accuracy | Precision | F-measure |
|---|---|---|---|---|---|
| SVM | 72.72% | 96.21% | 90.83% | 85.10% | 78.43% |
| DT | 81.81% | 97.29% | 93.75% | 90.00% | 85.71% |
| LR | 47.27% | 94.05% | 83.33% | 70.72% | 56.52% |
| LDA | 94.54% | 65.40% | 72.08% | 44.82% | 60,82% |
| KNN | 83.63% | 91.89% | 90.00% | 75.41% | 79.31% |
| EB | 85.45% | 97.83% | 95.00% | 92.16% | 88.68% |
Table 5.
Classification results based on particle swarm optimization coupling with different classifiers.
Table 5.
Classification results based on particle swarm optimization coupling with different classifiers.
| Classifiers | Sensitivity | Specificity | Accuracy | Precision | F-measure |
|---|---|---|---|---|---|
| SVM | 90.90% | 95.13% | 94.16% | 84.75% | 87.72% |
| DT | 89.09% | 95.67% | 94.16% | 85.96% | 87.50% |
| LR | 54.54% | 96.76% | 87.08% | 83.33% | 65.93% |
| LDA | 92.72% | 68.64% | 74.16% | 46.79% | 62.19% |
| KNN | 90.90% | 94.40% | 93.33% | 81.97% | 86.20% |
| EB | 90.90% | 97.83% | 96.25% | 92.59% | 91.74% |
Table 6.
Classification results based on hybrid ant colony optimization coupling with different classifiers.
Table 6.
Classification results based on hybrid ant colony optimization coupling with different classifiers.
| Classifiers | Sensitivity | Specificity | Accuracy | Precision | F-measure |
|---|---|---|---|---|---|
| SVM | 85.45% | 95.13% | 92.92% | 83.93% | 84.68% |
| DT | 80.00% | 96.21% | 92.50% | 86.27% | 83.02% |
| LR | 58.18% | 95.13% | 86.67% | 78.05% | 66.67% |
| LDA | 90.90% | 68.65% | 73.75% | 46.29% | 61.35% |
| KNN | 90.90% | 94.05% | 93.33% | 81.97% | 86.20% |
| EB | 90.90% | 96.75% | 95.42% | 89.28% | 90.90% |
Table 7.
Area under receiver operating characteristic curve of different pairs of feature selection and classifiers.
Table 7.
Area under receiver operating characteristic curve of different pairs of feature selection and classifiers.
| AUROC | ||||
|---|---|---|---|---|
| Classifiers | HSA | GA | PSO | HACO |
| DT | 93.40% | 89.11% | 92.06% | 90.57% |
| SVM | 98.15% | 95.25% | 97.91% | 94.94% |
| LR | 94.75% | 89.34% | 94.07% | 91.62% |
| LDA | 87.79% | 89.29% | 87.37% | 87.53% |
| KNN | 97.87% | 95.00% | 97.31% | 97.86% |
| EB | 98.34% | 97.31% | 97.93% | 97.79% |
Table 8.
Comparison of the proposed method with previous works.
| Authors | No. of Images | Methods/Input Features/Classifiers | Performance |
|---|---|---|---|
| Goh et al. 2009 [10] | 1000 |
| Sen = 92.00% Sp = 91.00% |
| Imani et al., 2015 [9] | 930 |
| Acc = 92.82% Sen = 92.01% Sp = 95.45% |
| Kumar et al., 2016 [6] | 1344 |
| Sen = 80% Sp = 50% |
| Acharya et al., 2016 [4] | 800 |
| Acc = 88.63% Sen = 86.25% SP = 91% |
| Koh et al., 2017 [5] | 1486 |
| Sen = 89.37% SP = 95.58% Acc = 92.48% |
| Proposed method | 1200 |
| Sen = 90.90% Sp = 98.92% Acc = 97.08% Pre = 96.15% F = 93.45% AUROC = 98.34% |
© 2018 by the authors. Licensee MDPI, Basel, Switzerland. This article is an open access article distributed under the terms and conditions of the Creative Commons Attribution (CC BY) license (http://creativecommons.org/licenses/by/4.0/).
Share and Cite
MDPI and ACS Style
Sreng, S.; Maneerat, N.; Hamamoto, K.; Panjaphongse, R. Automated Diabetic Retinopathy Screening System Using Hybrid Simulated Annealing and Ensemble Bagging Classifier. Appl. Sci. 2018, 8, 1198. https://doi.org/10.3390/app8071198
AMA Style
Sreng S, Maneerat N, Hamamoto K, Panjaphongse R. Automated Diabetic Retinopathy Screening System Using Hybrid Simulated Annealing and Ensemble Bagging Classifier. Applied Sciences. 2018; 8(7):1198. https://doi.org/10.3390/app8071198
Chicago/Turabian StyleSreng, Syna, Noppadol Maneerat, Kazuhiko Hamamoto, and Ronakorn Panjaphongse. 2018. "Automated Diabetic Retinopathy Screening System Using Hybrid Simulated Annealing and Ensemble Bagging Classifier" Applied Sciences 8, no. 7: 1198. https://doi.org/10.3390/app8071198
Note that from the first issue of 2016, this journal uses article numbers instead of page numbers. See further details here.