A Quantitative Structure-Property Relationship Model Based on Chaos-Enhanced Accelerated Particle Swarm Optimization Algorithm and Back Propagation Artificial Neural Network


Abstract
:Featured Application
Abstract
1. Introduction
2. Modeling Theory and Methods
2.1. Chaos-Enhanced Accelerated Particle Swarm Optimization Algorithm
2.2. QSPR Model Based on the Hybrid Intelligent Method
2.3. Model Evaluation
3. Experimental Study
3.1. Experimental Data
3.2. Screening of Molecular Descriptors
- Construction of molecular structure. This is performed using Chemdraw UItra 7.0 software.
- Optimization of molecular structure. The molecular structure is further optimized in Hyper Chem 7.5 software.
- Calculation of molecular descriptors. The optimized molecular structure is imported into CODESSA software and the corresponding molecular descriptors are obtained by calculation.
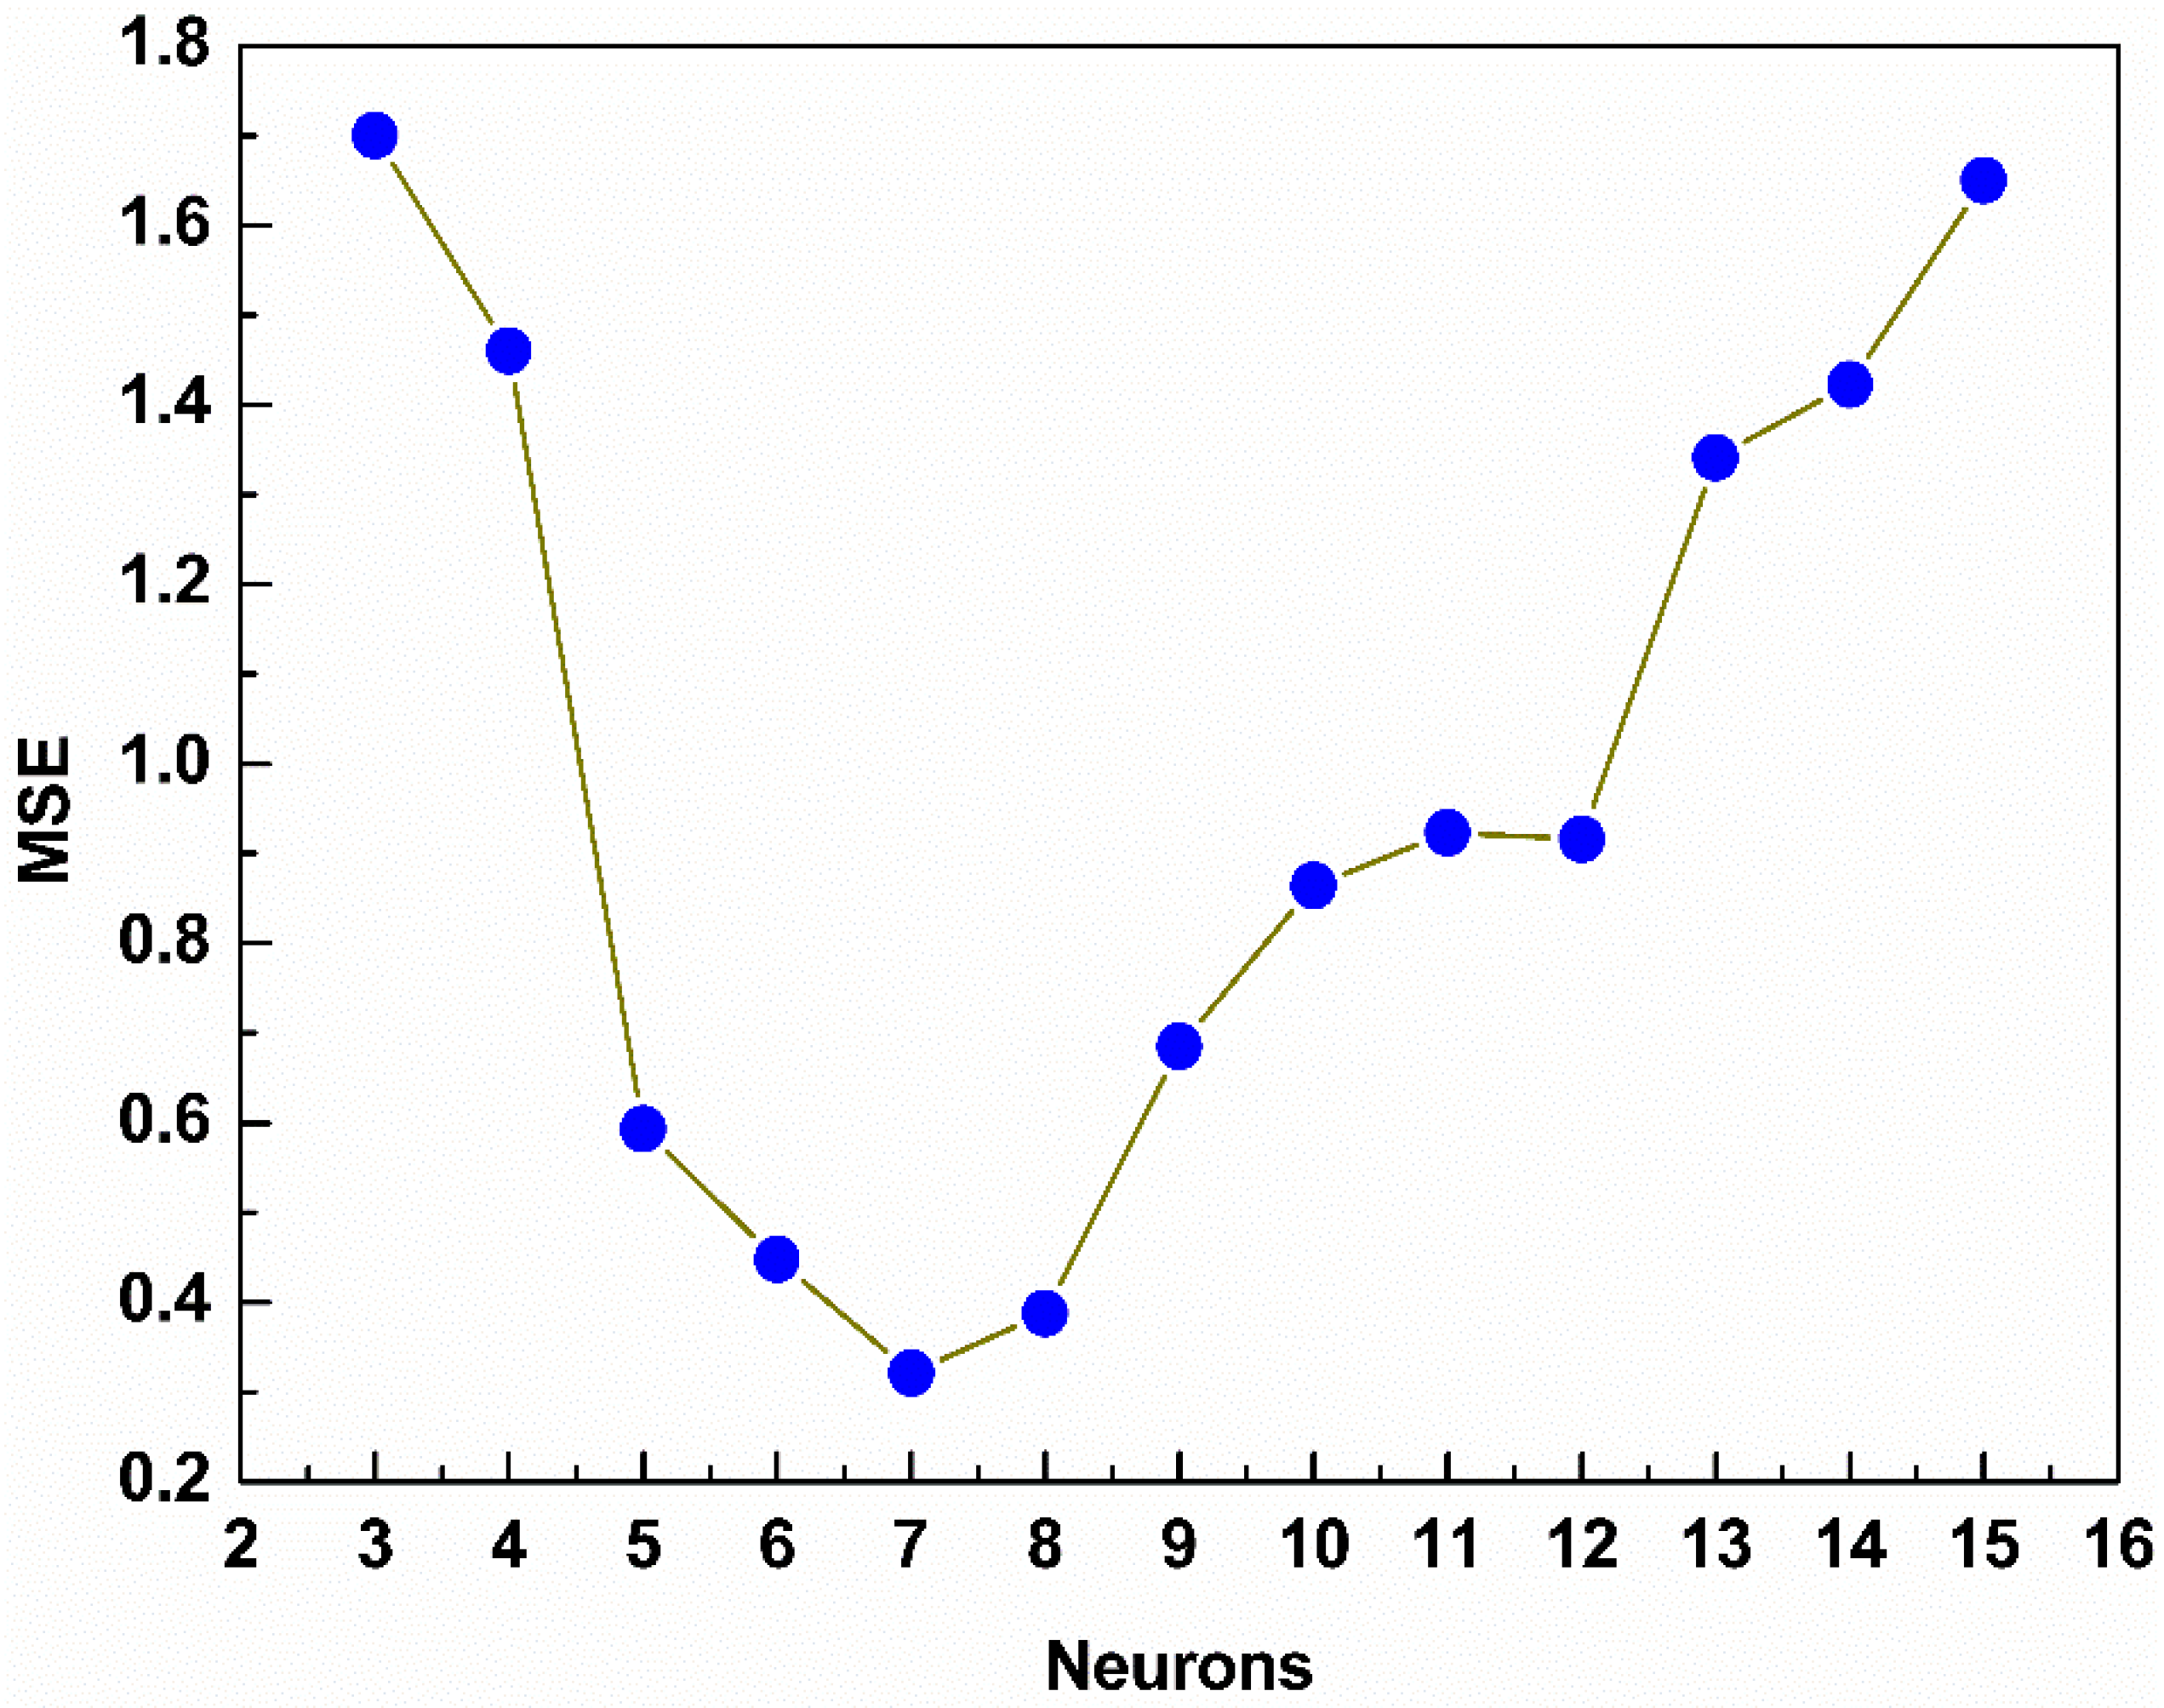
3.3. Model Structure
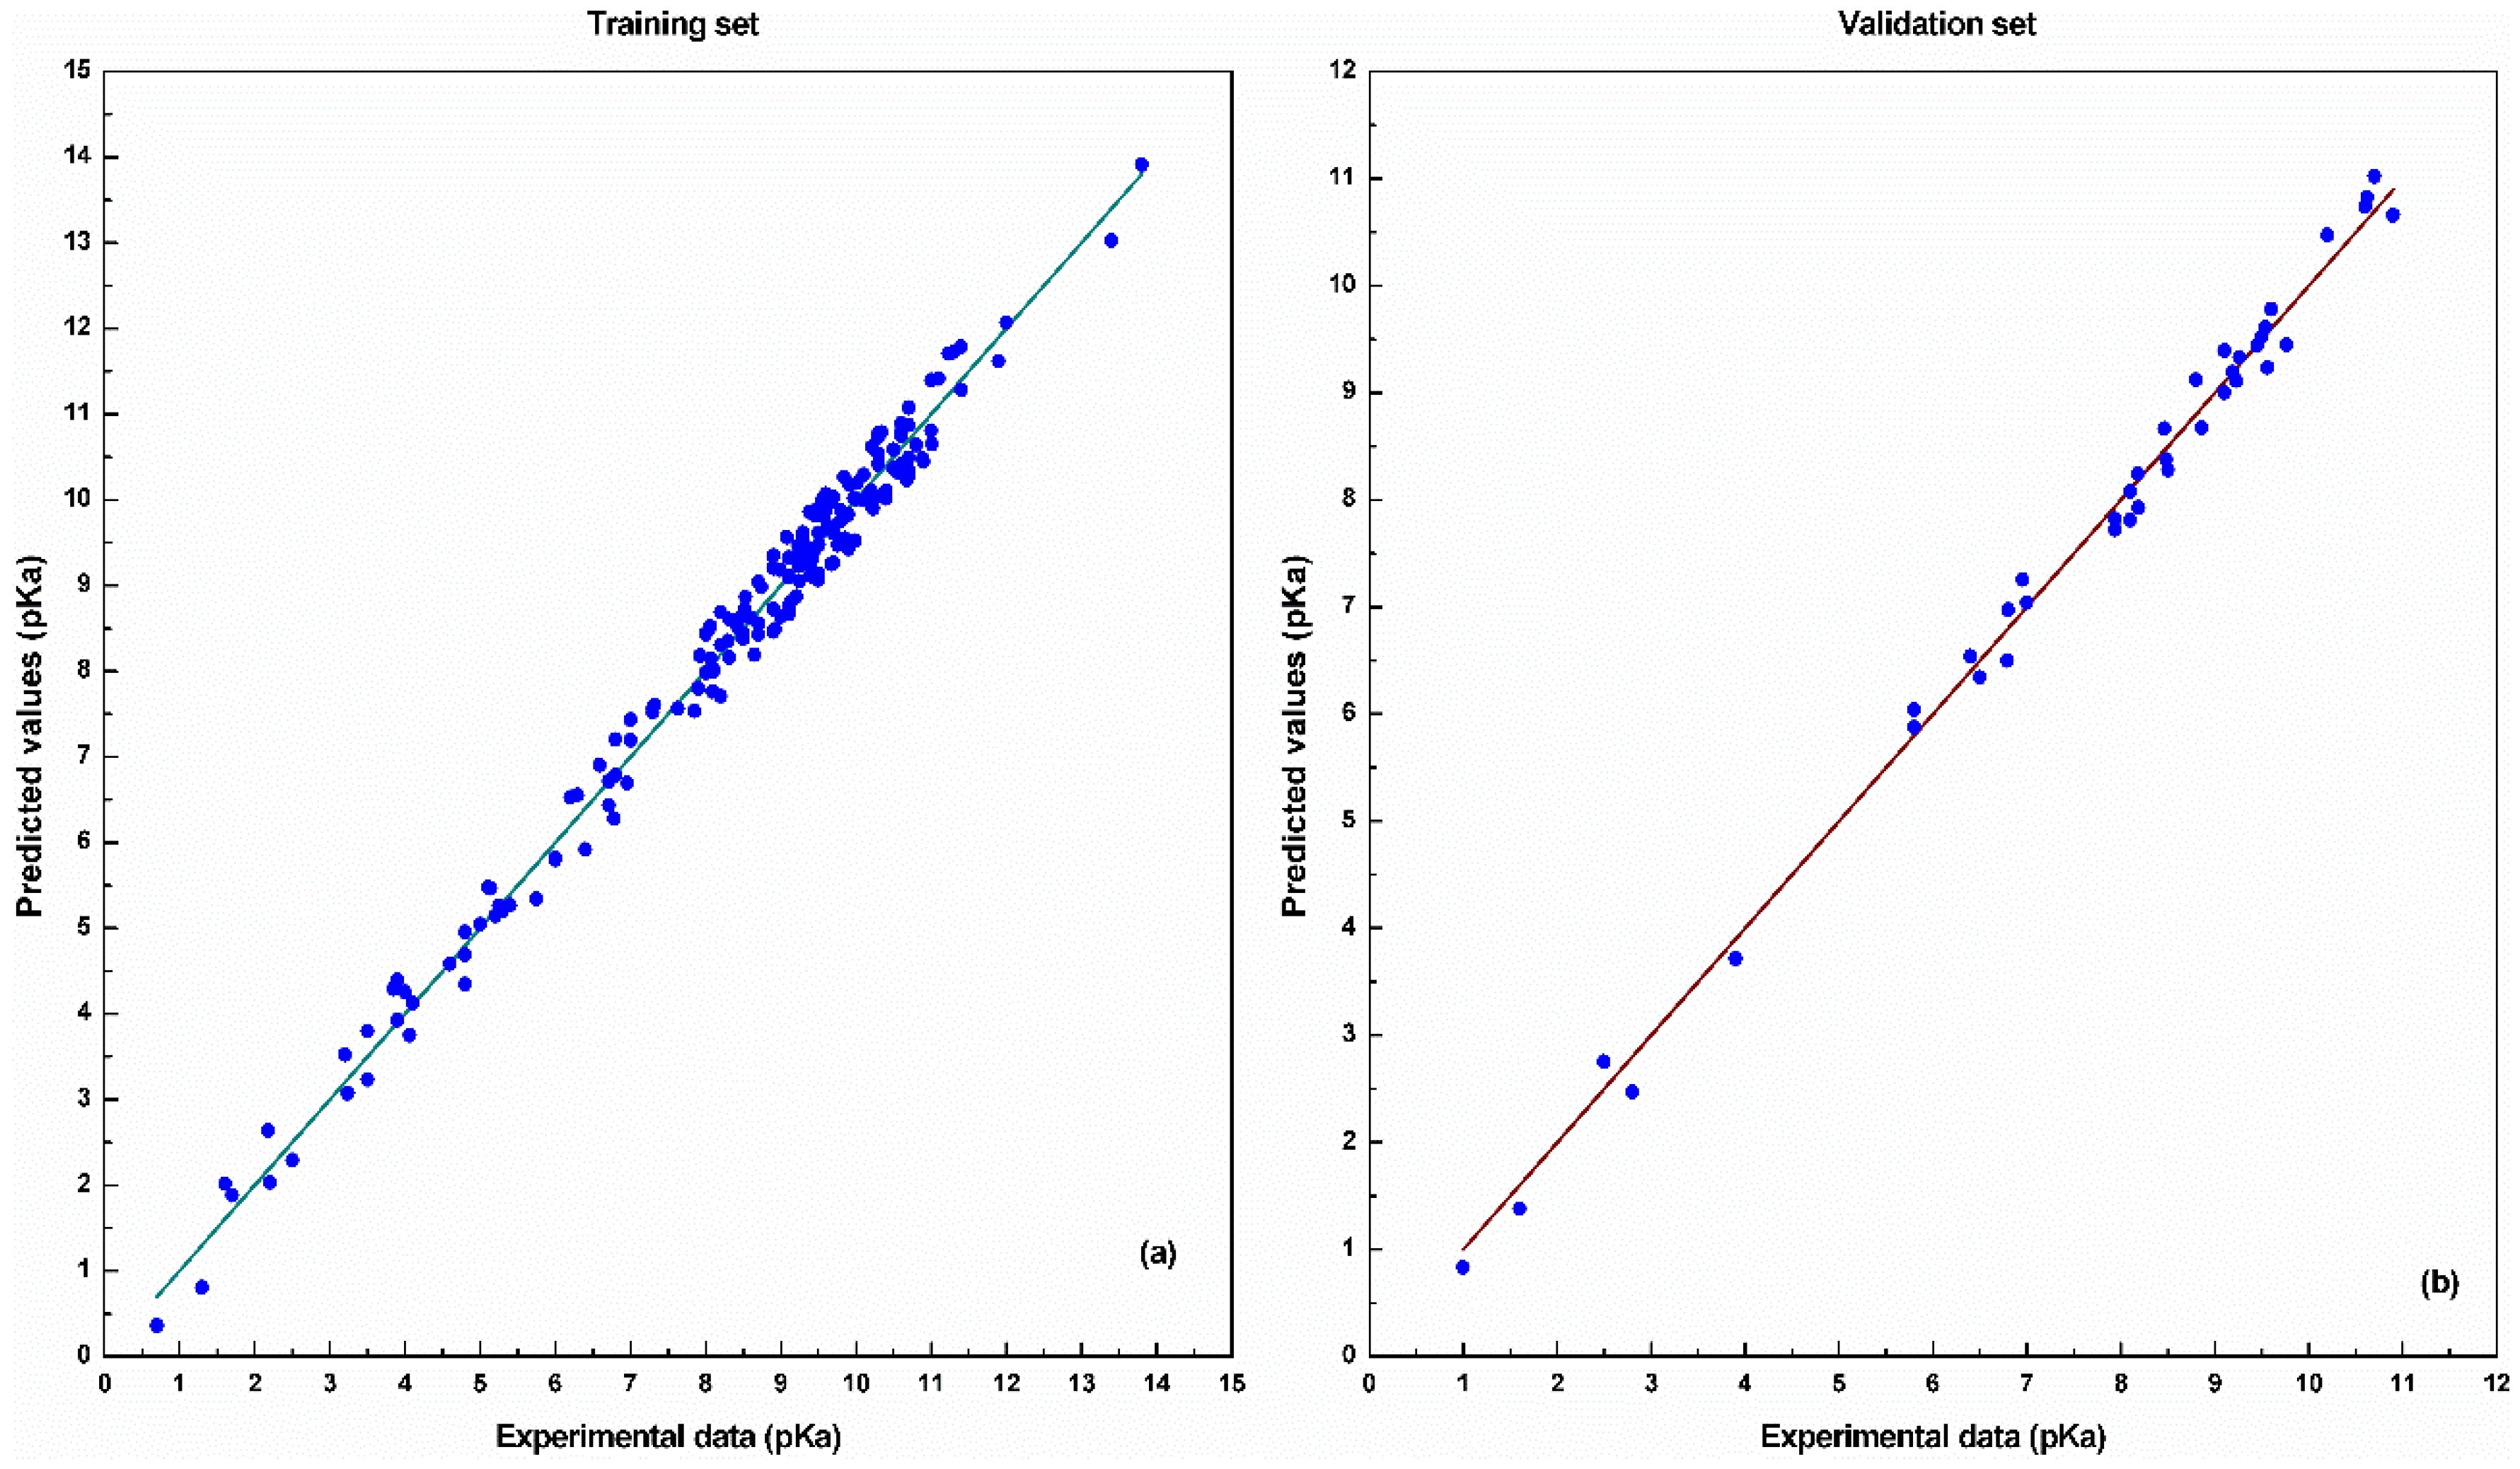
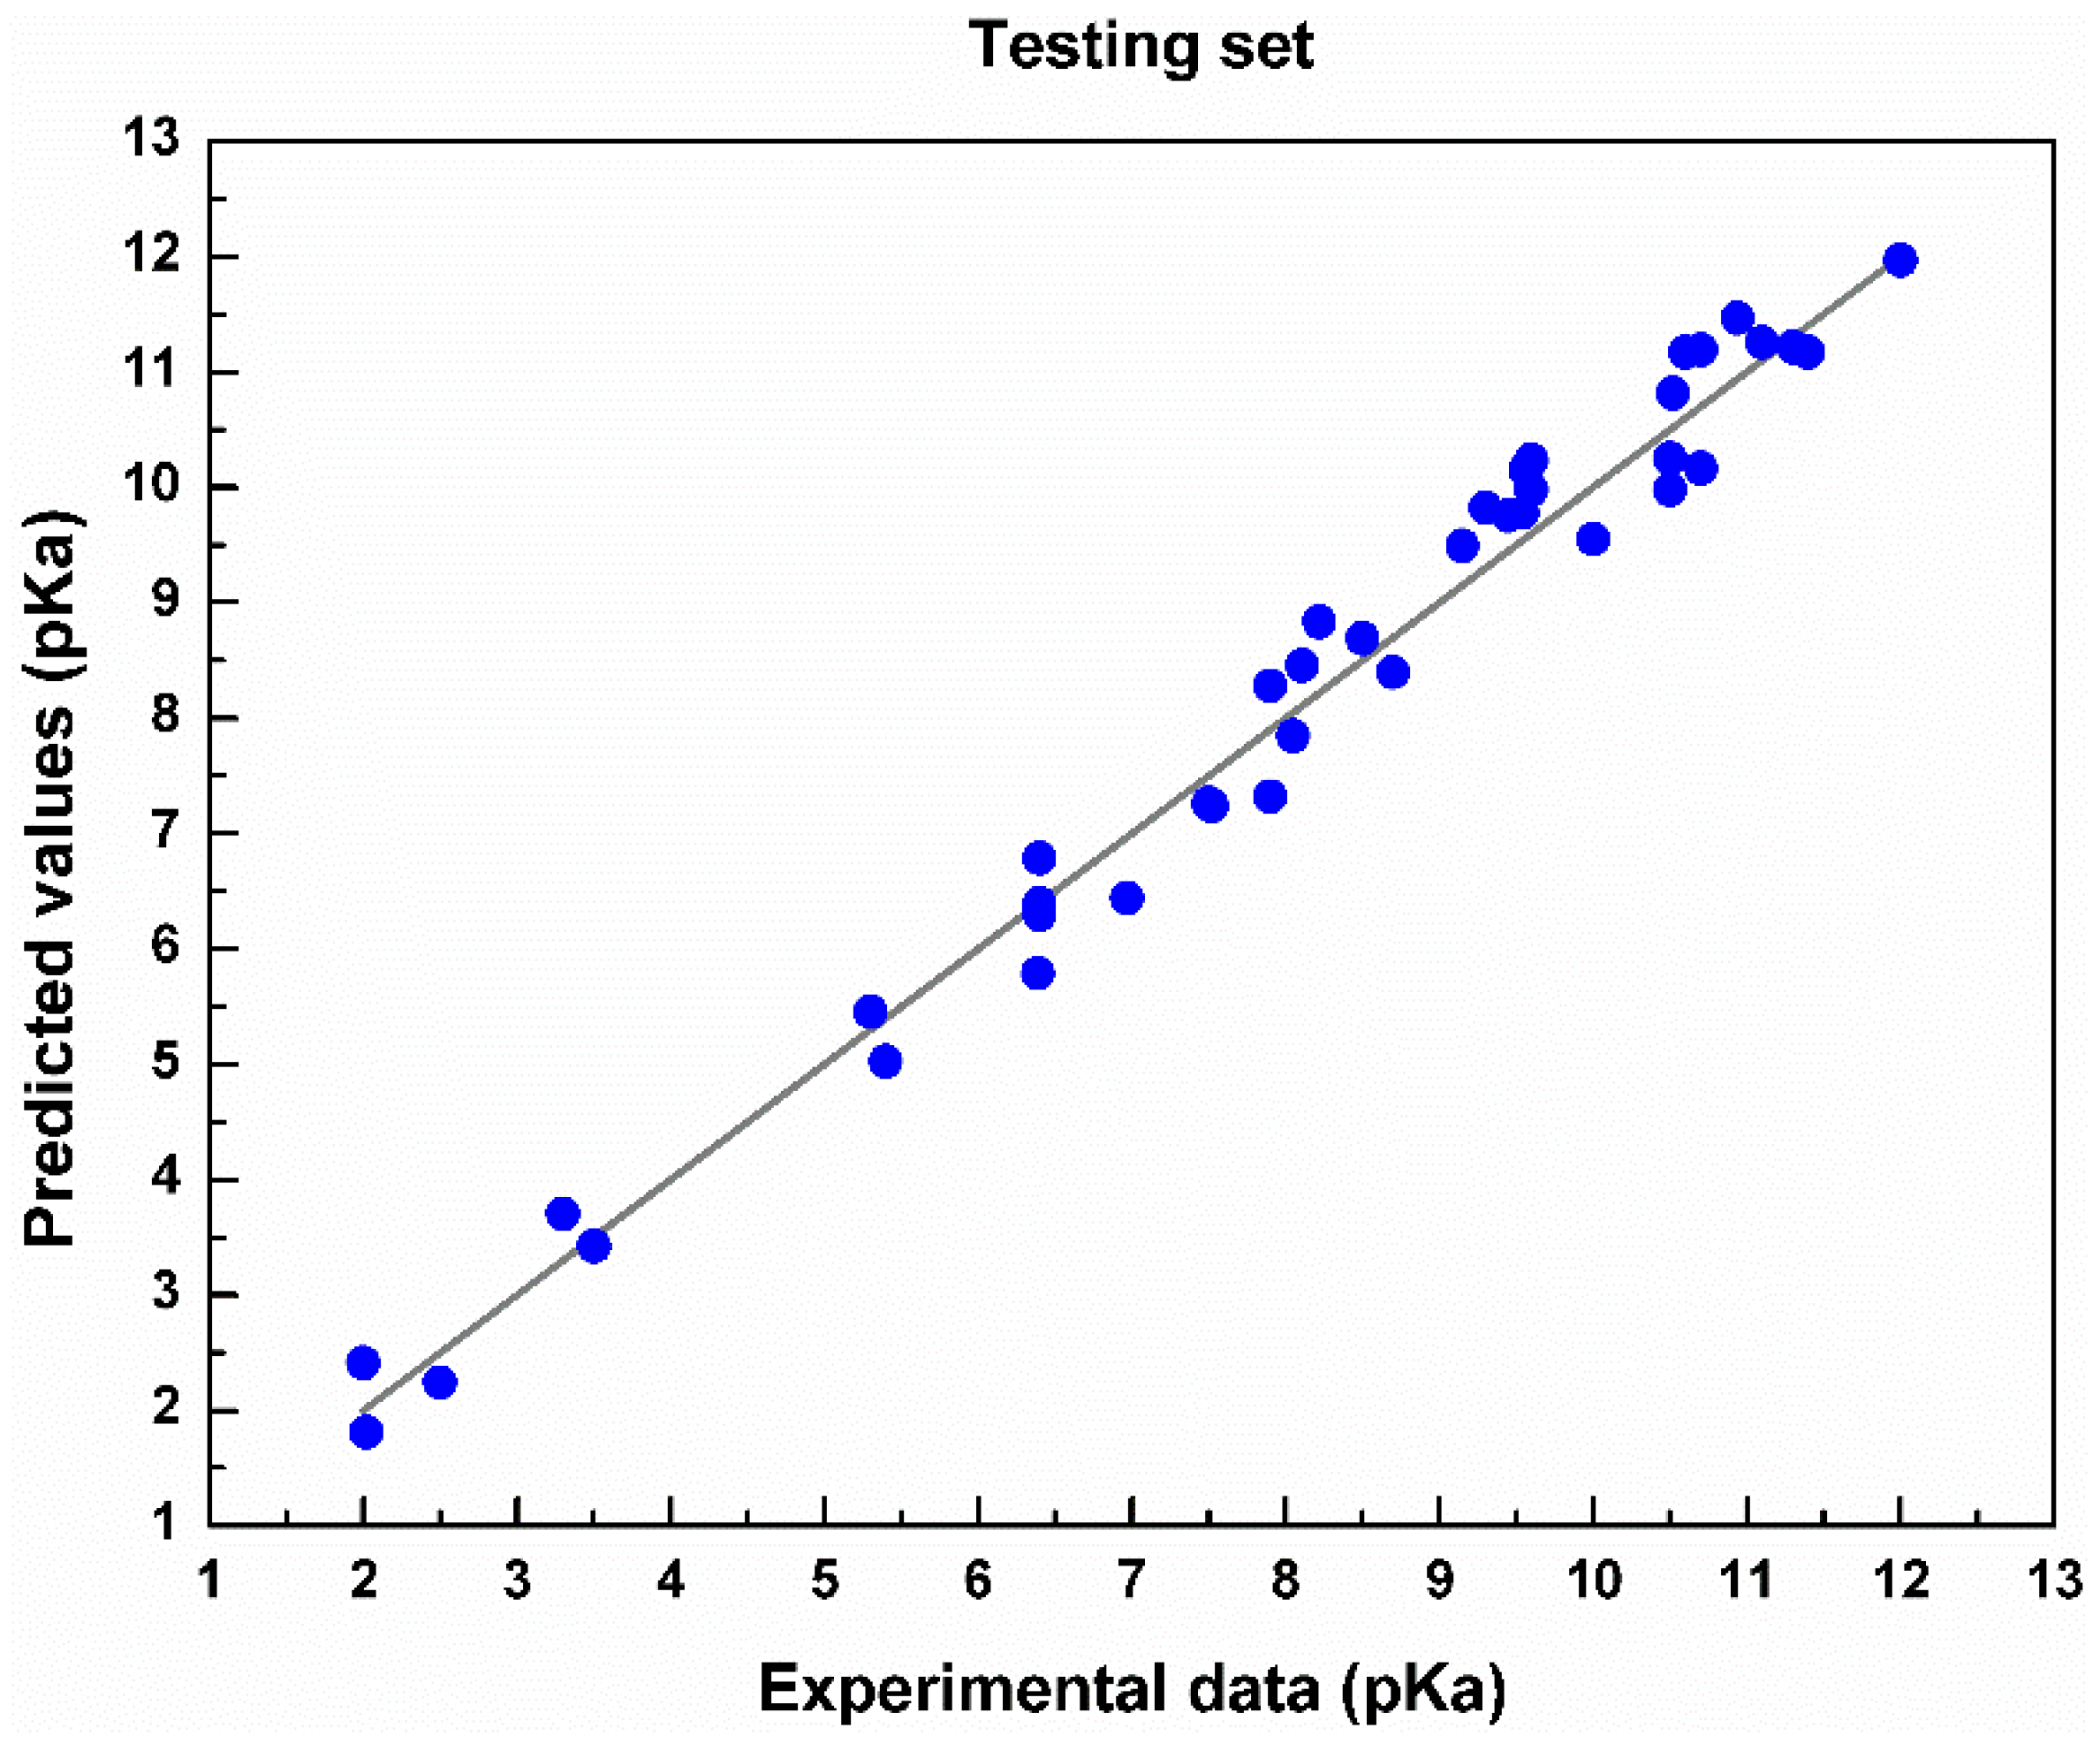
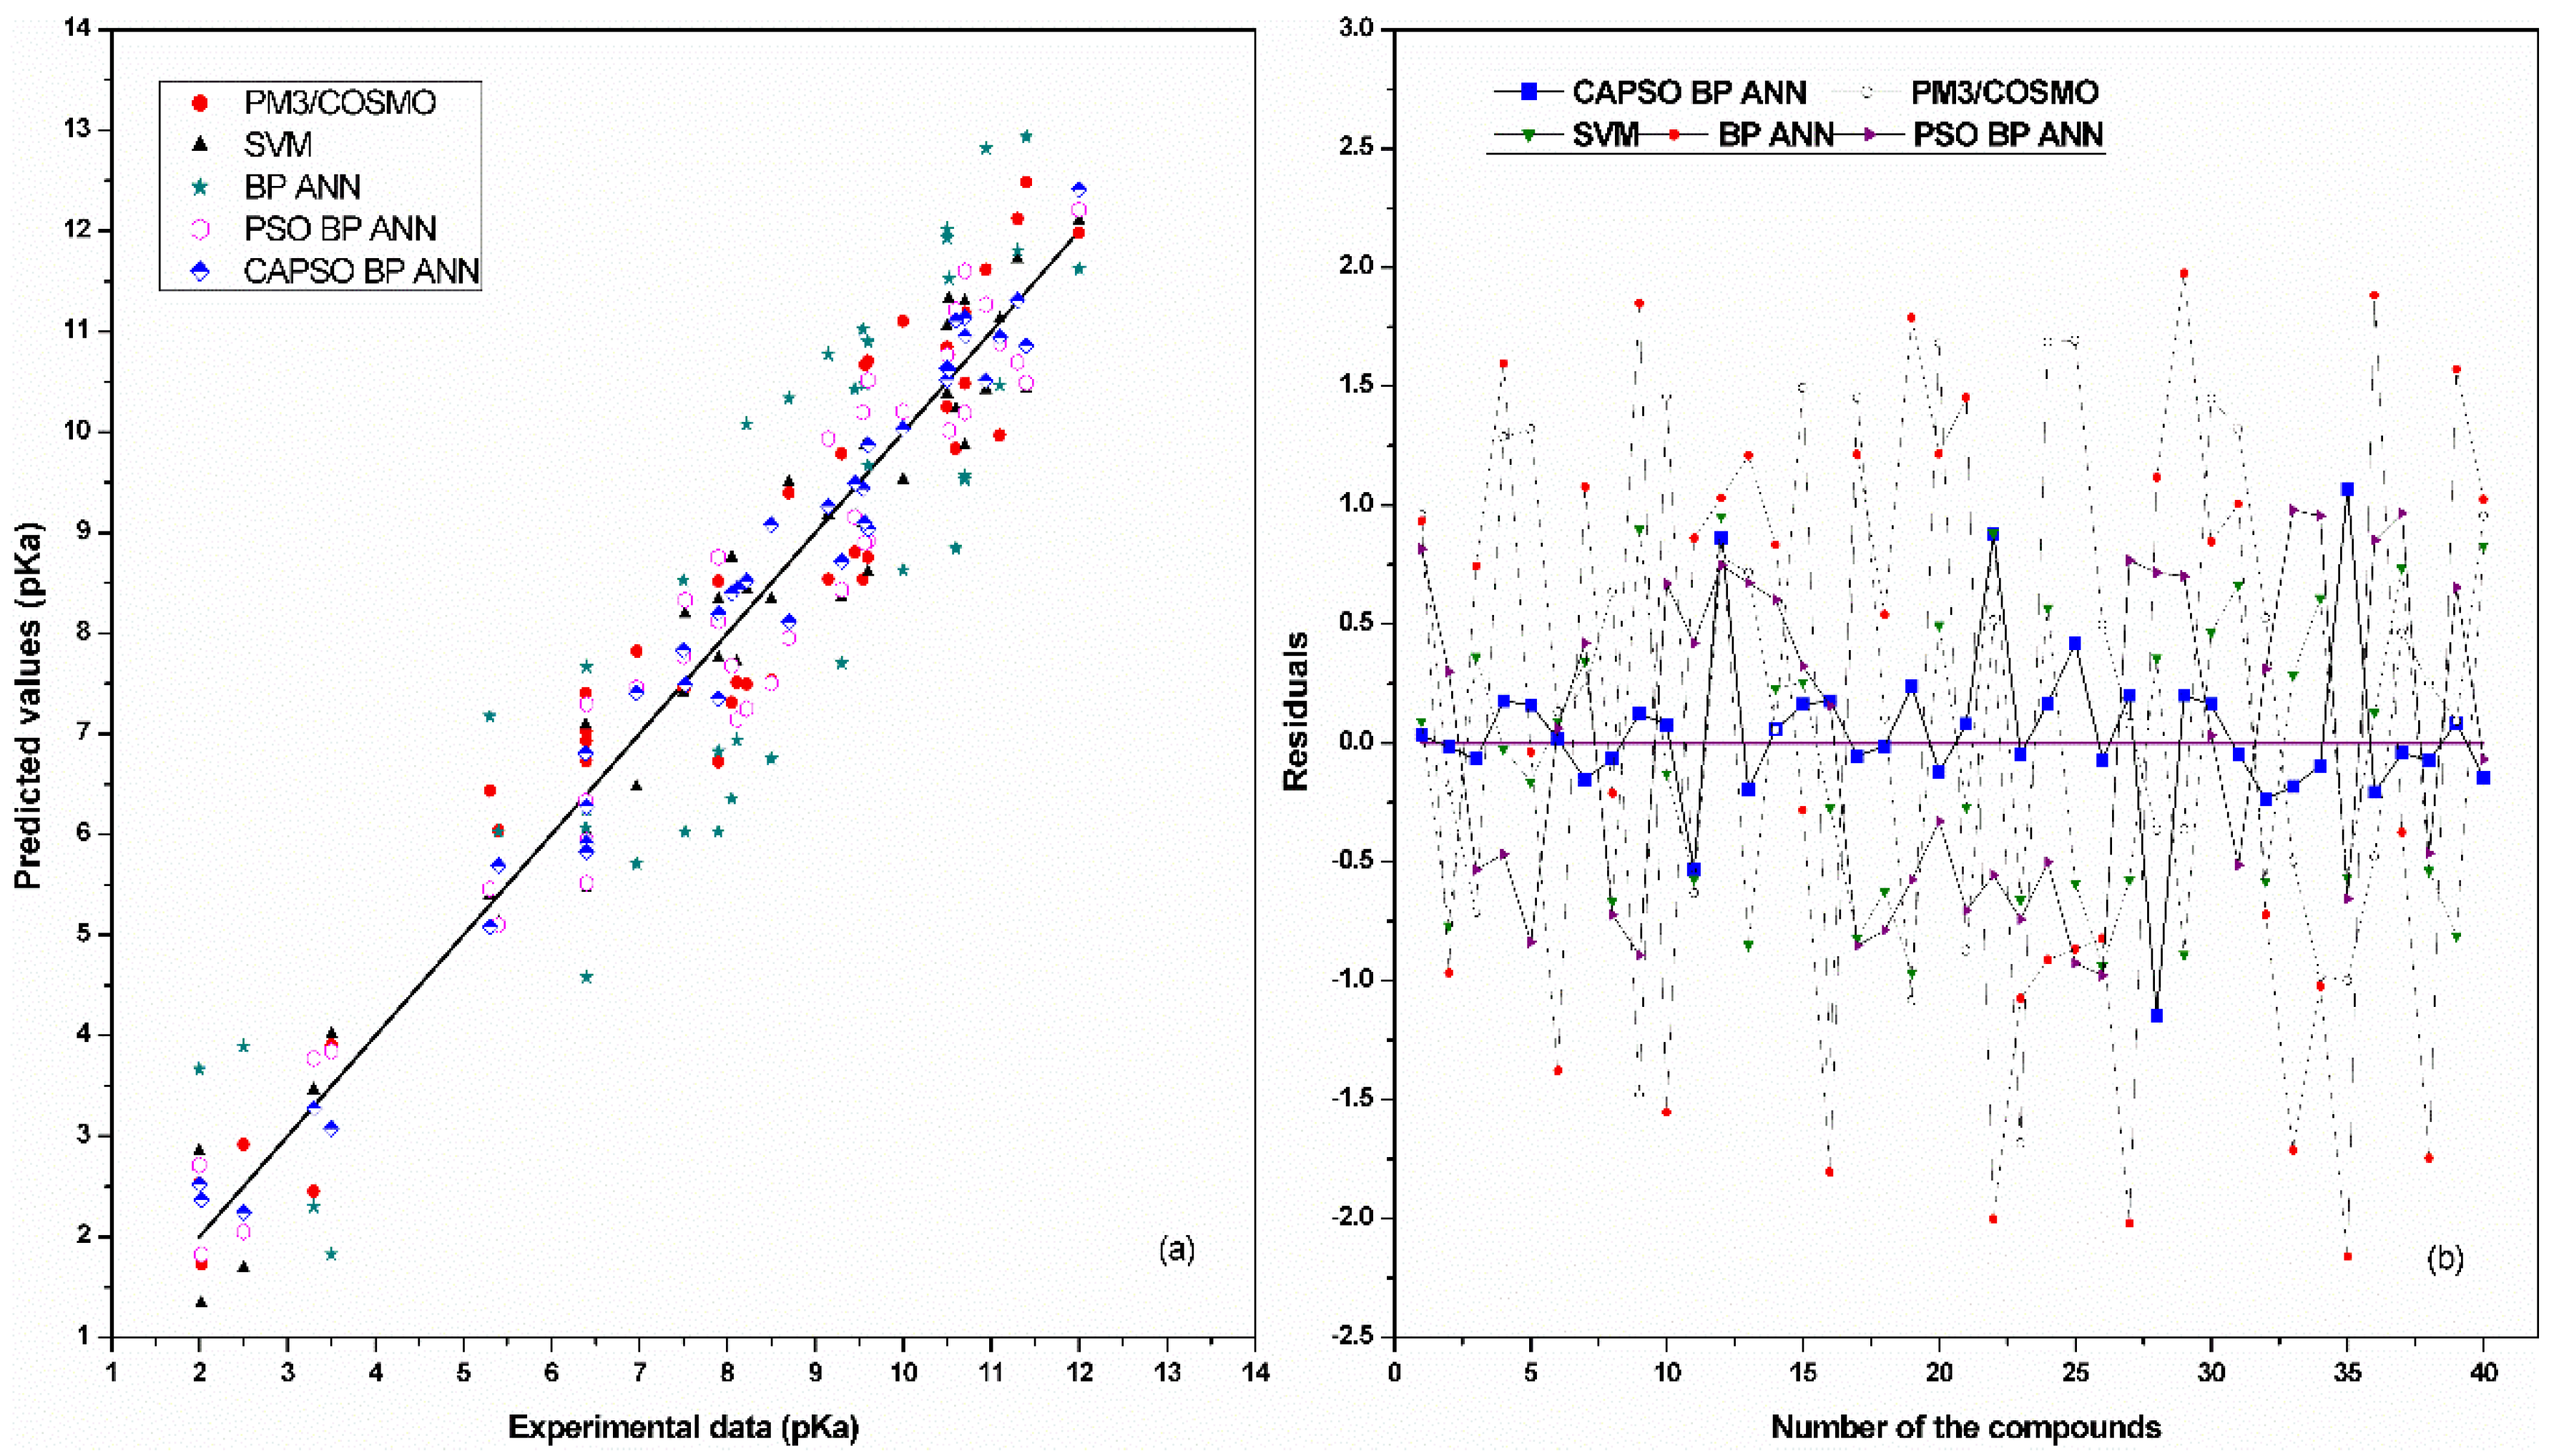
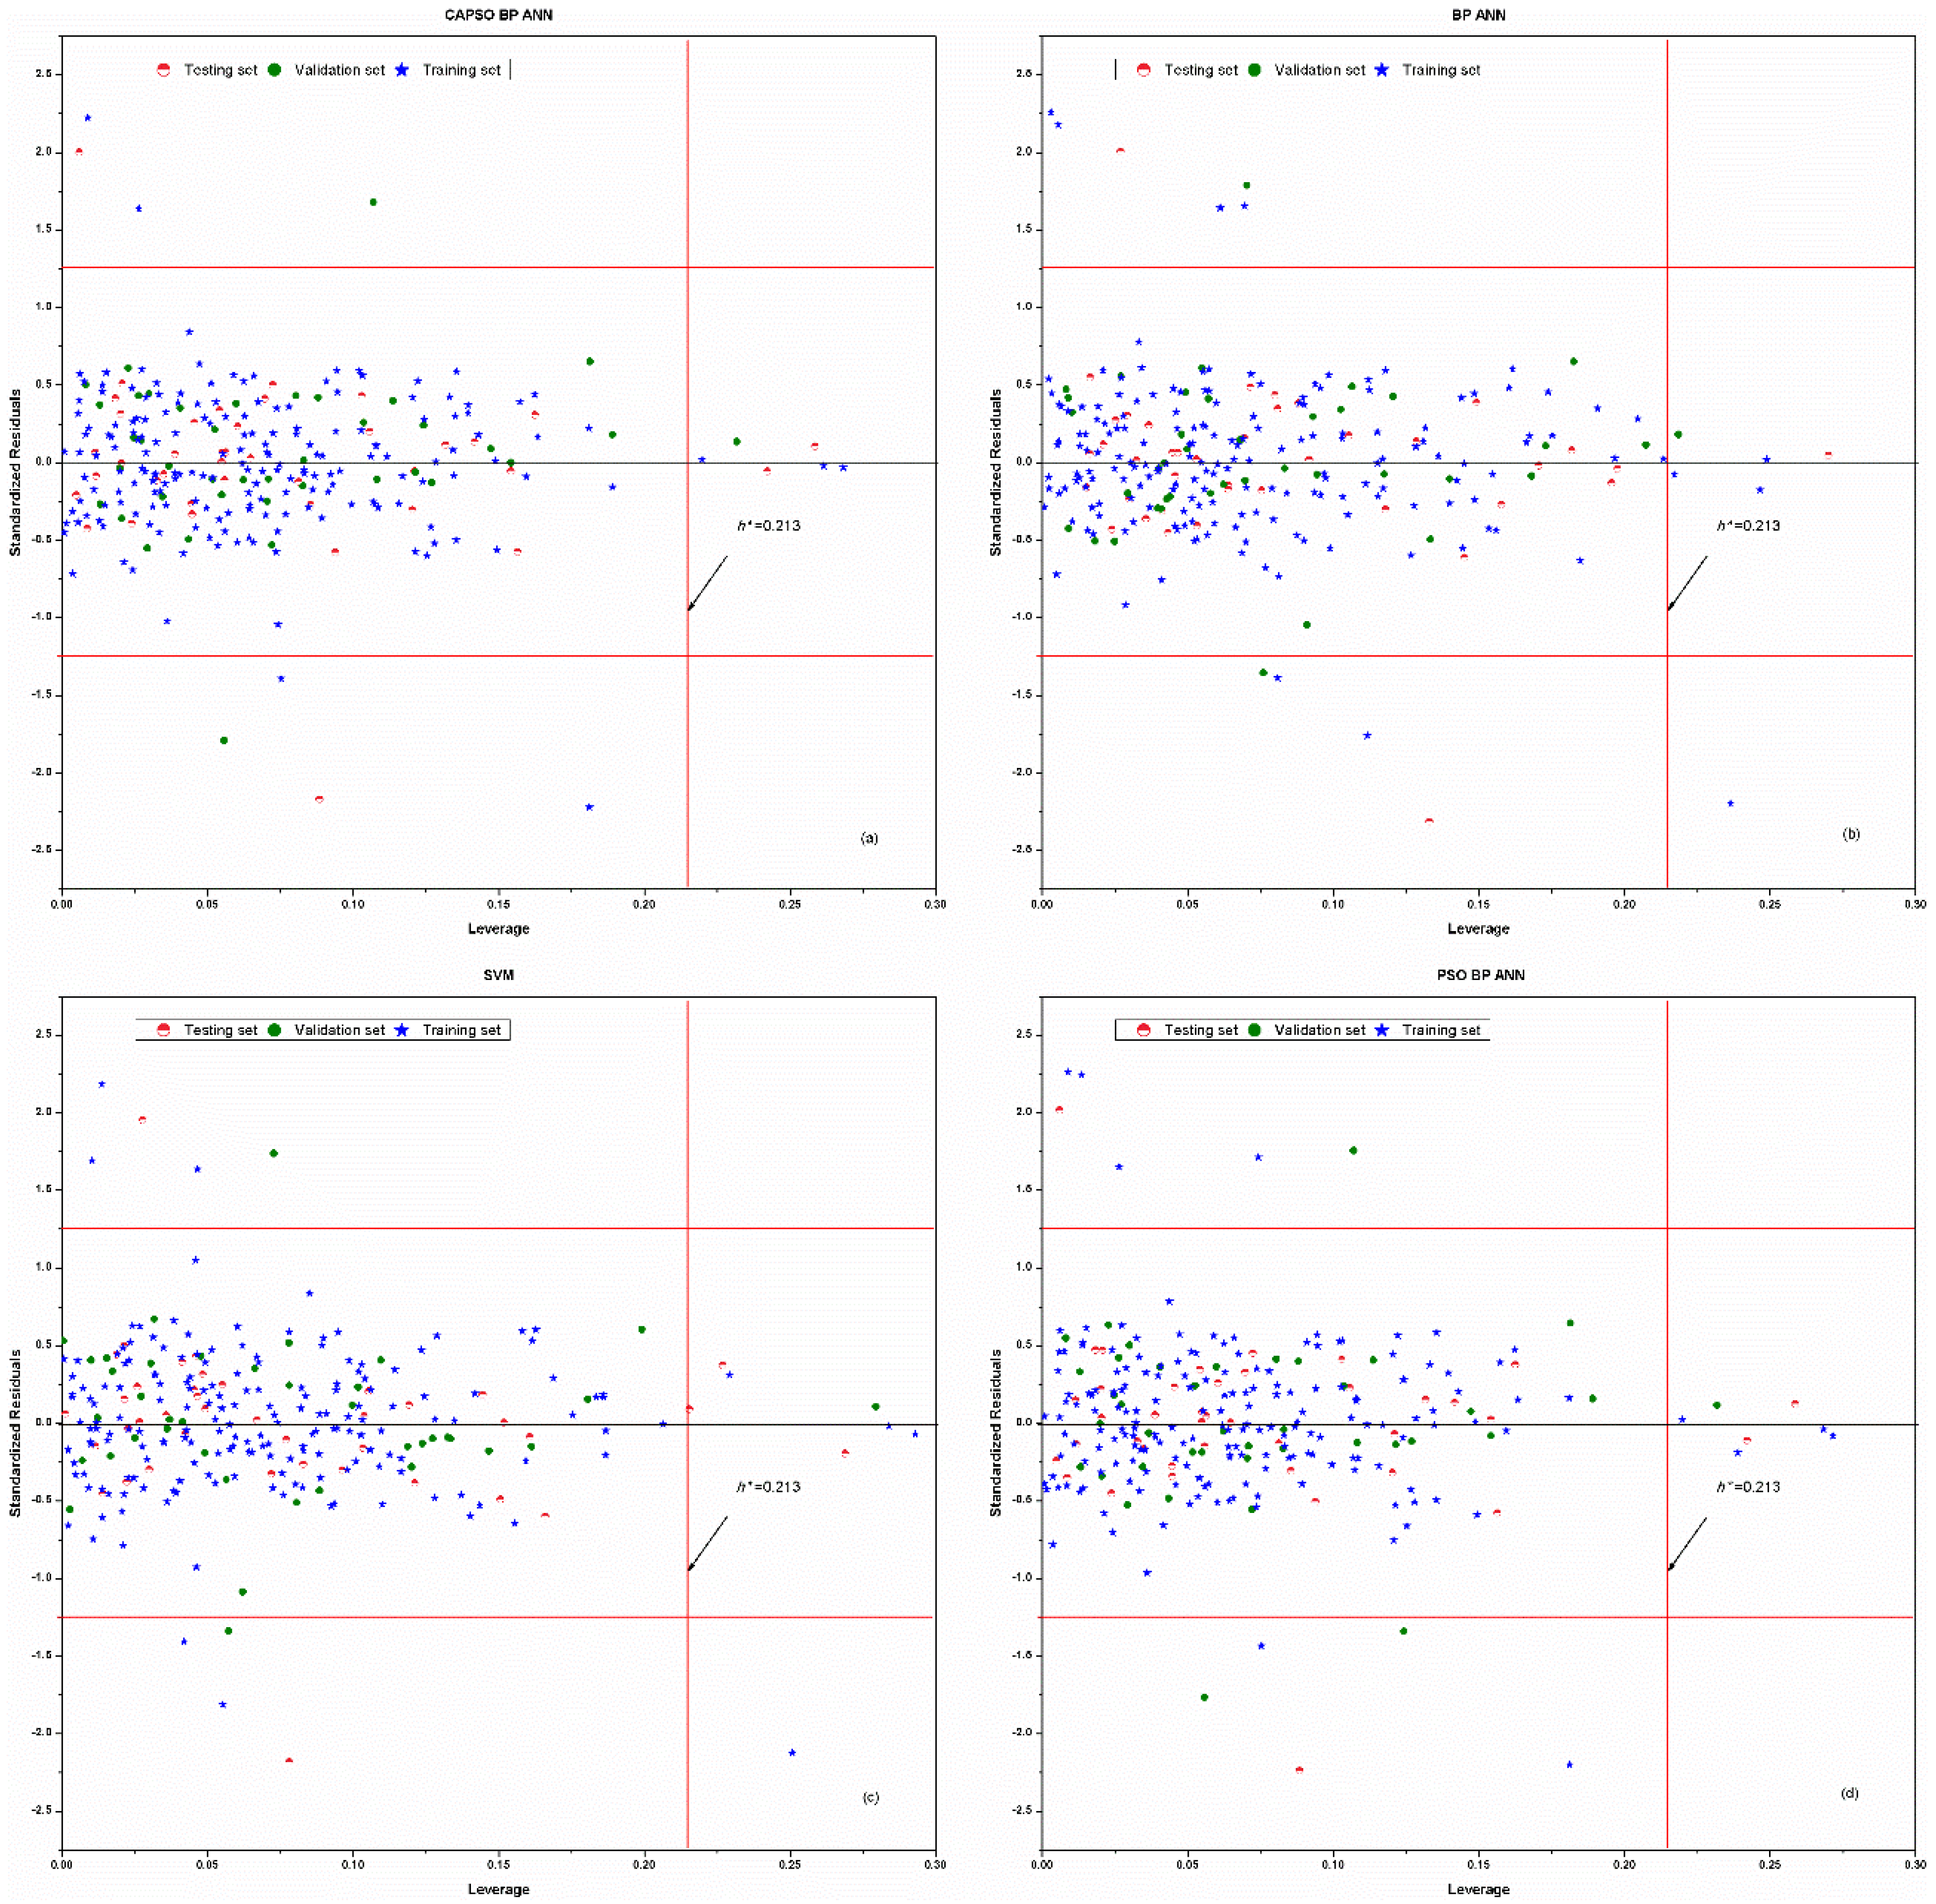
4. Results and Discussion
5. Conclusions
Supplementary Materials
Author Contributions
Funding
Acknowledgments
Conflicts of Interest
References
- Cumming, J.G.; Davis, A.M.; Muresan, S.; Haeberlein, M.; Chen, H.M. Chemical predictive modelling to improve compound quality. Nat. Rev. Drug Discov. 2013, 12, 948–962. [Google Scholar] [CrossRef] [PubMed]
- Rojas, C.; Ballabio, D.; Consonni, V.; Tripaldi, P.; Mauri, A.; Todeschini, R. Quantitative structure-activity relationships to predict sweet and non-sweet tastes. Theor. Chem. Acc. 2016, 135, 1–13. [Google Scholar] [CrossRef]
- Patel, M.; Chilton, M.L.; Sartini, A.; Gibson, L.; Barber, C.; Covey-Crump, L.; Przybylak, K.R.; Cronin, M.T.D.; Madden, J.C. Assessment and reproducibility of quantitative structure-activity relationship models by the nonexpert. J. Chem. Inf. Model. 2018, 58, 673–682. [Google Scholar] [CrossRef] [PubMed]
- Liu, C.M.; Dou, X.W.; Zhang, L.; Kong, W.J.; Wu, L.; Duan, Y.P.; Yang, M.H. Development of a broad-specificity antibody-based immunoassay for triazines in ginger and the quantitative structure-activity relationship study of cross-reactive molecules by molecular modeling. Anal. Chim. Acta 2018, 1012, 90–99. [Google Scholar] [CrossRef] [PubMed]
- Gebreyohannes, S.; Dadmohammadi, Y.; Neely, B.J.; Gasem, K.A.M. A comparative study of QSPR generalized activity coefficient model parameters for vapor-liquid equilibrium mixtures. Ind. Eng. Chem. Res. 2016, 55, 1102–1116. [Google Scholar] [CrossRef]
- Dardonville, C.; Caine, B.A.; de la Fuente, M.N.; Herranz, G.M.; Mariblanca, B.C.; Popelier, P.L.A. Substituent effects on the basicity (pKa) of aryl guanidines and 2-(arylimino) imidazolidines: Correlations of pH-metric and UV-metric values with predictions from gas-phase ab initio bond lengths. New J. Chem. 2017, 41, 11016–11028. [Google Scholar] [CrossRef]
- Balabin, R.M.; Smirnov, S.V. Variable selection in near-infrared spectroscopy: Benchmarking of feature selection methods on biodiesel data. Anal. Chim. Acta 2011, 692, 63–72. [Google Scholar] [CrossRef] [PubMed]
- Xiaobo, Z.; Jiewen, Z.; Povey, M.J.W.; Holmes, M.; Hanpin, M. Variables selection methods in near-infrared spectroscopy. Anal. Chim. Acta 2010, 667, 14–32. [Google Scholar] [CrossRef] [PubMed]
- Goodarzi, M.; Dejaegher, B.; Vander Heyden, Y. Feature selection methods in QSAR studies. J. AOAC Int. 2012, 95, 636–651. [Google Scholar] [CrossRef] [PubMed]
- Zuvela, P.; Liu, J.J.; Macur, K.; Baczek, T. Molecular descriptor subset selection in theoretical peptide quantitative structure-retention relationship model development using nature-inspired optimization algorithms. Anal. Chem. 2015, 87, 9876–9883. [Google Scholar] [CrossRef] [PubMed]
- Zuvela, P.; Liu, J.J. On feature selection for supervised learning problems involving high-dimensional analytical information. RSC Adv. 2016, 6, 82801–82809. [Google Scholar] [CrossRef]
- Heberger, K.; Skrbic, B. Ranking and similarity for quantitative structure-retention relationship models in predicting lee retention indices of polycyclic aromatic hydrocarbons. Anal. Chim. Acta 2012, 716, 92–100. [Google Scholar] [CrossRef] [PubMed]
- Zuvela, P.; David, J.; Wong, M.W. Interpretation of ANN-based QSAR models for prediction of antioxidant activity of flavonoids. J. Comput. Chem. 2018, 39, 953–963. [Google Scholar] [CrossRef] [PubMed]
- Zuvela, P.; Macur, K.; Liu, J.J.; Baczek, T. Exploiting non-linear relationships between retention time and molecular structure of peptides originating from proteomes and comparing three multivariate approaches. J. Pharm. Biomed. 2016, 127, 94–100. [Google Scholar] [CrossRef] [PubMed]
- Shi, J.; Hu, X.; Zou, X.; Zhao, J.; Zhang, W.; Huang, X.; Zhu, Y.; Li, Z.; Xu, Y. A heuristic and parallel simulated annealing algorithm for variable selection in near-infrared spectroscopy analysis. J. Chemom. 2016, 30, 442–450. [Google Scholar] [CrossRef]
- Pandit, A.; Sengupta, S.; Krishnan, M.A.; Reddy, R.B.; Sharma, R.; Venkatesh, C. First report on 3D-QSAR and molecular dynamics based docking studies of GCPII inhibitors for targeted drug delivery applications. J. Mol. Struct. 2018, 1159, 179–192. [Google Scholar] [CrossRef]
- Shahlaei, M. Descriptor selection methods in quantitative structure-activity relationship studies: A review study. Chem. Rev. 2013, 113, 8093–8103. [Google Scholar] [CrossRef] [PubMed]
- Barley, M.H.; Turner, N.J.; Goodacre, R. Improved descriptors for the quantitative structure-activity relationship modeling of peptides and proteins. J. Chem. Inf. Model. 2018, 58, 234–243. [Google Scholar] [CrossRef] [PubMed]
- Soper-Hopper, M.T.; Petrov, A.S.; Howard, J.N.; Yu, S.S.; Forsythe, J.G.; Grover, M.A.; Fernandez, F.M. Collision cross section predictions using 2-dimensional molecular descriptors. Chem. Commun. 2017, 53, 7624–7627. [Google Scholar] [CrossRef] [PubMed]
- Khajeh, A.; Modarress, H.; Zeinoddini-Meymand, H. Application of modified particle swarm optimization as an efficient variable selection strategy in QSAR/QSPR studies. J. Chemom. 2012, 26, 598–603. [Google Scholar] [CrossRef]
- Li, M.S.; Liu, L.; Huang, X.Y.; Liu, H.S.; Chen, B.S.; Guan, L.X.; Wu, Y. Prediction of supercritical carbon dioxide solubility in polymers based on hybrid artificial intelligence method integrated with the diffusion theory. RSC Adv. 2017, 7, 49817–49827. [Google Scholar] [CrossRef] [Green Version]
- Liu, Q.Z.; Wang, S.S.; Li, X.; Zhao, X.Y.; Li, K.; Lv, G.C.; Qiu, L.; Lin, J.G. 3D-QSAR, molecular docking, and oniom studies on the structure-activity relationships and action mechanism of nitrogen-containing bisphosphonates. Chem. Biol. Drug Des. 2018, 91, 735–746. [Google Scholar] [CrossRef] [PubMed]
- Wang, N.N.; Dong, J.; Deng, Y.H.; Zhu, M.F.; Wen, M.; Yao, Z.J.; Lu, A.P.; Wang, J.B.; Cao, D.S. ADME properties evaluation in drug discovery: Prediction of Caco-2 cell permeability using a combination of NSGA-II and boosting. J. Chem. Inf. Model. 2016, 56, 763–773. [Google Scholar] [CrossRef] [PubMed]
- Fujita, T.; Winkler, D.A. Understanding the roles of the “two QSARs”. J. Chem. Inf. Model. 2016, 56, 269–274. [Google Scholar] [CrossRef] [PubMed]
- Borisek, J.; Drgan, V.; Minovski, N.; Novic, M. Mechanistic interpretation of artificial neural network-based QSAR model for prediction of cathepsin K inhibition potency. J. Chemom. 2014, 28, 272–281. [Google Scholar] [CrossRef]
- Du, X.J.; Wang, J.L.; Jegatheesan, V.; Shi, G.H. Dissolved oxygen control in activated sludge process using a neural network-based adaptive PID algorithm. Appl. Sci. 2018, 8, 261. [Google Scholar] [CrossRef]
- Verma, R.P.; Matthews, E.J. Estimation of the chemical-induced eye injury using a weight-of-evidence (WoE) battery of 21 artificial neural network (ANN) c-QSAR models (QSAR-21): Part I: Irritation potential. Regul. Toxicol. Pharm. 2015, 71, 318–330. [Google Scholar] [CrossRef] [PubMed]
- Yasrab, R.; Gu, N.J.; Zhang, X.C. An encoder-decoder based convolution neural network (CNN) for future advanced driver assistance system (ADAS). Appl. Sci. 2017, 7, 312. [Google Scholar] [CrossRef]
- Selzer, D.; Neumann, D.; Schaefer, U.F. Mathematical models for dermal drug absorption. Expert Opin. Drug Metab. Toxicol. 2015, 11, 1567–1583. [Google Scholar] [CrossRef] [PubMed]
- Hassanzadeh, Z.; Kompany-Zareh, M.; Ghavami, R.; Gholami, S.; Malek-Khatabi, A. Combining radial basis function neural network with genetic algorithm to QSPR modeling of adsorption on multi-walled carbon nanotubes surface. J. Mol. Struct. 2015, 1098, 191–198. [Google Scholar] [CrossRef]
- Dolara, A.; Grimaccia, F.; Leva, S.; Mussetta, M.; Ogliari, E. Comparison of training approaches for photovoltaic forecasts by means of machine learning. Appl. Sci. 2018, 8, 228. [Google Scholar] [CrossRef]
- Polanski, J.; Walczak, B. The comparative molecular surface analysis (COMSA): A novel tool for molecular design. Comput. Chem. 2000, 24, 615–625. [Google Scholar] [CrossRef]
- Luan, F.; Xue, C.X.; Zhang, R.S.; Zhao, C.Y.; Liu, M.C.; Hu, Z.D.; Fan, B.T. Prediction of retention time of a variety of volatile organic compounds based on the heuristic method and support vector machine. Anal. Chim. Acta 2005, 537, 101–110. [Google Scholar] [CrossRef]
- Li, M.; Huang, X.; Liu, H.; Liu, B.; Wu, Y.; Wang, L. Solubility prediction of supercritical carbon dioxide in 10 polymers using radial basis function artificial neural network based on chaotic self-adaptive particle swarm optimization and k-harmonic means. RSC Adv. 2015, 5, 45520–45527. [Google Scholar] [CrossRef]
- Li, M.S.; Huang, X.Y.; Liu, H.S.; Liu, B.X.; Wu, Y.; Xiong, A.H.; Dong, T.W. Prediction of gas solubility in polymers by back propagation artificial neural network based on self-adaptive particle swarm optimization algorithm and chaos theory. Fluid Phase Equilibr. 2013, 356, 11–17. [Google Scholar] [CrossRef]
- Azad, F.N.; Ghaedi, M.; Asfaram, A.; Jamshidi, A.; Hassani, G.; Goudarzi, A.; Azqhandi, M.H.A.; Ghaedi, A. Optimization of the process parameters for the adsorption of ternary dyes by ni doped FEO(OH)-NWs-AC using response surface methodology and an artificial neural network. RSC Adv. 2016, 6, 19768–19779. [Google Scholar] [CrossRef]
- Li, M.; Wu, W.; Chen, B.; Wu, Y.; Huang, X. Solubility prediction of gases in polymers based on an artificial neural network: A review. RSC Adv. 2017, 7, 35274–35282. [Google Scholar] [CrossRef]
- Gandomi, A.H.; Yun, G.J.; Yang, X.S.; Talatahari, S. Chaos-enhanced accelerated particle swarm optimization. Commun. Nonlinear Sci. 2013, 18, 327–340. [Google Scholar] [CrossRef]
- Kennedy, J.; Eberhart, R. Particle swarm optimization. In Proceedings of the 1995 IEEE International Conference on Neural Networks—ICNN’95, Perth, Western Australia, 27 November–1 December 1995; Volume 4, pp. 1942–1948. [Google Scholar]
- Wang, F.; Zhou, L.D.; Wang, B.; Wang, Z.; Shafie-Khah, M.; Catalao, J.P.S. Modified chaos particle swarm optimization-based optimized operation model for stand-alone CCHP microgrid. Appl. Sci. 2017, 7, 754. [Google Scholar] [CrossRef]
- Liang, C.H.; Tong, X.M.; Lei, T.Y.; Li, Z.X.; Wu, G.S. Optimal design of an air-to-air heat exchanger with cross-corrugated triangular ducts by using a particle swarm optimization algorithm. Appl. Sci. 2017, 7, 554. [Google Scholar] [CrossRef]
- Jiang, G.W.; Luo, M.Z.; Bai, K.Q.; Chen, S.X. A precise positioning method for a puncture robot based on a PSO-optimized BP neural network algorithm. Appl. Sci. 2017, 7, 969. [Google Scholar] [CrossRef]
- Yang, X.S.; Deb, S.; Fong, S. Accelerated particle swarm optimization and support vector machine for business optimization and applications. In Proceedings of the Networked Digital Technologies, Macau, China, 11–13 July 2011; Volume 136, pp. 53–66. [Google Scholar]
- Han, F.; Zhu, J.S. Improved particle swarm optimization combined with backpropagation for feedforward neural networks. Int. J. Intell. Syst. 2013, 28, 271–288. [Google Scholar] [CrossRef]
- Li, M.S.; Zhang, H.J.; Chen, B.S.; Wu, Y.; Guan, L.X. Prediction of pKa values for neutral and basic drugs based on hybrid artificial intelligence methods. Sci. Rep. 2018, 8. [Google Scholar] [CrossRef] [PubMed]
- Zolfaghari, S.; Noor, S.B.M.; Mehrjou, M.R.; Marhaban, M.H.; Mariun, N. Broken rotor bar fault detection and classification using wavelet packet signature analysis based on fourier transform and multi-layer perceptron neural network. Appl. Sci. 2018, 8, 25. [Google Scholar] [CrossRef]
- Valdez, F.; Melin, P.; Castillo, O. Modular neural networks architecture optimization with a new nature inspired method using a fuzzy combination of particle swarm optimization and genetic algorithms. Inf. Sci. 2014, 270, 143–153. [Google Scholar] [CrossRef]
- Li, N.J.; Wang, W.J.; Hsu, C.C.J.; Chang, W.; Chou, H.G.; Chang, J.W. Enhanced particle swarm optimizer incorporating a weighted particle. Neurocomputing 2014, 124, 218–227. [Google Scholar] [CrossRef]
- SAMUELS, M.L. Nonparametric estimates of standard error: The jackknife, the bootstrap and other methods. Biometrika 1981, 68, 589–599. [Google Scholar]
- Jensen, J.H.; Swain, C.J.; Olsen, L. Prediction of pKa values for druglike molecules using semiempirical quantum chemical methods. J. Phys. Chem. A 2017, 121, 699–707. [Google Scholar] [CrossRef] [PubMed]
- Eckert, F.; Klamt, A. Accurate prediction of basicity in aqueous solution with COSMO-RS. J. Comput. Chem. 2006, 27, 11–19. [Google Scholar] [CrossRef] [PubMed]
- Luan, F.; Ma, W.P.; Zhang, H.X.; Zhang, X.Y.; Liu, M.C.; Hu, Z.D.; Fan, B.T. Prediction of pKa for neutral and basic drugs based on radial basis function neural networks and the heuristic method. Pharm. Res. 2005, 22, 1454–1460. [Google Scholar] [CrossRef] [PubMed]
- Kennard, R.W.; Stone, L.A. Computer aided design of experiments. Technometrics 1969, 11, 137–148. [Google Scholar] [CrossRef]
- Gevrey, M.; Dimopoulos, I.; Lek, S. Review and comparison of methods to study the contribution of variables in artificial neural network models. Ecol. Model. 2003, 160, 249–264. [Google Scholar] [CrossRef]
- Leifeld, P.; Cranmer, S.J.; Desmarais, B.A. Temporal exponential random graph models with btergm: Estimation and bootstrap confidence intervals. J. Stat. Softw. 2018, 83. [Google Scholar] [CrossRef]


| Number of Compounds | Experimental pKa | References |
|---|---|---|
| 31 | 0.70–4.99 | [50,51] |
| 34 | 5.00–6.99 | [50,51,52] |
| 16 | 7.00–7.99 | [50,51,52] |
| 46 | 8.00–8.99 | [50,51,52] |
| 80 | 9.00–9.99 | [50,51,52] |
| 45 | 10.00–10.99 | [50,51,52] |
| 16 | 11.00–13.80 | [50,51] |
| No. | Molecular Descriptors | Descriptor Types |
|---|---|---|
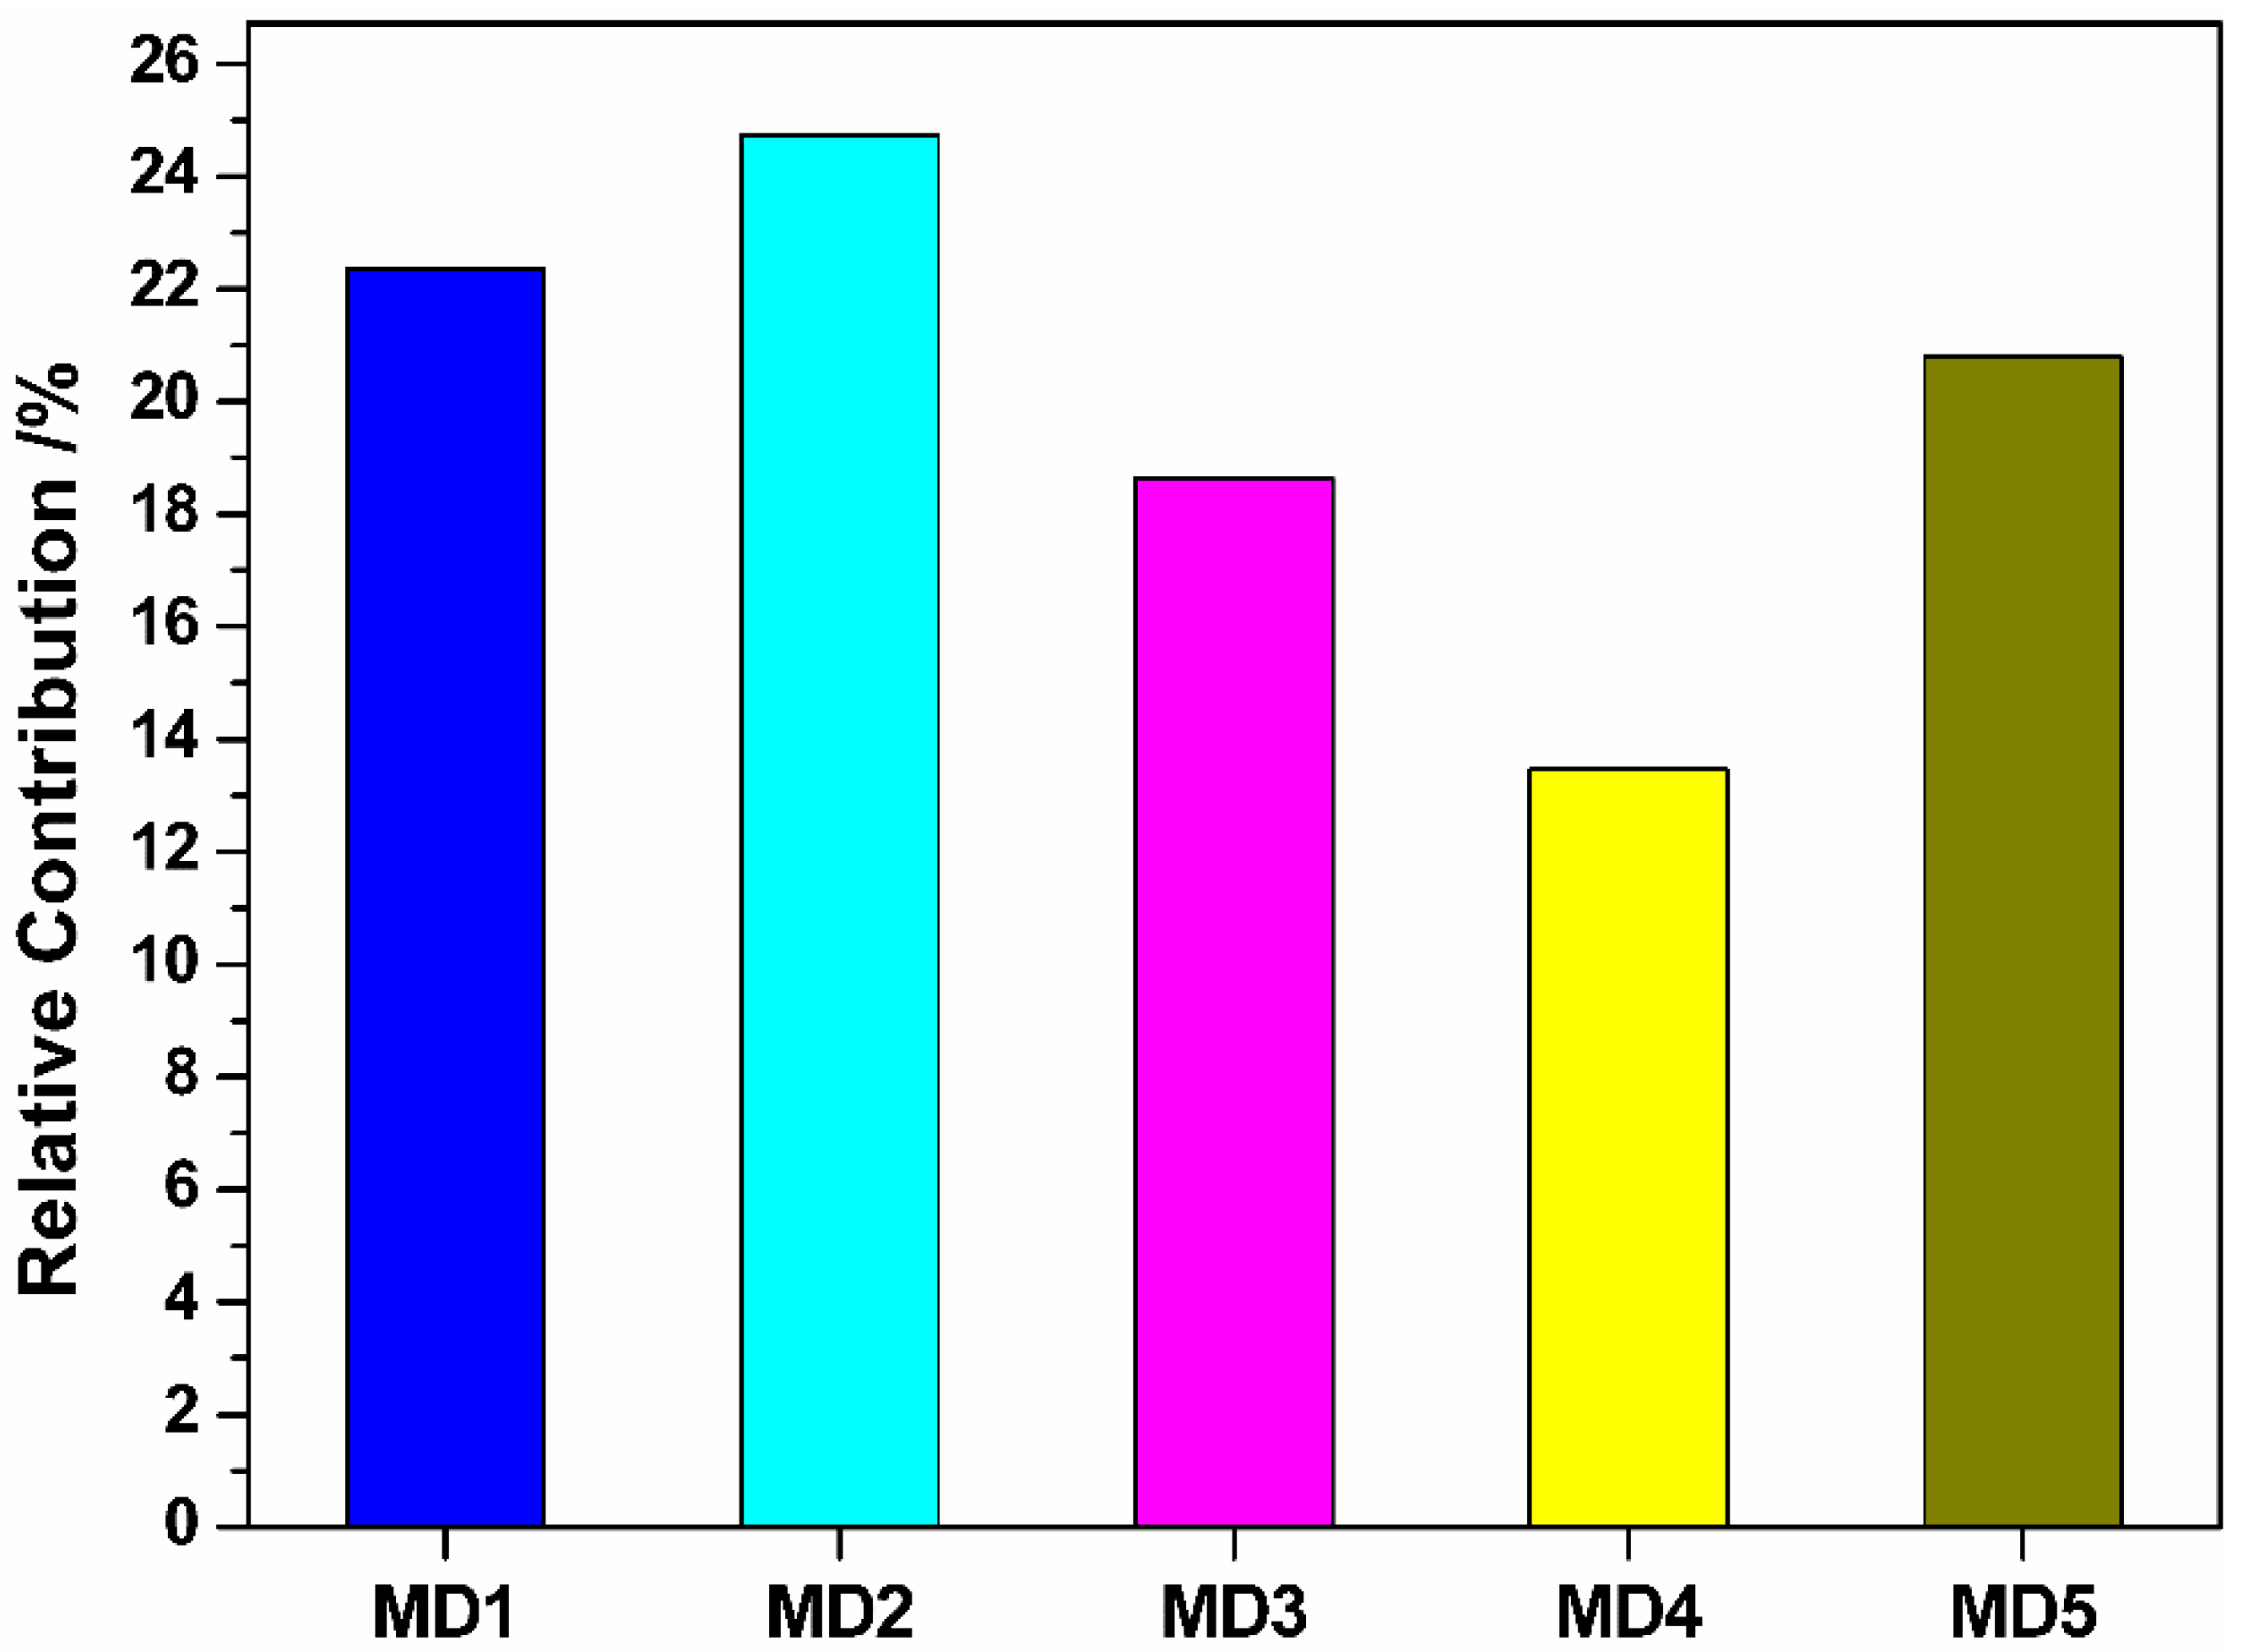
| MD1 | Relative number of N atoms | Constitutional descriptors |
| MD2 | Randic index (order 3) | Topological descriptors |
| MD3 | RNCG relative negative charged (QMNEG/QTMINUS) (Quantum-Chemical PC) | Electrostatic descriptors |
| MD4 | RNCS Relative negative charged SA (SAMNEG * RNCG) (Zefirov’s PC) | Electrostatic descriptors |
| MD5 | Maximum net atomic charge | Quantum descriptors |
| Parameters | Values |
|---|---|
| Training data proportion | 70% |
| Validation data proportion | 15% |
| Testing data proportion | 15% |
| Training algorithm | CAPSO |
| Number of input neurons | 5 |
| Number of hidden neurons | 7 |
| Number of output neuron | 1 |
| Number of particles in CAPSO | 50 |
| Maximum iteration times | 1000 |
| Sets | AARD | RMSEP | R2 |
|---|---|---|---|
| Training | 0.3436 | 0.0335 | 0.9771 |
| Validation | 0.3101 | 0.0211 | 0.9886 |
| Testing | 0.5364 | 0.0632 | 0.9438 |
| Models | AARD | RMSEP | R2 |
|---|---|---|---|
| PM3/COSMO | 0.8724 | 0.1439 | 0.8346 |
| SVM | 0.7333 | 0.1038 | 0.8863 |
| BP ANN | 1.2134 | 0.5354 | 0.6958 |
| PSO BP ANN | 0.7229 | 0.1029 | 0.8872 |
| CAPSO BP ANN | 0.5364 | 0.0632 | 0.9438 |
| Models | C.I. (90%) | C.I. (95%) | C.I. (99%) |
|---|---|---|---|
| PM3/COSMO | (0.04721, 0.24059) | (0.02904, 0.25876) | (0.00067, 0.29450) |
| SVM | (0.03368, 0.17393) | (0.02050, 0.18710) | (0.00054, 0.21303) |
| BP ANN | (0.39482, 0.67598) | (0.36841, 0.70240) | (0.31644, 0.75437) |
| PSO BP ANN | (0.03327, 0.17253) | (0.02019, 0.18561) | (0.00056, 0.21135) |
| CAPSO BP ANN | (0.05066, 0.07574) | (0.04830, 0.07810) | (0.04367, 0.08273) |
© 2018 by the authors. Licensee MDPI, Basel, Switzerland. This article is an open access article distributed under the terms and conditions of the Creative Commons Attribution (CC BY) license (http://creativecommons.org/licenses/by/4.0/).
Share and Cite
Li, M.; Zhang, H.; Liu, L.; Chen, B.; Guan, L.; Wu, Y. A Quantitative Structure-Property Relationship Model Based on Chaos-Enhanced Accelerated Particle Swarm Optimization Algorithm and Back Propagation Artificial Neural Network. Appl. Sci. 2018, 8, 1121. https://doi.org/10.3390/app8071121
Li M, Zhang H, Liu L, Chen B, Guan L, Wu Y. A Quantitative Structure-Property Relationship Model Based on Chaos-Enhanced Accelerated Particle Swarm Optimization Algorithm and Back Propagation Artificial Neural Network. Applied Sciences. 2018; 8(7):1121. https://doi.org/10.3390/app8071121
Chicago/Turabian StyleLi, Mengshan, Huaijin Zhang, Liang Liu, Bingsheng Chen, Lixin Guan, and Yan Wu. 2018. "A Quantitative Structure-Property Relationship Model Based on Chaos-Enhanced Accelerated Particle Swarm Optimization Algorithm and Back Propagation Artificial Neural Network" Applied Sciences 8, no. 7: 1121. https://doi.org/10.3390/app8071121