Article

Comparison of CO2 Flow Behavior through Intact Siltstone Sample under Tri-Axial Steady-State and Transient Flow Conditions

by
Chengpeng Zhang
1,
Ranjith Pathegama Gamage
1,* and
Mandadige Samintha Anne Perera
2
1
Deep Earth Energy Laboratory, Department of Civil Engineering, Monash University, Building 60, Melbourne, VIC 3800, Australia
2
Department of Infrastructure Engineering, The University of Melbourne, 209B, Building 175, Melbourne, VIC 3010, Australia
*
Author to whom correspondence should be addressed.
Appl. Sci. 2018, 8(7), 1092; https://doi.org/10.3390/app8071092
Submission received: 20 March 2018 / Revised: 8 June 2018 / Accepted: 27 June 2018 / Published: 5 July 2018
(This article belongs to the Special Issue The Applications of Supercritical Carbon Dioxide)

Abstract

:
With its low viscosity properties, CO2 has much greater penetration capacity into micro-fractures, and therefore has more potential to create expanded and effective fractures in shales during the hydraulic fracturing process. However, the feasibility of this technique is dependent on the accurate prediction of formation flow characteristics, given the high leak-off of CO2 at deep depths. The aim of this study is therefore to understand the flow behavior of CO2 in deep shale plays. A series of tri-axial permeability tests was conducted under both steady-state and transient conditions. The test results show much lower permeability values for liquid CO2 than gaseous CO2, and the permeability under transient conditions is much lower than that under steady-state conditions, due to the combined effects of the reduced slip-flow effect under low pressures and the temperature variation influence under steady-state conditions. Under steady-state conditions, unstable flow behavior occurred at higher injection pressure (≥9 MPa) possibly due to the fine mineral particle migration and the deposition of small drikold particles, which indicates the serious error in permeability calculation under steady-state conditions. Importantly, a greater than 1 effective stress coefficient ( χ ) for permeability in tested siltstone was observed, confirming the greater sensitivity of CO2 to pore pressure than confining pressure.

1. Introduction

Being a green energy source, natural gas has recently attracted increased scientific and industrial interest, and shale gas accounts for more than 63% of the total global sources of unconventional gas [1]. The economic exploitation of shale gas therefore has the ability to satisfy the increasing world energy consumption [2]. Although the extremely low permeability of the shale matrix obstructs gas migration from the matrix to the production wells, some reservoir-enhancement techniques, such as hydro-fracturing, can significantly enhance permeability by creating a fracture network between the production wells and the shale matrix, that eventually enhance shale gas productivity [3,4,5]. For the hydraulic fracturing process, water-based fracturing fluids are currently used. However, this has raised many issues, including formation damage, long clean-up times, excessive water consumption and wastewater generation [6,7,8,9].
Liquid CO2 with low viscosity can be used as an alternative to water-based fracturing fluids [10], which avoids most of the issues created by water-based fluids. The use of CO2 as a fracturing fluid also contributes to CO2 geo-sequestration, which has already been successfully verified in some shale formations [11]. During the fracturing process, CO2 is often injected into reservoir formations in its liquid or super-critical state in a short time, and high pressurized CO2 can fracture the shale matrix or open up existing fractures [12]. However, the low viscosity of CO2 and its high penetration capacity cause very fast leak-off rates [13], and insufficient leak-off control can cause unacceptably high injection rates and excessive CO2 consumption, challenging the capacity of the fracturing pump. Consequently, treatment using CO2 may not be applicable to relatively high permeable reservoirs for hydraulic fracturing. After the completion of the fracturing process, CO2 flows from the shale matrix to the wellhead through the fracturing wells, where CO2 is easily subjected to phase transition among gaseous, liquid and super-critical states because the physical properties of CO2 are highly pressure- and temperature-dependent [14]. The huge pressure gradient induced near the fracture points upon the release of injection pressure may cause fine particle migration, which can move from the reservoir to the well along the CO2 flow [15]. Furthermore, since injecting CO2 into depleted oil and gas reservoirs and saline aquifers also contributes to the geological storage of CO2, the safe storage of injected CO2 in these formations depends on the ultralow permeable rock layers lying above the formation [16,17]. As the primary security key for CO2-based hydraulic fracturing and the associated geological storage of CO2, a full understanding of CO2 flow behavior in low permeable formations under different in situ environments is therefore essential, otherwise, erroneous leak-off rate estimations based on a vague understanding of CO2 flow behavior in gas reservoirs can lead to inaccurate estimation of total CO2 usage and prediction of the CO2 injection rates required for fracturing.
On the other hand, the complicated thermodynamic properties of CO2 increase the complexity of precisely estimating the apparent permeability of shale for CO2. Various methods have been developed to measure the permeability of reservoir rock with ultralow permeability and studies have been performed under both steady-state and transient conditions [18]. For steady-state conditions, the downstream pressure can be controlled to achieve a specific pressure gradient along the sample, and many tests under steady-state conditions have been achieved by opening the downstream to the atmosphere, offering atmospheric downstream pressure conditions, and flow rates are measured when the pressure distribution along the sample reaches equilibrium. However, this fails to secure super-critical or liquid CO2 flow downstream, resulting in phase variation of CO2 throughout the sample [19]. These issues can be overcome by using transient tests, in which the downstream outlet is closed, giving the opportunity for downstream pressure development [20]. However, the calculation of transient permeability is much more complicated than the steady-state calculation, and researchers have used downstream pressure development curves for this purpose [21]. Depending on the experimental conditions, transient tests and steady-state tests closely correspond to the CO2 injection process and the CO2 clean-up process, respectively. In theory, the apparent permeability for CO2 through sample is independent of different measurement techniques. Existing research shows that permeability results using transient techniques may be up to twice greater than permeability calculated using steady-state approaches in low permeable rocks, due to the many assumptions made in transient calculations [21]. Rushing et al. [18] found five times greater permeability using the transient approach compared to the steady-state approach. This exhibits differences among permeability calculations under steady-state and transient conditions [22]. Importantly, permeability calculation under both conditions may have considerable errors if the possible CO2 phase transition through the rock mass is not considered under steady-state conditions [23]. As a result, precise knowledge of the liquid CO2 flow behavior in the reservoir rock mass is vital.
Zhang et al. [24] proposed a new method to calculate the apparent permeability for gaseous and liquid CO2 under steady-state conditions, and speculated that the permeability for liquid CO2 at higher than 12 MPa calculated by the traditional method can deviate greatly from the actual value. This study therefore attempts to distinguish the flow behavior of CO2 at higher pressures considering the CO2 phase transition between liquid and gaseous phases, and to identify the difference between steady-state and transient conditions, following a comprehensive set of permeability experiments on siltstone based on different confining and injection pressures at room temperature.

2. Experimental Methodology

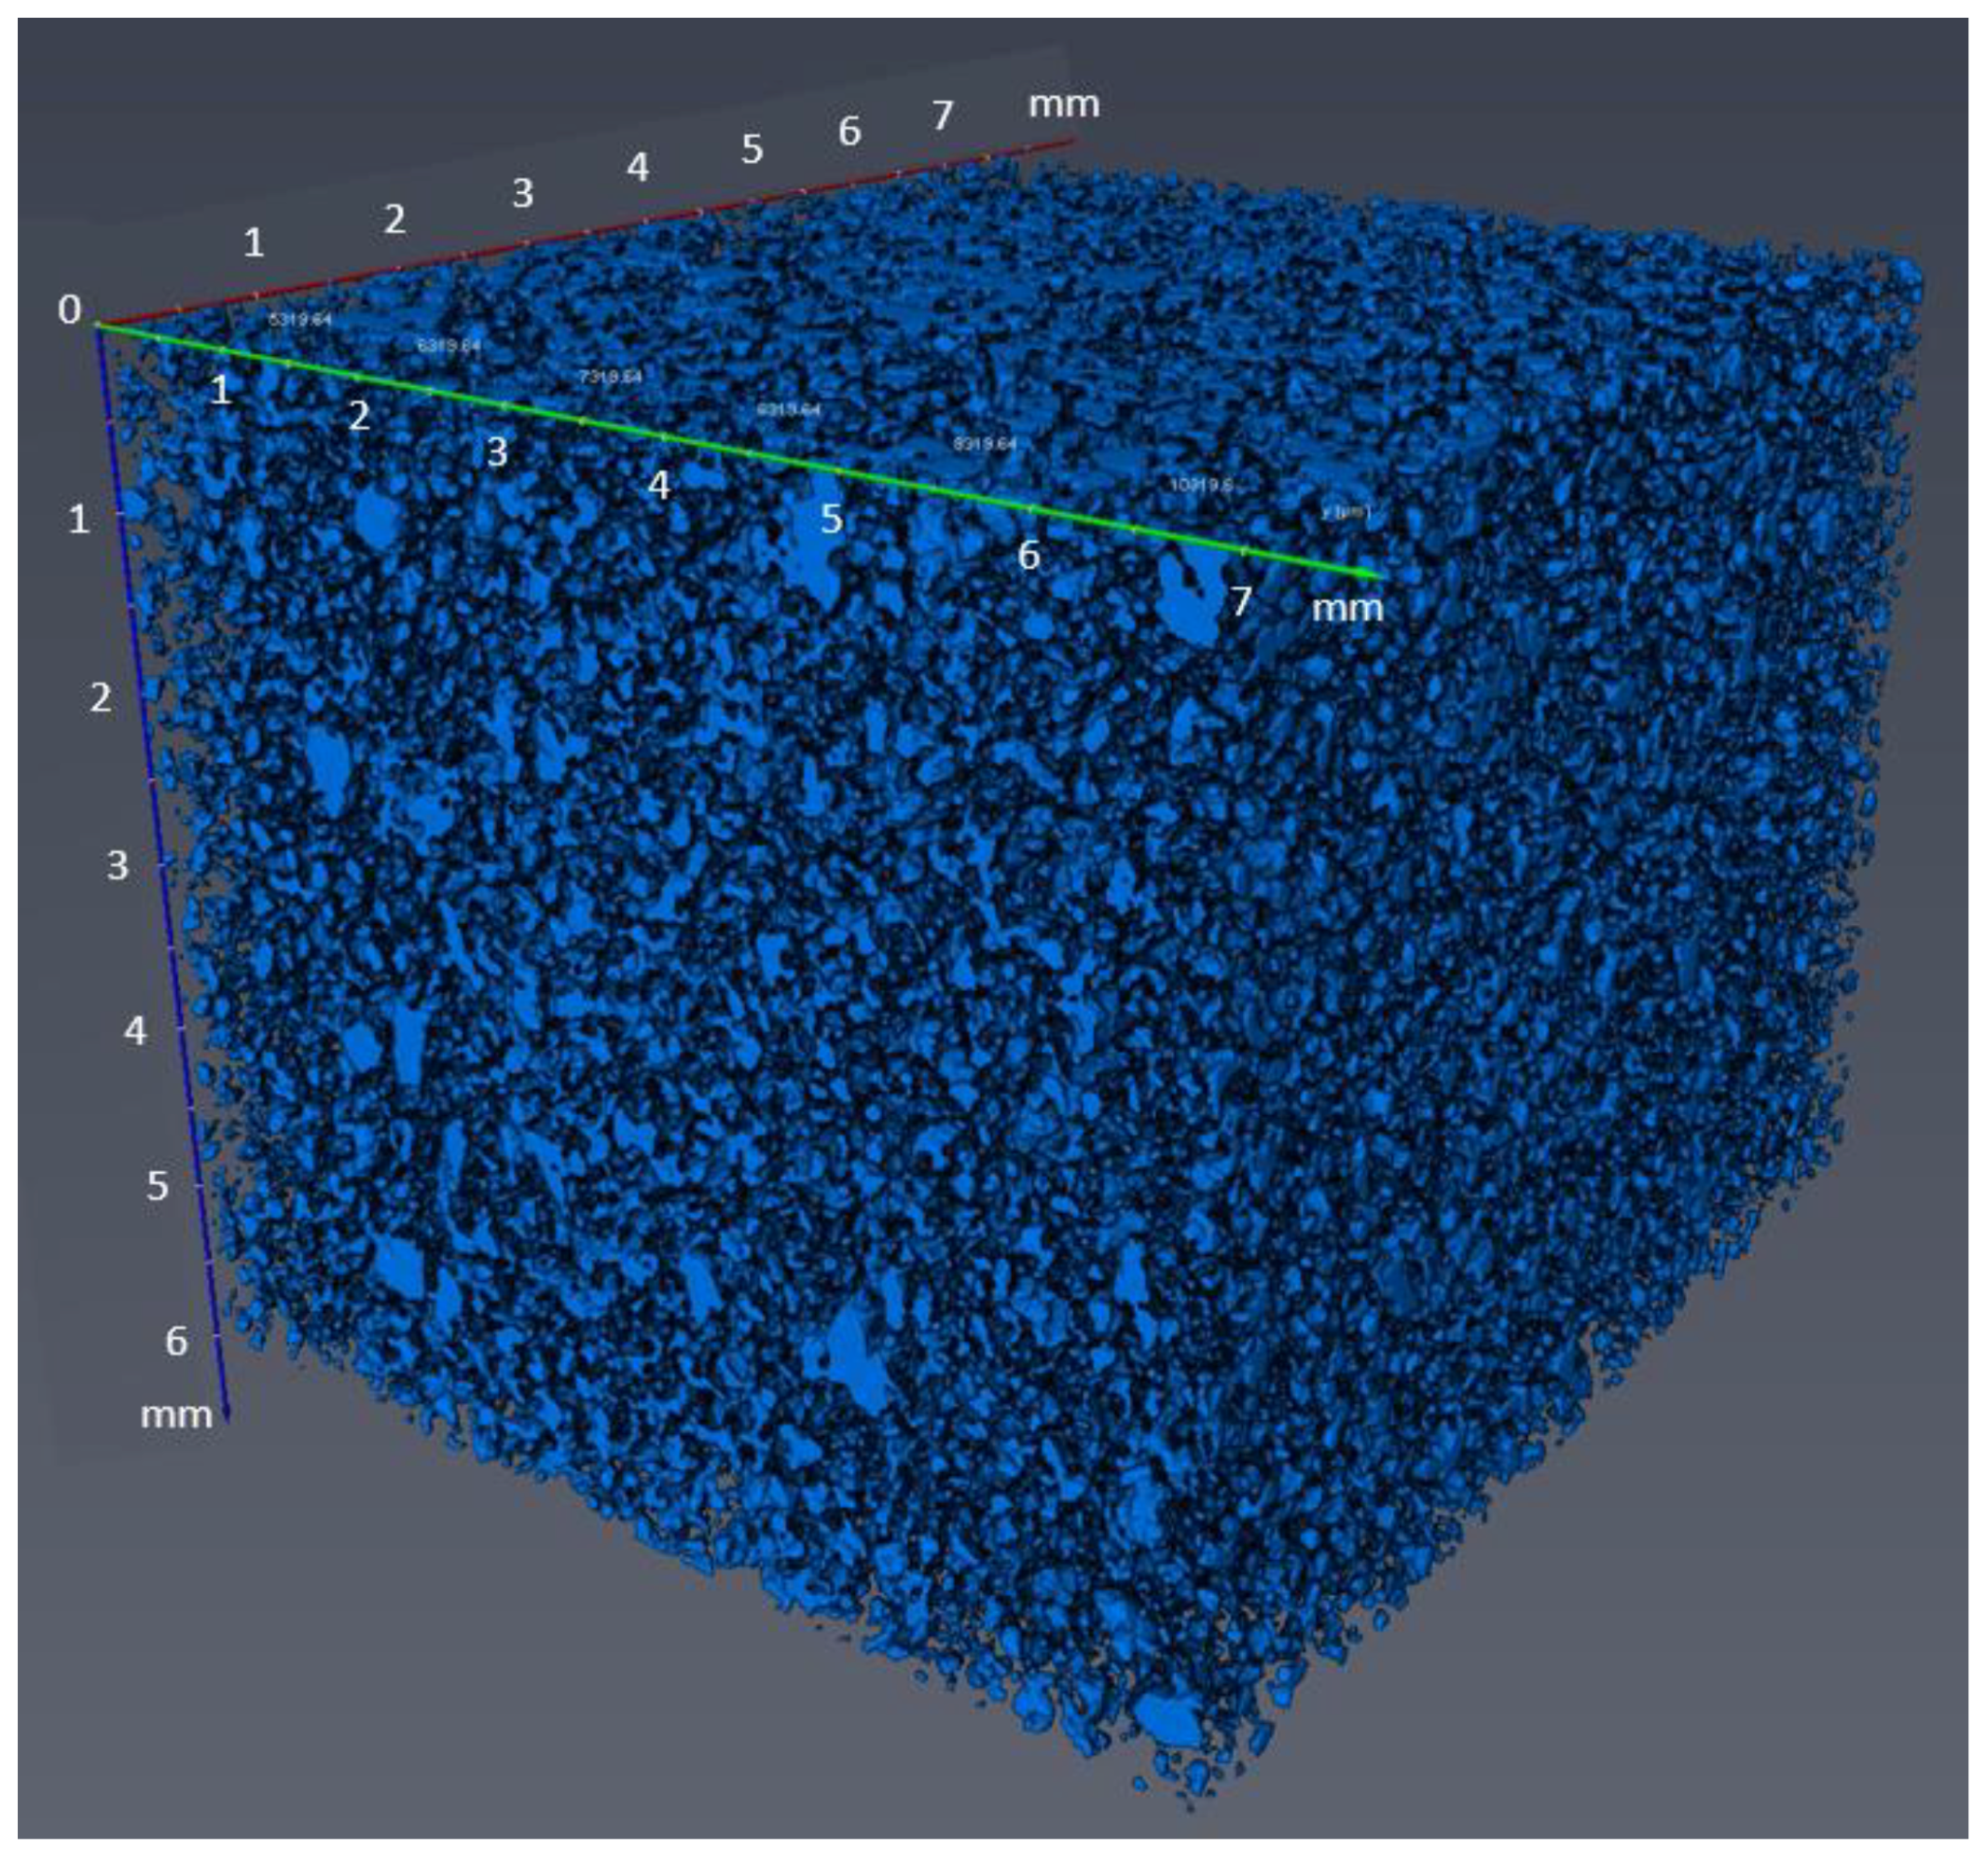
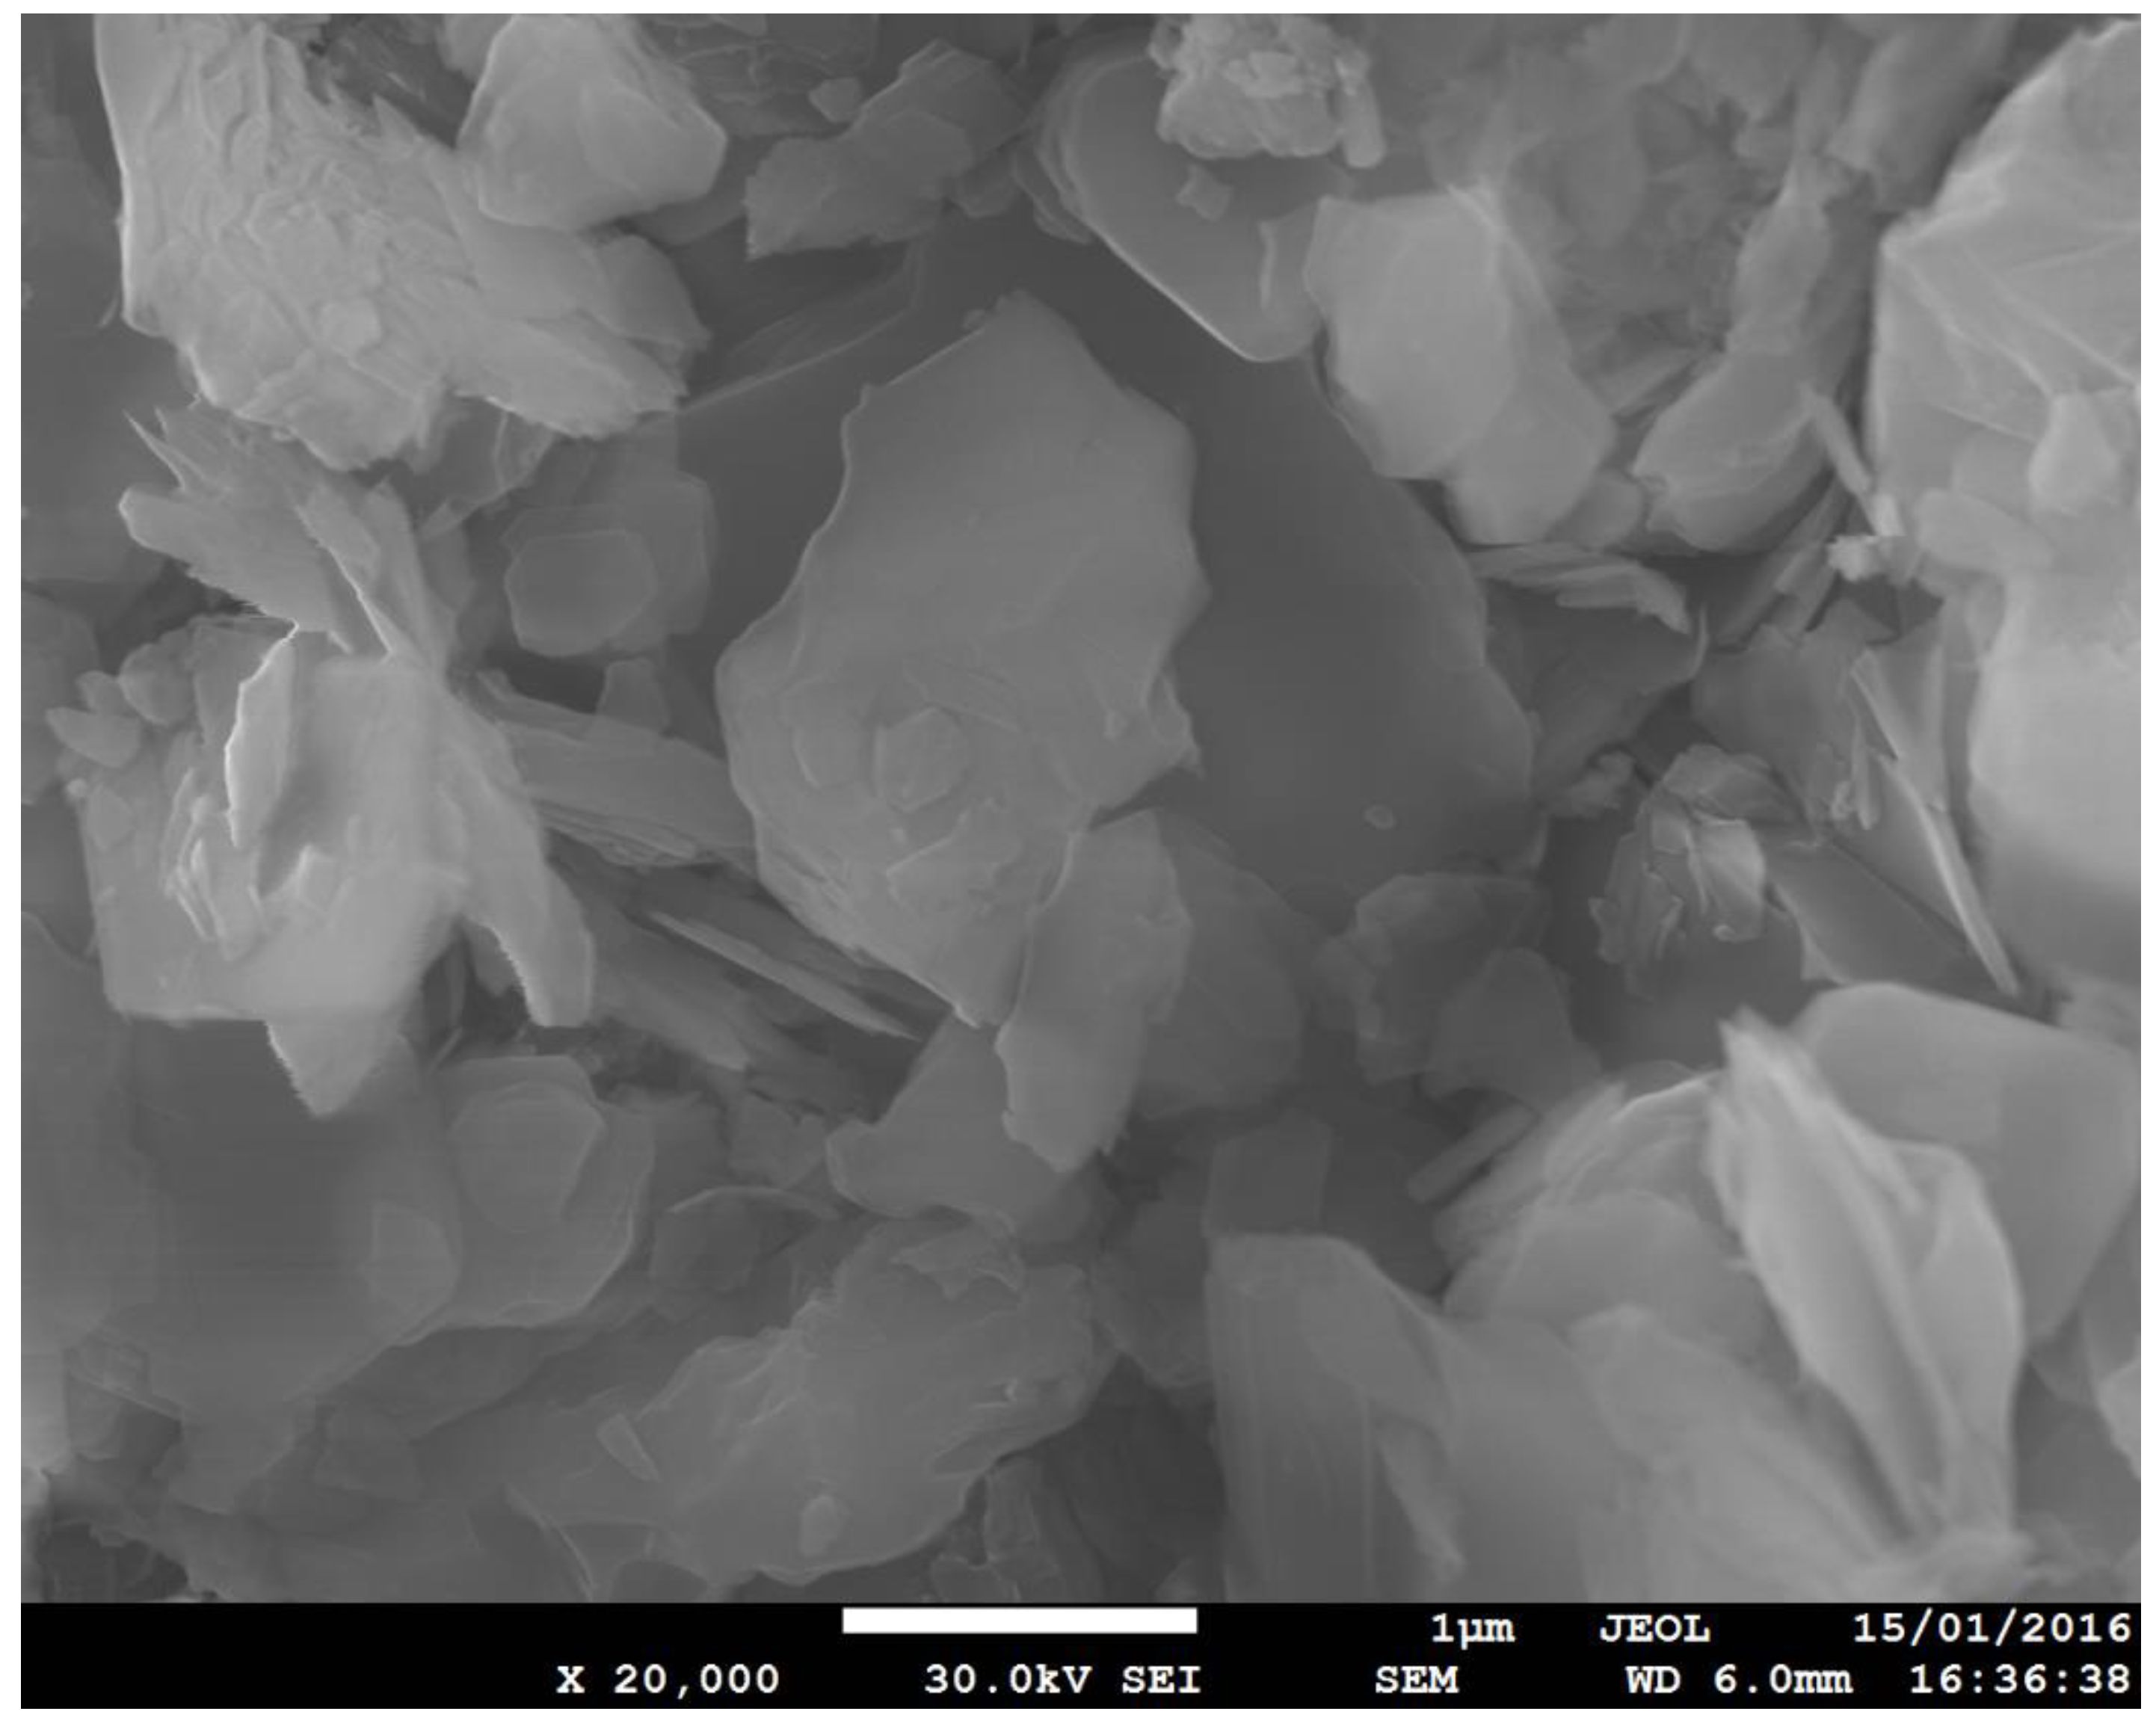
2.1. Sample Description

Since siltstone is one of the primary rocks in many shale formations, and both siltstone and shale have similar mineral compositions and pore structures [25], siltstone sample was used in this study as an alternative to shale samples to investigate the CO2 flow behavior in shale formations. The siltstone outcrop sample was collected from the Eidsvold formation, Queensland, Australia, and the total porosity of the dry siltstone measured using the mercury intrusion method was around 19.5%, which is higher than that of most shale, but still available in some shale formations [26], and the bulk density was around 2.24 g/mL. The pore size can be calculated by measuring the pressure and volume of injected mercury [27], and the pore distribution of the tested sample is plotted in Figure 1. This siltstone has very tiny pores, and the median pore diameter is around 625 nm and 17.2 nm in terms of pore volume and area, respectively. This pore structure was then validated by performing a CT scanning test on a sample with a diameter of 13 mm, as CT scanning can offer non-destructive three-dimensional imaging of the interior structure (see Figure 2 and Figure 3). The porosity obtained through CT testing was 15.4% calculated based on the watershed algorithm [28,29], which is slightly lower than the value obtained from mercury intrusion testing. There are many pores with varying sizes in the siltstone, although only a limited number of pores are of the order of magnitude of 100 µm and most of the pores are of the order of 1 µm (see Figure 2). 3-D CT images can be reconstructed by superimposing CT slices and only show the pore structure (see Figure 3), where tiny pores are evenly distributed and connected with each other through small pore throats. Regarding the mineral composition of the tested siltstone, according to XRD analysis, the tested dry siltstone is mainly composed of quartz (43%) and kaolinite (40%), and the tiny kaolinite particles (<2 µm) separate quartz-quartz particle contacts and segment the space formed by quartz particle skeletons [30]. As a result, the high clay content in the tested siltstone sample contributes significantly to this pore network [31,32]. This overall pore structure governs the low permeability of this sedimentary siltstone [33].

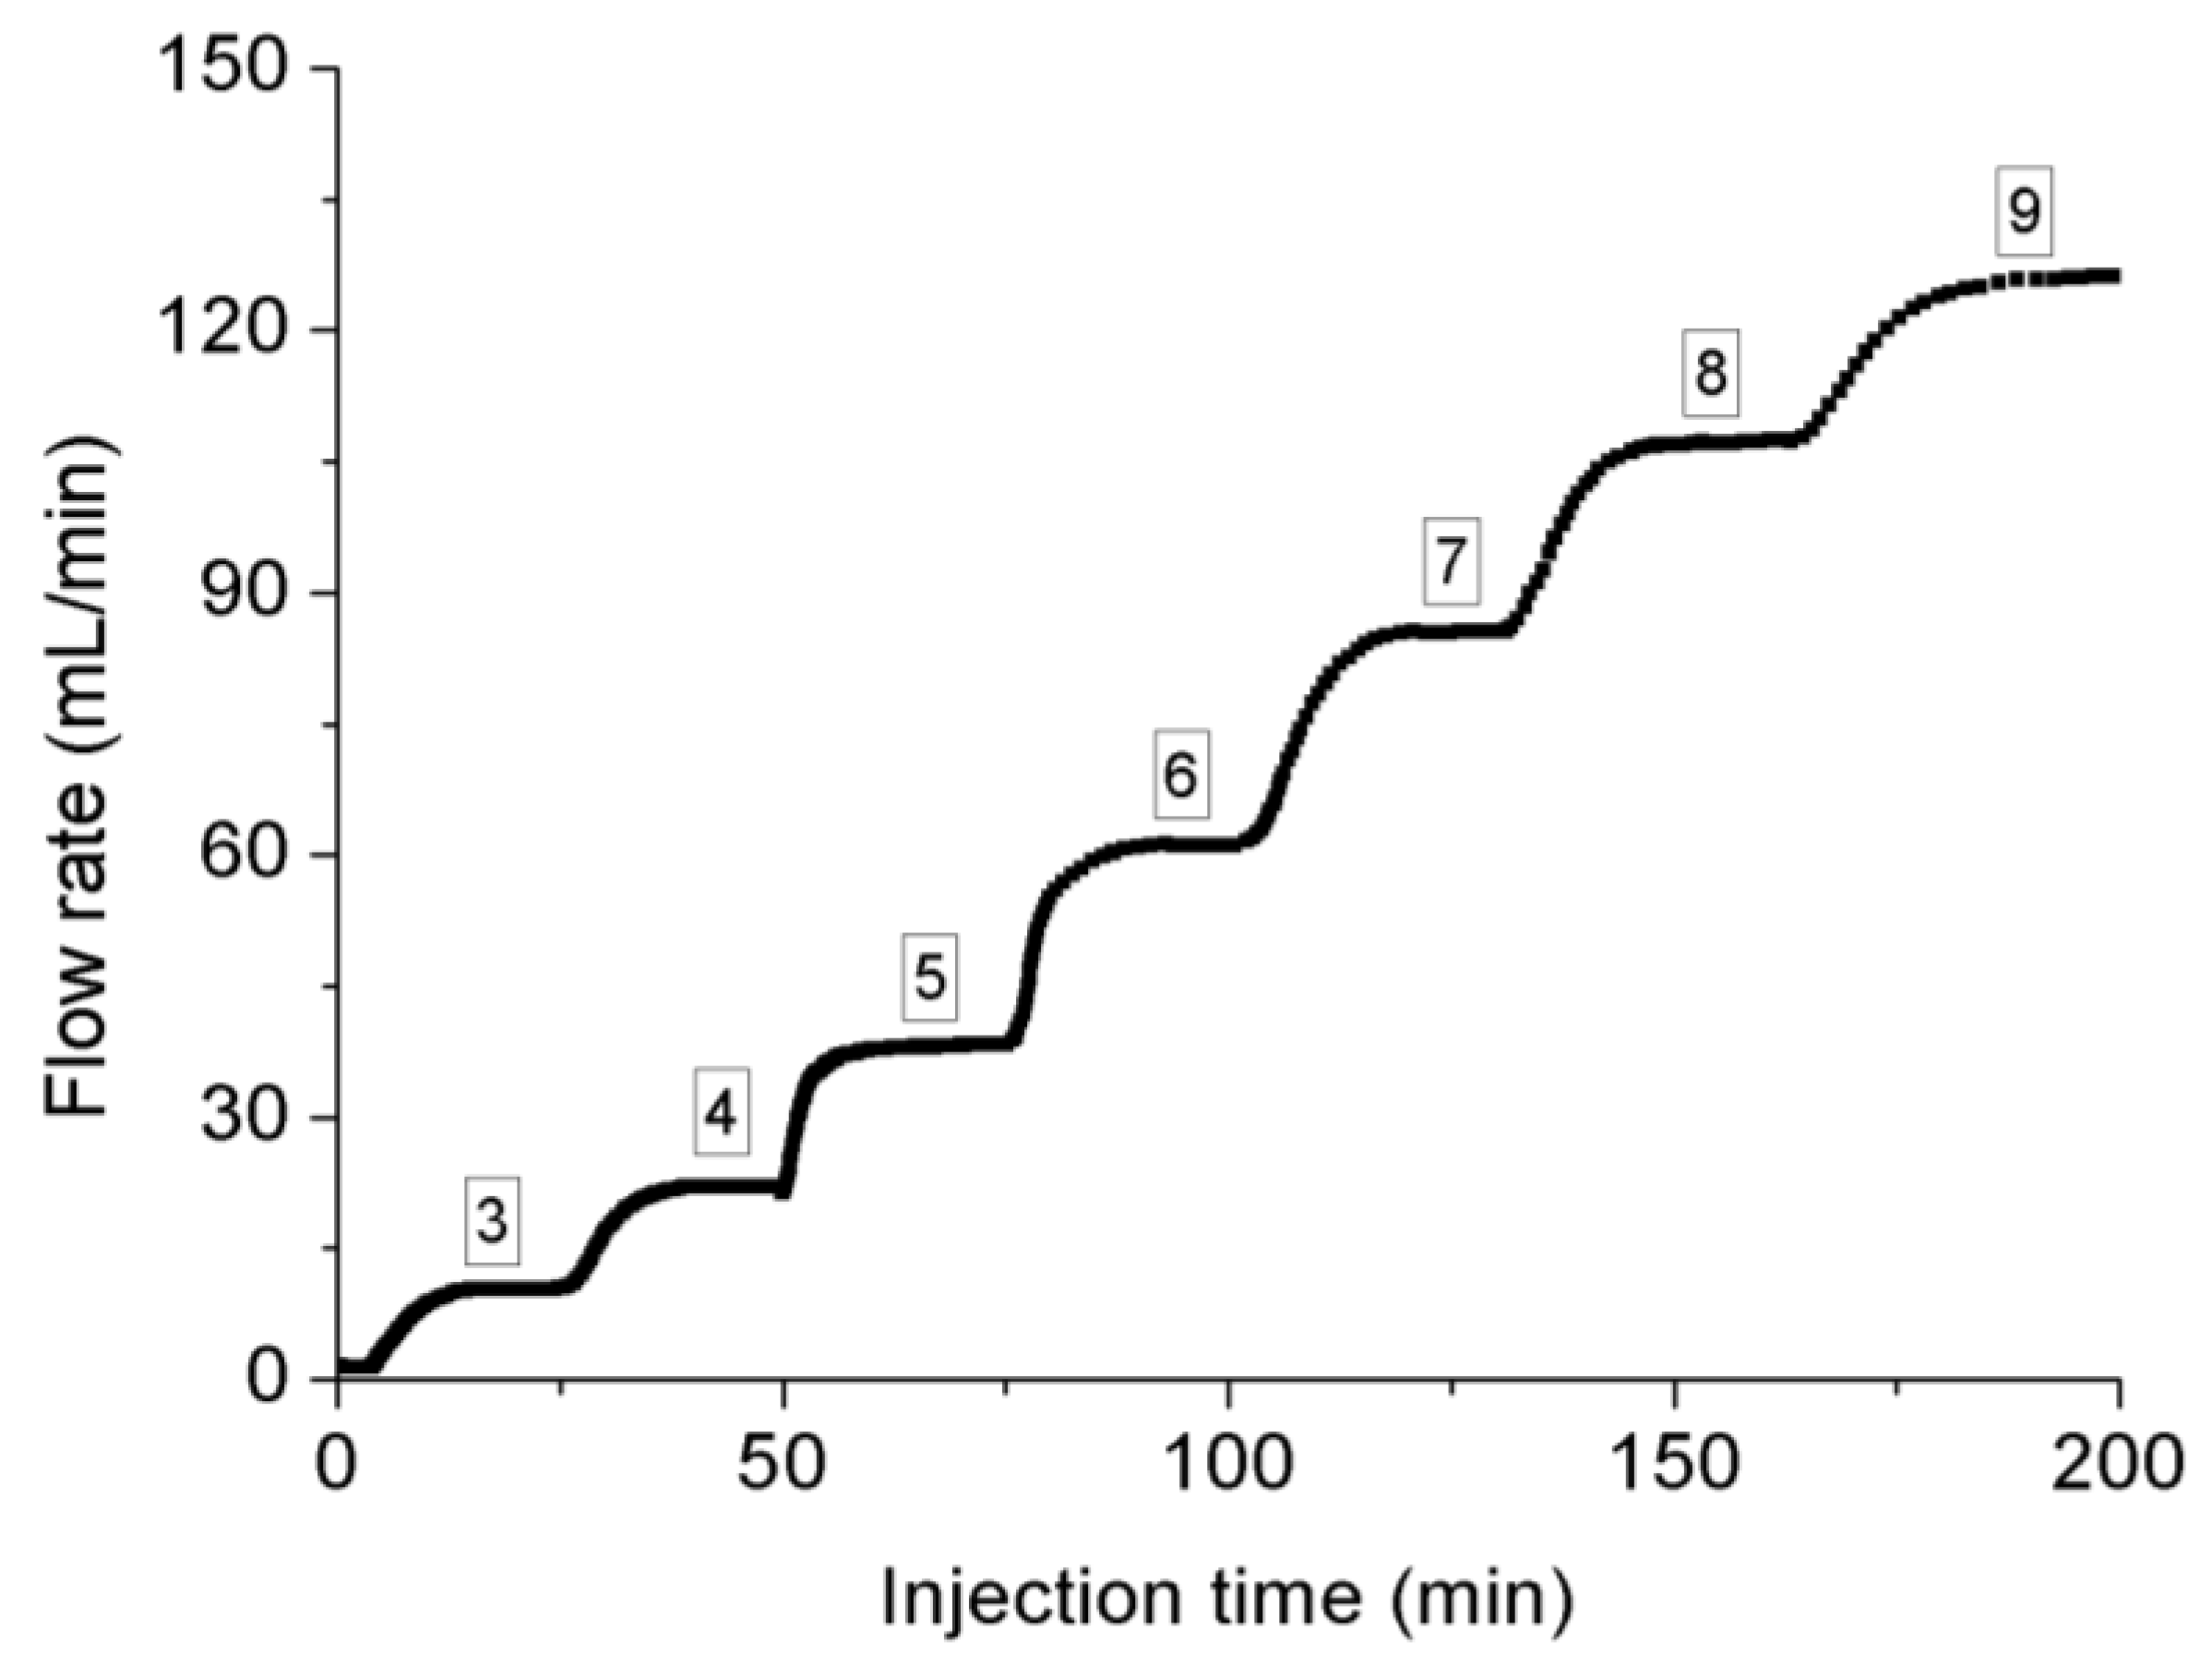
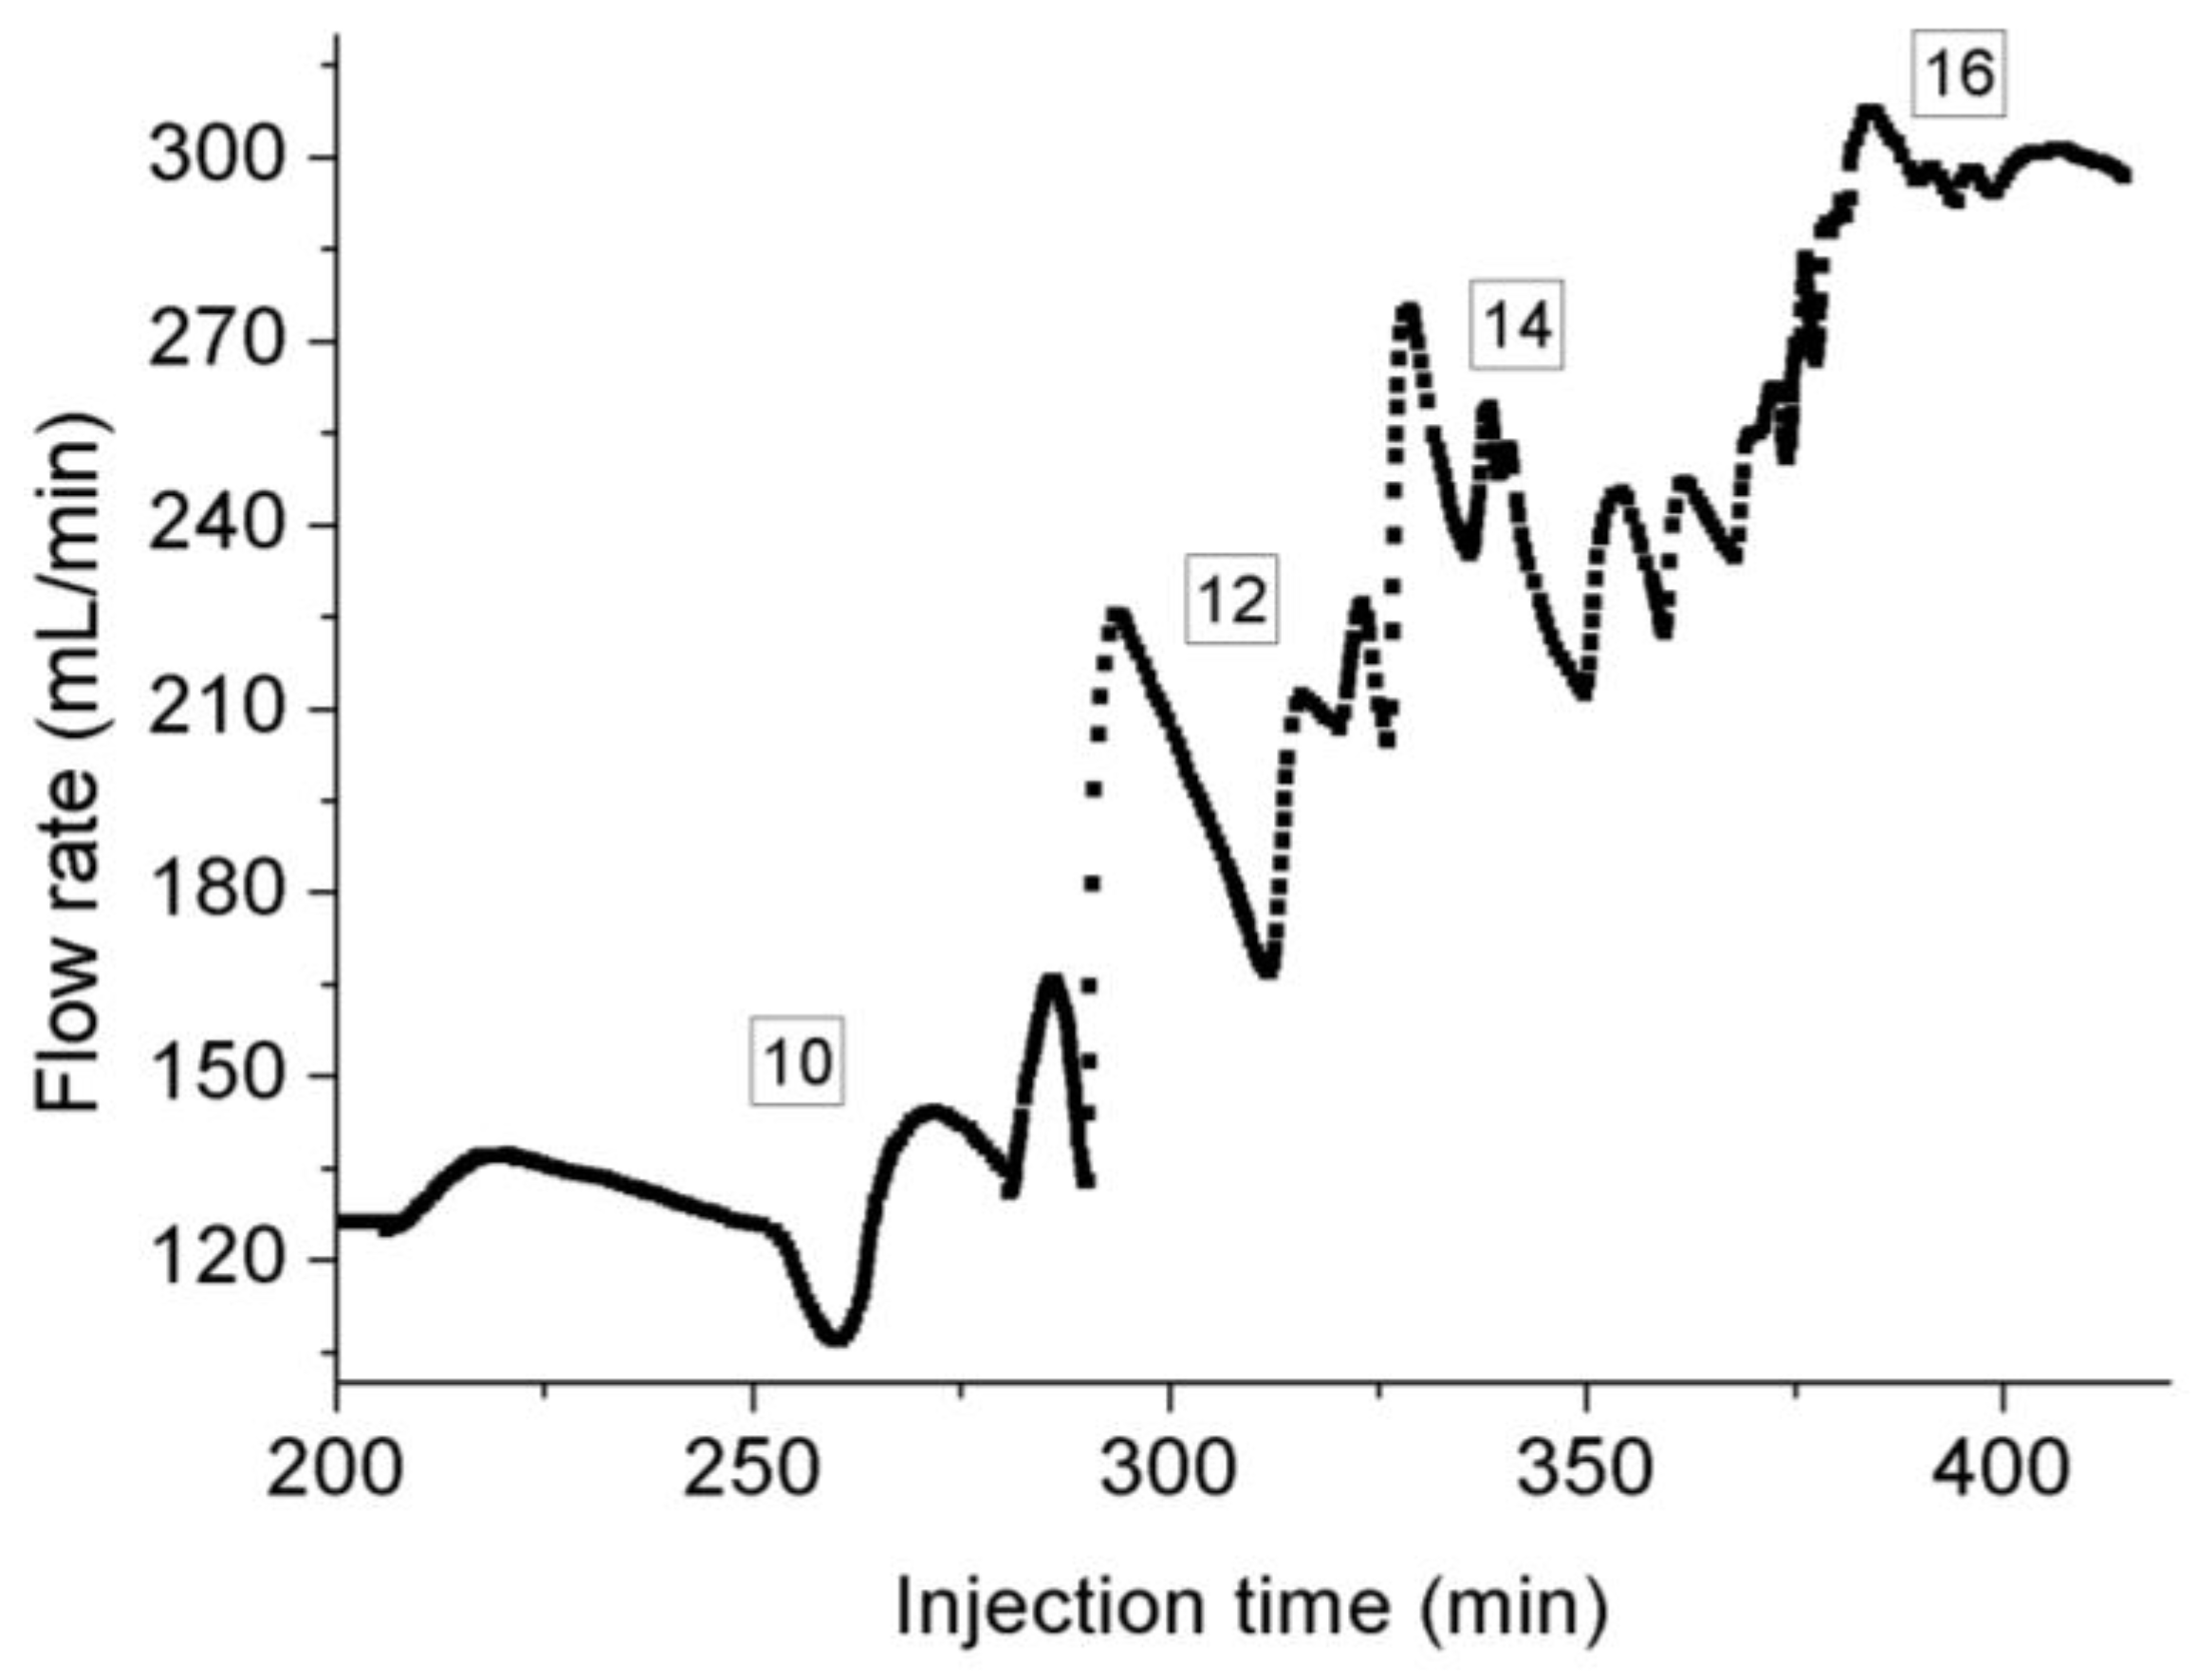
2.2. Experimental Procedure

A sample of dry siltstone 38 mm in diameter and 76 mm in height was first prepared in the Deep Earth Energy Research Laboratory at Monash University, and the detailed preparation procedure is reported by Ranjith and Perera [34] and Zhang et al. [24].
In the present study, permeability tests were performed under both steady-state and transient tri-axial conditions at room temperature (stabilized at 22 °C) by injecting CO2 with 99.95% purity. To avoid the effect of sample variance on the permeability results, only one dry sample was used. After each confining pressure from 10 MPa to 40 MPa became constant, permeability testing started. Sub-critical CO2 was injected into the siltstone sample, maintaining the injection pressure at a value of less than 90% of confining pressure to avoid possible CO2 leak-off through the sample-membrane boundary. For steady-state tests, the downstream outlet was opened to the atmosphere, and once the CO2 flow rate at the downstream became constant, the injection pressure was increased to the next higher value. Similar tests were conducted for a series of gas injection pressures. Since the expansion of CO2 flow along the sample can absorb heat from the surroundings and temperature fluctuation can affect accuracy in measuring permeability, a thermometer was placed in the tri-axial cell to monitor the temperature change in confining pressure oil during the tests. The temperature in the confinement cell remained steady at 22 °C, which indicates the constant ambient temperature around the sample. For transient condition tests, the outlet was closed, and once the downstream pressure reached the injection pressure, both upstream and downstream pressures were released to remove the injected CO2 from the sample, and the pressure release was done at a very slow rate of 0.2 MPa/min controlled by a pump to avoid any sudden CO2 volumetric expansion with the associated temperature change. Once the downstream pressure reached the atmospheric pressure and the flow rate at downstream dropped to zero, the next injection pressure was initiated, and similar tests were conducted for a series of gas injection pressures. Considering the possibility that multiple cycles of pressurization and depressurization may cause serious and irreversible structure damage to the sample, permeability tests at 10 MPa confinement under steady-state conditions were repeated and nearly the same flow rates under the same condition were witnessed. This confirms that the sample was not fatigued in this test, because the maximum confinement pressure and injection pressure applied in this study were much lower than the rock strength and the tested siltstone was still in the elastic stage.

2.3. Permeability Calculation

In shale formations or tight formations with ultralow permeability, the flow behavior of gas is affected by the combination of stress effects and the flow regime effect. The flow regime effect cannot be ignored, in particular when the gas pressure is low and the pore throat is small, and the transport of gas is governed by a mixture of Darcy flow, which is caused by the pressure gradient, and Knudsen flow, which is caused by molecular collisions along the walls of the flow channels [35]. Therefore, it is necessary to distinguish the flow pattern of CO2 in siltstone before calculating the permeability.
The flow behavior of gas depends on the pore throat, temperature, pressure and the molecular diameter, and can be divided into different flow types at different scales, and the flow regimes can be distinguished by the dimensionless Knudsen number (see Equations (1) and (2)) [3]. According to Heller et al. [3], when the Knudsen number is less than 0.01, the pore size is much higher than the mean free path of gas molecules, and the flow is mainly driven by pressure difference (Darcy flow); in contrast, when K n > 10 , the gas molecules move along the tiny pore throats by the collisions between gas molecules and between the pore wall and gas molecules, and the driving force is mainly caused by the concentration gradient instead of the pressure difference (Knudsen flow), and Darcy’s law is therefore no longer applicable. The flow is in slip flow regime when 0.01 < K n < 0.1 and in transition flow regime when   0.1 < K n < 10 , which are mainly induced by Darcy flow and Knudsen flow, respectively [3,35].
K n = λ d p
λ = k B T 2 π d m 2 P
where, K n is the dimensionless Knudsen number, d p is the diameter of the pore, λ is the mean free path of CO2 molecules, k B is the Boltzmann constant (=1.38 × 10⁻²³ m2kgs−2K−1), T is the temperature (K), d m is the CO2 molecular diameter, and P is the gas pressure.
With the increase of gas pressure, the molecular mean free path of CO2 becomes smaller with higher gas density (see Figure 4), and the effect of Knudsen flow recedes with the increase of pressure (see Figure 5). For example, for a pore with a diameter of 300 nm, the Knudsen number is 0.0139 at a pressure of 2 MPa and the flow is in slip flow, while the Knudsen number is 0.0093 at pressure of 3 MPa and the flow is in Darcy flow. When the pressure is higher than 5 MPa, the mean free path is 1.67 nm, and pure Darcy flow can only happen in pores with diameters greater than 167 nm and slip flow in pores between 16.7–167 nm. According to the pore size measured by mercury intrusion testing, the median pore diameter of siltstone is around 625 nm where the flow mainly belongs to Darcy flow, while there are still many pores with a diameter around 10–300 nm where the slip flow effect also has an important role (see Figure 5), in particular when CO2 is in the gaseous state. Due to the smaller molecular diameter and larger mean free path of CO2 compared with CH4, (see Figure 4), slippage effects are slightly greater for CO2, and the apparent permeability for CO2 is slightly higher than that of CH4.
The slip-flow effect was first discovered by Klinkenberg [36], and the effect is expressed as Equation (3), which indicates that the slip-flow effect can greatly increase the permeability for gas if the pore radius and pore pressure are small.
k g = k l ( 1 + b P )
where, k g is apparent the permeability for gas CO2, k l is the intrinsic permeability of tested siltstone which can be measured using liquid CO2 or water, b is the Klinkenberg parameter and P is the pore pressure.
Since the flow regime mainly belongs to Darcy flow, the permeability of the tested siltstone for gas injection under various steady-state conditions can be calculated using the traditional Darcy equation (Equation (4)), based on the assumption that gas volume changes inversely proportionally with gas pressure at constant temperature [37].
k g = 2 Q o P o μ L A ( P i 2 P o 2 )
where, k g is the permeability for CO2, Q o is CO2 flow rate at downstream, μ is its viscosity, L and A are the length and cross-sectional area of the specimen, P o and P i are downstream pressure and upstream pressure.
However, when the injection pressure is higher than 6 MPa, the gaseous CO2 and liquid CO2 co-exist in the sample because CO2 transfers into its liquid state at 6 MPa (data from NIST) [38], and the Boyle’s Law that gas volume is proportional to the gas pressure is assumed to be applicable for the gaseous state for simplicity, but not for the liquid state, because this phase transition causes sudden enhancement of density [39]. For example, when CO2 is in its liquid state, its density increases slightly from 760 kg/m3 at 6.01 MPa to 901 kg/m3 at 15 MPa, which is much higher than 210 kg/m3 at 6.00 MPa. Therefore, the Darcy equation for compressed gas is not suitable for this case, and in consideration of the slight difference of density in the liquid state, the permeability for the liquid section can be calculated using the method proposed by Zhang et al. [24], utilizing Equations (5) and (6), and the ratio between the length of gaseous CO2 section to sample length is inversely proportional to the ratio between the flow rate at an injection pressure of 6 MPa and that at each higher injection pressure.
L l = L L g = L Q 6 L Q o
k l = Q l μ l L l A ( P i P t )
where, L l is the length of liquid CO2 in the sample, L g is the length of gas CO2 in the sample, Q 6 is the flow rate at 6 MPa injection pressure, k l is the permeability for liquid CO2 at a certain injection pressure (>6 MPa), Q l is the liquid CO2 flow rate at transition point, μ l is the viscosity of liquid CO2 at room temperature, P t is pressure at transition point and here it equals 6 MPa, and P i is upstream pressure.
For transient conditions, the permeability at specific pressure was calculated using pulse-decay permeability measurement by the following equations (Equations (7) and (8)) [3]:
Δ P ( t ) = Δ P 0 e α t
α = k A β V d o w n L μ
where, α is the decay exponent, Δ P 0 is the pressure difference between upstream and downstream at time t = 0, Δ P ( t ) is the pressure difference between upstream and downstream with time, k is the permeability for CO2, β is the CO2 compressibility, V d o w n is the volume of the downstream reservoir, μ is the CO2 viscosity, and L and A are the length and cross-section area of the sample, respectively.

3. Results and Discussion

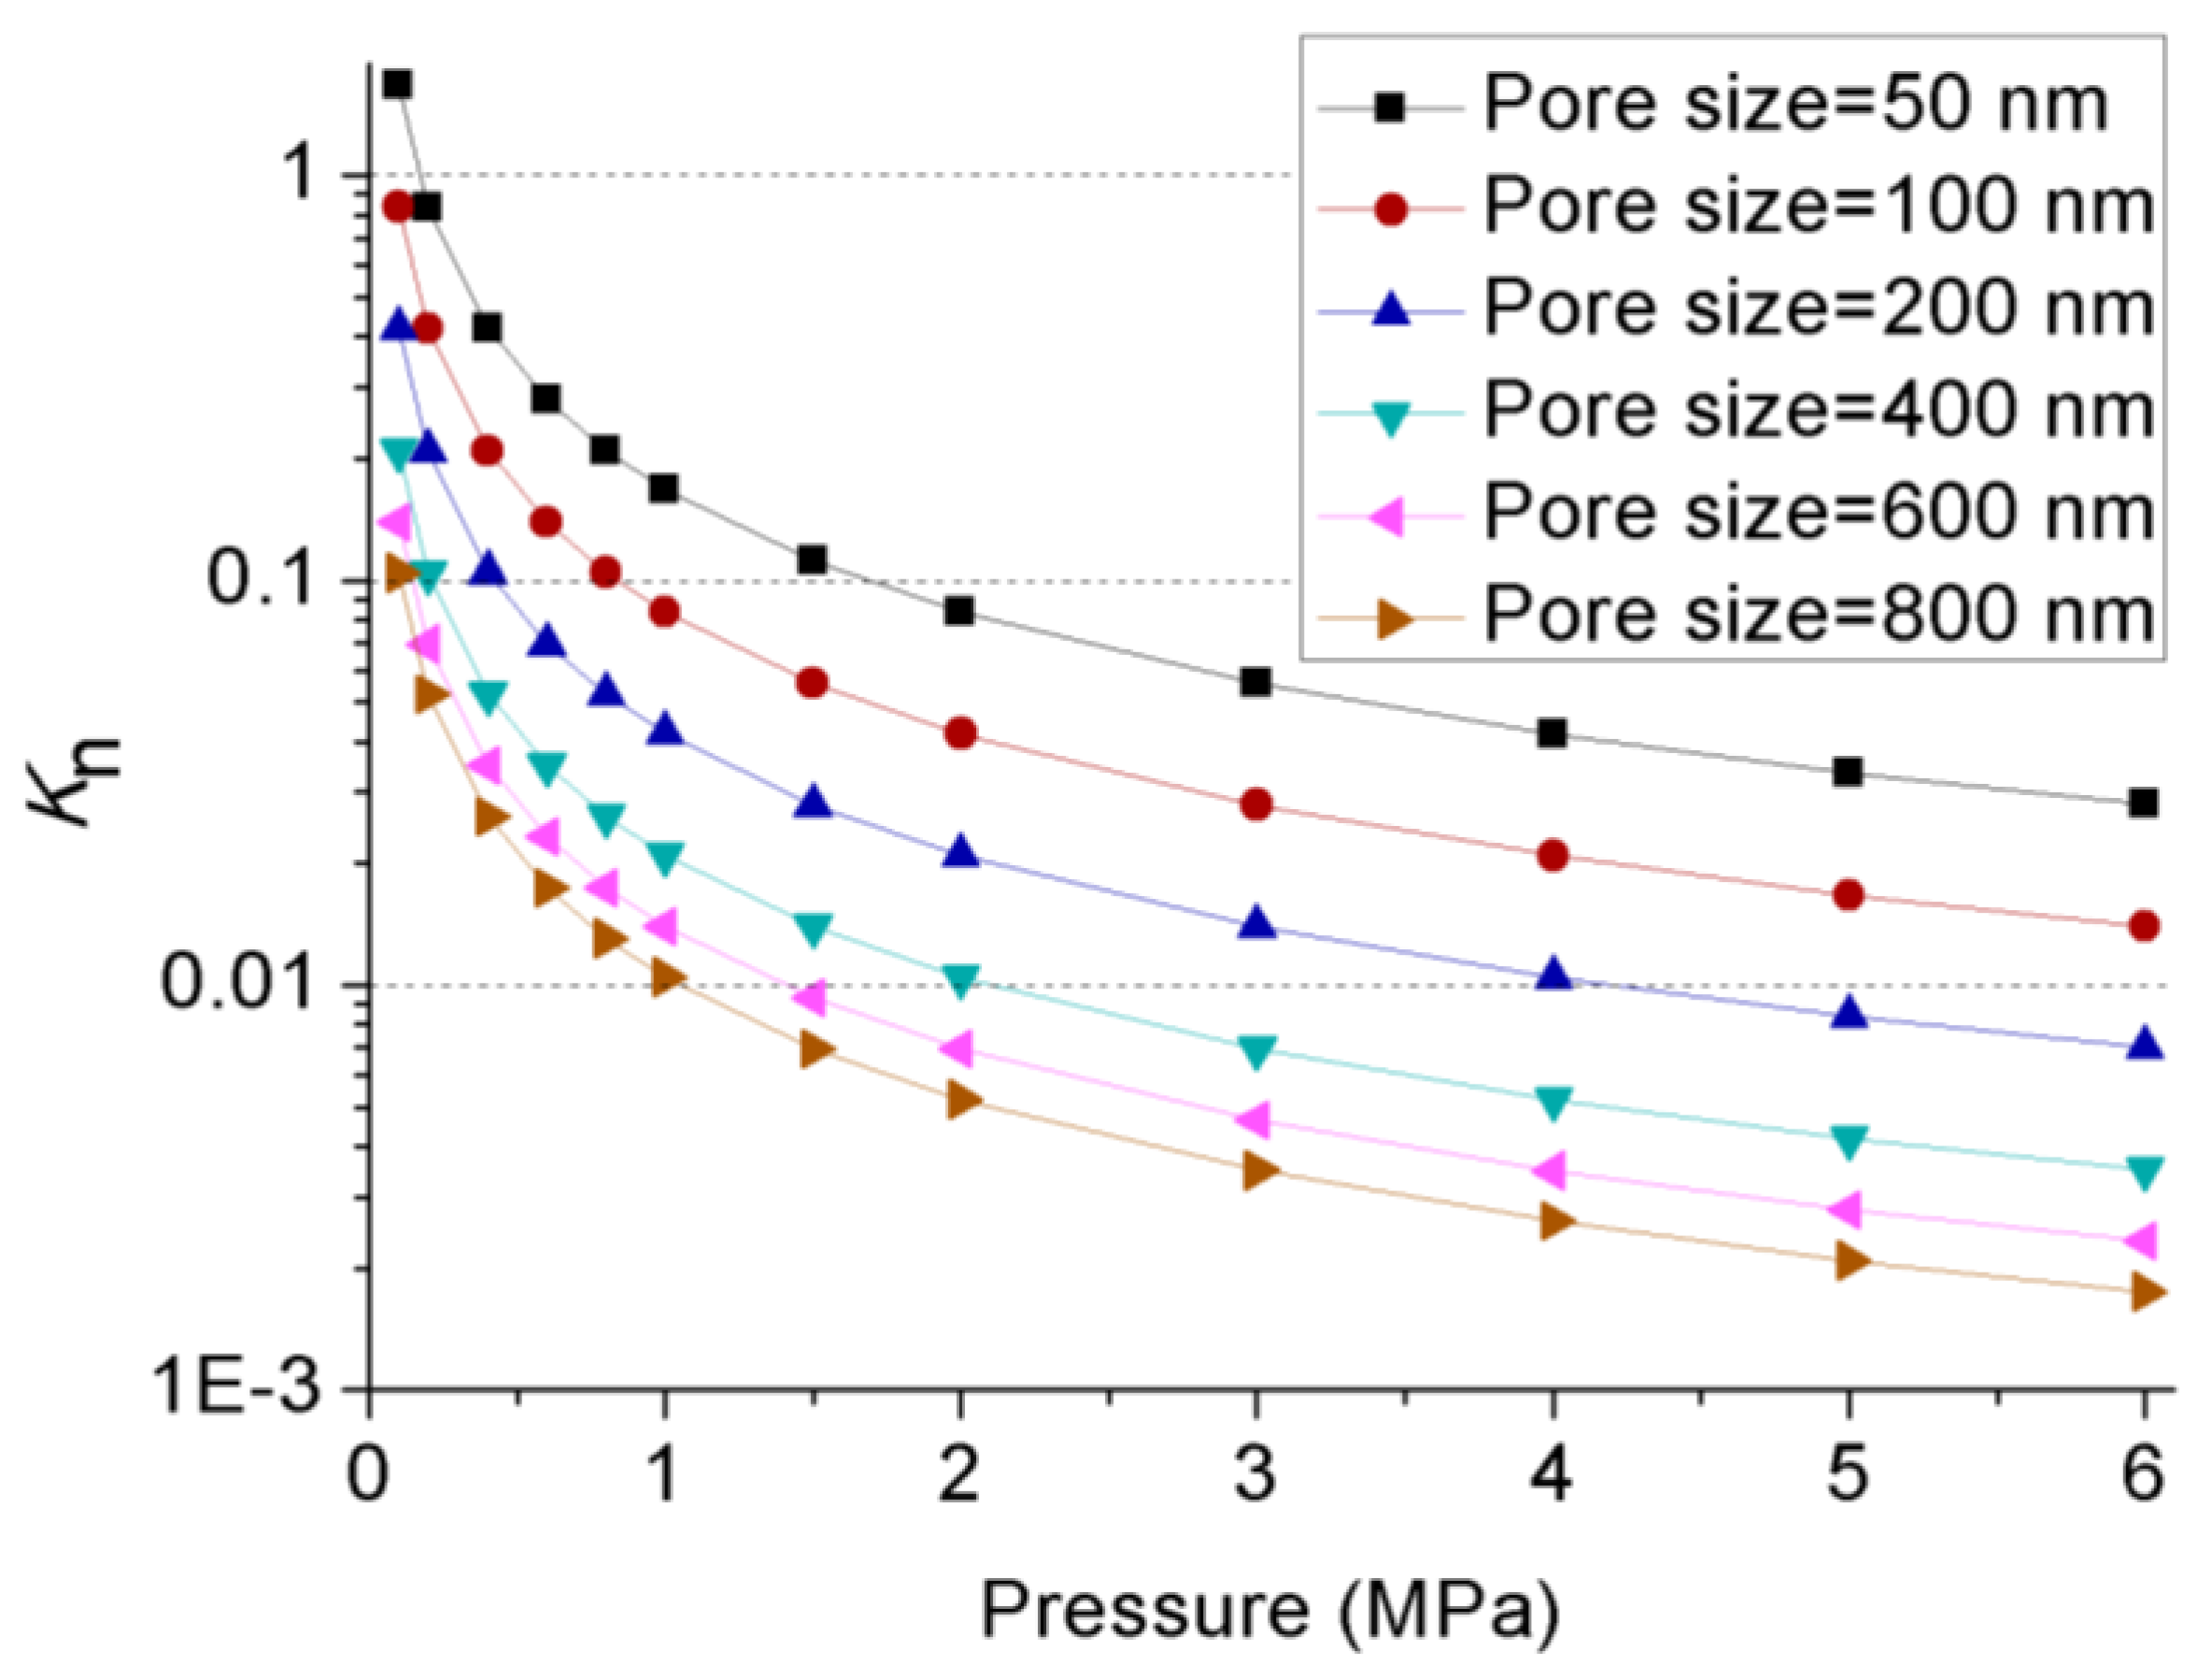
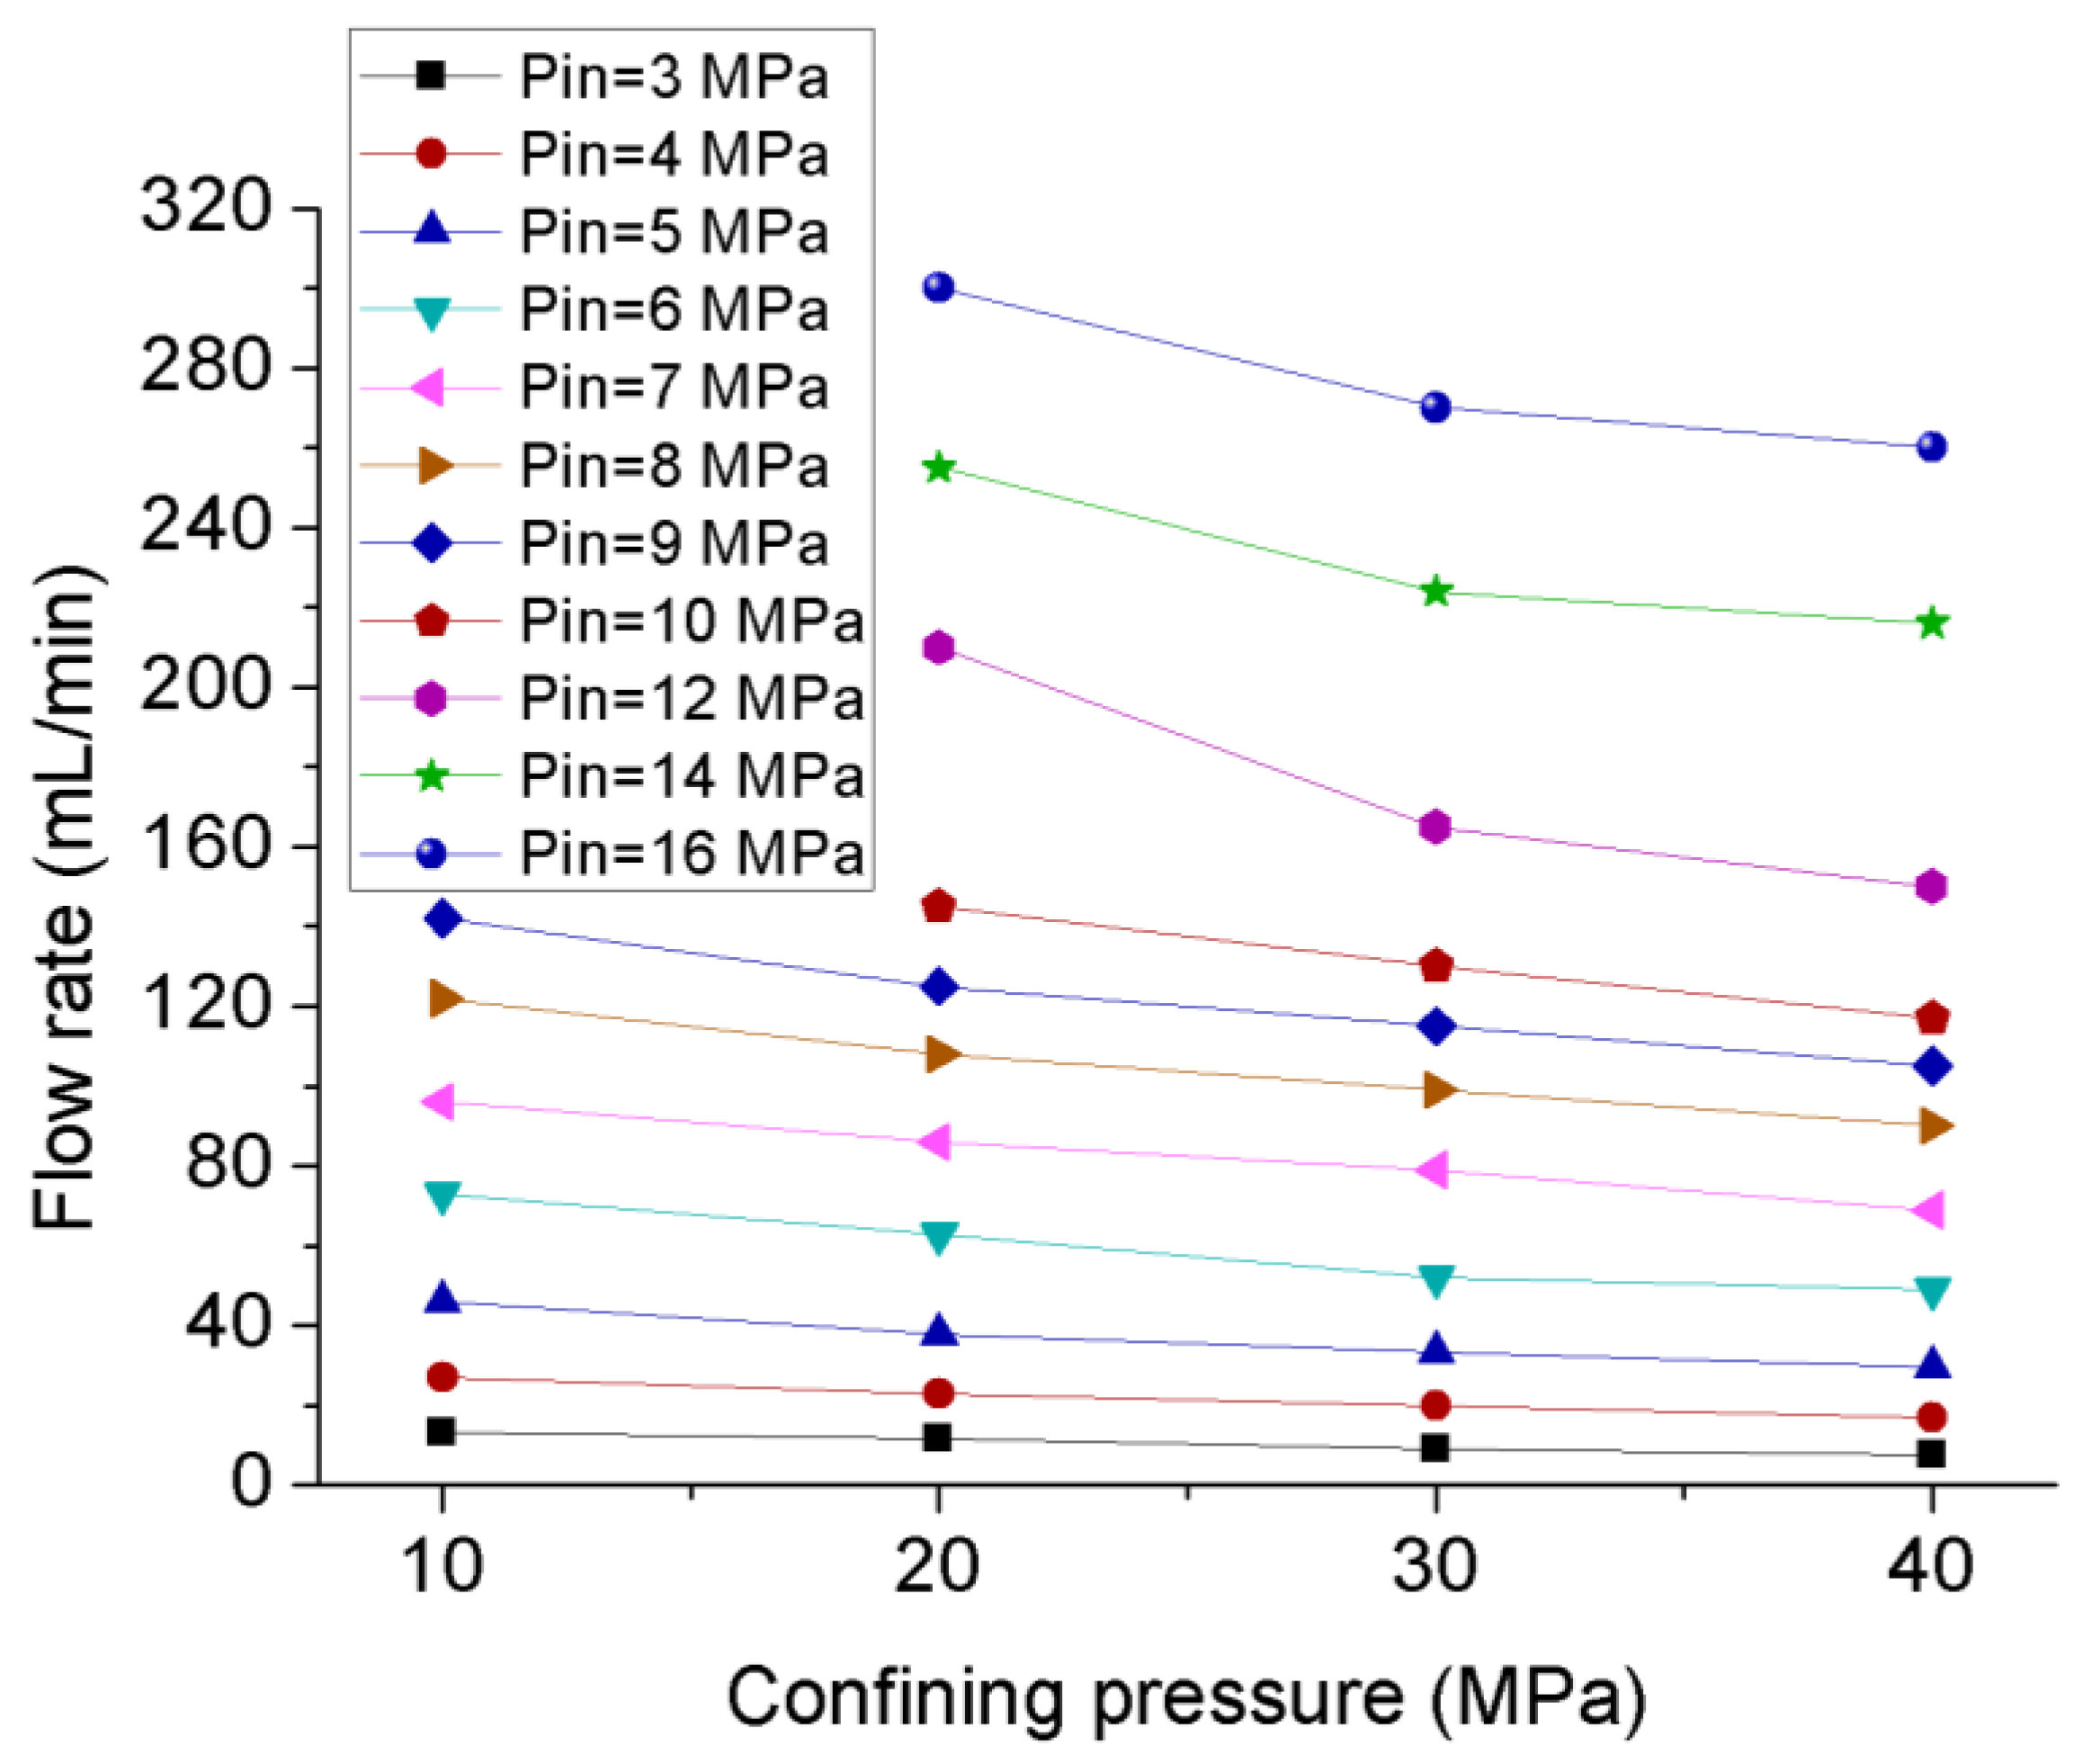
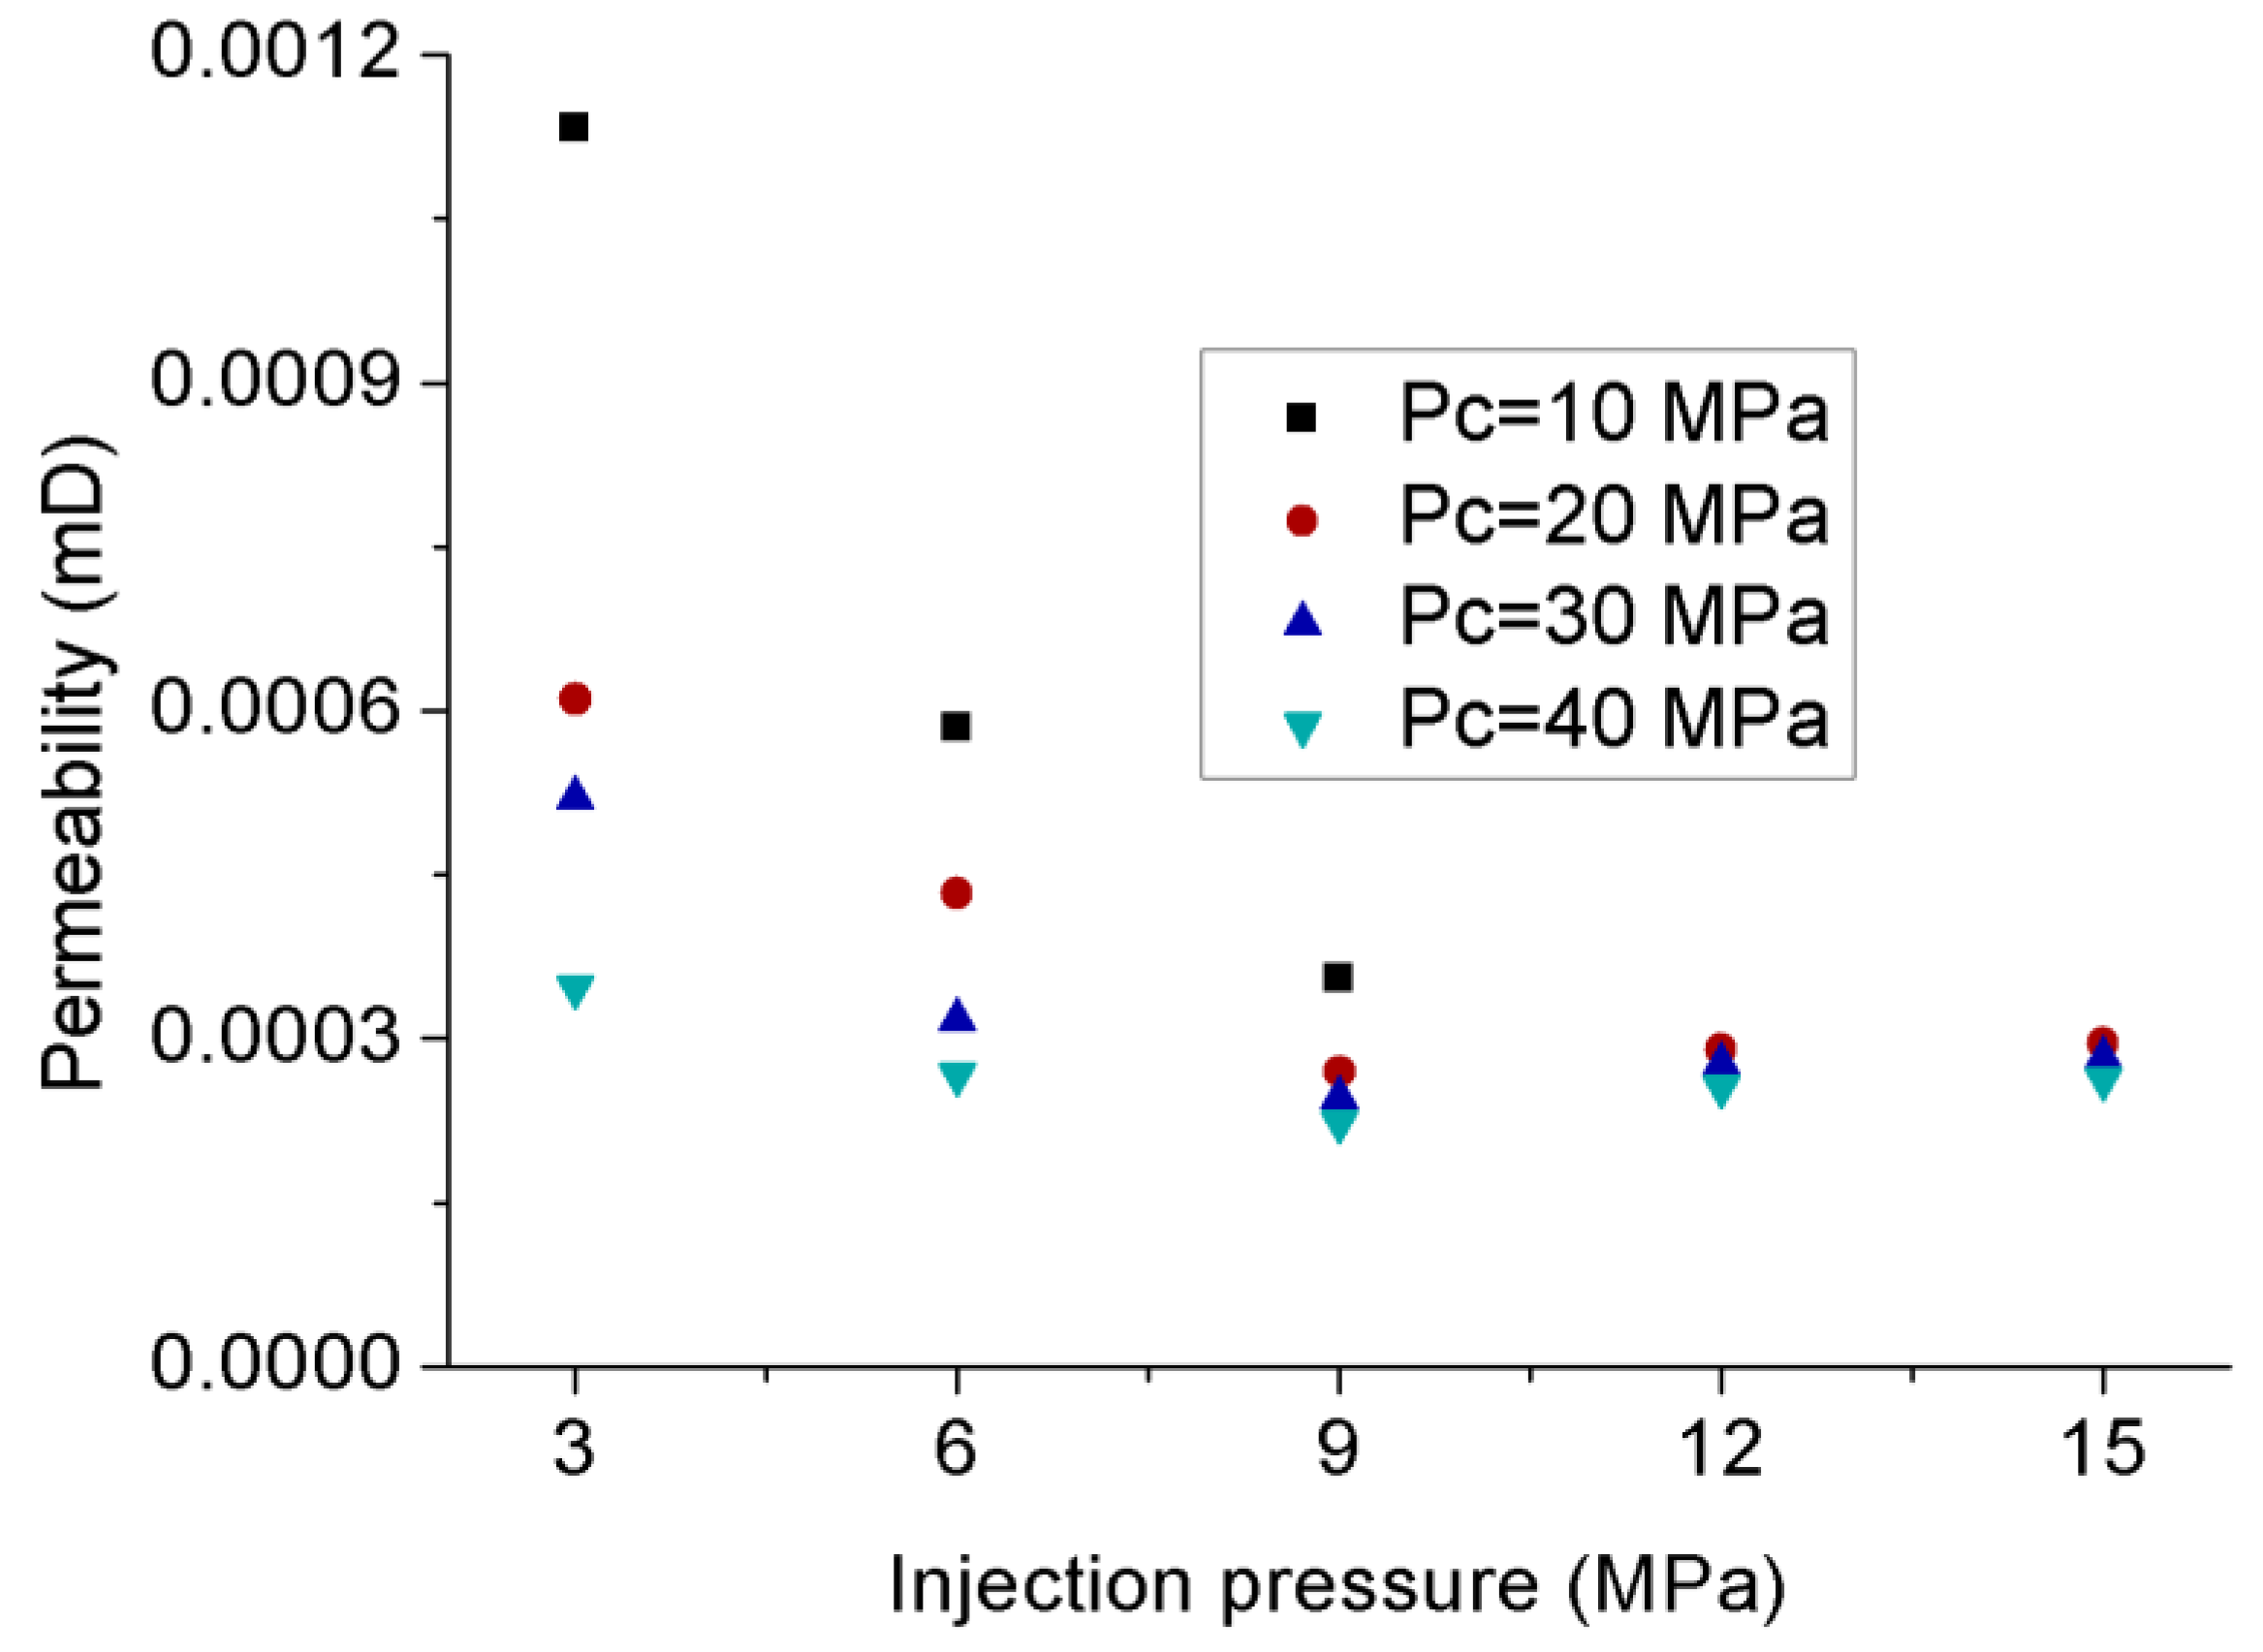
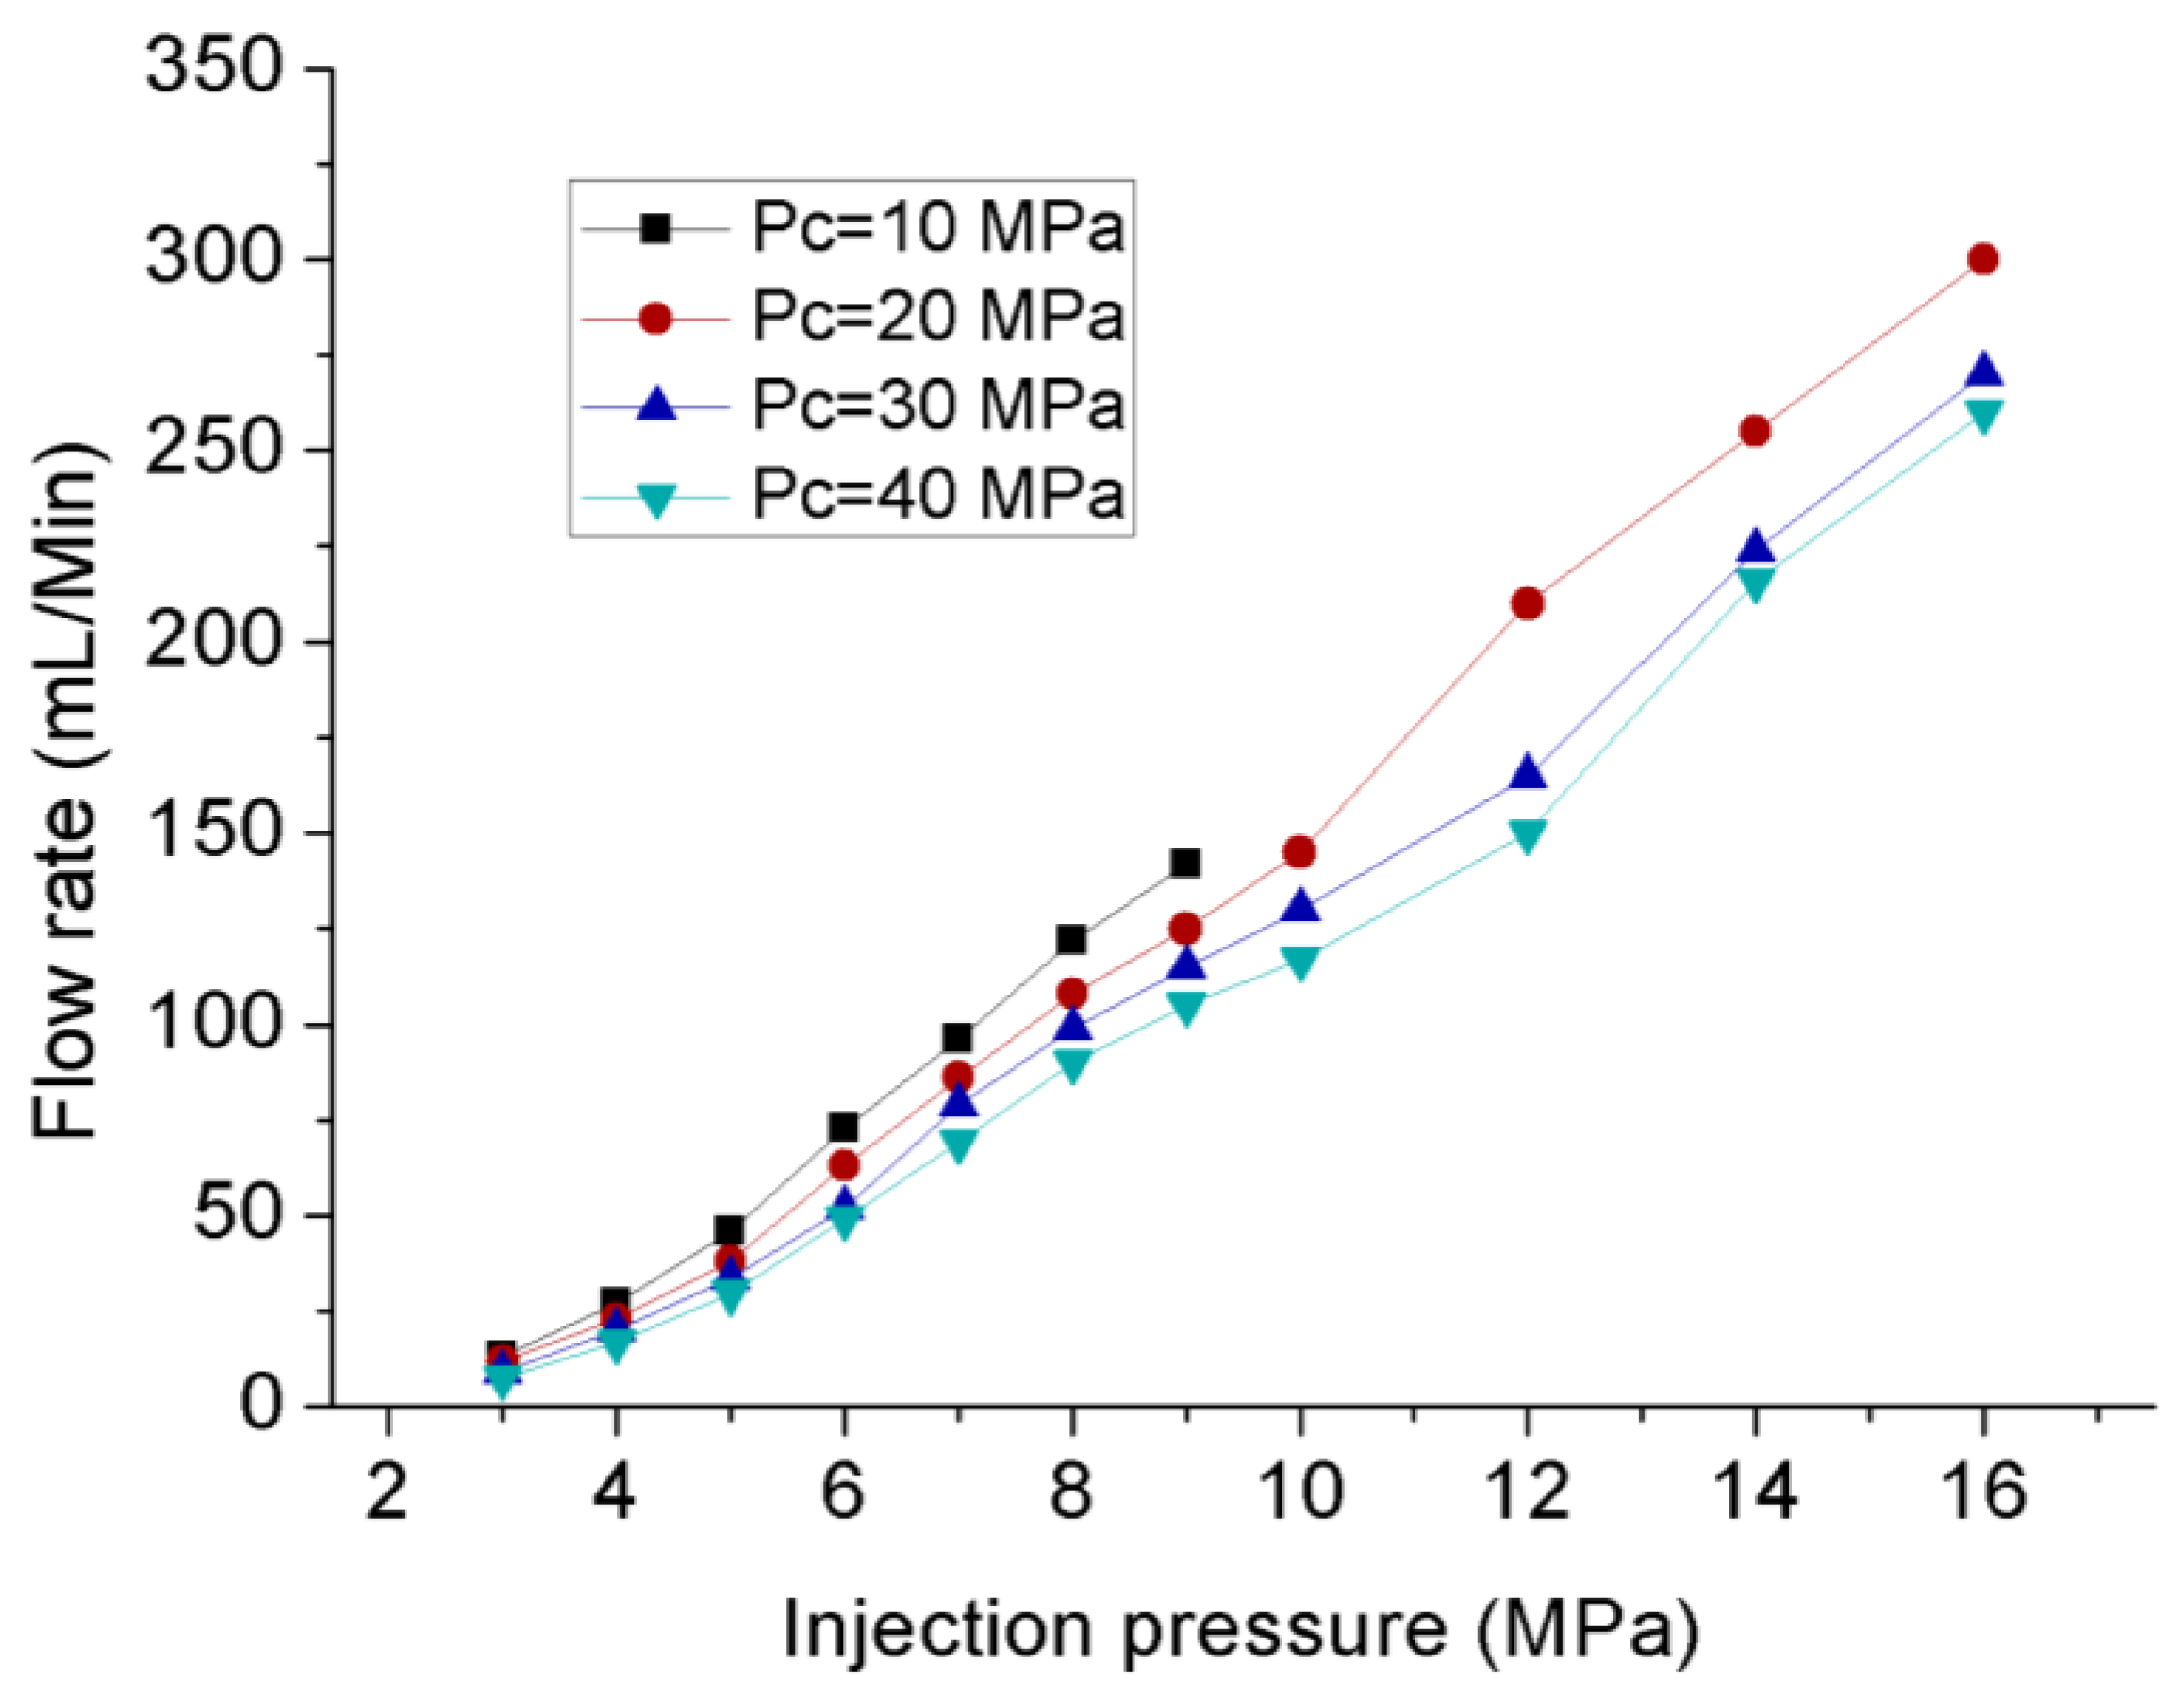
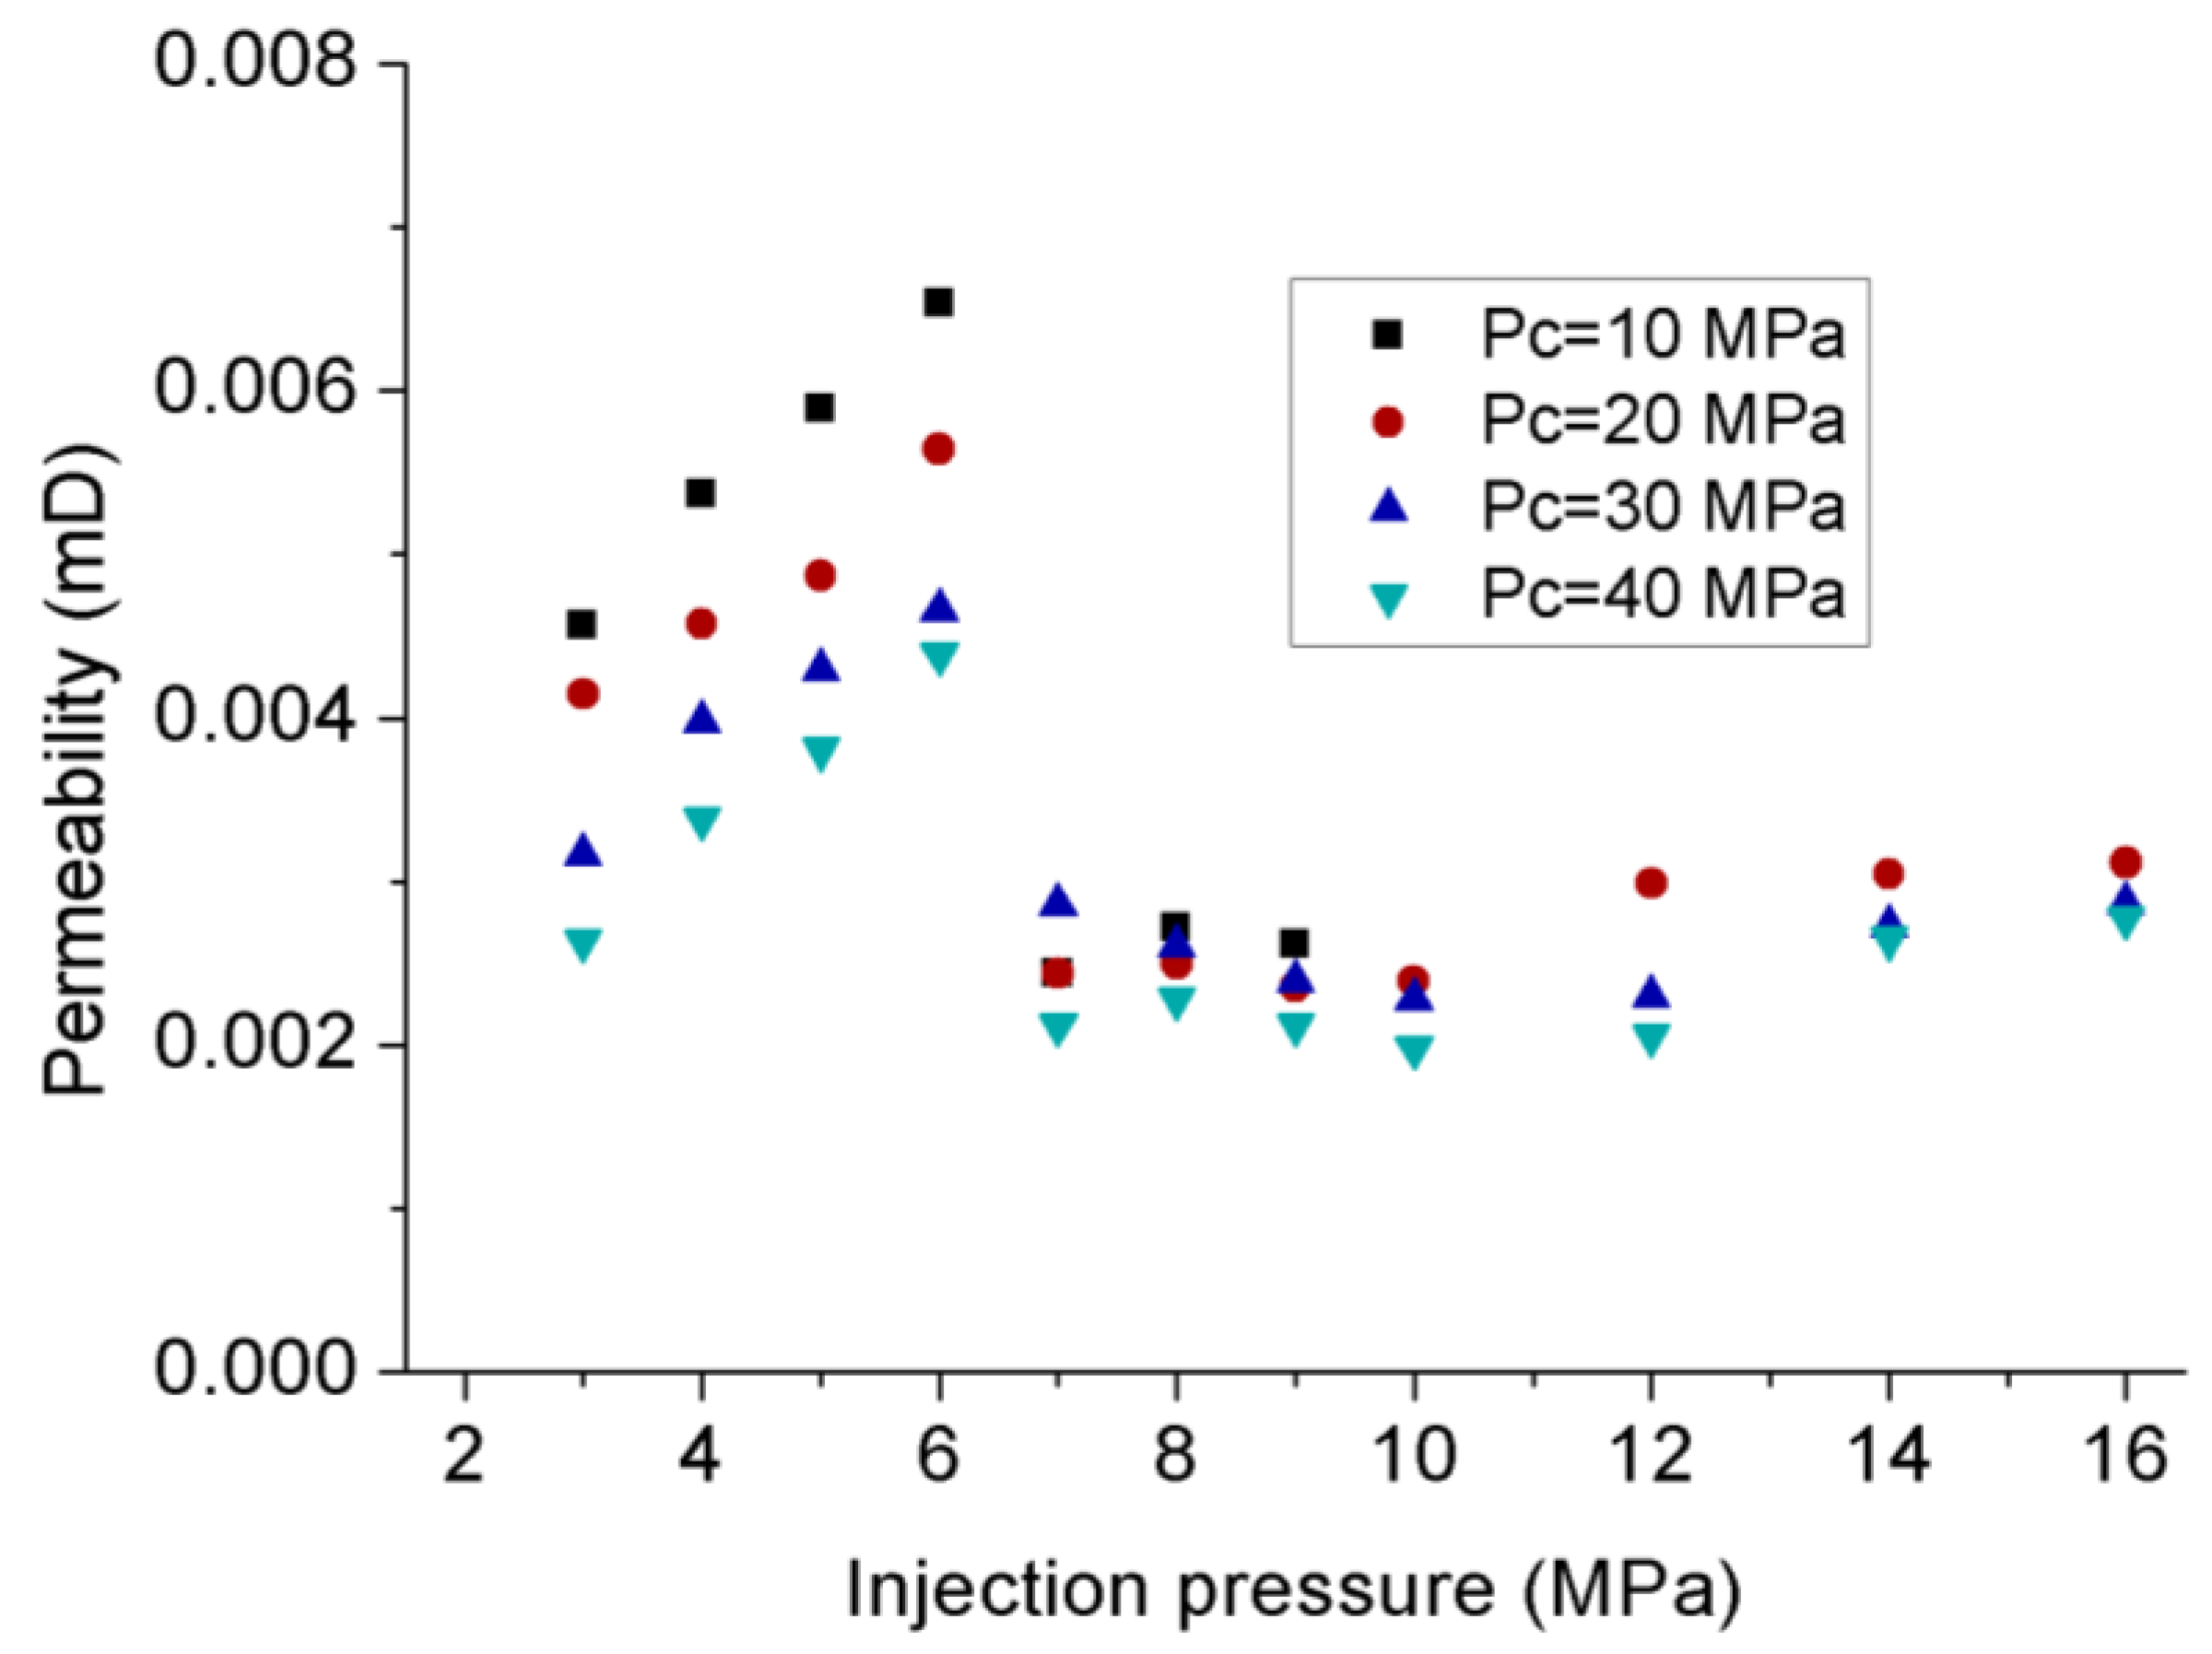
3.1. Permeability Behavior of CO2 under Steady-State Conditions

CO2 was first injected into the same siltstone sample at steady-state conditions under four different confining pressures (see Table 1), and the corresponding downstream flow rate was observed and recorded over time. The flow rate development under 20 MPa confinement is shown in Figure 6 and Figure 7. When the injection pressure is not higher than 9 MPa, the downstream CO2 flow rate gradually reaches a steady state at each injection pressure after around 20 min of injection (see Figure 6). However, when the injection pressure goes beyond 9 MPa, although the flow rate increases with increasing injection pressure, obtaining a steady state flow rate condition under each injection pressure condition was quite difficult due to the highly unsteady flow (see Figure 7). At each unsteady downstream flow behavior step (relevant to each injection pressure after 9 MPa), the flow rate first increased rapidly followed by a slow reduction, although confining and injection pressures remained steady during each injection process and the possibility of leak-off was excluded. This is possibly because some physical process occurs in the sample with existing high flow rates under greater injection pressures, and fine particle migration is one of the suspected causes. Fine particle migration with the high pressure-driven great advective flux in such situations may be responsible for this phenomenon, and a small quantity of fine particles was seen on the filter paper at the downstream after the permeability tests. The mineral particle distribution is shown in a SEM image and the differentiation of particle radiuses is marked (see Figure 8). The size of the kaolinite particles (less than 2 μm in diameter) is much smaller than that of the quartz particles (less than 62.5 μm in diameter), and kaolinite particles therefore normally exist between quartz particles and have a high tendency to occupy the flow path, showing the negative influence of clay content on flow ability or permeability of sample [31,40]. When the injection pressure is higher than 9 MPa, higher advective flux along the rock matrix induces a higher pushing force on some free or loosely-bonded fine particles, extracting them from the rock matrix and mixing them into the fluid flow. While blockage of the available narrow pore throats in the rock sample through fine particle accumulation can cause a significant reduction in flow ability through the rock matrix, once the accumulated pressure at the upstream side reaches a certain value, these blockages can be pushed out by the associated great pushing force, opening the pore throats. This might cause the observed sudden flow rate increments (see Figure 9). Another reason for this phenomenon maybe the presence of small drikold particles near the downstream due to the sharply drop of temperature of CO2 flow, which will be discussed in detail in Section 3.2.
However, for these complex downstream flow behaviors obtained under high CO2 injection pressure, the average of peak points was taken as the steady-state downstream flow rate to calculate the permeability. These observed flow behaviors of CO2 under steady-state conditions exhibited similar patterns under the greater confinements of 30 and 40 MPa. The flow rates obtained under each test condition are shown in Figure 10, which confirms the linear variation between the flow rate and injection pressure. Therefore, Darcy’s equation was used to calculate the permeability for CO2 in dry siltstone under each test condition.
The permeability of the siltstone was then calculated using the traditional Darcy equation for gas (see Equation (4)), and Figure 11 shows the calculated permeability values for each injection pressure. When the whole sample is filled with gaseous CO2, the siltstone’s permeability increases with increasing injection pressure, regardless of confinement. For example, increasing the injection pressure from 3 to 6 MPa causes the sample permeability to increase from 0.00457 mD to 0.00654 mD and 0.00264 mD to 0.00439 mD at 10 MPa and 40 MPa confining pressures, respectively. This permeability increment may be related to the effective stress effect. Increasing the injection pressure expands the rock pore throats, even opening some new flow paths for CO2, which contributes to the reduced tortuosity for CO2 movement along the sample. This trend of permeability increase appears to change with the phase transition, which occurs in CO2 after around 6 MPa and continues, and permeability first slowly reduces with increasing injection pressure up to around 10 MPa (from 0.00654 mD to 0.00601 mD and 0.00439 mD to 0.00413 mD at 10 MPa and 40 MPa confining pressures). After that permeability is surprisingly subjected to a sudden increment.
This permeability reduction is due to fact that after 6 MPa at 22 °C, CO2 transfers into the liquid state from the gaseous state. As a result, the presence of liquid CO2 in the siltstone sample (at the upstream side) causes this opposite permeability trend. The lower permeability for liquid CO2 compared to gaseous CO2 in the siltstone sample is due to the slip-flow effect. The reduction of permeability for liquid CO2 compared with gaseous CO2 is related to the slip-flow effect, as gas molecules with higher compressibility and lower viscosity have greater potential to slip through narrow pore throats [36,41]. In addition, liquid CO2 with higher viscosity meets much higher resistance than gaseous CO2, and very tiny pore throats are impenetrable for liquid CO2. Although the permeability at higher injection pressures is much lower than that for the gaseous state, the leak-off rate may be much higher than that for gaseous CO2 because of its greater density. Importantly, this shows the calculation of permeability based on Darcy’s equation for gas is not accurate for the prediction of the permeability of samples under these two-phase CO2 conditions (liquid at upstream and gas at downstream). Further, there is a sharp rise in viscosity when the CO2 transfers into the liquid state at 6 MPa from 18.19 µPa·s to 66.15 µPa·s, and the use of the traditional Darcy’s equation with mean viscosity in the gaseous state causes some errors, because the basic assumption of Darcy’s equation for gas, that viscosity is nearly independent on the pressure variation, is no longer applicable when both liquid and gas co-occur in the sample. This is further highlighted by the sudden permeability increment after 12 MPa, caused by the abrupt change of the mean viscosity after 12 MPa (see Figure 12), and it is likely that the greater portion of liquid CO2 in the sample at greater pressure significantly increases this error. This is confirmed by Table 2, which shows that when the injection pressure is greater than 6 MPa, liquid CO2 is present in the sample, and the proportion is around 25% of the whole sample at 7 MPa injection pressure and around 80% at 16 MPa injection pressure. This suggests that the higher the injection pressure, the greater the proportion of liquid CO2 in the sample for liquid CO2 injection.
This was then considered by recalculating the permeability for liquid CO2 injection (>6 MPa) using the proposed method (see Equation (6)), which separates the gaseous and liquid section along the tested sample, and the results are shown in Figure 13. This proposed method divides the liquid and gaseous states of CO2 in the sample to apply the corresponding Darcy equation for the gas and liquid portions, respectively. The newly-calculated permeability values corresponding to liquid CO2 injections are much lower than those for the gaseous CO2 section (see Figure 13). For example, when the injection pressure increases from 6 MPa to 7 MPa, the permeability drops sharply from 0.00564 mD to 0.00244 mD at a confinement of 20 MPa, and the sudden permeability reductions are around 63%, 57%, 39% and 52% under 10, 20, 30 and 40 MPa confinements, respectively. For the liquid CO2, although there is a little fluctuation in permeability with injection pressure, its permeability increases slightly with the increase of injection pressure, due to the decrease of effective stress. Overall, the range of variation of apparent permeability for liquid CO2 is much smaller than that for gaseous CO2.
In addition to the injection pressure, reservoir depth or confining pressure also significantly affects the flow behavior in any reservoir [42,43], because increased confining pressure causes shrinkage in the pore structure in the formation rock matrix. This was investigated for the tested siltstone and Figure 14 shows the observed axial deformation variation of the sample with increasing applied confining pressure. There is a non-linear relationship between axial deformation and confining pressure, and the increasing rate of axial deformation decreases with increasing confining pressure (see Figure 14), because most of the shrinkable pores have already shrunk with the increase of confinement. This shrunken pore structure under high confining pressures results in the reduction of flow paths for CO2 movement, and the rock permeability therefore decreases with the increasing confinement. This is confirmed by Figure 15, which shows that CO2 downstream flow rates decrease with increasing confining pressure.

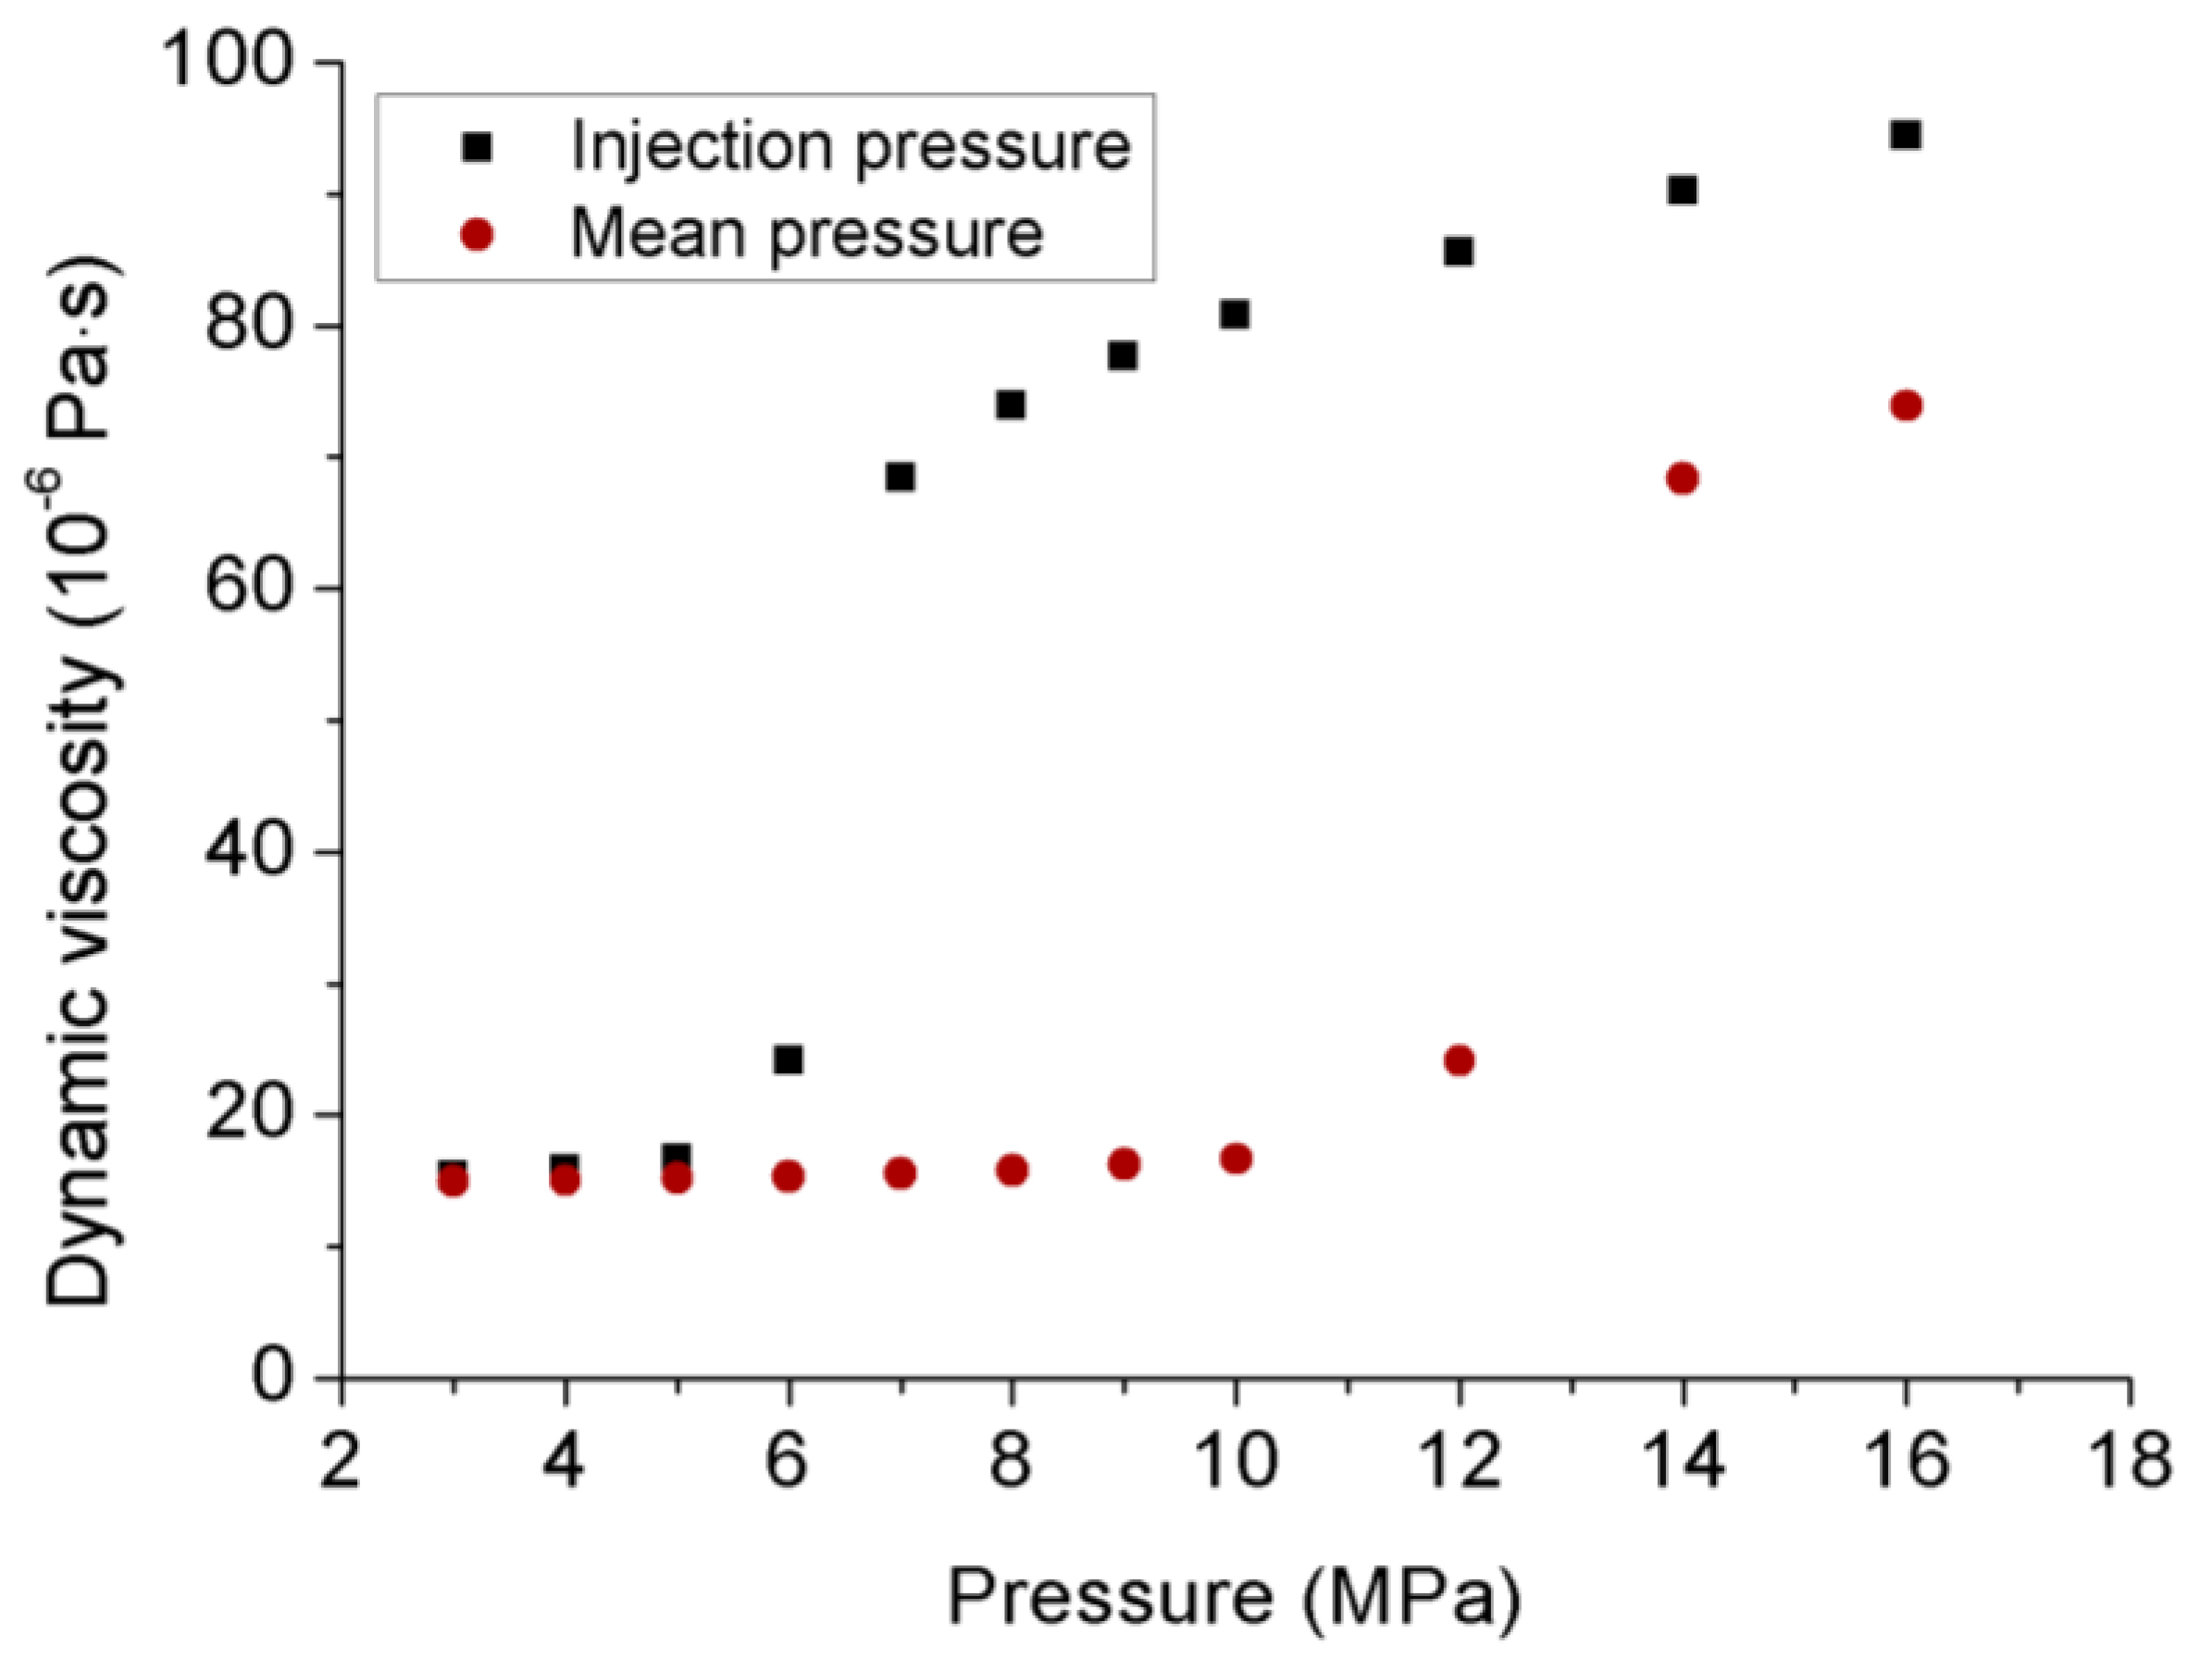
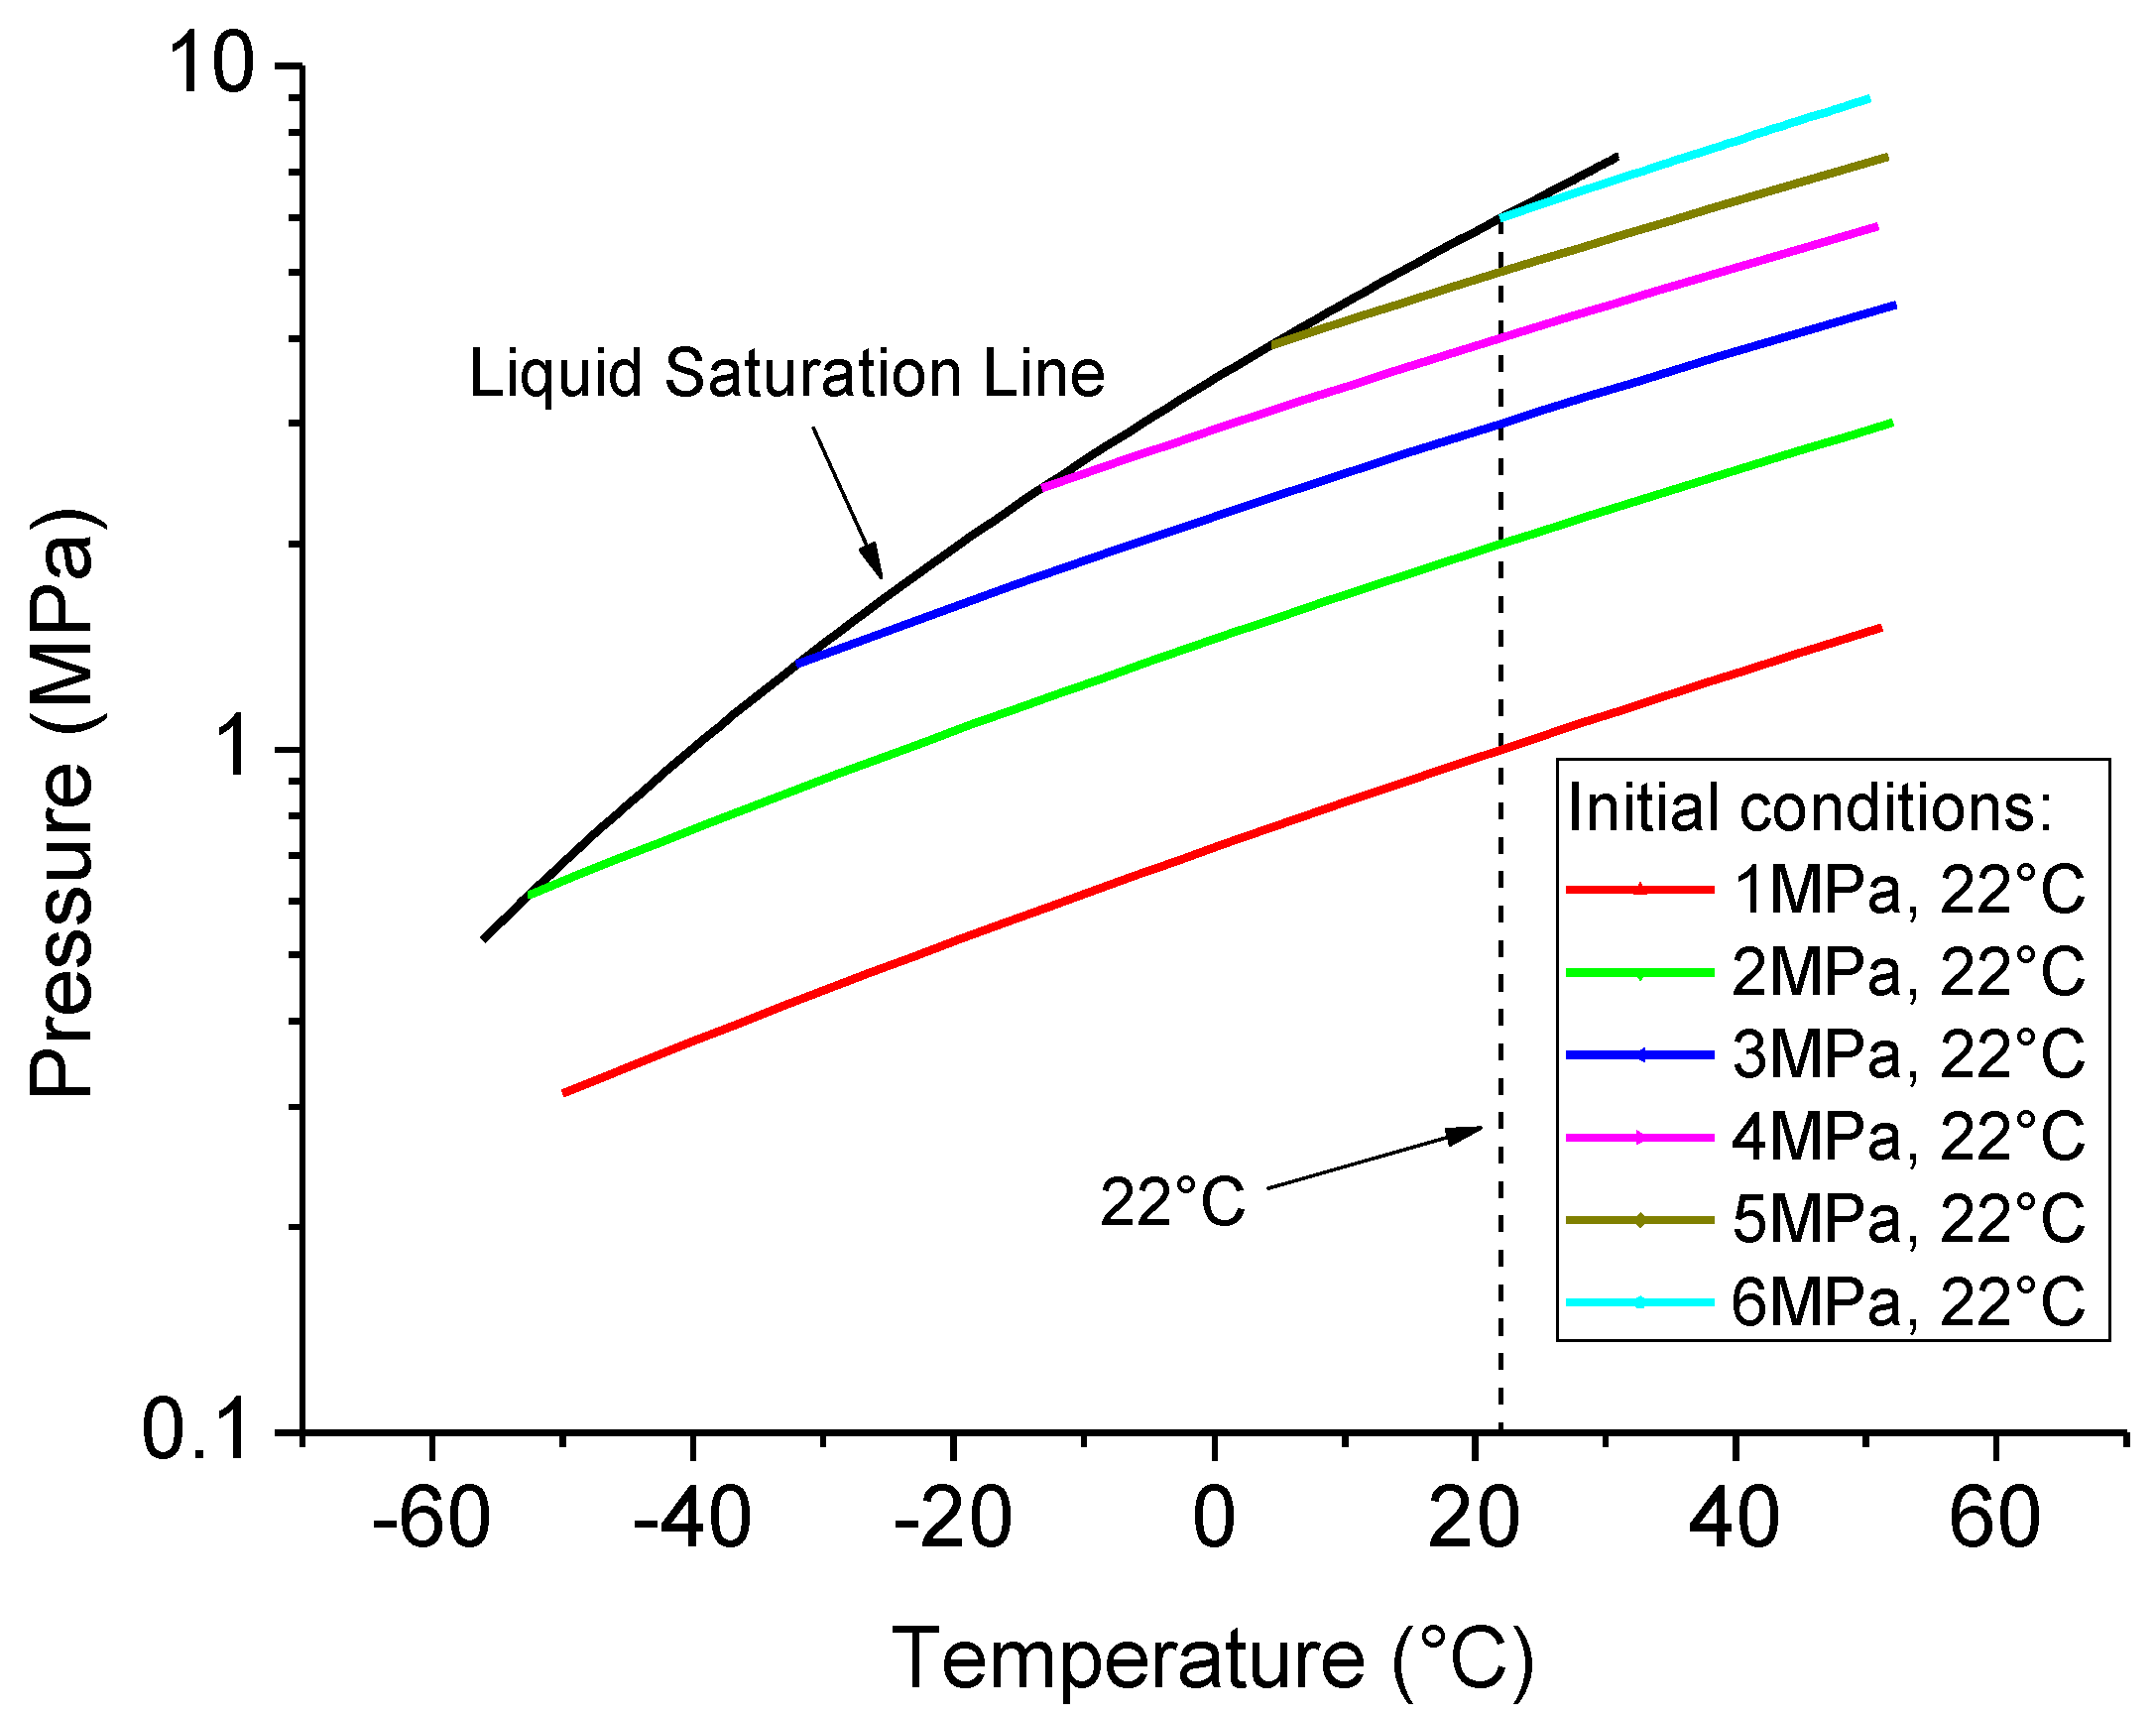
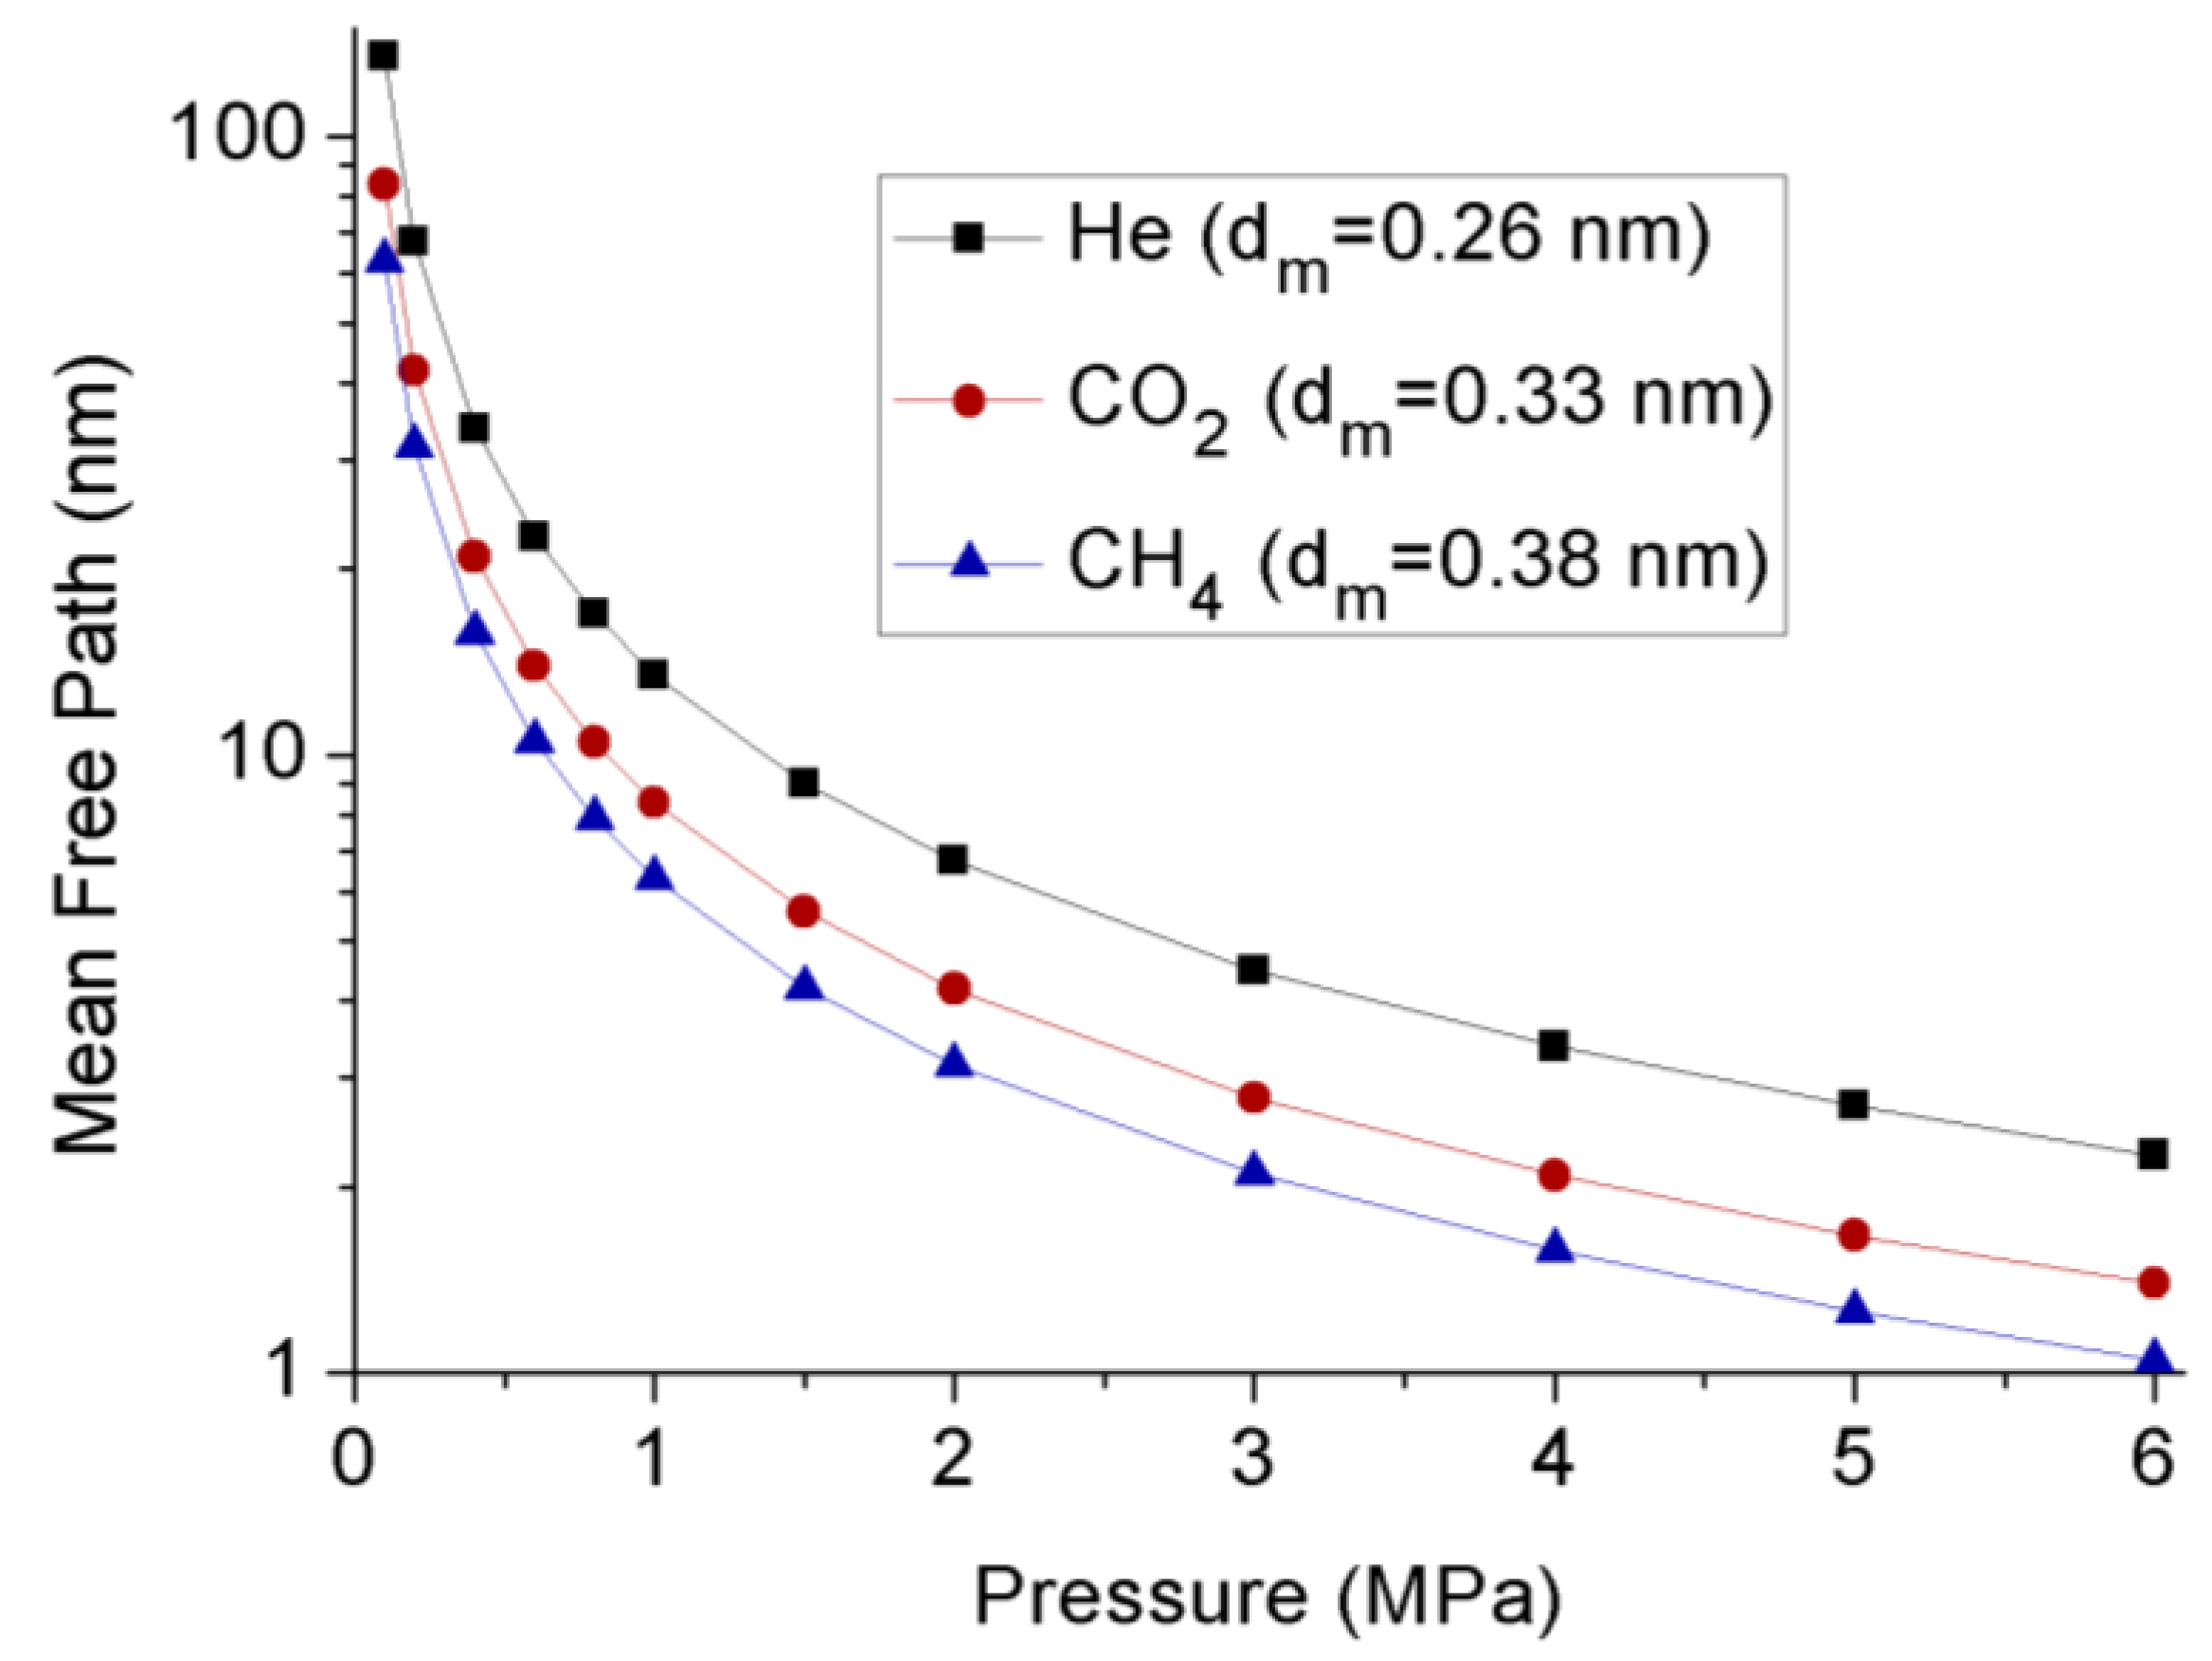
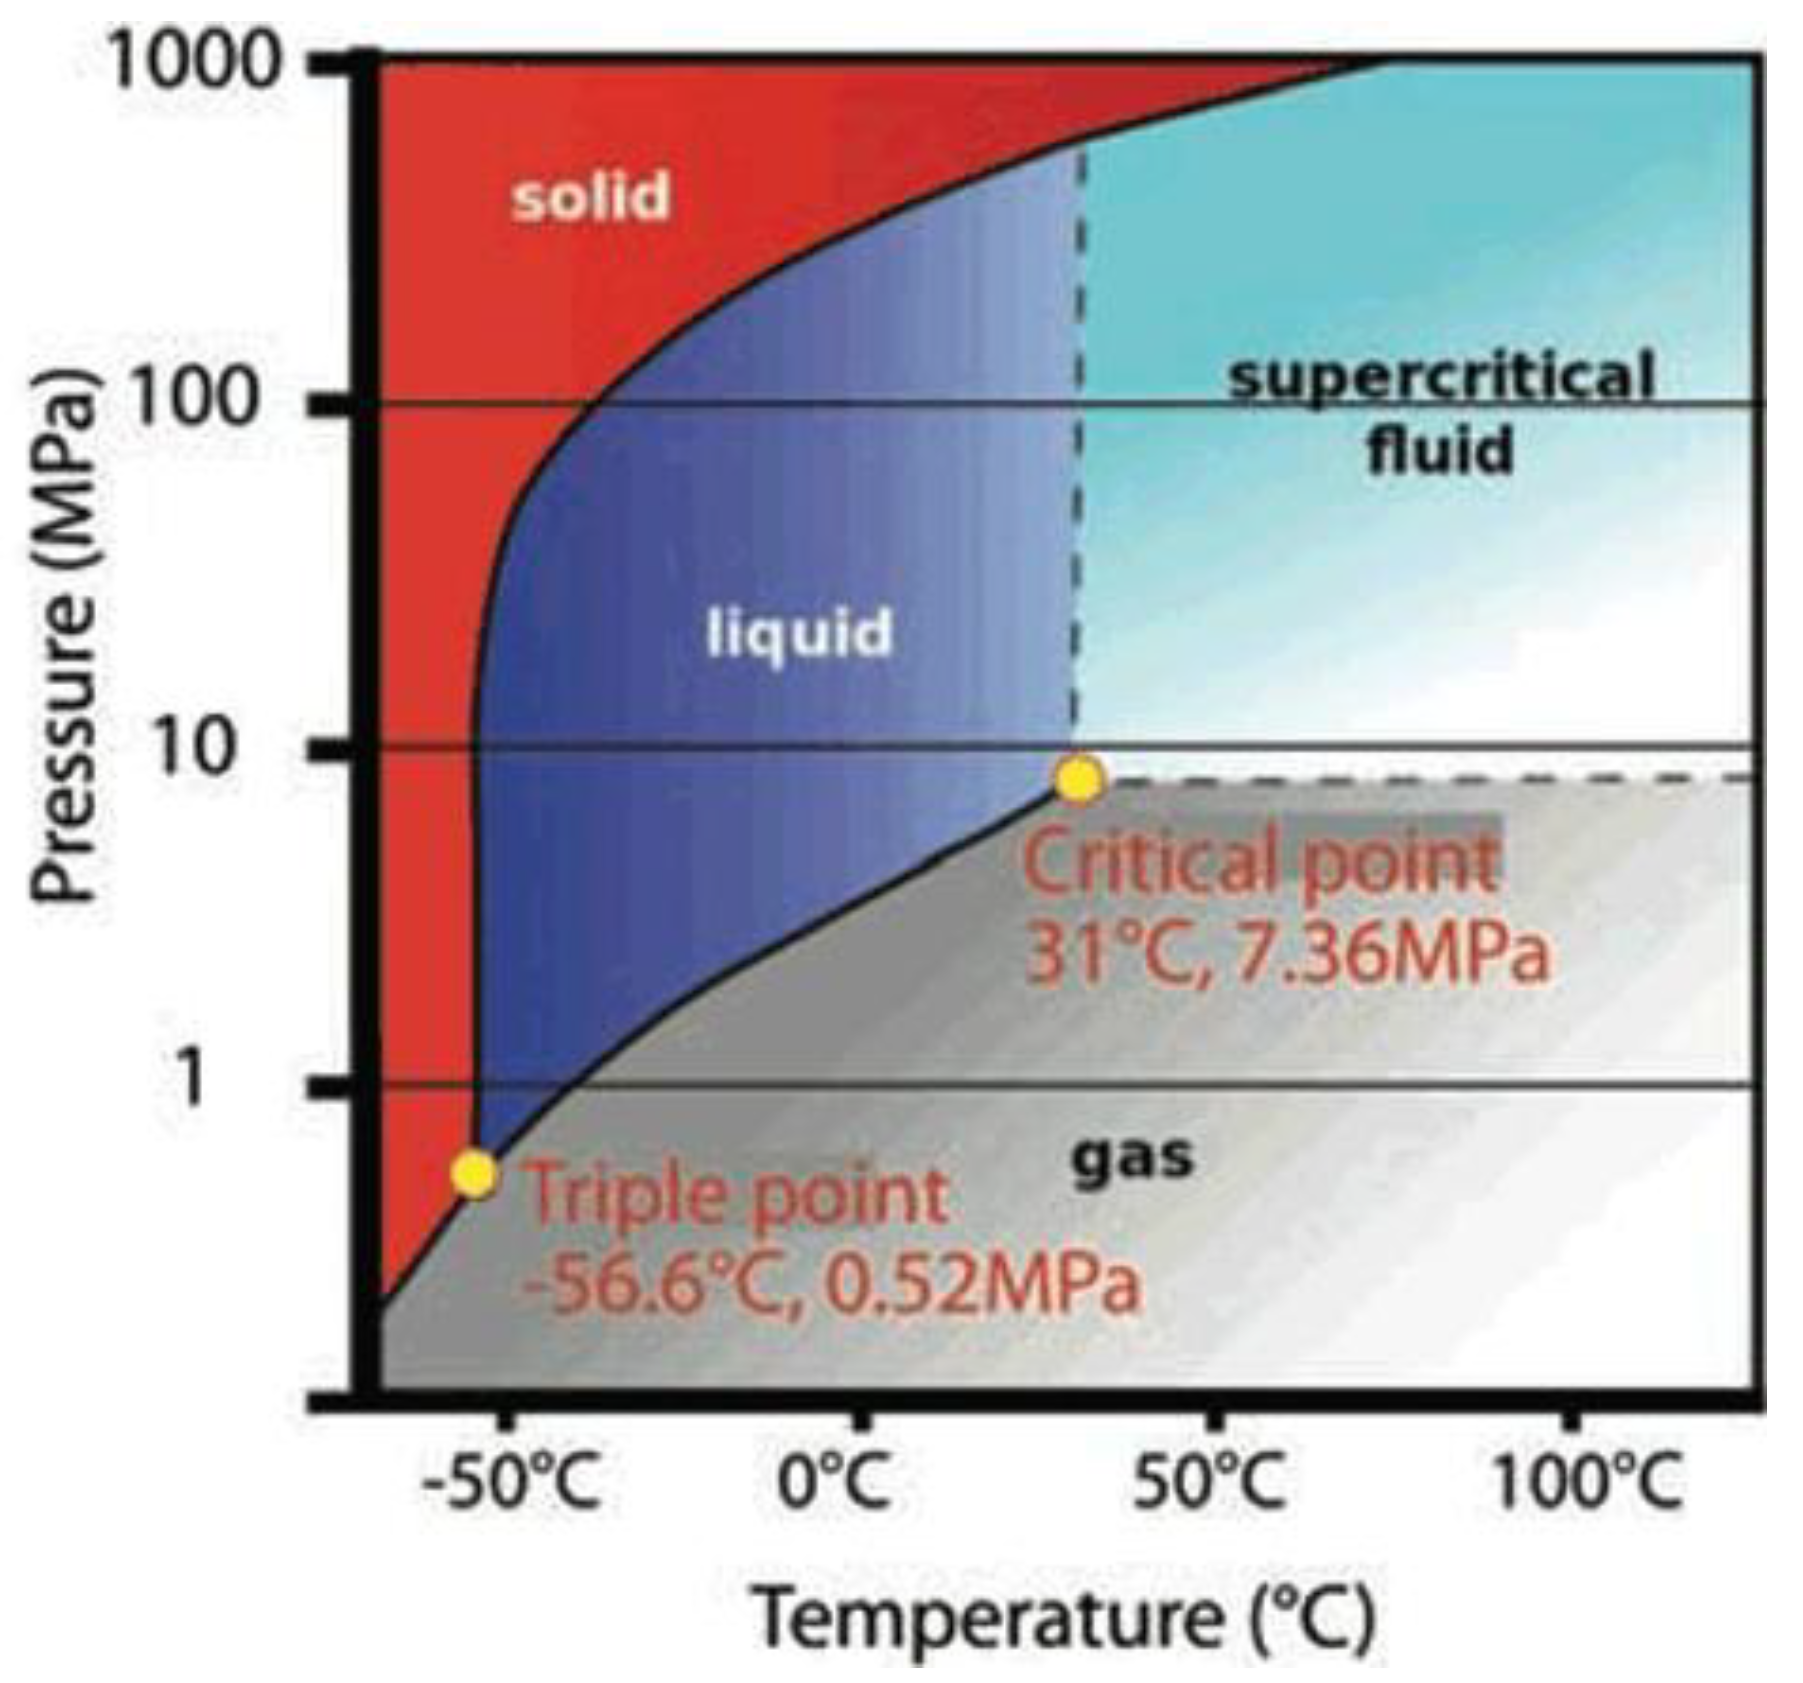
3.2. Considering Thermodynamic Properties Variation of CO2 Flow

The results analysis and discussion in Section 3.1 are premised on the condition that the temperature of both sample and flow fluid was kept at room temperature invariably. While in reality, although the temperature recorded by the thermometer in the tri-axial cell kept constant, the temperature variation inside the sample during CO2 expansion with the decrease of pressure along sample cannot be ignored. According to the first law of thermodynamics [44] (see Equation (9)), the volume work done by gas expansion is compensated by its internal energy and the heat transferred into the system. The heat exchange, due to the temperature difference between CO2 flow and sample matrix, can reduce the rate of CO2 internal energy decline. However, considering that much energy consumed for the fast CO2 volume expansion and the low thermal conductivity of siltstone sample may fail to transmit enough energy to maintain the temperature of CO2 flow at room temperature along the sample, the premise condition for permeability calculation under steady-state conditions that CO2 flow along the sample maintained at room temperature is therefore questionable.
d U + δ W = δ Q
where, d U is the change in the internal energy of the system, δ W is work done by the system and δ Q the heat transferred to the system.
The temperature variation of CO2 flow is closely related to its flow rate, thermal conductivity of rock, CO2 phase transition and so on. Higher flow rate and lower thermal conductivity of siltstone can promote temperature variation of CO2 flow. In particular when liquid CO2 evaporates into gaseous CO2, the heat of vaporization can greatly decrease the temperature of both liquid and gaseous CO2, because much energy is needed to do the volume work during the rapid volume expansion process. The standard enthalpy change of vaporization at liquefaction point (22 °C and 6 MPa) is 6.27 kJ/mol, and it is much higher than the heat capacity of gaseous and liquid CO2 which are around 36.6 J/mol·°C and 133.8 J/mol·°C, respectively. In other words, if the heat exchange between the CO2 flow and rock matrix was not considered and CO2 flow was in an adiabatic condition ( δ Q = 0), 6.27 kJ is needed to evaporate each mole of CO2, which can decrease the temperature of gaseous and liquid CO2 by 171.3 °C and 46.9 °C, respectively. The standard enthalpy change of vaporization can increase to 12.22 kJ/mol at −20 °C and 2 MPa, which can absorb more heat from the surroundings. The evaporation of liquid CO2 can greatly decrease the temperature of adjacent liquid CO2 and evaporated CO2, and even solid carbon dioxide can be formed at the liquefied interface [45]. According to Figure 16, with the decrease of temperature of liquid CO2, the pressure at evaporating point also decreases, which indicates the liquid CO2 length in sample is longer than predicted and the higher density of liquid CO2 can lead to much higher flow rate compared with that at constant room temperature.
Due to much energy being consumed for the vaporization process when the injection pressure is higher than 6 MPa, the temperature of gaseous CO2 at the liquefied interface will definitely be lower than the room temperature. Besides the temperature variation around the liquefied interface, the gaseous CO2 volume expansion with the decrease of pore pressure can also decrease its temperature. Although the rate of gas volume expansion is much lower than that in the evaporation process, higher gaseous CO2 flow rate can also absorb much energy. If there was no heat exchange between CO2 and the rock matrix in the ideal condition, the gaseous CO2 flow was assumed to be at adiabatic condition and its entropy kept constant. Considering that the temperature of gaseous CO2 at the liquefied interface was lower than room temperature and it is difficult to determine its accurate value when the injection pressure is higher than 6 MPa, only the injection cases, where the injection pressure is not higher than 6 MPa, are used to analyze the CO2 thermodynamic property evolution along the sample. According to Figure 17, with the decrease of pore pressure, the temperature decreases sharply. For example, when the injection pressure equals 5 MPa, its temperature can decrease to liquefaction point at −40.12 °C at 1 MPa. With the decrease of both temperature and pressure, the CO2 level tends to be close to the triple point (−56.6 °C and 0.52 MPa). With the further decrease of pore pressure down to the atmospheric pressure, much heat is obtained from the solidification process, and CO2 can be transferred into solid phase.
For the ideal steady-state tests, the flow rate and pore pressure along the sample tend to be equilibrate state and the temperature maintains a constant ( d U = 0). However, in the real experiments, the temperature variation can also lead to the adjustment of flow behavior. Therefore, the flow rate, pore pressure and fluid temperature gradually reach a steady state with time, where continuous and stable heat was transferred from outside to the CO2 flow through siltstone matrix, which indicates that the real condition is between two ideals conditions which are under constant temperature ( d U = 0) and under adiabatic conditions ( δ Q = 0), respectively. For the complex flow system, it is difficult to accurately assess the flow behavior evolution along the sample, because these variables are interdependent with each other. The heat exchange rate, which is dependent on the thermal conductivity of siltstone, is therefore crucial to the CO2 flow behavior. If the heat exchange rate is much lower than that needed for high CO2 flow rate under high injection pressure, the presence of drikold particles in sample matrix can greatly disturb the steady-state flow, because it can block the flow channels for gaseous CO2 flow. The forming and disappearing of drikold partials is more likely responsible for the unsteady flow rate at downstream at injection pressure higher than 9 MPa.
In conclusion, the temperature variation can influence the flow behavior to some extent. The longer length of liquid CO2 along the sample than expected can greatly increase the flow rate due to its much higher density than gaseous CO2. Furthermore, unlike the idea of gas at constant room temperature, where gas volume is inversely proportional to its pore pressure, there is a non-linear relationship between pore pressure and gas volume at adiabatic condition, which is presented by the polytropic process equation in Equation (10) [46]. The higher density along the sample than that predicted at room temperature can also lead to slightly higher flow rate at downstream. The temperature variation, due to the unique thermodynamic properties of CO2, therefore can result in the inaccuracy of permeability calculation under steady-state conditions, and it highlights the necessity of permeability calculation under transient conditions, where the thermodynamic heat exchange is negligible because of much lower pressure variation and flow rate.
P V γ = P 0 V 0 γ = C
where, P is the gas pressure, V is the gas volume, γ is the heat capacity ratio (approximately equals to 1.3 for CO2) and C is constant.

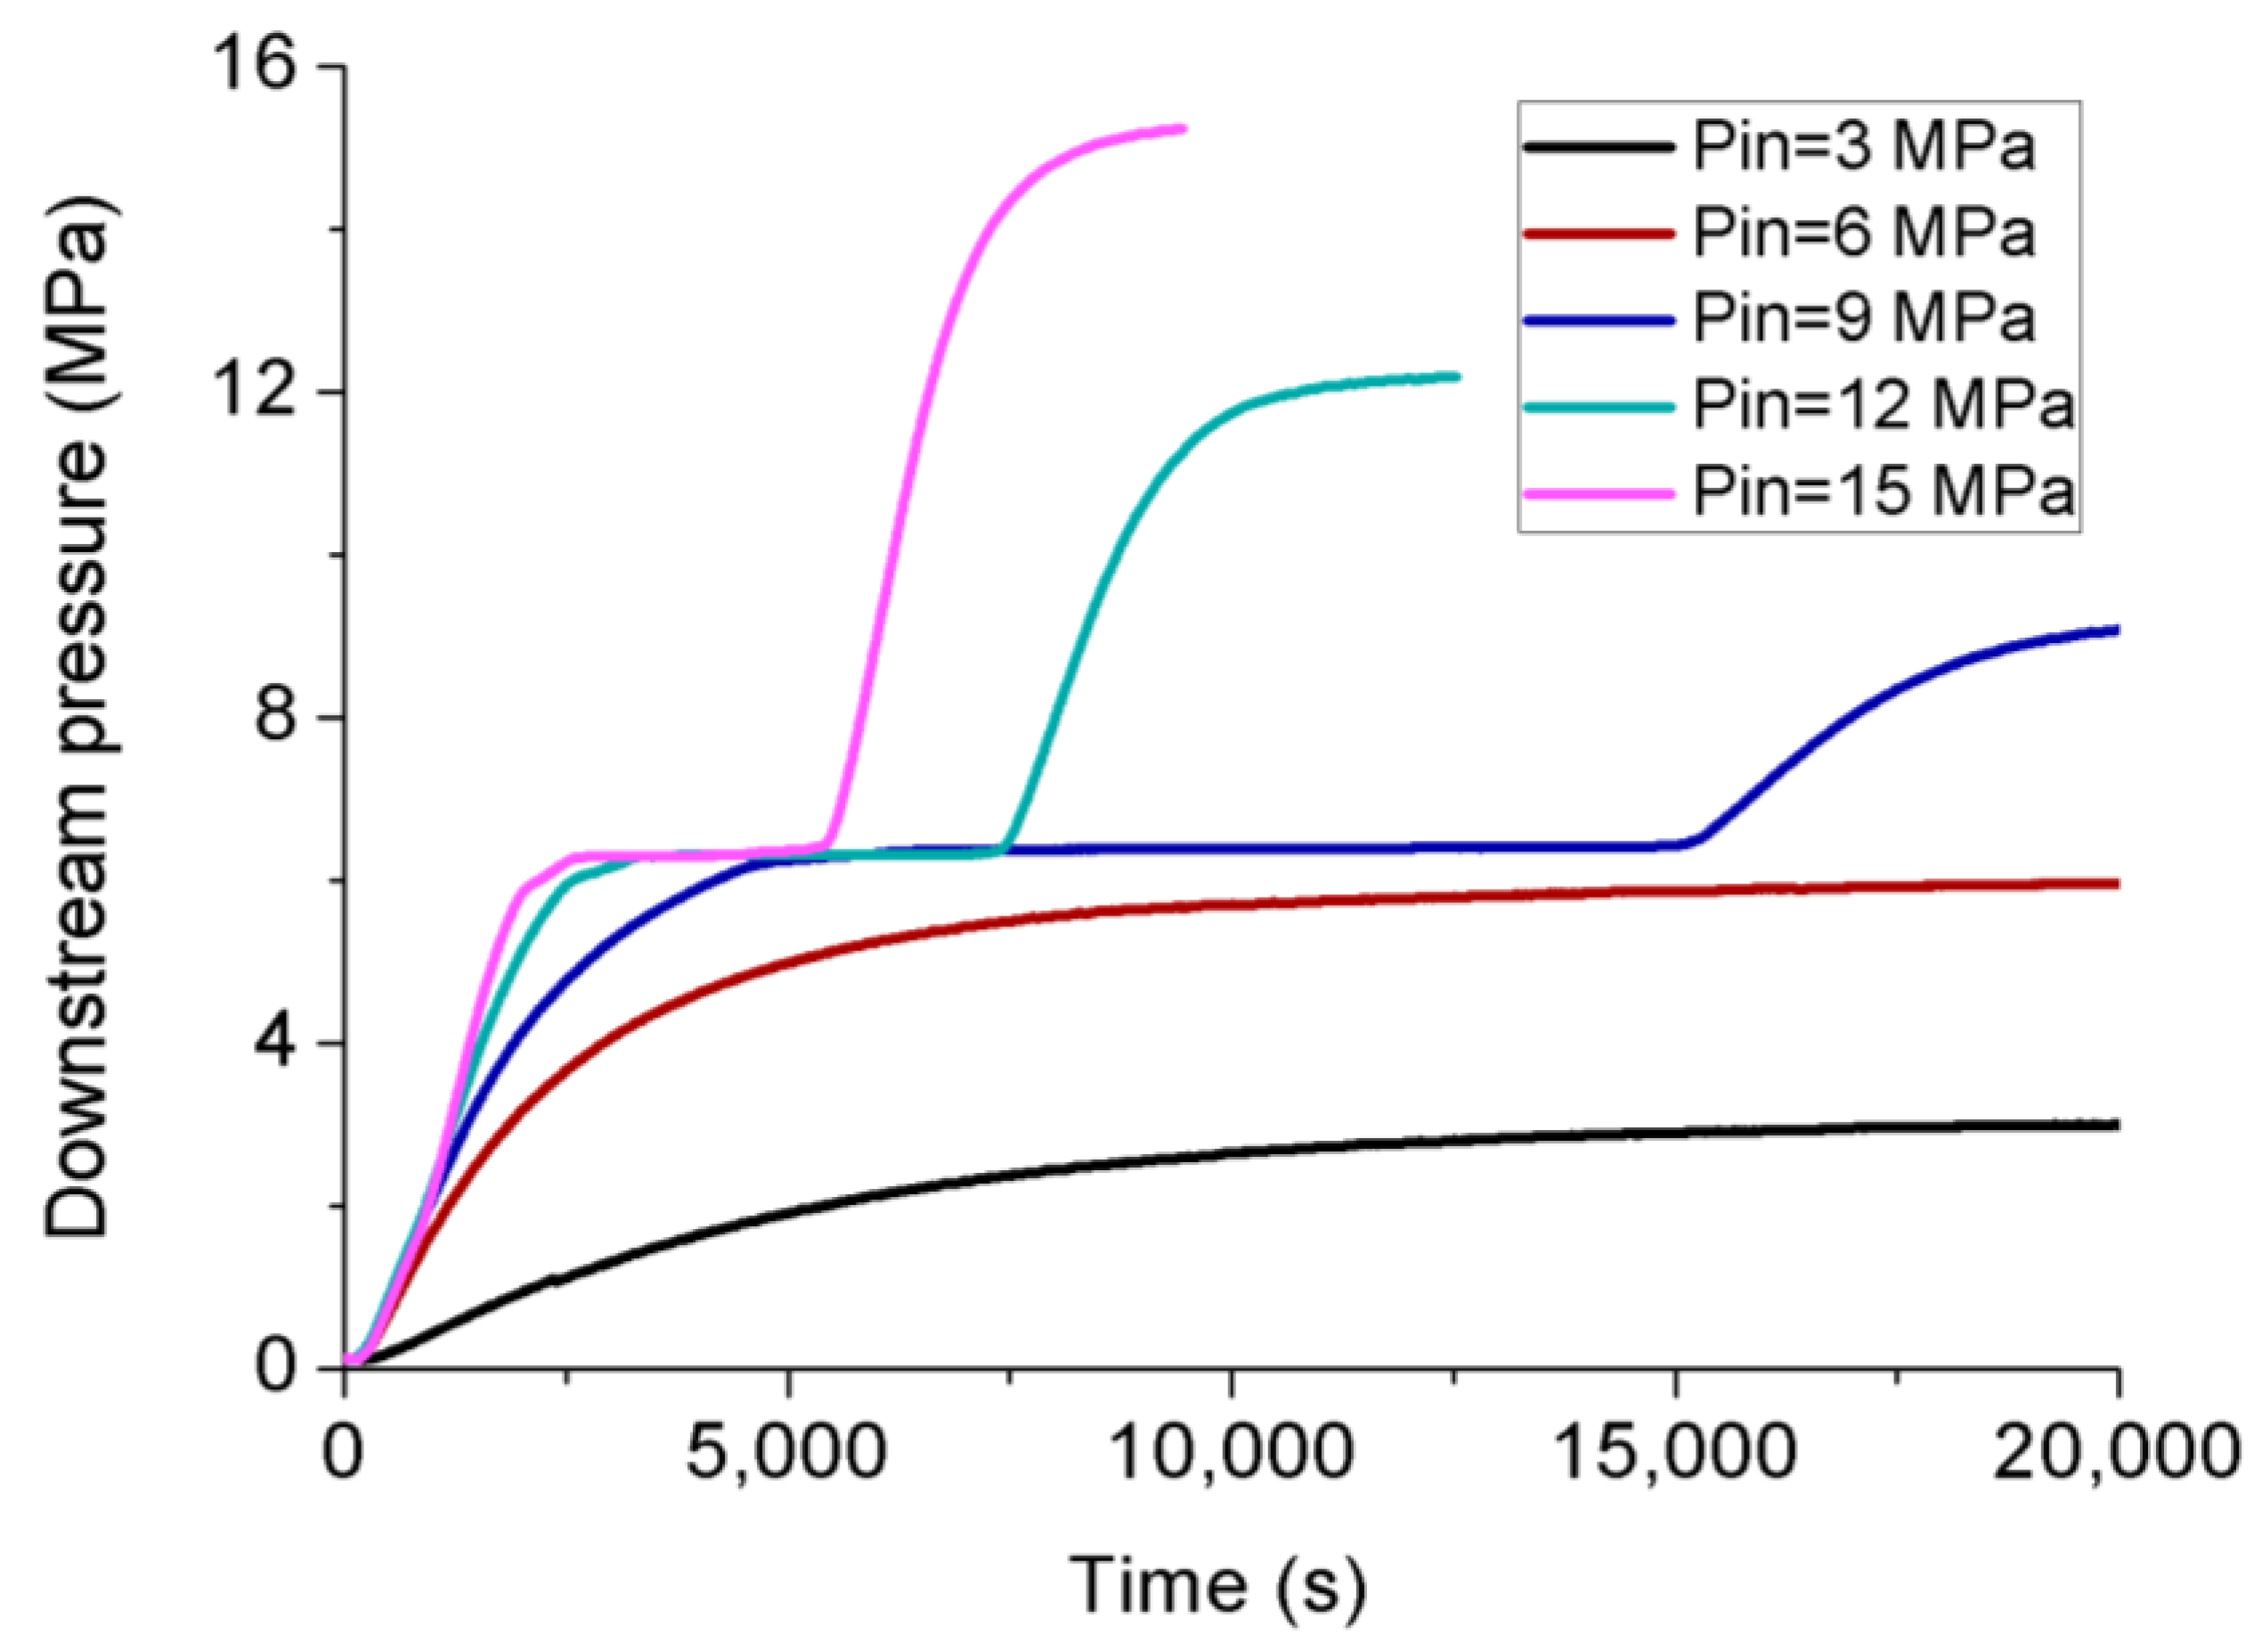
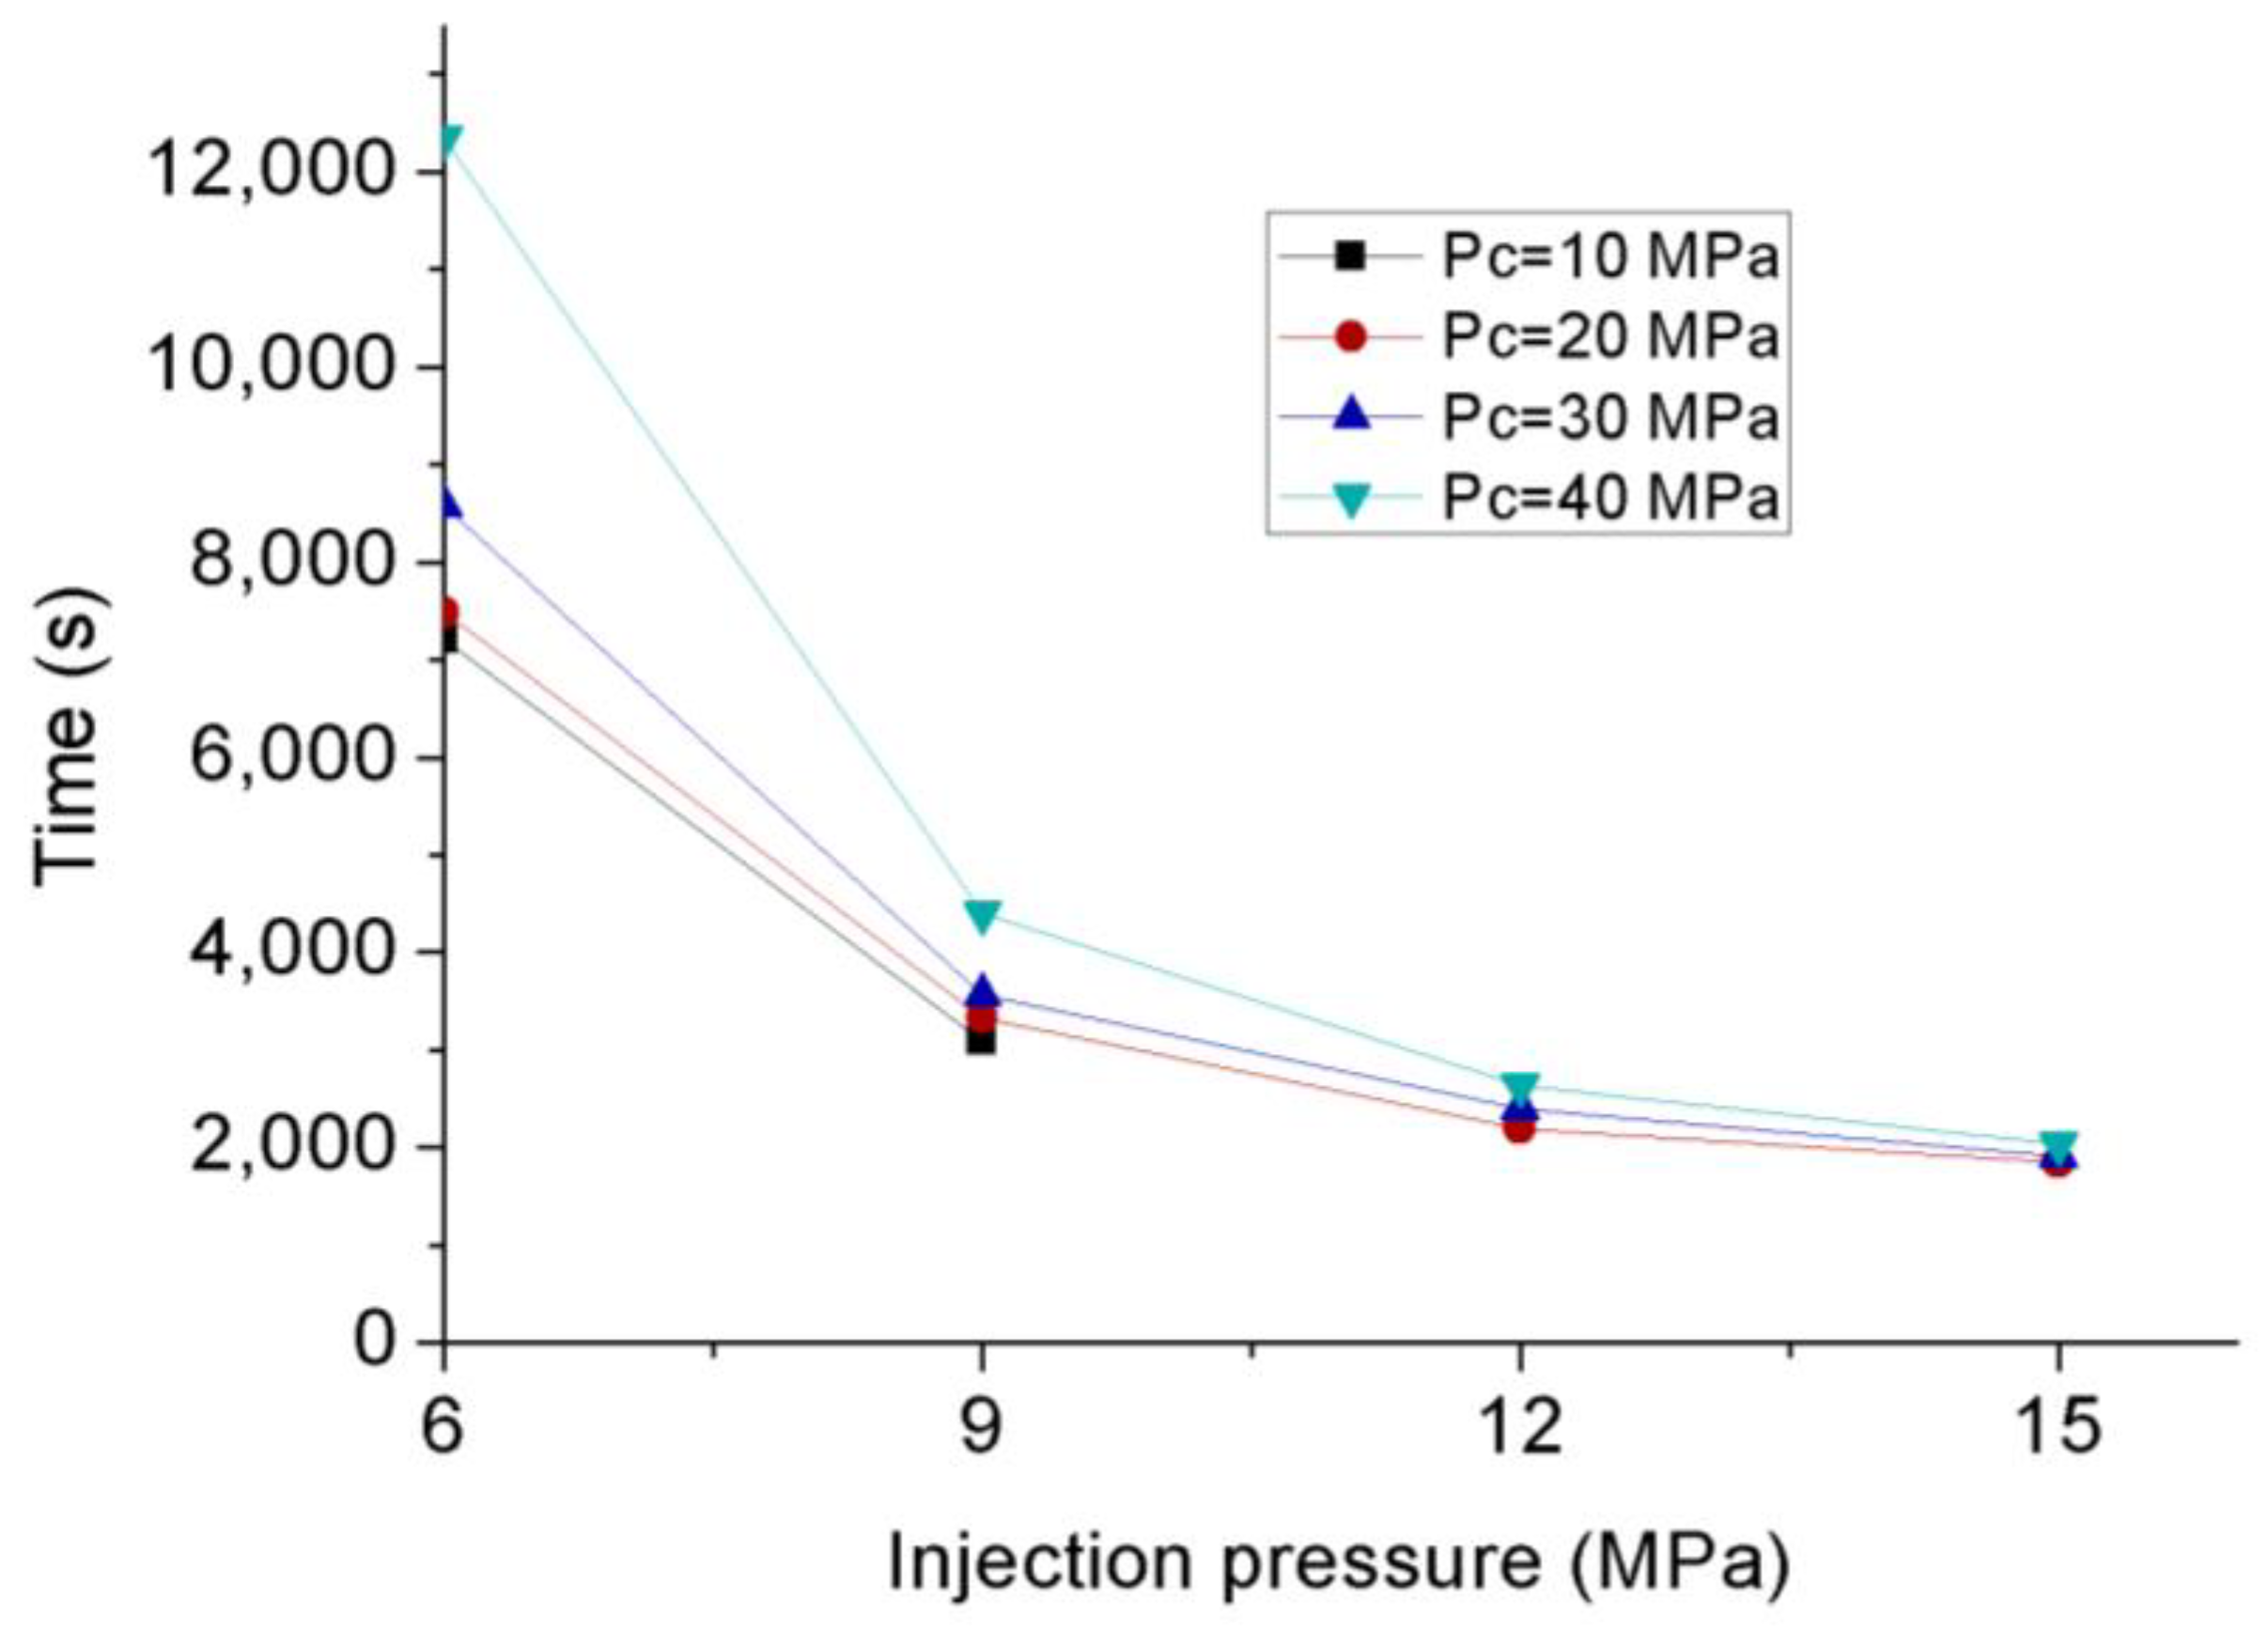
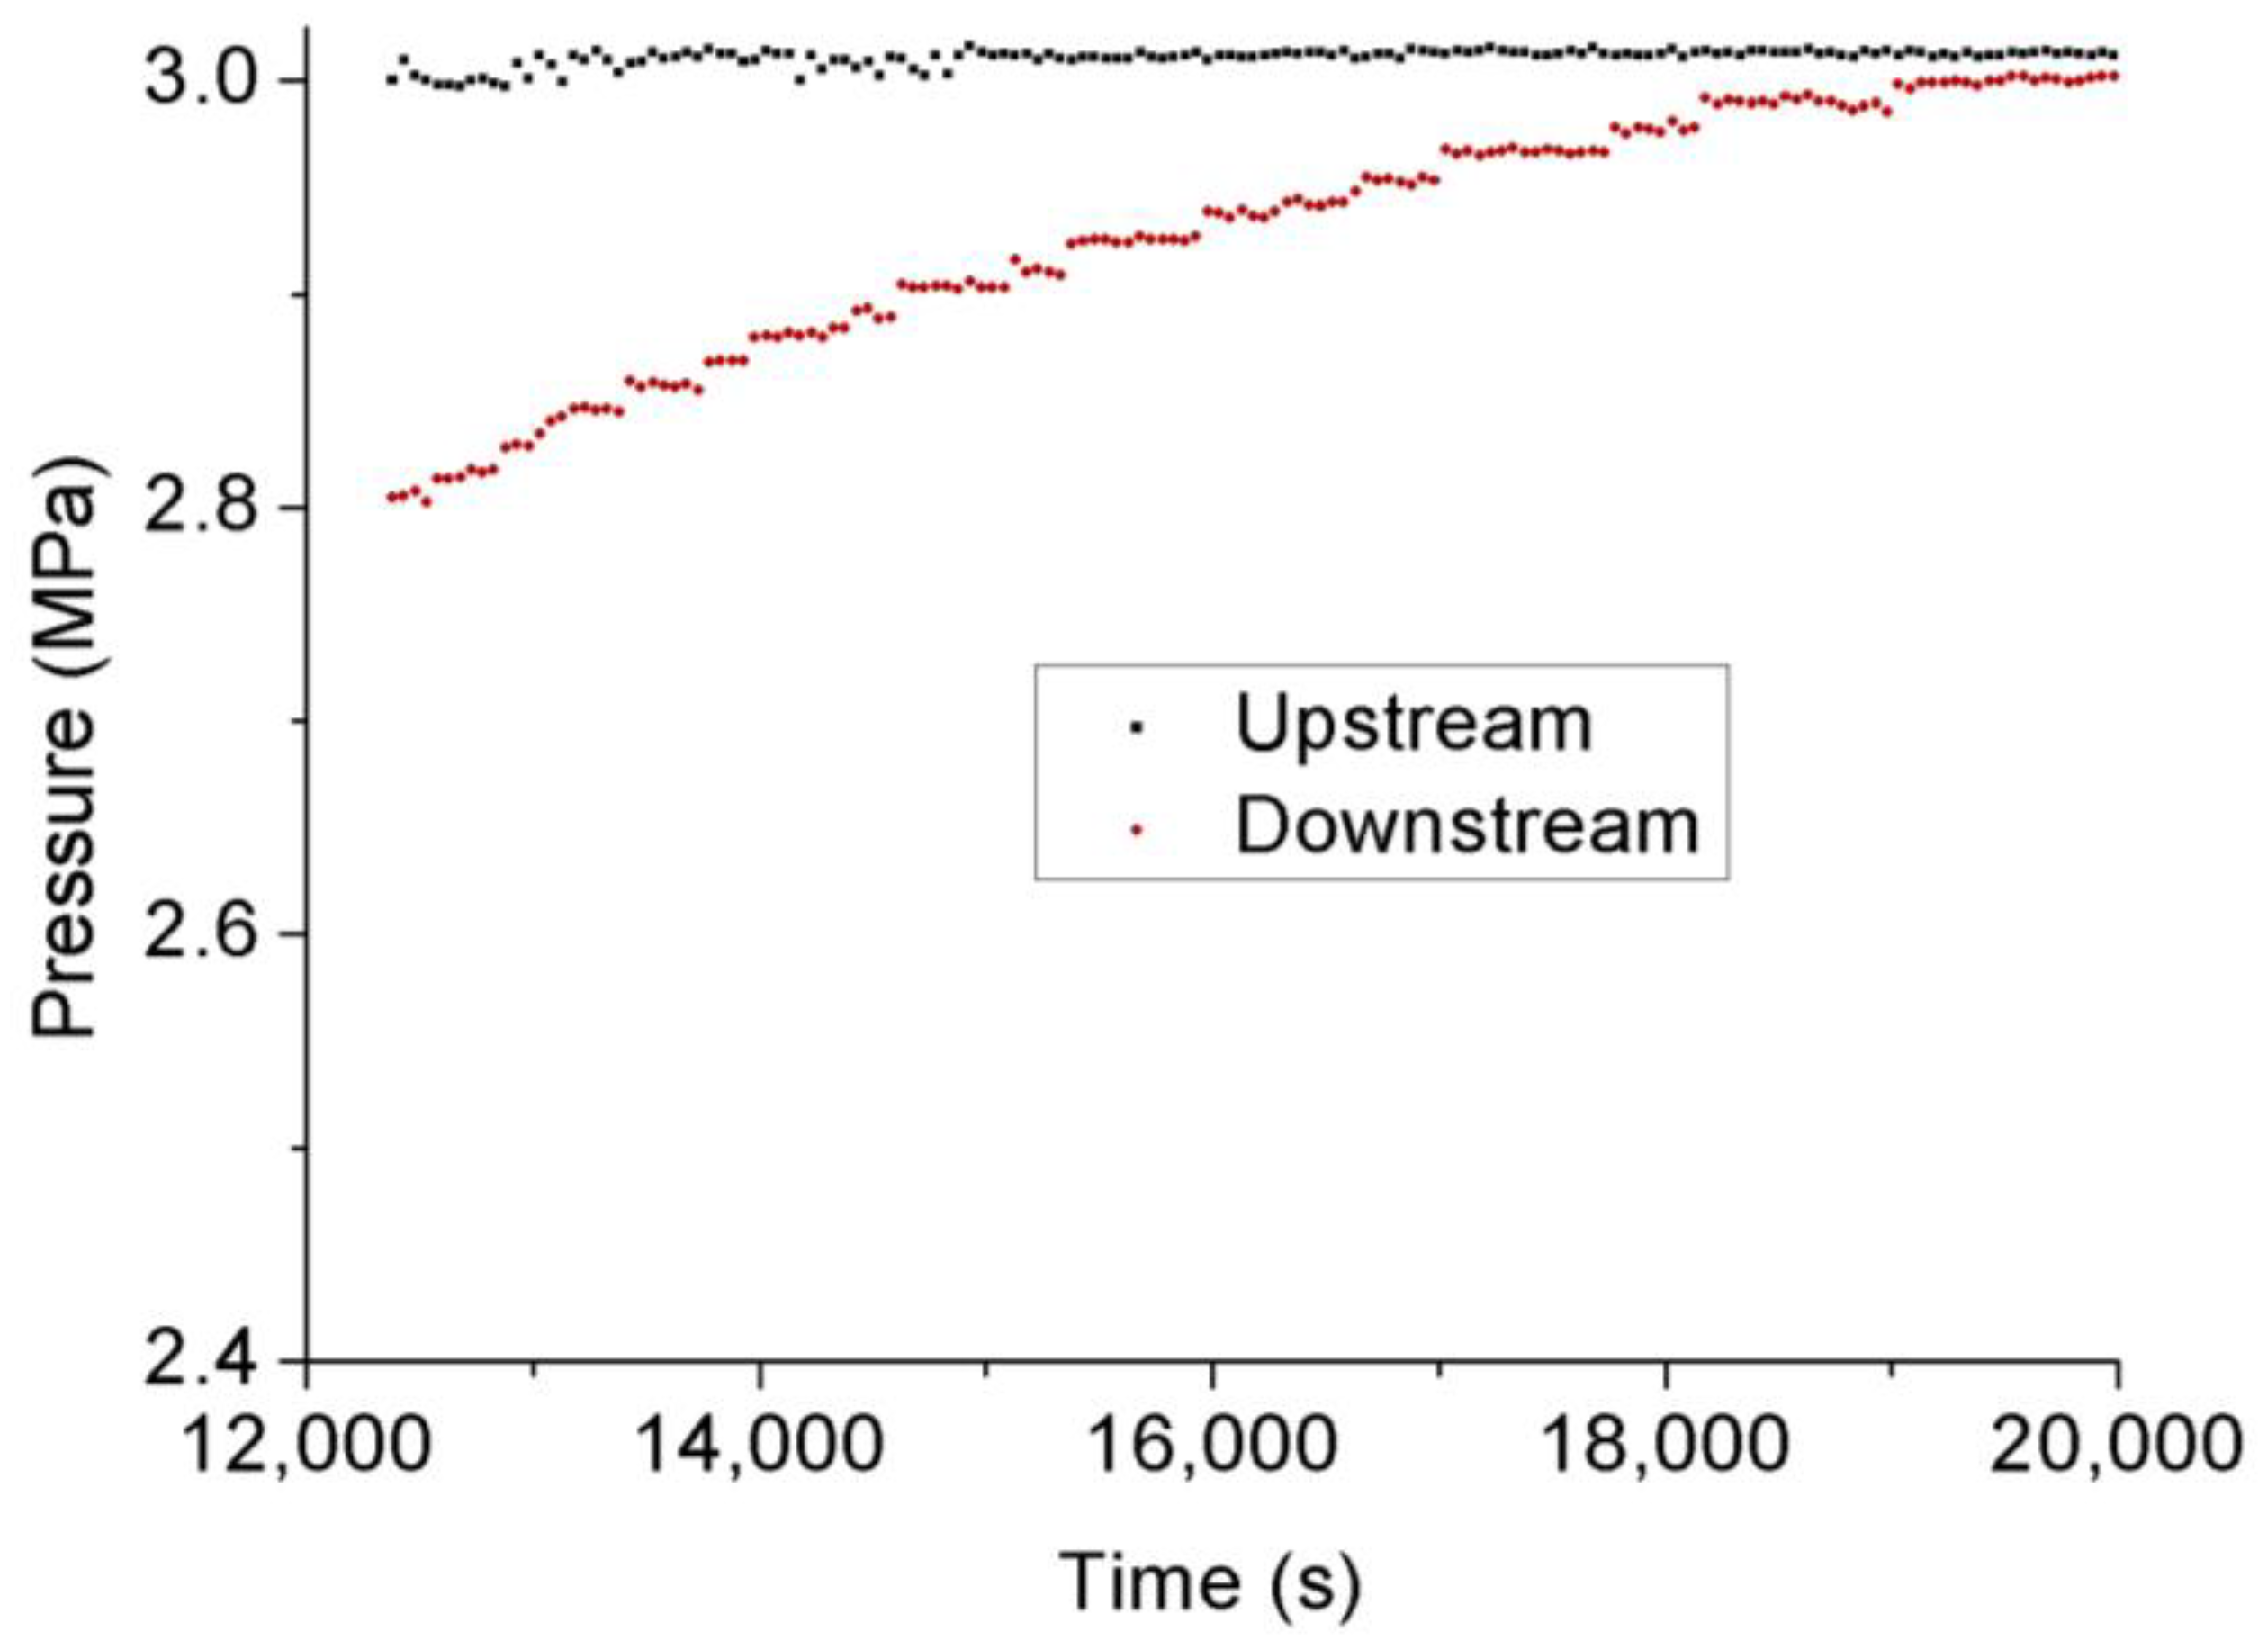
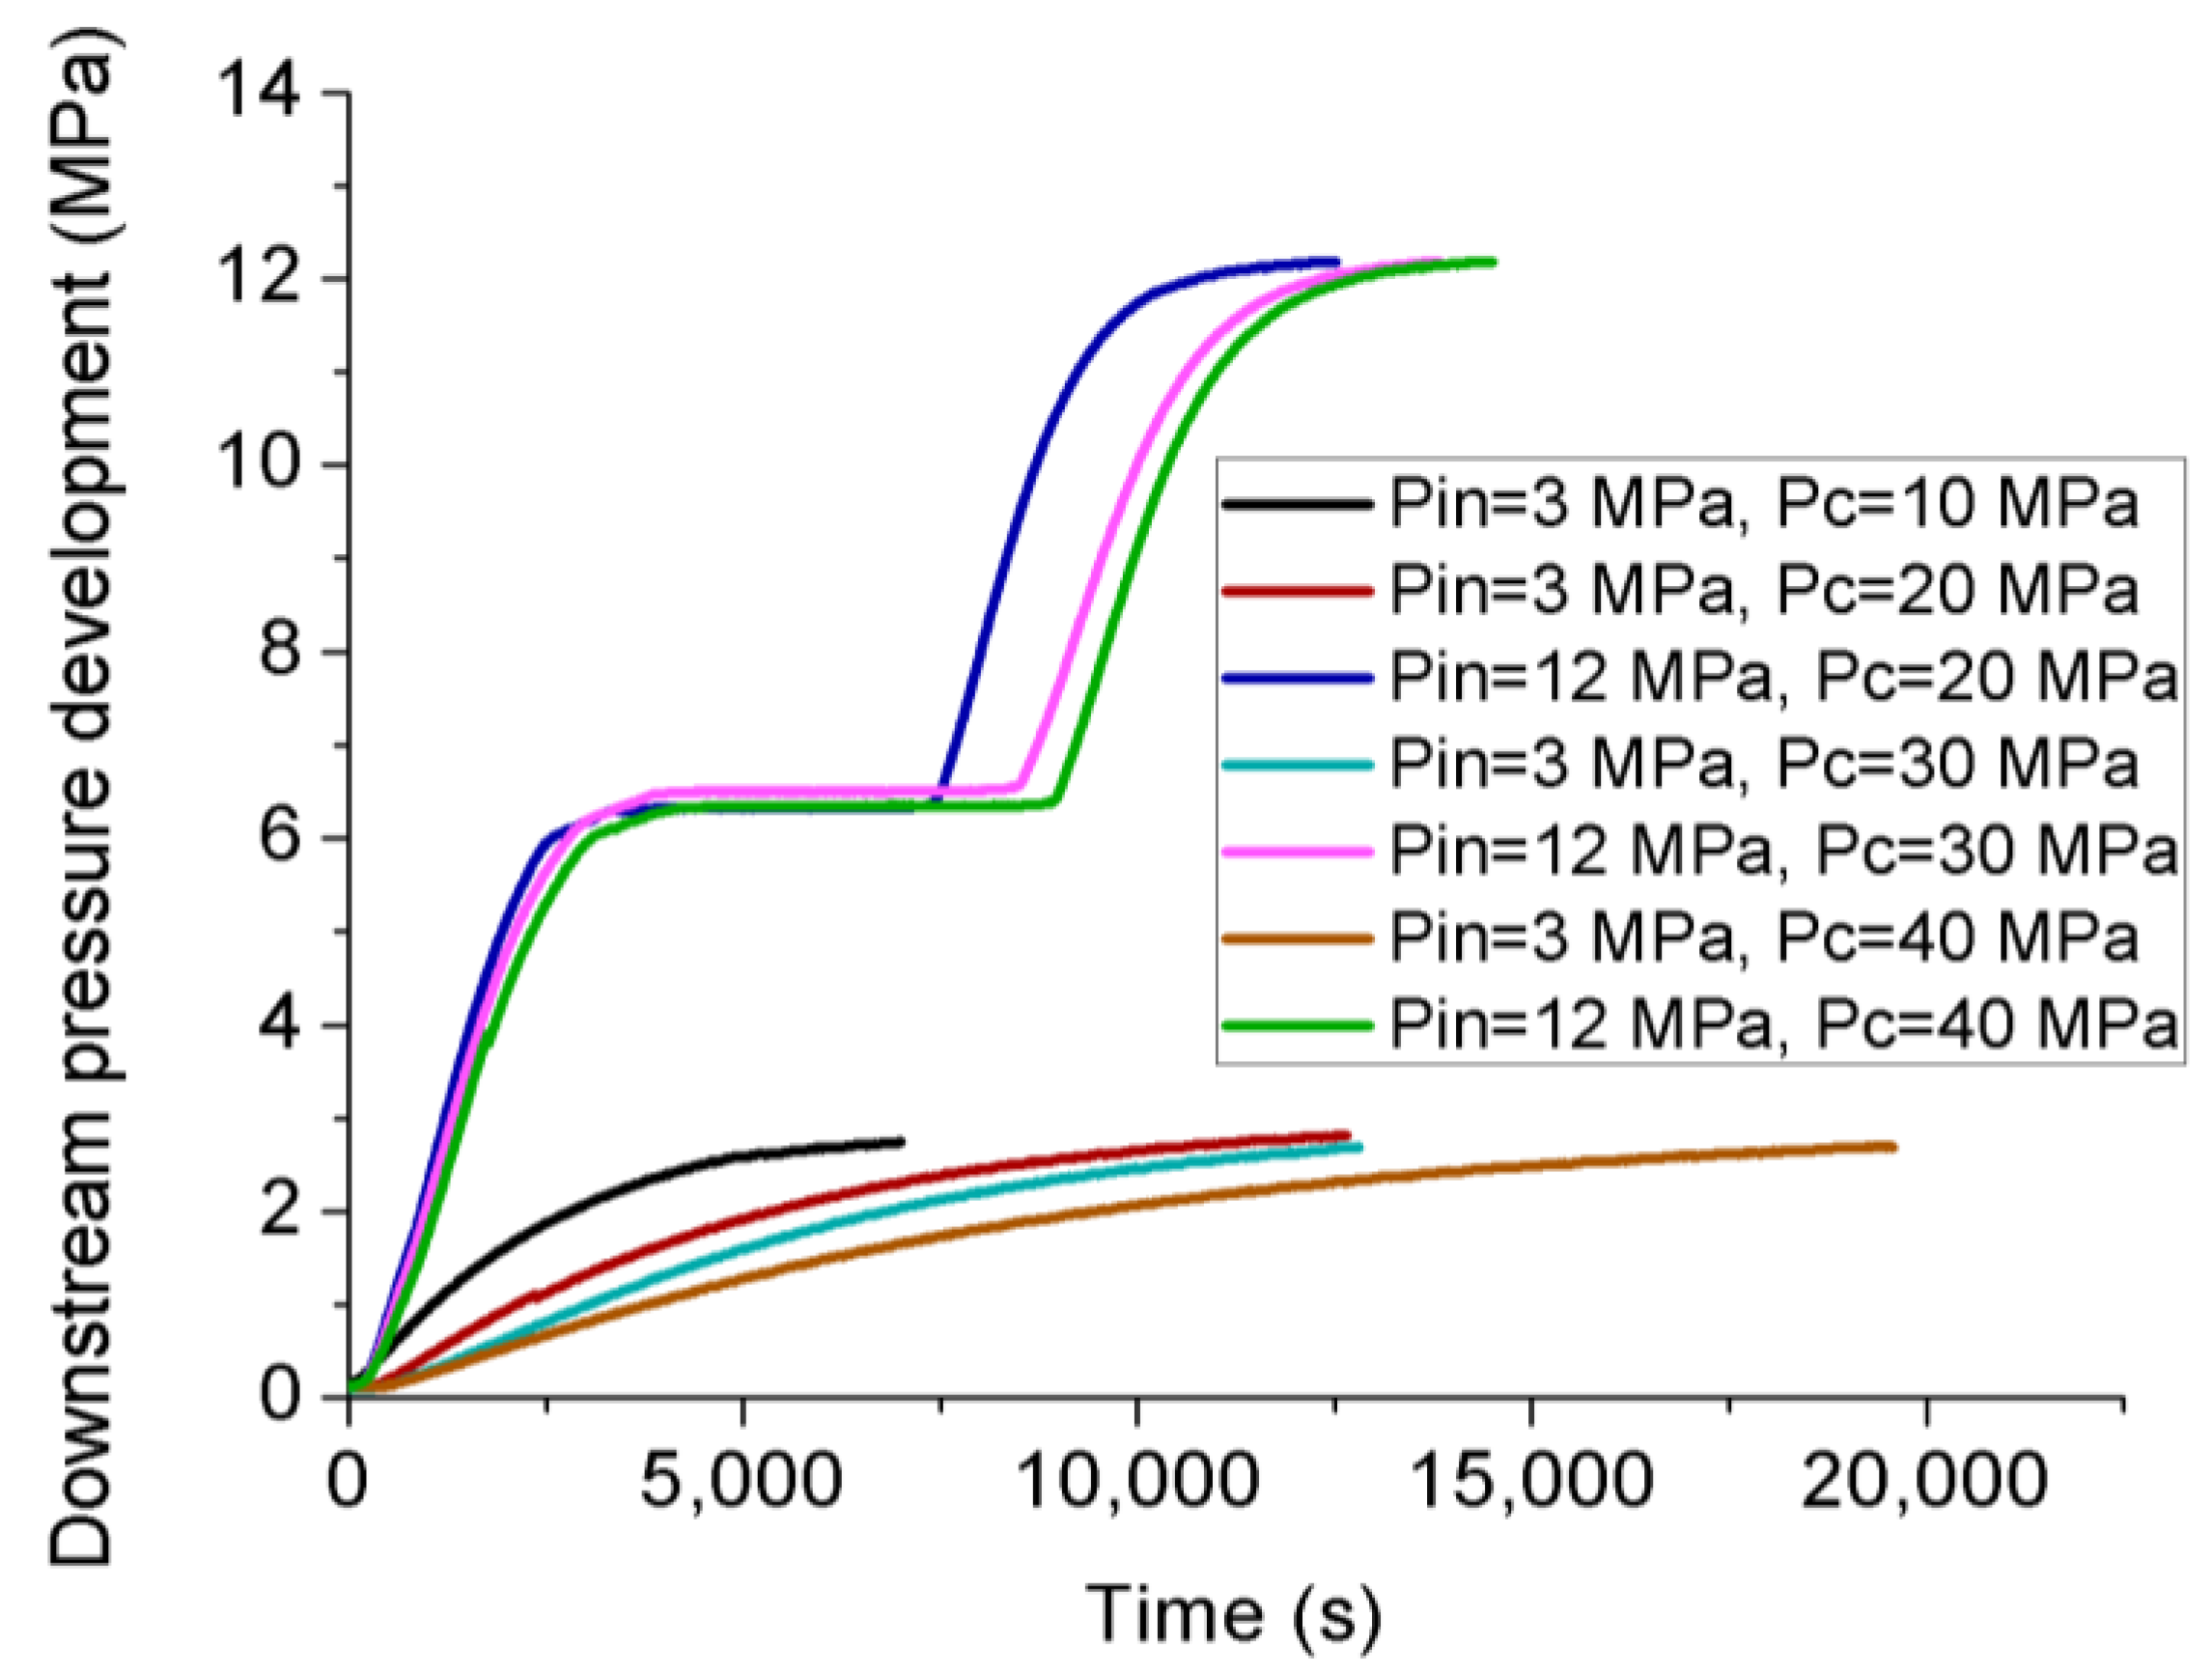
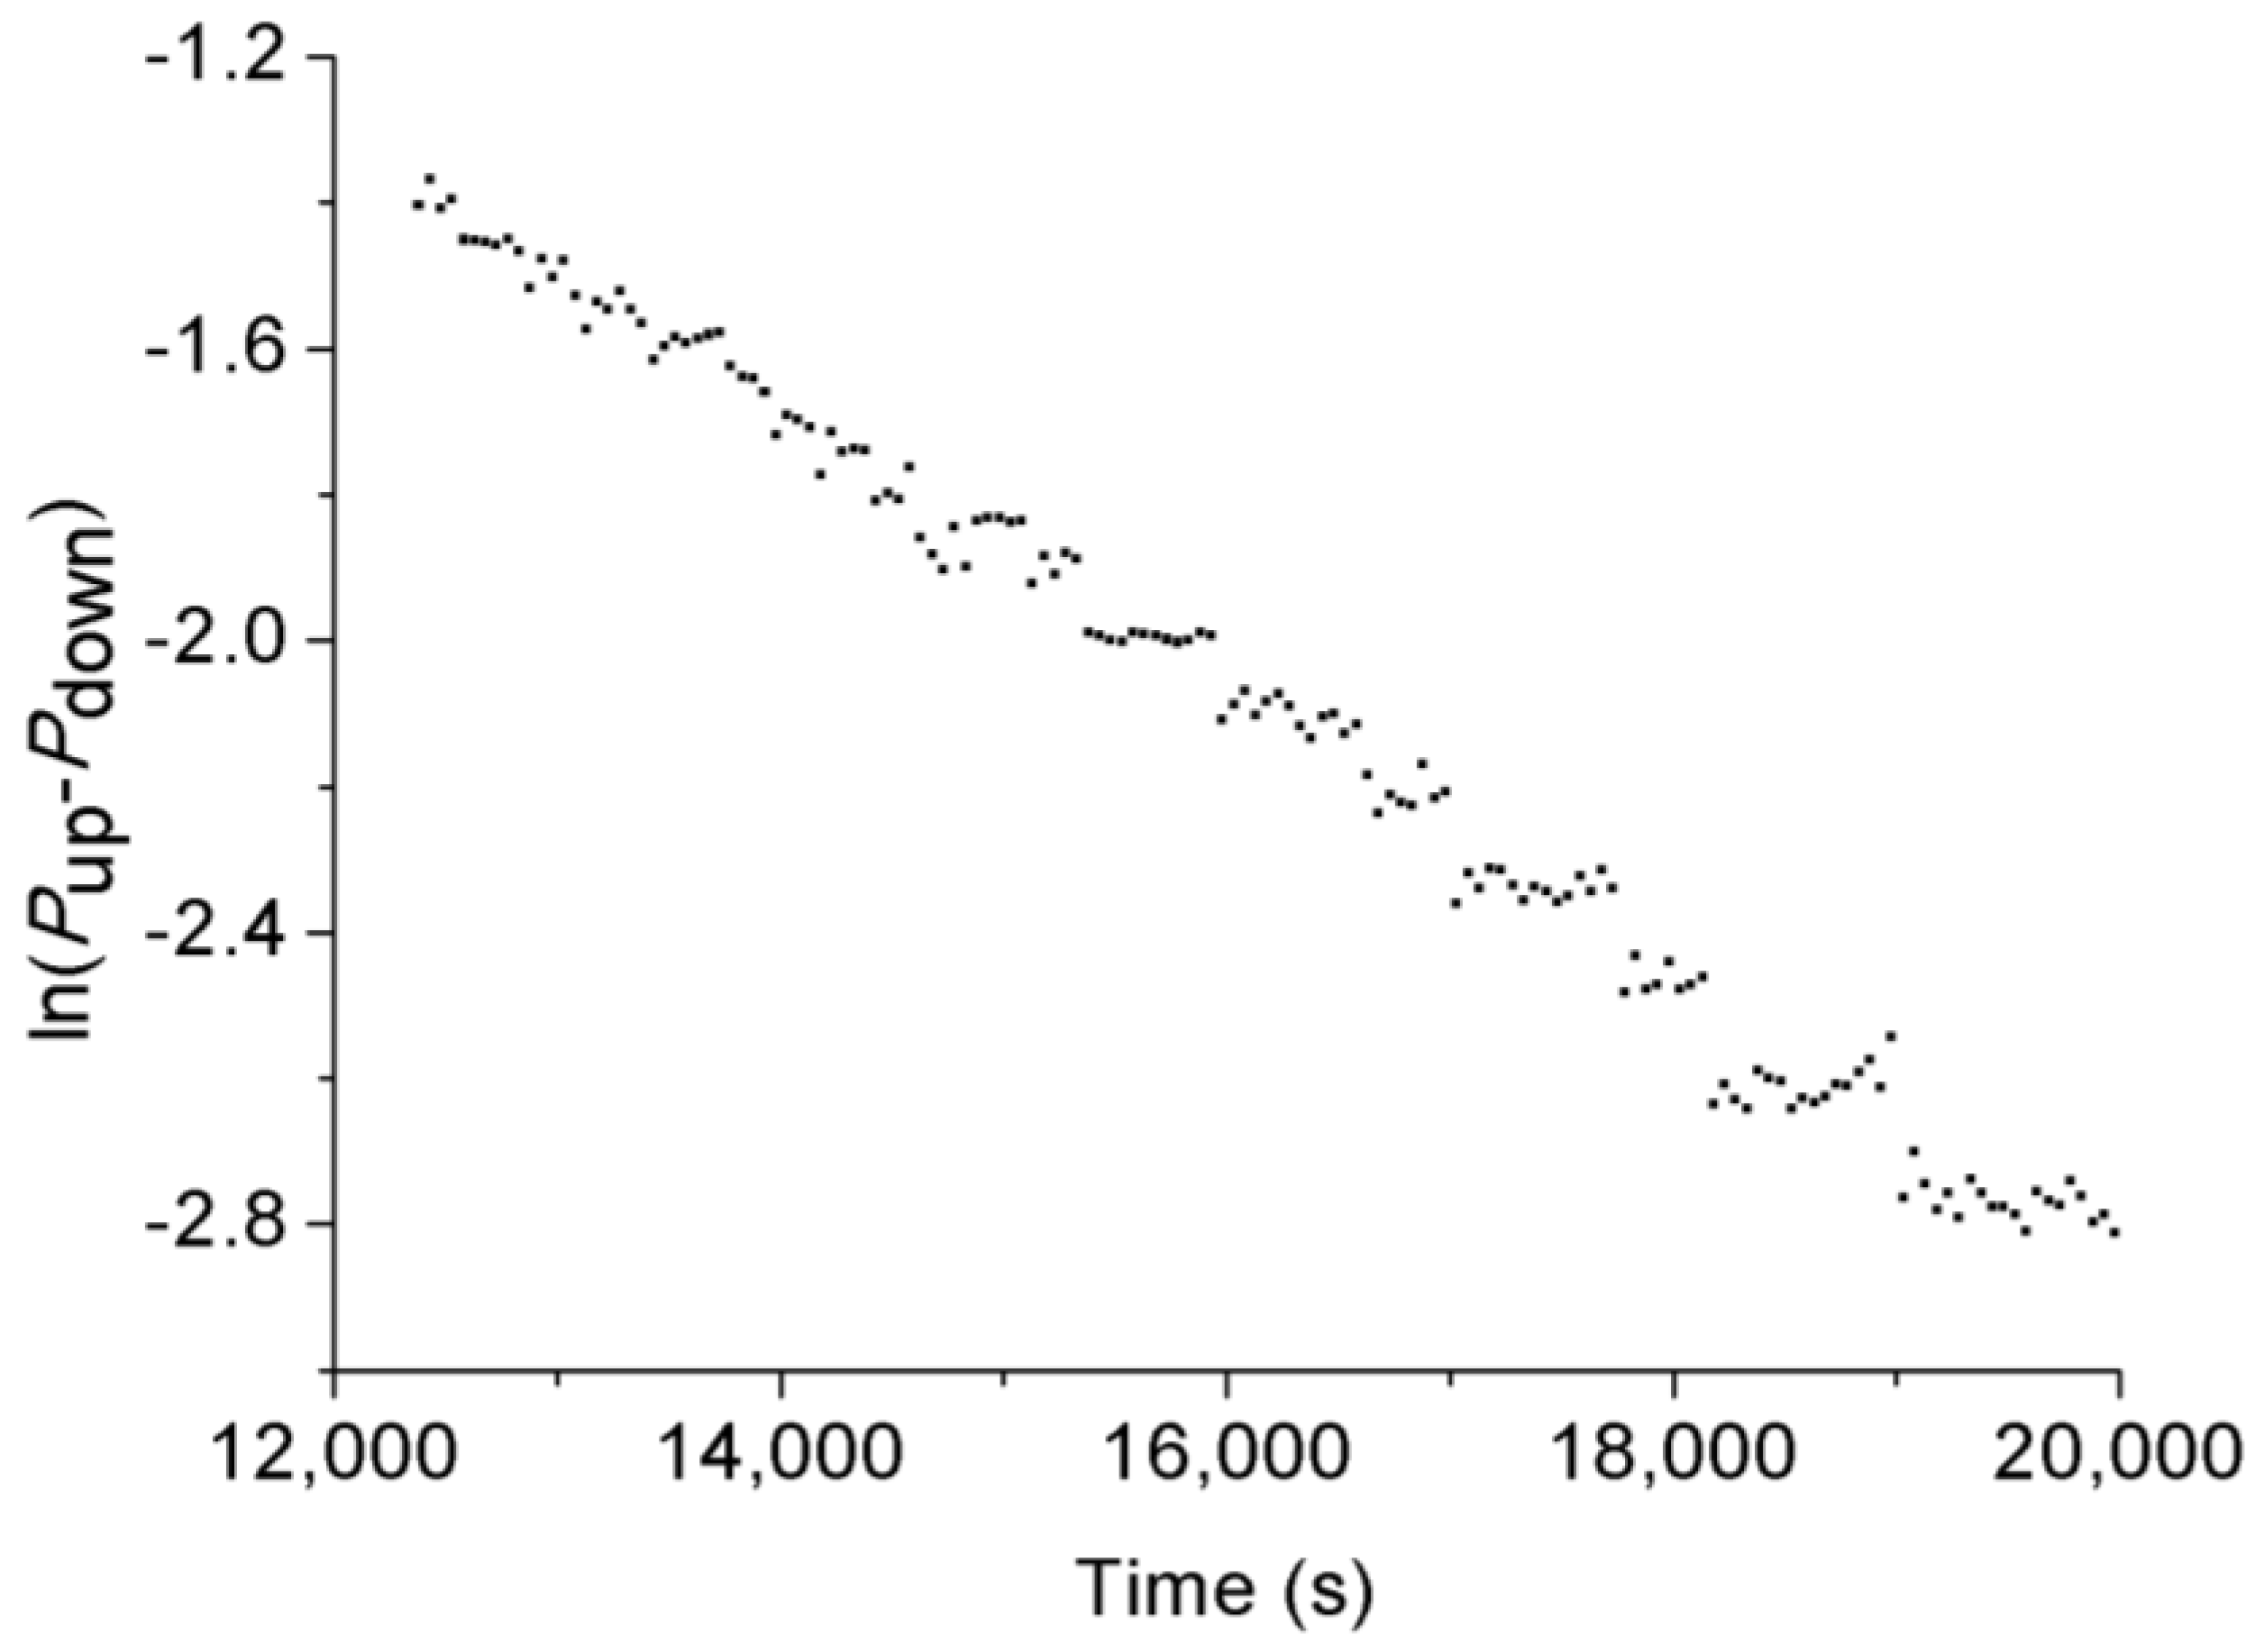
3.3. Permeability Behavior of CO2 under Transient Conditions

The complex gas/liquid permeability characteristics observed in the rock sample during liquid CO2 injection indicate the importance of checking the different permeability characteristics of the tested siltstone under pure gas and liquid CO2 movement using transient tests. Here, the permeability was calculated using Equations (7) and (8), considering the long time of injection under steady-state flow conditions, as longer time is expected under transient conditions, the transient test conditions used for the study are therefore down-sized (see Table 3).
The downstream pressure development relevant to each injection under 20 MPa confining pressure is shown in Figure 18. Here, the time taken to reach the injection pressure value at downstream decreases with increasing injection pressure, exhibiting a weakened flow behavior at lower injection pressures through the rock sample. For example, at 20 MPa confining pressure, the time taken to reach injection pressure level at downstream pressure is around 11 h, 6.4 h and 2.6 h at 3 MPa, 9 MPa, and at 15 MPa injection pressure, respectively. This is mainly due to the accelerated advective flux, which creates a greater pushing force under the existing greater initial pressure gap between the injecting point and the rock matrix pore space. Figure 19 compares the time taken to achieve 5.5 MPa (CO2 still in gaseous state) pressure at downstream under various injection (6–15 MPa) and confining (10–40 MPa) pressures. The time taken to reach the 5.5 MPa at 6 MPa injection pressure condition decreases by 57% with the increase of injection pressure to 9 MPa at 10 MPa confining pressure, and the time taken at 6 MPa injection pressure reduces by 75%, 78% and 83% with increased injection pressure to 15 MPa at 20, 30 and 40 MPa confinement, respectively (see Figure 19).
When the injection pressure is 3 MPa and 6 MPa, a steady-state downstream pressure development over time up to the injection pressure can be seen (see Figure 18). Interestingly, this downstream pressure development changes after 6 MPa at greater injection pressures, and the downstream pressure development curves exhibit two steady-state conditions. In other words, in addition to the final steady-state condition (closer to the injection pressure value), an intermediate steady-state pressure development may be seen under high injection scenarios (≥9 MPa). Importantly, for each high injection pressure (from 9 MPa to 15 MPa), the intermediate pressure development occurs when the downstream reaches 6 MPa (it converts from gas to liquid at this pressure), due to the quite different physical properties of CO2 in its gas and liquid phases (see Figure 18). Increasing the downstream pressure beyond 6 MPa causes the phase transition of the CO2 there, and therefore in the whole sample, from gas to the liquid state. The associated sudden increment in CO2 density (increasing from 210 kg/m3 in the gaseous state to 760 kg/m3 in the liquid state) and the reduction in adiabatic compressibility (0.154 (1/MPa) in the gaseous state to 0.009 (1/MPa) in the liquid state) are due to the phase transition. For this liquidation process, a certain amount of CO2 must be aggregated in the downstream, until which time the downstream pressure development occurs only at a slower rate, showing an almost steady-state condition closer to 6 MPa. This is because pressure development in the gaseous state requires a large gas volume in constant space, due to its high compressibility characteristics, and when it converts to the liquid state, the associated huge compressibility reduction and density enhancement cause much quicker pressure development. In other words, downstream pressure closer to 6 MPa means the sample has almost liquid CO2 throughout and is continually sending out CO2 to downstream, which therefore creates an almost steady pressure holding period until the downstream CO2 converts to its liquid state. The duration of this downstream pressure holding is therefore dependent on the advective flux rate through the sample pore space, which is proportional to the pressure difference between the injection point and the holding pressure. In such situations, greater injection pressures create more accelerated advective flux, causing much shorter pressure holding periods. For example, the pressure holding times for 9, 12 and 15 MPa injection pressures are around 2.24 h, 1.05 h and 0.51 h, respectively. Interestingly, once the downstream begins to increase again after the phase transition, the pressure development at downstream initiates after the holding period, and the pressure development seems to be even greater than the pressure development rate experienced during primary pressure development (0 to 6 MPa), which confirms the superior dense and incompressible characteristics of liquid CO2 compared with its gaseous state (see Figure 18). For example, CO2 compressibility reduces from 0.255 (1/MPa) to 0.00457 (1/MPa) with increasing pressure from 3 MPa to 12 MPa, and the possible pressure increment upon the addition of 1% by volume of CO2 is around 0.039 MPa and 2.19 MPa at 3 MPa and 12 MPa, respectively. This shows that, although there is a much slower flow rate in the liquid state, the CO2 pressure can be significantly changed from an additional CO2 drop, which guarantees a high injection pressure of CO2 during the fracturing process.
The permeability of the siltstone was then calculated using pulse-decay permeability measurement (Equations (7) and (8)), and Figure 20 shows the logarithmic decay of the difference in pressure between upstream and downstream at 3 MPa injection pressure and 20 MPa confinement. Here, in order to reduce the influence of pore pressure on the permeability calculation, only the tail end of the development of the downstream pressure is used, and for each injection condition, the start time of the pulse decay permeability measurement begins when the pressure difference between upstream and downstream drops to 0.2 MPa (see Figure 20). In this case, the pore pressure approximates the injection pressure. There is a linear relationship between the logarithms of the pressure difference between upstream and downstream with time, and the slope of the straight line is the decay exponent α in Equation (7) (see Figure 21), and the permeability of the siltstone sample at different injection pressures can be calculated from Equation (8).
The calculated permeability values for each injection pressure condition are shown in Figure 22, which shows that the permeability decreases from 0.00061 mD to 0.000433 mD with increasing injection pressure from 3 MPa to 6 MPa at 20 MPa confinement, due to the reducing slip flow with increasing pressure, and gaseous CO2 with lower compressibility has high penetration capacity through pore throats. In the case of liquid CO2 injection, when the injection pressure is 9 MPa, the permeability drops to the lowest point of around 0.000270 mD, recalling the conclusion that the permeability for liquid CO2 is much lower than that for gaseous CO2.under steady-state conditions. With further increase of injection pressure, the permeability starts to slightly increase up to 0.000295 mD at 15 MPa, which is mainly related to the reduced effective stress effect in rock pores. In this study, the permeability at 9 MPa injection pressure is regarded as the reference liquid permeability, because the slippage effect is almost absent, and the permeability fluctuation is small when CO2 is in the fluid phase. The Klinkenberg parameter b can be calculated using Equation (3). For example, at 20 MPa confinement, it equals 3.78 MPa at 3 MPa injection pressure and 3.61 MPa at 6 MPa injection pressure, with an average value of 3.70 MPa, which is consistent with the findings of Tanikawa and Shimamoto [41]. According to Equation (3), the permeability for gas CO2 is 0.001265 mD at 1 MPa pore pressure and 0.002268 mD at 0.5 MPa pore pressure, respectively, which is much higher than the liquid permeability.
Similar to the steady-state permeability tests, the confining pressure under transient conditions also plays an important role in permeability evolution. Higher confining pressures cause the natural micro-fractures or preferential flow paths to shrink, resulting in a significant permeability reduction. With the increase of confining pressure, the times taken for the equilibrium between upstream and downstream are increased and the pressure increase rate is decreased (see Figure 23). The tested siltstone permeability decreases with increasing confining pressure (see Figure 22). For example, under 9 MPa injection pressure conditions, increasing the confinement from 10 to 20 MPa, 10 to 30 MPa and 10 to 40 MPa causes the siltstone permeability to decrease by 24%, 31% and 37%, respectively.
Now, if the steady-state and transient permeability values are compared (Figure 13 and Figure 22), it appears that the permeability calculated under transient conditions is much lower than the steady-state permeability of the tested siltstone. The slip-flow effect is reduced with the downstream pressure development which occurs under the transient test conditions, and for steady-state conditions, the flow behavior of CO2 is mainly dominant at low pore pressure around downstream, where a greater pressure gradient is needed for higher flow rates. Therefore, the slip-flow effect around downstream can result in higher permeability under steady-state conditions compared with transient conditions. More significantly, the temperature variation can greatly change the CO2 flow behavior along the sample and tend to increase the flow rate, which is introduced in detail in Section 3.2. In the field, depending on the flow characteristics of the surrounding rock layers, the flow behavior can be partially steady-state/transient and the permeability behavior can change accordingly, particularly for the gaseous state of CO2. For the fracturing process, the leak-off rate of injected CO2 is more dependent on the flow behavior under transient conditions compared with steady-state conditions.

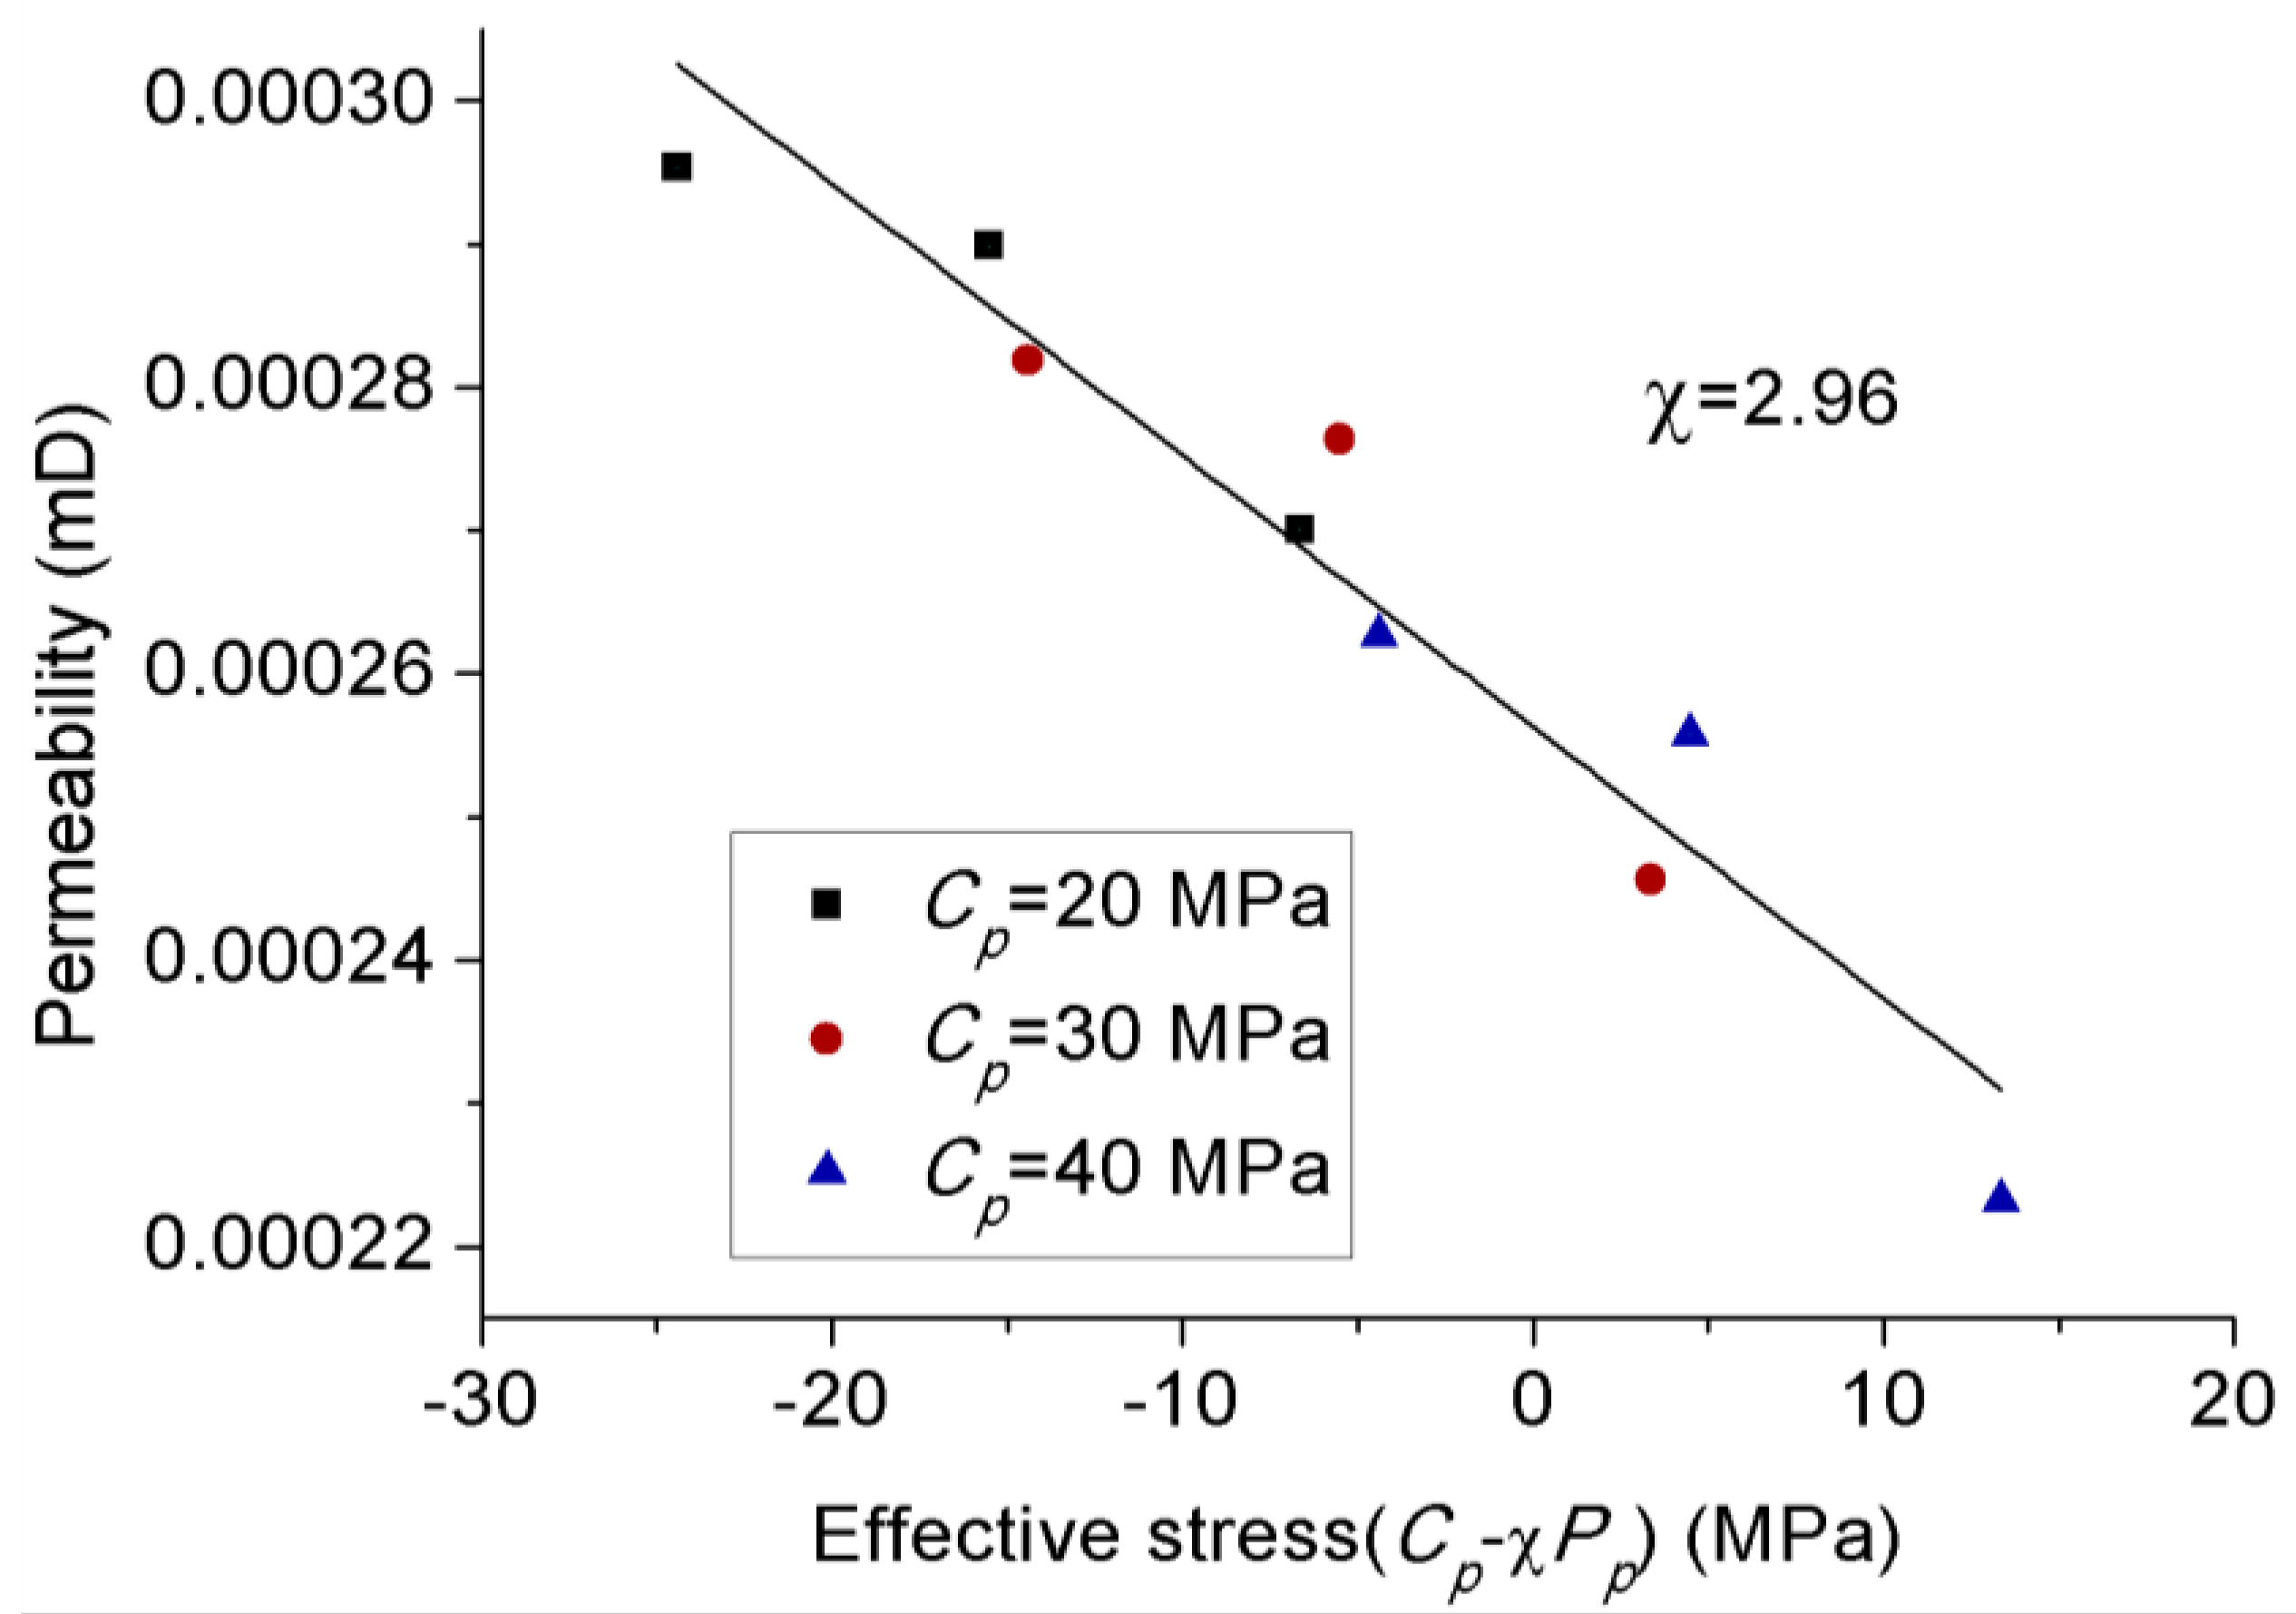
3.4. Effect of Effective Stress Law on Permeability Behavior of CO2

According to Terzaghi [47], rock deformation is governed by the difference between confining pressure and pore pressure, as in Equation (11), which reveals the opposite effects of confining pressure and pore pressure on the volumetric strain and pore structure. For consolidated rock, the sensitivity of rock deformation to confining pressure and pore pressure is different, and similarly, rock permeability, which is closely related to the pore structure of rock, is affected differently by confining pressure and pore pressure [48]. To describe how permeability varies with confining pressure and pore pressure, the effective stress law is applied, considering an effective stress coefficient (Equation (12)).
σ T e r z a g h i = C p P p
σ e f f = C p χ P p
where, C p is confining pressure, P p is the pore pressure, χ is the effective stress coefficient for permeability, and σ e f f is the effective stress for permeability.
The effective stress coefficient for permeability χ indicates the different effects of confining pressure and pore pressure on permeability, and the permeability can be related to single variable parameter σ e f f , effective pressure [43]. The effective stress coefficient for permeability can be calculated using the ratio between the sensitivity of permeability to change in pore pressure and confining pressure (see Equation (13)).
χ = k P p k C p
where, k is the permeability of the sample, and χ indicates the ratio between the relative sensitivity of permeability to changes in confining pressure and pore pressure.
Considering the effect of slip-flow on the difference of permeability between gaseous and liquid CO2, only the permeability for liquid CO2 was analyzed for the effective stress coefficient χ . According to Figure 24, there is a linear relationship between permeability and effective stress under steady-state conditions, and χ equals 3.91 in liquid CO2 state, indicating that the permeability of the siltstone sample is more sensitive to change in pore pressure than confining pressure. This result is consistent with many other studies where clay mineral-abundant samples have higher χ values (>1) [49,50,51], and a similar χ value (2.96) was also calculated for liquid CO2 under transient conditions (see Figure 25). This can be explained by a simplified conceptual model of pore structure proposed by Zoback and Byerlee [49]. The very tiny pore channel for CO2 flow is surrounded by mineral particles, and the quartz particles (accounting for 42% in weight) with a larger diameter and low compressibility make up the skeleton, while many tiny and soft clay particles (accounting for 40% in weight) are present between the quartz particles and tiny pore channels (see Figure 26). The simple conceptual model can be verified by SEM images (see Figure 8). In this model, the outer ring is a rigid framework composed of quartz particles and the inner ring is composed of soft clay minerals. When the confining pressure and pore pressure are applied to the model, the rigid framework incurs a small strain which has limited impact on the thickness of the CO2 flow channel. The inner clay mineral layer is more sensitive to pore pressure because the confining pressure is mainly supported by quartz particles, and pore pressure can produce higher strain on clay minerals compared with the same confining pressure, and the clay mineral strain can have a considerable impact on the thickness of the flow channels. Therefore, pore pressure has a greater effect than confining pressure on the flow behavior of CO2 in this clay-abundant sample [50].

4. Conclusions

The current lack of understanding of CO2 flow behavior in deep shale layers, particularly with its expected phase transition and using different measurement techniques, adds many complications to the prediction of the effectiveness of the fracturing process. The intention of the present study was therefore to determine the flow behavior of CO2 in shale formations and the influence of phase transition on it. Further, the influence of utilizing laboratory techniques (steady-state and transient tests) on permeability calculation was also examined. The test results enable the following conclusions to be drawn:
(1).
Much lower permeability values for liquid CO2 compared to gaseous CO2 were observed under transient conditions, due to the reduced slip-flow effect. Considering the significant difference of density between two phases, the mass flow rate of liquid CO2 is much higher than that of gaseous CO2.
(2).
Under steady-state conditions, the heat exchange with the decrease of pore pressure can greatly decrease the flow temperature due to the unique thermodynamic properties of CO2, which can liquefy the gaseous CO2 and extend the length of liquid CO2 along the sample, and much higher density of liquid CO2 can lead to higher flow rate recorded by flowmeter at room temperature. Faster temperature variation at higher injection pressure than 9 MPa can results in the presence of small drikold particles, which is responsible for the unstable flow rate at higher injection pressure.
(3).
Permeability calculated under transient conditions is much lower than that under steady-state conditions, except the reason that the slip-flow effect under steady-state conditions increased the flow behavior of CO2 through the tested sample with ultralow permeability, the influence of temperature variation can be excluded under transient conditions due to its much lower flow rate. During the field fracturing process, liquid CO2 is injected into the formation matrix at high pore pressure, and the conditions are closer to transient laboratory conditions. Therefore, the transient permeability calculation approach is more reliable for the shale fracturing process.
(4).
The variation of apparent permeability with injection pressure is affected by the combined effects of slip-flow effect, temperature variation and effective stress. Under transient conditions without any temperature variation, increasing the injection pressure caused an opposite trend of apparent permeability for gaseous and liquid CO2, because the slip-flow effect dominates the downward of permeability for gaseous CO2 and the effect of effective stress dominates the upward of permeability for liquid CO2, respectively. However, under steady-state conditions, although liquid CO2 showed a similar upward trend to that under transient conditions, gaseous CO2 permeability also exhibited an upward trend with the increase of injection pressure, which is opposite to that under transient conditions, because the influence of temperature variation becomes stronger with the increase of flow rate and increases the apparent permeability with the increase of injection pressure.
(5).
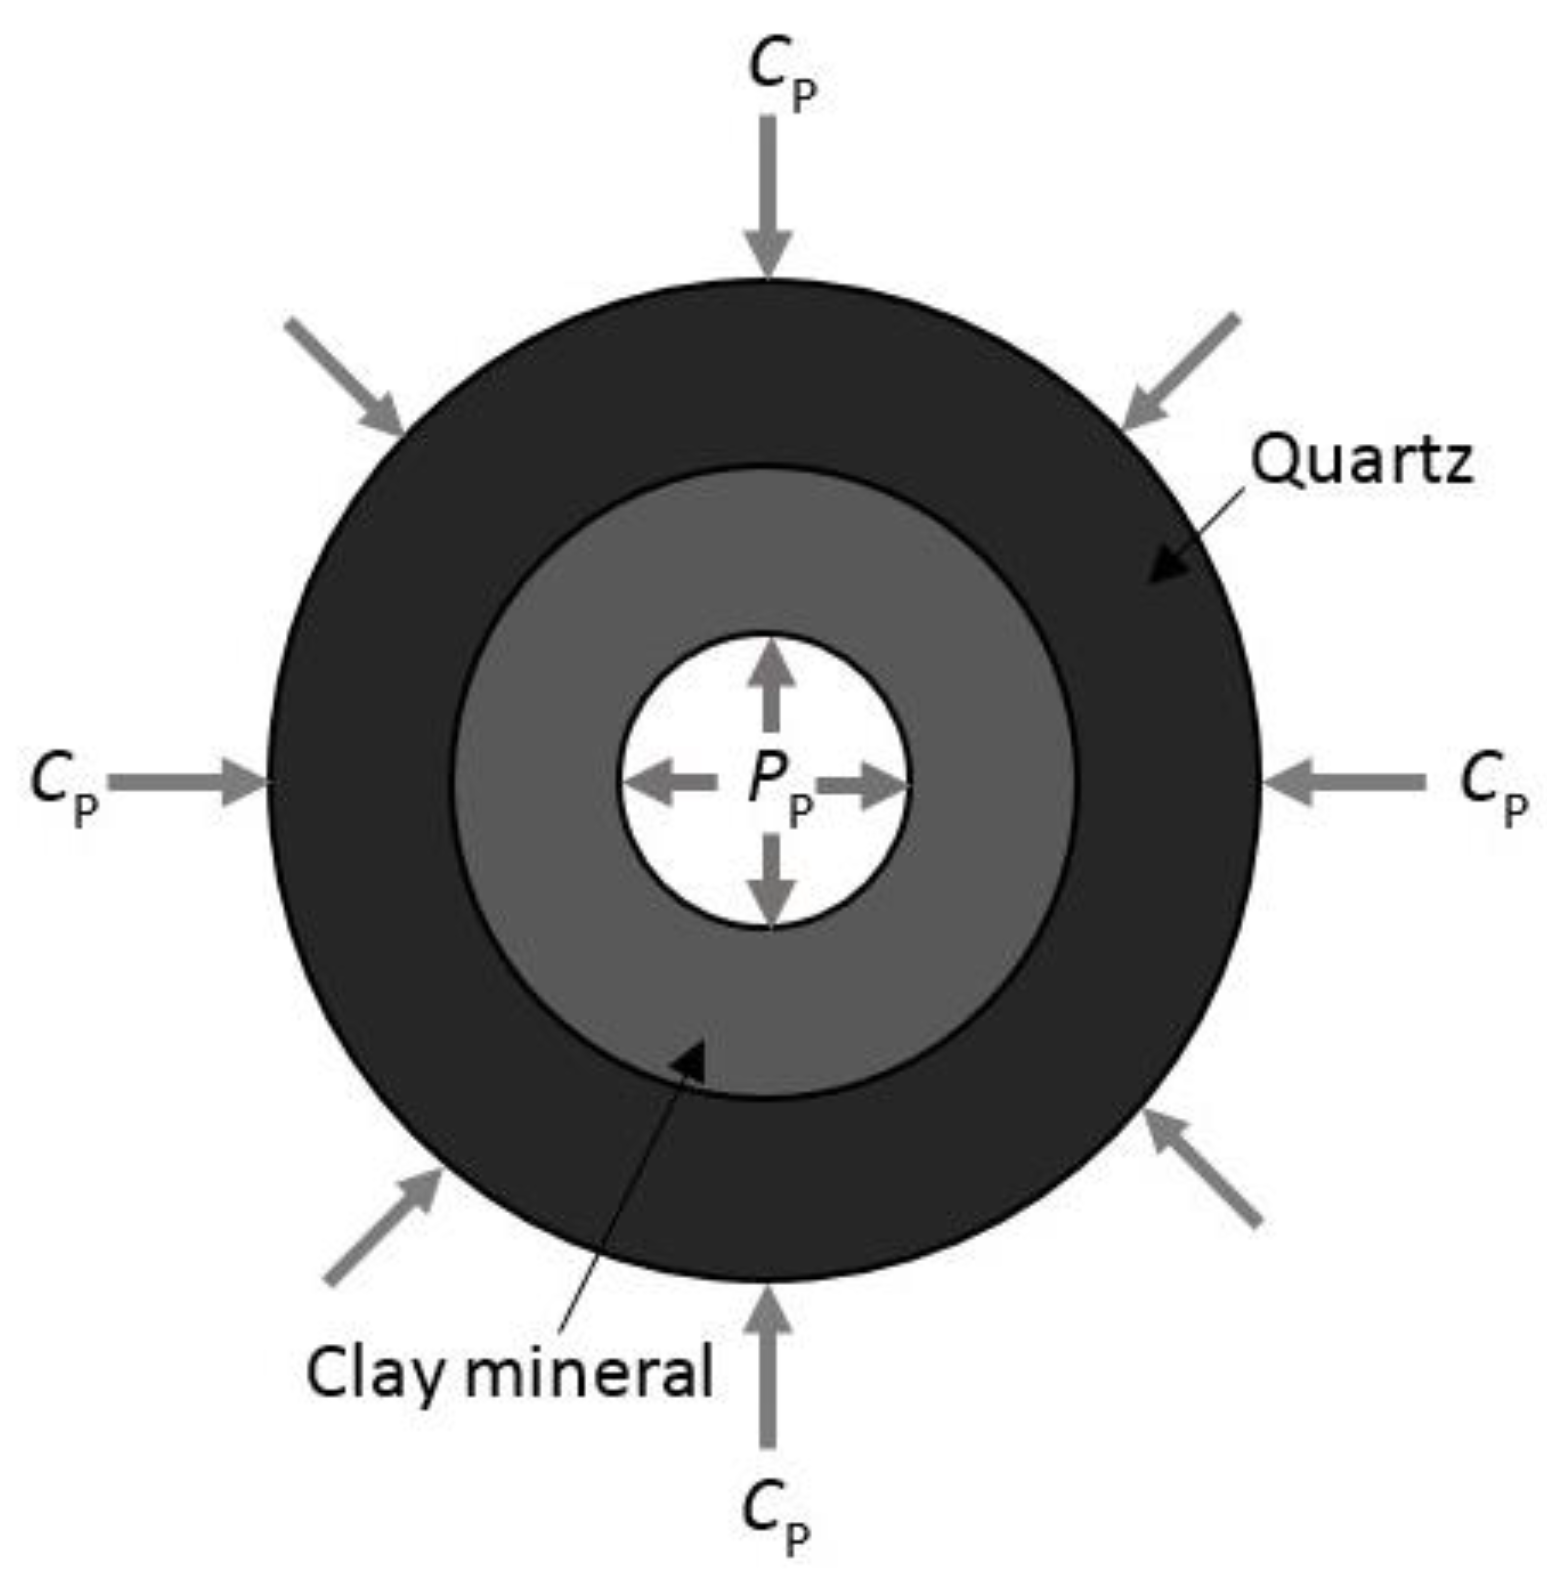
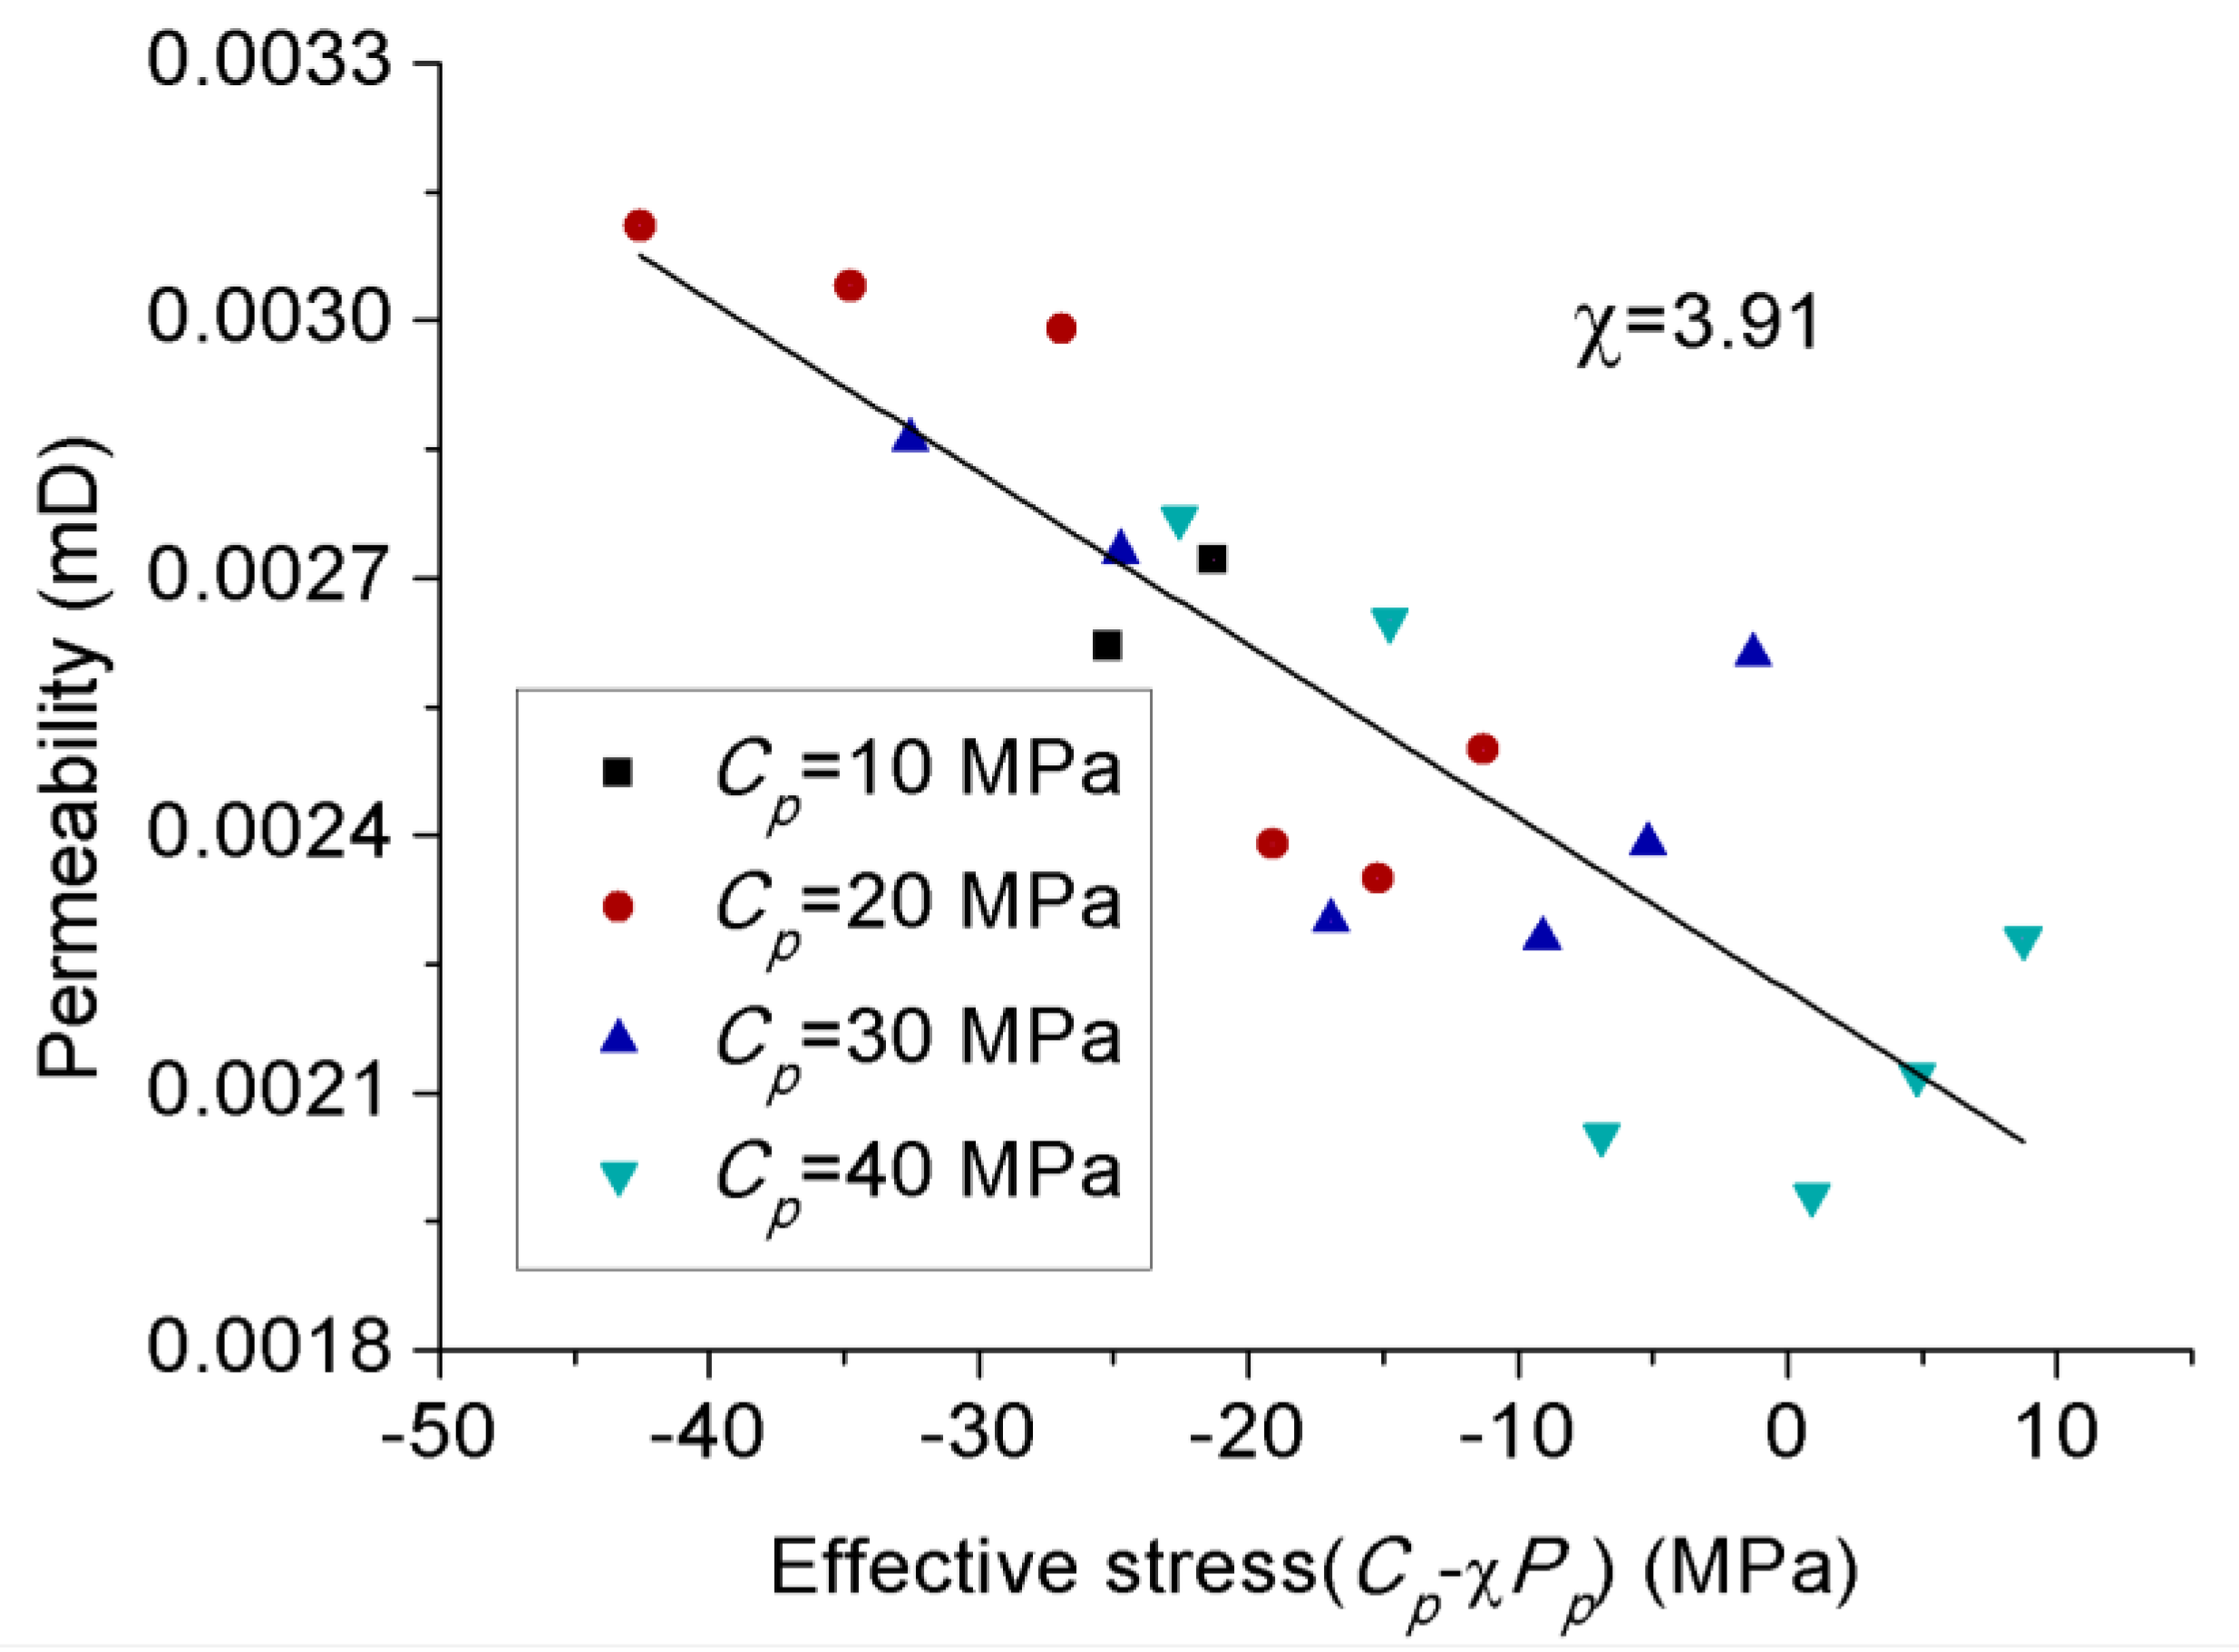
Increasing the confining pressure causes the internal natural micro-fractures or preferential flow pathways in the rock matrix to close, which significantly reduces its flow capacity or permeability. A greater than 1 effective stress coefficient ( χ ) for permeability confirms the greater sensitivity of CO2 to pore pressure compared to confining pressure due to the abundance of clay minerals.

Author Contributions

C.Z. and R.P.G. conceived and designed the experiments; C.Z. performed the experiments; C.Z. and M.S.A.P. analyzed the data and wrote the paper; C.Z. revised the paper according to reviewers’ comments.

Funding

This research received no external funding.

Acknowledgments

This work was performed in part at the Monash Centre for Electron Microscopy (MCEM). Chengpeng would like to acknowledge the scholarship assistance from China Scholarship Council and Monash University.

Conflicts of Interest

The authors declare no conflict of interest.

References

  1. US Energy Information Administration. International Energy Outlook; US Energy Information Administration: Washington, DC, USA, 2011.
  2. Conti, J.; Holtberg, P.; Diefenderfer, J.; Napolitano, S.; Schaal, A.; Turnure, J.; Westfall, L. Annual Energy Outlook 2014 with Projections to 2040; US Energy Information Administration: Washington, DC, USA, 2014.
  3. Heller, R.; Vermylen, J.; Zoback, M. Experimental investigation of matrix permeability of gas shales. AAPG Bull. 2014, 98, 975–995. [Google Scholar] [CrossRef]
  4. Kumar, H.; Elsworth, D.; Mathews, J.; Marone, C. Permeability evolution in sorbing media: Analogies between organic-rich shale and coal. Geofluids 2015, 16, 43–55. [Google Scholar] [CrossRef]
  5. Liu, H.; Ranjith, P.; Georgi, D.; Lai, B. Some key technical issues in modelling of gas transport process in shales: A review. Geomech. Geophys. Geo-Energy Geo-Resour. 2016, 2, 231–243. [Google Scholar] [CrossRef]
  6. Arnold, D. Liquid CO2 and sand: An alternative to water-based stimulation fluids. Pet. Eng. Int. 1998, 71, 89–92. [Google Scholar]
  7. Ghahremani, N.; Clapp, L. Feasibility of using brackish groundwater desalination concentrate as hydraulic fracturing fluid in the eagle ford shale. In Proceedings of the Shale Energy Engineering Conference 2014: Technical Challenges, Environmental Issues, and Public Policy, Pittsburgh, PA, USA, 21–23 July 2014; pp. 23–32. [Google Scholar]
  8. Gallegos, T.J.; Varela, B.A.; Haines, S.S.; Engle, M.A. Hydraulic fracturing water use variability in the United States and potential environmental implications. Water Resour. Res. 2015, 51, 5839–5845. [Google Scholar] [CrossRef] [PubMed] [Green Version]
  9. Birkle, P. Geochemical fingerprinting of hydraulic fracturing fluids from qusaiba hot shale and formation water from paleozoic petroleum systems, Saudi Arabia. Geofluids 2016, 16, 565–584. [Google Scholar] [CrossRef]
  10. Li, X.; Feng, Z.; Han, G.; Elsworth, D.; Marone, C.; Saffer, D.; Cheon, D.-S. Breakdown pressure and fracture surface morphology of hydraulic fracturing in shale with H2O, CO2 and N2. Geomech. Geophys. Geo-Energy Geo-Resour. 2016, 2, 63–76. [Google Scholar] [CrossRef]
  11. Lillies, A.T.; King, S.R. Sand fracturing with liquid carbon dioxide. In Proceedings of the SPE Production Technology Symposium, Hobbs, NM, USA, 8–9 November 1982. [Google Scholar]
  12. Sinal, M.; Lancaster, G. Liquid CO2 fracturing: Advantages and limitations. J. Can. Pet. Technol. 1987, 26, 26–30. [Google Scholar] [CrossRef]
  13. Zhou, X.; Burbey, T. Fluid effect on hydraulic fracture propagation behavior: A comparison between water and supercritical CO2-like fluid. Geofluids 2014, 14, 174–188. [Google Scholar] [CrossRef]
  14. Perera, M.; Ranjith, P.; Choi, S.; Airey, D.; Weniger, P. Estimation of gas adsorption capacity in coal: A review and an analytical study. Int. J. Coal Prep. Util. 2012, 32, 25–55. [Google Scholar] [CrossRef]
  15. Ong, S.; Ramos, R.; Zheng, Z. Sand production prediction in high rate, perforated and open-hole gas wells. In Proceedings of the SPE International Symposium on Formation Damage Control, Lafayette, LA, USA, 23–24 February 2000. [Google Scholar]
  16. Godec, M.; Koperna, G.; Petrusak, R.; Oudinot, A. Potential for enhanced gas recovery and CO2 storage in the Marcellus Shale in the Eastern United States. Int. J. Coal Geol. 2013, 118, 95–104. [Google Scholar] [CrossRef]
  17. De Silva, P.; Ranjith, P. A study of methodologies for CO2 storage capacity estimation of saline aquifers. Fuel 2012, 93, 13–27. [Google Scholar] [CrossRef]
  18. Rushing, J.; Newsham, K.; Lasswell, P.; Cox, J.; Blasingame, T. Klinkenerg-corrected permeability measurements in tight gas sands: Steady-state versus unsteady-state techniques. In Proceedings of the SPE Annual Technical Conference and Exhibition, Houston, TX, USA, 26–29 September 2004. [Google Scholar]
  19. Perera, M.S.A.; Ranjith, P.G.; Choi, S.K.; Airey, D. Numerical simulation of gas flow through porous sandstone and its experimental validation. Fuel 2011, 90, 547–554. [Google Scholar] [CrossRef]
  20. Perera, M.; Ranjith, P.; Choi, S.; Airey, D. Investigation of temperature effect on permeability of naturally fractured black coal for carbon dioxide movement: An experimental and numerical study. Fuel 2012, 94, 596–605. [Google Scholar] [CrossRef]
  21. Carles, P.; Egermann, P.; Lenormand, R.; Lombard, J. Low permeability measurements using steady-state and transient methods. In Proceedings of the International Symposium of the SCA, Calgary, AB, Canada, 10–12 September 2007. [Google Scholar]
  22. Boulin, P.; Bretonnier, P.; Gland, N. Comparison of steady state method and transient methods for water permeability measurement in low permeability rocks. In Proceedings of the SPE Low Perm Symposium, Denver, CO, USA, 5–6 May 2016; p. 1234. [Google Scholar]
  23. Ranathunga, A.S.; Perera, M.S.A.; Ranjith, P.G.; Ju, Y.; Vishal, V.; De Silva, P.N.K. A macro-scale experimental study of sub- and super-critical CO2 flow behaviour in Victorian brown coal. Fuel 2015, 158, 864–873. [Google Scholar] [CrossRef]
  24. Zhang, C.; Ranjith, P.; Perera, M.; Zhao, J.; Zhang, D.; Wanniarachchi, W. A novel approach to precise evaluation of carbon dioxide flow behaviour in siltstone under tri-axial drained conditions. J. Nat. Gas Sci. Eng. 2016, 34, 331–340. [Google Scholar] [CrossRef]
  25. Clarkson, C.R.; Jensen, J.L.; Pedersen, P.K.; Freeman, M. Innovative methods for flow-unit and pore-structure analyses in a tight siltstone and shale gas reservoir. AAPG Bull. 2012, 96, 355–374. [Google Scholar] [CrossRef]
  26. Burnham, A.K. Porosity and permeability of Green River oil shale and their changes during retorting. Fuel 2017, 203, 208–213. [Google Scholar] [CrossRef]
  27. Gao, Z.; Hu, Q. Estimating permeability using median pore-throat radius obtained from mercury intrusion porosimetry. J. Geophys. Eng. 2013, 10, 25014. [Google Scholar] [CrossRef]
  28. Ramandi, H.L.; Mostaghimi, P.; Armstrong, R.T.; Saadatfar, M.; Pinczewski, W.V. Porosity and permeability characterization of coal: A micro-computed tomography study. Int. J. Coal Geol. 2016, 154, 57–68. [Google Scholar] [CrossRef]
  29. Husain, R.A.; Zayed, A.S.; Ahmed, W.M.; Elhaji, H.S. Image segmentation with improved watershed algorithm using radial bases function neural networks. In Proceedings of the 2015 16th International Conference on Sciences and Techniques of Automatic Control and Computer Engineering (STA), Monastir, Tunisia, 21–23 December 2015; pp. 121–126. [Google Scholar]
  30. Bergaya, F.; Lagaly, G. Handbook of Clay Science; Newnes: Oxford, UK, 2013; Volume 5. [Google Scholar]
  31. Kuila, U.; Prasad, M. Specific surface area and pore-size distribution in clays and shales. In Proceedings of the SPE Annual Technical Conference and Exhibition, Denver, CO, USA, 30 October–2 November 2011. [Google Scholar]
  32. Kuila, U.; Prasad, M. Specific surface area and pore-size distribution in clays and shales. Geophys. Prospect. 2013, 61, 341–362. [Google Scholar] [CrossRef]
  33. Wu, T.; Li, X.; Zhao, J.; Zhang, D. Mutiscale pore structure and its effect on gas transport in organic-rich shale. Water Resour. Res. 2017, 7, 5438–5450. [Google Scholar] [CrossRef]
  34. Ranjith, P.; Perera, M. A new triaxial apparatus to study the mechanical and fluid flow aspects of carbon dioxide sequestration in geological formations. Fuel 2011, 90, 2751–2759. [Google Scholar] [CrossRef]
  35. Darabi, H.; Ettehad, A.; Javadpour, F.; Sepehrnoori, K. Gas flow in ultra-tight shale strata. J. Fluid Mech. 2012, 710, 641–658. [Google Scholar] [CrossRef]
  36. Klinkenberg, L. The permeability of porous media to liquids and gases. In Drilling and Production Practice; American Petroleum Institute: Tulsa, OK, USA, 1941; pp. 200–213. [Google Scholar]
  37. Kollek, J. The determination of the permeability of concrete to oxygen by the Cembureau method—A recommendation. Mater. Struct. 1989, 22, 225–230. [Google Scholar] [CrossRef]
  38. Lemmon, E.; Huber, M.; McLinden, M. NIST Standard Reference Database 23: NIST Reference Fluid Thermodynamic and Transport Properties, REFPROP; Version 9.0; Standard Reference Data Program; National Institute of Standards and Technology: Gaithersburg, MD, USA, 2010.
  39. Webster, C. The Discovery of Boyle’s Law, and the Concept of the Elasticity of Air in the Seventeenth Century. Arch. Hist. Exact Sci. 1965, 2, 441–502. [Google Scholar] [CrossRef]
  40. Bustin, R.M.; Bustin, A.M.; Cui, A.; Ross, D.; Pathi, V.M. Impact of shale properties on pore structure and storage characteristics. In Proceedings of the SPE Shale Gas Production Conference, Fort Worth, TX, USA, 16–18 November 2008. [Google Scholar]
  41. Tanikawa, W.; Shimamoto, T. Klinkenberg effect for gas permeability and its comparison to water permeability for porous sedimentary rocks. Hydrol. Earth Syst. Sci. Discussions 2006, 3, 1315–1338. [Google Scholar] [CrossRef]
  42. Ghabezloo, S.; Sulem, J.; Guédon, S.; Martineau, F. Effective stress law for the permeability of a limestone. Int. J. Rock Mech. Min. Sci. 2009, 46, 297–306. [Google Scholar] [CrossRef] [Green Version]
  43. Rathnaweera, T.; Ranjith, P.; Perera, M.; Yang, S. Determination of effective stress parameters for effective CO2 permeability in deep saline aquifers: An experimental study. J. Nat. Gas Sci. Eng. 2015, 24, 64–79. [Google Scholar] [CrossRef]
  44. Moran, M.J.; Shapiro, H.N.; Boettner, D.D.; Bailey, M.B. Fundamentals of Engineering Thermodynamics; John Wiley & Sons: Hoboken, NJ, USA, 2010. [Google Scholar]
  45. Pruess, K. On CO2 fluid flow and heat transfer behavior in the subsurface, following leakage from a geologic storage reservoir. Environ. Geol. 2008, 54, 1677–1686. [Google Scholar] [CrossRef]
  46. Mungan, C.E. Irreversible Adiabatic Compression of an Ideal Gas; Naval Postgraduate School, Monterey CA Department of Physics: Monterey, CA, USA, 2003. [Google Scholar]
  47. Terzaghi, K.V. The shearing resistance of saturated soils and the angle between the planes of shear. In Proceedings of the 1st International Conference on Soil Mechanics and Foundation Engineering, Cambridge, MA, USA, 22–26 June 1936; pp. 54–56. [Google Scholar]
  48. Biot, M.; Willis, D. The theory of consolidation. J. Appl. Elast. Coeff. Mech. 1957, 24, 594–601. [Google Scholar]
  49. Zoback, M.D.; Byerlee, J. Permeability and effective stress: Geologic notes. AAPG Bull. 1975, 59, 154–158. [Google Scholar]
  50. Walls, J.; Nur, A. Pore pressure and confining pressure dependence of permeability in sandstone. In Proceedings of the Transactions of the 7th Formation Evaluation Symposium, Calgary, AB, Canada, 21–24 October 1979; pp. 1–8. [Google Scholar]
  51. Al-Wardy, W.; Zimmerman, R.W. Effective stress law for the permeability of clay-rich sandstones. J. Geophys. Res. Solid Earth 2004, 109, 1029–1039. [Google Scholar] [CrossRef]
Figure 1. Pore size distribution defined by incremental pore volume and pore area [24].
Applsci 08 01092 g001
Figure 2. CT images of cylindrical siltstone sample with diameter of 13.0 mm and height of 13.5 mm (black cavities represent pores).
Applsci 08 01092 g002
Figure 3. Reconstructed 3-D CT images of pore structure with sample size of 6 mm × 7 mm × 7 mm (pores are shown in blue).
Applsci 08 01092 g003
Figure 4. Relationship between mean free path and pressure at 22 °C.
Applsci 08 01092 g004
Figure 5. Dimensionless Knudsen number of CO2 vs. pore pressure for different pore sizes at 22 °C.
Applsci 08 01092 g005
Figure 6. Flow rate development with time when injection pressure is not higher than 9 MPa.
Applsci 08 01092 g006
Figure 7. Flow rate development with time when injection pressure is higher than 9 MPa.
Applsci 08 01092 g007
Figure 8. SEM image of tested siltstone sample with varisized particles.
Applsci 08 01092 g008
Figure 9. Schematic diagram of effect of fine particle migration on permeability (solid circles represent mineral and fine particles; dashed circles represent moving fine particles).
Applsci 08 01092 g009
Figure 10. Flow rates for different injection pressures.
Applsci 08 01092 g010
Figure 11. Relationship between permeability of siltstone under different injection pressures (traditional method).
Applsci 08 01092 g011
Figure 12. Relationship between CO2 viscosity at different injection pressures.
Applsci 08 01092 g012
Figure 13. Relationship between apparent permeability of siltstone under different injection pressures (proposed method).
Applsci 08 01092 g013
Figure 14. Vertical displacement at different confining pressures.
Applsci 08 01092 g014
Figure 15. Relationship between permeability of siltstone at different confining pressures.
Applsci 08 01092 g015
Figure 16. The phase diagram of CO2 (date were obtained from REFPROP Database [38]).
Applsci 08 01092 g016
Figure 17. Isentropic plots of pure CO2 for different initial conditions (date were obtained from REFPROP Database [38]).
Applsci 08 01092 g017
Figure 18. Measurement of downstream pressure at different CO2 injection pressures under 20 MPa confining pressure.
Applsci 08 01092 g018
Figure 19. Time for downstream pressure up to 5.5 MPa at different injection pressures and confining pressures.
Applsci 08 01092 g019
Figure 20. Development of downstream pressure with time at 3 MPa injection pressure under 20 MPa confinement.
Applsci 08 01092 g020
Figure 21. Logarithmic decay of difference between upstream pressure and downstream pressure at 20 MPa confinement.
Applsci 08 01092 g021
Figure 22. Relationship between permeability of siltstone at different injection pressures.
Applsci 08 01092 g022
Figure 23. Measurement of downstream fluid pressure for CO2 injection under 3 MPa injection pressure without phase transition and under 12 MPa injection pressure with phase transition (for the effect of confining pressure).
Applsci 08 01092 g023
Figure 24. Permeability versus modified effective stress for liquid CO2 state under steady-state conditions.
Applsci 08 01092 g024
Figure 25. Permeability versus modified effective stress for liquid CO2 state under transient conditions.
Applsci 08 01092 g025
Figure 26. Conceptual model of flow channel structure in clay-abundant sample [49].
Applsci 08 01092 g026
Table 1. Steady-state permeability test conditions for the same sample.
Confining Pressure(MPa)Injection Pressure (MPa)
Gaseous StateLiquid State
103, 4, 5, 67, 8, 9
20, 30, 403, 4, 5, 67, 8, 9, 10, 12, 14, 16
Table 2. Proportion of liquid CO2 length in sample calculated using Equation (5) (%).
Injection Pressure (MPa)Confining Pressure (MPa)
10203040
723.9626.7434.1828.99
840.1641.6747.4745.56
948.5949.6054.7853.33
10 56.5560.0058.12
12 70.0068.4867.33
14 75.2976.7977.31
16 79.0080.7481.15
Table 3. Transient permeability test conditions.
Confining Pressure (MPa)Injection Pressure (MPa)
Gaseous StateLiquid State
103, 69
20, 30, 403, 69, 12, 15

