Diagnosis of the Hollow Ball Screw Preload Classification Using Machine Learning


1
Department of Mechatronics Engineering, National Changhua University of Education, No. 1, Chinde Rd., Changhua city, Changhua 500, Taiwan
2
Precision Machinery Research and Development Center, Taichung 40768, Taiwan
*
Author to whom correspondence should be addressed.
Appl. Sci. 2018, 8(7), 1072; https://doi.org/10.3390/app8071072
Submission received: 31 May 2018
/
Revised: 25 June 2018
/
Accepted: 27 June 2018
/
Published: 30 June 2018
(This article belongs to the Special Issue Selected Papers from the 2017 International Conference on Inventions)
Abstract
:The prognostic diagnosis of machine-health status is an emerging research topic. In this study, the diagnostic results of hollow ball screws with various ball-nut preloads were obtained using a machine-learning approach. In this method, ball-screw pretension, oil circulation, and ball-nut preload were considered. A feature extraction was used to determine the hollow ball-screw preload status on the basis of vibration signals, servo-motor speed, servo-motor current signals, and linear scale counts. Preloads with 2%, 4%, and 6% ball screws were predesigned, manufactured, and operated. Signal patterns with various preload features, servo-motor speeds, servo-motor current signals, and linear scale counts were classified using the support vector machine (SVM) algorithm. The features of the vibration signal were classified using the genetic algorithm/k-nearest neighbor (GA/KNN) method. The complex and irregular model of the ball-screw-nut preload could be learned and supervised using the driving motion current, ball-screw speed, linear scale positioning, and vibration signals of the ball screw. The experimental results indicate that the prognostic status of the ball-nut preload can be determined using the proposed methodology. The proposed diagnostic method can be used to prognosticate the health status of the machine tool.
1. Introduction
Precision computer numerical control (CNC) machines are widely used in modern industries for mass production. Recently, many strategies were proposed for the diagnosis of machine status, providing operators with information critical for the extension of the machine’s useful lifespan. The authors of [1] established a system to acquire and analyze vibration signals corresponding to various machine-tool states. The calculated results were saved in a database, and a training model was established using Bayesian classification. The ball screws of CNC machines are widely used in linear actuators, which are used in various types of machinery and equipment. Preloading is an effective method of eliminating backlash and increasing the stiffness of the ball screw for precision motion, which maximizes the productive efficiency [2]. Preload loss leads to a low natural frequency, low stiffness, oscillatory positioning, and a possibility of rapid downtime in the manufacturing process. For a double-nut ball-screw preload, tuning the preload values is time-consuming and requires increased downtime. Thus, the ball-screw-nut preload must be protected during machine operation. The fault diagnosis of acquired signals requires performing a conventional Fourier transform or discrete wavelet transform in the frequency and time domains. The authors of [3] developed a new approach to signal analysis that avoids generating nonphysical results from complex trace formalism [4], defining the concepts of instantaneous amplitude, phase, and frequency such that the original signal could be expressed in terms of a Fourier-like expansion. This process and the definition of the instantaneous frequency were effective for monocomponent signals. However, in many real applications, signals have multiple components and are often corrupted by noise. Recently, the Hilbert–Huang transform (HHT) was applied to diagnose faults and damage in electrical machines, rolling bearings, and tools in mechanical engineering [5,6]. The loss of the ball-screw preload decreases the bandwidth of the frequency response spectrum, and reduces the positioning accuracy. Accordingly, industrial mass-production applications benefit from a lifetime prediction of the ball-screw preload. However, few studies focus on this topic. The HHT involves the time and frequency analysis of engineering applications. However, the complexity of a ball screw with a preload in operation is highly nonlinear and nonstationary. Traditional entropy measurements quantify only the regularity (predictability) of a time series on a single scale. However, no straightforward correlation exists between the regularity and complexity. In our previous study [7], multiscale entropy (MSE) analysis [8] was used to measure the complexity of a ball-nut preload based on the finite length of motor current signals. However, the selective feature of the motor current for the MSE calculation was based on the intrinsic mode function of the empirical mode decomposition technique. Feature extraction for on-line diagnosis is difficult. The MSE computational tool [8] was successfully applied to sound and laser Doppler vibrometer datasets for air-turbine dental handpieces [9]. However, the sound acquired through a microphone is corrupted in a CNC shop-floor environment. Moreover, the cost of the vibration data acquired using the laser Doppler vibrometer is expensive. In this study, the support vector machine (SVM) [10,11,12,13,14,15] algorithm was used to classify the complexity of the finite-length time series of the vibration signals, servo-motor speed, servo-motor current signals, and linear scale counts. The vibration signal was acquired by attaching an accelerometer to the ball nut. SVM analysis with a low classification rate could be used to determine the preload status of the ball screws. The feature patterns of the servo-motor speed, servo-motor current signals, and linear scale counts with various preload statuses, pretension, and/or oil-cooling circulation were determined using the SVM algorithm with a high classification rate. The vibration signal features were then classified using the genetic algorithm/k-nearest neighbor (GA/KNN) method to determine the preload status of the ball screws. The authors of [16] used a systematic data-driven method to trace the root cause of the major problems occurring in the ball screw during the manufacturing process. In this research, the failure signature was identified and classified using various prediction-model-based methods. With trends such as big data, Internet of Things, and smart manufacturing, smart analytics is required to determine the health status of CNC machines. Information on the 2%, 4%, and 6% preload data could be used to prognosticate future preload loss, which could be done using, for example, a self-organizing map. In this paper, the application of the SVM algorithm and GA/KNN model enabled rapid decision-making for the diagnosis of machine status.
2. SVM Method
Many linear classifiers can be used to distinguish between various types of featured data. In the SVM [10,11,12] algorithm, the margin between two separated data types is maximized. This is known as the optimal separating hyperplane, which divides the linear and nonlinear data. The margin boundary is expected to generalize better than other possible boundaries. The SVM algorithm maps the input data into a high-dimension feature space by selecting a suitable kernel function. The SVM algorithm was first used as a supervised learning method. The SVM algorithm included training data on the known preload ball screw nut, and testing data for preload status validation. The general kernel functions for the linear and nonlinear classifiers of the Gauss radius-based function (RBF) are defined as and , respectively, where and denote two distinct sample datasets, and σ represents a tuning variable of the Parzen window.
3. Experiment Set-Up and Results
3.1. Experiment Set-Up
An experimental platform was designed and assembled, as displayed in Figure 1 and Figure 2. The apparatus was fabricated according to the industrial standard for a tapping machine. It had a 2-kW and 3000-rpm servo motor (Delta Electronics, Taiwan); an oil-cooling system of 3 ψ and 220 V, with an accuracy of ±2 °C; a mechanical structure accuracy of 5 μm, with a repeated accuracy of 2 μm; a maximum positioning speed of 48 m/min, with an acceleration of 1× g when the motor speed was 3000 rpm; and a sampling frequency of 5.12 kHz for data acquisition from the acceleration sensor.
The table was set for a traveling distance of 270 mm with reciprocating movement by varying the motor speed from 300 rpm to 900 rpm, with or without oil-cooling circulation and 20-kg payload conditions. The table was driven by a servomotor, followed by a coupler and a single-nut hollow ball screw (Hiwin R-36-16(K3)-FSC-C1-527-855-0.006-H) with various ball-nut preload and pretension levels. The standard ball-screw preload force was determined to be 4% of its maximum dynamic force of 3750 kgf. The maximum static force of the ball-screw preload was 9542 kgf. In this study, the preload percentage of the maximum dynamic force was divided into three categories: 2%, 4%, and 6%. Oversized balls were used in the single-nut ball screw to provide various preload statuses. The speed, acceleration, and S curve were controlled with a CNC controller (LNC-M310i-V) with feedback from a Heidenhain© encoder strip.
A preload adjustable ball-screw mechanism was constructed by the authors of [17] to examine the formula of drag torque and preload of ball screws. Parameters such as the helix angle, contact angle, friction coefficient, ball diameter, sliding direction, and normal contact force of the ball–nut contact were taken into consideration. A new correlation between the preload and no-load drag torque was obtained. The literature includes limited discussions regarding a direct preload sensing mechanism or prognostic diagnosis for a ball screw nut. In general, for a CNC feeding table, the specification of the ball screw preload is selected when the positioning accuracy is determined a priori. The growing demand for machining learning in preload loss diagnosis increased the reliability of ball screws used in CNC machining equipment. In this study, the 4% preload was treated as the standard preload for typical precision motion in industrial applications. Therefore, a 2% preload indicates a preload loss situation, increased mechanical backlash, increased pitted ball trace, low stiffness, and oscillatory position errors. Moreover, the pretension and oil-cooling system on the hollow ball screw were used to achieve thermal rigidity compensation for improving the positioning accuracy. Changes in the aforementioned conditions can be considered as various feature classifications.
3.2. Servo-Motor Current with the Optical Linear Scale
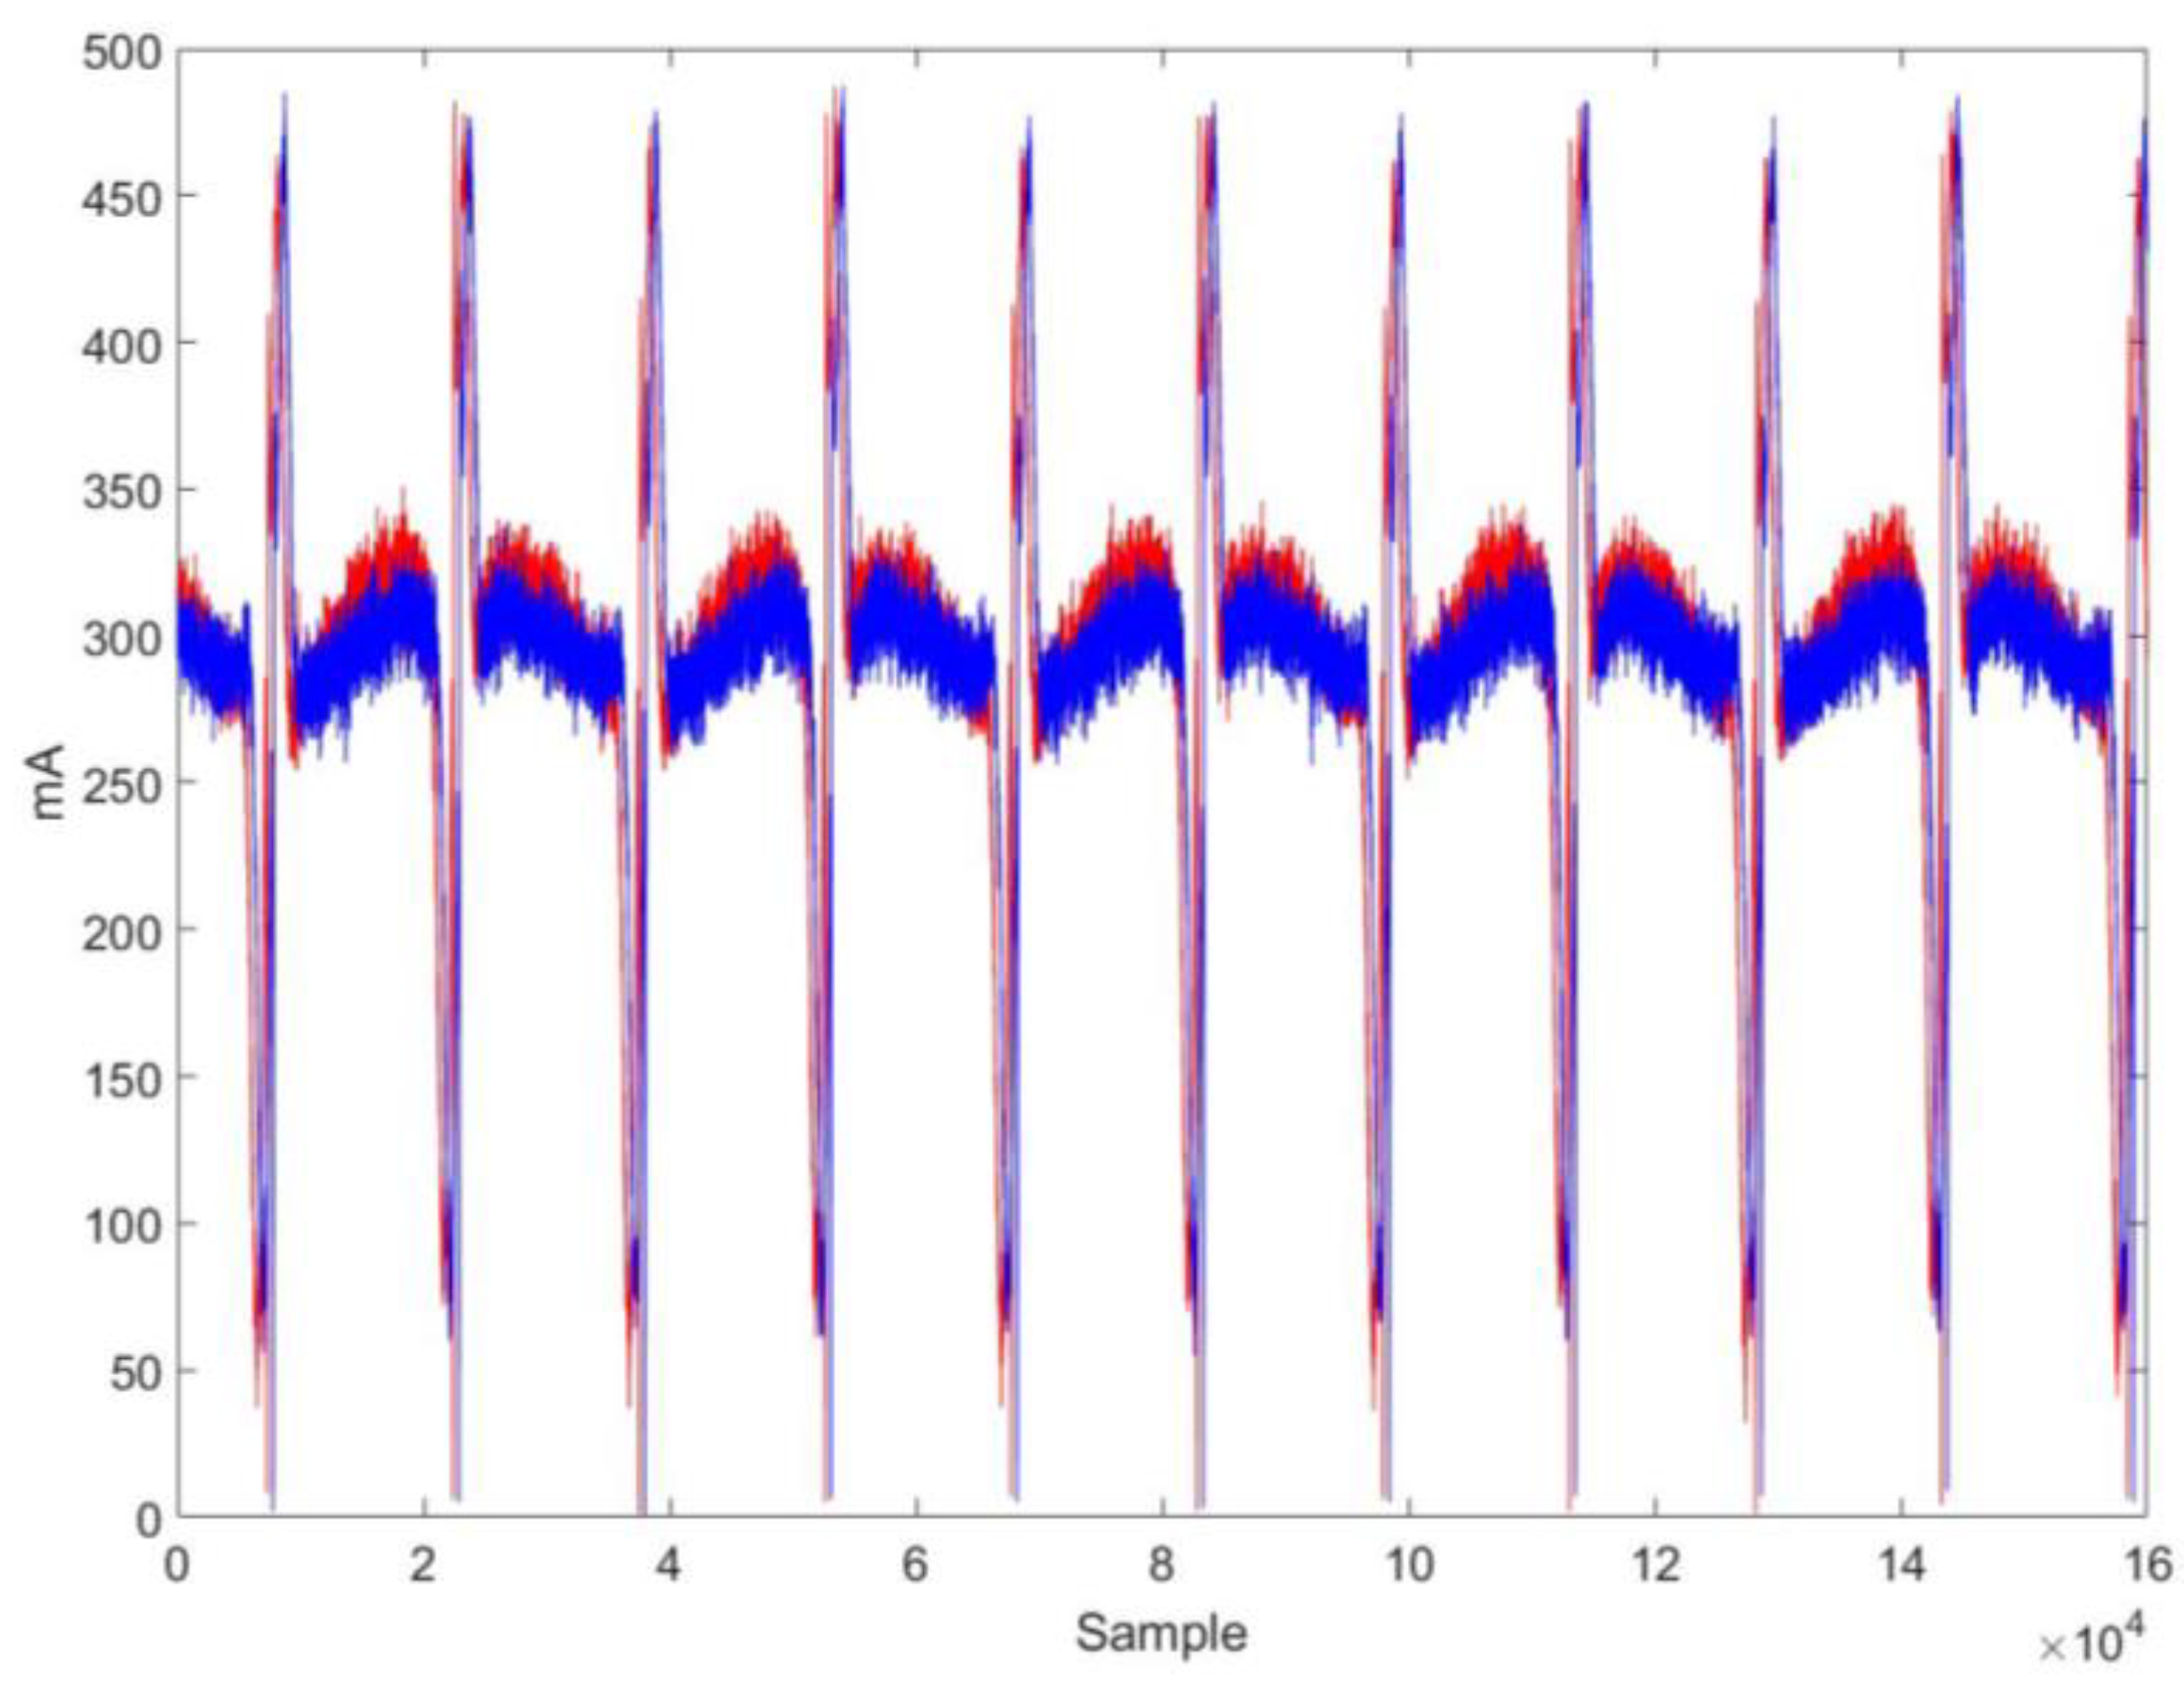
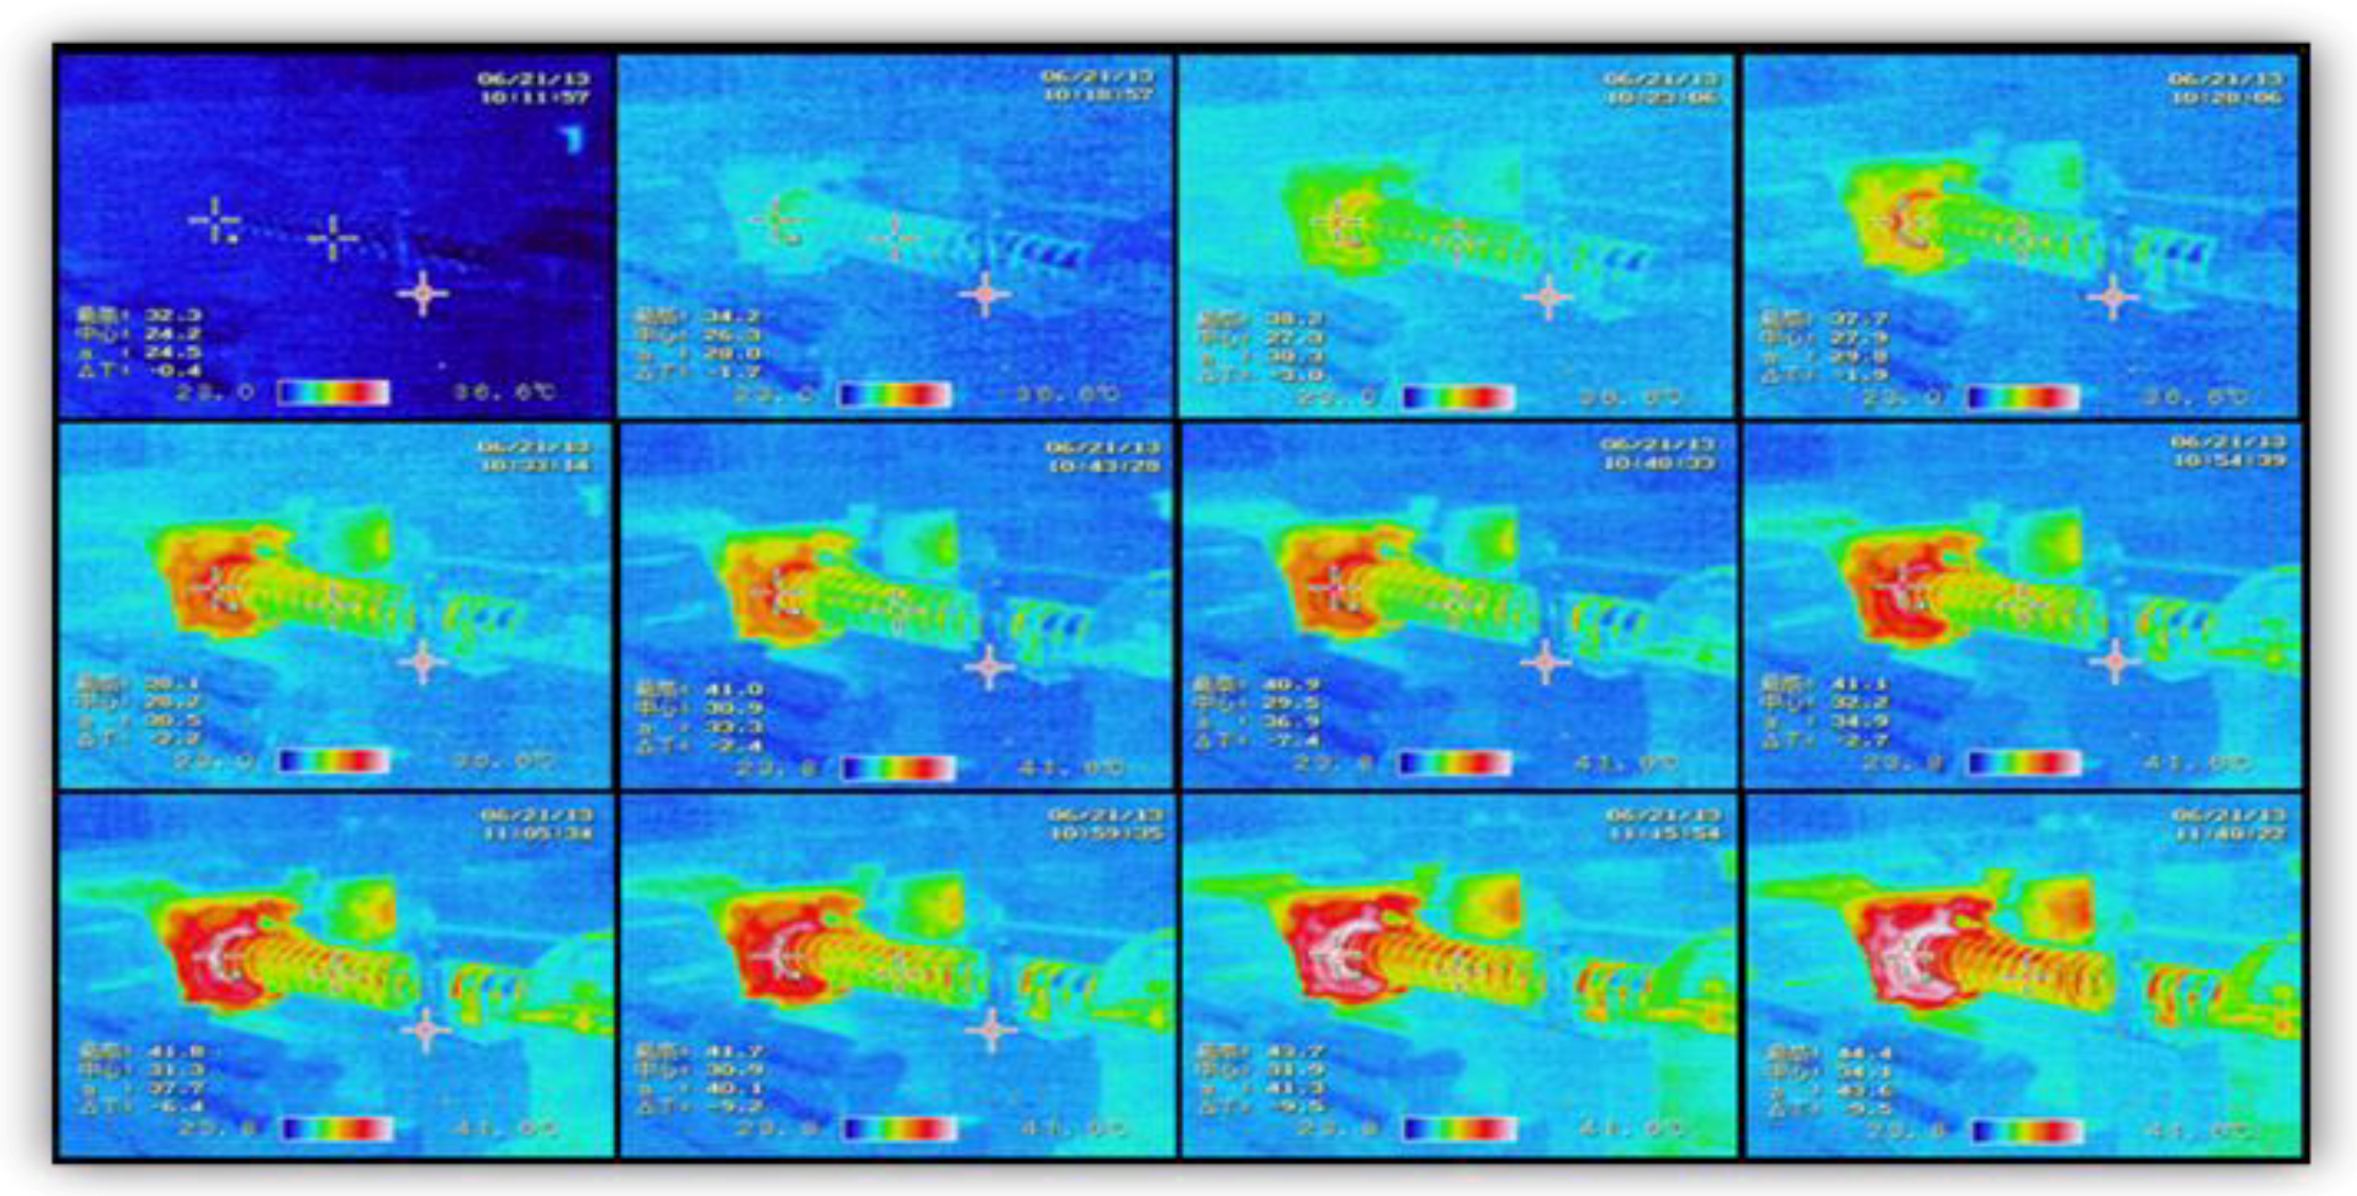
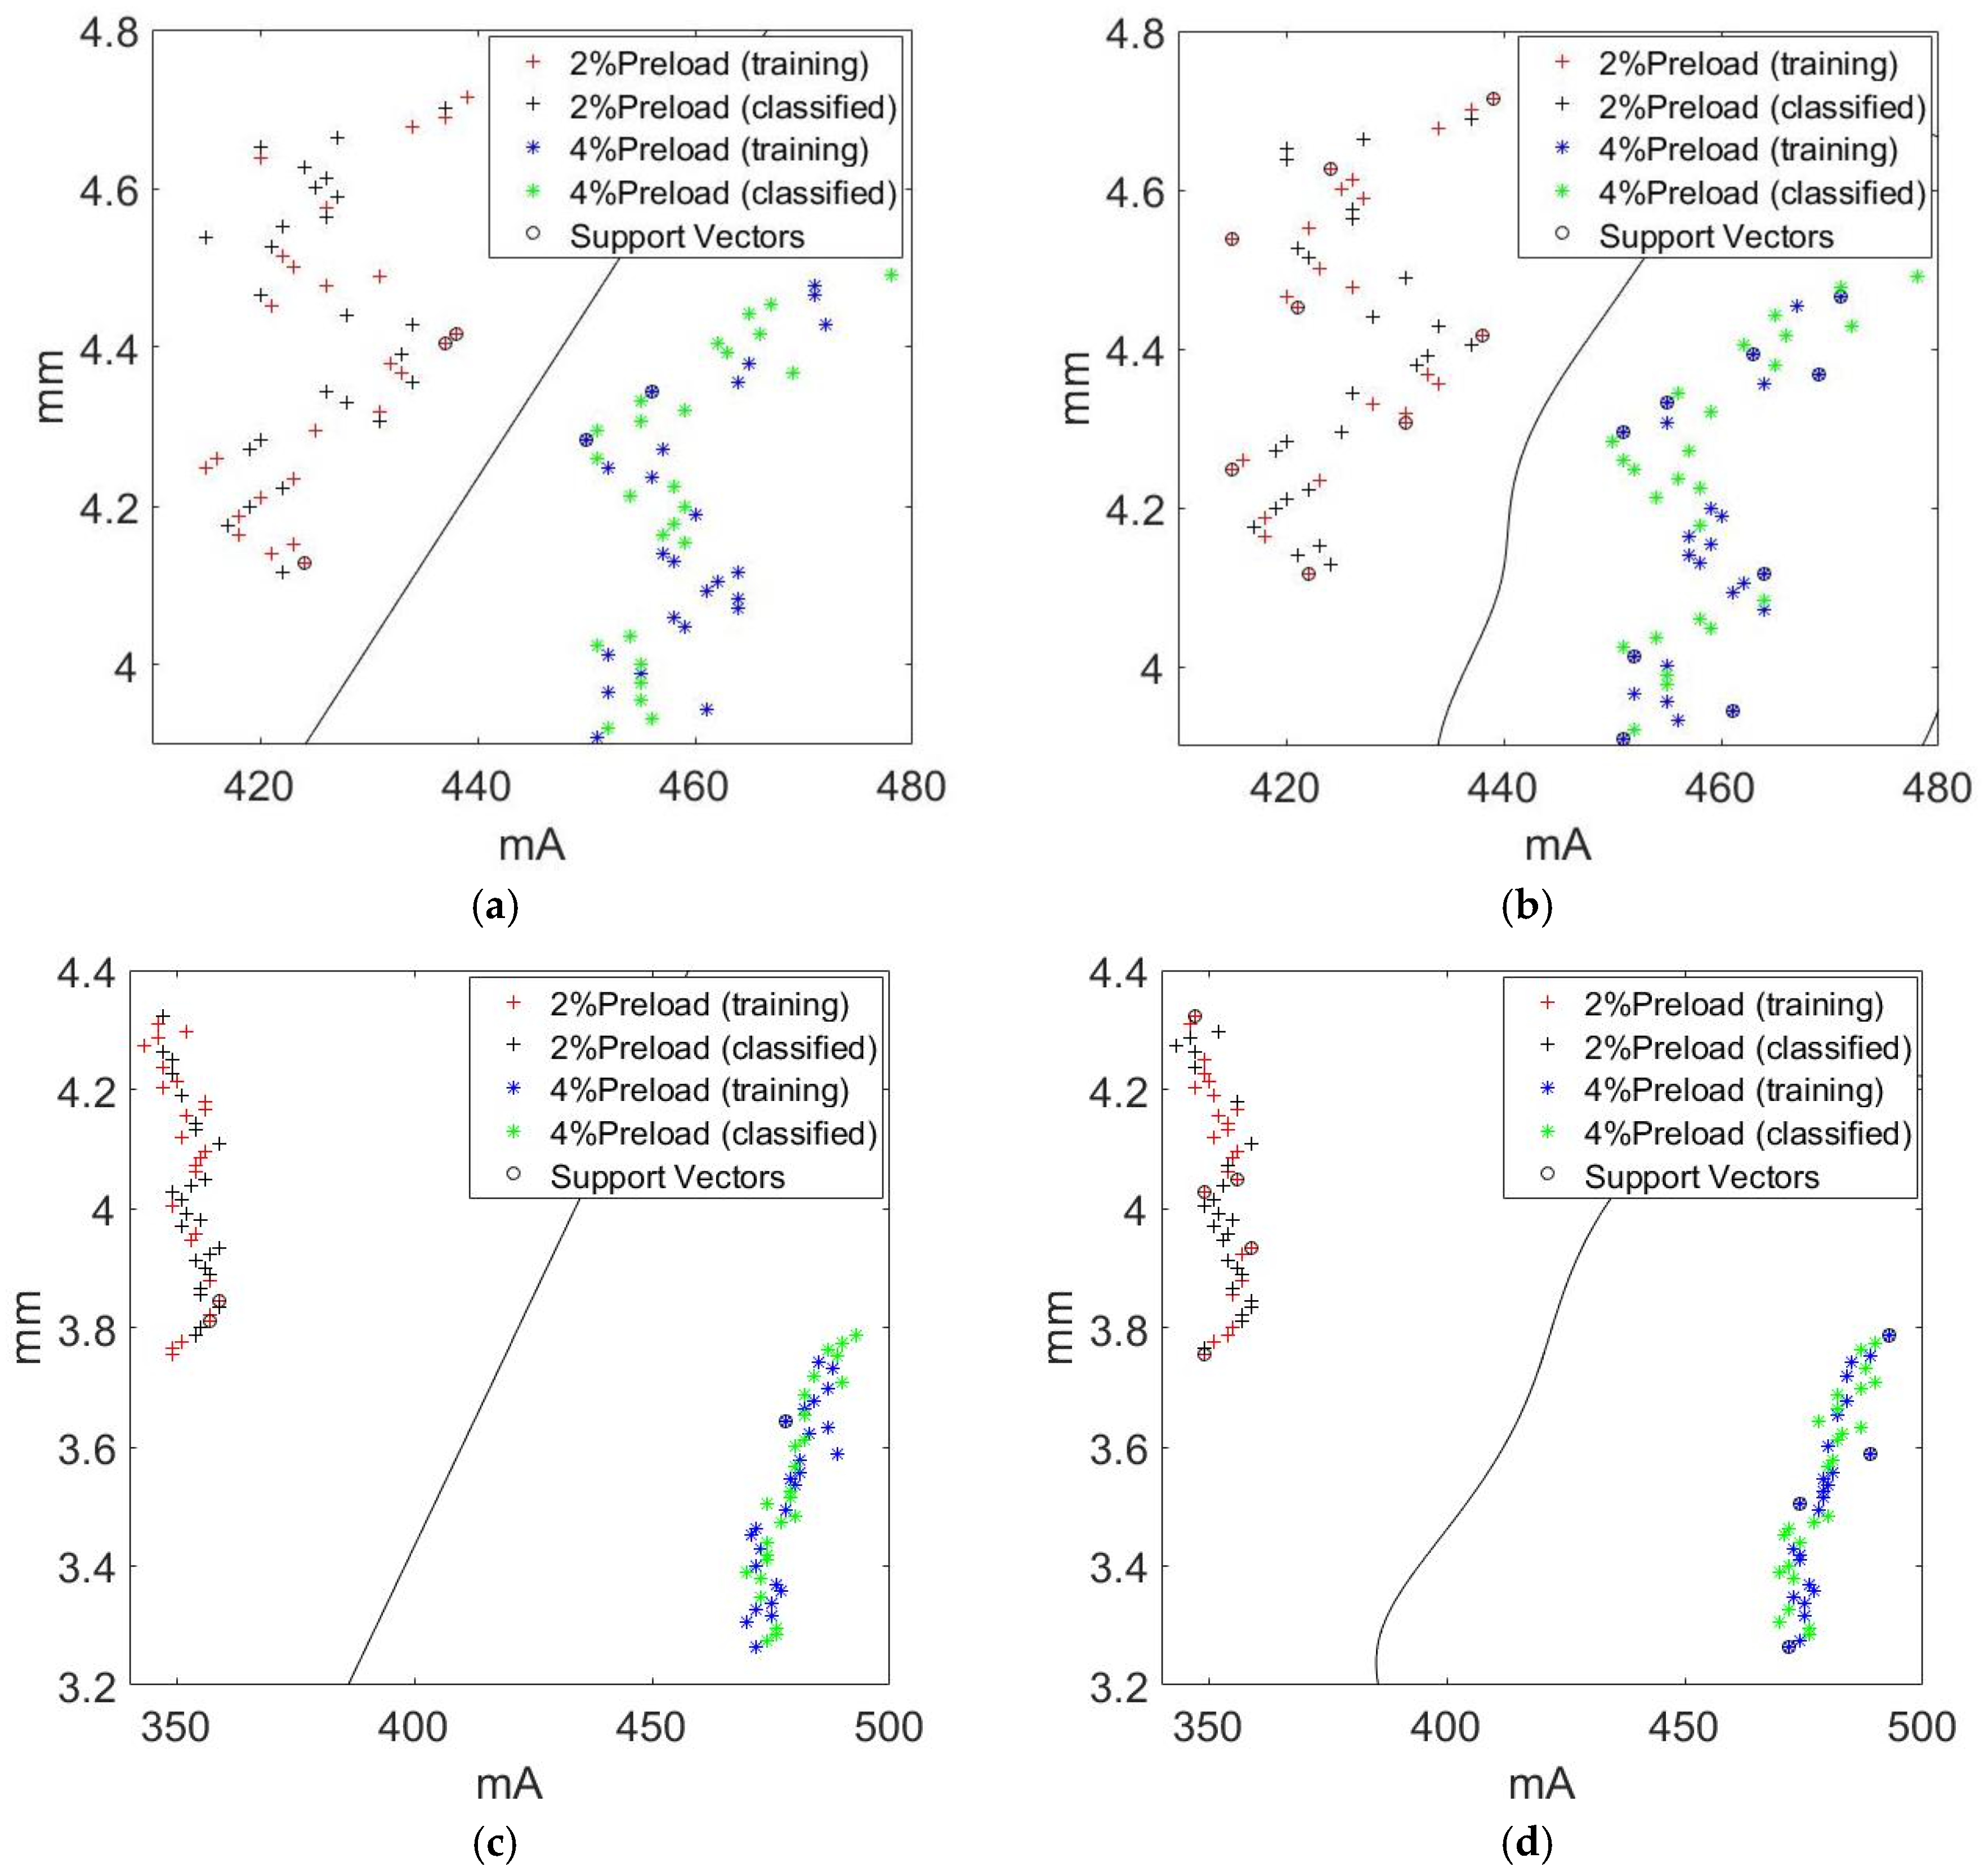
For effective electrical fault predictions, the authors of [18] performed multiclass SVM predictions with the current signal only, vibration only, and vibration and current signals concurrently when the induction motor was running with a mechanical load. For light and high mechanical loads, current signals only could be used to perfectly predict the electrical faults. Figure 3 illustrates the plot of the two servo-motor current signals based on the 4% ball screw preload nut without ball-screw pretension. The motor was running at a speed of 600 rpm with a 20-kg payload for 60 min with and without oil-cooling circulation. The feed motor current with oil-cooling circulation was less than that without cooling. An increasing temperature distribution was created along the ball screw and ball nut (Figure 4) when the operation time of the feed-drive system was long [7]. The high temperature between the balls and the ball race of the ball nut amplified the ball size, and therefore, generated additional contact friction area. This resulted in additional torque current being produced without the help of the cooling system. As depicted in Figure 3, the upper and lower sharp peaks of the 4% ball-nut preload motor current occurred when the feed-drive system was under repetitive motion for 60 min, which indicated reverse motion because of the acceleration and deceleration commands. The acquired signals were feedforward, and backward signals that contained information regarding the peak servo current value were associated with the linear scale signals. Figure 5 and Figure 6 display the training and testing signals, respectively, of the sampled data for the SVM analysis based on the 25 forward and backward signals of the maximum peak value. The hyperplane in Figure 5 divided the 2% (red + mark) and 4% (green * mark) ball-nut preload ball screws into two half-spaces when the table was running. Without oil-cooling circulation, the Fisher criterion score was high with low dispersion and high aggregation of the current or positioning feature (Figure 6). The classification rate was 100% because the peak current signal region associated with the positioning linear scale signals was used. The Fisher criterion, dispersion, and aggregation from the motor current, and the position data had high scores whenever the preload was changed or a pretension of 5 μ was applied.
3.3. Vibration Signal
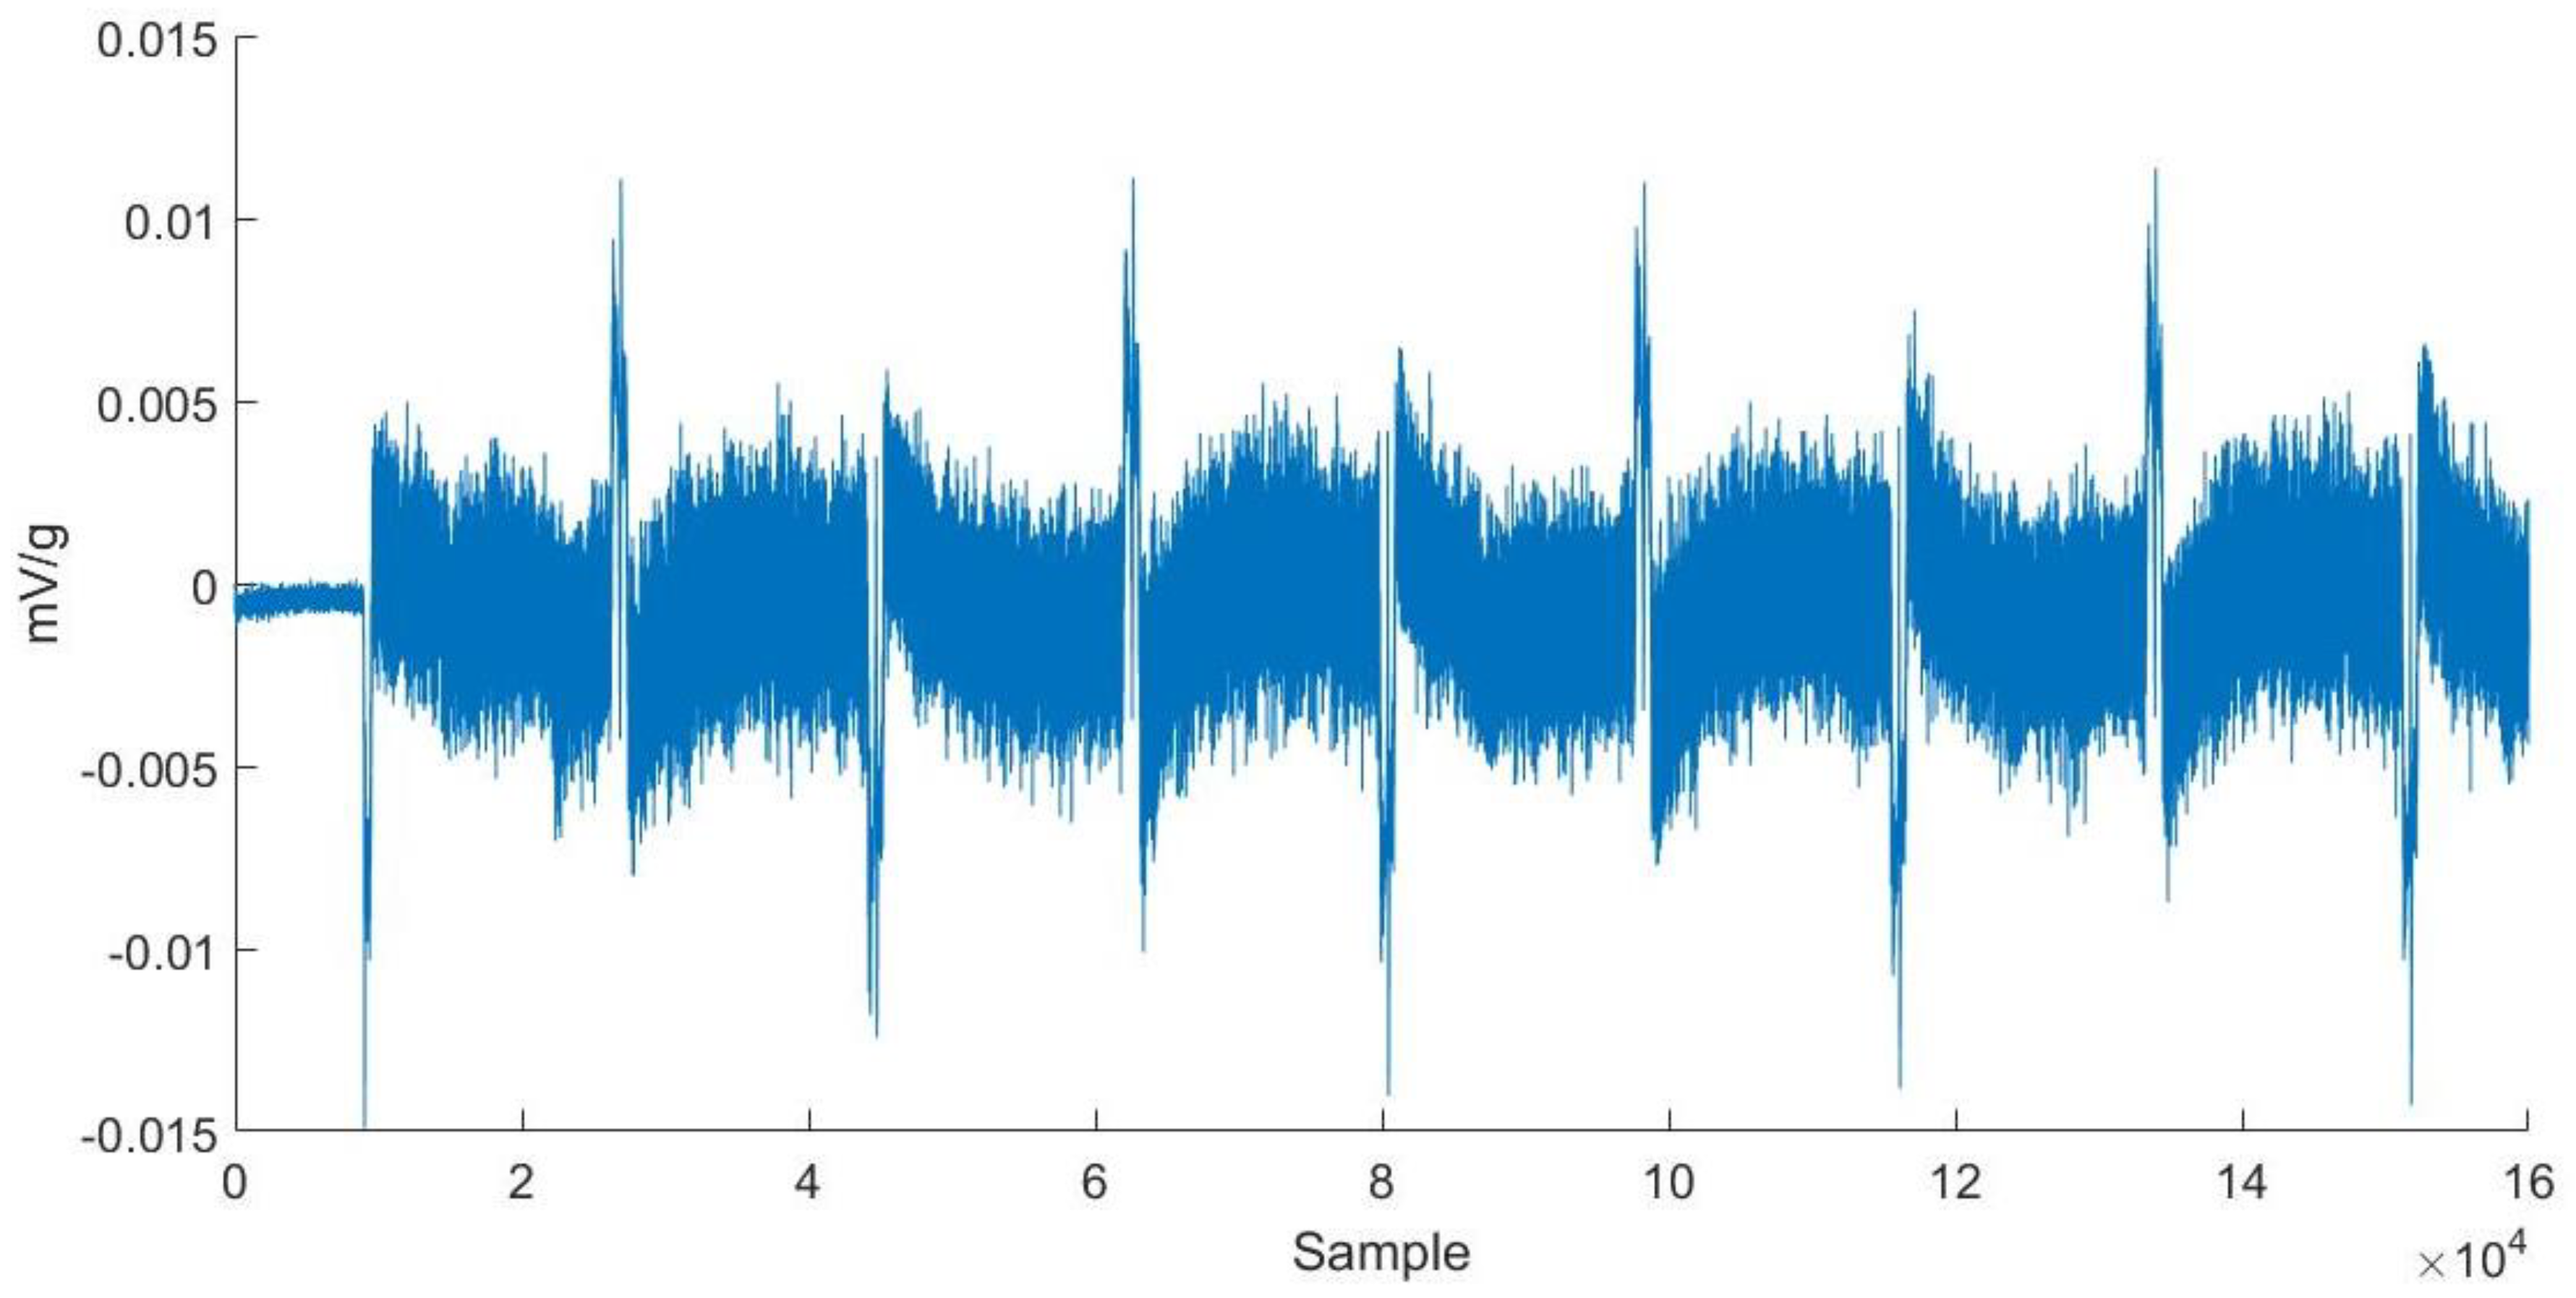
Accelerometer sensors are widely used for diagnosing machine health status in rolling element bearings [14]. Various localized defects and loading conditions with a range of rotation speeds were used to analyze the behavior of vibration signals for the classification of bearing faults. The least-squares SVM model with two root-mean-square (RMS) input features and kurtosis was used to classify the types of bearing faults according to the defect size. Another data-driven approach was presented by the authors of [15] for detecting the precursor of power-electronics converter failures in power-conversion systems. Several statistical features were extracted followed by feature selection. It must be determined whether only one accelerometer feature signal can be used to diagnose the preload status. Figure 7 represents the plots of the vibration signals acquired from Figure 1b. The linear SVM kernel function and nonlinear RBF SVM kernel function (Figure 5 and Figure 6) were deployed in Figure 8. Classification rates of 74% and 78% were obtained for the testing and training data, respectively, based on the 25 forward and backward signals of the maximum peak value under a rotation speed of 300 rpm, pretension of 10 μ, and operation time of 5 min.
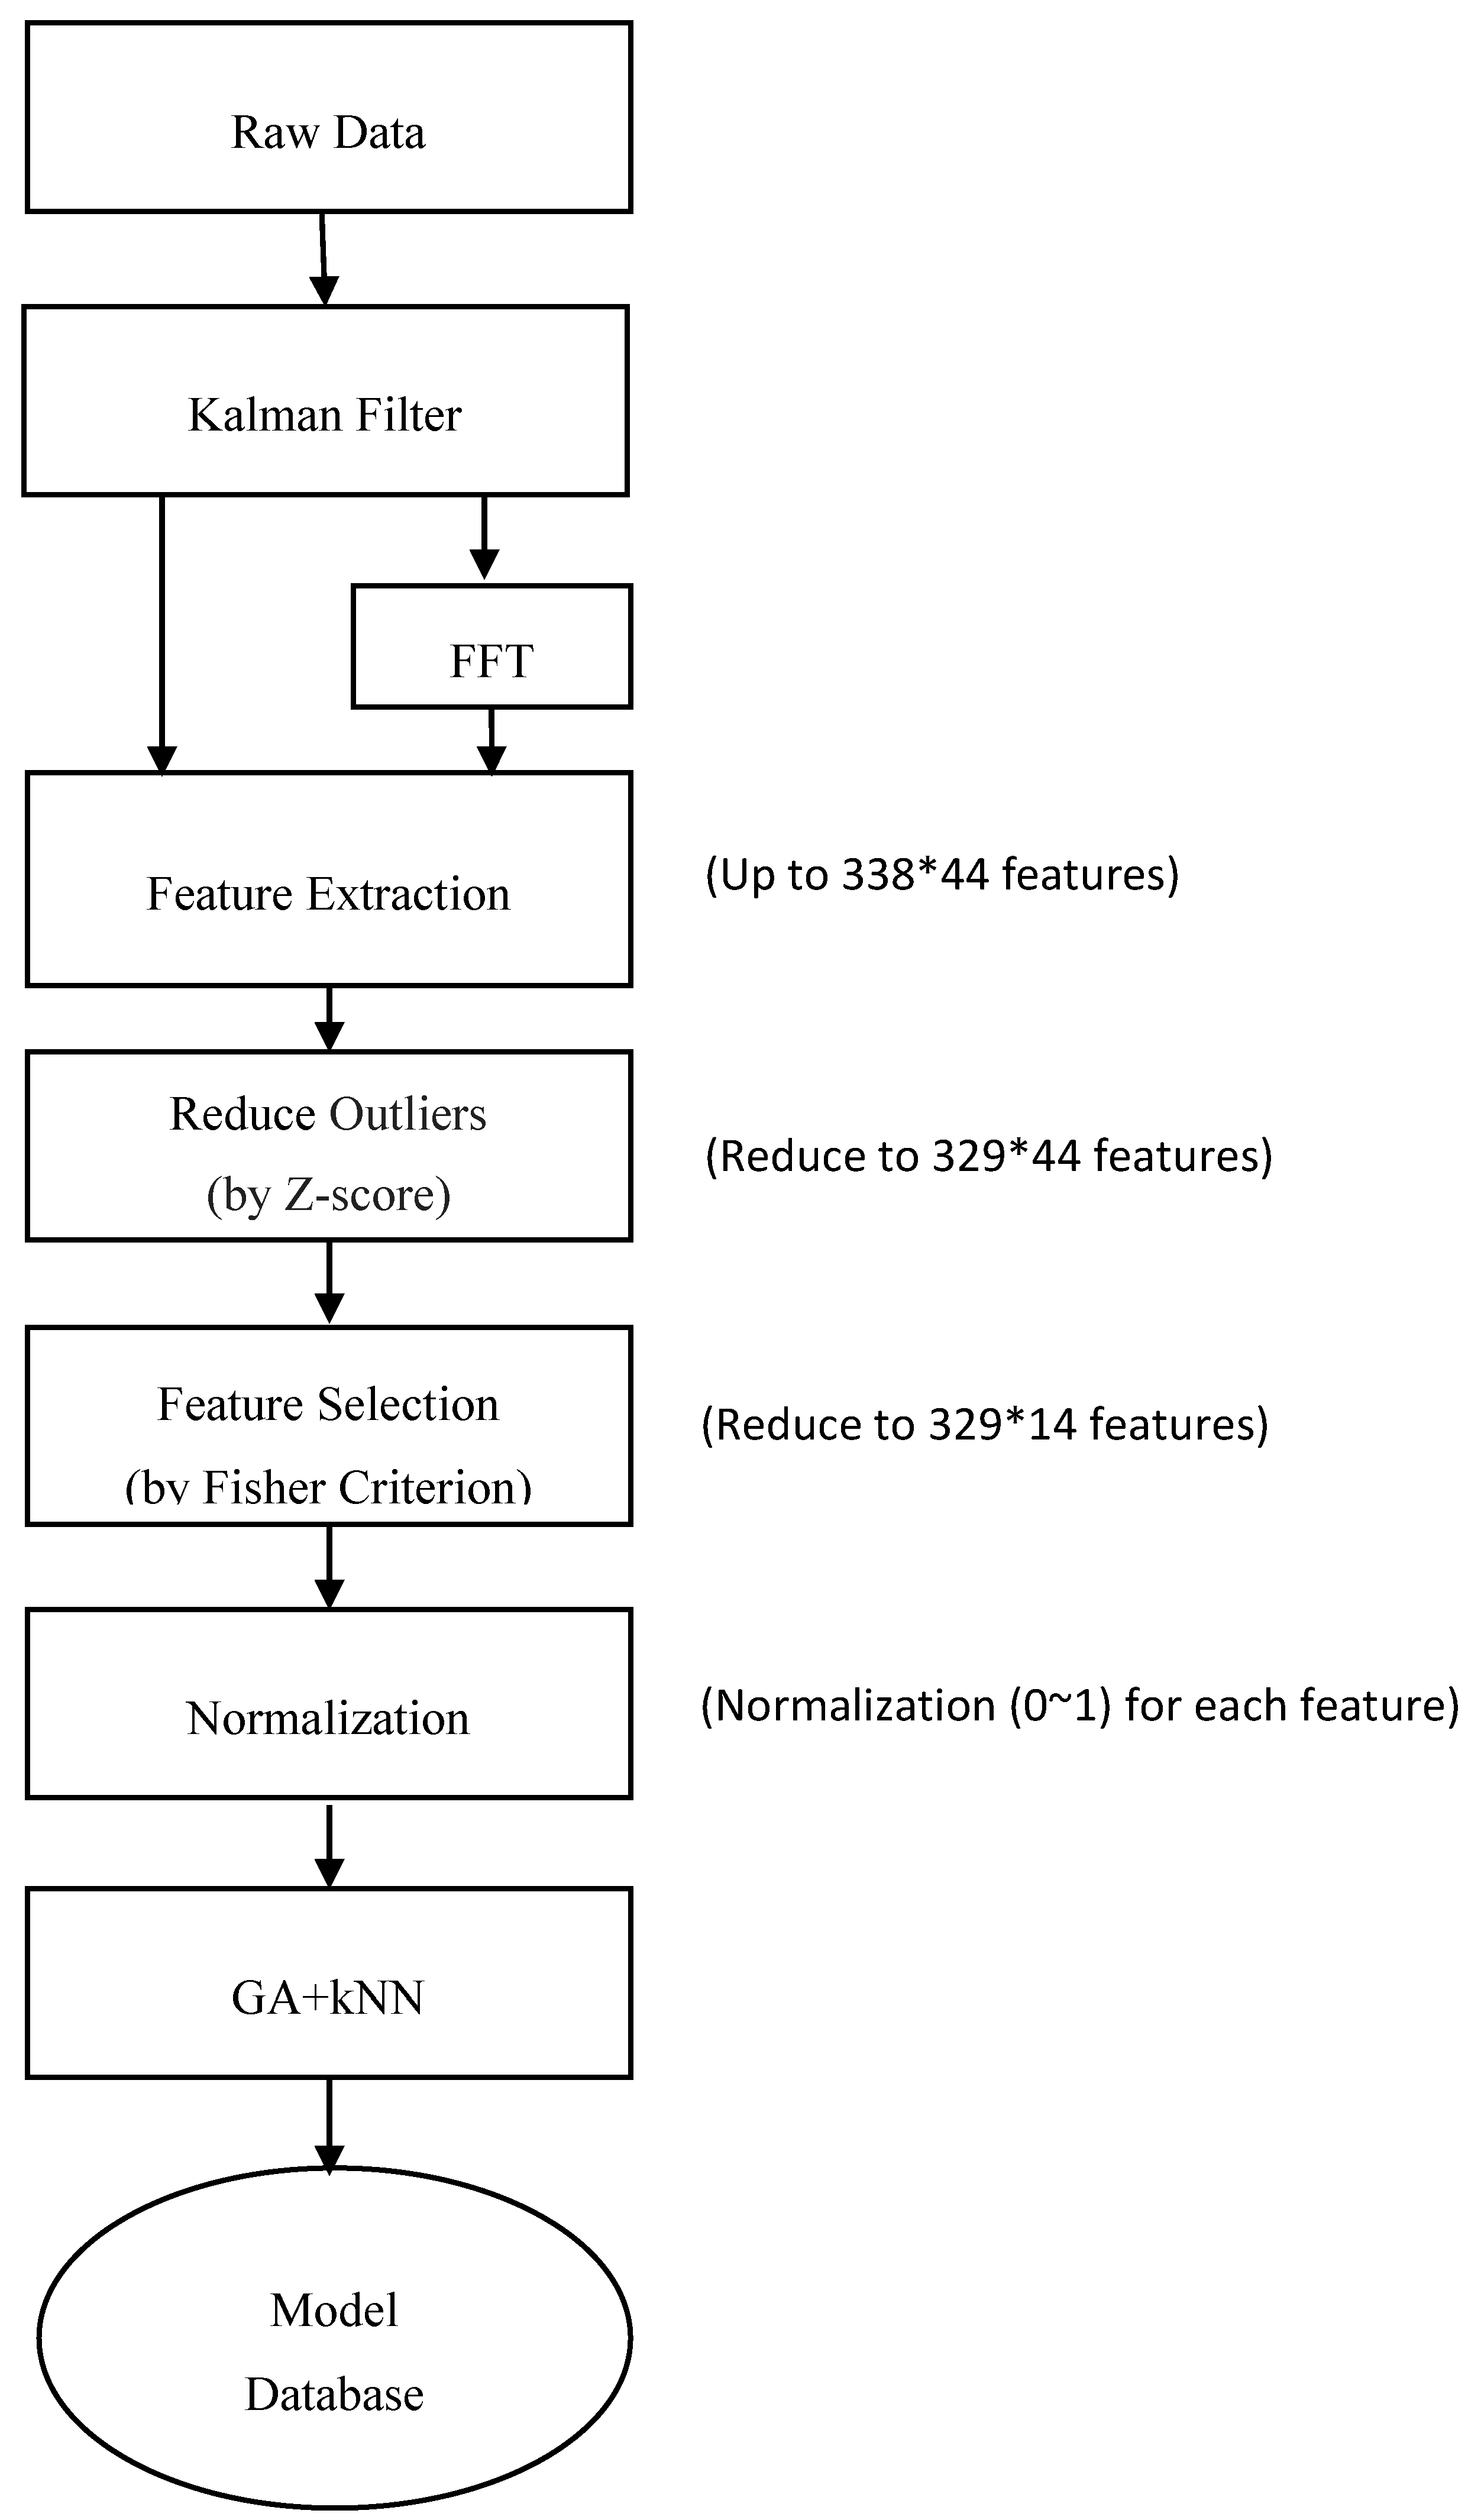
The aim of this study was to produce a classifier or a machine-learning method that could be suitably used for various ball-nut preloads. Figure 9 represents the flow chart of the prognostic diagnosis based on feature extraction and the GA/KNN classifier model.
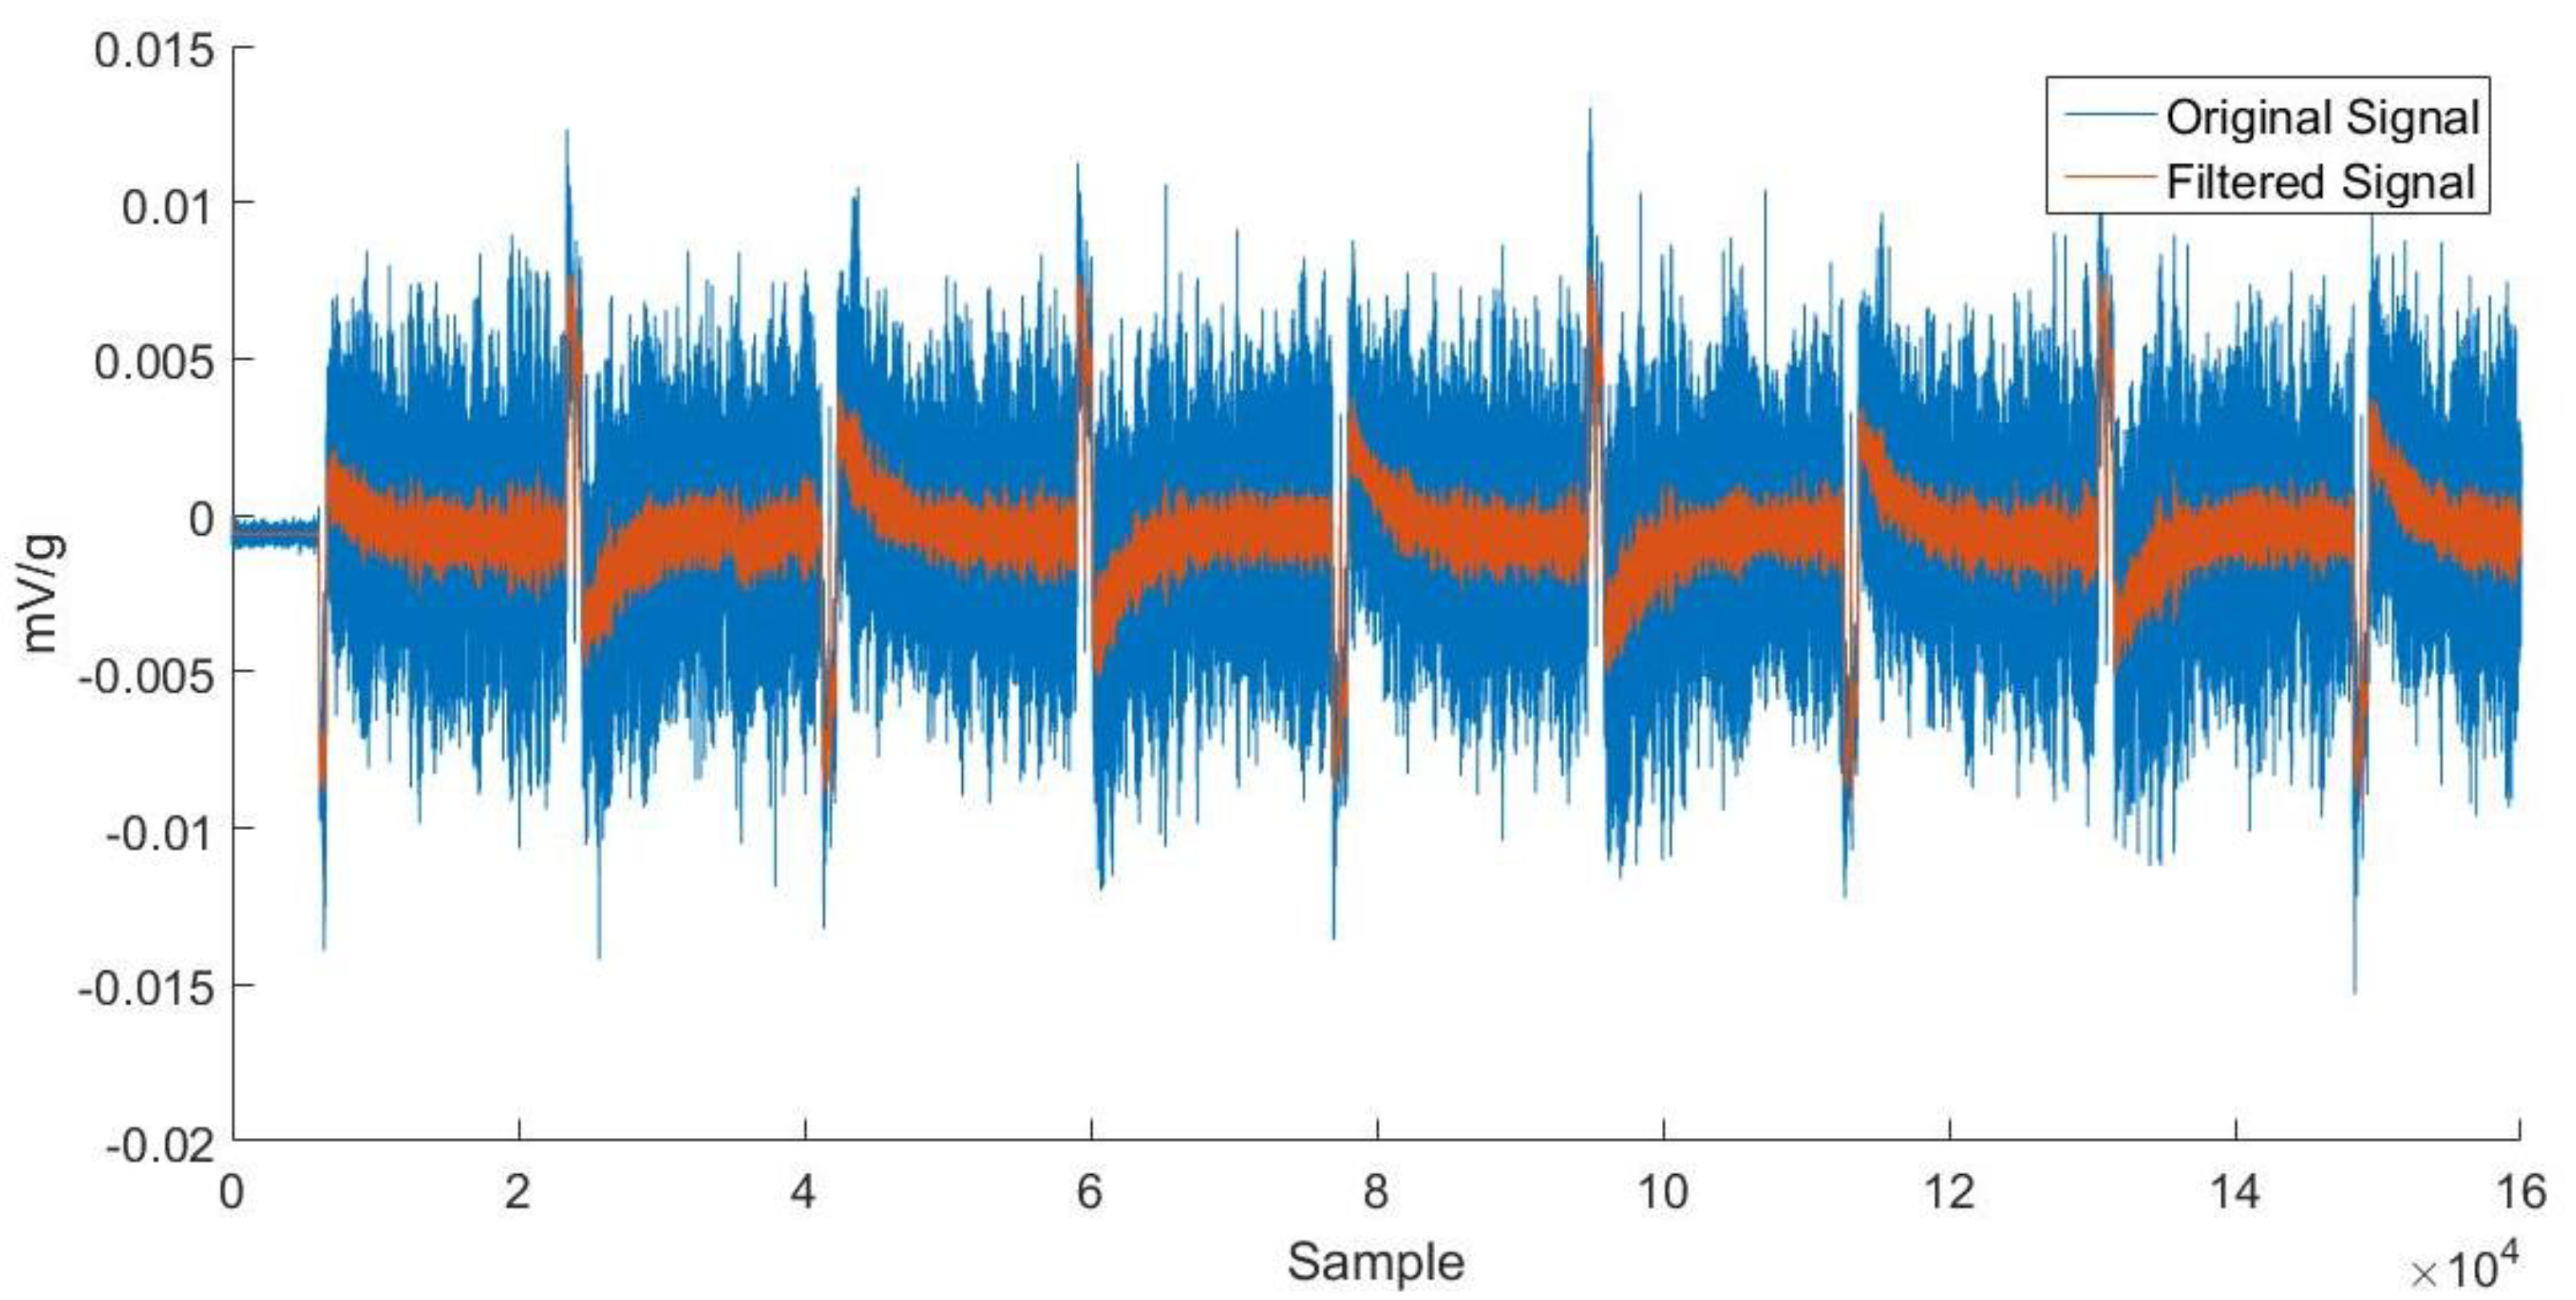
Raw data of 1,620,992 vibration signals were acquired and then filtered using the Kalman filter, since the Kalman filter is the Bayesian optimal solution to the problem of sequentially estimating the states of a dynamical system in which the state evolution and measurement processes are both linear and Gaussian [19]. The Kalman-filtering algorithm has low computation complexity, and can be implemented in digital signal-processing hardware for a real-time system. A satisfactory classification rate could not be obtained with the SVM for the data-acquisition region around the peak signal. The constant speed profile was redirected for the duration of machine learning when the commanded ball-screw motion stage was cruising with a constant speed. As displayed in Figure 10, the smooth vibration signals were divided into 338 segments after filtering. Each segment was labeled as one cell with its own feature vector. Each feature vector contained six feature elements, namely the RMS, kurtosis, variance, crest factor, standard deviation, and skewness of the vibration signals. The feature vectors included an additional 30 elements based on the fast Fourier transform of the vibration signal. The frequency spectrum from 1 kHz to 2.56 kHz was divided into 30 segments. The average frequency amplitude of each frequency segment (covering a range of 85.3 Hz) was calculated based on all the frequencies associated with the segment. Finally, the power spectral density of the vibration signal based on the amplitude and shape of the frequency segments’ average, standard deviation, skewness, and kurtosis were all augmented with an additional eight features. Thus, 44 features constituted the feature vector for the 338 cells.
Before feature extraction from the 338 cells using the 44 features in each cell’s feature vector, outliers (extreme values) were removed from the cells by using the Z-score technique [20]. The criterion for Z-score computation was set at three times the standard deviation. Point A was treated as an outlier after Z-score computation (Figure 11). Therefore, nine cells were removed from the original 338 cells. The remaining 329 cells were used to extract the representative ball-screw quantitative values, which reflected the ball-nut preload behavior.
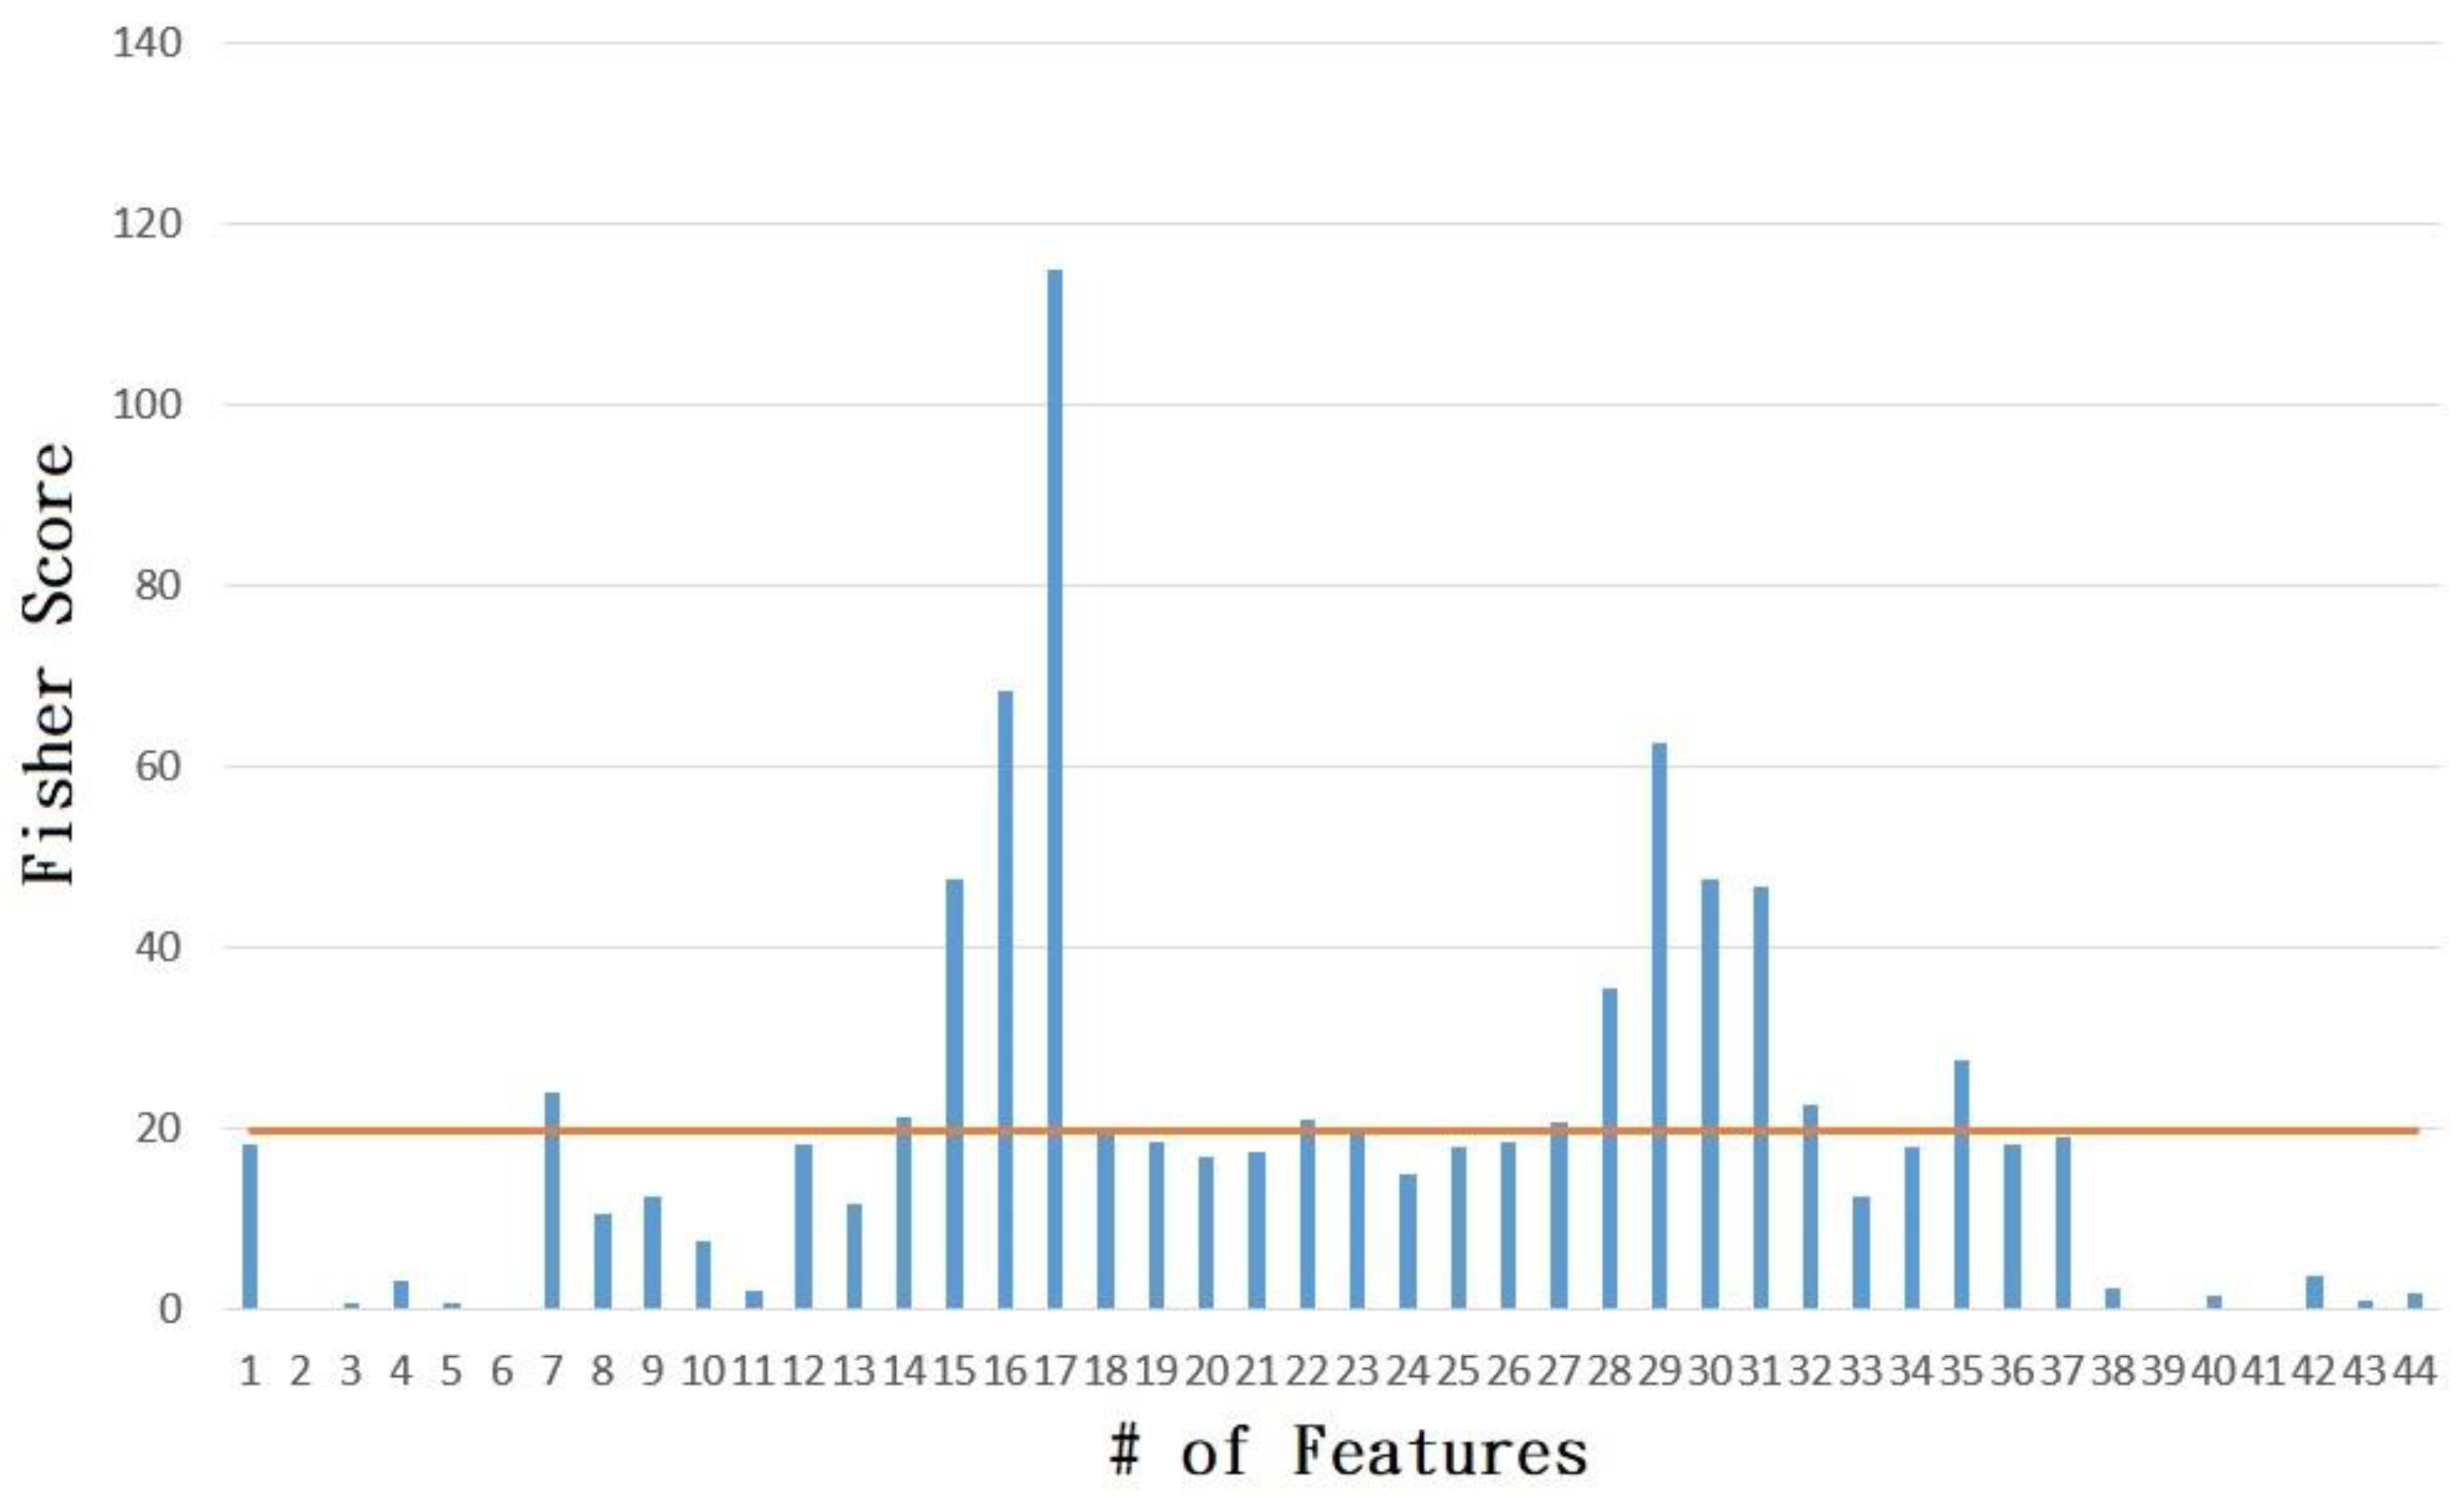
Fisher’s criteria were used to select the significant features from the 44 features that could distinguish between the 2% preload loss and the 4% preload (normal preload) or 6% preload (extra preload). Using all the extracted features for assessing the prognostic-diagnosis health model is unfeasible and inefficient. Some extracted features have a low contribution in classification models. Therefore, the Fisher criterion score (Equation (1)) was selected to determine significant features from the 44 feature vectors. Each feature had its own score, which was calculated as follows:
where μ and indicate the mean and standard deviation, respectively, of the same class, and 1 and 2 represent classes 1 and 2, respectively.
The selection of the remaining 14 features that could distinguish between the various ball-nut preloads or ball-screw pretensions is illustrated in Figure 12. The orange line in Figure 12 denotes the average score of the 44 features. For the 329 cells, 329 × 14 arrays were constituted. Each cell contained 14 column features, including the 2% and 4% preloads. The N(μ, ) distribution of the 329 × 14 arrays was executed into a value between [0,1]. The formula as shown in Equation (2) for the new value of each cell feature was as follows:
This normalization process was preserved as a new 329 × 14 array. The new normalized array could then be used in the GA/KNN classifier model.
The KNN data-mining algorithm was used to classify the normalized dataset of the 329 × 14 array for the 2% and 4% preloads. The KNN algorithm was selected because this algorithm is the most commonly used method for datasets of discrete series [21]. The KNN classifier is a simple but effective algorithm that classifies a testing sample based on its similarity to the labeled training samples. For a new testing feature, the five nearest neighbors from the training set are first identified according to Euclidean distance. Secondly, a voting mechanism assigns the class label with the largest vote to the testing sample. The voting mechanism may encounter a dilemma when the distance calculation is vague. This may cause the aggregation of two different classes when a new feature is identified. In the genetic algorithm, a weighting coefficient was added to the distance calculation for the 14 features (Equation (3)). The number of genes was 50, with a mutation rate of 0.08 and a crossover rate of 0.6 for the computation of 100 generations.
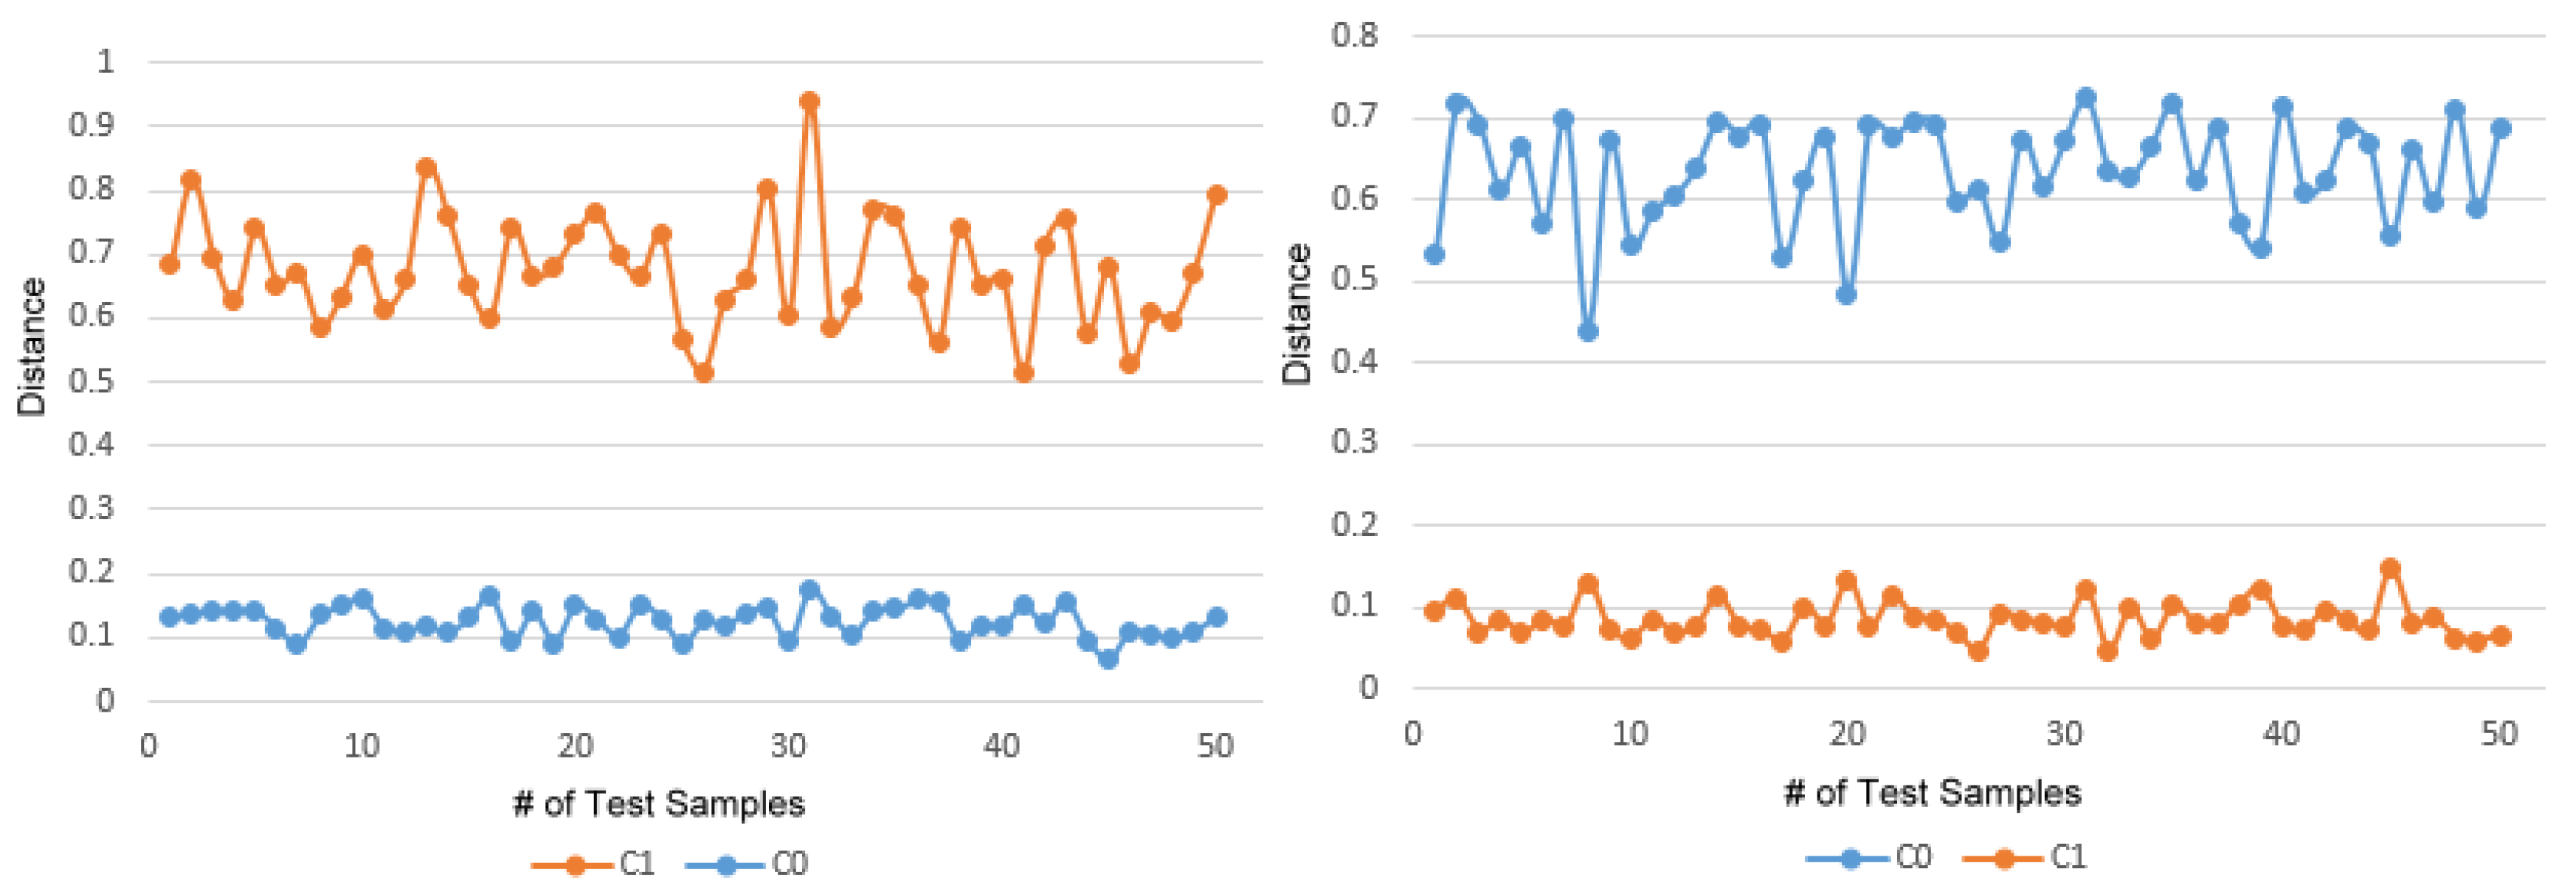
Figure 13 displays the classification rate for the C0 and C1 classes. The training set had 229 cells, and the test set comprised 100 cells. As displayed in the left image of Figure 13, when the tested data for the 4% preload was close to the trained set, the C0 class was denoted. As displayed in the right image of Figure 13, when the distance between the tested data for the 2% preload and the trained set was small, the C1 class was denoted. Table 1 shows the confusion matrix for the test set. A classification rate of 100% was achieved for the vibration signals using the GA/KNN.
The various ball-nut preloads were successfully classified using the SVM and GA/KNN algorithms with various signals. The vibration signal profile obtained after using the Kalman filter, and the motor current profile without using the Kalman filter are illustrated in Figure 3 and Figure 10, respectively. The 2% and 4% preloads could be easily classified when raw data were carefully selected using the SVM and GA/KNN methods.
4. Conclusions
In this research, signal analysis techniques were used with SVM and GA/KNN algorithms to detect the preload status of a hollow ball screw. Various ball-nut preloads in a one-axis machine tool feed-drive table were studied. Experimental results aimed to achieve the prognosis of the ball-screw preload loss when a CNC table was used for a traveling distance with reciprocating movement, and operated within a few minutes. Using the motor peak current information, both the nonlinear SVM method and linear hyperplane with 100% classification rate were used to diagnose the health status of the feed-drive machinery after the data regarding reverse table motion were acquired. A measure of the vibrations using feature extraction was developed with the GA/KNN method. The experimental results indicated that the sensed vibration signals of the preload features were extracted with a low classification rate by use of the SVM, while a 100% classification rate was achieved using the GA/KNN method when the CNC table was operated for a few minutes. Heuristically, with more sensors, the SVM can facilitate high-precision classification. In this work, only the monitoring and diagnosis of the preload loss were processed through the use of motor current, motor speed (sensor-less), optical linear scale, and vibration (sensor-rich) signals. A systematic methodology for ball-screw prognosis, health assessment, and remaining useful life was proposed by the authors of [22]. Future studies will compare various sensed signals using new machine-learning processes.
Author Contributions
Y.-C.H. conceived and designed the experiments, and wrote the paper; C.-H.K. performed the experiments, and analyzed the SVM data; and S.-J.C. performed the GA/KNN data analytics.
Funding
This research received the funding from the Ministry of Science and Technology.
Acknowledgments
The authors thank the Ministry of Science and Technology for financially supporting this research under Grant MOST 106-2221-E-018-013MY2.
Conflicts of Interest
The authors declare no conflict of interest.
References
- Huang, C.; Chen, S.; Liou, H.; Wang, W.; Chen, L.; Huang, T.; Hou, K. A machine tool performance monitoring system for use on common hand-held devices. J. Chin. Soc. Mech. Eng. 2009, 30, 323–331. [Google Scholar]
- Shimoda, H. Stiffness analysis of ball screws-influence of load distribution and manufacturing error. Int. J. Jan. Soc. Precis. Eng. 1999, 33, 168–172. [Google Scholar]
- Huang, N.E.; Shen, Z.; Long, S.R.; Wu, M.C.; Shih, H.H.; Zheng, Q.; Yen, N.-C.; Tung, C.C.; Liu, H.H. The empirical mode decomposition and the hilbert spectrum for nonlinear and nonstationary time series analysis. Proc. R. Soc. A 1998, 454, 903–995. [Google Scholar] [CrossRef]
- Gabor, D. Theory of communication. Jt. Inf. Exch. Environ. 1946, 93, 429–457. [Google Scholar] [CrossRef]
- Antonino-Daviu, J.; Rodriguez, P.J.; Riera-Guasp, M.; Arkkio, A.; Roger-Folch, J.; Pérez, R.B. Transient detection of eccentricity-related components in induction motors through the hilbert–huang transform. Energy Convers. Manag. 2009, 50, 1810–1820. [Google Scholar] [CrossRef]
- Peng, Z.K.; Tse, P.W.; Chu, F.L. A comparison study of improved hilbert–huang transform and wavelet transform: Application to fault diagnosis for rolling bearing. Mech. Syst. Signal Process. 2005, 19, 974–988. [Google Scholar] [CrossRef]
- Huang, Y.-C.; Sun, S.-L.; Peng, K.-H. Ball Nut Preload Diagnosis of the Hollow Ball Screw through Sensed Current Signals. Int. J. Autom. Smart Technol. 2014, 4, 134–142. [Google Scholar]
- Costa, M.; Goldberger, A.L.; Peng, C.K. Multiscale entropy analysis of biological signals. Phys. Rev. E 2005, 71, 021906. [Google Scholar] [CrossRef] [PubMed]
- Huang, Y.-C.; Liu, C.-C.; Chuo, P.-C. Prognostic Diagnosis of the Health Status of an Air-Turbine Dental Handpiece Rotor by Using Sound and Vibration Signals. J. Vibroeng. 2016, 18, 1514–1524. [Google Scholar]
- Gunn, S.R. Support Vector Machines for Classification and Regression; Technical Report; Faculty of Engineering, Science and Mathematics School of Electronics and Computer Science, University of Southampton: Southampton, UK, 1998. [Google Scholar]
- Smola, A.; Vishwanathan, S.V.N. Introduction to Machine Learning; Cambridge University Press: Cambridge, UK, 2008. [Google Scholar]
- Cortes, C.; Vapnik, V.M. Support-vector networks. Mach. Learn. 1995, 20, 273–297. [Google Scholar] [CrossRef] [Green Version]
- Wang, S.J.; Mathew, A.; Chen, Y.; Xi, L.F.; Ma, L.; Lee, J. Empirical analysis of support vector machine ensemble classifiers. Expert Syst. Appl. 2009, 36, 6466–6476. [Google Scholar] [CrossRef] [Green Version]
- Aditya Shastry, K.; Sanjay, H.A.; Deexith, G. Quadratic-radial-basis-function-kernel for classifying multi-class agricultural datasets with continuous attributes. Appl. Soft Comput. 2017, 58, 65–74. [Google Scholar] [CrossRef]
- Patel, J.P.; Upadhyay, S.H. Comparison between Artificial Neural Network and Support Vector Method for a Fault Diagnostics in Rolling Element Bearings. Sci. Direct Procedia Eng. 2016, 144, 390–397. [Google Scholar] [CrossRef]
- Jin, W.; Chen, Y.; Lee, J. Methodology for ballscrew component health assessment and failure analysis. In Proceedings of the ASME International Manufacturing Science and Engineering Conference MSEC2013, Madison, WI, USA, 10–14 June 2013. [Google Scholar]
- Zhou, C.-G.; Feng, H.-T.; Chen, Z.-T.; Ou, Y. Correlation between preload and no-load drag torque of ball screws. Int. J. Mach. Tools Manuf. 2016, 102, 35–40. [Google Scholar] [CrossRef]
- Gangsar, P.; Tiwari, R. Comparative investigation of vibration and current monitoring for prediction of mechanical and electrical fault in induction motor based on multiclass-support vector machine algorithms. Mech. Syst. Signal Process. 2017, 94, 464–481. [Google Scholar] [CrossRef]
- Kovvali, N.; Banavar, M.; Spanias, A. An Introduction to Kalman Filtering with MATLAB Examples; Morgan & Claypool Publishers: San Rafael, CA, USA, 2014. [Google Scholar]
- Meyer-Bäese, A.; Schmid, V. Pattern Recognition and Signal Analysis in Medical Imaging; Elsevier Inc.: New York, NY, USA, 2014; pp. 22–63. [Google Scholar]
- Shi, Z.; Liu, Z.; Lee, J. An auto-associative redidue based approach for raiyway point system fault detection and diagnosis. Measurement 2018, 119, 246–258. [Google Scholar] [CrossRef]
- Li, P.; Jia, X.; Feng, J.; Davari, H.; Qiao, G.; Hwang, Y.; Lee, J. Prognosability study of ball screw degradation using systemic methodology. Mech. Syst. Signal Process. 2018, 109, 45–57. [Google Scholar] [CrossRef]
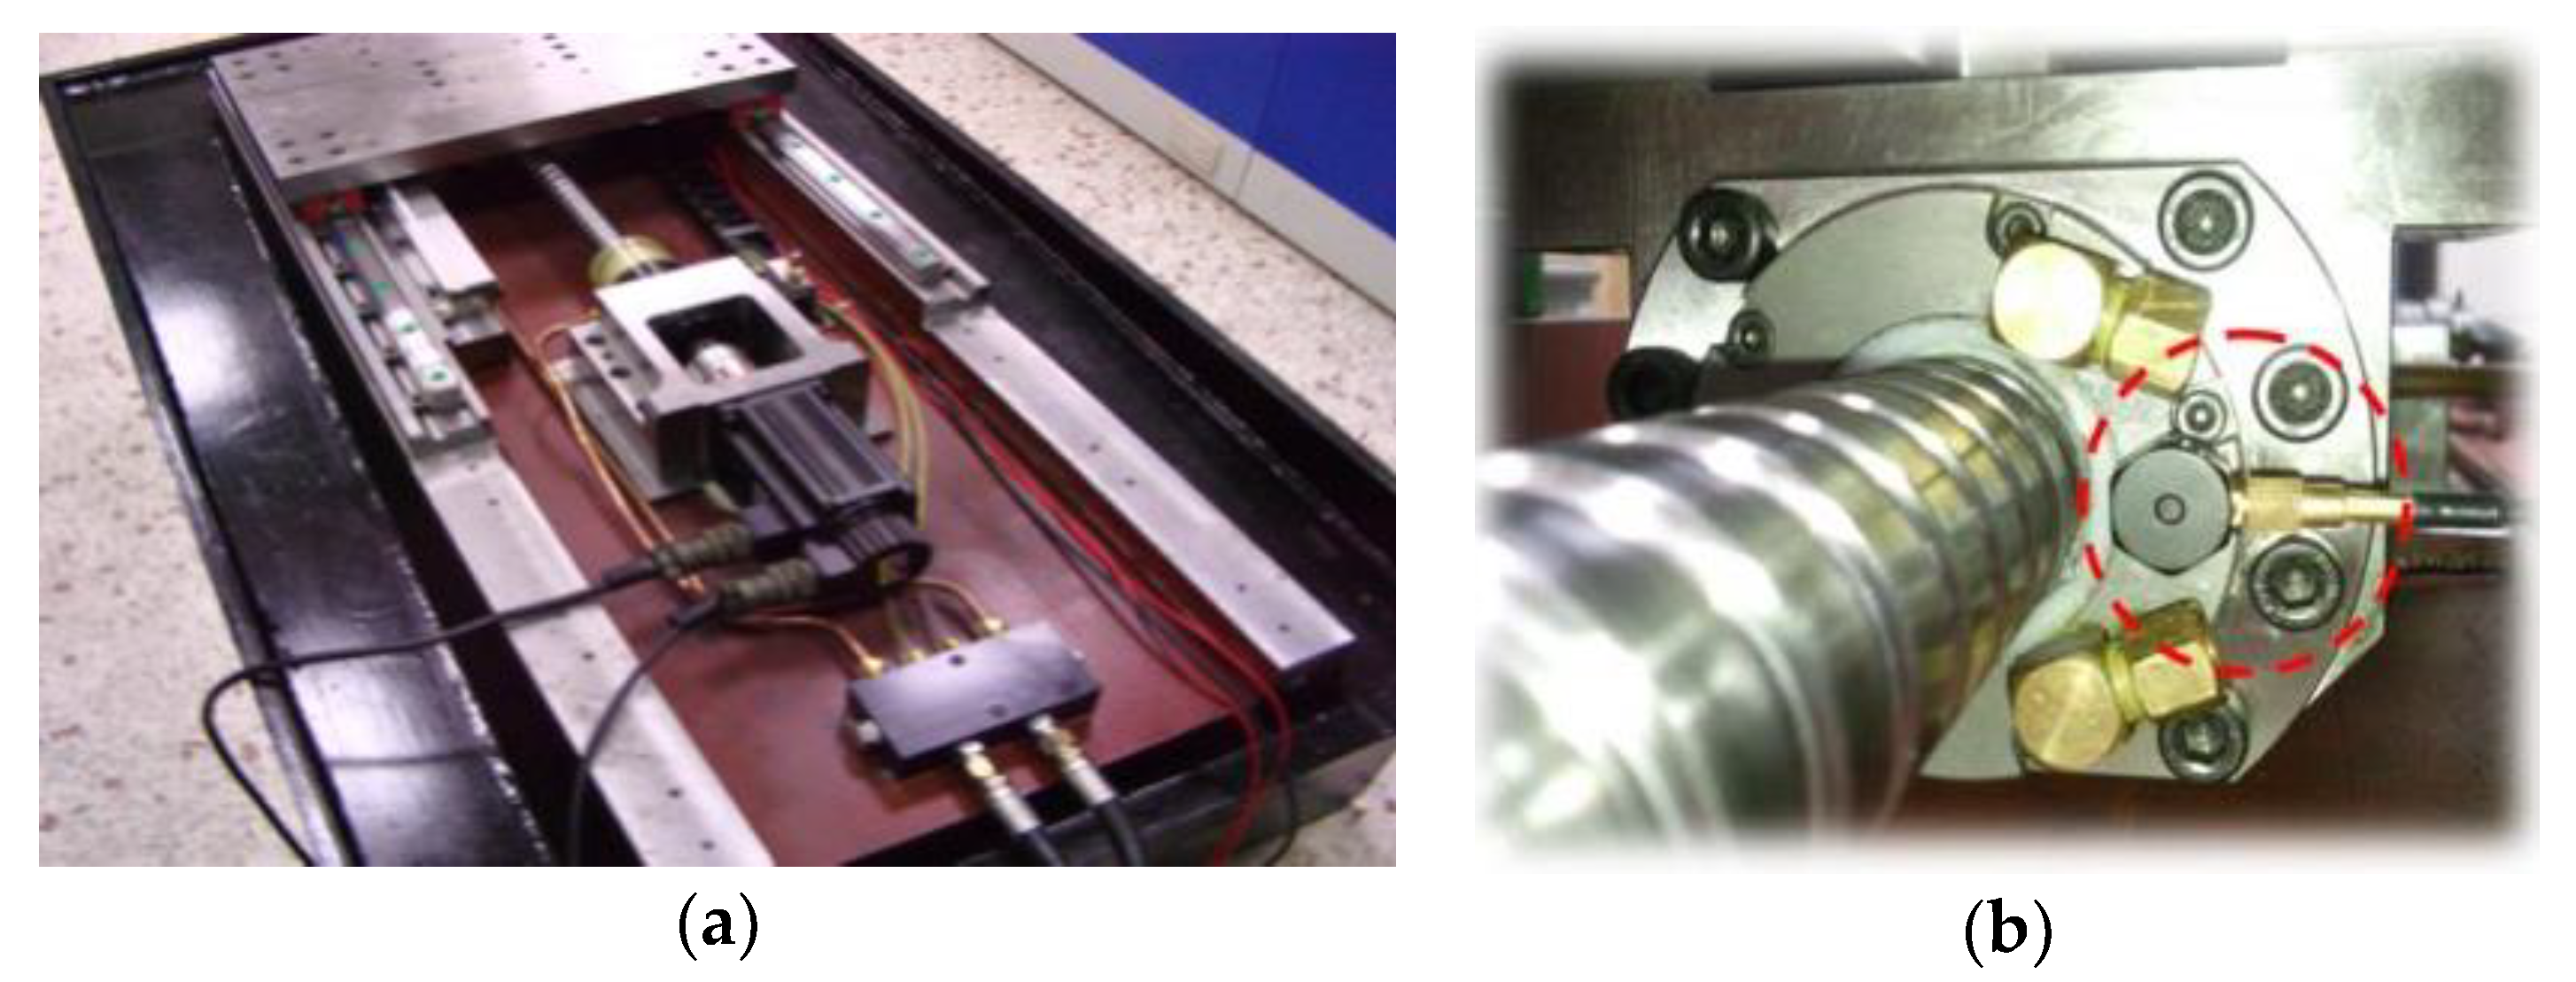
Figure 1.
(a) Picture of the in-house single-axis platform with a servo motor and linear scale positioning sensor, and (b) picture of the acceleration sensor attached to the ball nut (right).
Figure 1.
(a) Picture of the in-house single-axis platform with a servo motor and linear scale positioning sensor, and (b) picture of the acceleration sensor attached to the ball nut (right).

Figure 2.
Oil-cooling circulating system around the hollow ball screw in Figure 1.
Figure 2.
Oil-cooling circulating system around the hollow ball screw in Figure 1.
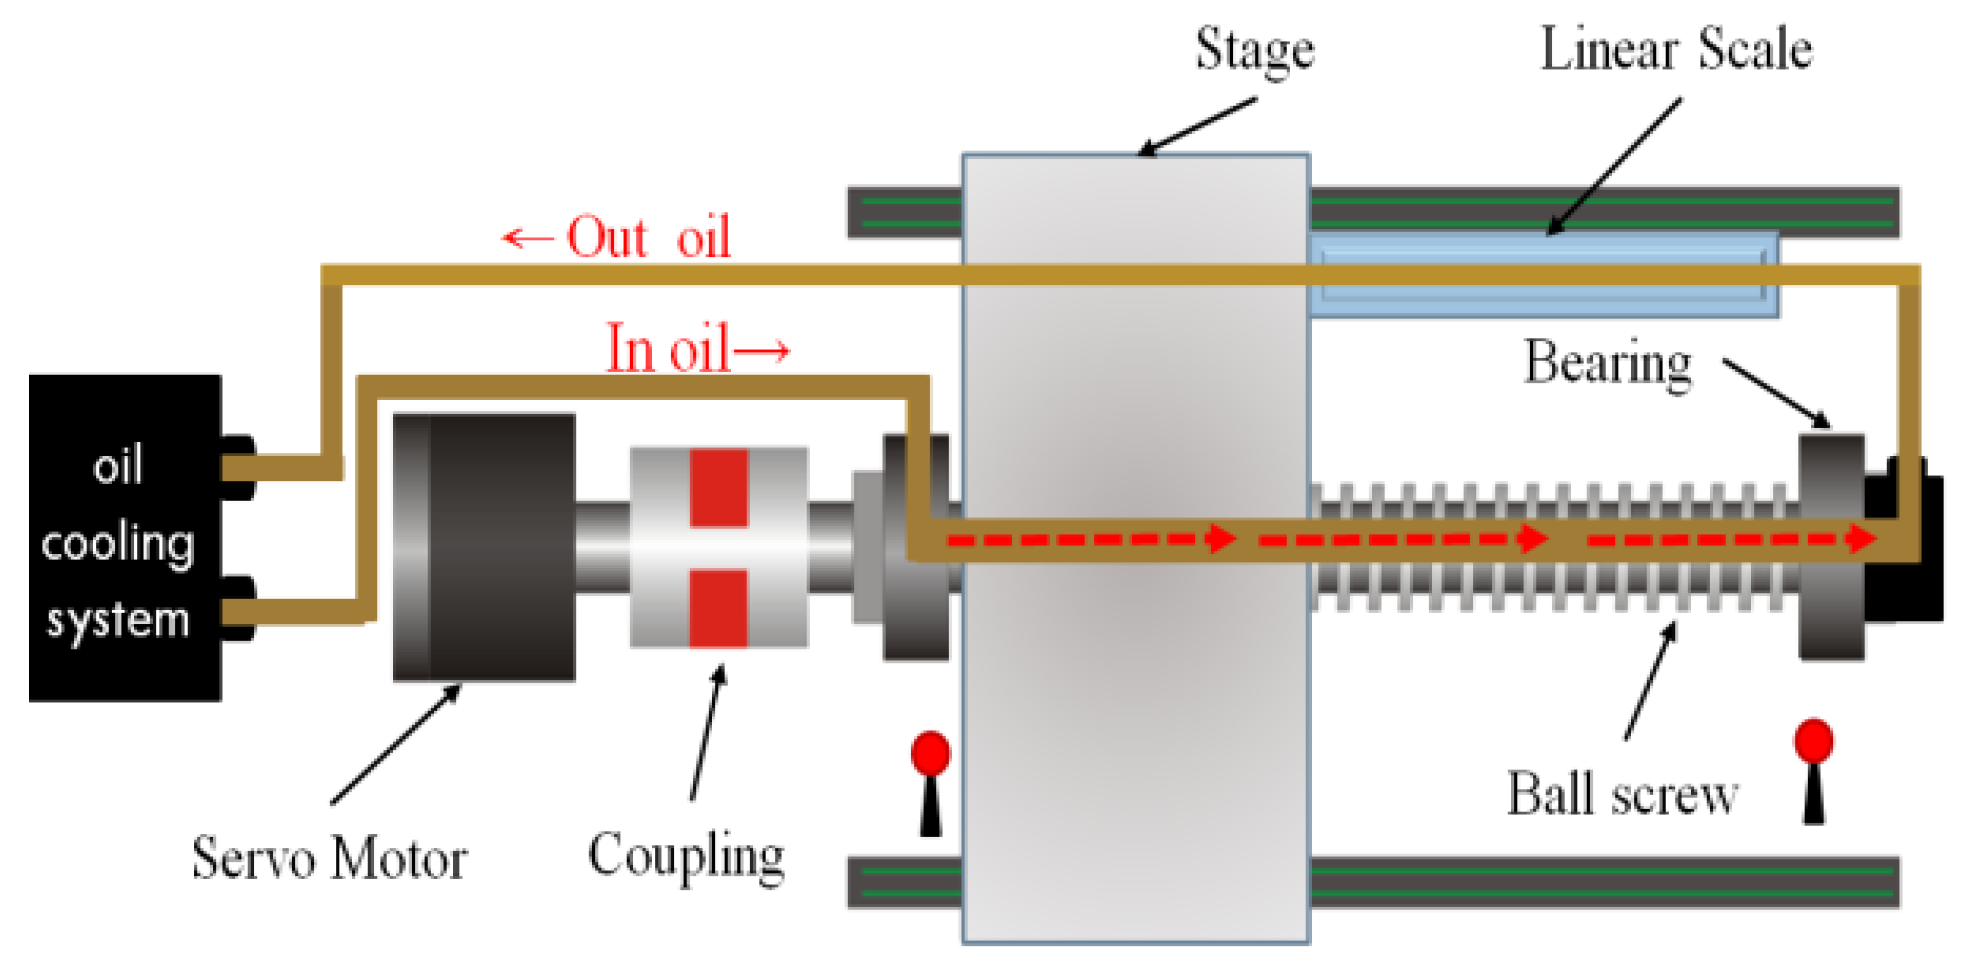
Figure 3.
Motor current plot of the 4% ball-screw preload without pretension and with a 20-kg payload under a repetitive motion speed of 600 rpm for 60 min. The blue and red colors indicate the conditions with and without oil-cooling circulation, respectively.
Figure 3.
Motor current plot of the 4% ball-screw preload without pretension and with a 20-kg payload under a repetitive motion speed of 600 rpm for 60 min. The blue and red colors indicate the conditions with and without oil-cooling circulation, respectively.

Figure 4.
Thermal image [16] of the 4% ball-screw preload without pretension and payload under a repetitive motion speed of 900 rpm for 60 min. The temperature distribution of the ball nut for 60 min begins from the top left and ends to the bottom right.
Figure 4.
Thermal image [16] of the 4% ball-screw preload without pretension and payload under a repetitive motion speed of 900 rpm for 60 min. The temperature distribution of the ball nut for 60 min begins from the top left and ends to the bottom right.

Figure 5.
100% classification rates obtained for the 2% and 4% ball-nut preloads based on the current and linear scale signals with oil-cooling circulation: (a) linear support vector machine (SVM) kernel function, (b) radial kernel function, (c) linear SVM kernel function with an additional pretension of 5 μ, and (d) radial kernel function with an additional pretension of 5 μ.

Figure 6.
100% classification rate results for the 2% and 4% ball-nut preloads based on the current and linear scale signals without oil-cooling circulation with the (a) linear SVM kernel function, (b) radial kernel function, (c) linear SVM kernel function with an additional pretension of 5 μ, and (d) radial kernel function with an additional pretension of 5 μ.
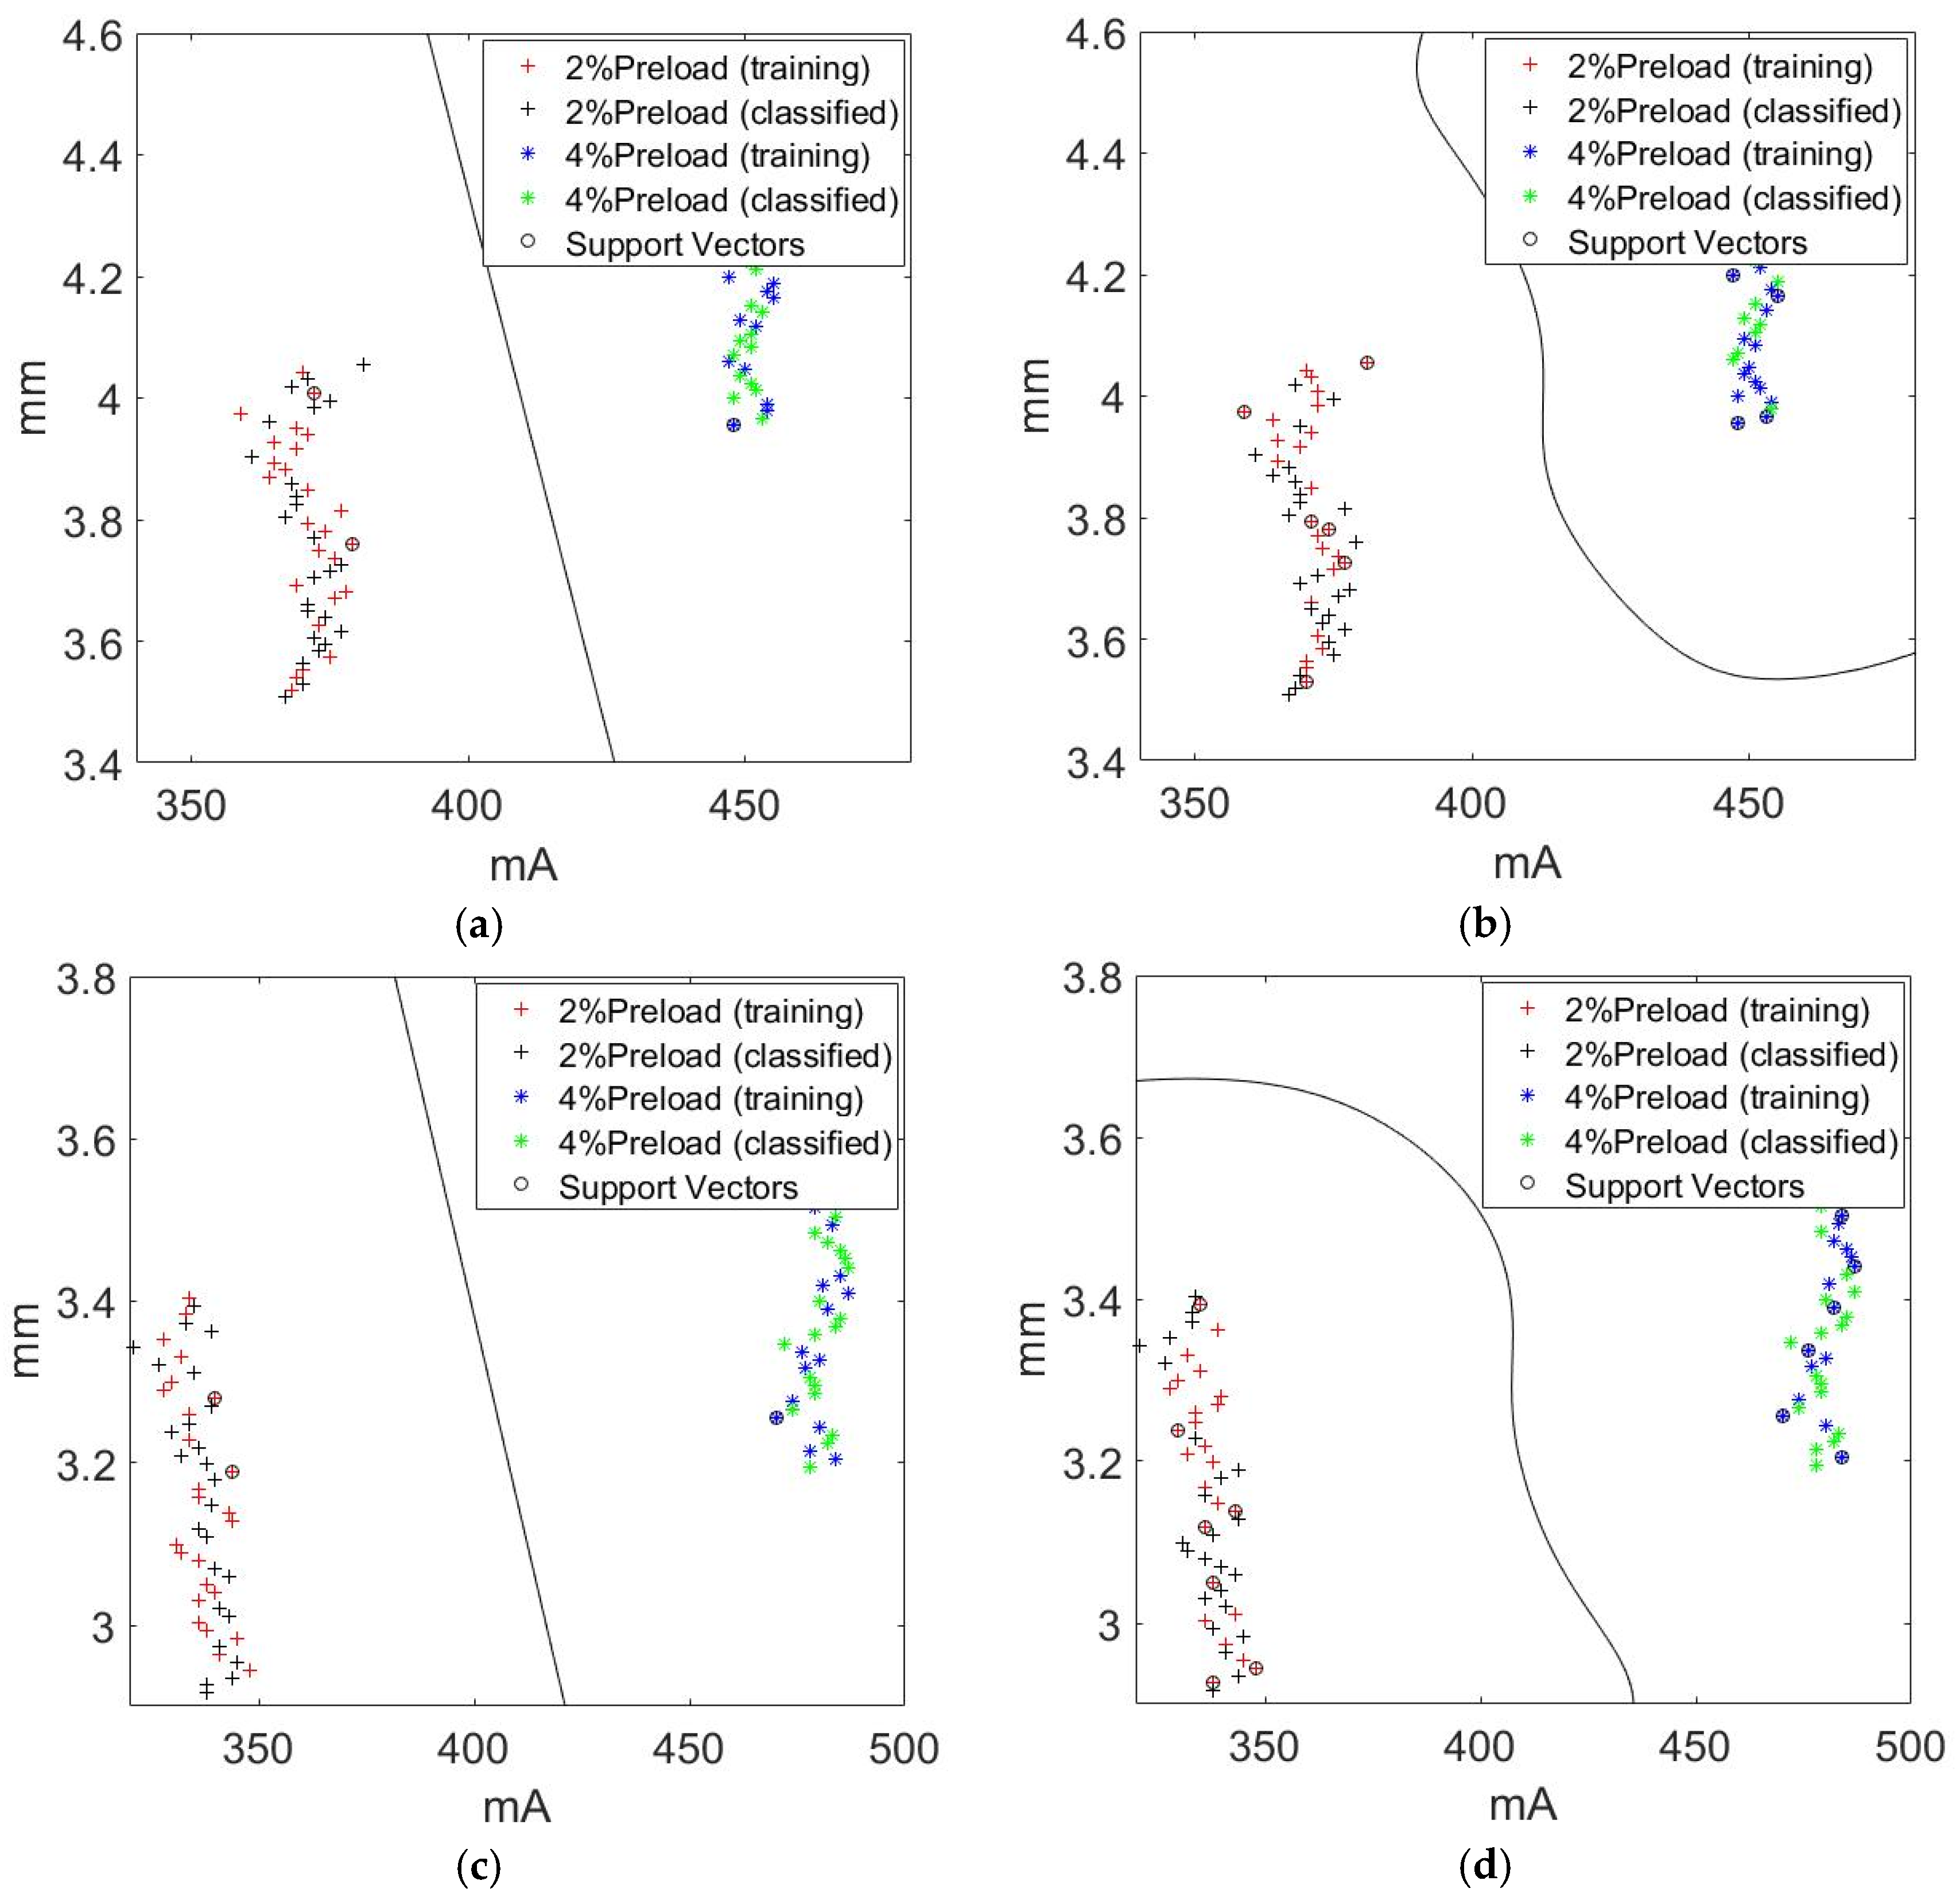
Figure 7.
Sampled vibration signals.

Figure 8.
Training and classified results for the (a) linear SVM kernel function, and (b) nonlinear radius-based function (RBF) SVM kernel function of the vibration signals for the 2% and 4% ball-nut preloads with a pretension of 10 μ.
Figure 8.
Training and classified results for the (a) linear SVM kernel function, and (b) nonlinear radius-based function (RBF) SVM kernel function of the vibration signals for the 2% and 4% ball-nut preloads with a pretension of 10 μ.
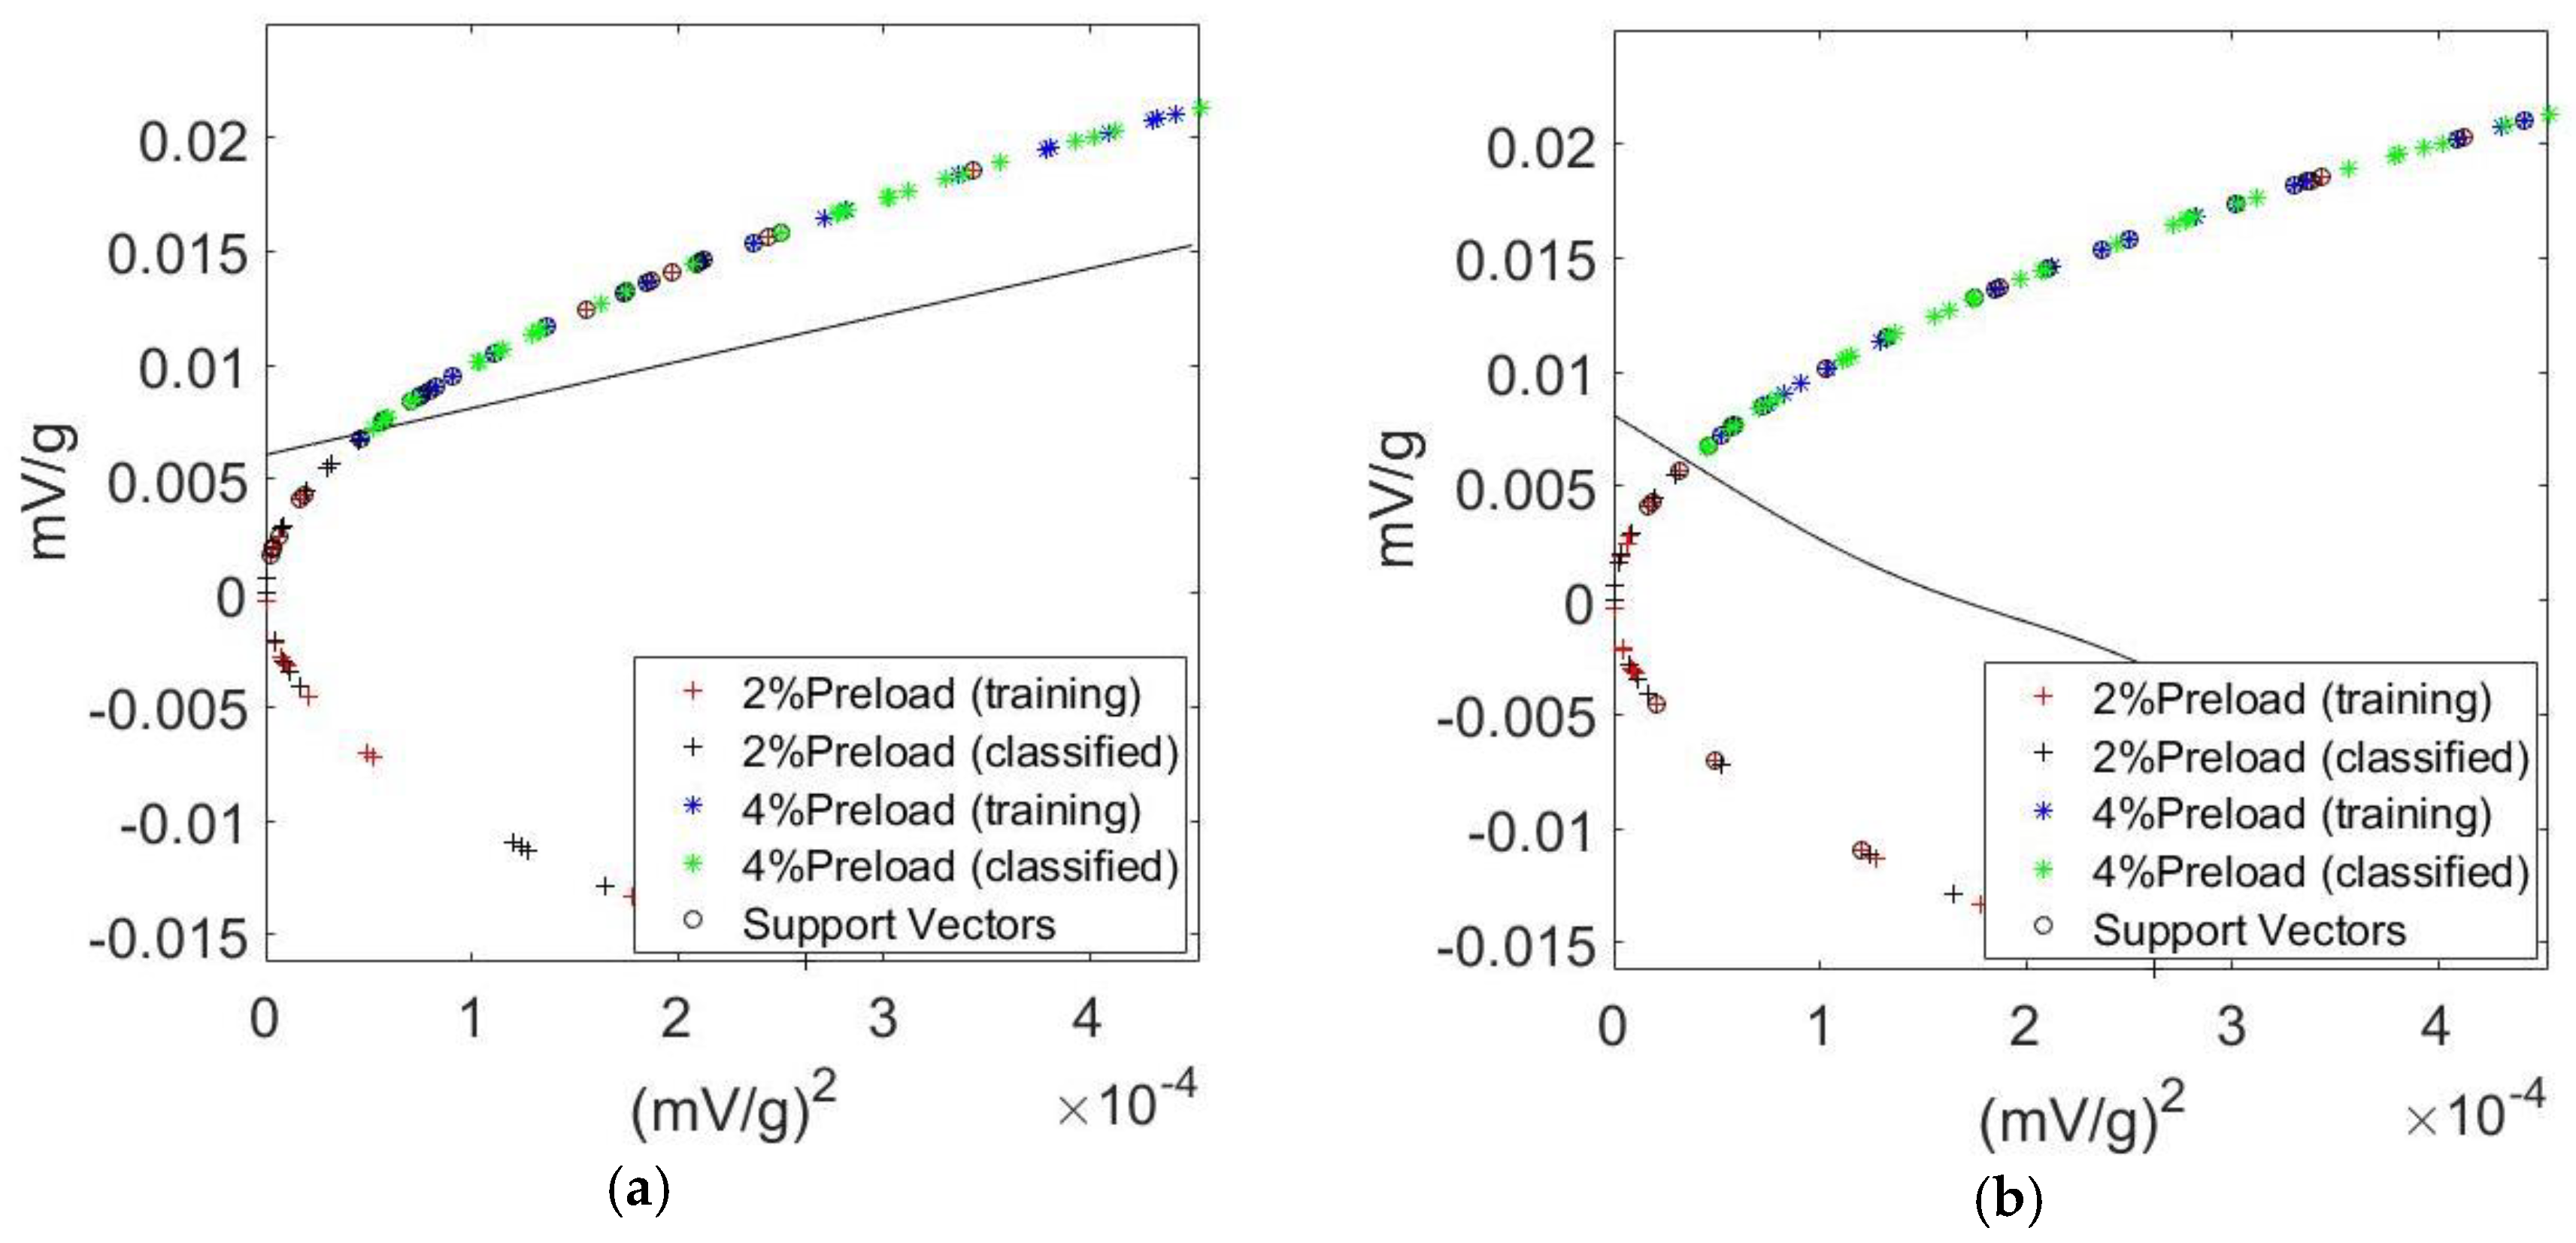
Figure 9.
Flow chart of prognostic diagnosis based on feature extraction and the genetic algorithm/k-nearest neighbor (GA/KNN) classifier model.
Figure 9.
Flow chart of prognostic diagnosis based on feature extraction and the genetic algorithm/k-nearest neighbor (GA/KNN) classifier model.

Figure 10.
Partial view of the original vibration signal (blue) and signal profile after Kalman filtering (red).
Figure 10.
Partial view of the original vibration signal (blue) and signal profile after Kalman filtering (red).

Figure 11.
The Z-score technique for removing the outliers (red) among the acquisitioned data (blue).
Figure 11.
The Z-score technique for removing the outliers (red) among the acquisitioned data (blue).
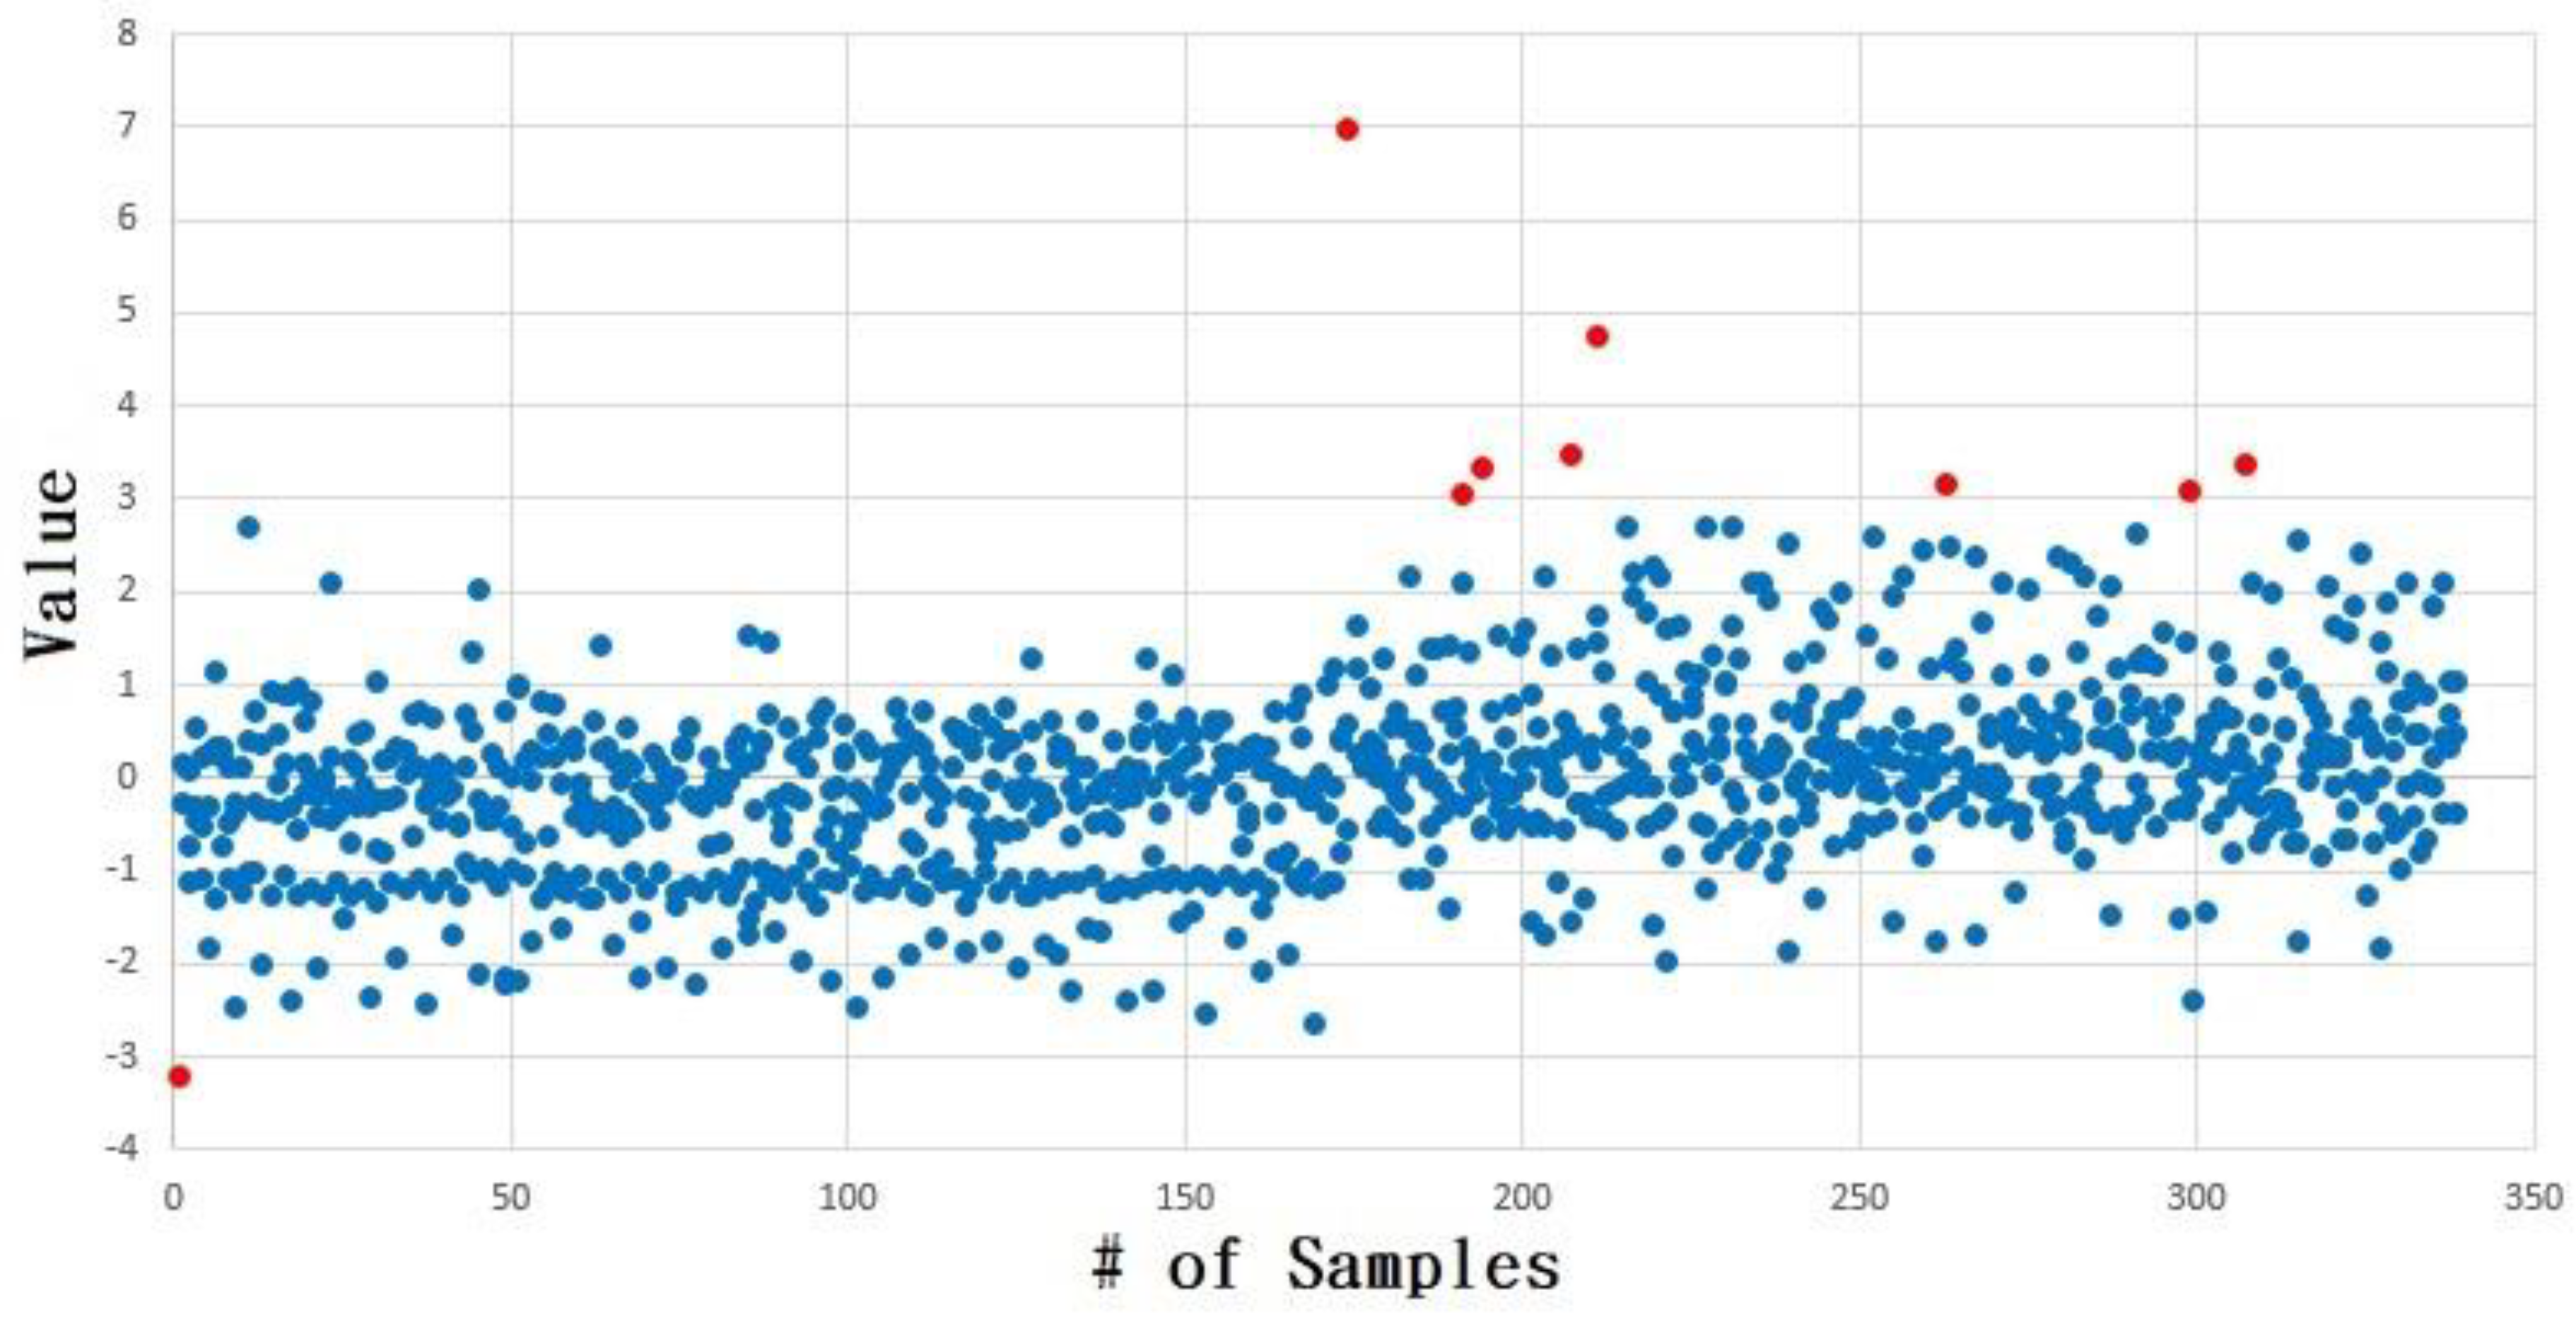
Figure 12.
Selection of 14 of the 44 features based on the Fisher criterion.

Figure 13.
Visualized test result for the distance of the C0 and C1 classes when the tested 4% preload data were near C0 (left figure), and the tested 2% preload data were near C1 (right figure).
Figure 13.
Visualized test result for the distance of the C0 and C1 classes when the tested 4% preload data were near C0 (left figure), and the tested 2% preload data were near C1 (right figure).

Table 1.
The confusion matrix.
| Classification Items | Predict C0 | Predict C1 |
|---|---|---|
| Actual: C0 | 50 | 0 |
| Actual: C1 | 0 | 50 |
© 2018 by the authors. Licensee MDPI, Basel, Switzerland. This article is an open access article distributed under the terms and conditions of the Creative Commons Attribution (CC BY) license (http://creativecommons.org/licenses/by/4.0/).
Share and Cite
MDPI and ACS Style
Huang, Y.-C.; Kao, C.-H.; Chen, S.-J. Diagnosis of the Hollow Ball Screw Preload Classification Using Machine Learning. Appl. Sci. 2018, 8, 1072. https://doi.org/10.3390/app8071072
AMA Style
Huang Y-C, Kao C-H, Chen S-J. Diagnosis of the Hollow Ball Screw Preload Classification Using Machine Learning. Applied Sciences. 2018; 8(7):1072. https://doi.org/10.3390/app8071072
Chicago/Turabian StyleHuang, Yi-Cheng, Chi-Hsuan Kao, and Sheng-Jhe Chen. 2018. "Diagnosis of the Hollow Ball Screw Preload Classification Using Machine Learning" Applied Sciences 8, no. 7: 1072. https://doi.org/10.3390/app8071072
Note that from the first issue of 2016, this journal uses article numbers instead of page numbers. See further details here.