Study on Cleaning the Surface of Stainless Steel 316 Using Plasma Electrolysis Technology


1
Department of Mechanical Engineering, Cheng Shiu University, Kaohsiung 83347, Taiwan
2
Department of Mechanical Engineering, National Kaohsiung University of Science and Technology, Kaohsiung 80778, Taiwan
3
Department of Electrical Engineering, Cheng Shiu University, Kaohsiung 83347, Taiwan
*
Authors to whom correspondence should be addressed.
Appl. Sci. 2018, 8(7), 1060; https://doi.org/10.3390/app8071060
Submission received: 30 May 2018
/
Revised: 20 June 2018
/
Accepted: 27 June 2018
/
Published: 29 June 2018
(This article belongs to the Special Issue Selected Papers from IEEE ICASI 2018)
Abstract
:Featured Application
The proposed method may benefit the cleaning process of the metals that undergo surface treatment. Especially, this method can be used to fabricate microstructures on the surface of the stainless steel to enhance the self-cleaning and corrosion resistance properties.
Abstract
This research utilizes a plasma electrolysis technique to clean the surface of stainless steel 316. The resulting microstructure enhances the self-cleaning properties of the stainless steel surface. The position of the cathode electrode is varied to enlarge the total surface being processed and achieves a uniform processing surface. We propose a self-made plasma electrolysis reaction system supplemented with a 3-axis platform to control the speed at which the cathode electrode moves. The electrolyte is an aqueous solution of sodium bicarbonate (NaHCO3) and water. We obtain the optimal parameters for applied voltage, moving speed of the specimen at the cathode, and electrode distance using a one-factor-at-a-time experimental approach to achieve uniform distribution of the surface microstructure. We then observe and measure surface micrographs showing the surface roughness of the specimens after experiments, using a scanning electron microscope (SEM) and an atomic force microscope (AFM). The contact angle is experimentally proven to be greater than 100°, indicating that the surface is hydrophobic.
1. Introduction
Surface cleaning of stainless steel is generally preceded by the use of an organic solvent to remove exterior grease and by alkaline or acid washing to remove dirt, inorganic substances, and oxides, followed by washing in water before subsequent processes. The surface can also be cleaned with surface sandblasting, ultrasonic cleaning, electrolytic grinding, and other methods. However, traditional cleaning methods have drawbacks, such as high cost, harmful effects upon the environment and the human body, and the need to treat the resulting waste liquid. Plasma electrolytic technology, currently used in paper processing, can ameliorate the defects of traditional processing methods, reducing the cost of surface cleaning and the level of pollution affecting the environment and human health.
Plasma electrolytic technology has been widely used in engineering for coating, surface treatment, cleaning, and so on. In general, plasma electrolytic technology can be divided into anodic and cathodic electrolytic technologies, which are clearly described by Aliofkhazraei and Rouhaghdam [1]. Parfenov et al. [2] summarized plasma electrolytic technology and proposed a theoretical model that can be used for further observing the reaction process in this technology. Plasma electrolytic oxidation is usually used for metal oxidation and nanoparticles. Yerokhin et al. [3] used plasma electrolytic oxidation (PEO) in a titanium alloy and discovered the effect of the thickness of the oxidation film generated with different electrolytes. In 2004, Snizhko et al. [4] issued a paper on the anodic PEO of an alkaline solution on an aluminum alloy. Gu et al. [5] combined electric arc spraying and PEO to promote abrasion resistance and corrosion resistance in aluminum oxide double coatings on a steel plate. Ma et al. [6] proposed research on the corrosion resistance of a magnesium alloy following PEO oxidation. Liang et al. [7] optimized the corrosion resistance of a magnesium alloy with PEO and a method of changing the current density. Mu and Han [8] proposed coating three materials on a magnesium alloy using PEO. Moon [9] and Cui et al. [10] treated a magnesium alloy with PEO and studied its corrosion resistance and hydrophobicity. Krishna et al. [11] proposed an oxidation film that could be coated on a magnesium alloy and further explored the film’s hardness and corrosion resistance. Anodic electrolytic technology is currently used to make scratch-resistant layers and metal coatings to prevent surface oxidation on metal.
Cathodic plasma electrolytic technology is usually used to treat a cathodic surface and includes four applications: cleaning, heat treatment, fabrication of nanostructures, and nanocrystalline coating. The solution used in cathodic plasma electrolytic technology is based mainly on a weak alkali solution. A high voltage is applied during processing to form plasma, then paint, grease, dirt, and oxide can be removed from the surface. Compared to traditional cleaning methods, this reduces harmful effects upon the environment and human health. In addition, this technology can generate nanostructures on the material’s surface, making it less susceptible to dust and increasing corrosion resistance. Gupta et al. [12] summarized the plasma electrolytic principle and described the voltage–current curve of plasma electrolytic cleaning technology. Schilling et al. [13] used plasma electrolytic cleaning technology on structural steel and effectively improved its resistance to corrosion. Meletis et al. [14] used sodium bicarbonate as the electrolyte and cleaned the surface of low-carbon steel, then coated it with zinc and aluminum. Kumruoglu and Özel [15] proposed that plasma electrolytic technology could effectively remove rust and even the arc spray coating deposited on the steel surface. Chen et al. [16] proposed a phased-shift resonant power system to enhance the plasma cleaning efficiency by an online measurement of plasma load.
Stainless steel 316 is widely used in everyday appliances. So, finding a safe and effective cleaning method for stainless steel 316 is a research topic of considerable interest. The work described in this paper aims to make a microstructure on the surface of stainless steel 316 using plasma electrolytic technology to generate hydrophobicity. The experiment was conducted in the form of a fixed anode and a mobile cathode clamped with a specimen. The electrodes were soaked in the electrolyte. The purpose of the moving cathode was to increase the processing area and obtain a uniform processing surface. The experimental specimens were observed using a scanning electron microscope (SEM) and an atomic force microscope (AFM), and contact angle measurements were made. Finally, this paper determines the optimal parameters for the experimental system to enhance the surface effect on stainless steel 316 using plasma electrolytic technology with a moving cathode.
2. Experimental Method
2.1. Experimental Procedure
The paper uses plasma electrolysis technology with a cathodic specimen moving at a controlled speed to fabricate microstructures on the surface of stainless steel 316 to achieve surface cleaning and self-cleaning properties. The experimental procedure is shown in Figure 1. In the experiment, we chose to vary the parameters of applied voltage, cathodic movement speed, and electrode distance to obtain better results by the one-factor-at-a-time experimental approach. After the experiment, every specimen was cleaned using pure water and alcohol before undergoing SEM (SUPRA™ 55, Carl Zeiss AG, Oberkochen, Germany) and AFM (atomic force microscopes, NTEGRA, NT-MDT, Moscow, Russia) observation. Next, contact angle measurement (FTA-1000B First Ten Angstroms, Inc., Cincinnati, OH, USA) was applied to test the surface’s hydrophobicity. With different parameter settings, we compare and analyze the results to find the optimal process parameters and understand the relationship between cathode speed and surface morphology, to achieve uniformly distributed surface processing on the specimen. This experiment also used a 3-axis (XYZ) platform to control the Z-axis moving speed of the specimen clamped to the cathodic electrode to increase the processed area. The experiment was conducted within a small plasma electrolytic reaction bath. A new solution was added after every experiment to maintain the concentration and temperature of the electrolyte in a uniform environment.
2.2. Experimental Equipment
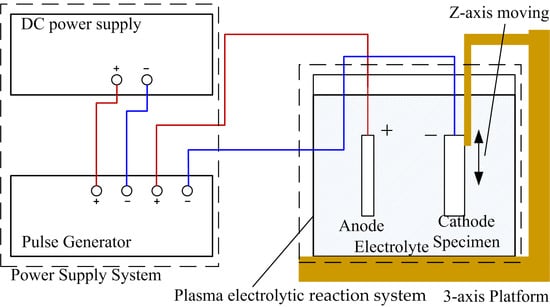
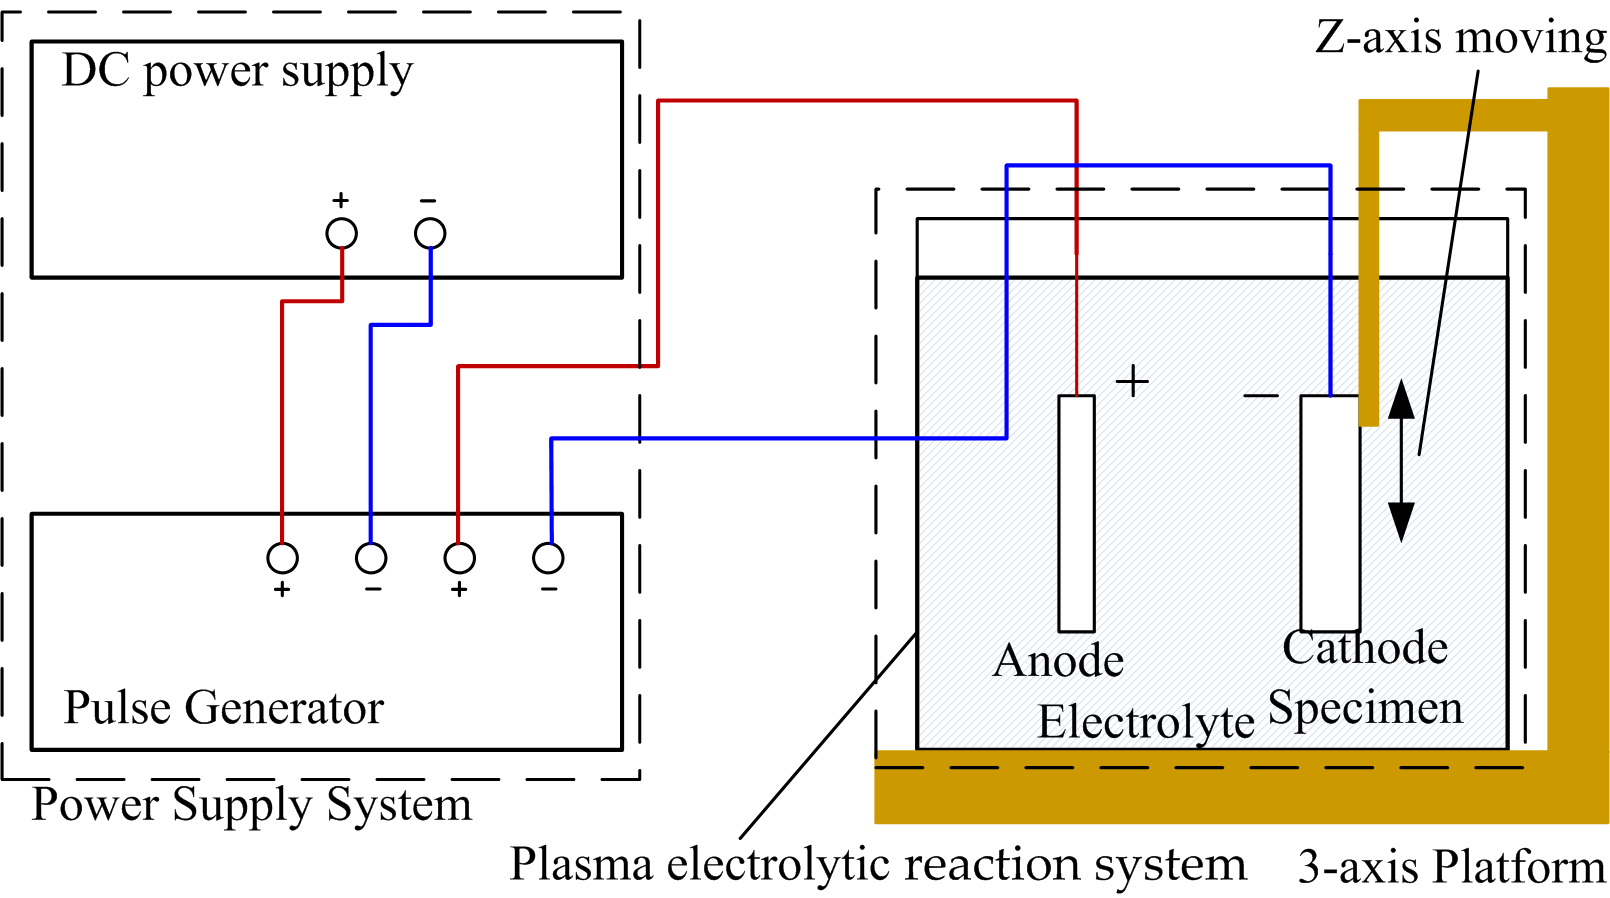
The plasma electrolytic system can be divided into three parts; the direct current (DC) power system [17], the plasma electrolytic reaction system, and 3-axis platform, as shown in Figure 2a. We aim to generate micrometer- and nanometer-sized holes on the specimen surface to give it self-cleaning capacity and enhance its corrosion resistance. Figure 2b provides a detailed view of the components used in the plasma electrolytic reaction system. The processing area is generally set as a fixed area where uneven processing can easily be induced, since bubbles generated can obstruct the processing surface. We therefore propose a fixed processing area of 10 × 10 mm, designed and located in the middle region of the cathodic fixture whose moving speed is being controlled, to enlarge the processing area and improve its uniformity. Note that a designated fixture is installed on the Z-axis to fix the cathode and wire. We use 3-axis platform because the cathode specimen needs to be driven at a stable speed every time to achieve uniform processing distribution and increase the processing area. The waterproof board limits the reaction area of the plasma electrolytic reaction to the region in front of the square hole, so the side and backplate areas of the specimen will not be driven during the plasma electrolytic reaction. Hence, under the same conditions, the processing area can be enlarged and the processing time reduced because of the large applied current. Note that the reaction tank is made of glass for convenient observation of the plasma electrolytic reaction.
2.3. Setting the Parameters
The electrolyte used in the study was an alkalescent sodium bicarbonate solution that causes little harm to the environment. The electrolyte concentration was NaHCO3/deionized water = 9.334 g:100 g. The cathode and the anode were stainless steel 316. The cathode was 20 mm × 60 mm × 1.5 mm, while the anode was 28 mm × 40 mm × 12 mm. The anode was fully exposed in the electrolyte. Since the cathode needed to be moved, it had to be installed in the cathodic fixture and behind the waterproof board. The processing area within the plasma electrolytic reaction was limited by the square hole, which was 10 mm × 10 mm and located in the middle region of the cathodic fixture. During the experiment, the pulse generator was set as follows: High voltage time (Ton) of 15 μs; Low voltage time (Toff) of 5 μs; frequency of 50 kHz. In the following, the experimental parameters remained fixed as changes were made to the applied input voltage, the moving speed of the cathodic specimen, and the electrode distance. In the following section, we will discuss the experiments and determine the optimal parameters for cleaning the surface of stainless steel 316, based on the one-factor-at-a-time experimental approach.
2.4. Post-Processing
After the cathodic plasma electrolysis process, the specimen was washed with clean water, then placed in an ultrasonic cleaning machine for 5 min for further cleaning. Because the test piece had been soaked in the electrolyte, the surface was likely to retain residual electrolyte components, which would have affected the subsequent analysis results. This cleaning process ensured that the subsequent analysis of the specimen would not be affected by contaminants. In this paper, AFM was used to confirm the surface homogeneity of the specimen produced by the plasma-electrolytic treatment. We simplified by using five measurement points on the specimen (see Figure 3) to understand the overall surface information.
3. Results and Discussion
3.1. Effect of Working Voltage on Plasma Electrolysis Reaction
Figure 4 graphs the relationship between the RMS (root mean square) surface roughness (Rq) and applied voltage. Figure 5 and Figure 6 respectively present photos of SEM at 10,000× and AFM inspection of the specimen surface after the cleaning process. Note that we took five measurements of the RMS surface roughness (Rq) at five positions each time. Figure 5a shows that when the applied voltage was 180 V, the resulting surface microstructure was small and shallow because the explosion energy in the plasma was small. The RMS surface roughness (Rq) was approximately 50 nm, which can be observed in Figure 6a. When the applied voltage was increased to between 220 and 260 V, Figure 5b,c shows that the surface microstructure was clearer and the RMS surface roughness (Rq) was around 70–90 nm, as shown in Figure 6b,c. When the applied voltage was further increased to between 280 and 300 V, Figure 5d shows that the surface microstructure became flatter because the plasma explosive energy was stronger, yielding an RMS surface roughness (Rq) of around 40–50 nm (see Figure 6d). In summary, when the applied voltage was gradually increased, the surface roughness correspondingly increased, but after reaching critical values, the RMS surface roughness (Rq) decreased. This was because the activation energy of plasma particles increased as the applied voltage increased. When the activation energy of plasma particles increases, a more violent reaction occurs, even the hole sizes become larger, the particles will fill up the holes and create a flattened surface, and the RMS surface roughness (Rq) will be decreased.
Figure 7 plots the contact angle against the applied voltage. Before the use of plasma electrolysis, the measured contact angle of stainless steel 316 is usually less than 80°, so it is classified as a hydrophilic material. However, Figure 7 shows that after the plasma electrolytic cleaning process, the measured contact angles were all greater than 90°, which indicates a material with hydrophobicity. The measured contact angle in Figure 7 is greatest when the applied voltage is 220 V. We therefore can conclude that the optimal applied voltage was 220 V, as it generated a RMS surface roughness (Rq) of about 90 nm and a contact angle of 104.73°.
3.2. Effect of the Movement Speed of the Cathodic Specimen on Plasma Electrolysis
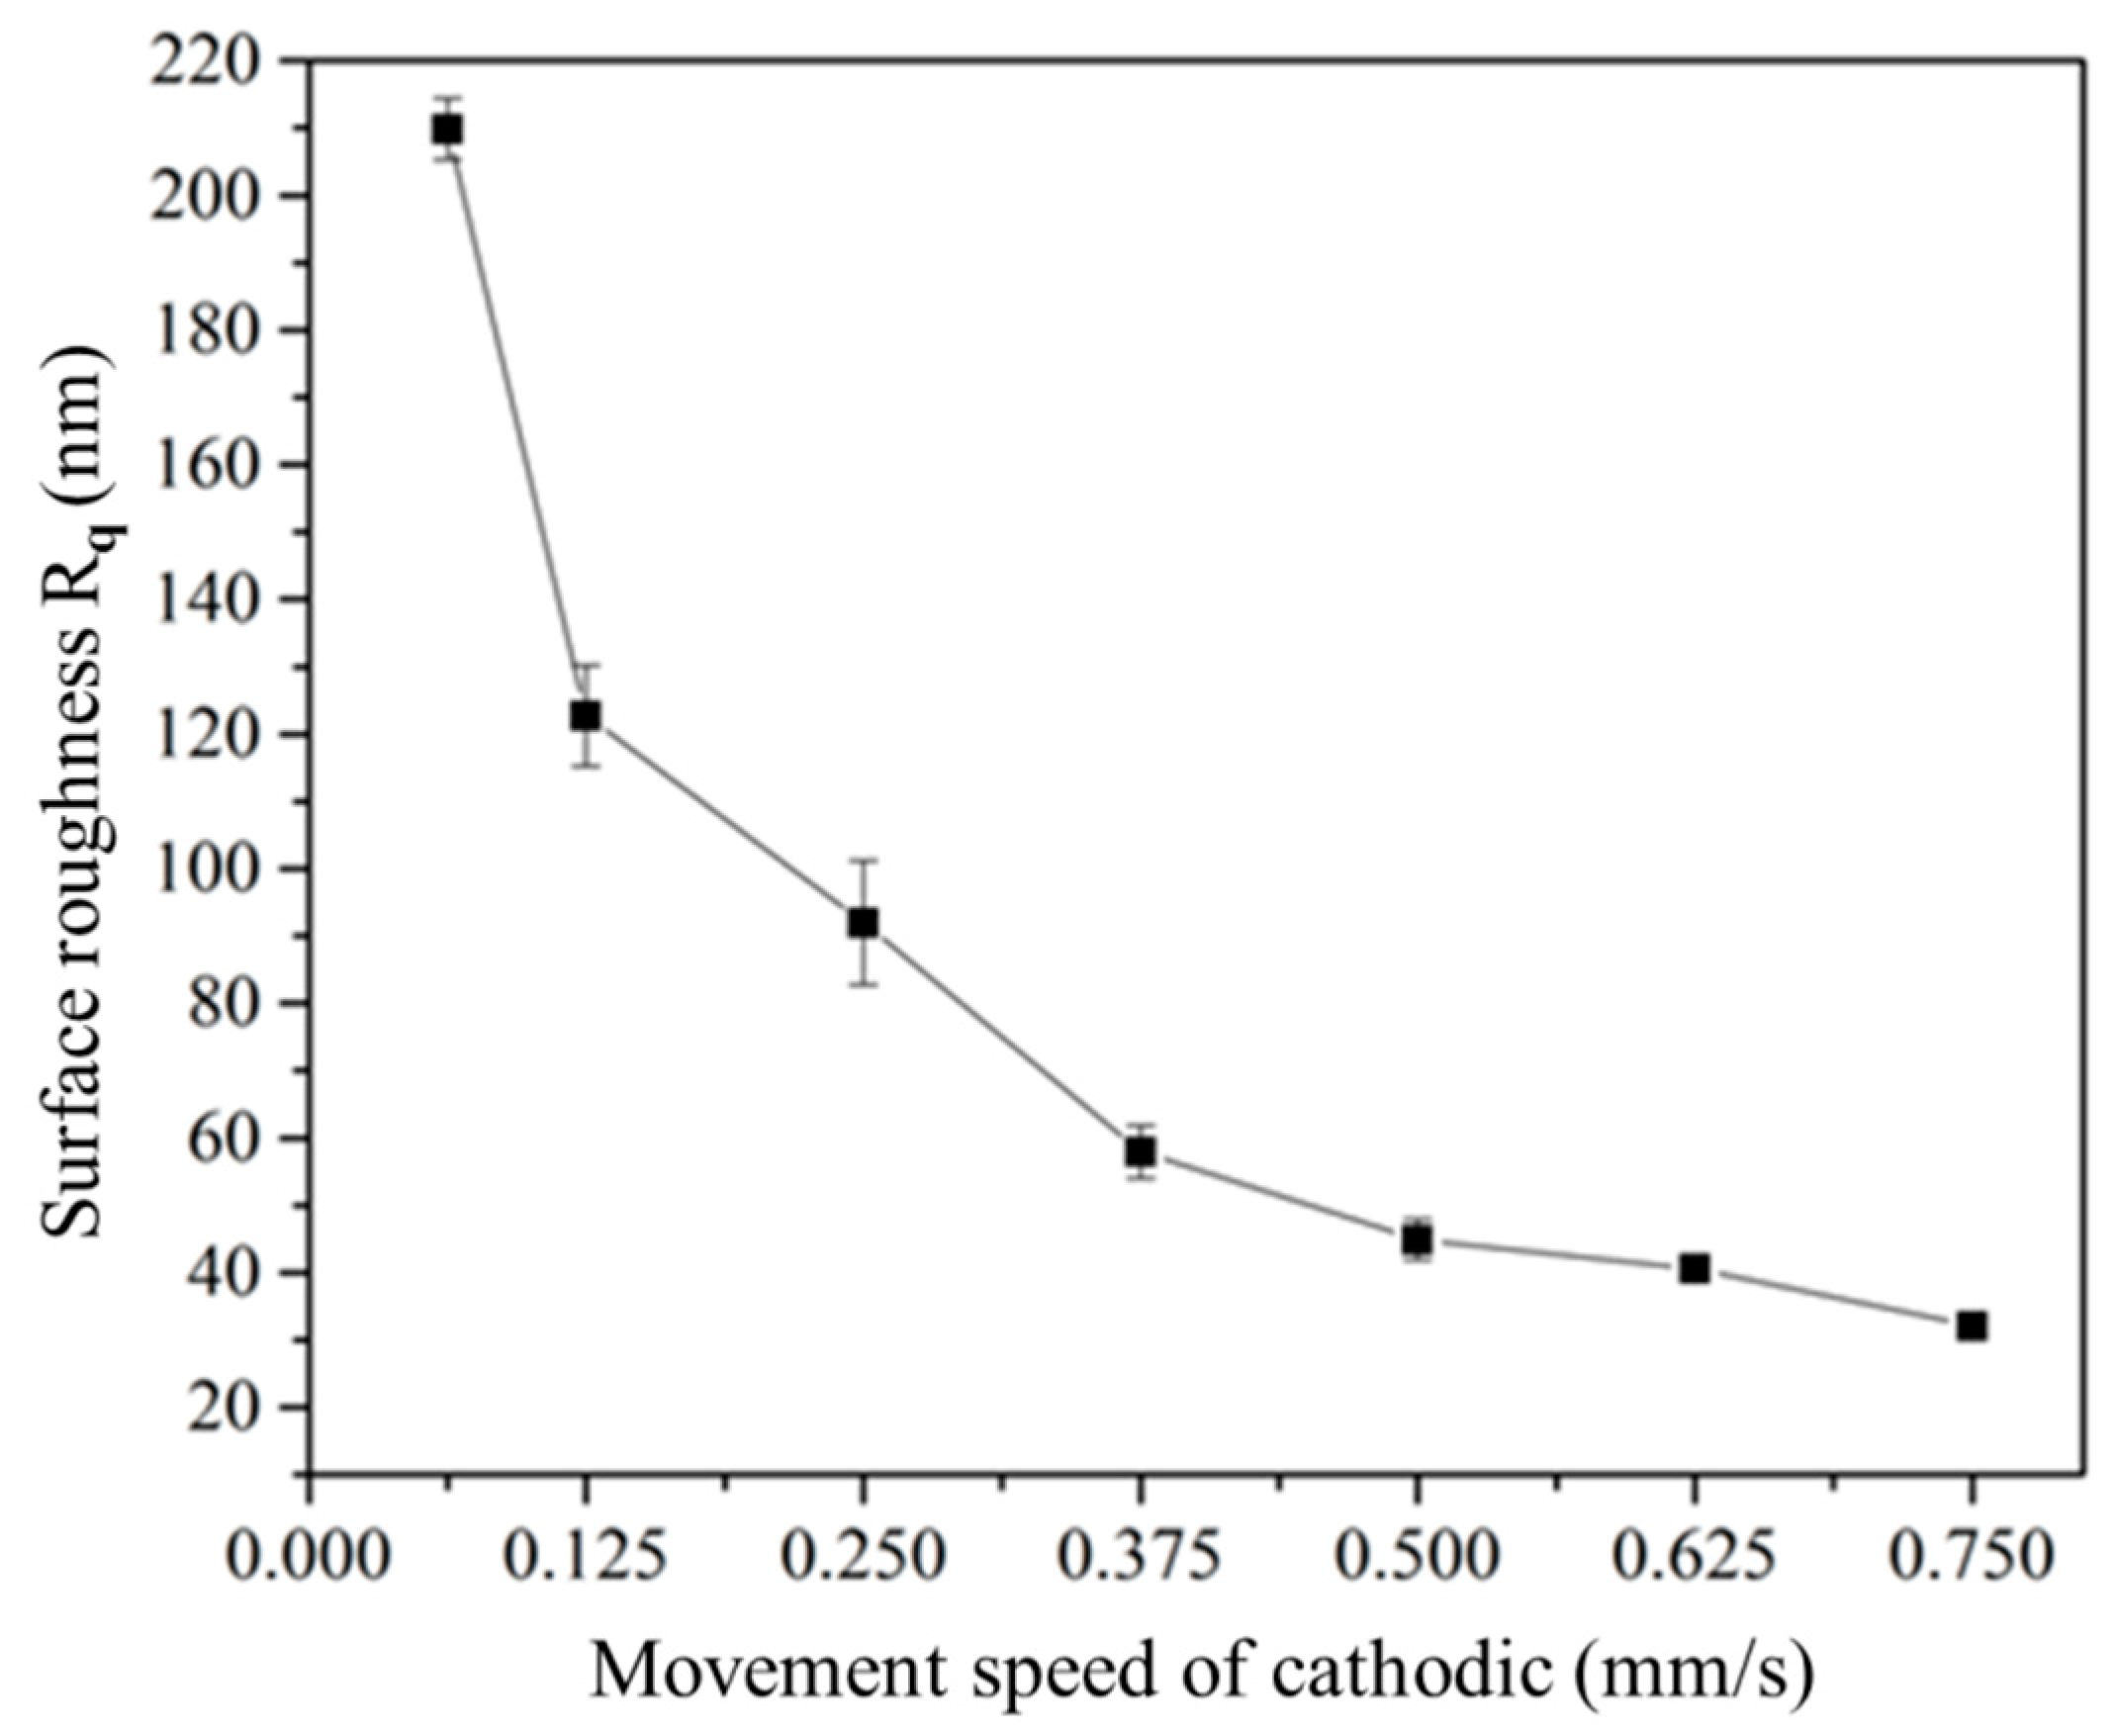
This subsection mainly explores the effect of the cathodic test block’s movement speed in the plasma electrolysis reaction system. Using the one-factor-at-a-time experimental approach, we set the applied voltage at 220 V. Figure 8 presents the RMS surface roughness (Rq) with respect to variations in the speed of the cathodic specimen. It can be observed that as the cathodic specimen sped up, the RMS surface roughness (Rq) decreased. This was because a faster speed shortened the plasma electrolytic reaction time on the surface, so microstructures did not completely form, resulting in less surface roughness. Figure 9 shows the microstructures generated on the material’s surface for different speeds, examined using SEM at 10,000×. The generated microstructure did not have directionality with respect to the direction of the cathodic specimen’s movement. Hence, we can conclude that the speed of the cathodic specimen increased its processing area and affected the processing time.
Figure 10 depicts the effect of the cathodic specimen speed on the contact angle. It can be observed that when the speed was slow, the contact angle was bigger. This was because the specimen with a slower speed was processed by the plasma electrolytic reaction for a longer time, resulting in a relatively complete surface microstructure. The resulting embossment and air in the holes supported the drops, resulting in higher hydrophobicity. However, when the specimen speed was too slow, the long treatment time caused the holes to enlarge and the contact angle to decrease. In summary, we concluded that the optimal specimen speed was 0.125 mm/s, which generated a contact angle greater than 105°.
3.3. Effect of Electrode Distance on the Plasma Electrolytic Reaction
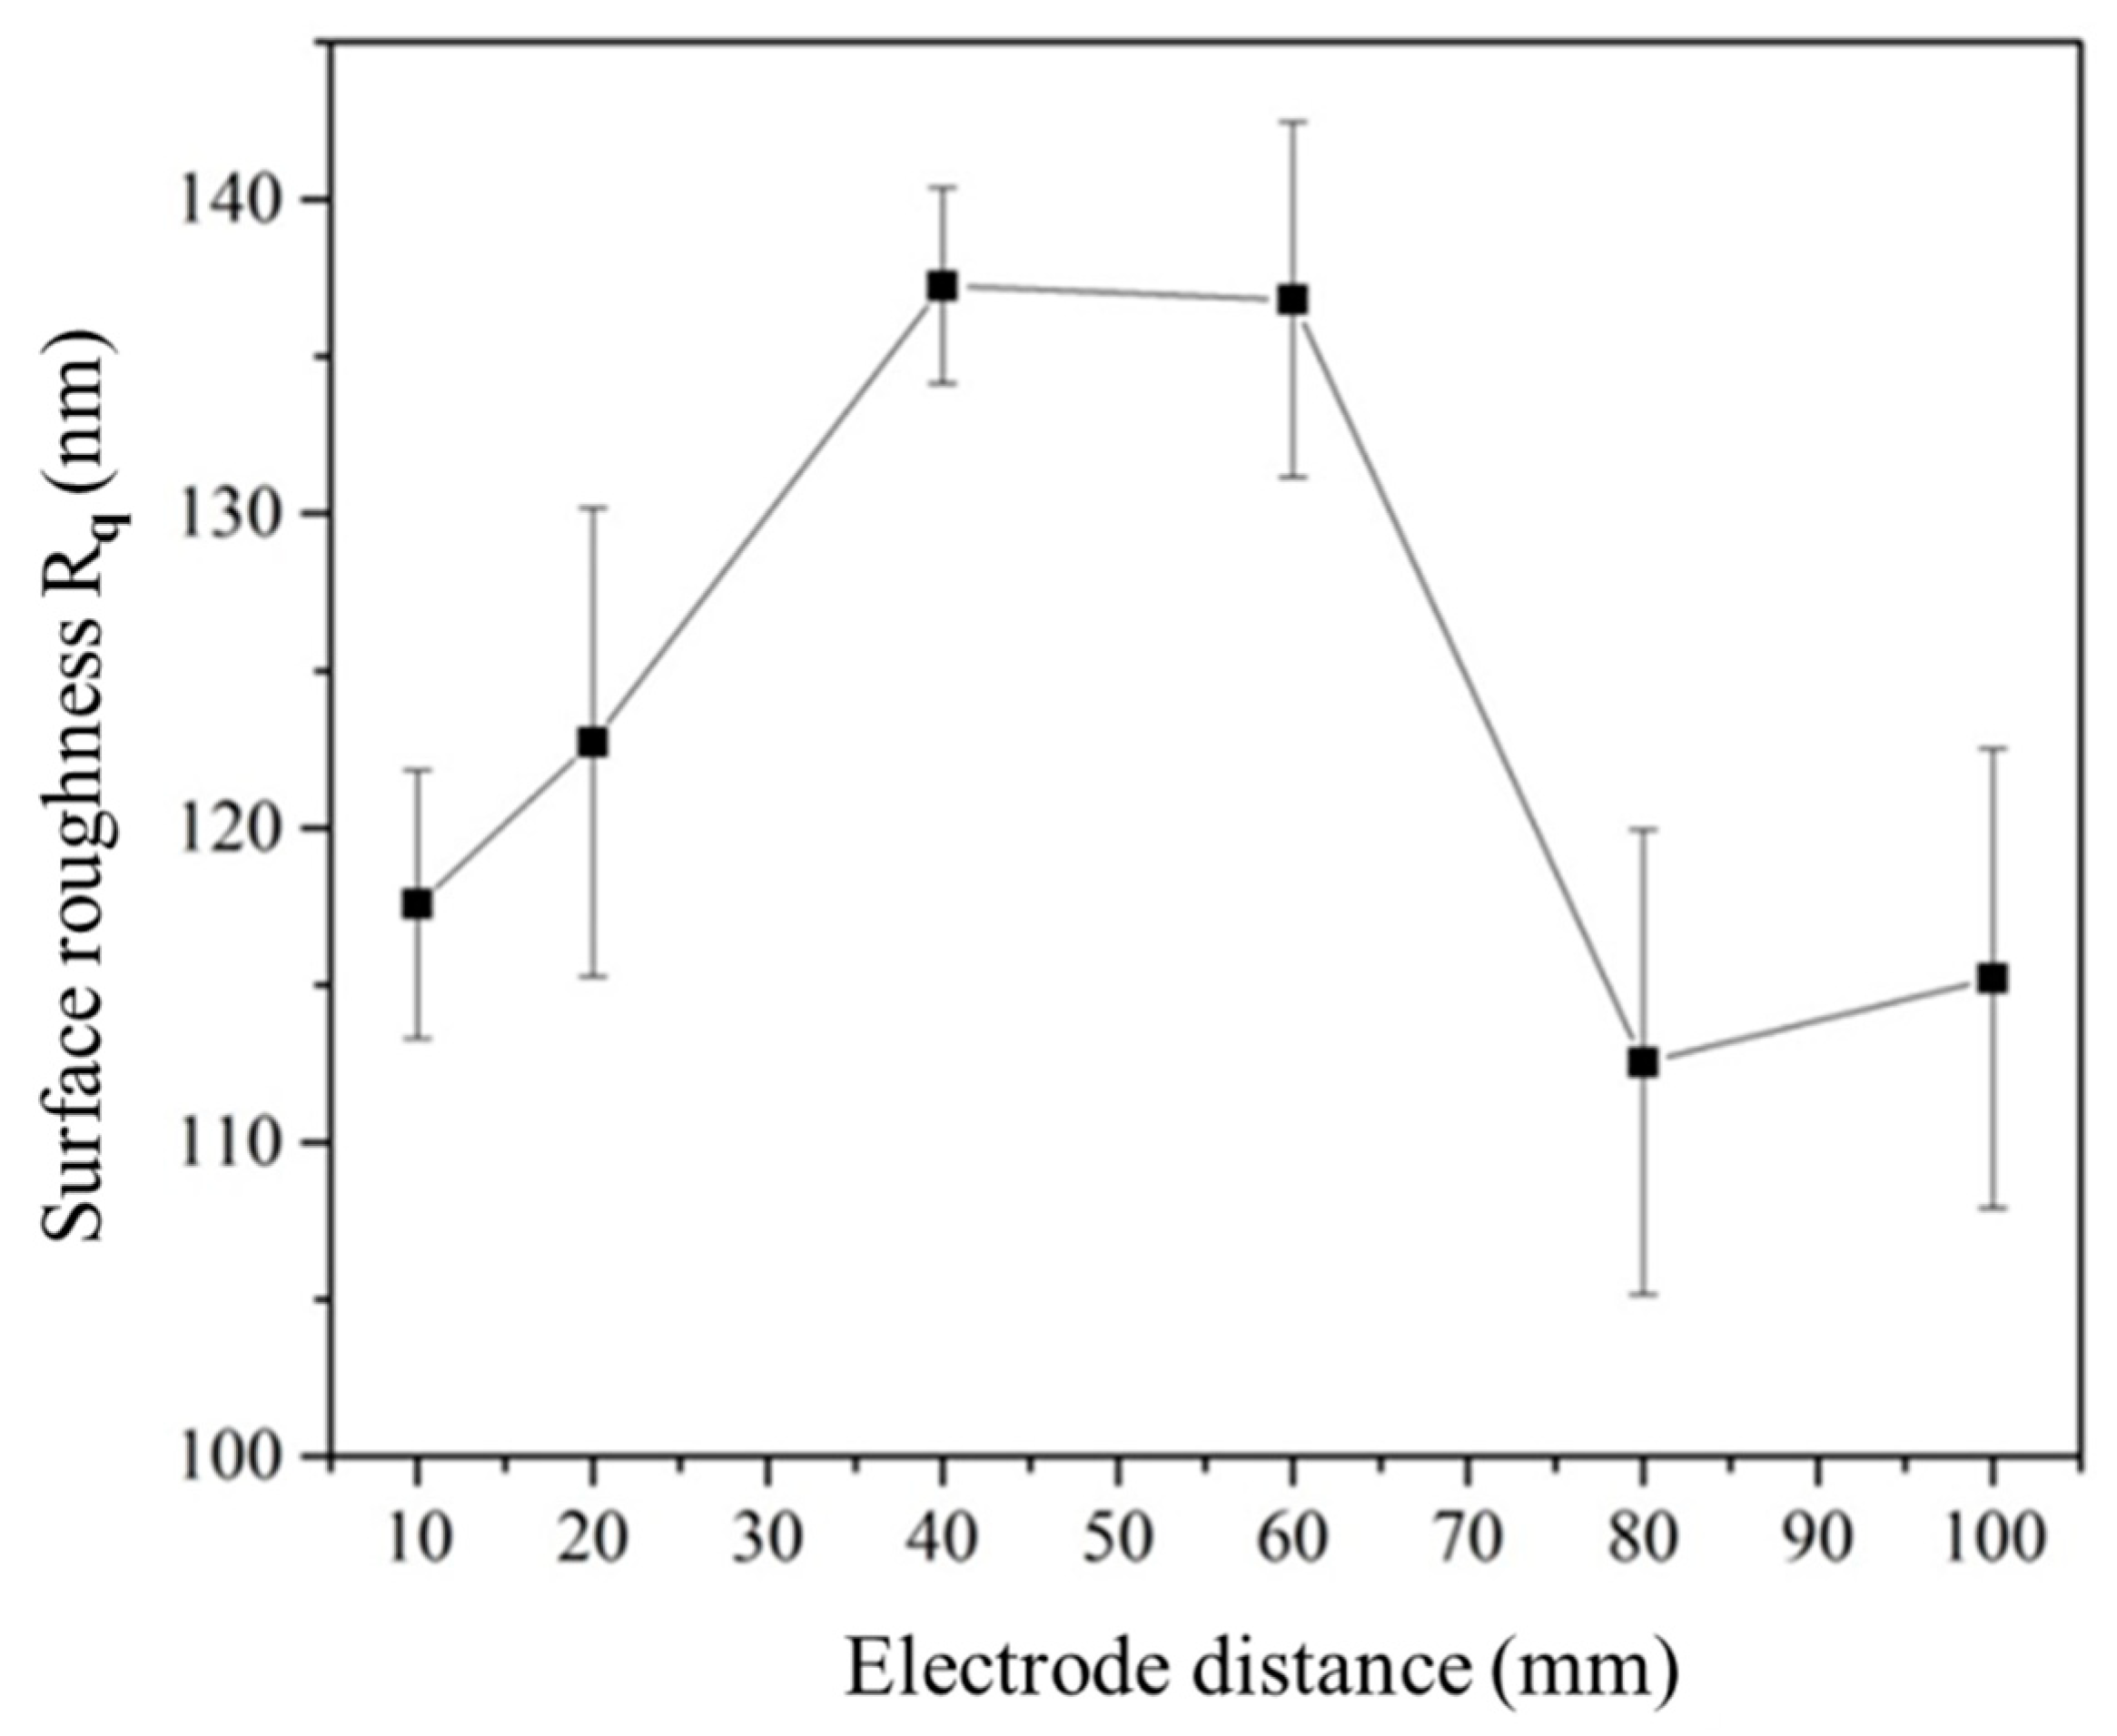
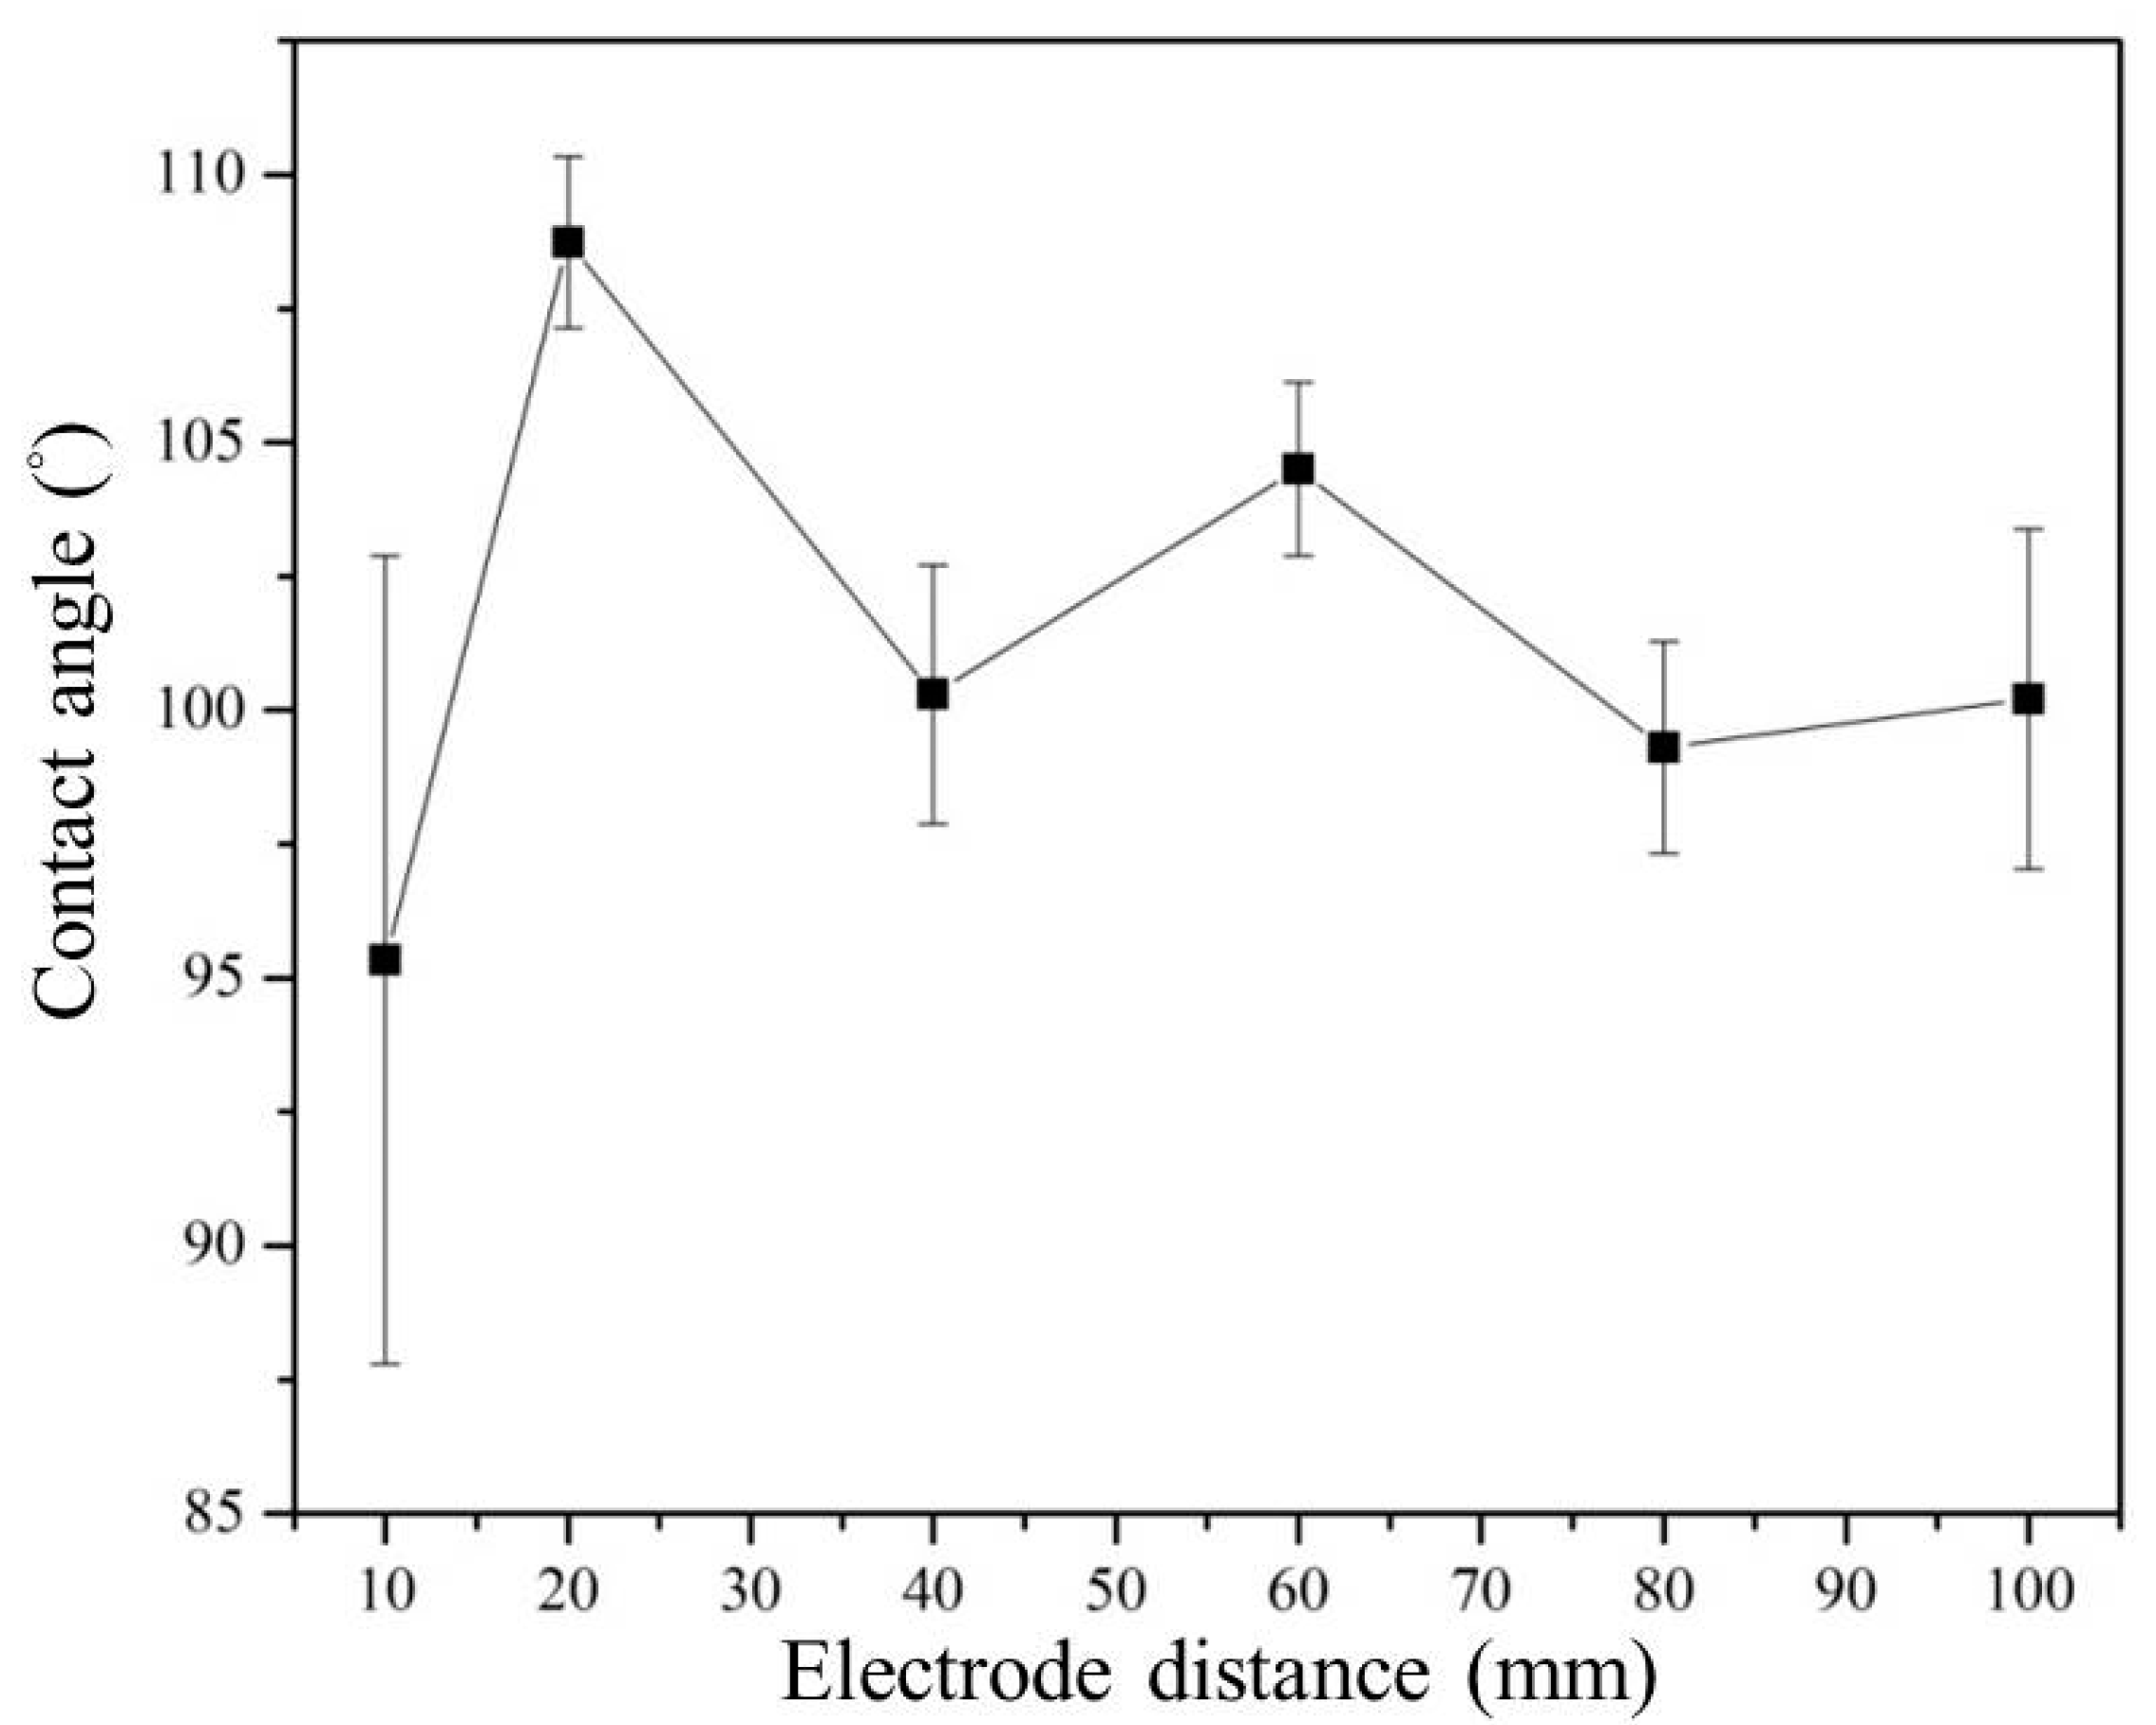
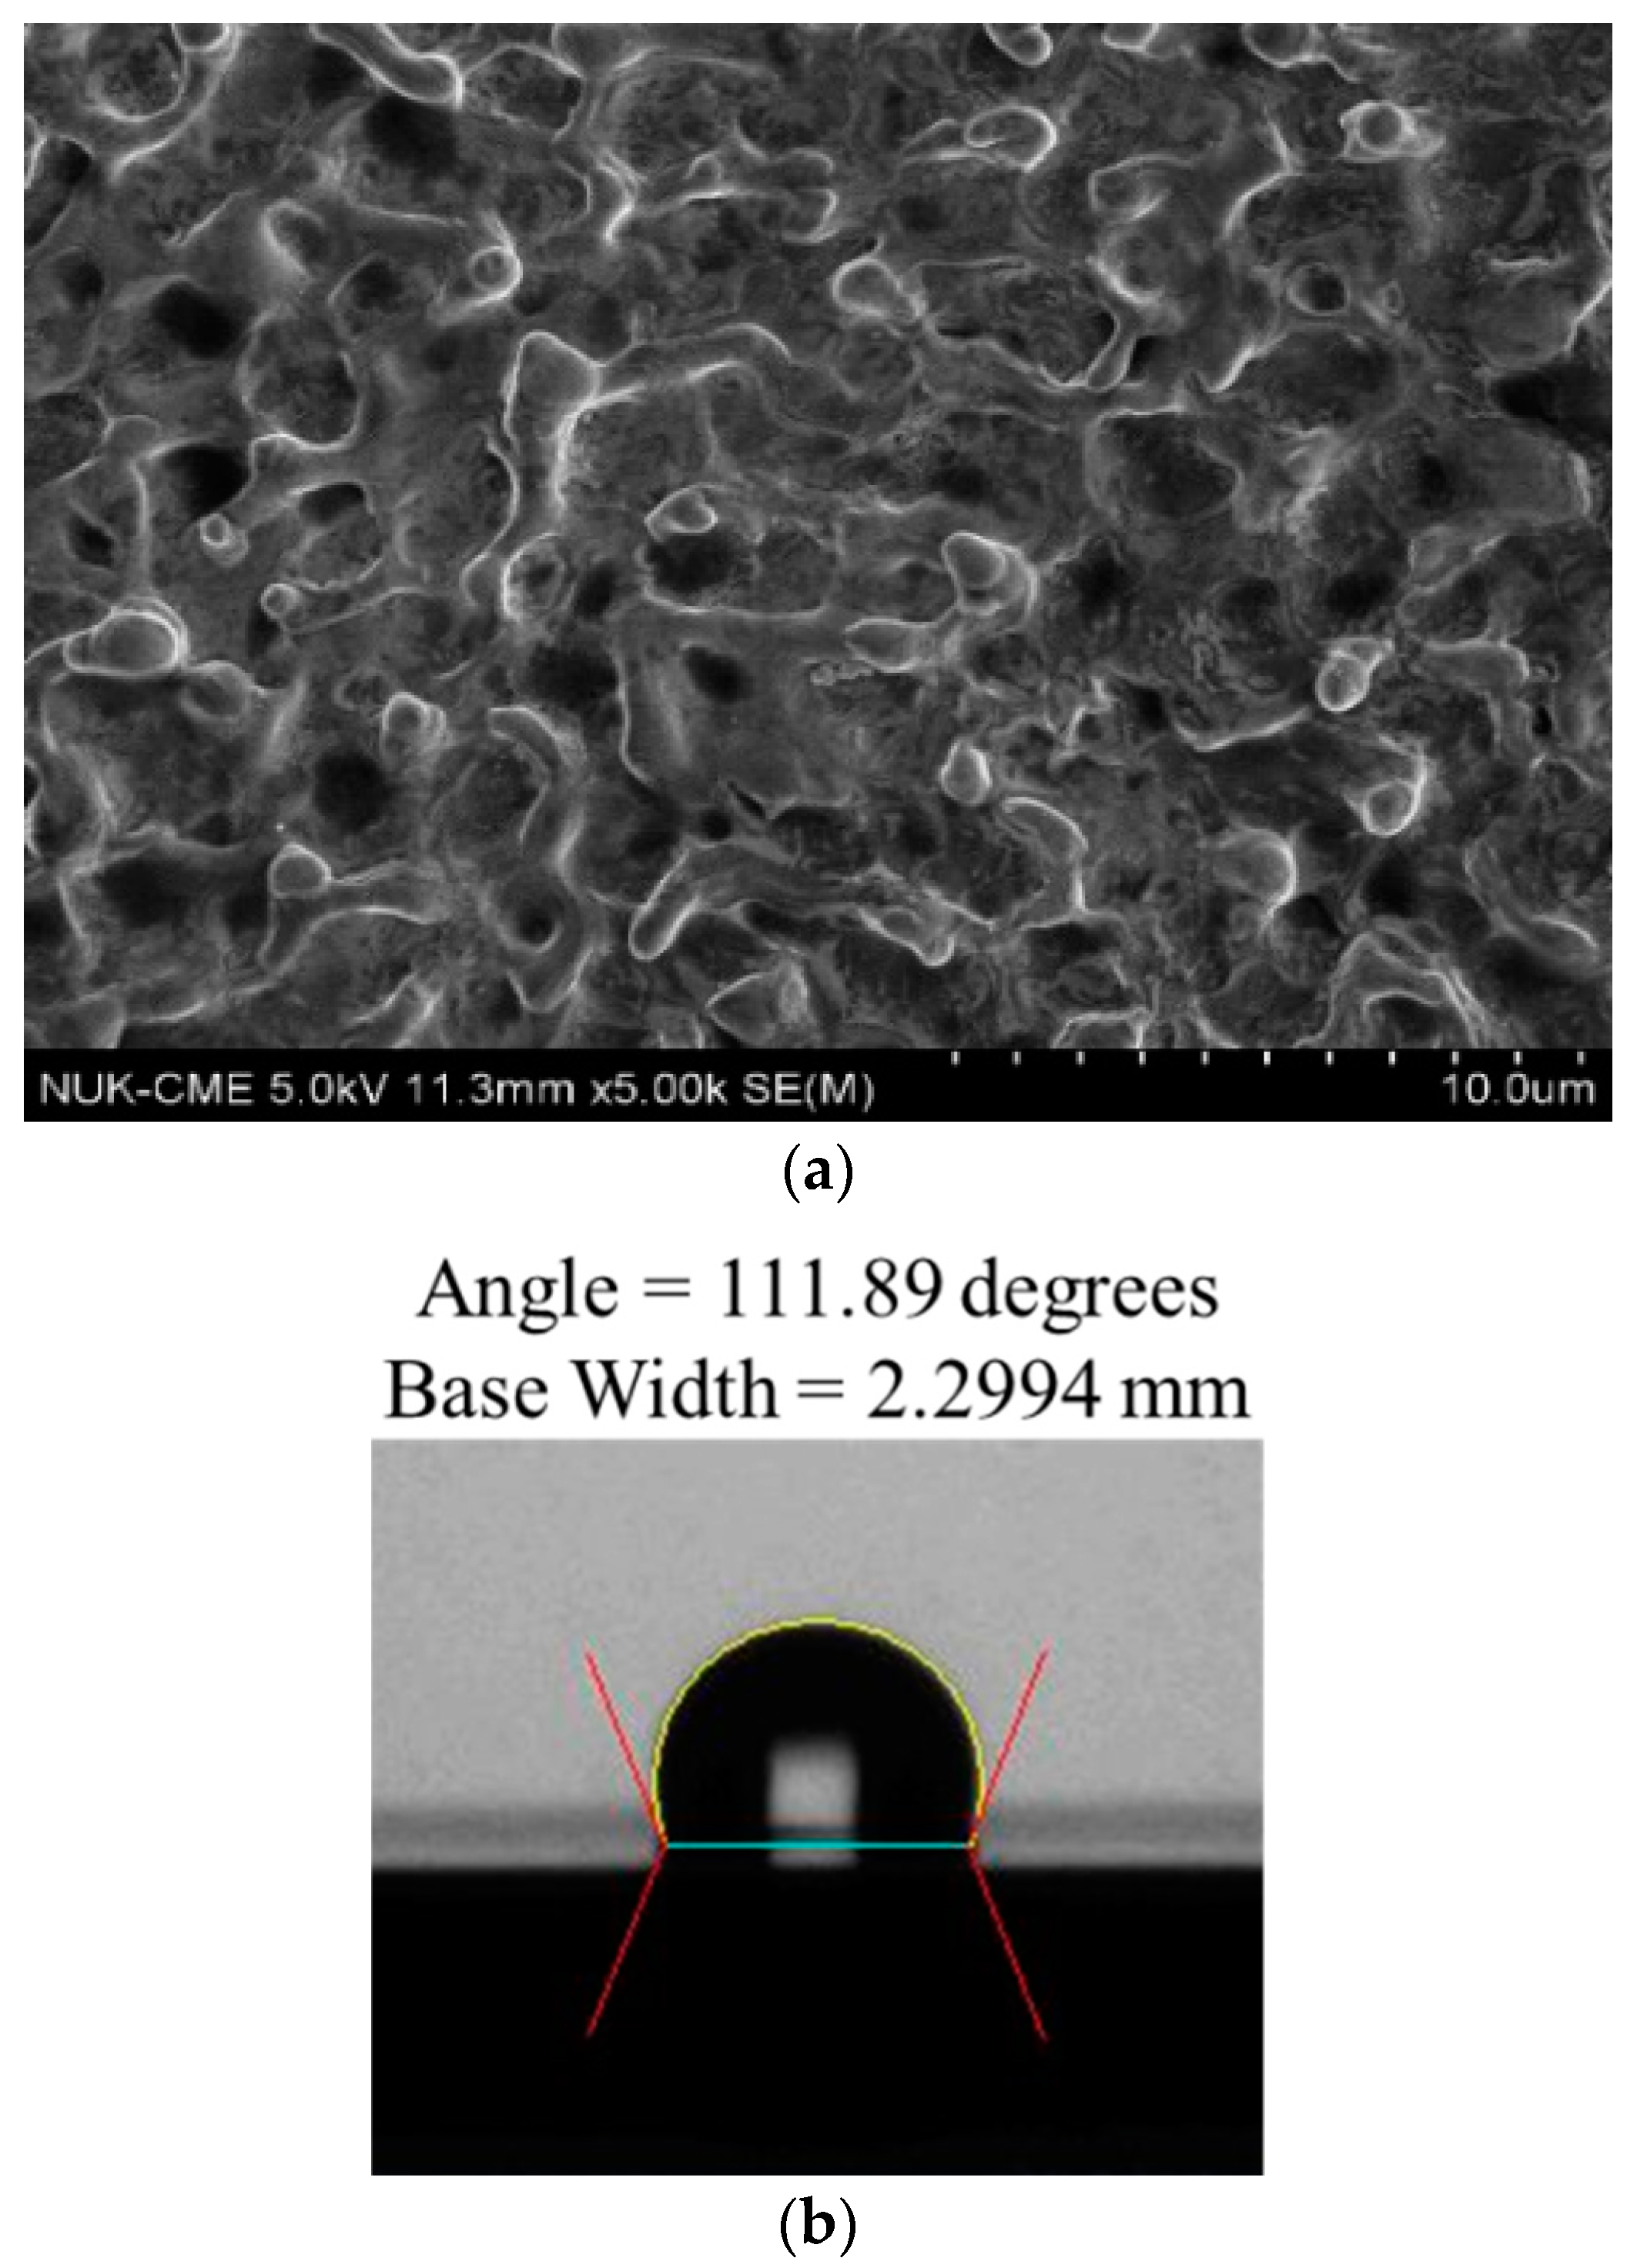
Based on the one-factor-at-a-time experimental approach, the applied voltage and cathodic specimen speed in the plasma electrolytic reaction system were set at 220 V and 0.125 mm/s. Figure 11 and Figure 12 respectively present the experimental results for the surface roughness and contact angles in terms of electrode distance. When the electrode distance was short—for example, 10 mm—the RMS surface roughness (Rq) was about 115 nm and the contact angle was highly variable because when the electrode distance was too small, the plasma electrolytic reaction was too unstable and violent. However, when the electrode distance was increased to 40–60 mm, the RMS surface roughness (Rq) was about 135 nm and the corresponding contact angle remained approximately 100°. If the electrode distance was further enlarged to 80–100 mm, the RMS surface roughness (Rq) was less than 115 nm, but its corresponding contact angle remained 100°. In addition, when the electrode distance was 20 mm, the biggest contact angle was 108.74°, with a standard deviation of 1.60 (Figure 12). The experimental result for an electrode distance of 20 mm is shown in Figure 13. In summary, we conclude that the optimal electrode distance was 20 mm, which generated a contact angle greater than 105° because the microstructure was clearly visible on the material’s surface.
4. Conclusions
This paper describes the successful design of a plasma electrolytic reaction system for cleaning the surface of a stainless steel 316 specimen, using a moving cathodic electrode to coat its surface with a microstructure and achieve self-cleaning and hydrophobic properties. The contact angle of the stainless steel 316 was 73.65°. Based on the one-factor-at-a-time experimental approach, the chosen optimal parameters for the experimental system were: applied voltage of 220 V; specimen movement speed at the cathode electrode of 0.125 mm/s; and electrode distance of 20 mm. Excellent results for cleaning the surface of the stainless steel 316 specimen were achieved using an experimental system with an RMS surface roughness (Rq) of around 120 nm and a contact angle of around 108.74°. The specimen that underwent plasma electrolysis achieved hydrophobicity. In future, we will apply the proposed cathodic plasma electrolytic reaction system to clean the surface of different titanium alloys or the surface of everyday appliances.
Author Contributions
C.-M.H. and A.-D.L. conceived and designed the experiments. C.-L.K. and W.-C.H. performed the experiments and measurements. C.-Y.C. analyzed the data and wrote and edited the paper.
Acknowledgments
The authors acknowledge partial financial support by the Ministry of Science and Technology, Taiwan, on grant numbers 106-2221-E-151-017 and 106-2622-E-110-009-CC2.
Conflicts of Interest
The authors declare no conflict of interest. The founding sponsors had no role in the design of the study; in the collection, analyses, or interpretation of data; in the writing of the manuscript; or in the decision to publish the results.
References
- Aliofkhazraei, M.; Rouhaghdam, A.S. Fabrication of Nanostructures by Plasma Electrolysis; Wiley-VCH Verlag GmbH & Go. KGaA: Weinheim, Germany, 2010. [Google Scholar] [CrossRef]
- Parfenov, E.V.; Yerokhin, A.; Nevyantseva, R.R.; Gorbatkov, M.V.; Liang, C.-J.; Matthews, A. Towards smart electrolytic plasma technologies: An overview of methodological approaches to process modeling. Surf. Coat. Technol. 2015, 269, 2–22. [Google Scholar] [CrossRef]
- Yerokhin, A.L.; Nie, X.; Leyland, A.; Matthews, A. Characterization of oxide films produced by plasma electrolytic oxidation of a Ti–6Al–4V alloy. Surf. Coat. Technol. 2000, 130, 195–206. [Google Scholar] [CrossRef]
- Snizhkoa, L.O.; Yerokhin, A.L.; Pilkington, A.; Gurevina, N.L.; Misnyankin, D.O.; Leyland, A.; Matthews, A. Anodic processes in plasma electrolytic oxidation of aluminum in alkaline solutions. Electrochim. Acta 2004, 49, 2085–2095. [Google Scholar] [CrossRef]
- Gu, W.; Shen, D.; Wang, Y.; Chen, G.; Feng, W.; Zhang, G.; Fan, S.; Liu, C.; Yang, S. Deposition of duplex Al2O3/aluminum coatings on steel using a combined technique of arc spraying and plasma electrolytic oxidation. Appl. Surf. Sci. 2006, 252, 2927–2932. [Google Scholar] [CrossRef]
- Ma, Y.; Nie, X.; Northwood, D.O.; Hu, H. Systematic study of the electrolytic plasma oxidation process on a Mg alloy for corrosion protection. Thin Solid Films 2006, 494, 296–301. [Google Scholar] [CrossRef]
- Liang, J.; Hu, L.; Hao, J. Improvement of corrosion properties of microarc oxidation coating on magnesium alloy by optimizing current density parameters. Appl. Surf. Sci. 2007, 253, 6939–6945. [Google Scholar] [CrossRef]
- Mu, W.; Han, Y. Study on Micro-Arc Oxidized Coatings on Magnesium in Three Different Electrolytes. Rare Met. Mater. Eng. 2010, 39, 1129–1134. [Google Scholar]
- Moon, S. Corrosion behavior of PEO treated AZ31 Mg alloy in chloride solution. J. Solid State Electrochem. 2014, 18, 341–346. [Google Scholar] [CrossRef]
- Cui, X.-J.; Lin, X.-Z.; Liu, C.-H.; Yang, R.-S.; Zheng, X.-W.; Gong, M. Fabrication and corrosion resistance of a hydrophobic micro-arc oxidation coating on AZ31 Mg alloy. Corros. Sci. 2015, 90, 402–412. [Google Scholar] [CrossRef]
- Krishna, L.R.; Poshal, G.; Jyothirmayi, A.; Sundararajan, G. Relative hardness and corrosion behavior of micro arc oxidation coatings deposited on binary and ternary magnesium alloys. Mater. Des. 2015, 77, 6–14. [Google Scholar] [CrossRef]
- Gupta, P.; Tenhundfeld, G.; Daigle, E.O.; Ryabkov, D. Electrolytic plasma technology: Science and engineering—An overview. Surf. Coat. Technol. 2007, 201, 8746–8760. [Google Scholar] [CrossRef]
- Schilling, P.J.; Herrington, P.D.; Daigle, E.O.; Meletis, E. Surface characteristics of structural steel processed using electro-plasma techniques. J. Mater. Eng. Perform. 2002, 11, 26–31. [Google Scholar] [CrossRef]
- Meletis, E.I.; Nie, X.; Wang, F.L.; Jiang, J.C. Electrolytic plasma processing for cleaning and metal-coating of steel surfaces. Surf. Coat. Technol. 2002, 150, 246–256. [Google Scholar] [CrossRef]
- Kumruoglu, L.C.; Özel, A. Electrolytic Plasma Surface Cleaning of Industrial Metallic Components. Acta Phys. Pol. A 2014, 125, 379–381. [Google Scholar] [CrossRef]
- Cheng, M.-H.; Liang, T.-J.; Chen, S.-M. A Phase-Shift Resonant Power System with Novel Plasma Impedance Measurement Methodology for Plasma Cleaning Applications. In Proceedings of the 2017 IEEE 3rd International Future Energy Electronics Conference and ECCE Asia (IFEEC 2017—ECCE Asia), Kaohsiung, Taiwan, 3–7 June 2017. [Google Scholar] [CrossRef]
- Lin, A.-D.; Kung, C.-L.; Cao, Y.-Q.; Hsu, C.-M.; Chen, C.-Y. Stainless Steel Surface Coating with Nanocrystalline Ag Film by Plasma Electrolysis Technology. Coatings 2018, 8, 222. [Google Scholar] [CrossRef]
Figure 1.
Flowchart of the experimental procedure; AFM: atomic force microscopes.
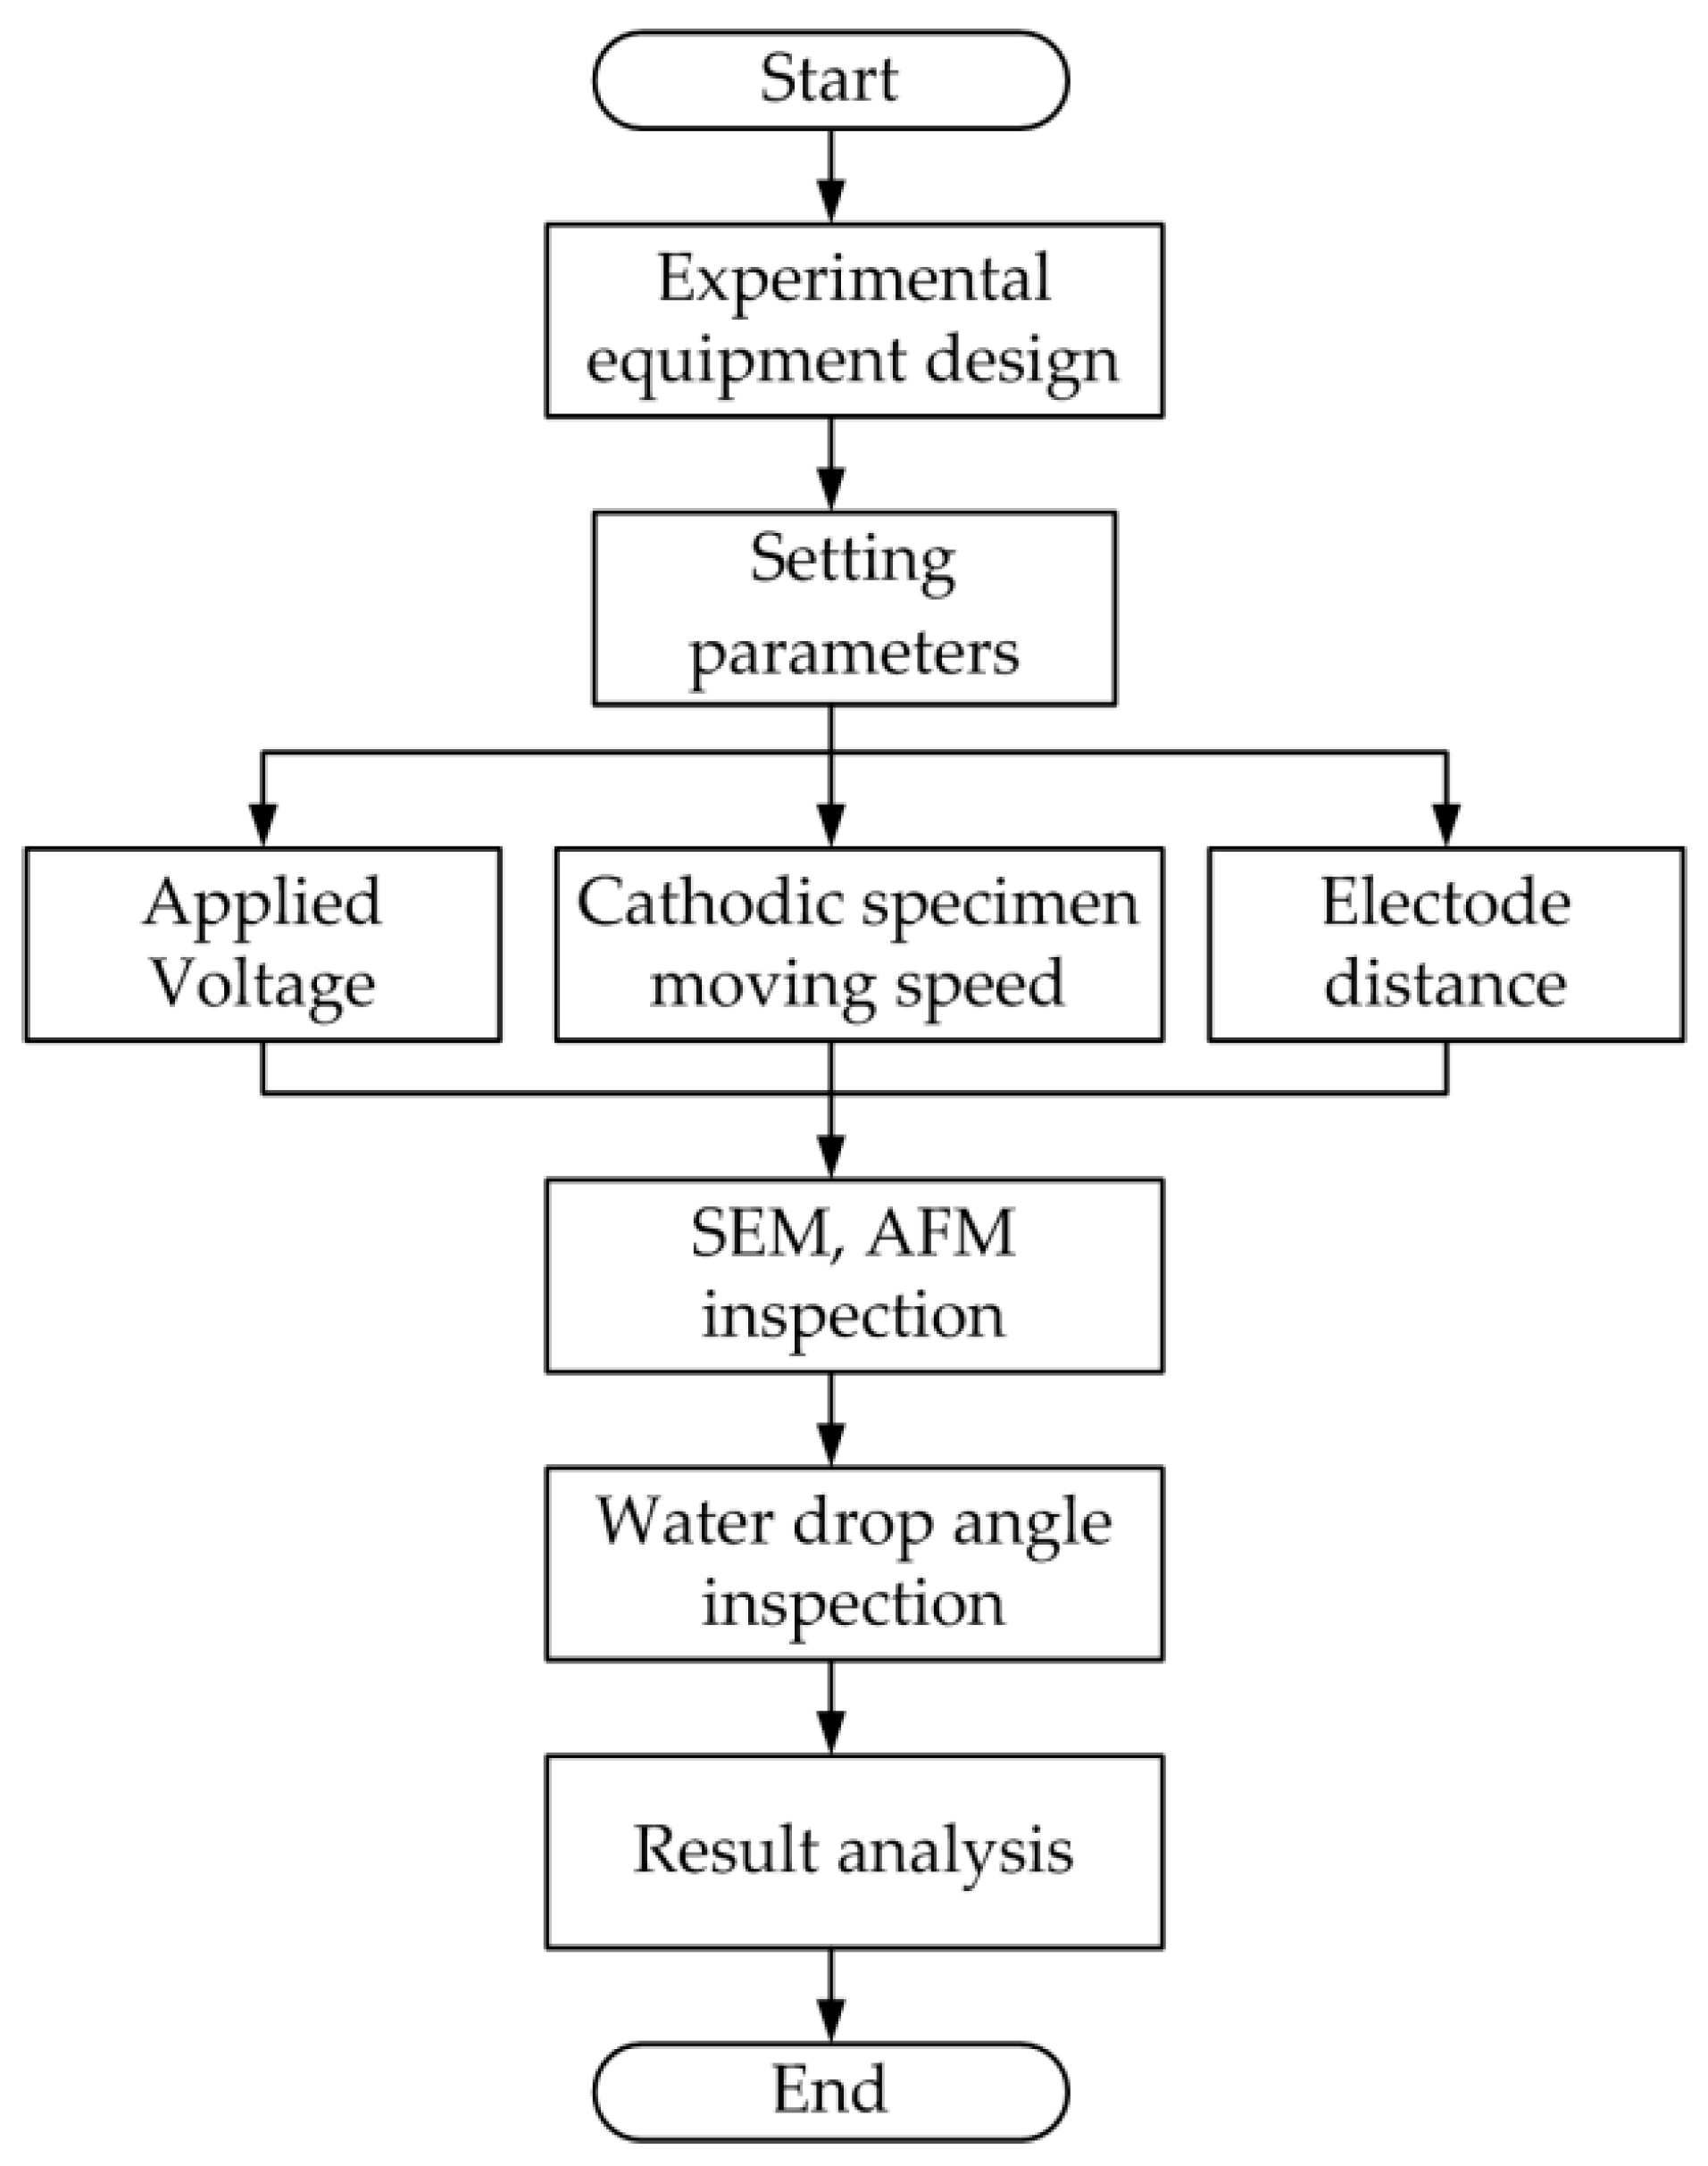
Figure 2.
Plasma electrolytic equipment for cleaning the surface of stainless steel 316: (a) configuration diagram; (b) detailed view of the reaction system components; DC: direct current.
Figure 2.
Plasma electrolytic equipment for cleaning the surface of stainless steel 316: (a) configuration diagram; (b) detailed view of the reaction system components; DC: direct current.
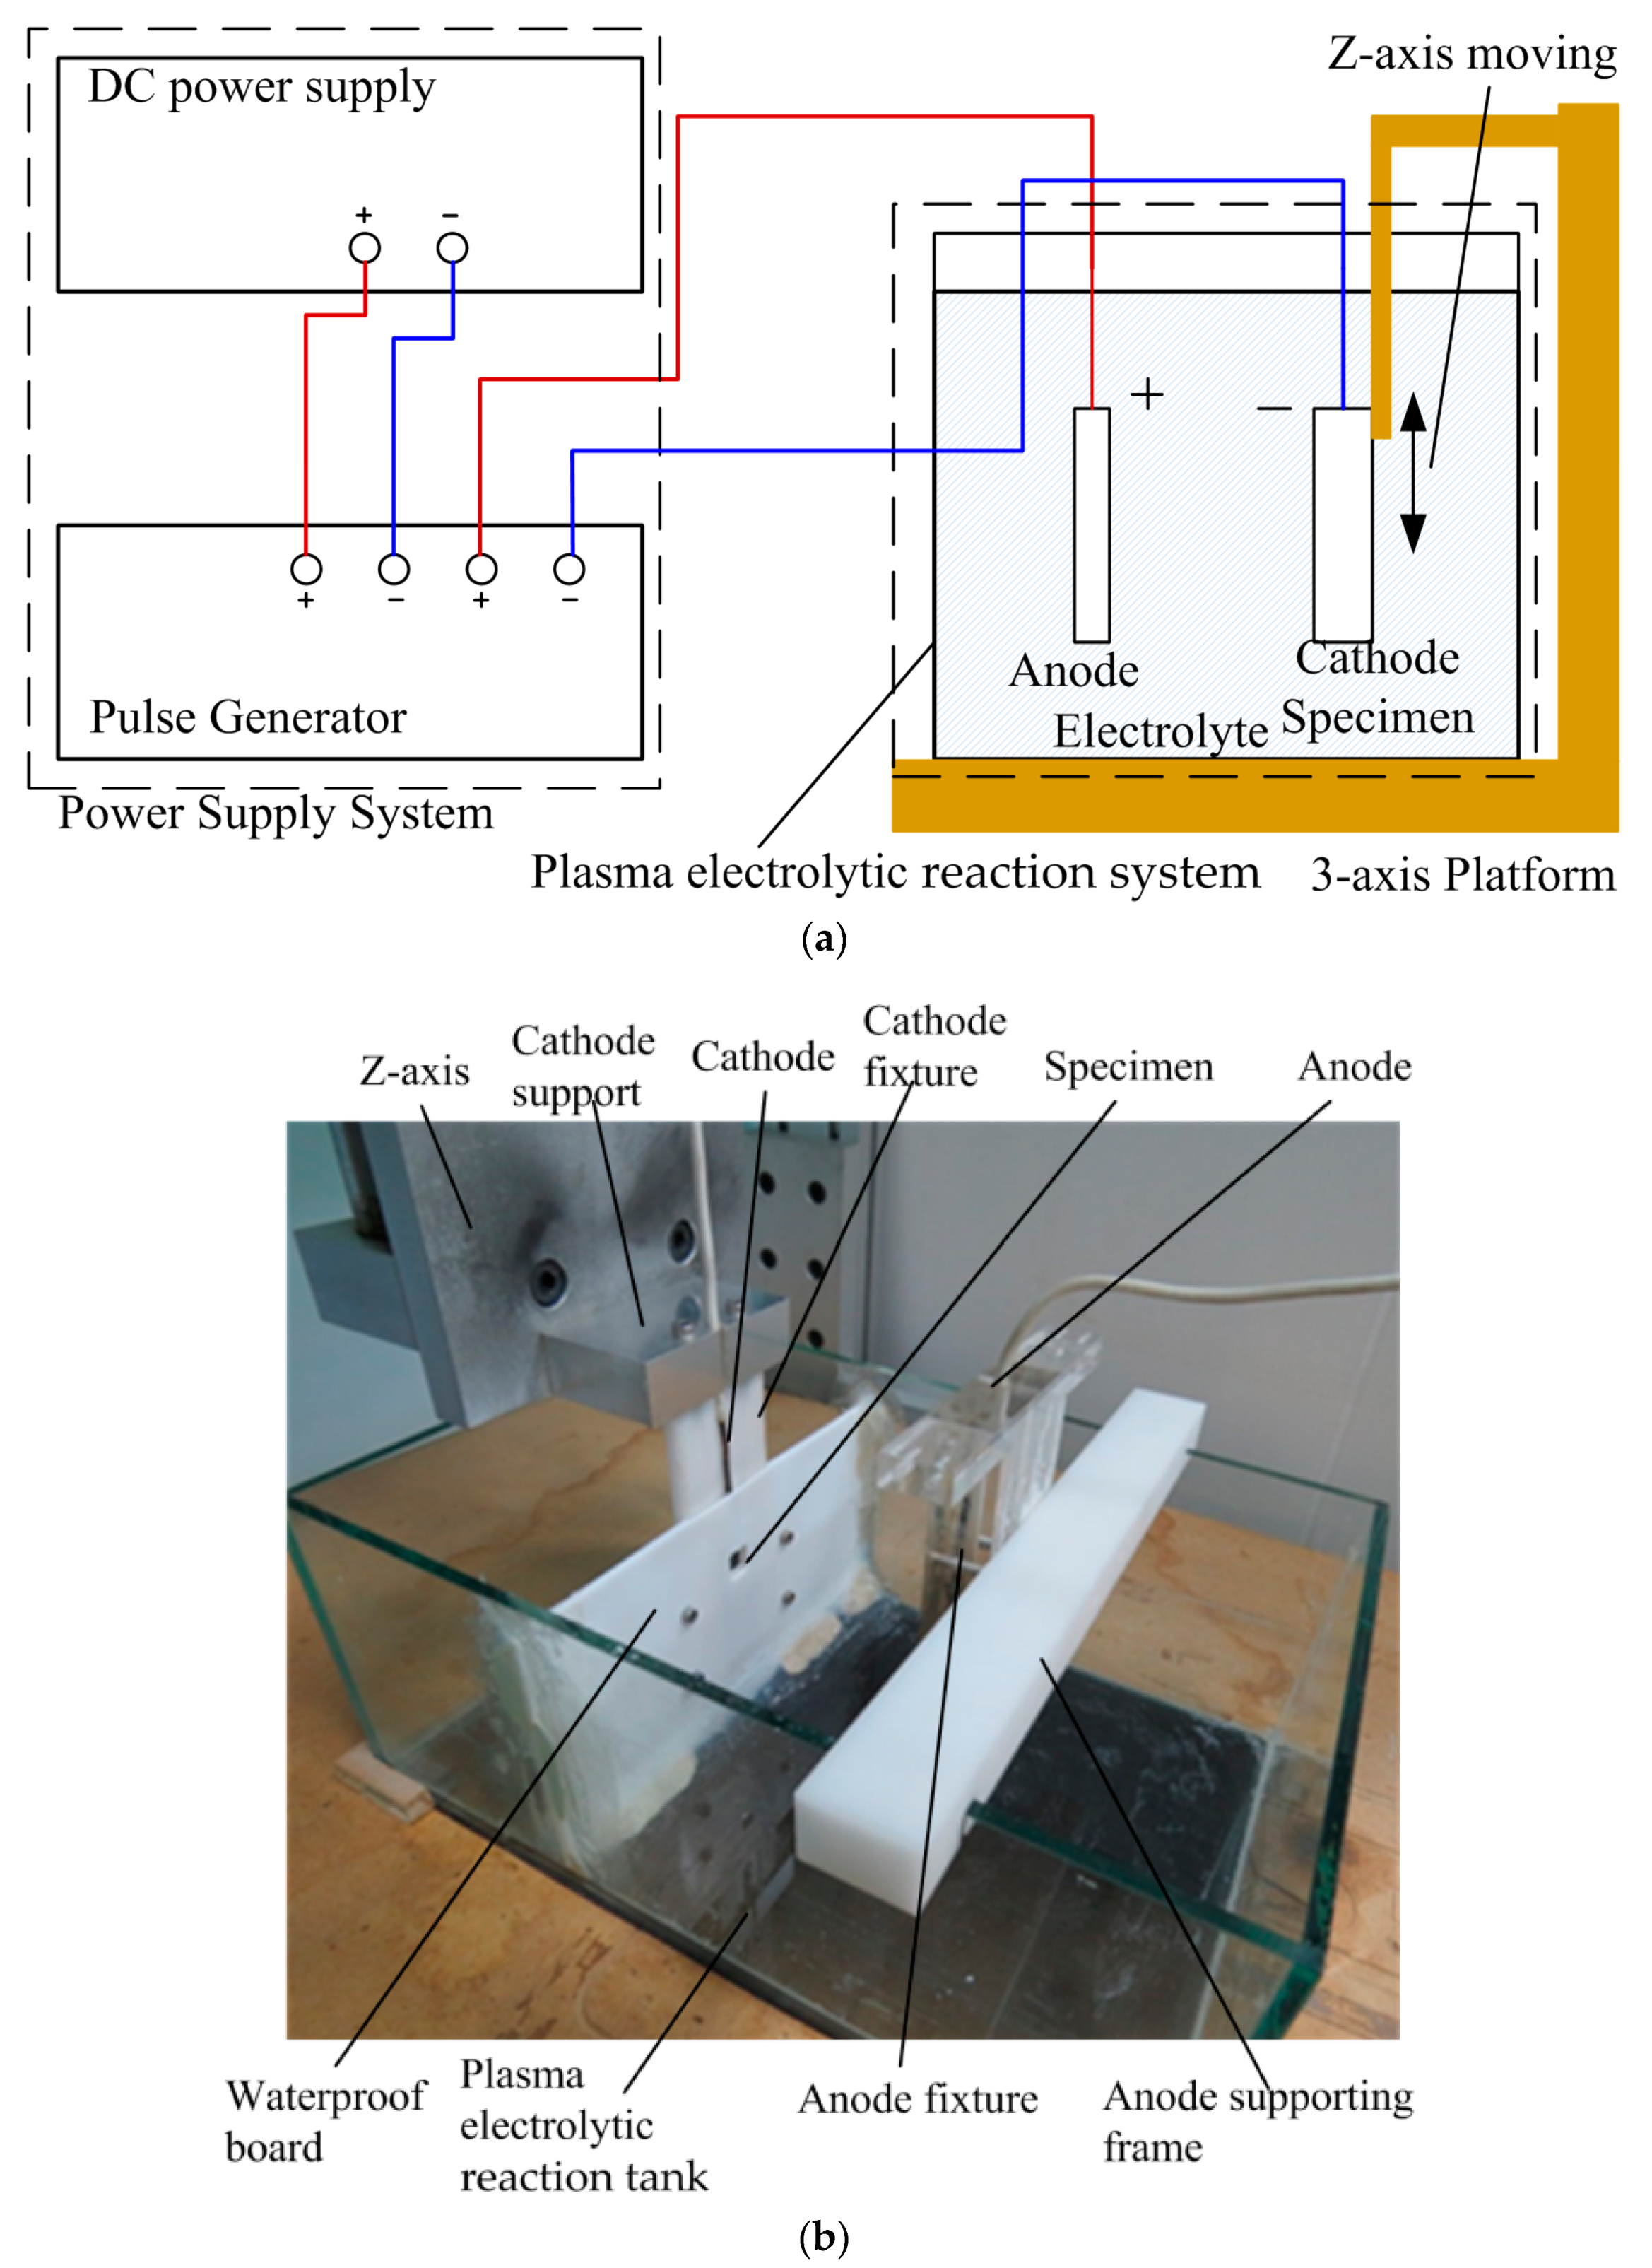
Figure 3.
Five measurement points for the surface roughness of the specimen.
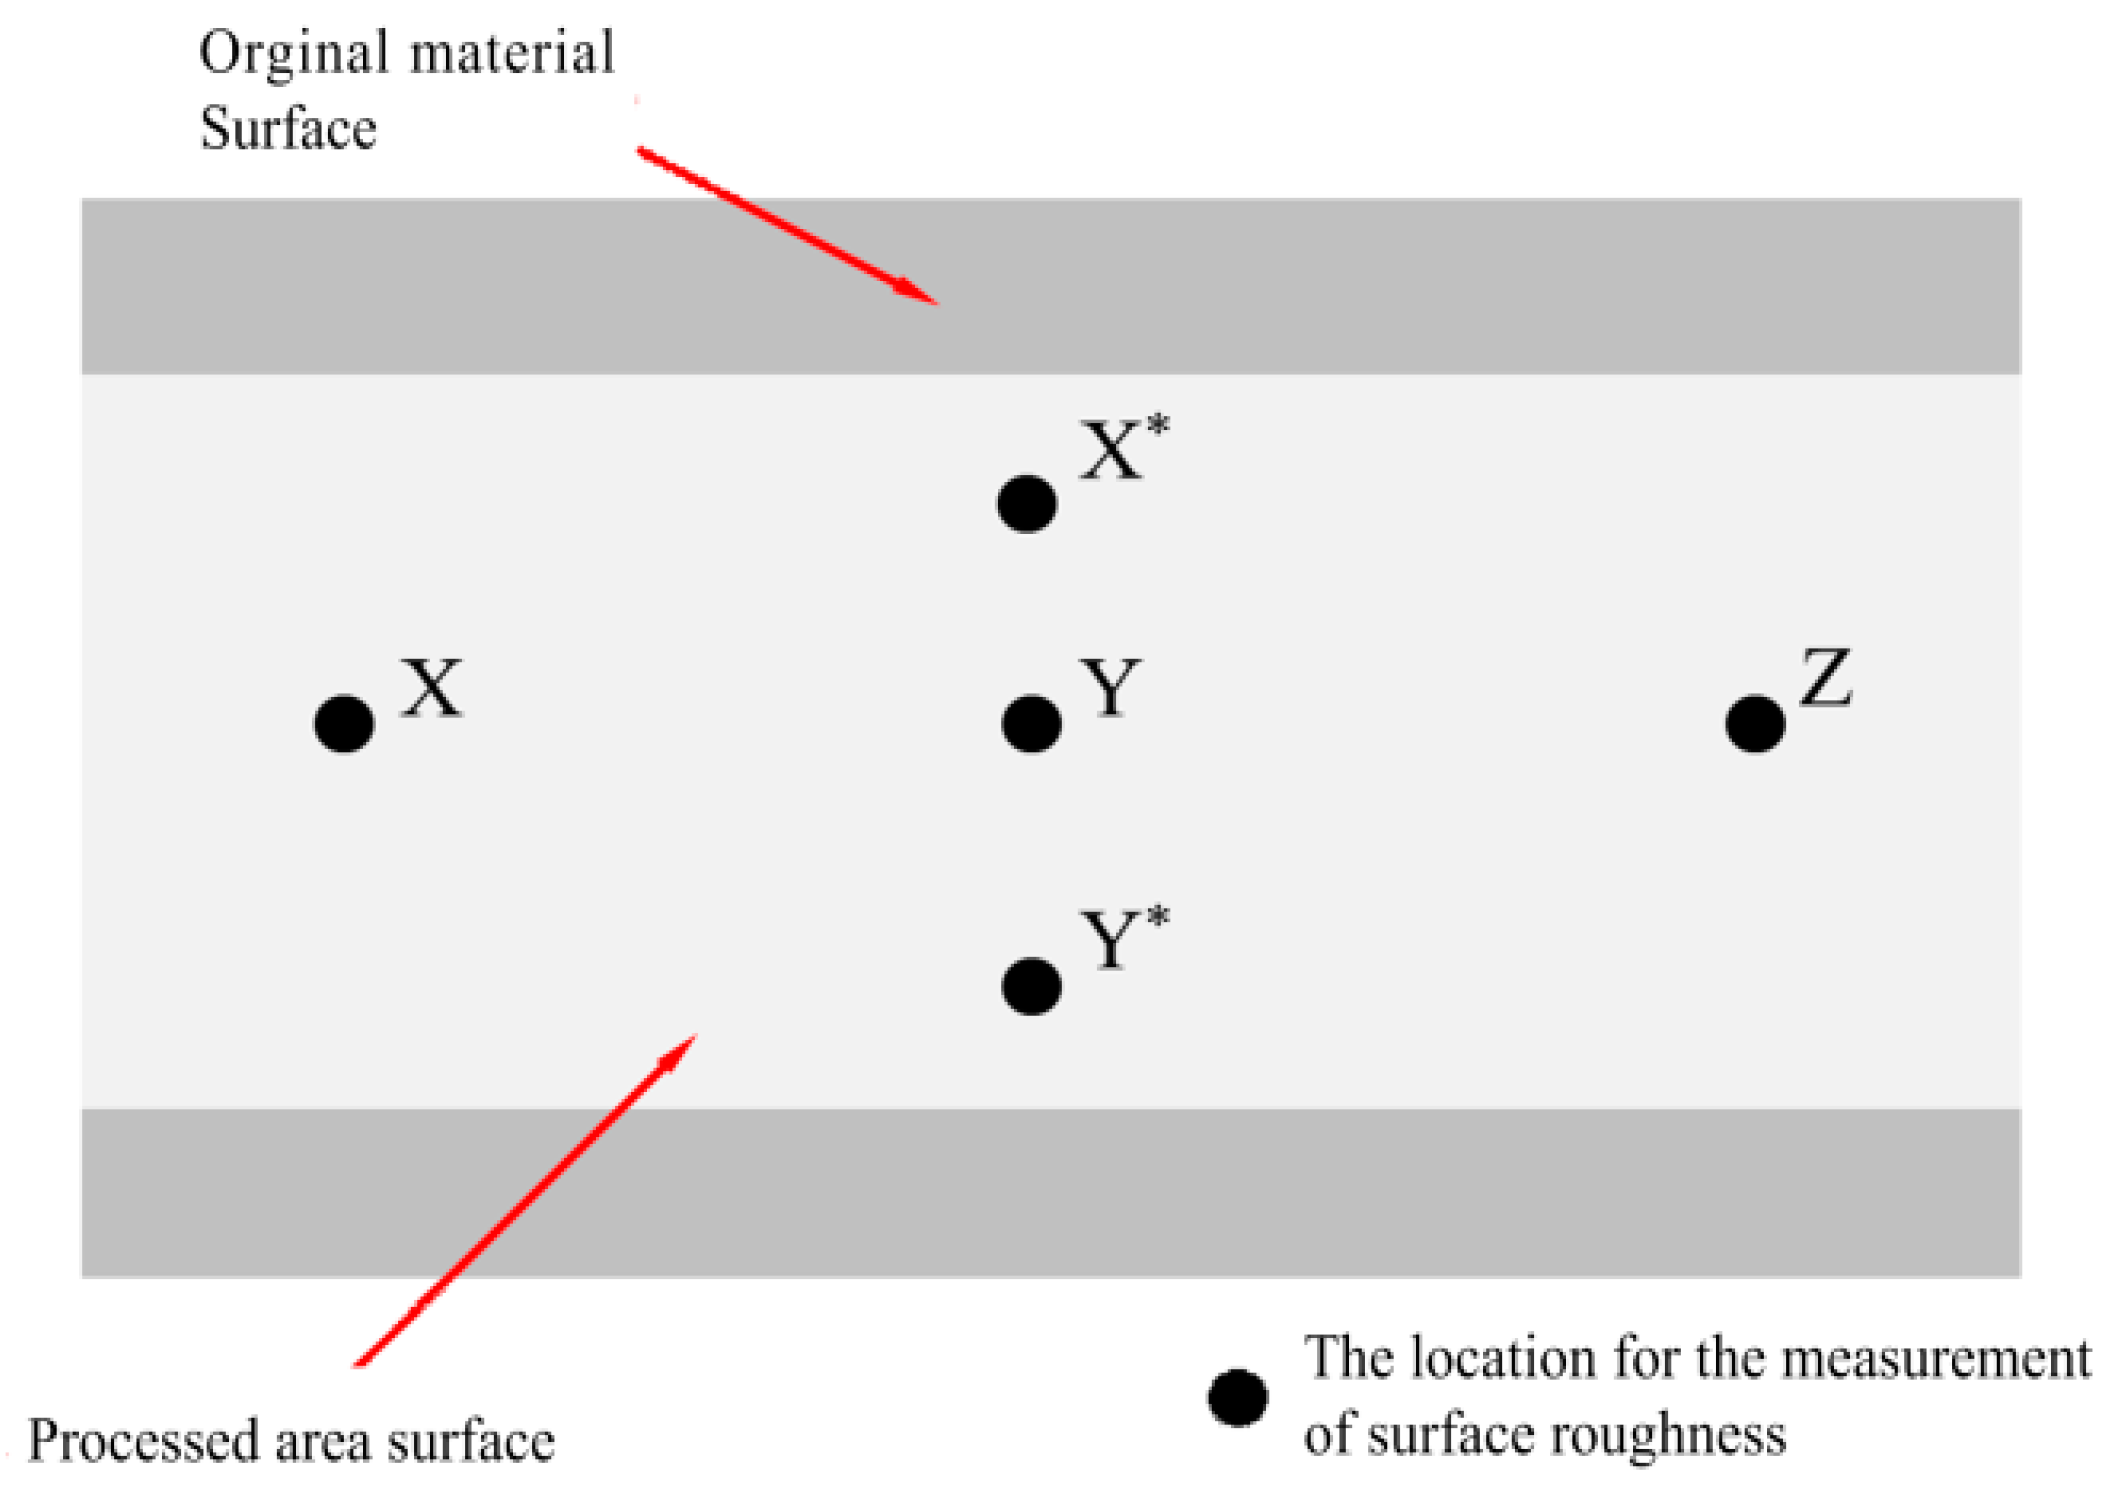
Figure 4.
Surface roughness Rq mean and standard deviation values with respect to the applied voltage when an electrode distance of 20 mm and the cathodic specimen speed of 0.25 mm/s are fixed.
Figure 4.
Surface roughness Rq mean and standard deviation values with respect to the applied voltage when an electrode distance of 20 mm and the cathodic specimen speed of 0.25 mm/s are fixed.
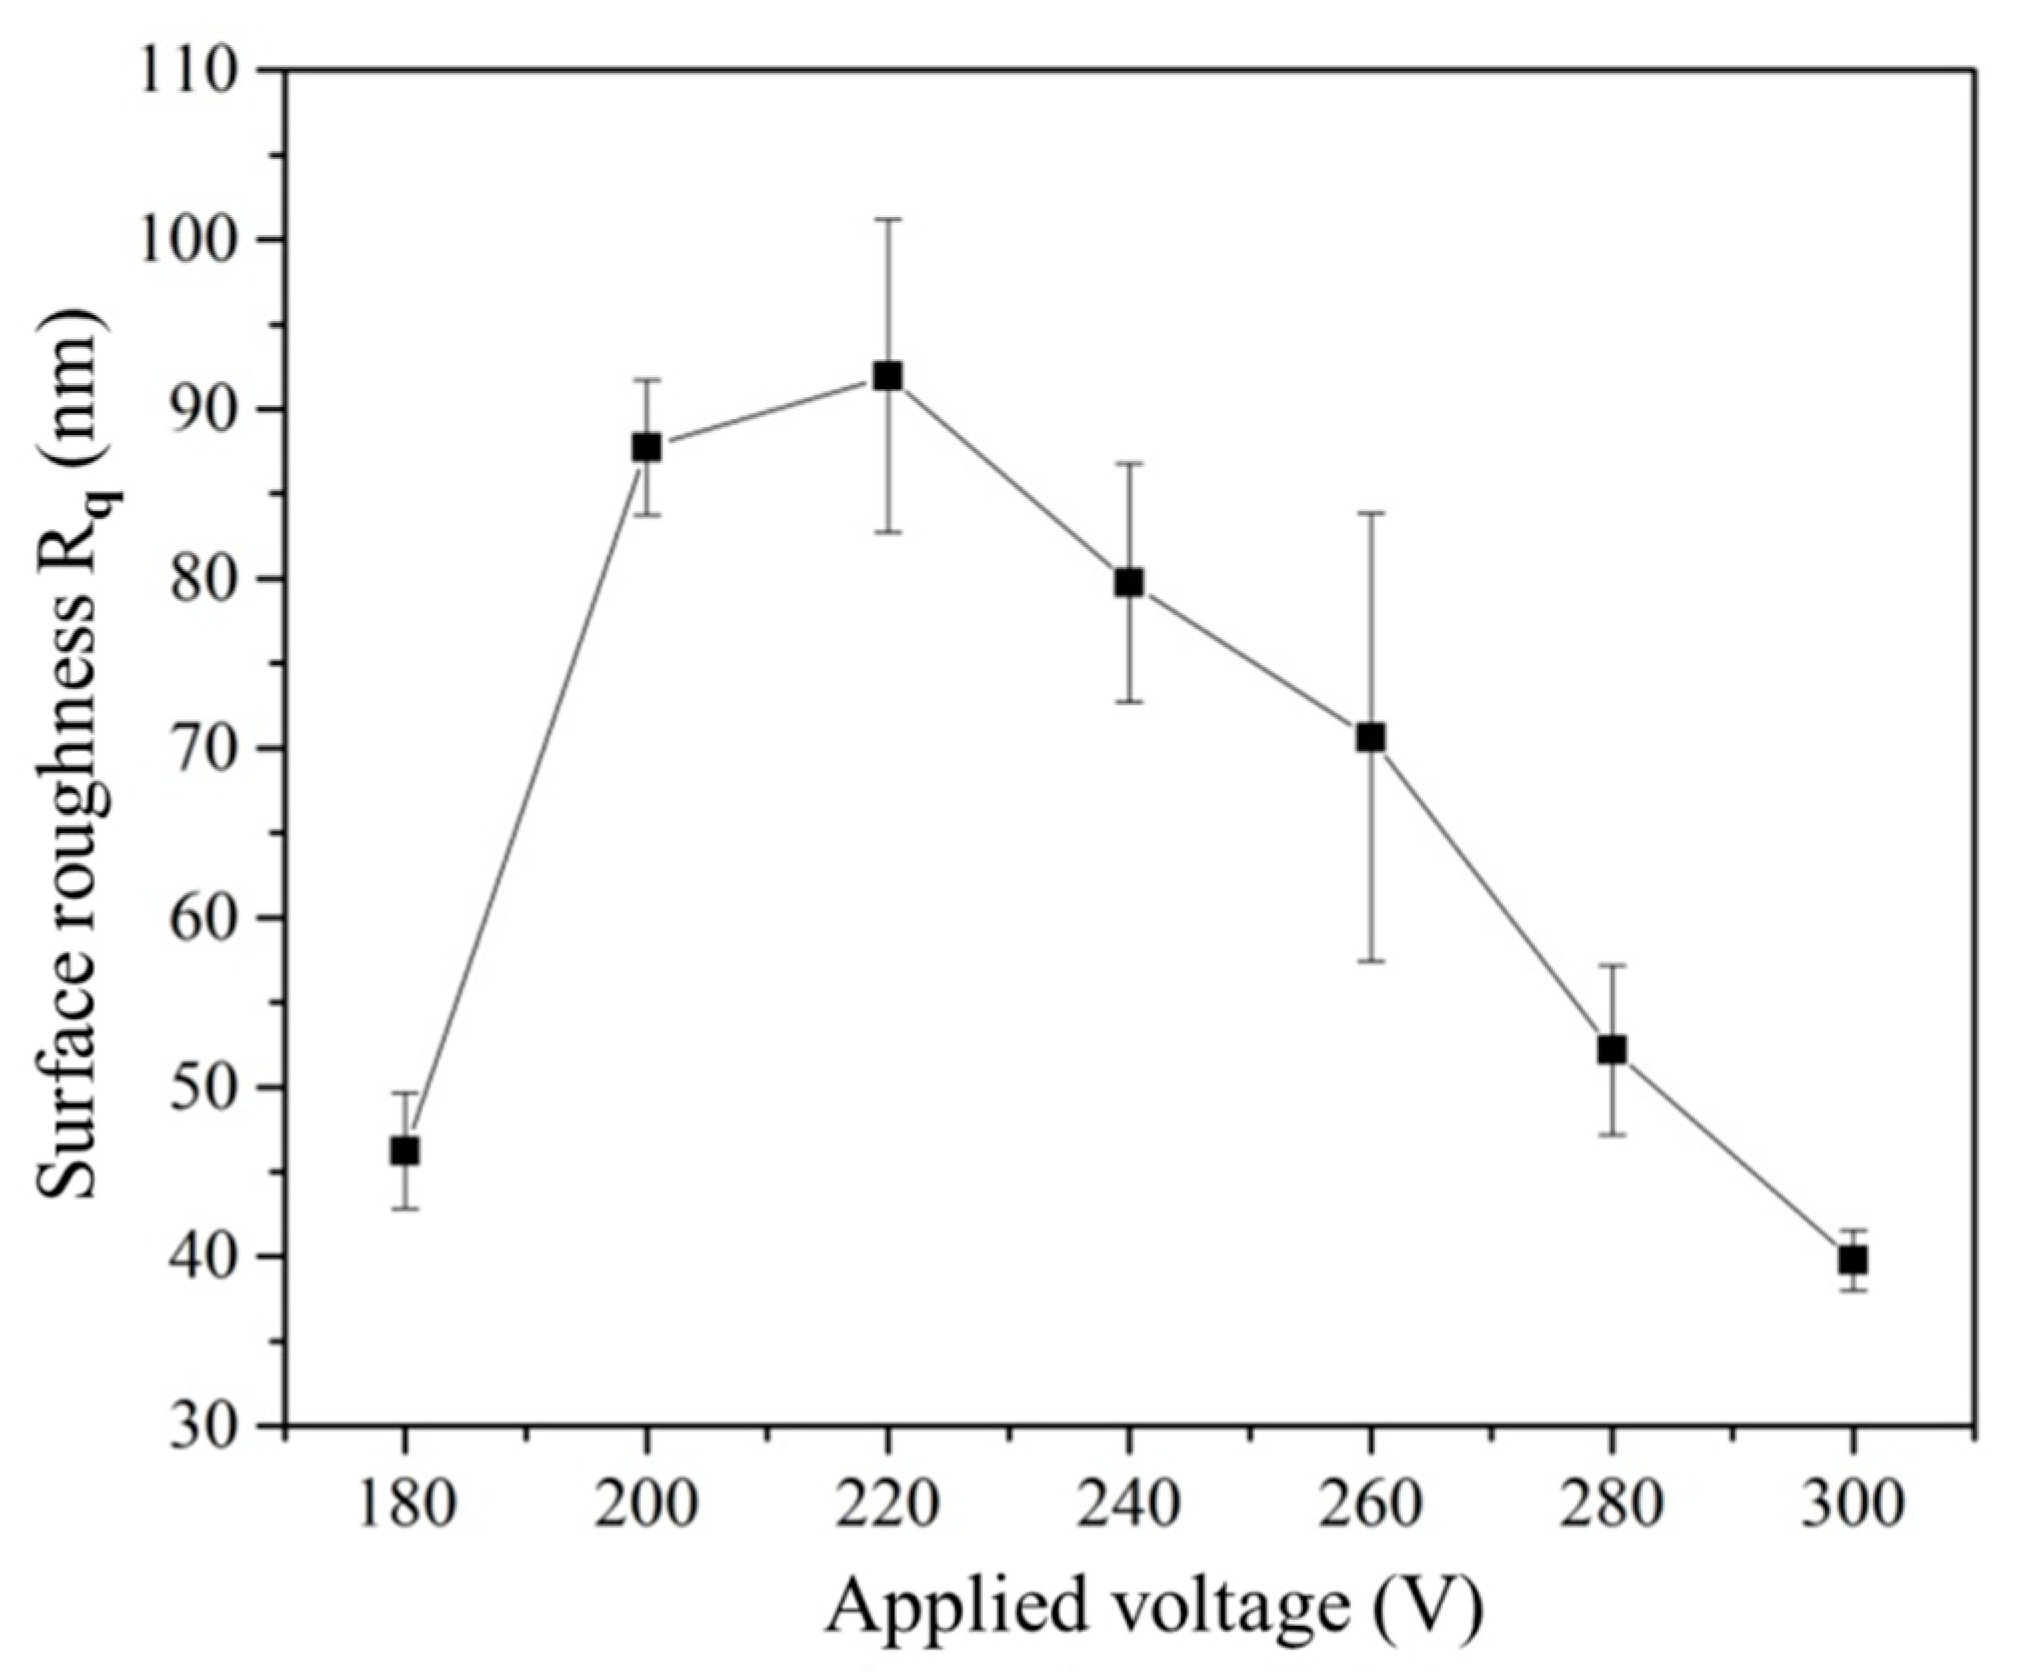
Figure 5.
SEM at 10,000× when the applied voltage was (a) 180, (b) 220, (c) 260, and (d) 300 V, for the fixed electrode distance of 20 mm and cathodic specimen speed of 0.25 mm/s; NUK-CME: National University of Kaohsiung-Chemical and Materials Engineering.
Figure 5.
SEM at 10,000× when the applied voltage was (a) 180, (b) 220, (c) 260, and (d) 300 V, for the fixed electrode distance of 20 mm and cathodic specimen speed of 0.25 mm/s; NUK-CME: National University of Kaohsiung-Chemical and Materials Engineering.
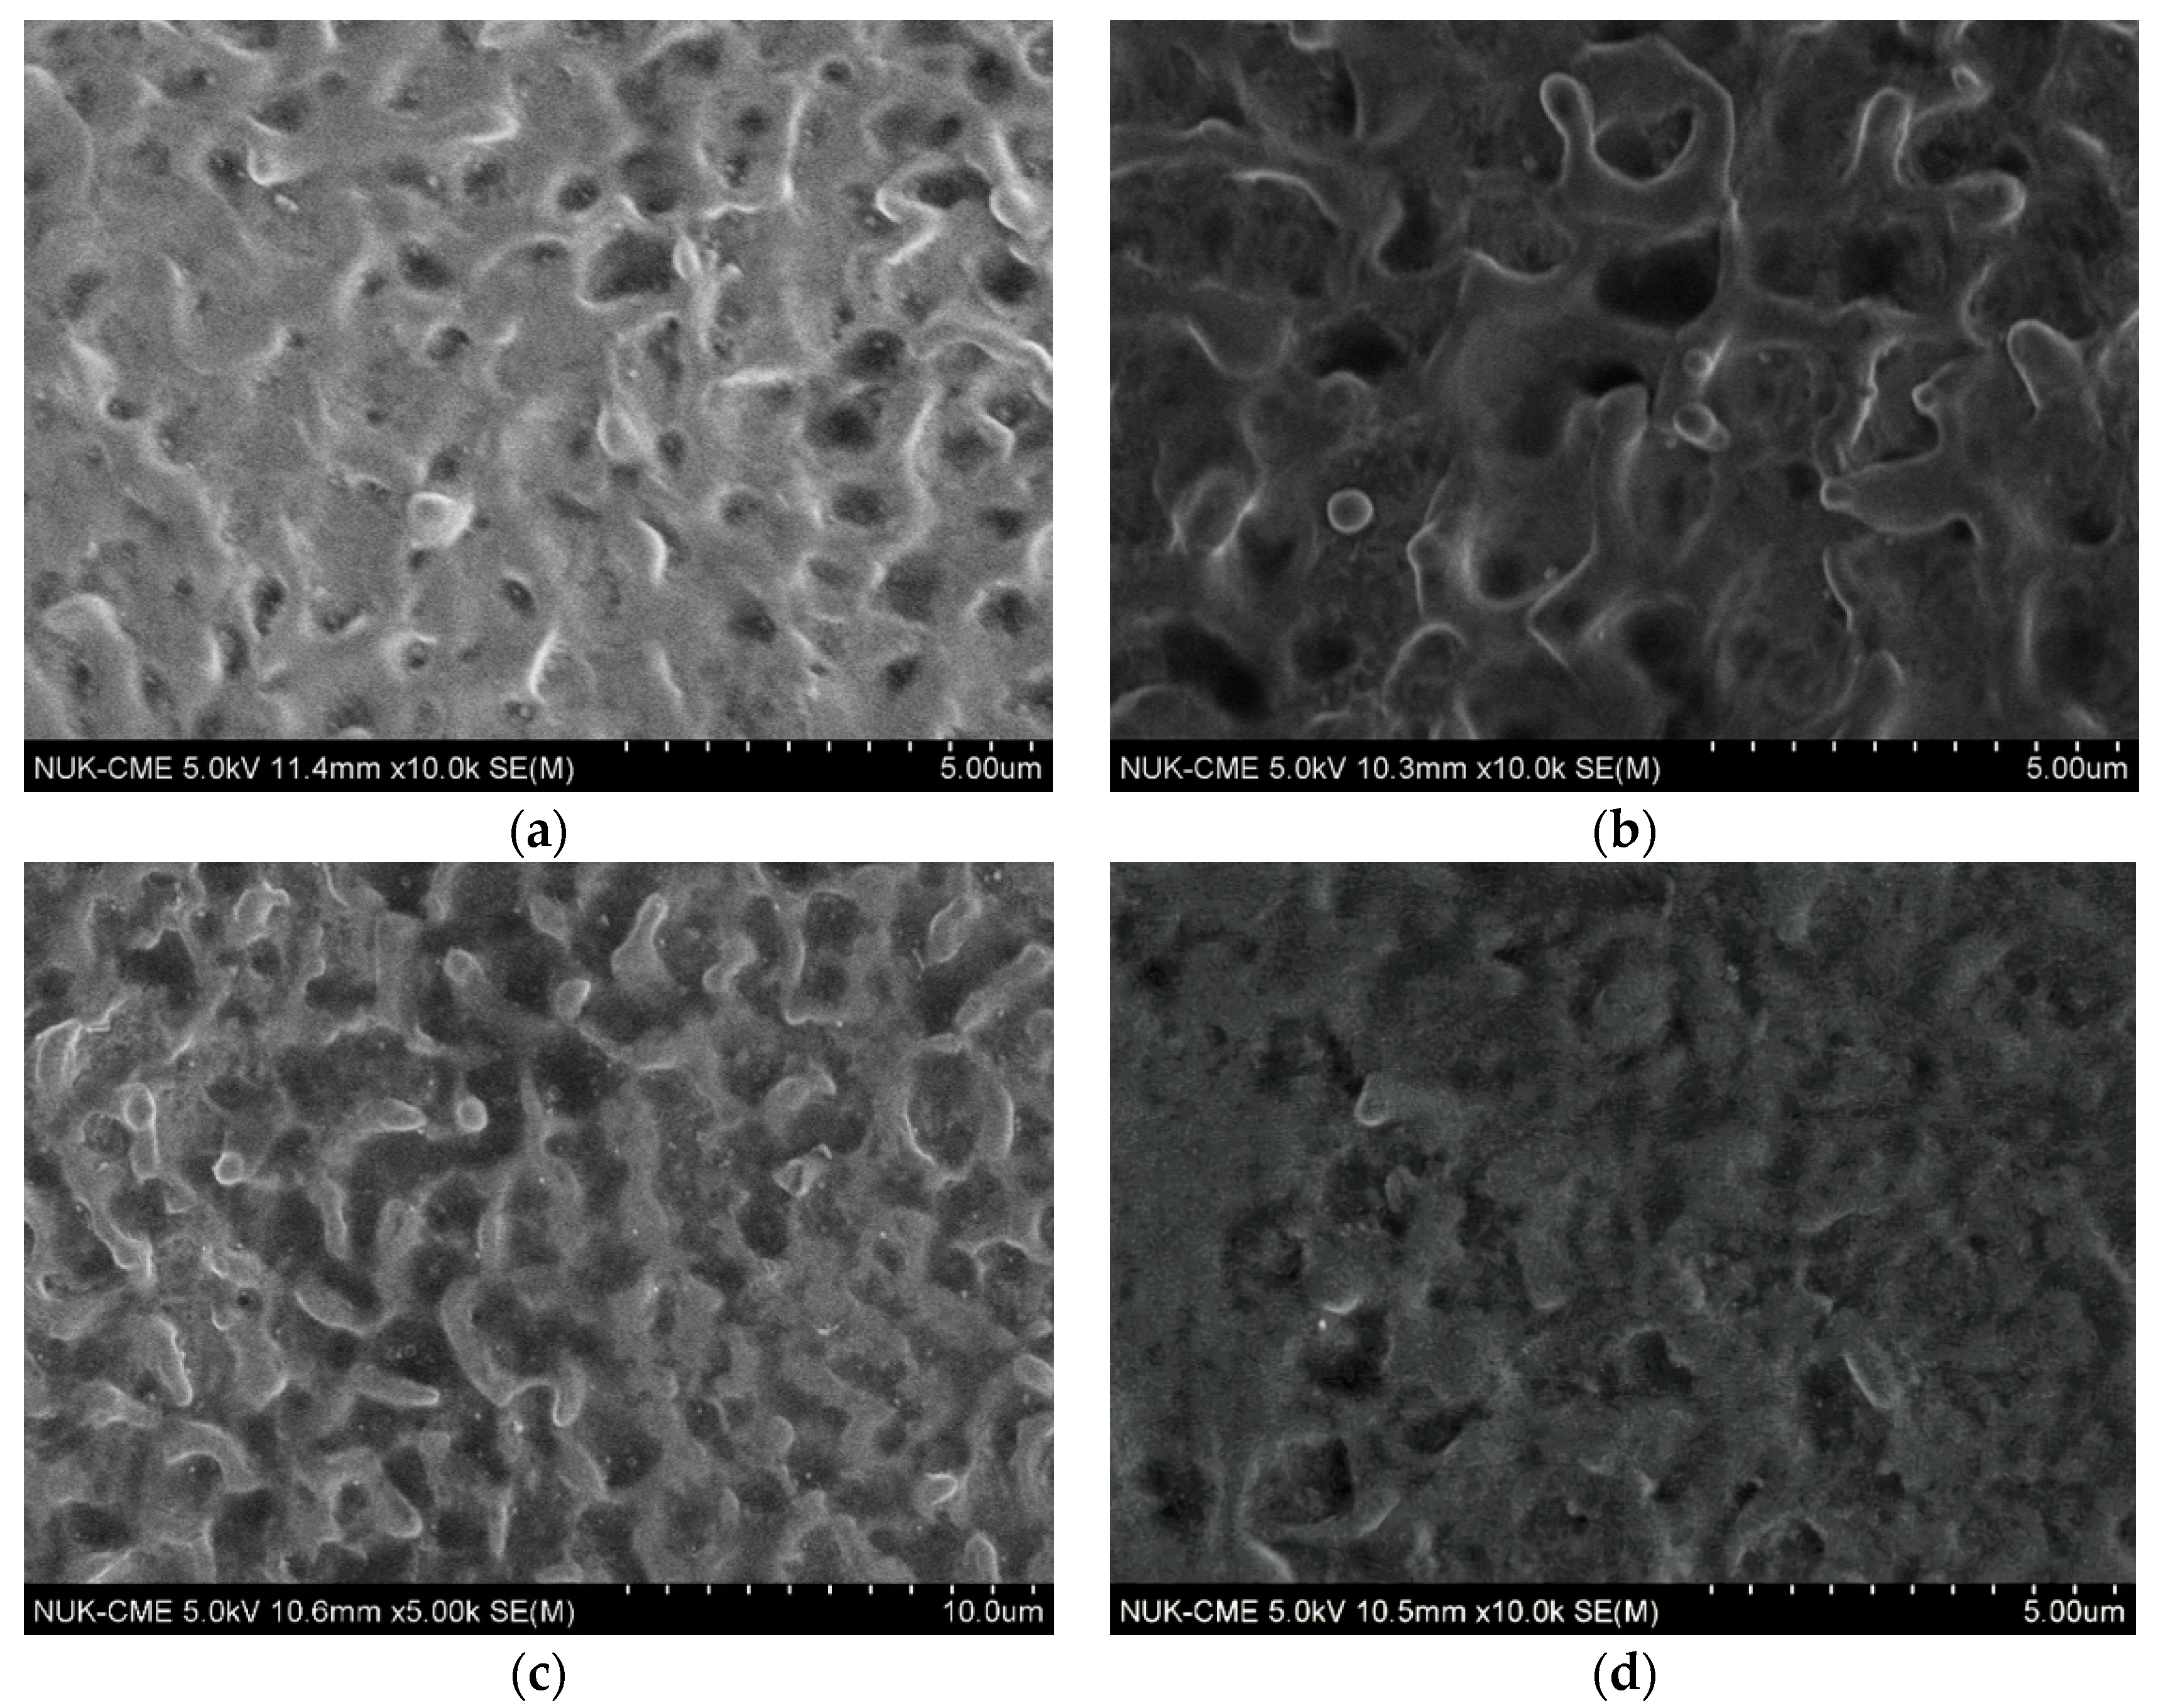
Figure 6.
AFM photo when the applied voltage was (a) 180, (b) 220, (c) 260, and (d) 300 V, for the fixed electrode distance of 20 mm and cathodic specimen speed of 0.25 mm/s.
Figure 6.
AFM photo when the applied voltage was (a) 180, (b) 220, (c) 260, and (d) 300 V, for the fixed electrode distance of 20 mm and cathodic specimen speed of 0.25 mm/s.
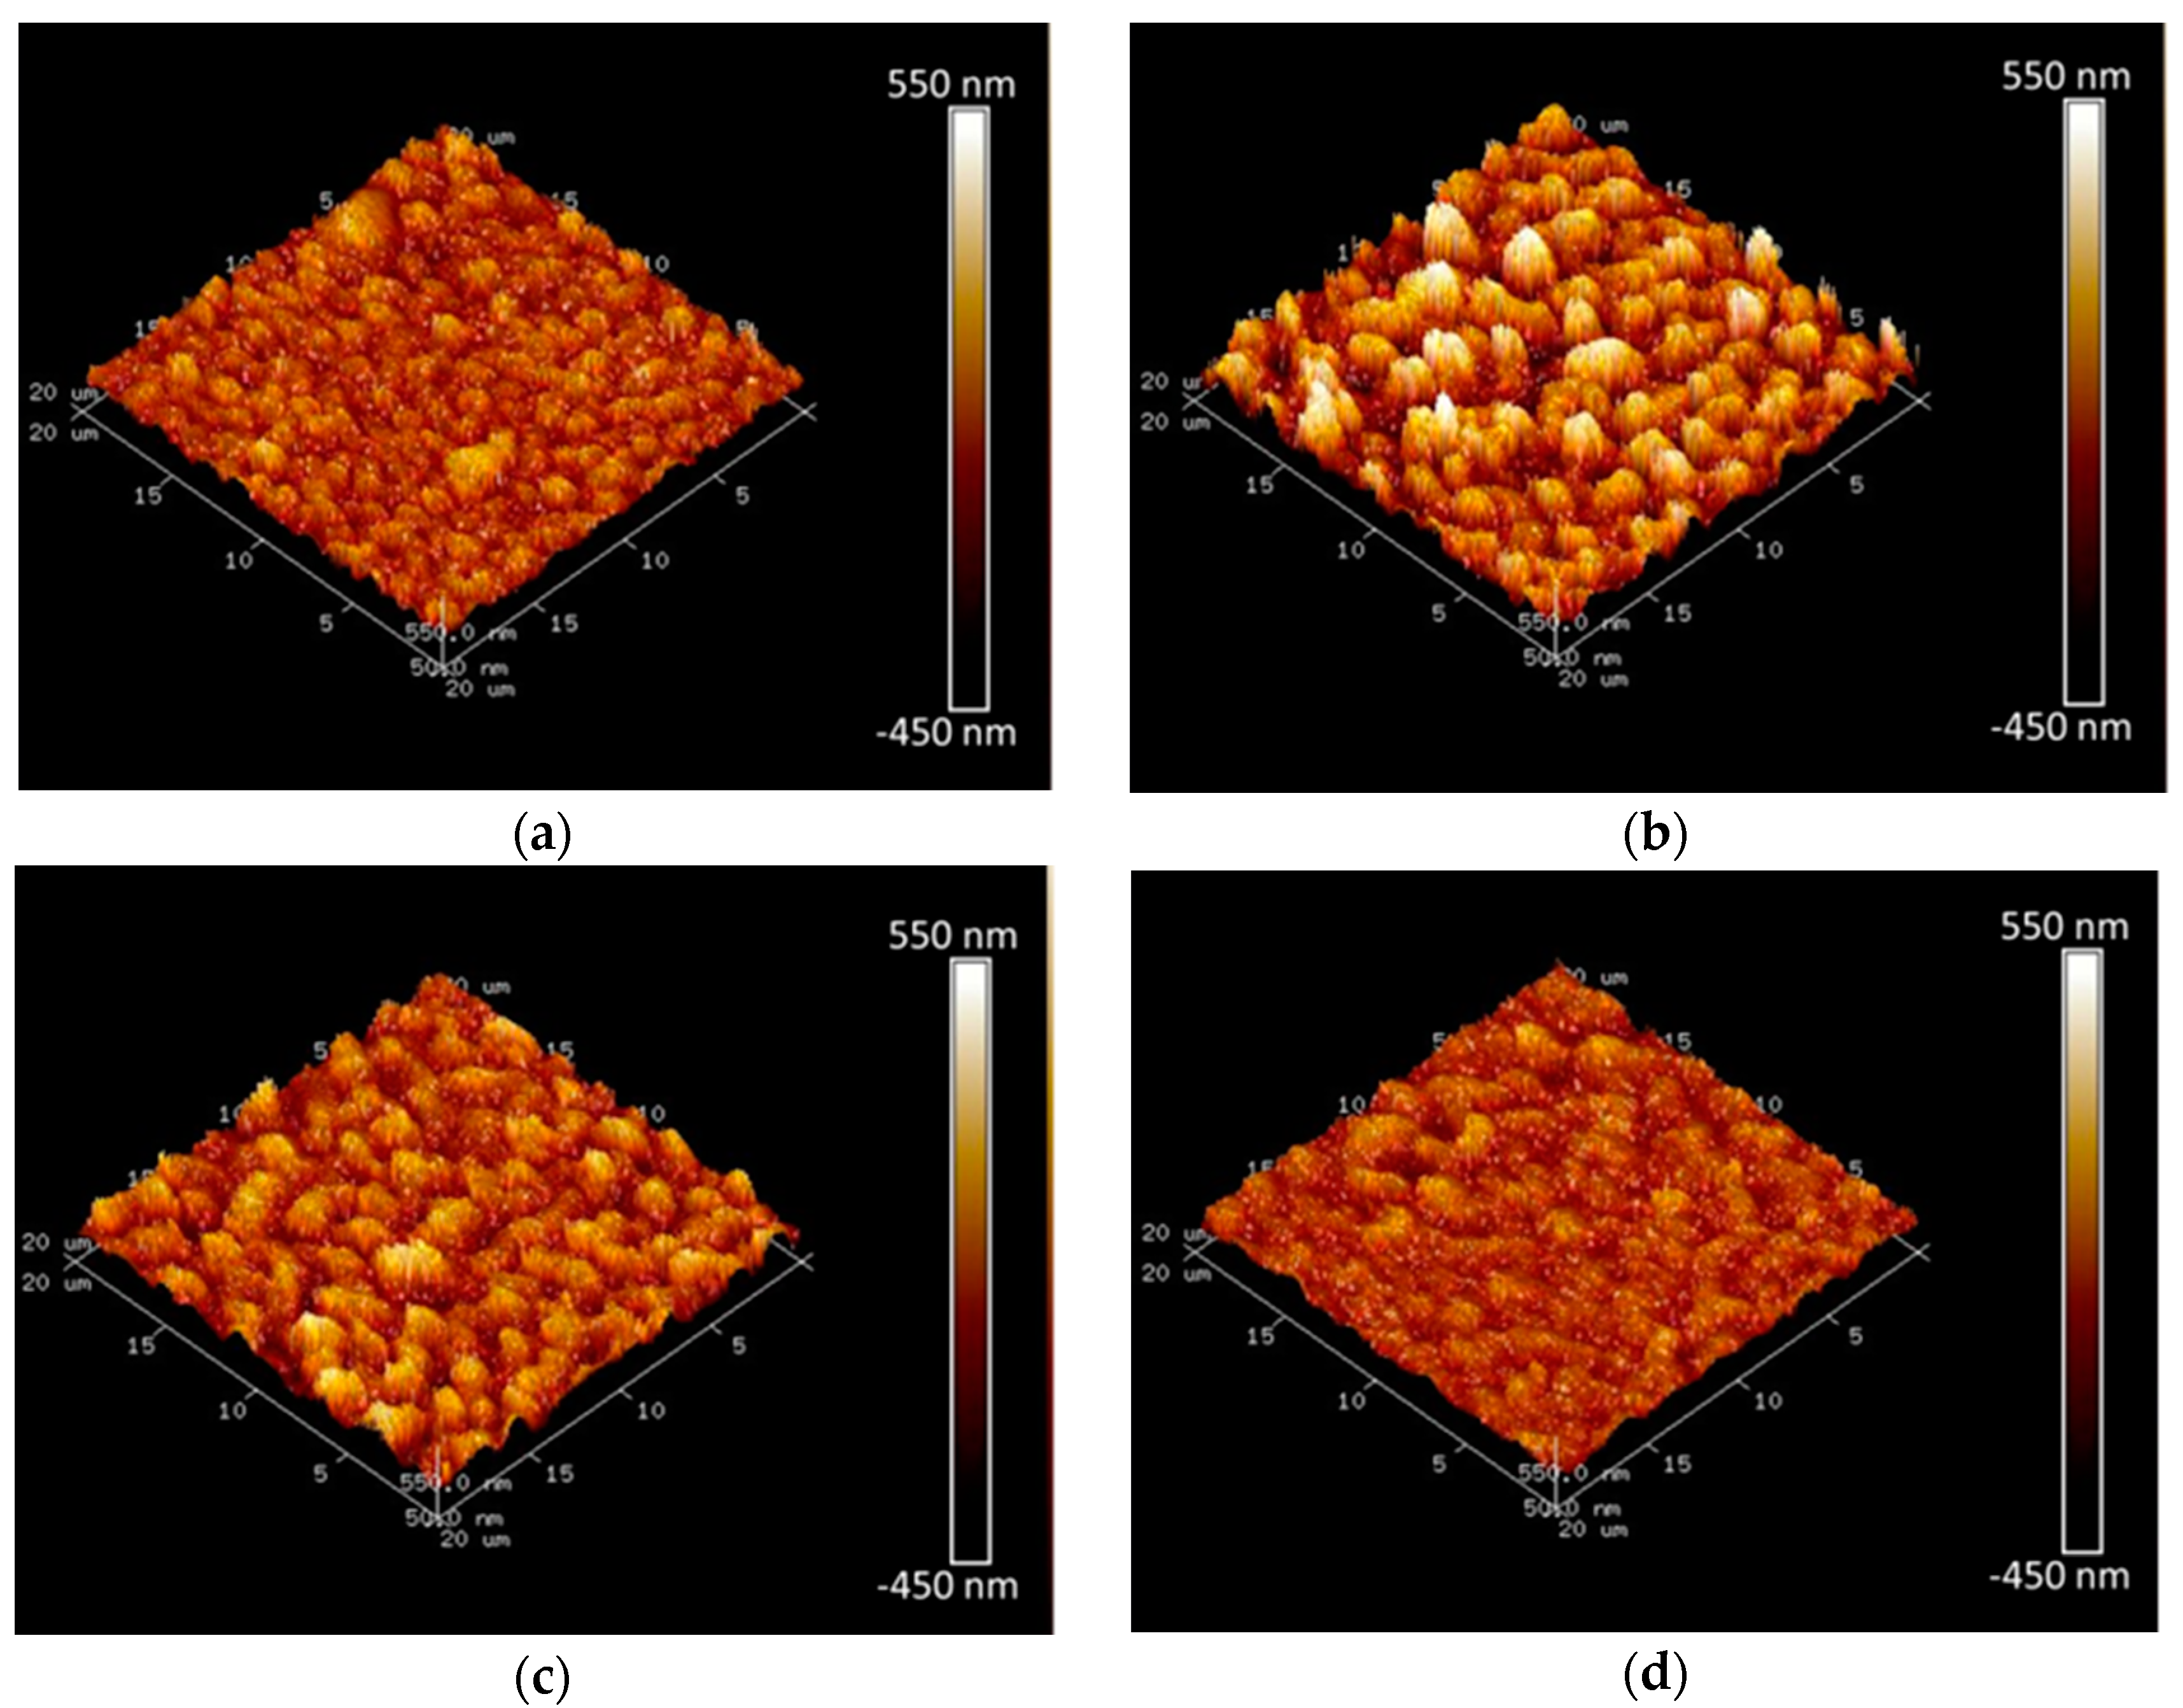
Figure 7.
The contact angle mean and standard deviation values with respect to the applied voltage when the electrode distance of 20 mm and the cathodic specimen speed of 0.25 mm/s are fixed.
Figure 7.
The contact angle mean and standard deviation values with respect to the applied voltage when the electrode distance of 20 mm and the cathodic specimen speed of 0.25 mm/s are fixed.
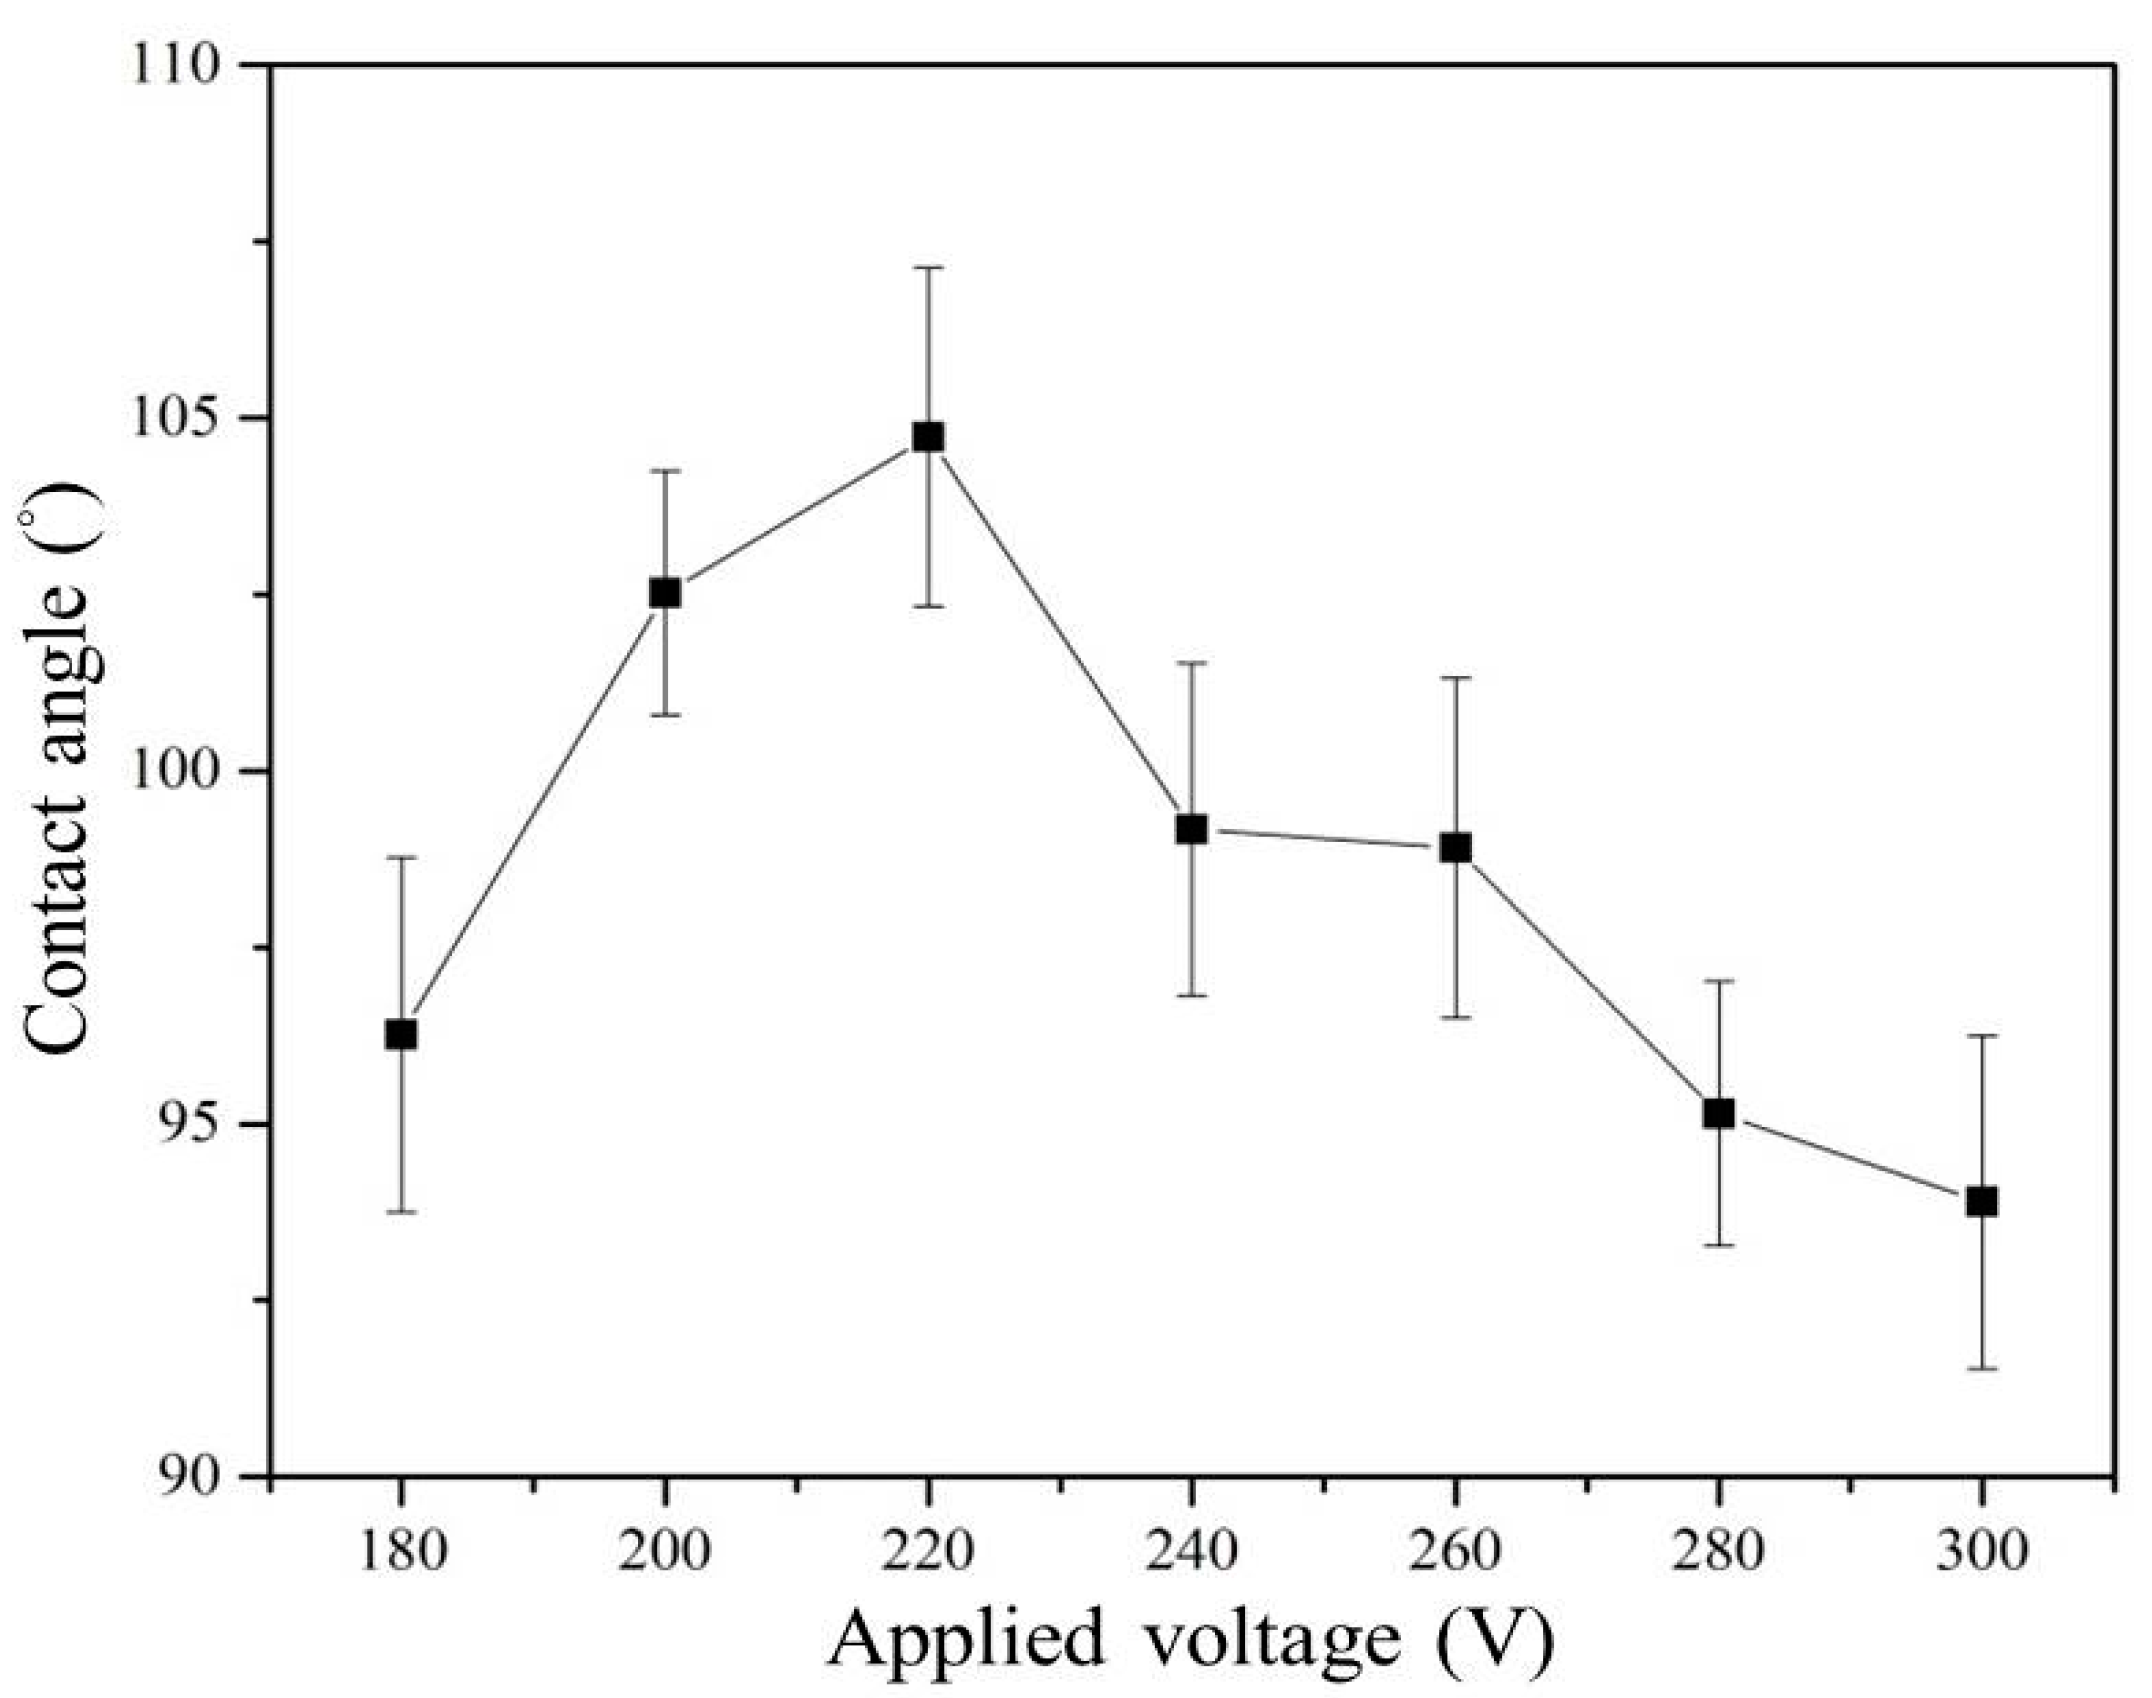
Figure 8.
Surface roughness Rq mean and standard deviation values for different cathodic specimen speeds when the electrode distance of 20 mm and the applied voltage of 220 V are fixed.
Figure 8.
Surface roughness Rq mean and standard deviation values for different cathodic specimen speeds when the electrode distance of 20 mm and the applied voltage of 220 V are fixed.

Figure 9.
SEM at 10,000× when the speed of the cathodic specimen was (a) 0.0625, (b) 0.125, (c) 0.25, and (d) 0.375 mm/s, for the fixed electrode distance of 20 mm and applied voltage of 220 V.
Figure 9.
SEM at 10,000× when the speed of the cathodic specimen was (a) 0.0625, (b) 0.125, (c) 0.25, and (d) 0.375 mm/s, for the fixed electrode distance of 20 mm and applied voltage of 220 V.
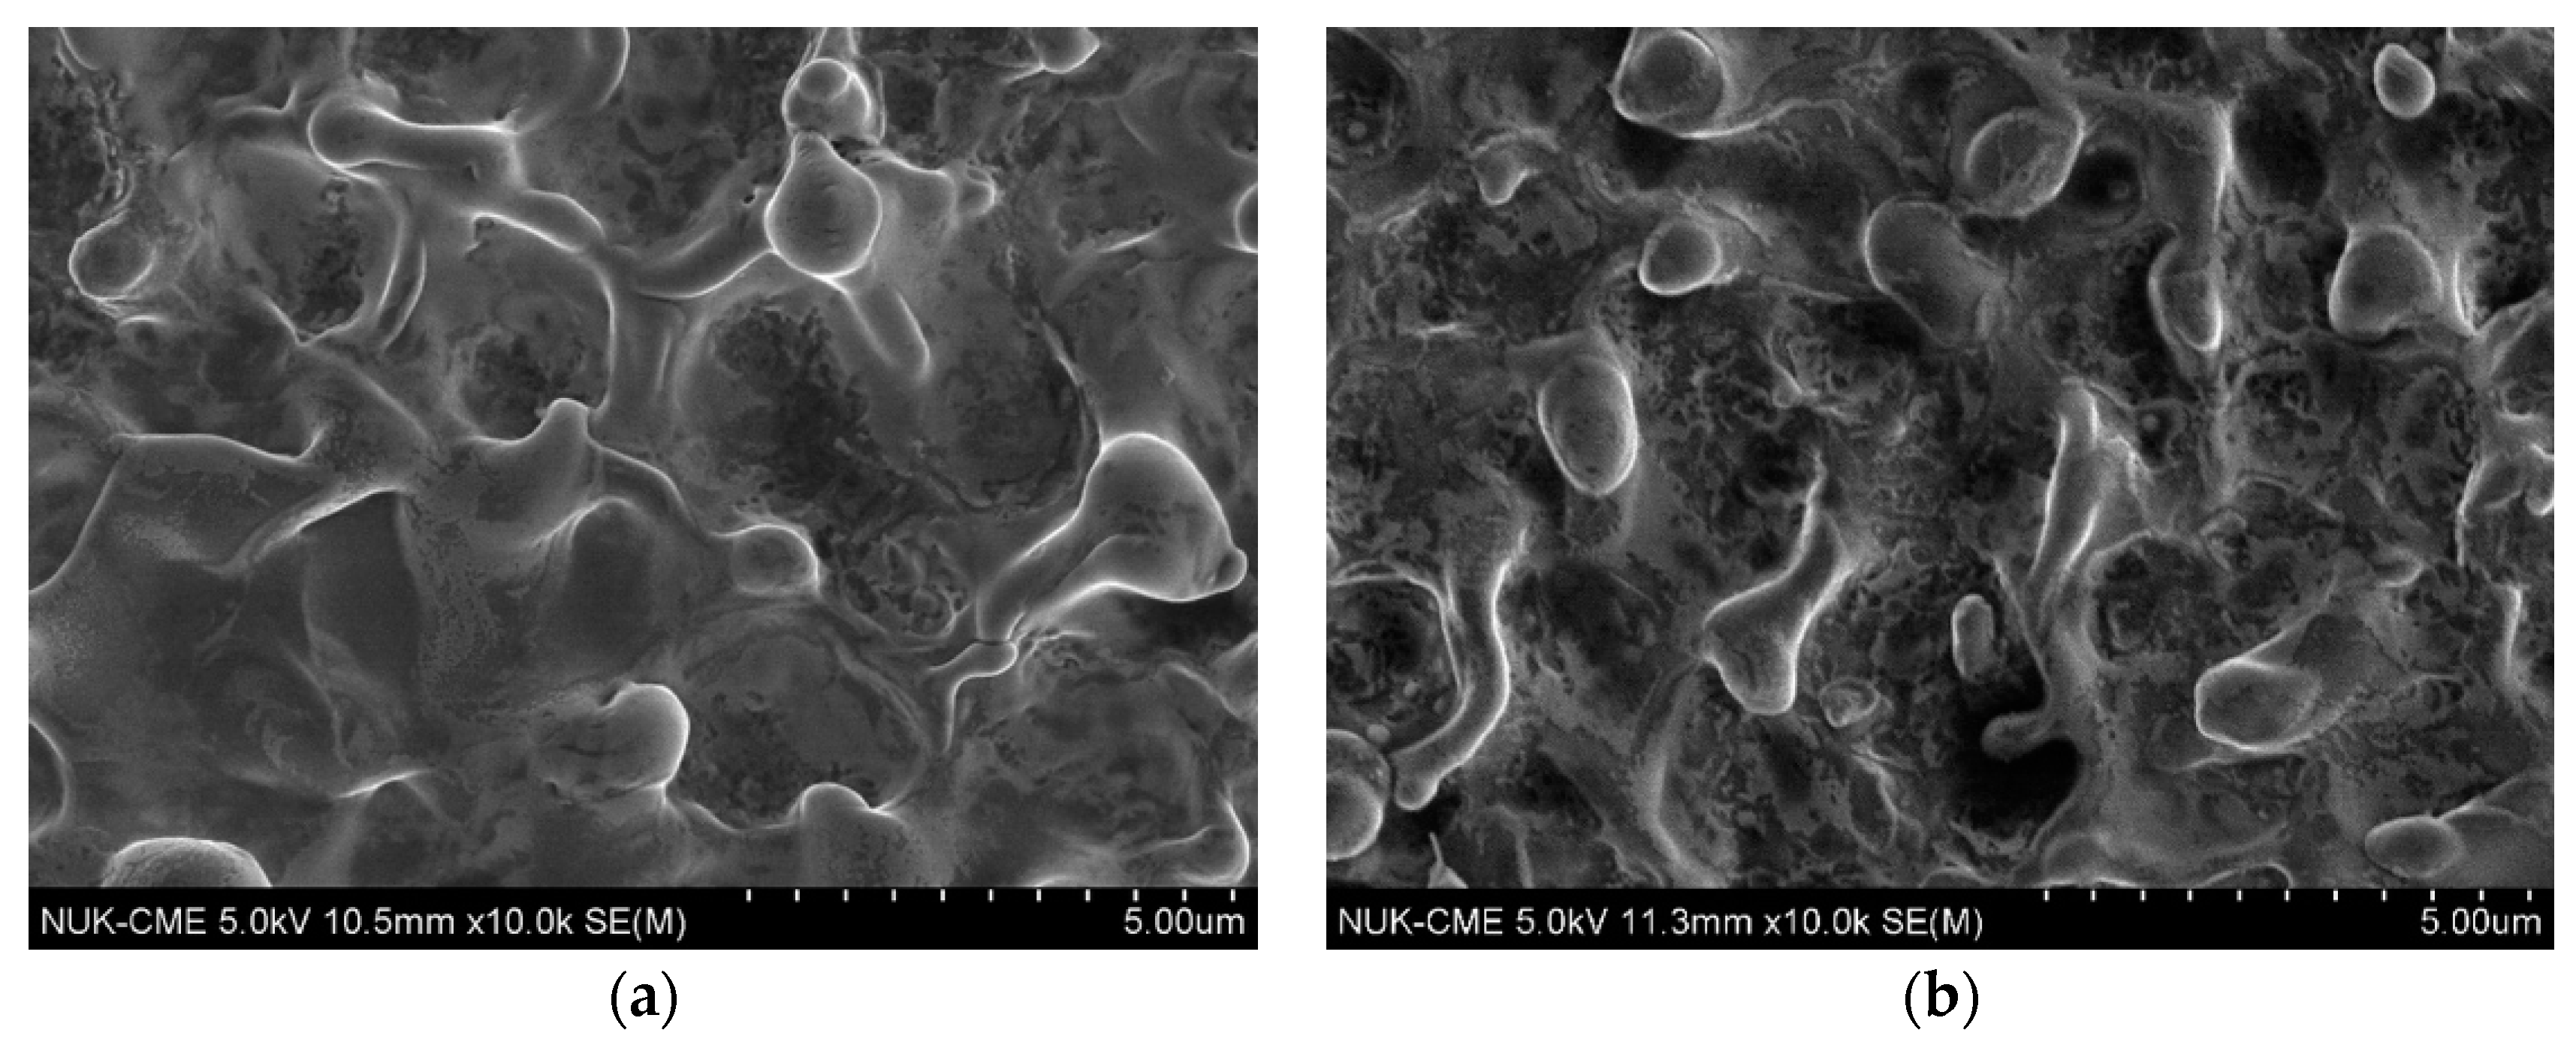
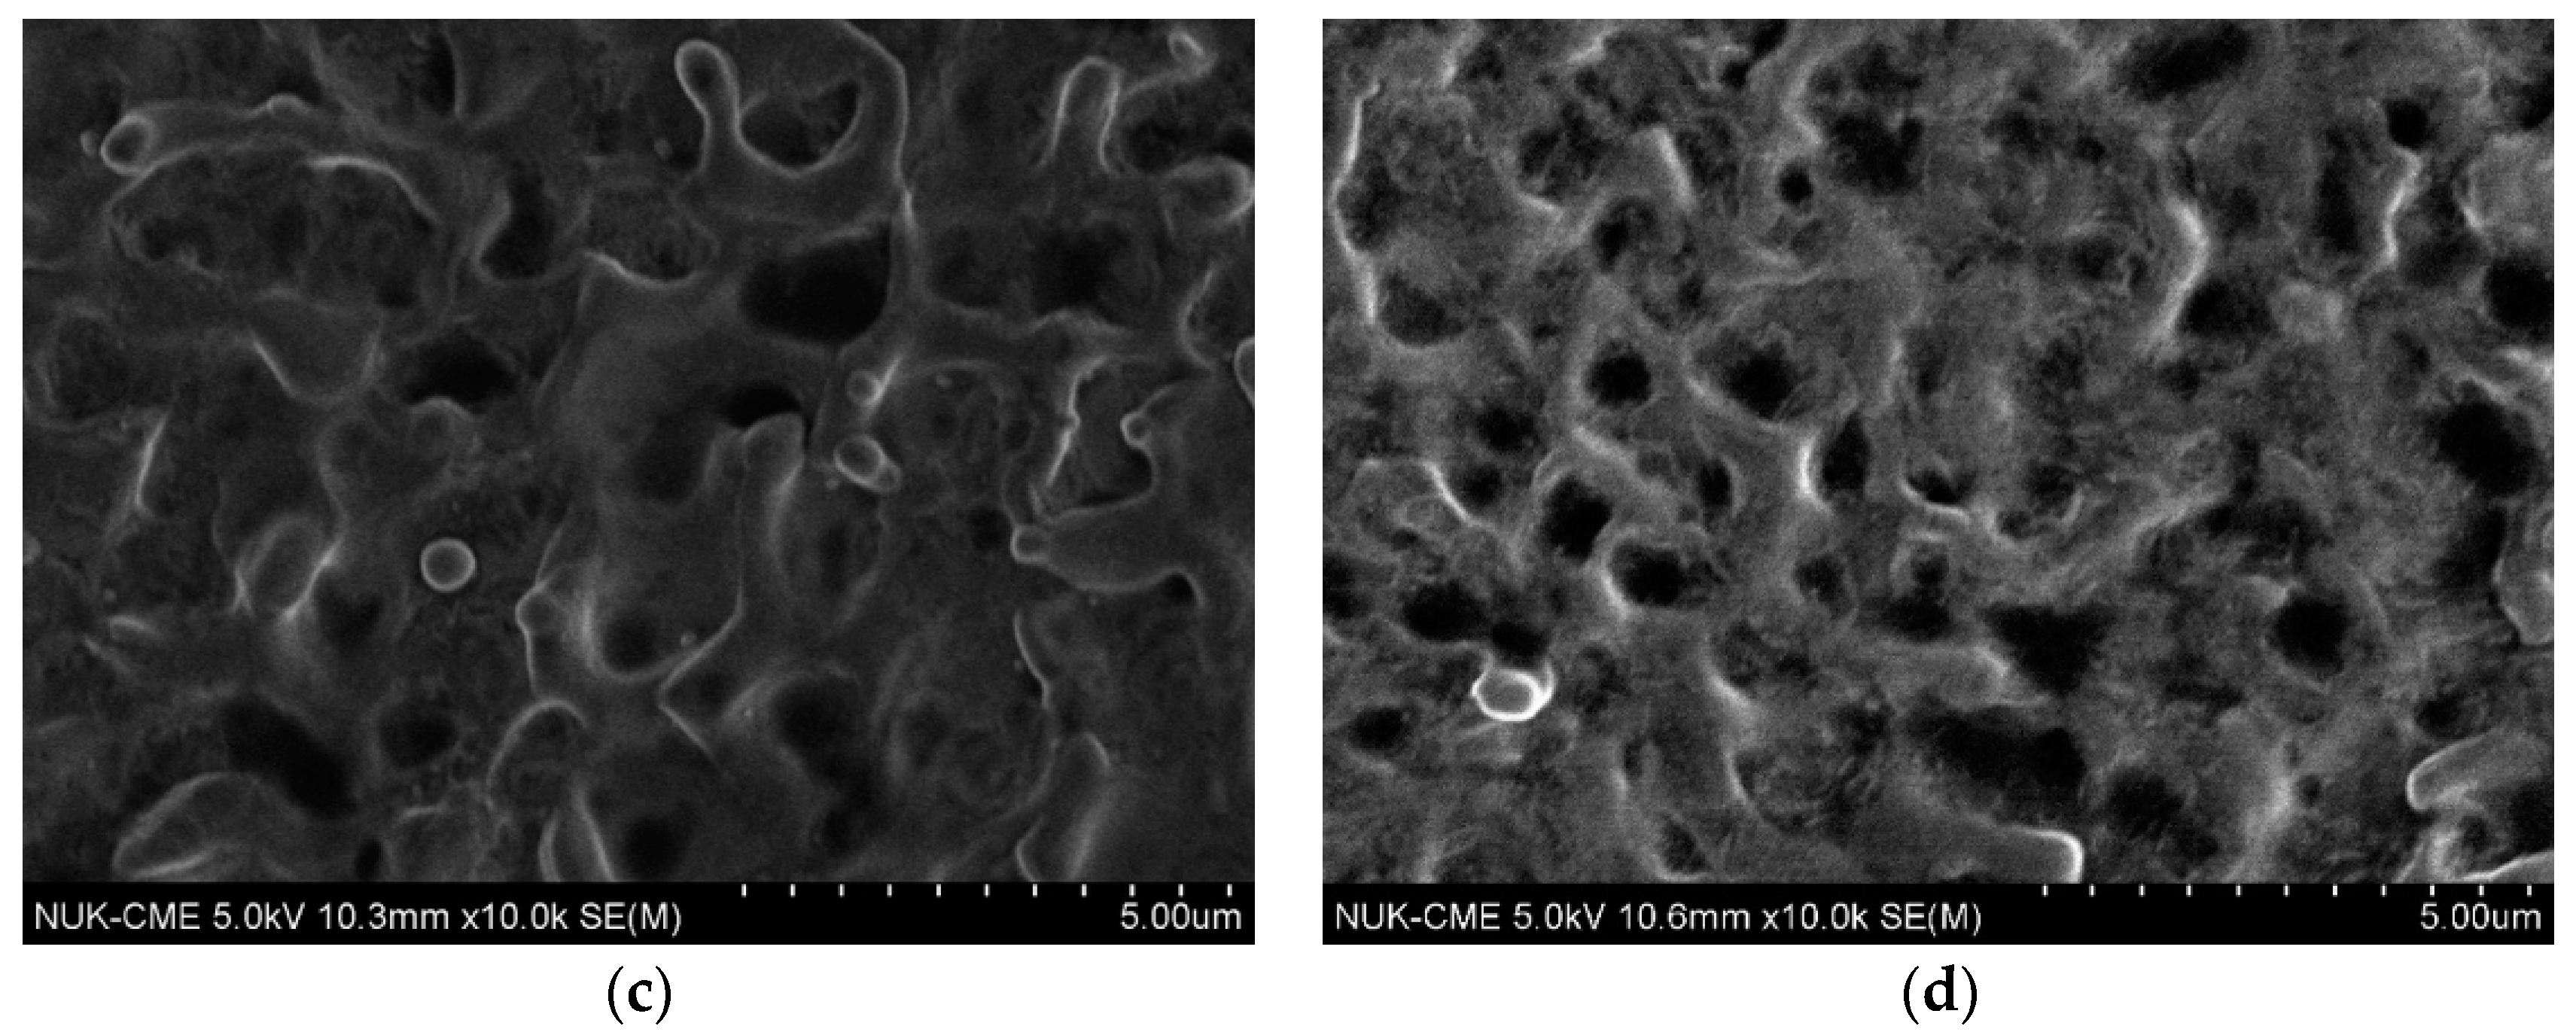
Figure 10.
Contact angle mean and standard deviation values for different cathodic specimen speeds when the electrode distance of 20 mm and the applied voltage of 220 V are fixed.
Figure 10.
Contact angle mean and standard deviation values for different cathodic specimen speeds when the electrode distance of 20 mm and the applied voltage of 220 V are fixed.
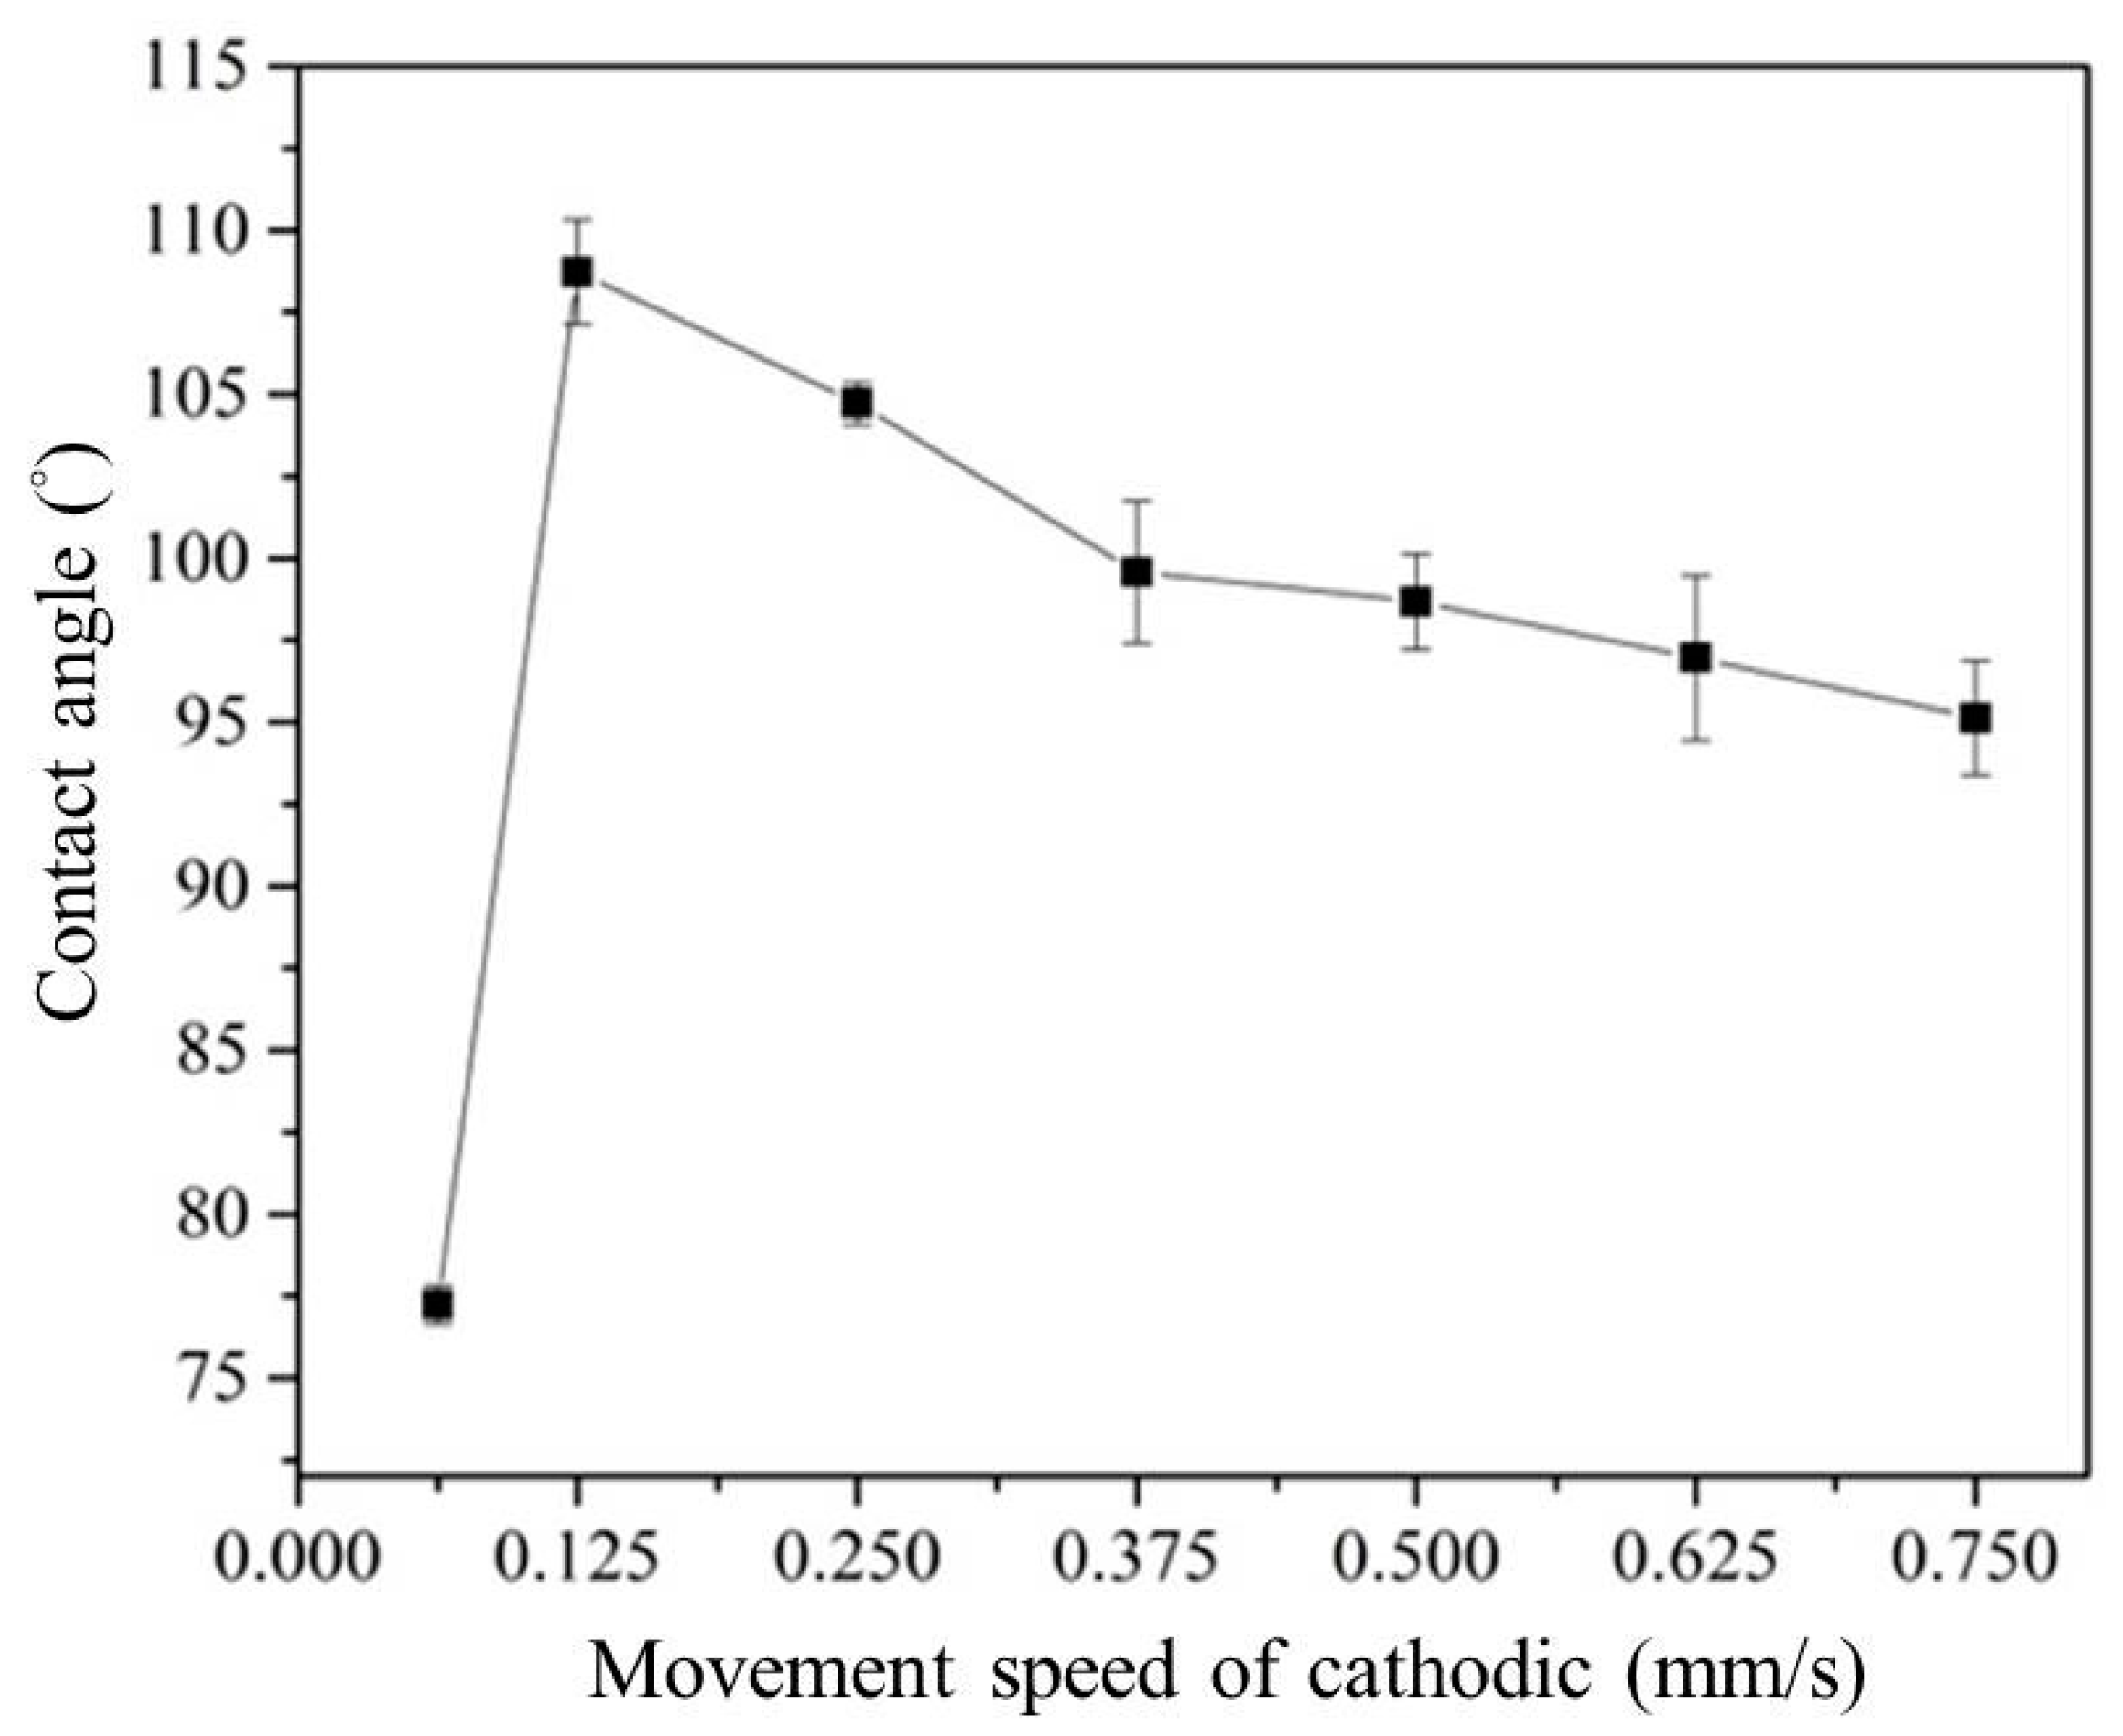
Figure 11.
Surface roughness Rq mean and standard deviation values for various electrode distances when the cathodic specimen speed of 0.125 mm/s and the applied voltage of 220 V are fixed.
Figure 11.
Surface roughness Rq mean and standard deviation values for various electrode distances when the cathodic specimen speed of 0.125 mm/s and the applied voltage of 220 V are fixed.
Figure 12.
Contact angle mean and standard deviation values for various electrode distances when the cathodic specimen speed of 0.125 mm/s and the applied voltage of 220 V are fixed.
Figure 12.
Contact angle mean and standard deviation values for various electrode distances when the cathodic specimen speed of 0.125 mm/s and the applied voltage of 220 V are fixed.

Figure 13.
Surface appearance and contact angle for an electrode distance of 20 mm: (a) SEM at 5000×; (b) contact angle when the cathodic specimen speed of 0.125 mm/s and the applied voltage of 220 V are fixed.
Figure 13.
Surface appearance and contact angle for an electrode distance of 20 mm: (a) SEM at 5000×; (b) contact angle when the cathodic specimen speed of 0.125 mm/s and the applied voltage of 220 V are fixed.
© 2018 by the authors. Licensee MDPI, Basel, Switzerland. This article is an open access article distributed under the terms and conditions of the Creative Commons Attribution (CC BY) license (http://creativecommons.org/licenses/by/4.0/).
Share and Cite
MDPI and ACS Style
Lin, A.-D.; Kung, C.-L.; Hsieh, W.-C.; Hsu, C.-M.; Chen, C.-Y. Study on Cleaning the Surface of Stainless Steel 316 Using Plasma Electrolysis Technology. Appl. Sci. 2018, 8, 1060. https://doi.org/10.3390/app8071060
AMA Style
Lin A-D, Kung C-L, Hsieh W-C, Hsu C-M, Chen C-Y. Study on Cleaning the Surface of Stainless Steel 316 Using Plasma Electrolysis Technology. Applied Sciences. 2018; 8(7):1060. https://doi.org/10.3390/app8071060
Chicago/Turabian StyleLin, Ah-Der, Chi-Liang Kung, Wei-Chen Hsieh, Chao-Ming Hsu, and Cheng-Yi Chen. 2018. "Study on Cleaning the Surface of Stainless Steel 316 Using Plasma Electrolysis Technology" Applied Sciences 8, no. 7: 1060. https://doi.org/10.3390/app8071060
Note that from the first issue of 2016, this journal uses article numbers instead of page numbers. See further details here.