Time Series Analysis of Acoustic Emissions in the Asinelli Tower during Local Seismic Activity


Department of Structural, Geotechnical and Building Engineering, Politecnico di Torino, Corso Duca degli Abruzzi, 24-10129 Torino, Italy
*
Author to whom correspondence should be addressed.
Appl. Sci. 2018, 8(7), 1012; https://doi.org/10.3390/app8071012
Submission received: 5 May 2018
/
Revised: 13 June 2018
/
Accepted: 14 June 2018
/
Published: 21 June 2018
(This article belongs to the Special Issue Structural Health Monitoring of Large Structures Using Acoustic Emission–Case Histories)
Abstract
:The existence of ongoing damage processes in a masonry wall of the Asinelli Tower in Bologna have been investigated by the acoustic emission (AE) technique. A time correlation between the AE activity in the monitored structural element and the nearby earthquakes has been observed. In particular, the largest cluster of AE signals has been recorded within a few hours after the main shock (4.1 magnitude) occurrence. The presented findings suggest that aging and deterioration of the monitored structural element significantly depend on the action of light earthquakes, even at considerable distance. Trends of two evolutionary parameters, the b-value and the natural time variance κ1, have been derived from the AE time series in order to identify the approach of the monitored structural element to a “critical state” in relation to the earthquake occurrence.
1. Introduction
Fracture precursors in metallic [1,2] and quasi-brittle materials like rocks [3,4], concrete [5,6,7,8,9], and masonry [10,11] can be experimentally investigated focusing on the statistical properties of an acoustic emission (AE) time series from growing micro-fractures, where the discovery of underlying scaling laws suggests a description of fracture as a critical phenomenon [12,13,14,15,16,17,18,19,20,21]. Within this context, finding fracture precursors means identifying critical scaling exponents and early indicators of the approach to a critical state [22].
The relevance of the AE applications in civil engineering for structural health monitoring is widely recognized. In this regard, it is increasingly necessary to give the highest priority to seismic risk mitigation in large portions of the Italian territory. Minor and light earthquakes can drive invisible damage processes in buildings and monuments, which eventually result in catastrophic collapses during stronger earthquakes. It is worth noting that AE can be exploited as a diagnostic tool in geophysics as well, since recent experimental evidences and theoretical studies support the hypothesis that increased AE and electromagnetic activities may be signature of crustal stresses redistribution in a large zone during the preparation of a seismic event [23,24,25,26,27,28,29,30,31,32,33,34]. Laboratory studies have been motivated by the need to provide tools for the earthquake prediction [35].
Therefore, the AE structural monitoring might potentially provide twofold information: one concerning the structural damage and the other concerning widespread micro-seismic activity, propagating across the ground-building foundation interface, for which the building foundation represents a sort of extended underground probe [10,11,21,23,24,30,33].
The presented research study was initially motivated by the debate about the alleged incompatibility between heavy vehicle traffic and Bologna’s historical center, which concerns also the structural stability of two medieval towers, the Garisenda and the Asinelli (the taller) [36]. As reported in a previous publication [30], the influence of environmental phenomena on the AE activity in the Asinelli tower, such as the flux of surrounding vehicle traffic, unusual anthropogenic activities, and wind action, has been excluded. Actually, the nearby seismicity apparently has some influence on the AE activity detected in a masonry wall of the tower [30]. Here, the focus is on the time correlation observed between the largest AE cluster and the strongest (magnitude 4.1) local earthquake, with an epicenter 100 km far from the monitoring site.
2. Materials and Methods
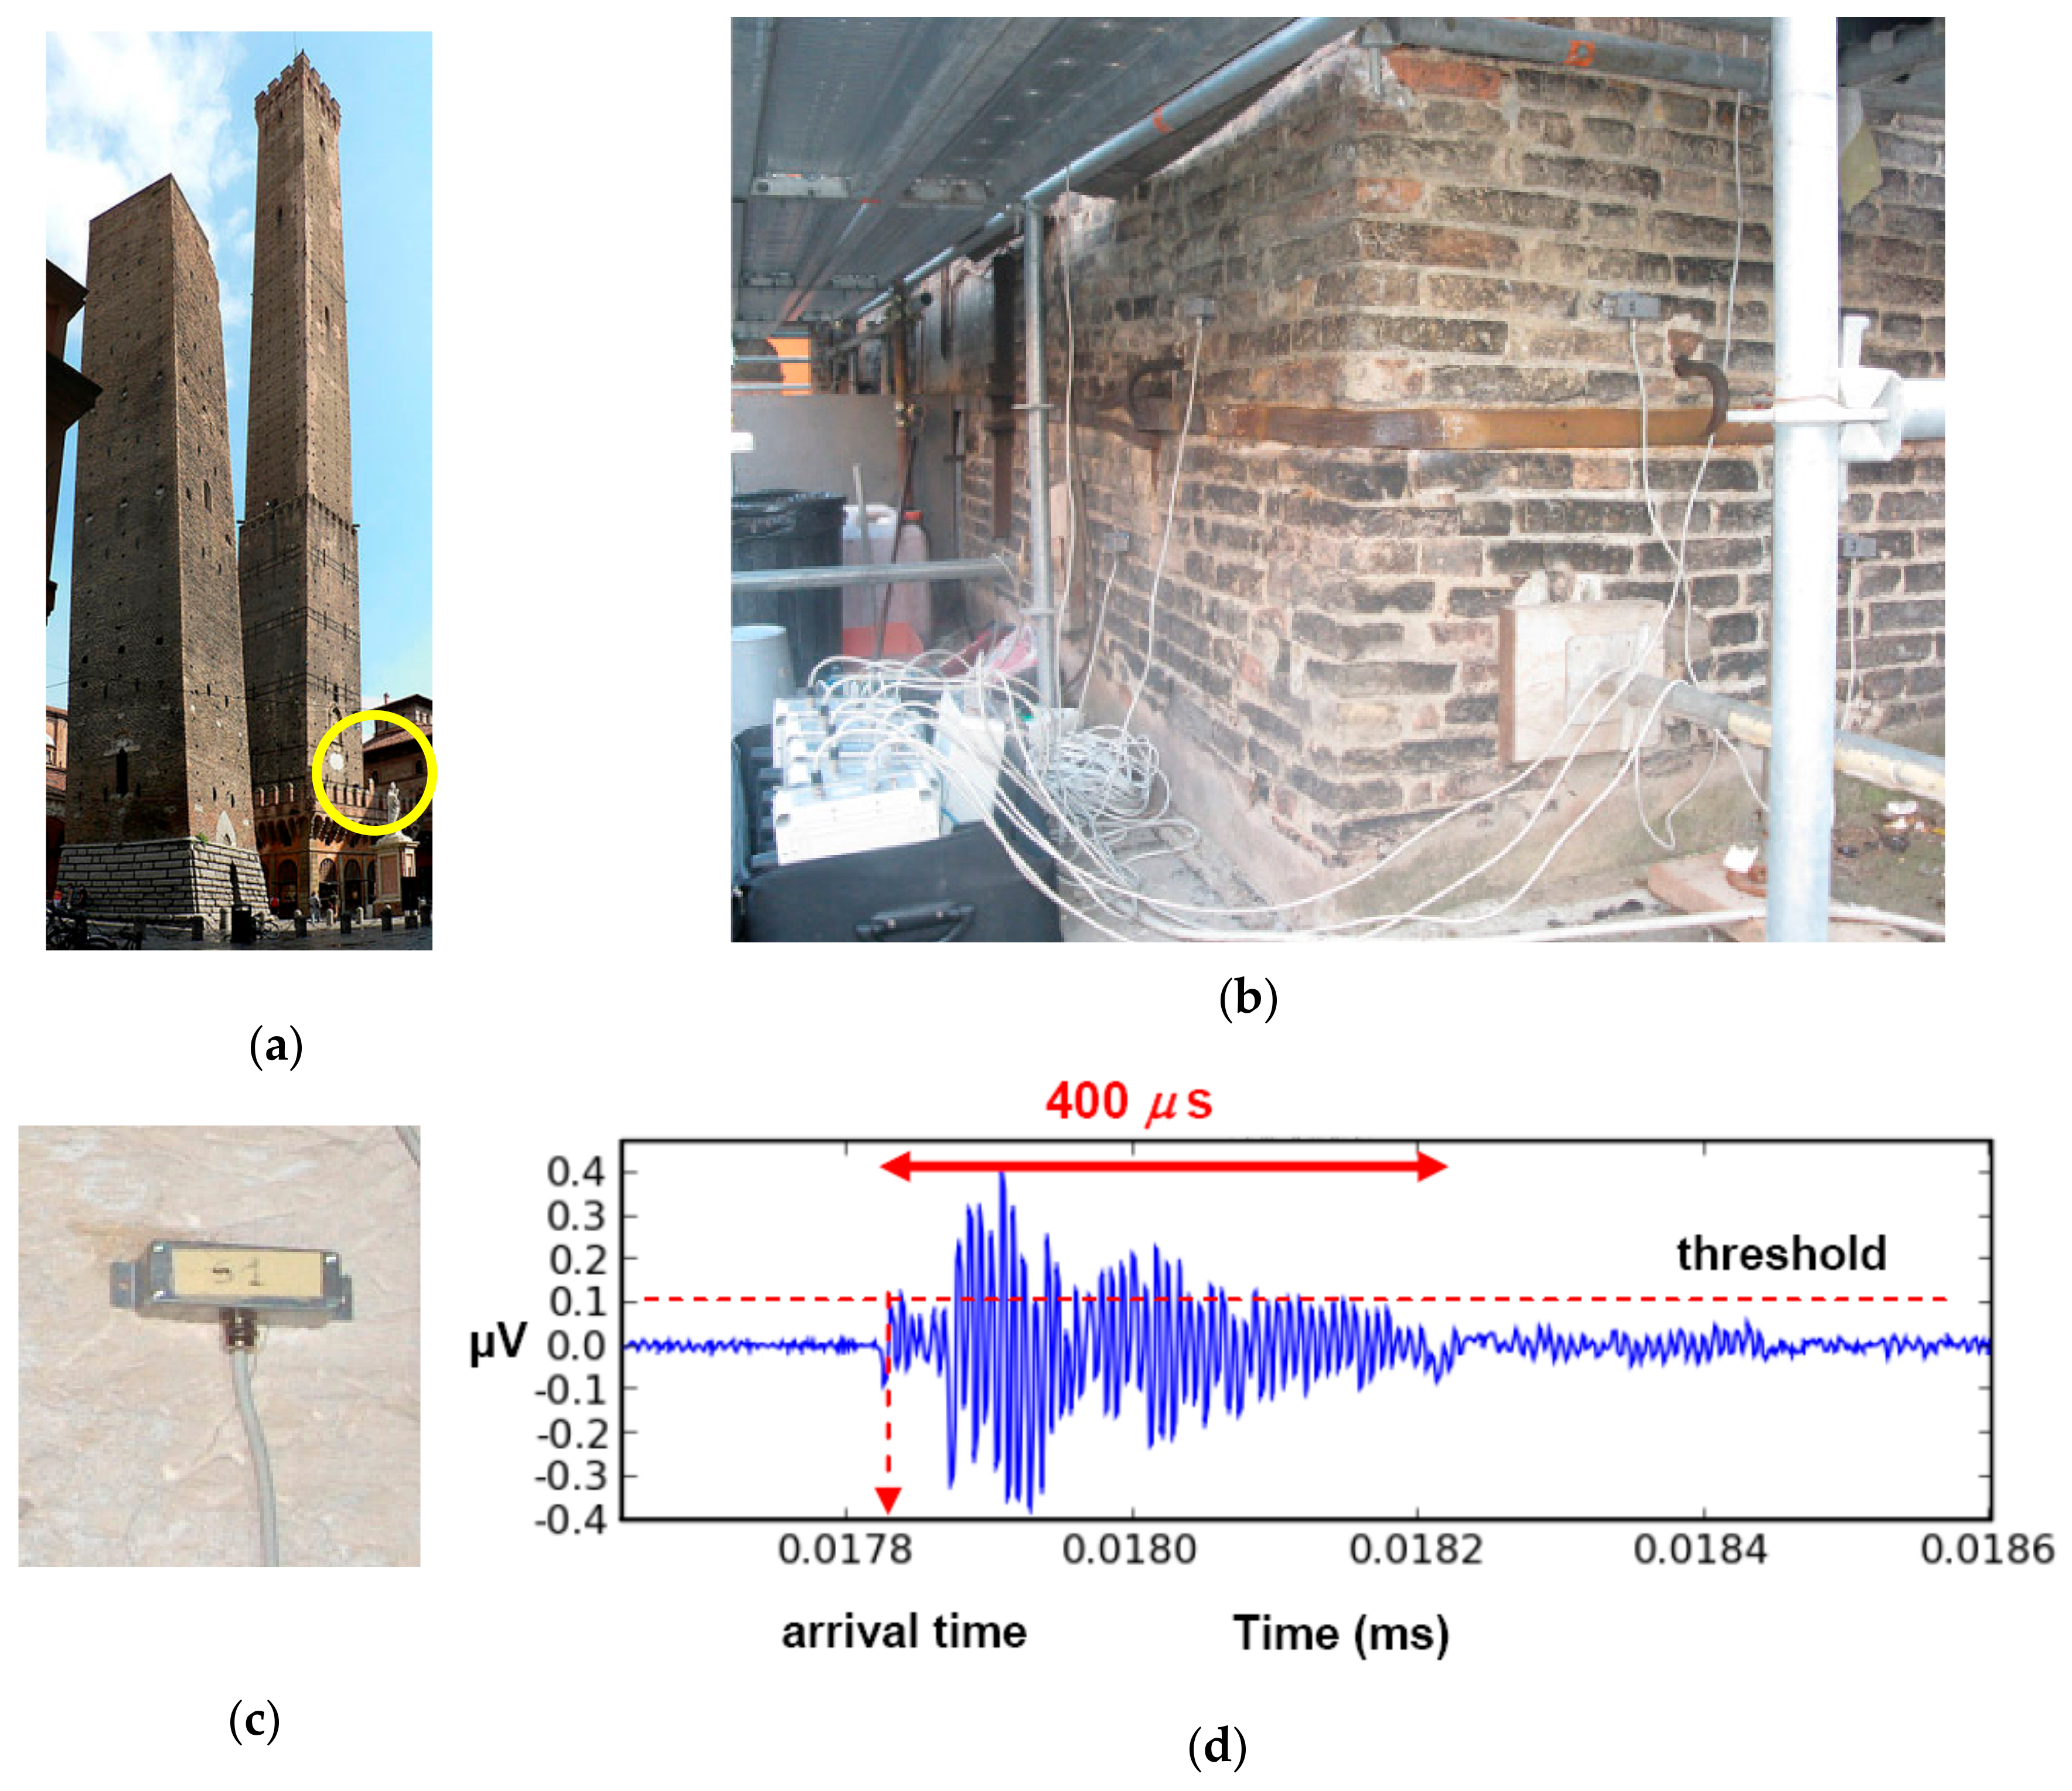
An array of six broadband AE transducers (with a flat frequency response nominally in the range of 50–500 kHz, as declared by the manufacturer, i.e., well beyond the frequency range of signals propagating in the masonry) was fixed to the north-east angle of the Asinelli Tower at an average height of 9.00 m above ground level. The frequencies of interest in the old masonry, around 30 kHz, were still detected by the adopted transducers as already reported in previous papers for similar surveys [37]. Figure 1a–c show the tower and the transducers applied to a masonry wall portion.
The transducers were connected to a six-channel acquisition system able to store AE signal parameters such as arrival time t (determined with accuracy of 0.2 μs), duration, peak amplitude, and ring-down count (number of times the AE signal exceeds a preset threshold). A time accuracy of 0.2 μs, equivalent to a sampling rate of five mega-samples per second, is adequate to measure frequency components up to 500 kHz (only frequencies up to 10 times smaller than the sampling rate are usually considered), covering satisfactorily the AE frequency range.
Prior to starting the monitoring, were preliminarily performed for a representative period of time, i.e., 8 h, in order to determine the level of spurious signals. Thus, the signal acquisition threshold was set to 100 μV in order to filter out the electrical noise (see a typical signal waveform in Figure 1d). Keeping fixed the threshold made it possible to capture possible variations in the noise level due to changeable environmental conditions like traffic, weekdays, weekends, etc.
AE monitoring began on 23 September 2010 at 5:40 p.m. and ended on 28 January 2011 at 1:00 p.m. for a 2915-h period [30]. All the AE signals were found to fall in the amplitude range of 100 to 12,800 μV or, equivalently, of 40 to 82 dB, if the signal peak amplitudes are expressed in decibels (dB), [38]. Because of heterogeneity of masonry, the point location method of AE sources exploiting signals recorded by multiple transducers could hardly be applied.
3. Results
3.1. Correlation between AE and Earthquakes
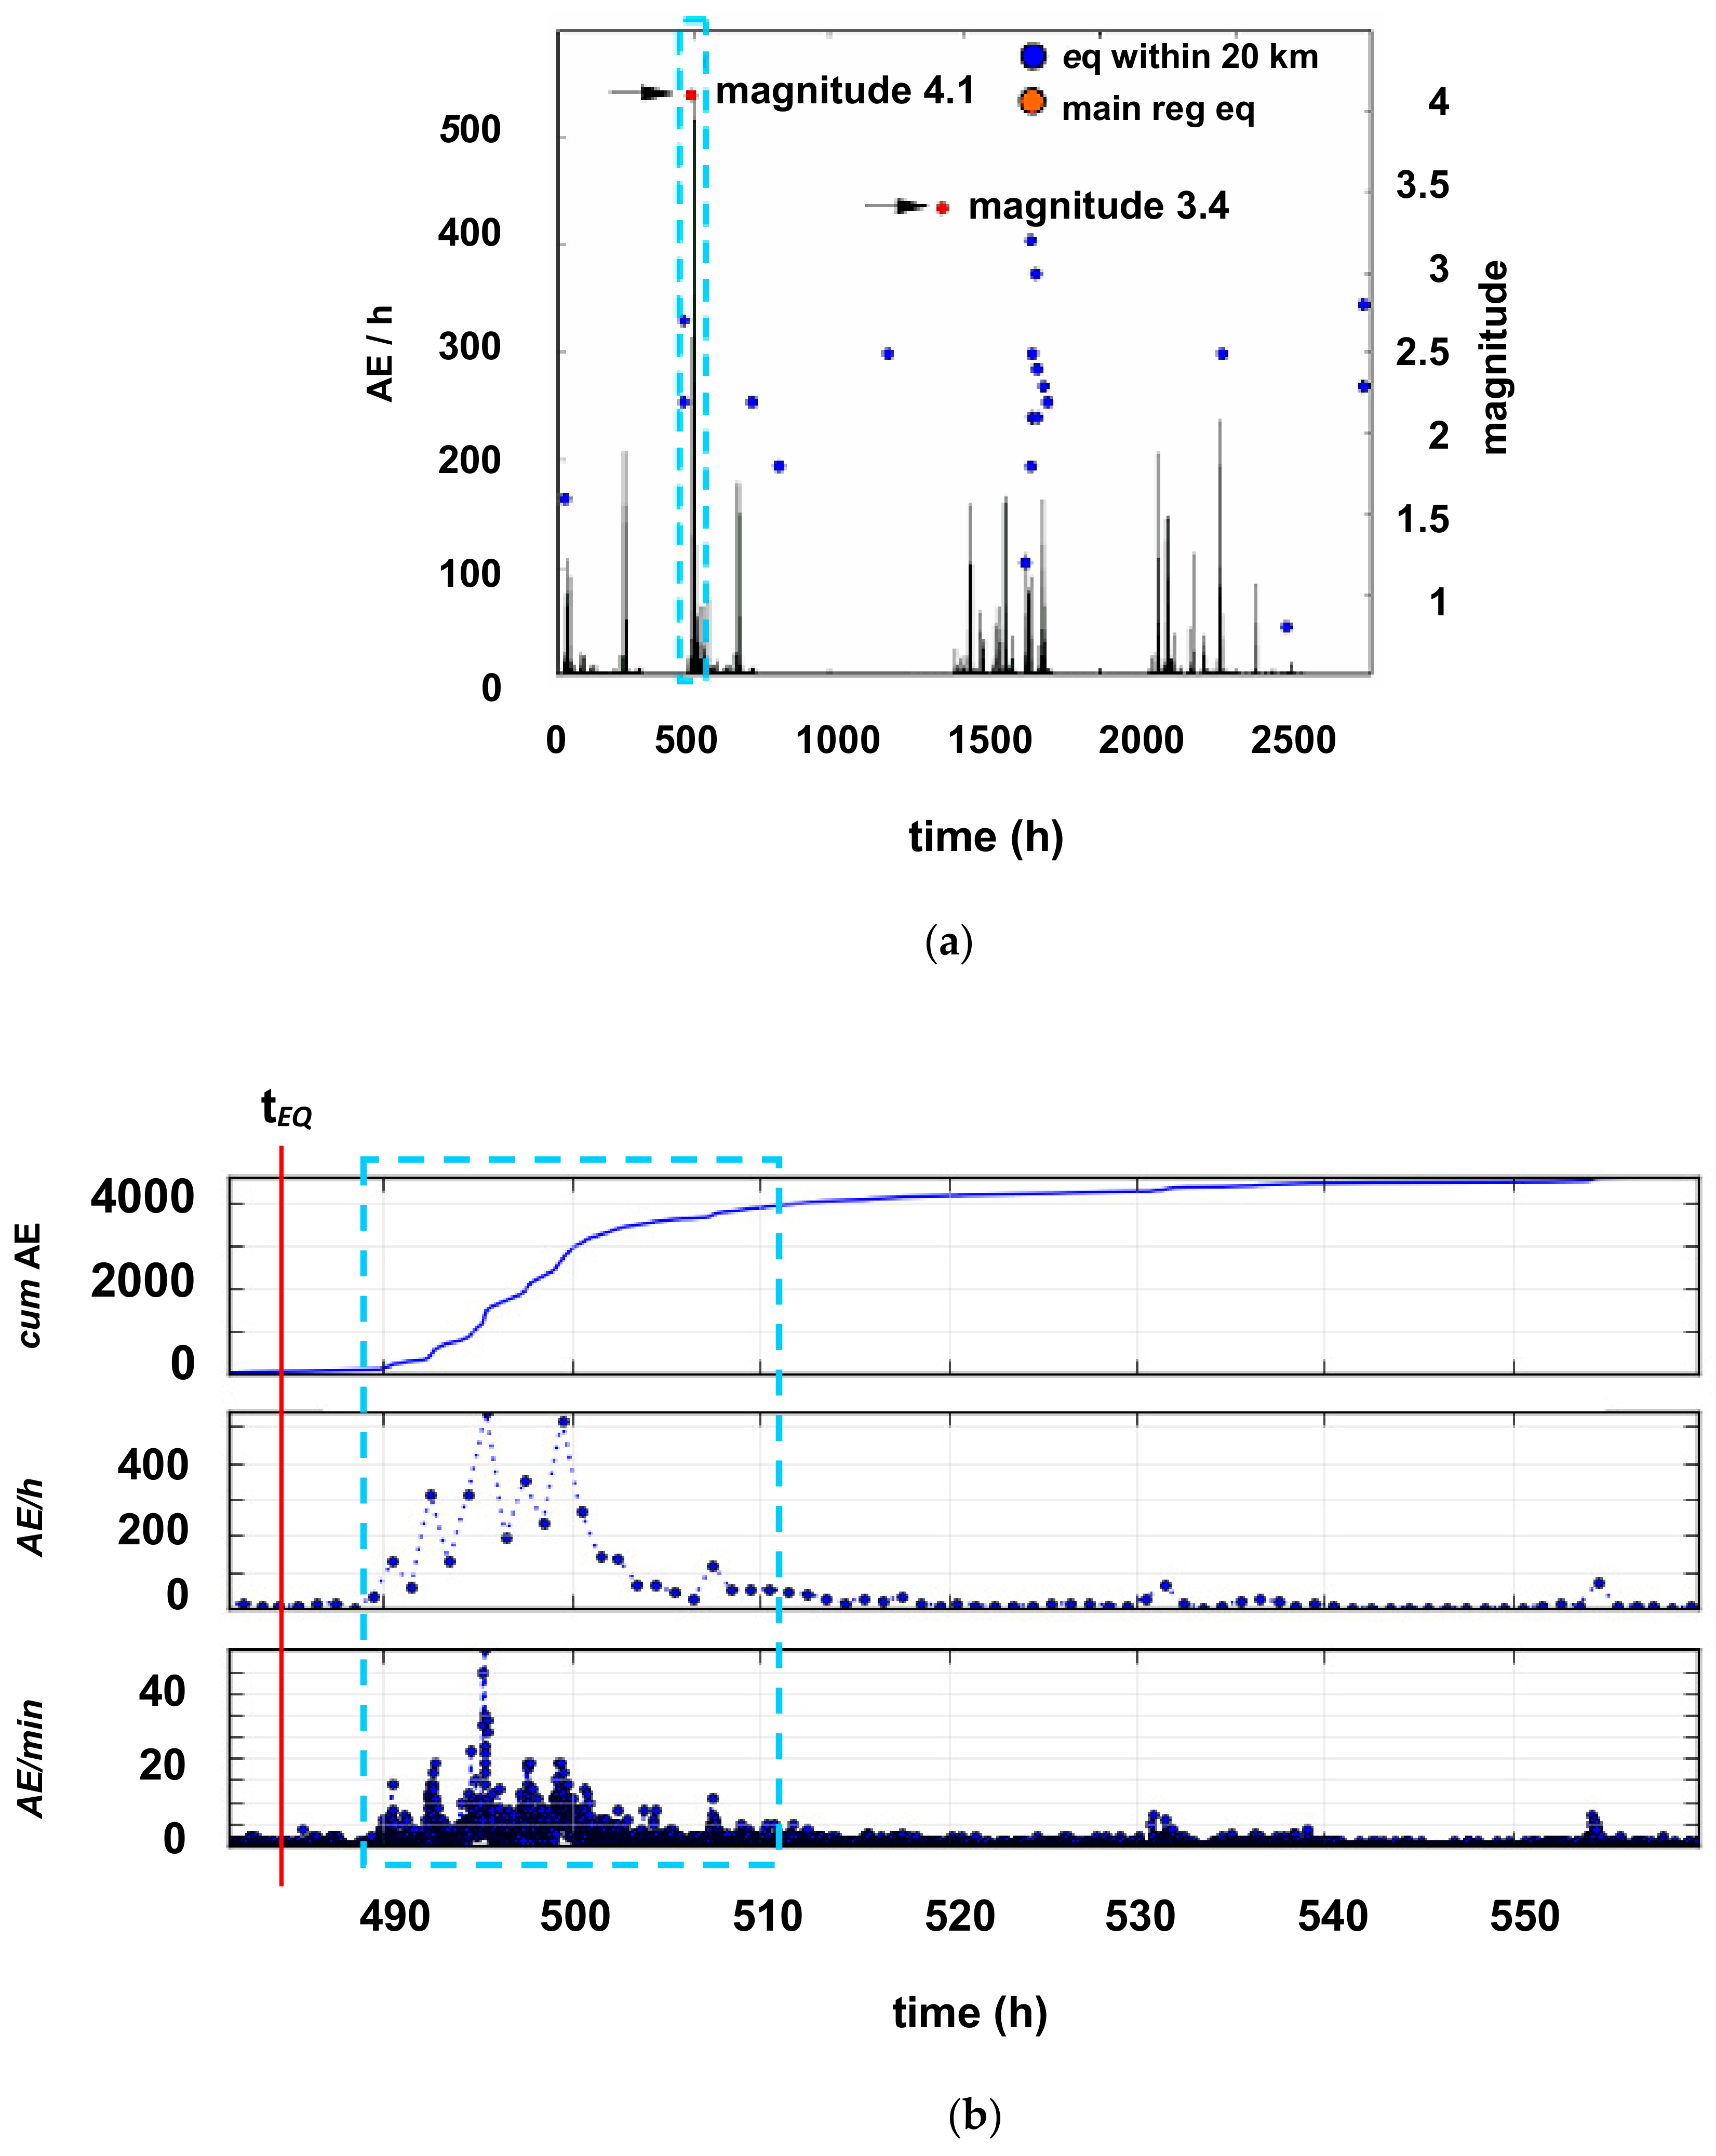
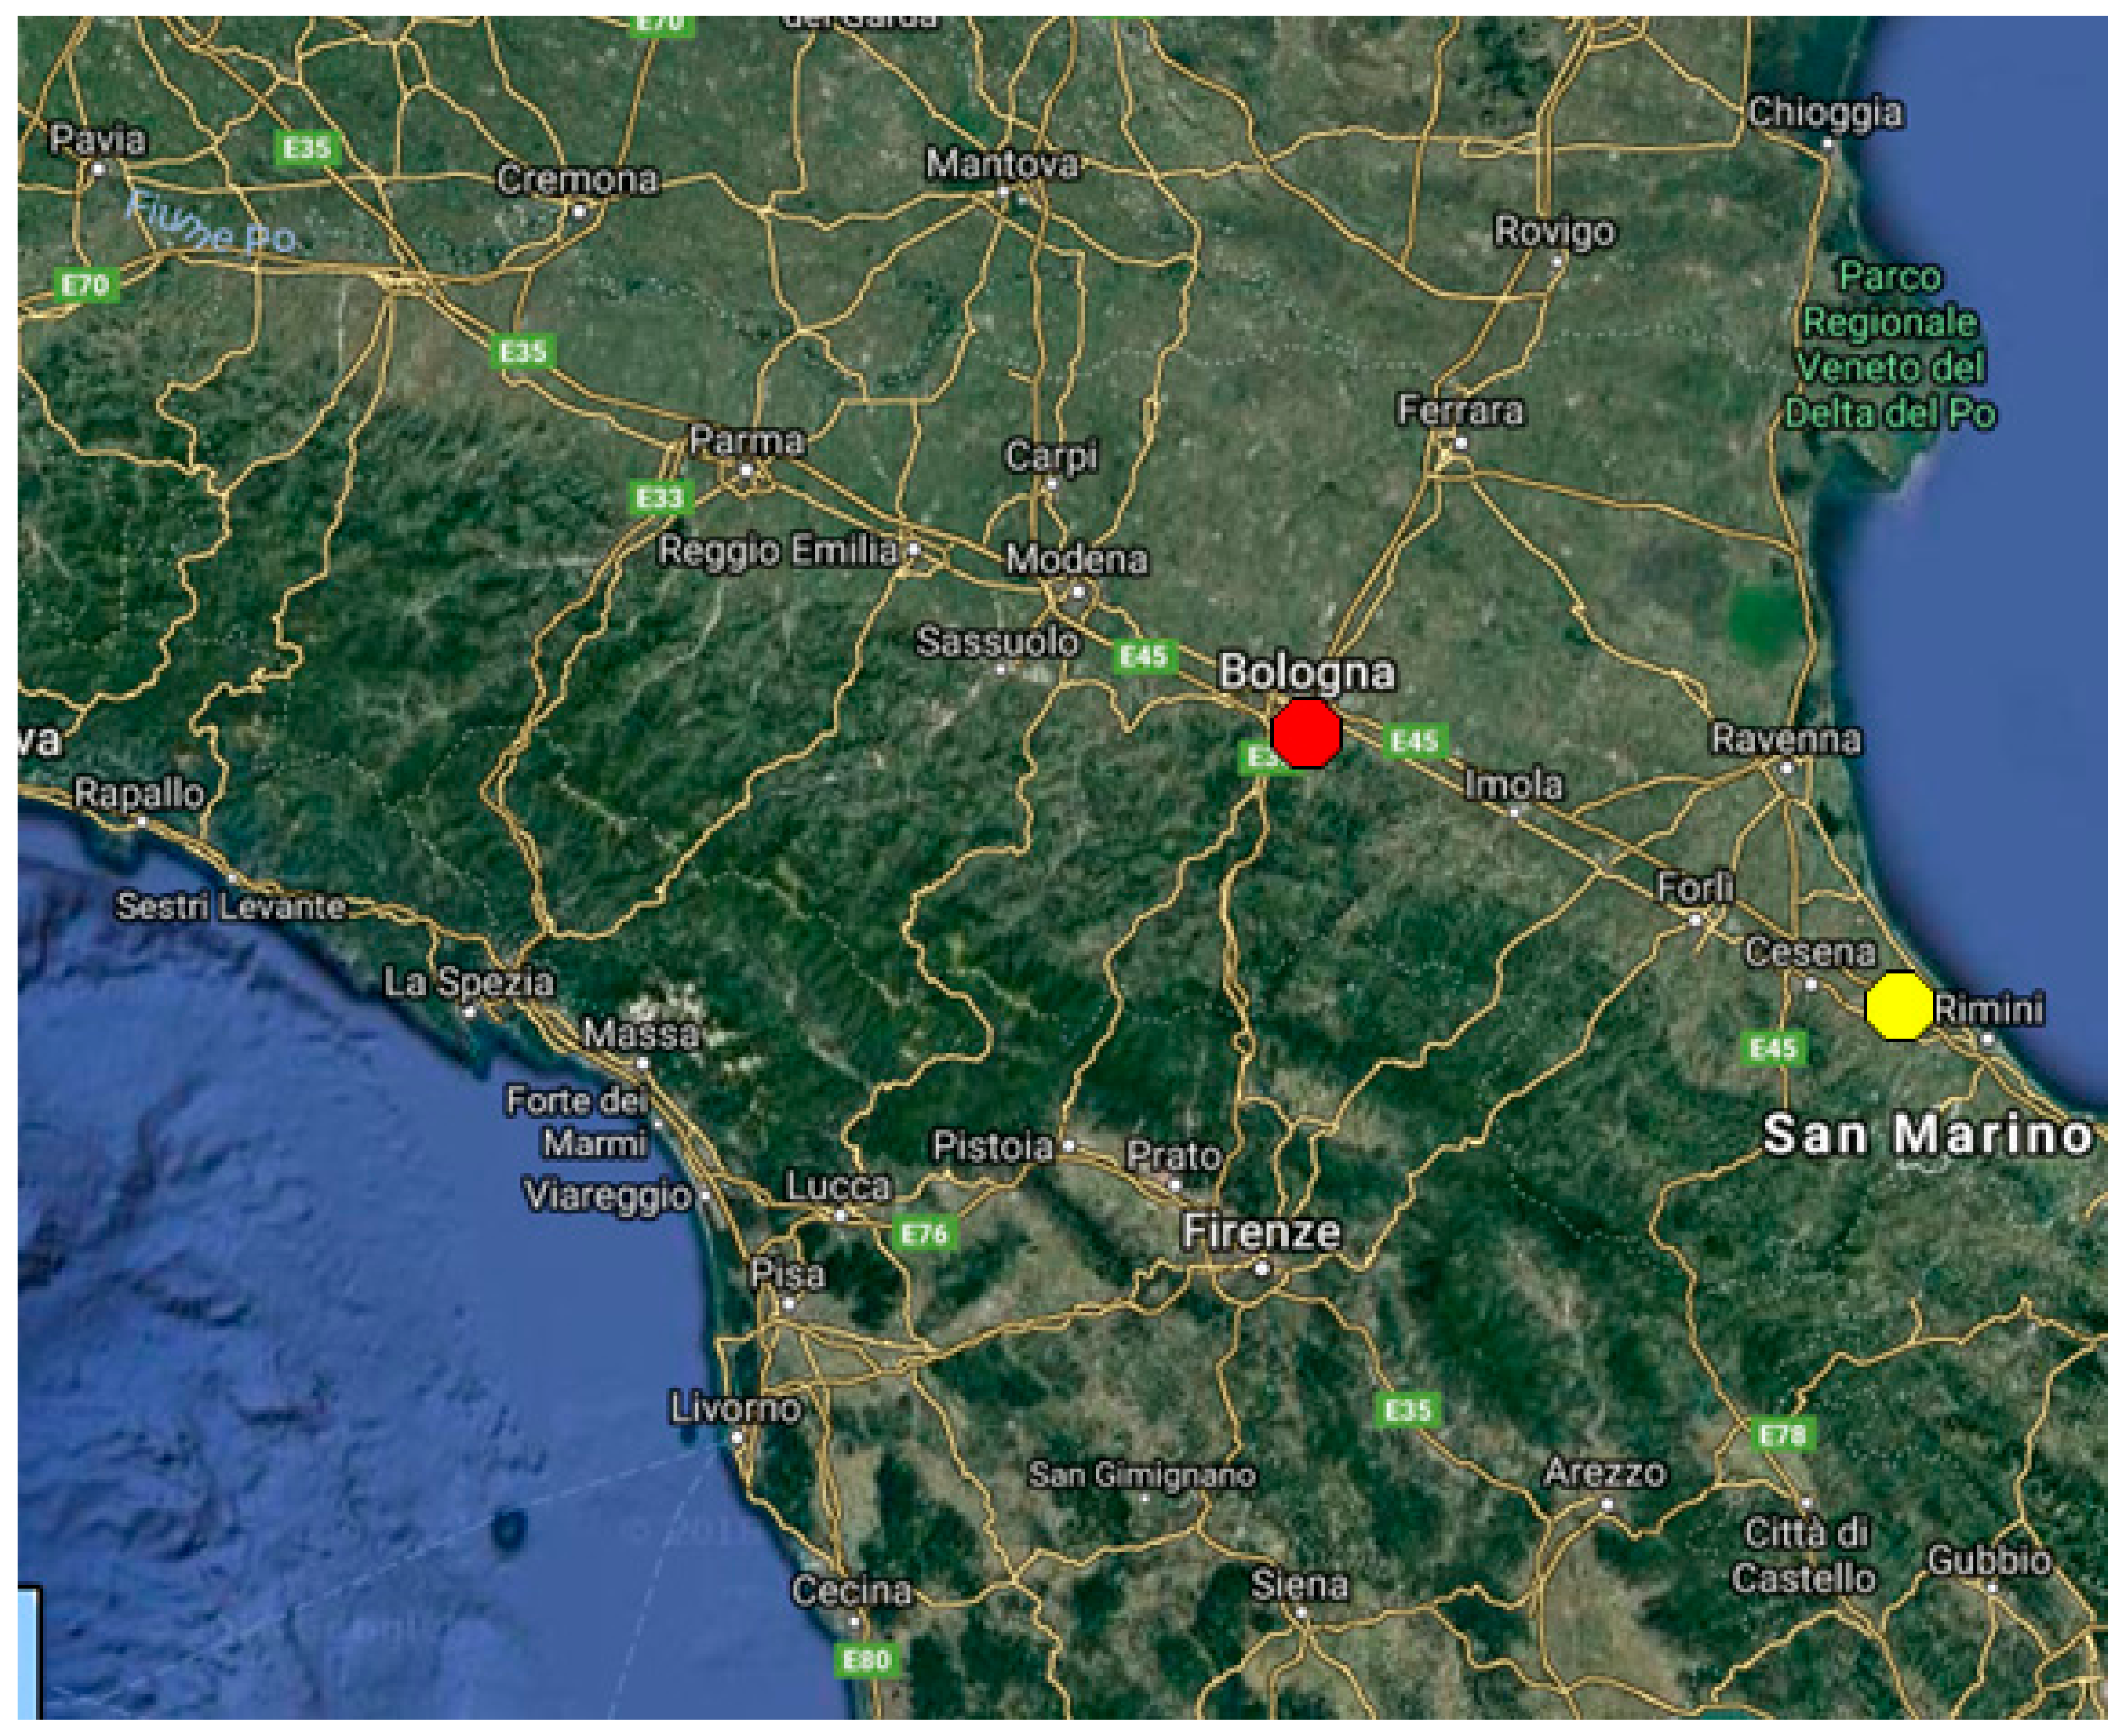
The plot of the AE signals count rate over the monitoring time (Figure 2) suggests that the masonry wall is undergoing a damage process. The clusters of AE hits, especially around the time 500 h, can be regarded as signature of high crack growth rate. During the monitoring period, frequent seismic events occurred in the region [30], but only those that might have affected the stability of the tower have been considered. Basing on their magnitude and epicentral distance, we have selected the two strongest regional earthquakes (the magnitude 4.1 event that hit the Rimini area on 13 October 2010 at 11:43 p.m. with epicenter about 100 km far from Bologna, as shown in Figure 3, and the magnitude 3.4 event recorded in the Modena Apennines on 21 November 2010 at 4:10 p.m.) and the nearby earthquakes with magnitude ≥0.5 and epicentral distance ≤20 km from the monitoring site.
Figure 2a shows the AE signals count rate and the earthquake time series, referring to the entire monitoring period, where a correlation in time between AE clusters and seismic events can be observed. A significant example is given by the seismic and the AE sequences that occurred between 1500 and 1800 h. Even more remarkably, the densest AE cluster (formed by 4000 hits and highlighted by the dashed frame in Figure 2) and the magnitude 4.1 earthquake that occurred on 13 October 2010 at 11:43 p.m. appear to be closely correlated.
Unless uncontrolled factors affecting the measurements, the main seismic shock apparently triggered temporary intensification of the AE activity, revealing local instability until the recovery of equilibrium. The comparatively longer duration of this AE cluster with respect the earthquake duration could be explained by a viscoelastic behavior, assumed for masonry structures [39], which would produce stress and strain over time in response to an impulsive load [40].
3.2. b-Value versus Natural Time Analyses of AE Time Series
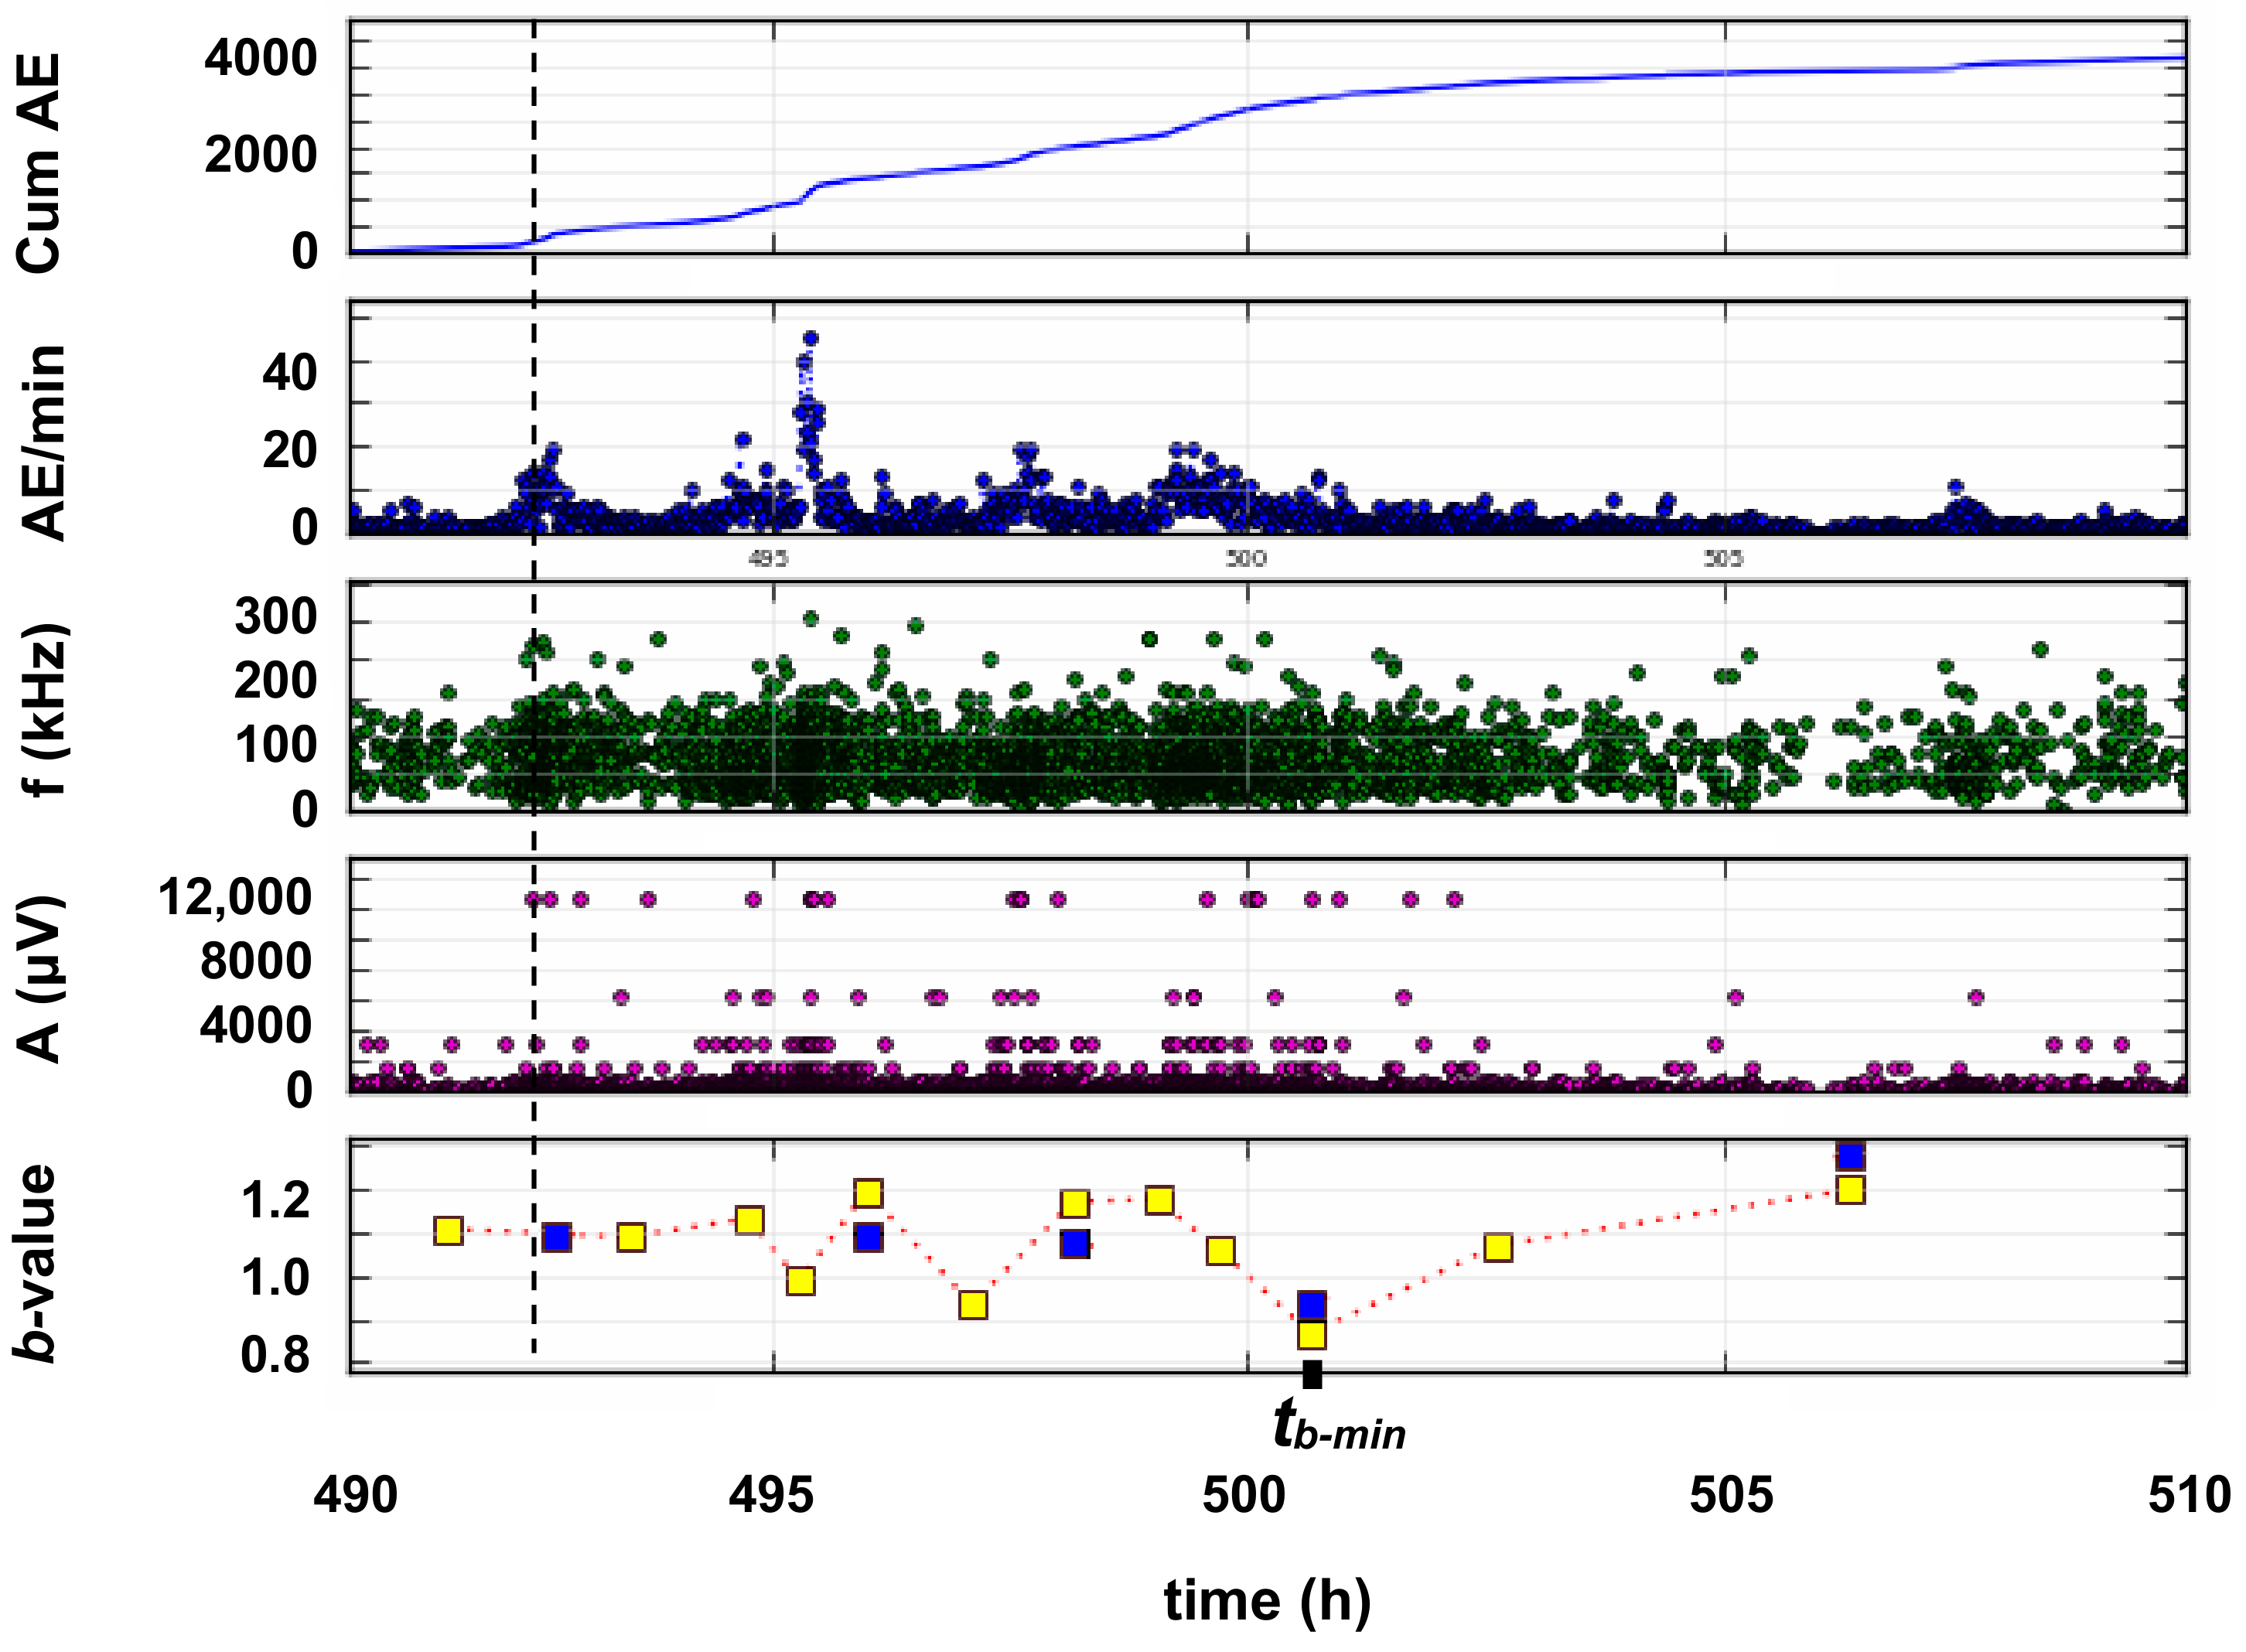
In order to investigate the entrance of the structural element to a critical state, we focus on the cluster of AE hits occurred in the interval 490–510 h. The temporal evolution of two AE parameters has been considered: the b-value of the Gutenberg-Richter (GR) law, and the variance κ1 of the natural-time transformed time series [25,26,27].
The GR law, initially introduced in seismology [41] and then extended to the statistics of AE signals [38,42,43,44,45,46], is expressed by the relation
where is the magnitude [38,45], i.e., the logarithm of the AE peak amplitude, N is the incremental frequency, i.e., the number of AE hits with magnitude greater than the threshold M, and a and b (termed as b-value) are empirical constants to be fitted. The standard error of b-value is for a population of N samples and 95% confidence limits are twice this value.
The b-value is the negative slope of the linear descending branch of the GR law, and it grossly represents the relative number of micro-fractures to macro-fractures. Generally, systematic decreasing b-values are indeed observed during laboratory loading tests, with a single minimum just prior to specimen failure [38,42,43,44,45,46].
In the present study, the b-value analysis has been carried out twice, by partitioning the data set in groups formed by 300 and 800 hits. The b-value of each subset has been obtained through Equation (1) and regression analysis in the linear range of GR graphs, from 2.0 to 3.8 or 4.1 magnitude (i.e., from 40 to 76 or 82 dB). The related time series of b-values exhibit similar trends, especially sharing a global minimum b = 0.9–1 at time tb-min = 501 h (marked in bottom diagram of Figure 4). It is worth remembering that b-values close to unity correspond to the growth of macro-fractures in the monitored element [38,39].
The results of the b-value analysis appear to be reliable, as they are substantially independent from the chosen partition. The final trend toward higher b-values suggests that the monitored masonry wall is substantially stable, with a damaging episode driven by the specific seismic event, and interpretable as a sign of enhanced structural sensitivity to light earthquakes.
In order to take into account variations in the statistical properties of the AE amplitude distributions, the “improved b-value” (Ib) was introduced and defined as follows [42,44,45]:
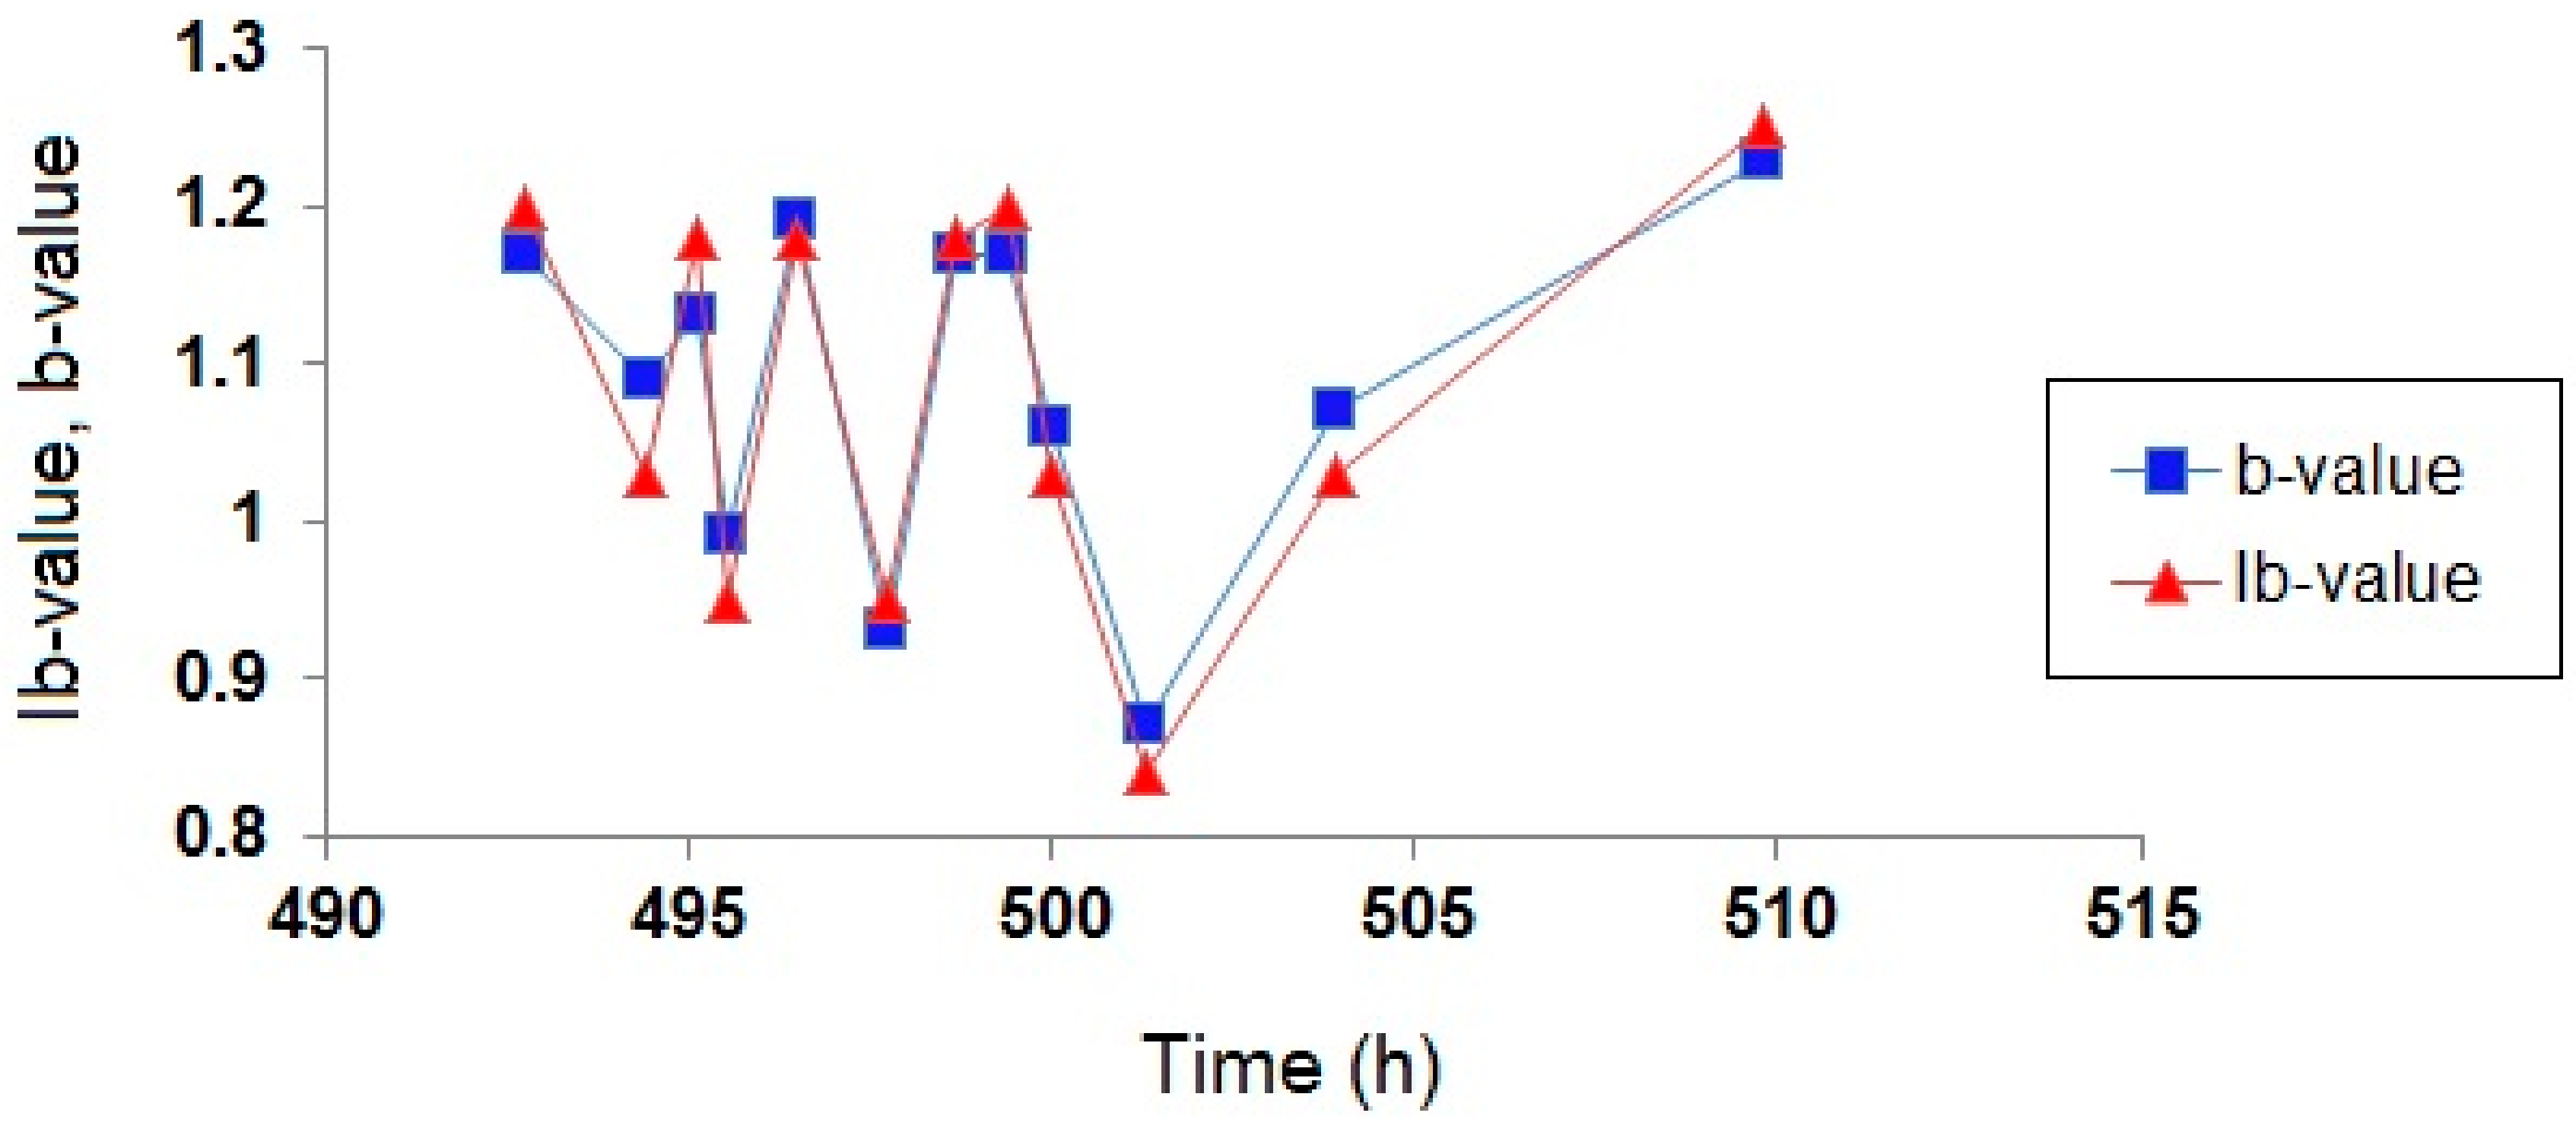
where μ and σ are mean and standard deviation of each AE amplitude subset, found to be, respectively, ~45 and 8 dB, whereas and are user-defined coefficients representing lower and upper limits of the amplitude range in which the cumulative frequency–magnitude distribution properly fits a straight line. The Ib- and b-values formed by a 300-hit partitioning are plotted in Figure 5, showing a good accordance between the two analyses.
Besides the b-value, other synthetic parameters acting as potential fracture precursors can be extracted from a time series of N AE hits by the natural time analysis. This concept is introduced by ascribing the natural time χk = k/N to the k-th event of energy Qk [25,26,27].
Regarding the normalized energies pk ≡ Qk/Σk=1NQi as the probability distribution of the discrete variable χk, the variance , is considered a key parameter for identifying the approach to a critical state, and defined as follows:
As χk and pk are rescaled upon the occurrence of any additional hit, κ1 results to be an evolutionary parameter.
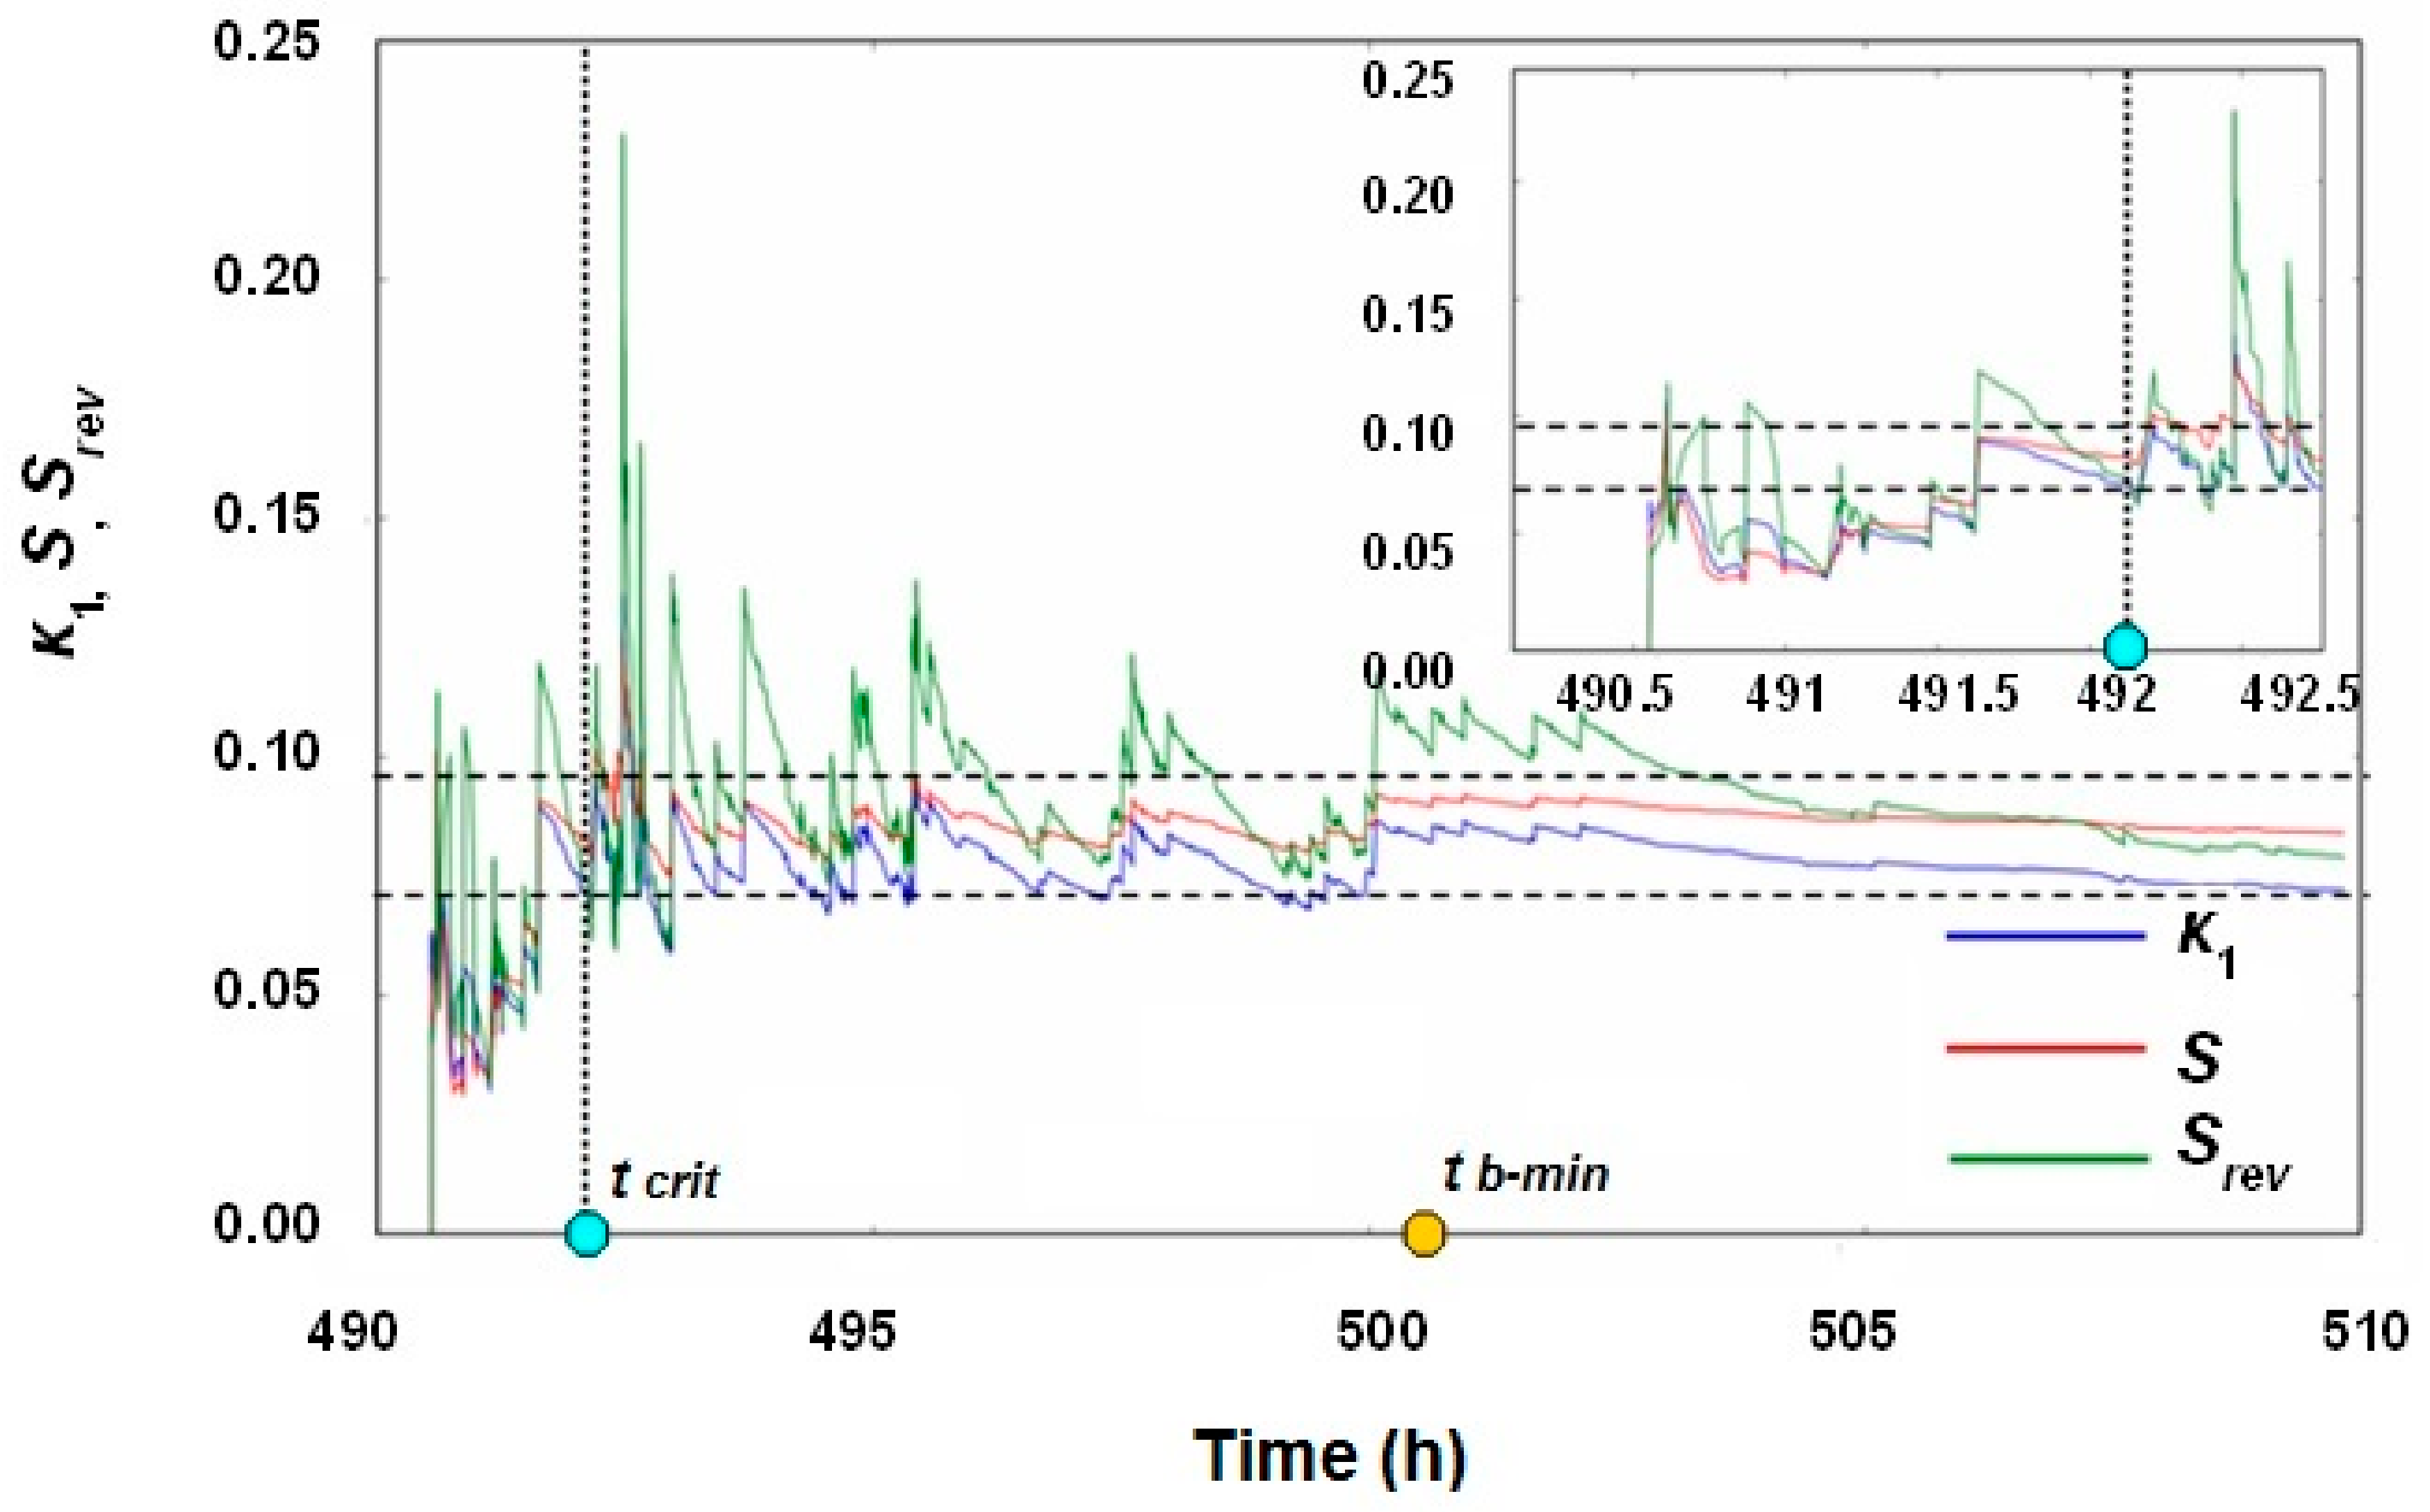
It has been successfully shown that a variety of dynamical systems (2D Ising model [47], Bak-Teng-Wiesenfeld sandpile model [12,47], and pre-seismic electric signals [25,26,27]) become critical when κ1, evolving hit by hit, approaches the value 0.07.
Two criteria were defined to identify the entrance of a system to true critical state [47,48,49,50]:
- (1)
- the parameter κ1 must approach the value 0.07 “by descending from above”;
- (2)
- the entropies S and Srev (entropy upon time reversal) must be lower than the entropy of uniform noise, Su = 0.0966, when κ1 coincides to 0.07. The entropy S is defined as
where .
Here, the evolution of variance κ1 and entropies S and Srev of the natural-time transformed AE time series {χk} has been studied, where the event energy Qk is derived from the amplitude Ak through the relation Qk = cAk1.5, where c is a constant of proportionality [51,52]. Plotting all natural-time quantities as functions of the conventional time t provides a visual way to reveal the possible entrance point to “critical stage,” corresponding to the fulfillment of criticality Conditions (1) and (2). An entrance point to critical stage has been identified at time tcrit = 492 h (criticality initiation time, marked by a vertical dashed line in Figure 4 and by a vertical dotted line in Figure 6), i.e., 9 h before the b-value reaches its minimum. Remarkably, this critical point corresponds to the middle-height peak in the AE rate (highlighted by the dashed line before the highest peak in Figure 4) and to the appearance of high-amplitude AE signals.
This analysis suggests that the variance κ1 of the natural-time transformed AE series can be identified as a pre-failure indicator, before the onset of non-reversible damage—supposedly revealed by the minimum b-value—within the bulk of the structural element.
4. Conclusions
The stability of a masonry wall of the Asinelli Tower has been assessed by the Acoustic Emission (AE) technique for a four-month period. The trend of the whole AE time series suggests that the monitored structural element is substantially stable, albeit with an ongoing damage process revealed by the AE activity observed over the entire monitoring period.
The observed correlation between the AE time series and the sequence of local earthquakes suggests that the local structural response is driven by the nearby seismicity. In particular, the densest AE cluster has been recorded within a few hours after the occurrence of the main local earthquake (4.1 magnitude). The b-value analysis of the AE cluster has revealed a significant, though momentary, acceleration of aging and deterioration processes in the monitored element, whose mechanical stability appears to be affected by light earthquakes.
Another emerging pattern is the transition of the monitored element to a state of criticality according to the paradigm of the natural time analysis [25,26,27]. The entrance to the critical state before the b-value reaches its minimum leads to consider the natural time variance κ1 [47,48,49,50], as a possible early failure precursor. Future investigations in similar surveys would hopefully include the use of a seismometer, installed together with the AE system to record possible small seismic events affecting the observations.
Supplementary Materials
Earthquake data were taken from the website of the Istituto Nazionale di Geofisica e Vulcanologia-INGV, http://www.ingv.it/it/.
Author Contributions
A.C. conceived the research study; G.L. designed and performed the experiments; G.N. analyzed the data and wrote the paper.
Funding
This research received no external funding.
Acknowledgments
The authors wish to thank the Municipality of Bologna and Eng. R. Pisani for allowing this study on the Asinelli Tower. This research received no specific grant from any funding agency in the public, commercial, or not-for-profit sectors.
Conflicts of Interest
The authors declare no conflict of interest.
References
- Bhuiyan, M.Y.; Giurgiutiu, V. The signature of acoustic emission waveforms from fatigue crack advancing in thin metallic plates. Smart Mater. Struct. 2018, 27, 015019. [Google Scholar] [CrossRef]
- Bhuiyan, M.Y.; Lin, B.; Giurgiutiu, V. Acoustic emission sensor effect and waveform evolution during fatigue crack growth in thin metallic plate. J. Intell. Mater. Syst. Struct. 2017, 29, 1275–1284. [Google Scholar] [CrossRef]
- Mogi, K. Study of elastic shocks caused by the fracture of heterogeneous materials and its relation to earthquake phenomena. Bull. Earthq. Res. Inst. 1962, 40, 125–173. [Google Scholar]
- Aki, K. A probabilistic synthesis of precursory phenomena. In Earthquake Prediction; Simpson, D.W., Richards, P.G., Eds.; American Geophysical Union: Washington, DC, USA, 1981; pp. 566–574. [Google Scholar]
- Shah, S.P.; Li, Z. Localization of microcracking in concrete under uniaxial tension. ACI Mater. J. 1994, 91, 372–381. [Google Scholar]
- Grosse, C.U.; Reinhardt, H.W.; Dahm, T. Localization and classification of fracture types in concrete with quantitative acoustic emission measurement techniques. NDT Int. 1997, 30, 223–230. [Google Scholar] [CrossRef]
- Ohtsu, M.; Okamoto, T.; Yuyama, S. Moment tensor analysis of acoustic emission for cracking mechanisms in concrete. ACI Struct. J. 1998, 95, 87–95. [Google Scholar]
- Aggelis, D.G.; Mpalaskas, A.C.; Matikas, T.E. Investigation of different fracture modes in cement-based materials by acoustic emission. Cem. Concr. Res. 2013, 48. [Google Scholar] [CrossRef]
- Carpinteri, A.; Lacidogna, G.; Niccolini, G. Damage analysis of reinforced concrete buildings by the acoustic emission technique. Struct. Control Health Monit. 2011, 18, 660–673. [Google Scholar] [CrossRef]
- Carpinteri, A.; Lacidogna, G.; Niccolini, G. Acoustic emission monitoring of medieval towers considered as sensitive earthquake receptors. Nat. Hazards Earth Syst. Sci. 2007, 7, 251–261. [Google Scholar] [CrossRef] [Green Version]
- Carpinteri, A.; Lacidogna, G. Damage evaluation of three masonry towers by acoustic emission. Eng. Struct. 2007, 29, 1569–1579. [Google Scholar] [CrossRef]
- Bak, P.; Tang, C. Earthquakes as a self-organized critical phenomenon. J. Geophys. Res. 1989, 94, 15635–15637. [Google Scholar] [CrossRef]
- Zapperi, S.; Vespignani, A.; Stanley, H.E. Plasticity and avalanche behaviour in microfracturing phenomena. Nature 1997, 388, 658–660. [Google Scholar] [CrossRef]
- Guarino, A.; Garcimartin, A.; Ciliberto, S. An experimental test of the critical behaviour of fracture precursors. Eur. Phys. J. B 1998, 6, 13–24. [Google Scholar] [CrossRef] [Green Version]
- Bonnet, E.; Bour, O.; Odling, N.E.; Davy, P.; Main, I.P.; Cowie, P.; Berkowitz, B. Scaling of fracture systems in geological media. Rev. Geophys. 2001, 39, 347–383. [Google Scholar] [CrossRef] [Green Version]
- Bak, P.; Christensen, K.; Danon, L.; Scanlon, T. Unified scaling law for earthquakes. Phys. Rev. Lett. 2002, 88, 178501. [Google Scholar] [CrossRef] [PubMed]
- Turcotte, D.L.; Newman, W.I.R.; Shcherbakov, R. Micro and macroscopic models of rock fracture. Geophys. J. Int. 2003, 152, 718–728. [Google Scholar] [CrossRef] [Green Version]
- Corral, A. Statistical Features of Earthquake Temporal Occurrence. In Modeling Critical and Catastrophic Phenomena in Geoscience; Bhattacharya, P., Chakrabarti, B.K., Eds.; Springer: Berlin, Germany, 2006; Volume 705, pp. 191–221. ISBN 978-3-540-35375-1. [Google Scholar]
- Davidsen, J.; Stanchits, S.; Dresen, G. Scaling and universality in rock fracture. Phys. Rev. Lett. 2007, 98, 125502. [Google Scholar] [CrossRef] [PubMed]
- Kun, F.; Carmona, H.A.; Andrade, J.S., Jr.; Herrmann, H.J. Universality behind Basquin’s Law of Fatigue. Phys. Rev. Lett. 2008, 100, 094301. [Google Scholar] [CrossRef] [PubMed]
- Niccolini, G.; Carpinteri, A.; Lacidogna, G.; Manuello, A. Acoustic emission monitoring of the Syracuse Athena Temple: Scale invariance in the timing of ruptures. Phys. Rev. Lett. 2011, 106, 108503. [Google Scholar] [CrossRef] [PubMed]
- Stanley, H.E. Scaling, renormalization and universality: Three pillars of modern critical phenomena. Rev. Mod. Phys. 1999, 71, 358–366. [Google Scholar] [CrossRef]
- Gregori, G.P.; Paparo, G. Acoustic Emission (AE): A diagnostic tool for environmental sciences and for non destructive tests (with a potential application to gravitational a antennas). In Meteorological and Geophysical Fluid Dynamics; Schroeder, W., Ed.; Science Edition: Bremen, Germany, 2004; pp. 166–204. [Google Scholar]
- Gregori, G.P.; Paparo, G.; Poscolieri, M.; Zanini, A. Acoustic emission and released seismic energy. Nat. Hazards Earth Syst. Sci. 2005, 5, 777–782. [Google Scholar] [CrossRef] [Green Version]
- Varotsos, P.A.; Sarlis, N.V.; Skordas, E.S. Spatio-temporal complexity aspects on the interrelation between seismic electric signals and seismicity. Pract. Athens Acad. Greece 2001, 76, 294–321. [Google Scholar]
- Varotsos, P.A.; Sarlis, N.V.; Skordas, E.S. Natural Time Analysis: The New View of Time; Springer: Berlin/Heidelberg, Germany, 2011. [Google Scholar]
- Varotsos, P.A.; Sarlis, N.V.; Skordas, E.S.; Lazaridou, M.S. Seismic Electric Signals: An additional fact showing their physical interconnection with seismicity. Tectonophysics 2013, 589, 116–125. [Google Scholar] [CrossRef]
- Lacidogna, G.; Carpinteri, A.; Manuello, A.; Durin, G.; Schiavi, A.; Niccolini, G.; Agosto, A. Acoustic and electromagnetic emissions as precursor phenomena in failure processes. Strain 2011, 47, 144–152. [Google Scholar] [CrossRef]
- Niccolini, G.; Borla, O.; Lacidogna, G.; Carpinteri, A. Correlated Fracture Precursors in Rocks and Cement-Based Materials under Stress. In Acoustic, Electromagnetic, Neutron Emissions from Fracture and Earthquakes; Carpinteri, A., Lacidogna, G., Manuello, A., Eds.; Springer International Publishing: Cham, Switzerland, 2015; pp. 238–248. [Google Scholar]
- Carpinteri, A.; Lacidogna, G.; Manuello, A.; Niccolini, G. A study on the structural stability of the Asinelli Tower in Bologna. Struct. Control Health Monit. 2016, 23, 659–667. [Google Scholar] [CrossRef]
- Carpinteri, A.; Borla, O. Fracto-emissions as seismic precursors. Eng. Fract. Mech. 2017, 177, 239–250. [Google Scholar] [CrossRef]
- Borla, O.; Lacidogna, G.; Di Battista, E.; Niccolini, G.; Carpinteri, A. Electromagnetic emission as failure precursor phenomenon for seismic activity monitoring. In Proceedings of the Conference & Exposition on Experimental and Applied Mechanics (SEM), Greenville, SC, USA, 2–5 June 2014; Springer International Publishing: Cham, Switzerland, 2014; Volume 5, pp. 221–229. [Google Scholar]
- Niccolini, G.; Manuello, A.; Marchis, E.; Carpinteri, A. Signal frequency distribution and natural time analyses from acoustic emission monitoring of an arched structure in the Racconigi Castle. Nat. Hazards Earth Syst. Sci. 2017, 17, 1025–1032. [Google Scholar] [CrossRef]
- Dobrovolsky, I.P.; Zubkov, S.I.; Miachkin, V.I. Estimation of the size of earthquake preparation zones. Pure Appl. Geophys. 1979, 117, 1025–1044. [Google Scholar] [CrossRef]
- Lei, X.; Ma, S. Laboratory acoustic emission study for earthquake generation process. Earthq. Sci. 2014, 27, 627–646. [Google Scholar] [CrossRef] [Green Version]
- Pesci, A.; Casula, G.; Boschi, E. Laser scanning the Garisenda and Asinelli towers in Bologna (Italy): Detailed deformation patterns of two ancient leaning buildings. J. Cult. Herit. 2011, 12, 117–127. [Google Scholar] [CrossRef] [Green Version]
- Carpinteri, A.; Lacidogna, G.; Invernizzi, S.; Accornero, F. The Sacred Mountain of Varallo in Italy: Seismic Risk Assessment by Acoustic Emission and Structural Numerical Models. Sci. World J. 2013, 2013, 170291. [Google Scholar] [CrossRef] [PubMed]
- Colombo, S.; Main, I.G.; Forde, M.C. Assessing damage of reinforced concrete beam using “b-value” analysis of acoustic emission signals. J. Mater. Civ. Eng. ASCE 2003, 15, 280–286. [Google Scholar] [CrossRef]
- Cecchi, A.; Tralli, A. A homogenized viscoelastic model for masonry structures. Int. J. Solids Struct. 2012, 49, 1485–1496. [Google Scholar] [CrossRef]
- Pritchard, R.H.; Terentjev, E.M. Oscillations and damping in the fractional Maxwell materials. J. Rheol. 2017, 61, 187–203. [Google Scholar] [CrossRef] [Green Version]
- Richter, C.F. Elementary Seismology; W.H. Freeman and Company: San Francisco, CA, USA; London, UK, 1958. [Google Scholar]
- Shiotani, T.; Fujii, K.; Aoki, T.; Amou, K. Evaluation of progressive failure using AE sources and improved b-value on slope model tests. Prog. Acoust. Emiss. 1994, VII, 529–534. [Google Scholar]
- Sammonds, P.R.; Meredith, P.G.; Murrel, S.A.F.; Main, I.G. Modeling the evolution of damage in rock containing porefluid by acoustic emission. In Proceedings of the Eurock’94, Delft, The Netherlands, 29–31 August 1994. [Google Scholar]
- Shiotani, T.; Yuyama, S.; Li, Z.W.; Ohtsu, M. Application of the AE improved b-value to qualitative evaluation of fracture process in concrete materials. J. Acoust. Emiss. 2001, 19, 118–132. [Google Scholar]
- Rao, M.V.M.S.; Prasanna Lakhsmi, K.J. Analysis of b-value and improved b-value of acoustic emissions accompanying rock fracture. Curr. Sci. 2005, 89, 1577–1582. [Google Scholar]
- Carpinteri, A.; Lacidogna, G.; Manuello, A.; Niccolini, G.; Puzzi, S. Critical defect size distributions in concrete structures detected by the acoustic emission technique. Meccanica 2008, 43, 349–363. [Google Scholar] [CrossRef]
- Varotsos, P.A.; Sarlis, N.V.; Skordas, E.S.; Uyeda, S.; Kamogawa, M. Natural time analysis of critical phenomena. Proc. Natl. Acad. Sci. USA 2011, 108, 11361–11364. [Google Scholar] [CrossRef] [PubMed] [Green Version]
- Varotsos, P.A.; Sarlis, N.V.; Skordas, E.S.; Lazaridou, M.S. Fluctuations, under time reversal, of the natural time and the entropy distinguish similar looking electric signals of different dynamics. J. Appl. Phys. 2008, 103, 014906. [Google Scholar] [CrossRef] [Green Version]
- Hloupis, G.; Stavrakas, I.; Pasiou, E.D.; Triantis, D.; Kourkoulis, S.K. Natural time analysis of acoustic emissions in Double Edge Notched Tension (DENT) marble specimens. Procedia Eng. 2015, 109, 248–256. [Google Scholar] [CrossRef]
- Hloupis, G.; Stavrakas, I.; Vallianatos, F.; Triantis, D. A preliminary study for prefailure indicators in acoustic emissions using wavelets and natural time analysis. Proc. Inst. Mech. Eng. Part L 2016, 230, 780–788. [Google Scholar] [CrossRef]
- Kanamori, H.; Anderson, D.L. Theoretical basis of some empirical relationships in seismology. Bull. Seismol. Soc. Am. 1975, 65, 1073–1095. [Google Scholar]
- Turcotte, D.L. Fractal and Chaos in Geology and Geophysics; Cambridge University Press: Cambridge, UK, 1997. [Google Scholar]
Figure 1.
(a) The Asinelli Tower (with Garisenda Tower on the left) in the city centre of Bologna; (b) Monitored portion of the masonry wall with the applied AE transducers, printed from [30]; (c) AE transducer adopted for the monitoring; (d) Typical AE signal formed by the sequence of P-, S- and surface waves.

Figure 2.
(a) Time series of the AE signals count rate and nearby earthquakes (extracted from http://www.ingv.it/it/, see Supplementary Materials) printed from [28]; (b) Expansion of the dashed frame: the red line marks the occurrence time tEQ = 486 h of 13 October; earthquake (EQ).
Figure 2.
(a) Time series of the AE signals count rate and nearby earthquakes (extracted from http://www.ingv.it/it/, see Supplementary Materials) printed from [28]; (b) Expansion of the dashed frame: the red line marks the occurrence time tEQ = 486 h of 13 October; earthquake (EQ).

Figure 3.
Map showing the epicenter of the 4.1-magnitude earthquake (yellow point) occurred on 13 October 2010 with epicenter 100 km far from the monitoring site in Bologna (red point).
Figure 3.
Map showing the epicenter of the 4.1-magnitude earthquake (yellow point) occurred on 13 October 2010 with epicenter 100 km far from the monitoring site in Bologna (red point).

Figure 4.
From top to bottom: accumulated number of AE signals; AE signals count rate; time series of AE signals frequencies (derived from signal duration and ring-down count) and amplitudes; b-value over time calculated using groups of, respectively, 300 (yellow squares), and 800 (blue squares) numbers of signals. The dashed line indicates a critical point revealed by the natural time analysis.

Figure 5.
The b-value and Ib-value calculated using groups of 300 numbers of signals.

Figure 6.
Time evolution of natural-time quantities κ1, S and Srev. Horizontal dashed lines represent the characteristics value κ1 = 0.07 and Su = 0.0966 defining the criticality initiation time tcrit. Note the relative positions of tcrit and tb-min along the time-axis (the inset shows the approach of natural-time quantities to the critical point).

© 2018 by the authors. Licensee MDPI, Basel, Switzerland. This article is an open access article distributed under the terms and conditions of the Creative Commons Attribution (CC BY) license (http://creativecommons.org/licenses/by/4.0/).
Share and Cite
MDPI and ACS Style
Carpinteri, A.; Niccolini, G.; Lacidogna, G. Time Series Analysis of Acoustic Emissions in the Asinelli Tower during Local Seismic Activity. Appl. Sci. 2018, 8, 1012. https://doi.org/10.3390/app8071012
AMA Style
Carpinteri A, Niccolini G, Lacidogna G. Time Series Analysis of Acoustic Emissions in the Asinelli Tower during Local Seismic Activity. Applied Sciences. 2018; 8(7):1012. https://doi.org/10.3390/app8071012
Chicago/Turabian StyleCarpinteri, Alberto, Gianni Niccolini, and Giuseppe Lacidogna. 2018. "Time Series Analysis of Acoustic Emissions in the Asinelli Tower during Local Seismic Activity" Applied Sciences 8, no. 7: 1012. https://doi.org/10.3390/app8071012
Note that from the first issue of 2016, this journal uses article numbers instead of page numbers. See further details here.