Optimization of Machining Parameters Using Fuzzy Taguchi Method for Reducing Tool Wear


1
Department of Information Management, Yu Da University, Miaoli County 36143, Taiwan
2
Department of Industrial Engineering and Management, Yuan Ze University, Taoyuan City 32003, Taiwan
*
Author to whom correspondence should be addressed.
Appl. Sci. 2018, 8(7), 1011; https://doi.org/10.3390/app8071011
Submission received: 10 May 2018
/
Revised: 15 June 2018
/
Accepted: 15 June 2018
/
Published: 21 June 2018
(This article belongs to the Special Issue Selected Papers from IEEE ICASI 2018)
Abstract
:Manufacturing industries are gradually changing to green production due to the increasing production cost. Reducing tool wear in production can not only decrease production cost but also the effect the environment. Thus, it becomes a crucial issue for the machining industry. This study investigates the optimal machining parameters for the computer numerical controlled turning process of S45C steel in minimizing tool wear. The correlation between control parameters (speed, cutting depth, and feed rate) and production quality were constructed by using semantic rules and fuzzy quantification. The Taguchi method was additionally employed to determine the optimal turning parameters. Under the consideration of environmental protection and tool cost, the optimal machining parameters were furthermore derived from the fuzzy semantic rules. The practicability of the optimal parameters was moreover verified through turning experiments. It is found that the proposed method in this study is appropriate and applicable to universal applications.
1. Introduction
For the increasing production costs and restrictive international laws regarding environmental protection, manufacturing industries are gradually transferring to green production as well as actively developing new processes that conserve energy, consume less resources, and generate less waste. These measures have substantially reduced production cost in not only assisting entrepreneurs to fulfill the social responsibility of the corporation but also meeting sustainable management objectives.
Precision turning is a universal and fundamental process in metal cutting. Since the demand for high quality products is increasing, the turning tools used in computer numerical controlled (CNC) machines are critical and irreplaceable for high-precision metal parts. The parameter setting of CNC machining operations often relies on practical experience. In some cases, the parameters are even selected using trial and error that often leads to increased tool costs and the production time; therefore, establishing a prospective and versatile optimal parameter analyzing method is deemed to be necessary for metal cutting industries.
In the existing studies on tool wear, researchers have focused on topics such as employing ceramic tools to cut Inconel 625 and using analysis of variance to determine the effects of cutting parameters on material removal rate and tool wear. It was found that cutting depth was the primary factor affecting tool wear [1]. A two-step method [2] was also proposed for predicting the lifetime of tools during cutting processes. It was found that tool life can be estimated and the production cost can be reduced by using image recognition software and artificial neural network (ANN). The Taguchi Method was also employed to select cutting parameters (tool nose radius, cutting speed, feed rate, and cutting depth) for optimizing tool wear and surface roughness in cutting AISI 4340 steel. The result revealed that the optimal cutting parameters could reduce production cost in the automatic production system [3].
An experimental study [4] in turning mild-steel round bar by using various combinations of federate, cutting depth, and speed was also developed. Through the scanning electron microscope (SEM), the tool wear can be measured. It was found that larger cutting depth and higher speed would increase the cutting temperature that will shorten the tool life. The parameter optimization using grey relational analysis and TOPSIS has been studied in turning Mg alloy with polycrystalline diamond (PCD) tools [5]. The mathematical model was constructed by using Response Surface Analysis (RSA) and then verified by using Analysis of Variance (ANOVA). It was found that the federate and speed were major factors to the surface roughness and tool wear [5]. The MATLAB software (R2016a, Yuan Ze University, Taoyuan, R.O.C., Taiwan, 2016) was also used to build mathematical models in predicting tool wear during turning [6]. The above studies are all under a specific environment using certain equipment. These studies have to be achieved through the operation of process equipment to verify the result of tool wear that often increase the cost. Thus, the semantic rules to quantify and calculate the optimum parameters without operating the equipment will surely enhance the competitiveness for the precision CNC turning industry.
2. Research Background
2.1. Tool Wear
Tool wear is a result of physical and chemical effects of the heat and mechanical friction that occur during cutting. Tool wear occurs on the backside of the tool wear belt, notch, and collapse. The abrasion area is crescent-shaped, and the back of the flank undergoes oxidation pit and ditch during abrasive wear of the pattern [7].
2.2. Fuzzy Theory
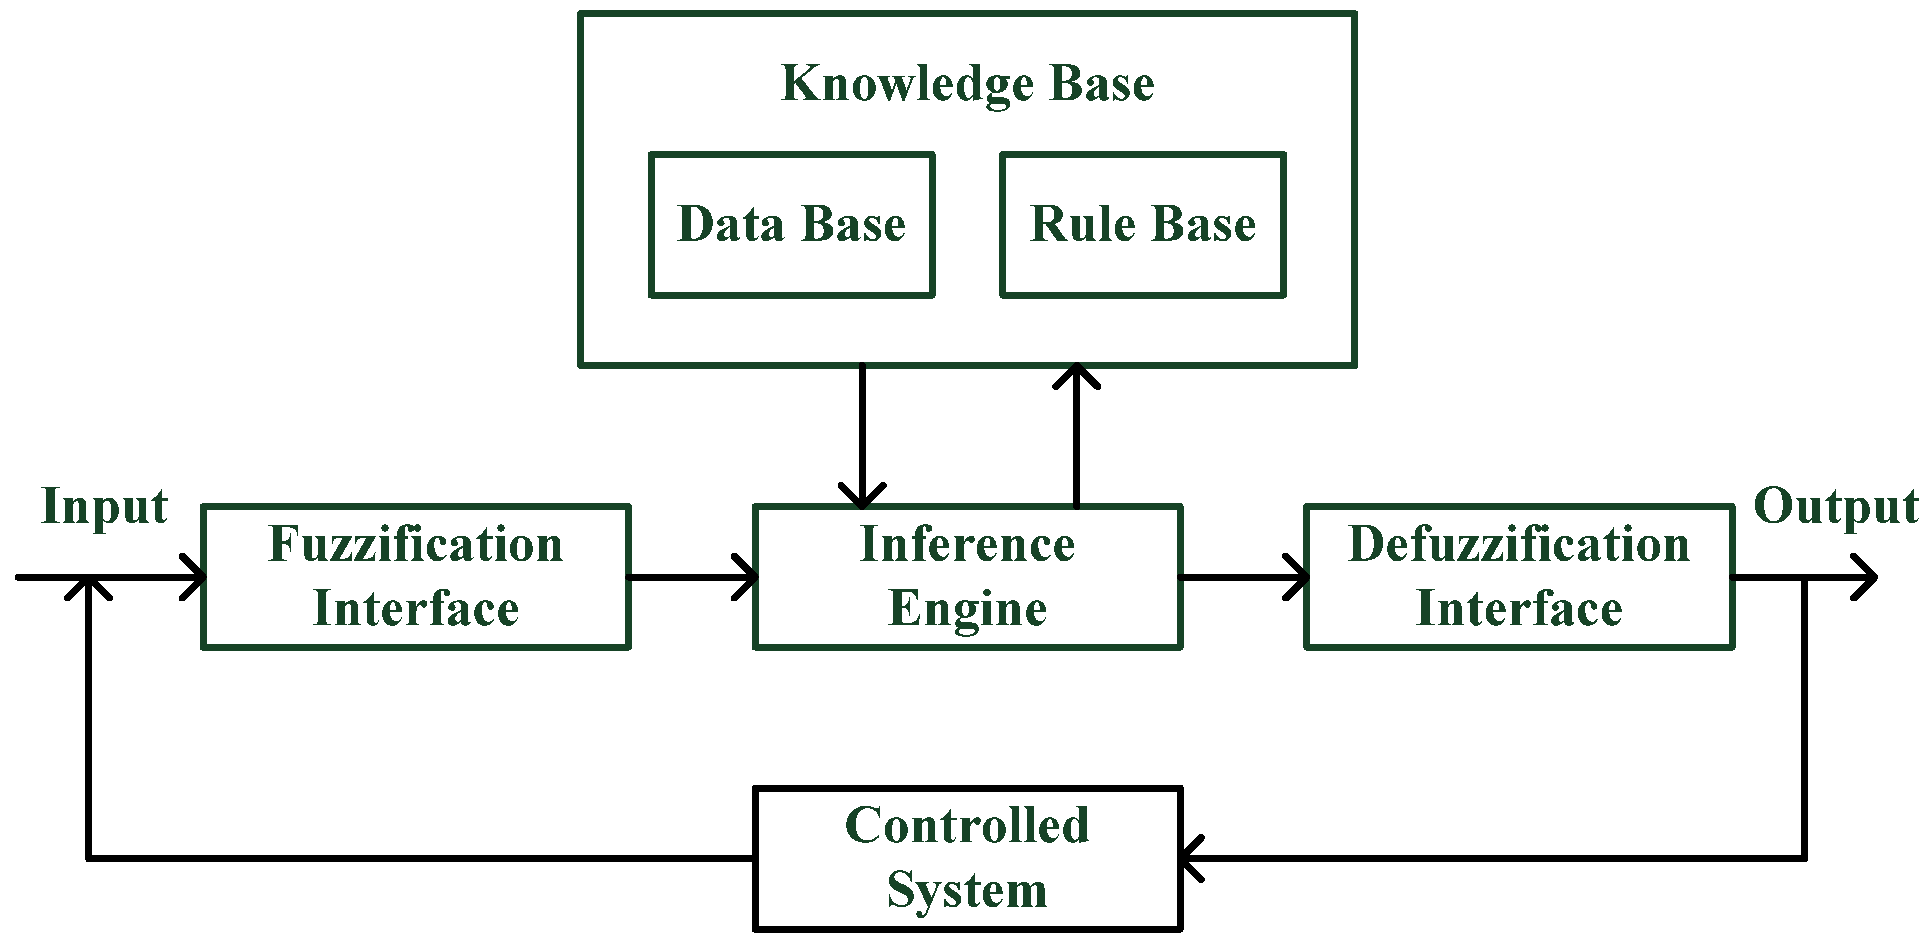
Fuzzy theory was proposed by Zadeh in 1965. Based on fuzzy sets, the theory is mainly applied to quantify the fuzzy concept and already has a considerable theoretical foundation [8]. Real environments are full of problems with uncertainty and inaccuracy. Using fuzzy logic to solve such problems, the theory identifies the fuzzy nature of the problem by extending the membership function over the interval of 0 to 1 in quantifying and characterizing the uncertainty [9]. The Fuzzy theory is to use the IF...THEN language to represent the relationship between the fuzzy relations. The user language can represent a qualitative conditional sentence and ambiguous rules. It is quantified by fuzzy math tool. Through fuzzy logic control, the input language is converted into fuzzy sets. The fuzzy logic control architecture includes the Fuzzification Interface, Fuzzy knowledge base, Interface Engine and DeFuzzification Interface, as shown in Figure 1 [10].
2.2.1. Fuzzification Interface
After the normalization step, the external input signal converts the normalization to a suitable fuzzy linguistic variable, which will be used as a fuzzy inference operation.
2.2.2. Fuzzy knowledge Base
The fuzzy knowledge base consists of a database and a rule base.
1. Database
The necessary definitions for constructing a fuzzy interface include state sets, fuzzy numbers, and membership functions.
2. Rule base
The control rules are usually represented by IF...THEN, which provides the representation of expert experience, knowledge and control strategies.
2.2.3. Interface Engine
Based on stored data and fuzzy language control rules, the input fuzzification variable is operated by simulating the human thinking mode, such as:
Rule: IF X is A THEN Y is B
X: The input condition variable corresponds to A, Y: The output condition variable corresponds to B.
2.2.4. Defuzzification Interface
Through the defuzzification interface, the fuzzy value output is converted into a clear output value. The common fuzzification strategies include Center of Area, Weighted Average Formula, and Mean of Maximum.
2.3. Taguchi Method
The Taguchi method was proposed by Dr. Taguchi Genichi to improve the stability of quality characteristics and reduce quality loss by using engineering optimization. Selecting an appropriate orthogonal array for analysis and selecting the optimal setting quickly reduces product variation in a design (or process) to identify the favorable control factor combination [11]. Through the mapping in the Taguchi method, the values of the repeated quality characteristics under the same conditions can be processed to find out the factors that can affect the variation. Using the signal-to-noise ratio (S/N), the value of the repetitive quality characteristics is integrated into the value for the size of reactive variation [12].
There are three types of signal-to-noise [12]:
- Smaller the better: The value cannot be negative. The smaller it is, the better, where n: experiment times and yi: experimental value.
- Larger the better: The larger the value is, the better.
- Nominal the best: The value has a fixed target value. Less than or greater than the target value is not good, where Vm: average, Ve: variance.
When considering averages and variances
When considering variance
Taguchi Orthogonal Array
How to use Taguchi Orthogonal Array is important. The purpose is to obtain useful statistical data with a limited number of experiments. The expression of the Orthogonal Array is that “L” is the original name of the Orthogonal Array, Latin squares, “a” indicates the number of groups in the experiment, and can have at most “b” levels of “c” factors.
3. Research Design
This study employed the Taguchi method and standard orthogonal array to identify three factors and three levels before selecting the optimal combination of cutting parameters. The three levels of cutting parameters are low, medium, and high. Semantic quantification was then used to determine the target cutting characteristics. In addition, the tool wear was divided into five classes (greatest, large, moderate, small, and minimal). The fuzzy rules were thus established based on the three levels, and the expected quality characteristic was set to be smaller-the-better.
3.1. Fuzzy Rules Establishment
According to the membership function in each rule, three input factors were compared to select the fuzzy membership function. The minimum membership function was derived from the intersection of the two selected input factors. For the fuzzy output, fuzzy values were determined by the maximum area of the centroid value calculated from the maximum value of the union of the fuzzy sets. In this paper, the triangle membership function was selected, and the center of gravity method was used for defuzzification.
Tool wear is a vital factor affecting cutting quality in precision machining. Changing the cutting tool before tool life results in higher production cost, lower production efficiency, and much disposal of tool inserts, which cause environmental pollution. Therefore, this study established fuzzy rules using cutting speed, cutting depth, and feed rate to minimize the tool wear. The rules are as follows:
- Rule 1:
- IF cutting speed is “low” and cutting depth is “low” and feed rate is “low”, THEN tool wear is “large.”
- Rule 2:
- IF cutting speed is “low” and cutting depth is “low” and feed rate is “medium”, THEN tool wear is “greatest.”
- Rule 3:
- IF cutting speed is “low” and cutting depth is “low” and feed rate is “high”, THEN tool wear is “large.”
- Rule 4:
- IF cutting speed is “low” and cutting depth is “medium” and feed rate is “low”, THEN tool wear is “moderate.”
- Rule 5:
- IF cutting speed is “low” and cutting depth is “medium” and feed rate is “medium”, THEN tool wear is “large.”
- Rule 6:
- IF cutting speed is “low” and cutting depth is “medium” and feed rate is “high”, THEN tool wear is “large.”
- Rule 7:
- IF cutting speed is “low” and cutting depth is “high” and feed rate is “low”, THEN tool wear is “minimal.”
- Rule 8:
- IF cutting speed is “low” and cutting depth is “high” and feed rate is “medium”, THEN tool wear is “minimal.”
- Rule 9:
- IF cutting speed is “low” and cutting depth is “high” and feed rate is “high,” THEN tool wear is “small.”
- Rule 10:
- IF cutting speed is “medium” and cutting depth is “low” and feed rate is “low”, THEN tool wear is “greatest.”
- Rule 11:
- IF cutting speed is “medium” and cutting depth is “low” and feed rate is “medium”, THEN tool wear is “greatest.”
- Rule 12:
- IF cutting speed is “medium” and cutting depth is “low” and feed rate is “high”, THEN tool wear is “greatest.”
- Rule 13:
- IF cutting speed is “medium” and cutting depth is “medium” and feed rate is “low”, THEN tool wear is “moderate.”
- Rule 14:
- IF cutting speed is “medium” and cutting depth is “medium” and feed rate is “medium”, THEN tool wear is “moderate.”
- Rule 15:
- IF cutting speed is “medium” and cutting depth is “medium” and feed rate is “high”, THEN tool wear is “large.”
- Rule 16:
- IF cutting speed is “medium” and cutting depth is “high” and feed rate is “low”, THEN tool wear is “small.”
- Rule 17:
- IF cutting speed is “medium” and cutting depth is “high” and feed rate is “medium”, THEN tool wear is “minimal.”
- Rule 18:
- IF cutting speed is “medium” and cutting depth is “high” and feed rate is “high”, THEN tool wear is “small.”
- Rule 19:
- IF cutting speed is “high” and cutting depth is “low” and feed rate is “low”, THEN tool wear is “large.”
- Rule 20:
- IF cutting speed is “high” and cutting depth is “low” and feed rate is “medium”, THEN tool wear is “greatest.”
- Rule 21:
- IF cutting speed is “high” and cutting depth is “low” and feed rate is “high”, THEN tool wear is “greatest.”
- Rule 22:
- IF cutting speed is “high” and cutting depth is “medium” and feed rate is “low”, THEN tool wear is “moderate.”
- Rule 23:
- IF cutting speed is “high” and cutting depth is “medium” and feed rate is “medium”, THEN tool wear is “small.”
- Rule 24:
- IF cutting speed is “high” and cutting depth is “medium” and feed rate is “high”, THEN tool wear is “small.”
- Rule 25:
- IF cutting speed is “high” and cutting depth is “high” and feed rate is “low”, THEN tool wear is “small.”
- Rule 26:
- IF cutting speed is “high” and cutting depth is “high” and feed rate is “medium”, THEN tool wear is “minimal.”
- Rule 27:
- IF cutting speed is “high” and cutting depth is “high” and feed rate is “high”, THEN tool wear is “small.”
3.2. Variability of the Input and Output Domains
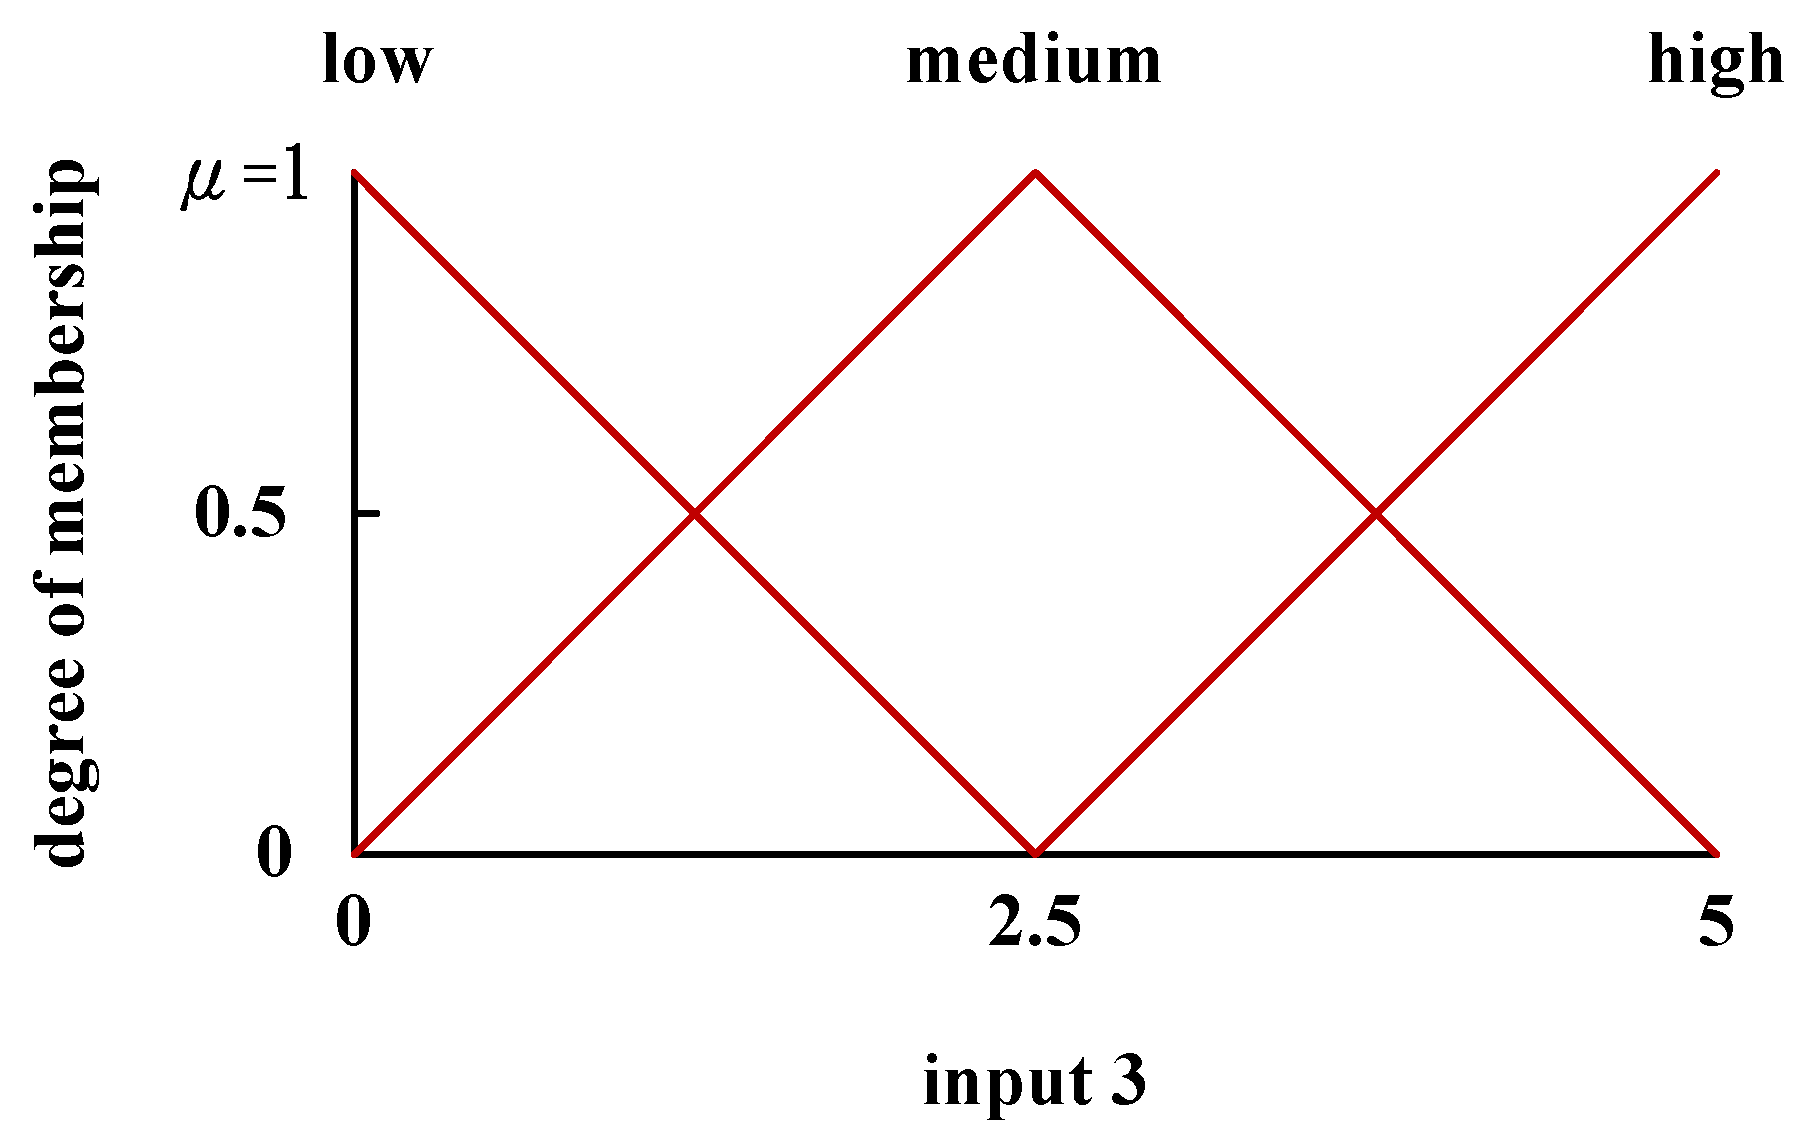
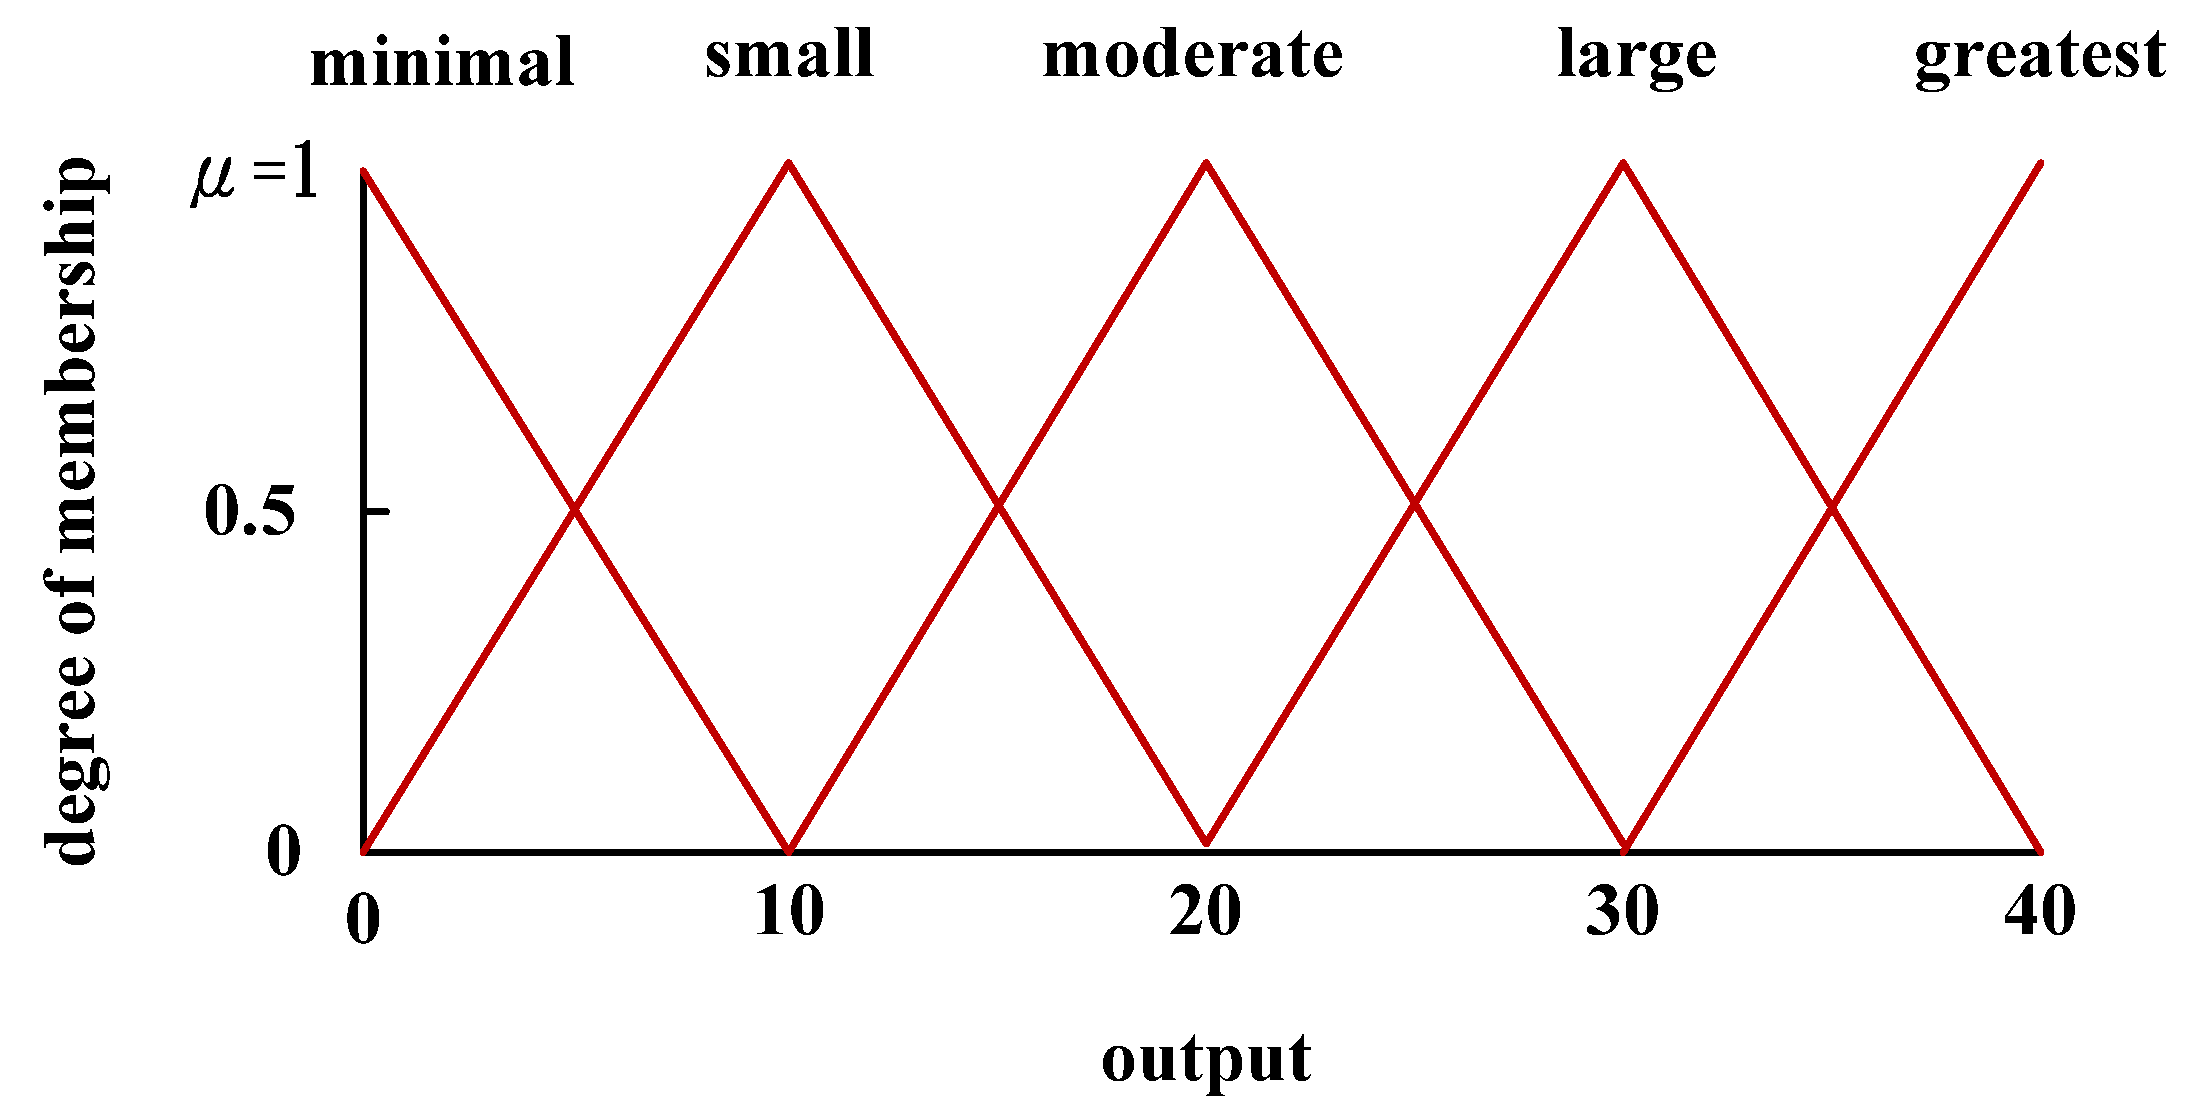
The operation had three inputs and one output. The input target was the control factor, and the output target was the default result. The input domain of the variables was in the interval [0, 5] and divided into five equal parts. The output domain of the variables was in the interval [0, 40] and divided into 40 equal parts.
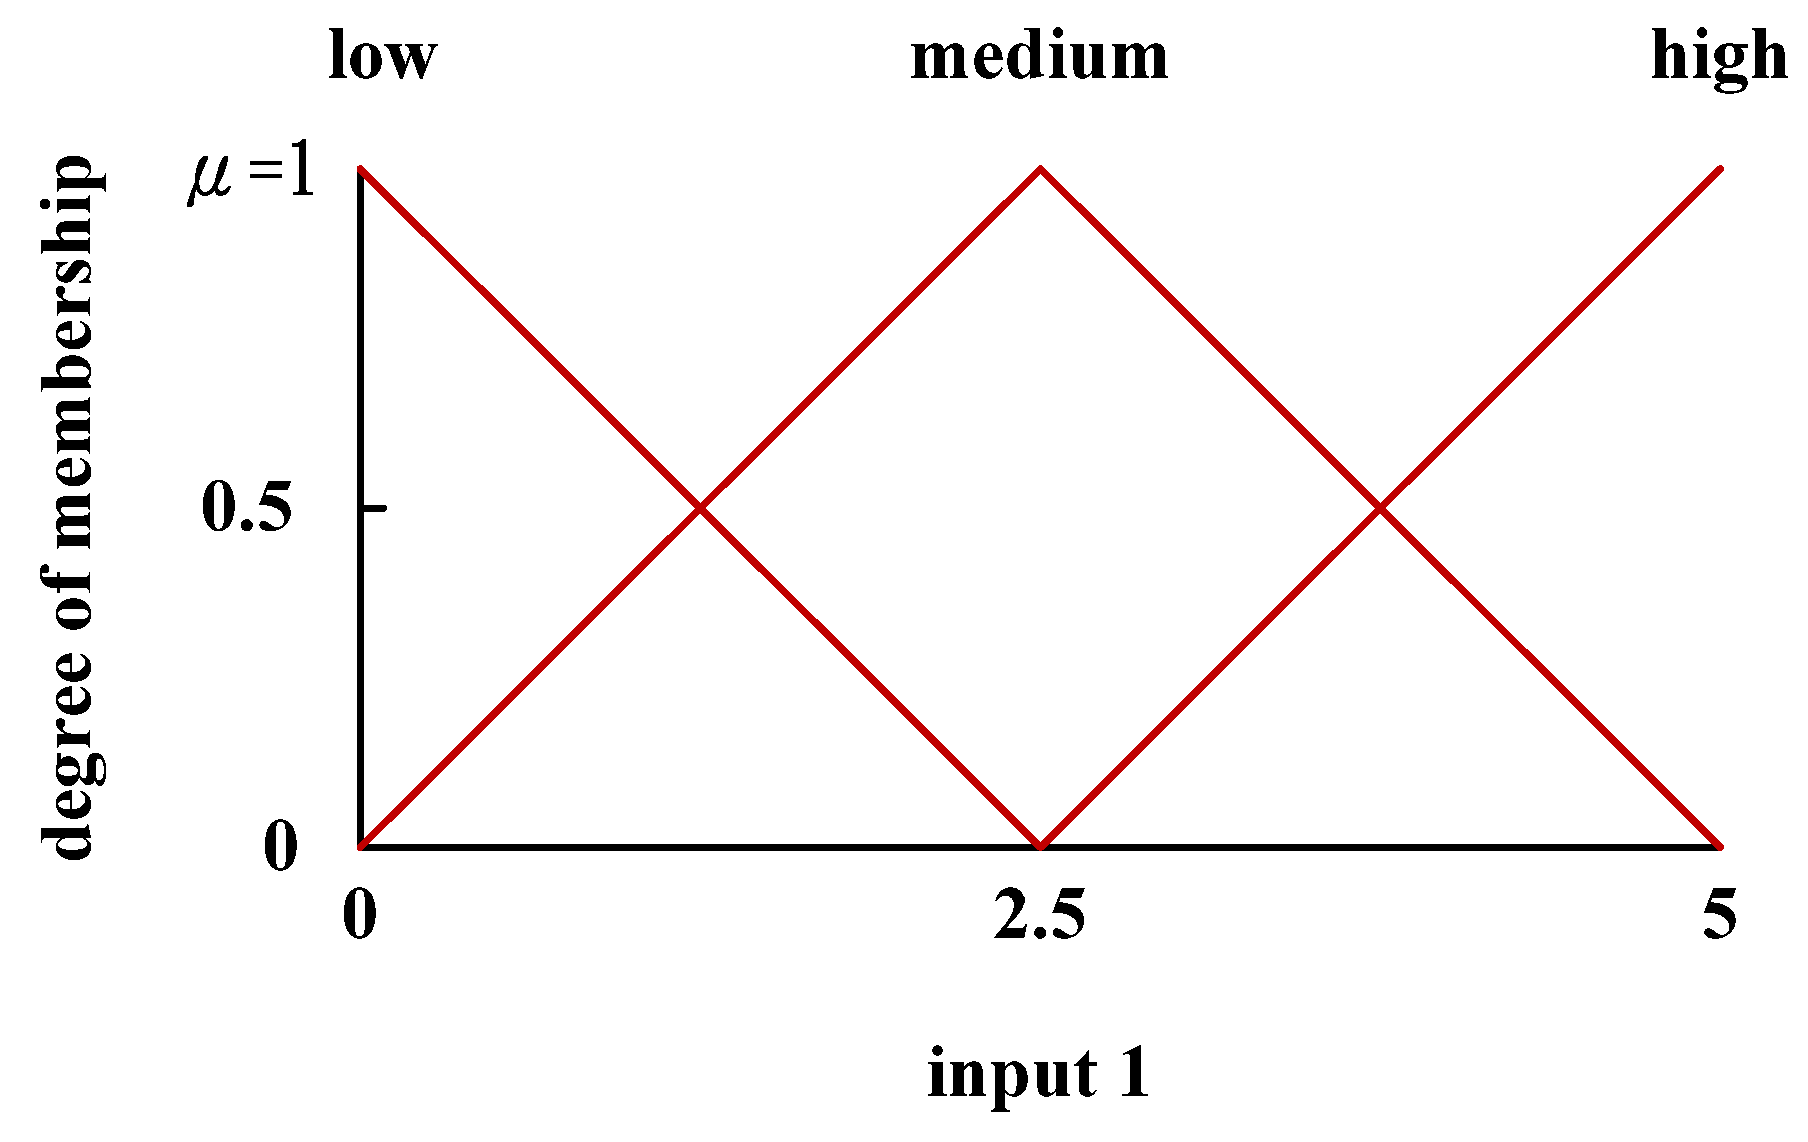
1. Input target (1): the degree of membership of cutting speed as the control factor (Figure 2).
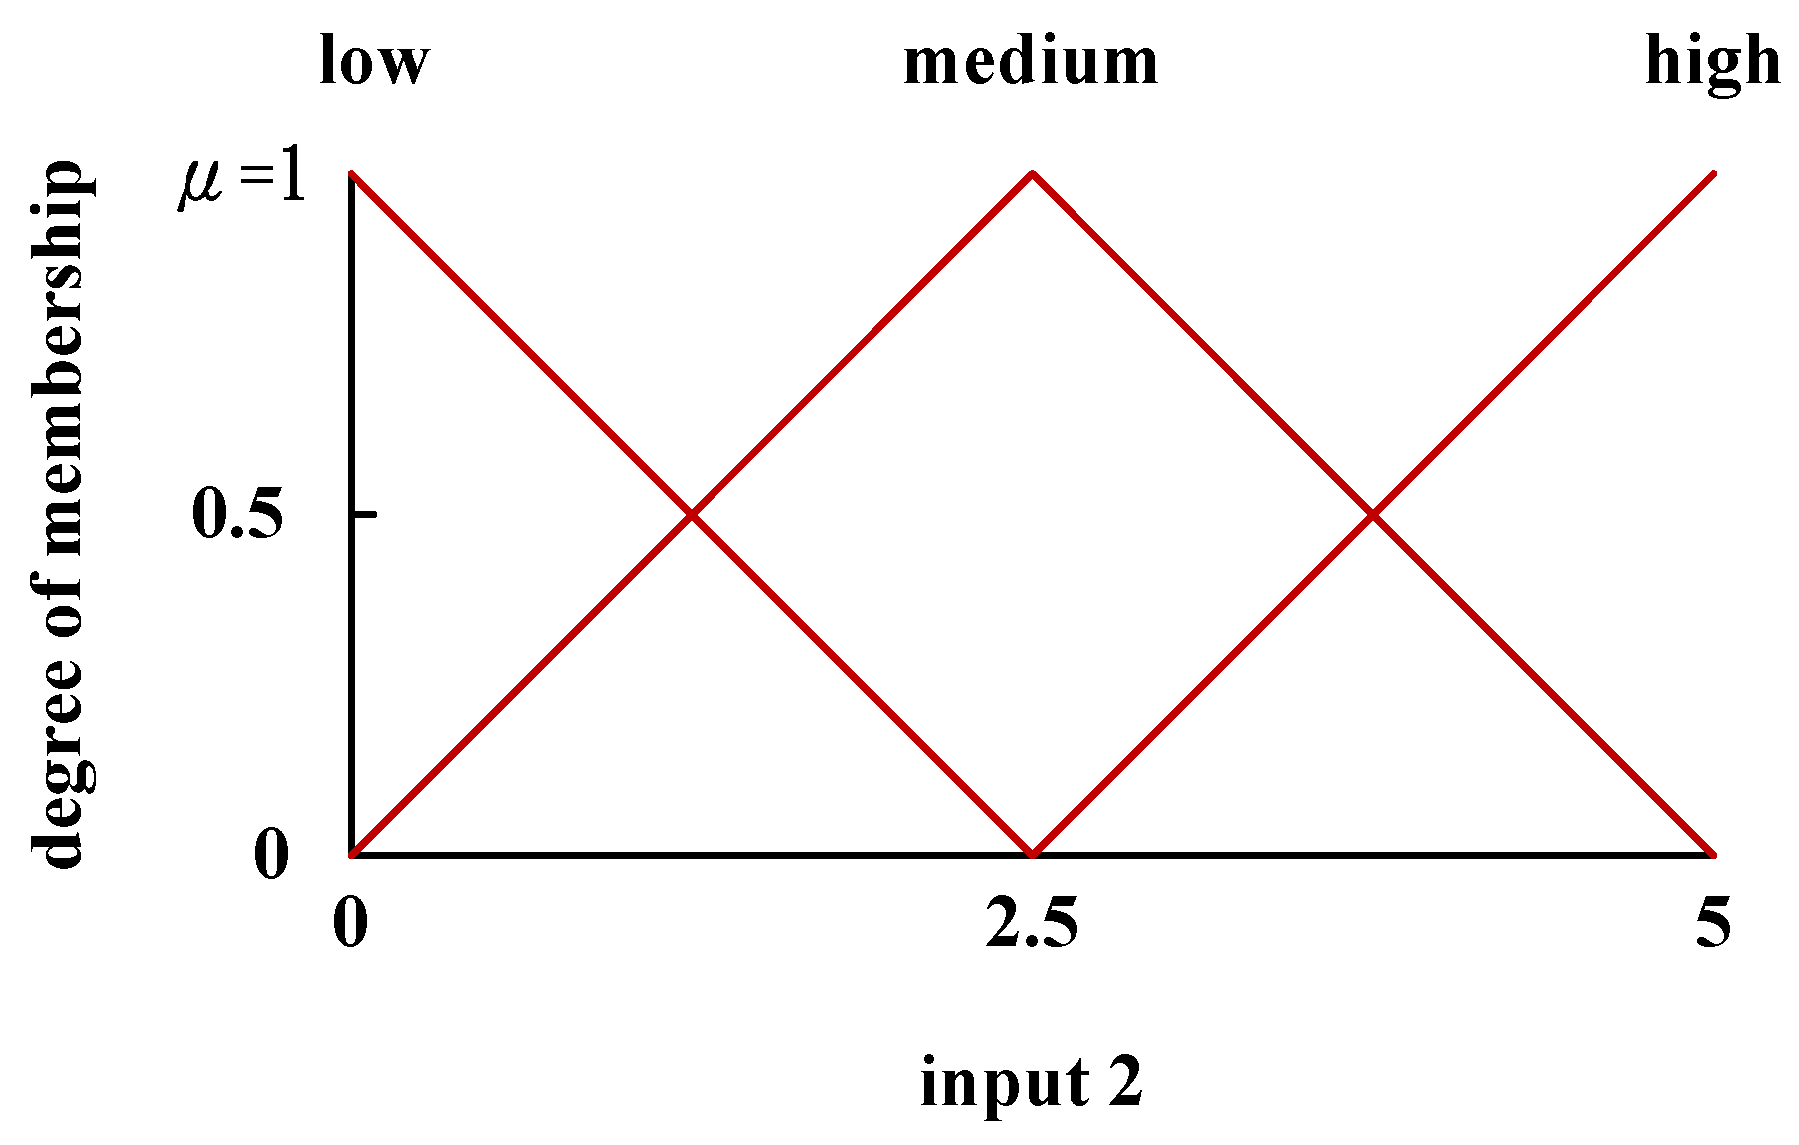
2. Input target (2): The degree of membership of cutting depth as the control factor (Figure 3).
3. Input target (3): The degree of membership of feed rate as the control factor (Figure 4).
4. Output target: membership functions of the output variable (Figure 5).
3.3. Combination of Rules and Fuzzy Operation
According to the three levels (low, medium, and high) defined in the Taguchi method, the membership functions corresponded to the highest point in each fuzzy region. The membership function of the input was determined using the intersection method. The expected average values of each fuzzy region are shown as follows.
- When the fuzzy region denotes “minimal” tool wear
- When the fuzzy region denotes “small” tool wear
- When the fuzzy region denotes “moderate” tool wear
- When the fuzzy region denotes “large” tool wear
- When the fuzzy region denotes “greatest” tool wear
The results are configured by the Taguchi method to establish the orthogonal array as shown in Table 5.
4. Experimental Verification
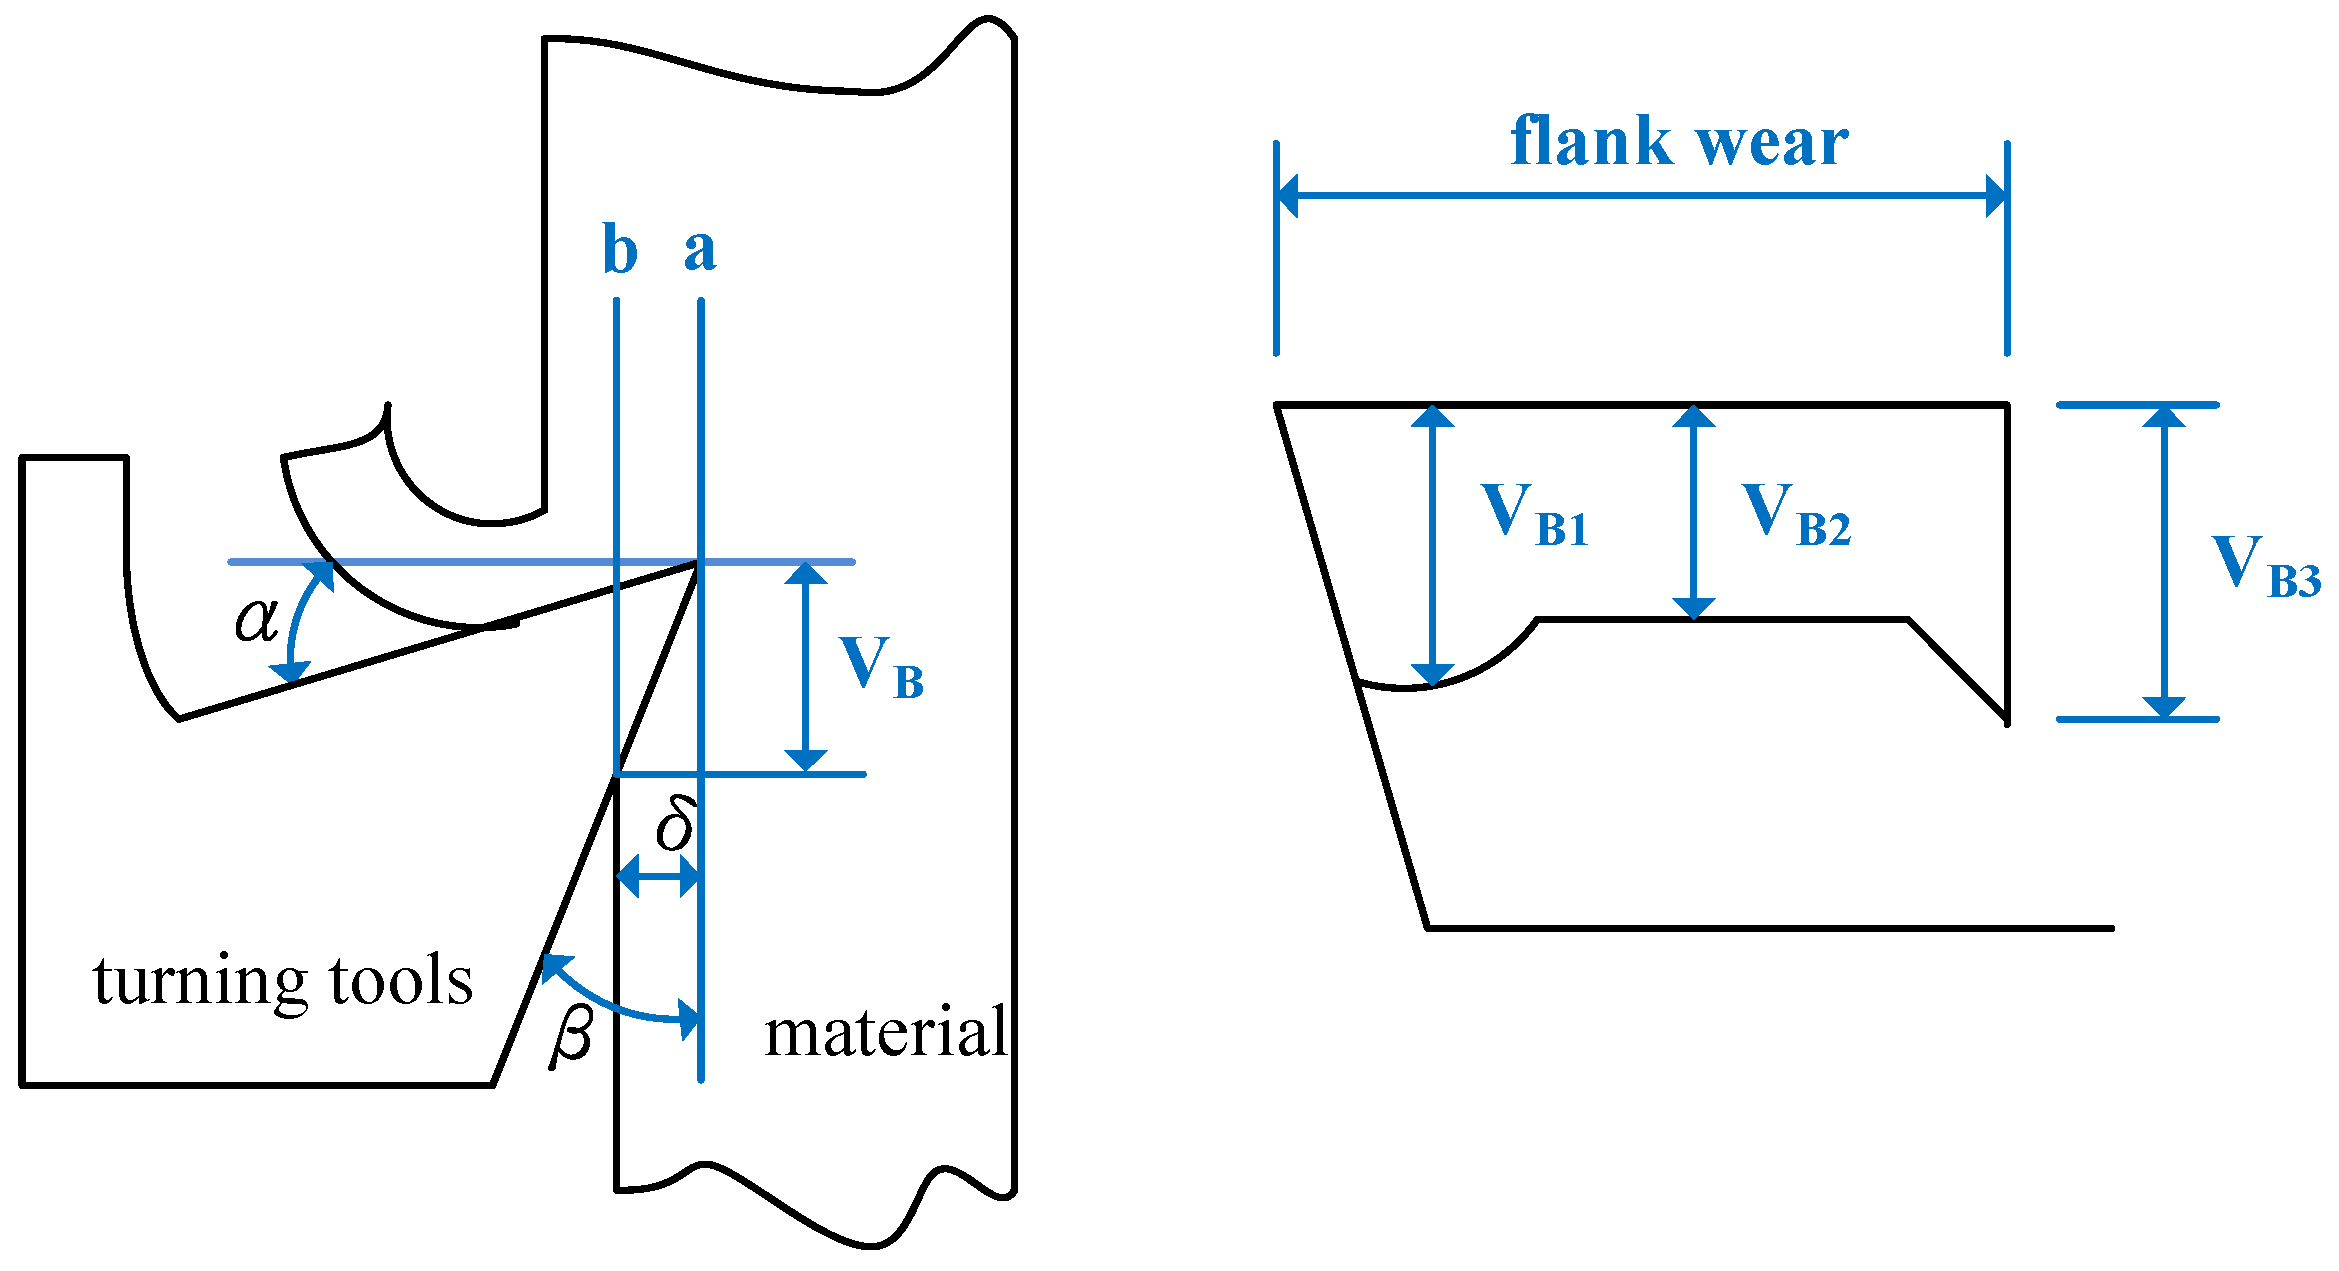
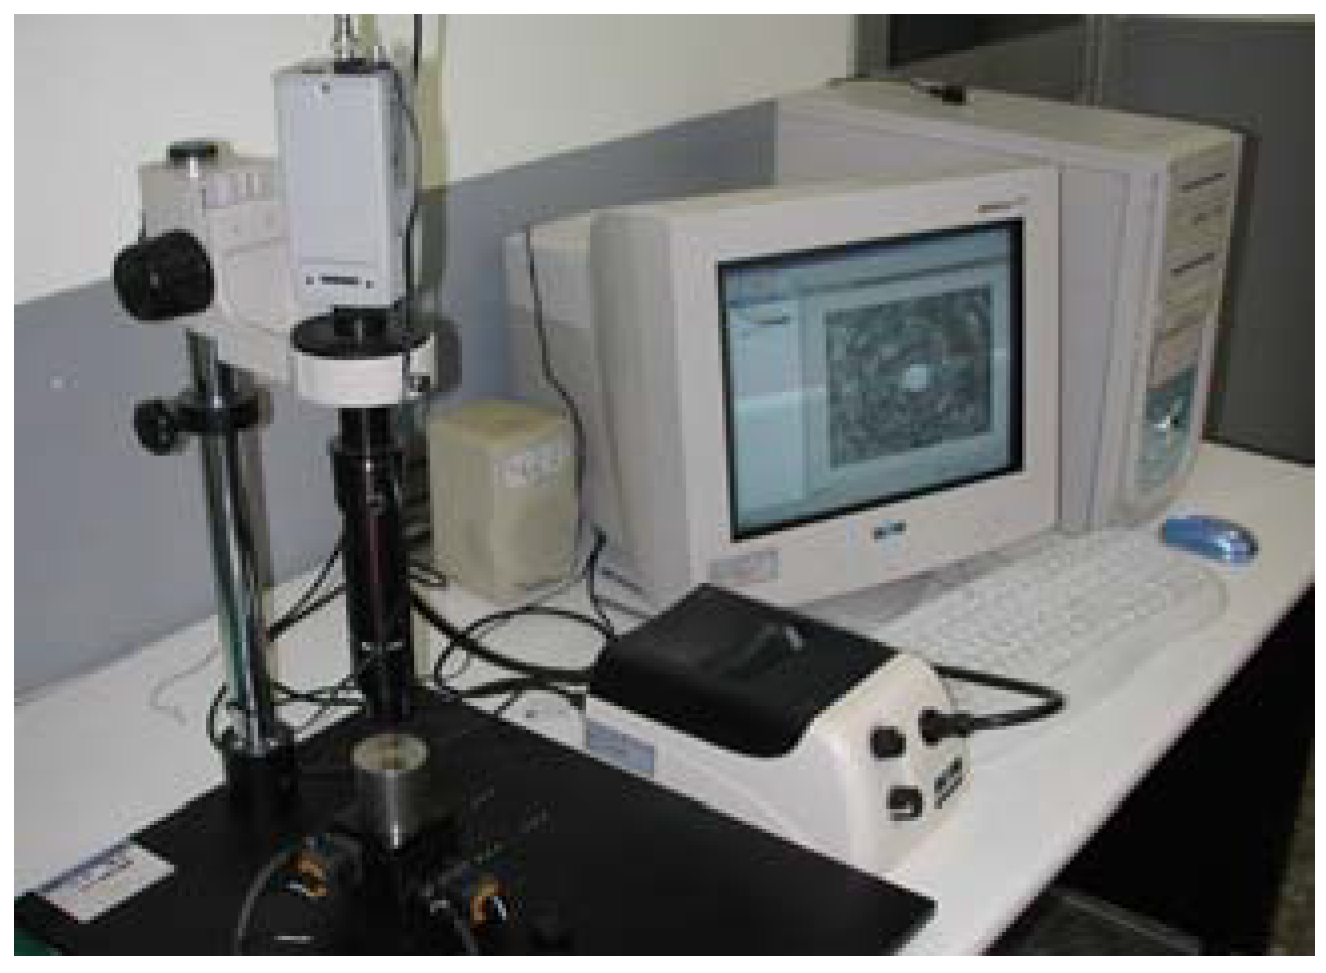
Whether parameters are optimal cannot be verified using semantic rules alone; thus, the orthogonal array of the Taguchi Method (Table 6) was employed to design a procedure for reducing the number of experiments required to identify the desired parameter combination. A PC-Base CNC lathe (ECOCA PC-3807, ECOCA, Taipei, R.O.C., Taiwan) was used to cut S45C mild carbon steel (specifications = 45 mm × 250 mm; clamping length = 100 mm). The Mitsubishi NX2525 tool (Mitsubishi, Ibaraki, Japan) insert and Toshiba tool holder (Mitsubishi, Tokyo, Japan) were selected for diameter turning of the steel specimen. The reference width of the flank wear VB2 (mm) (Figure 7) was automatically measured using a digital microscope, as shown in Figure 8 (SONY color video camera mold, SONY, Tokyo, Japan) under grayscale. The tool wear was defined as flank wear divided by the total volume removed by the cutting edge, tool wear ratio (µm−2). The flank wear is usually measured at different points. VB1 is the tool wear point for rough turning and VB2 is the tool wear point for finish turning. Because the precision machining in this study is finish turning, the VB2 is then measured for tool wear in verifying the accuracy of the semantic quantification. The machining parameters are listed in Table 7.
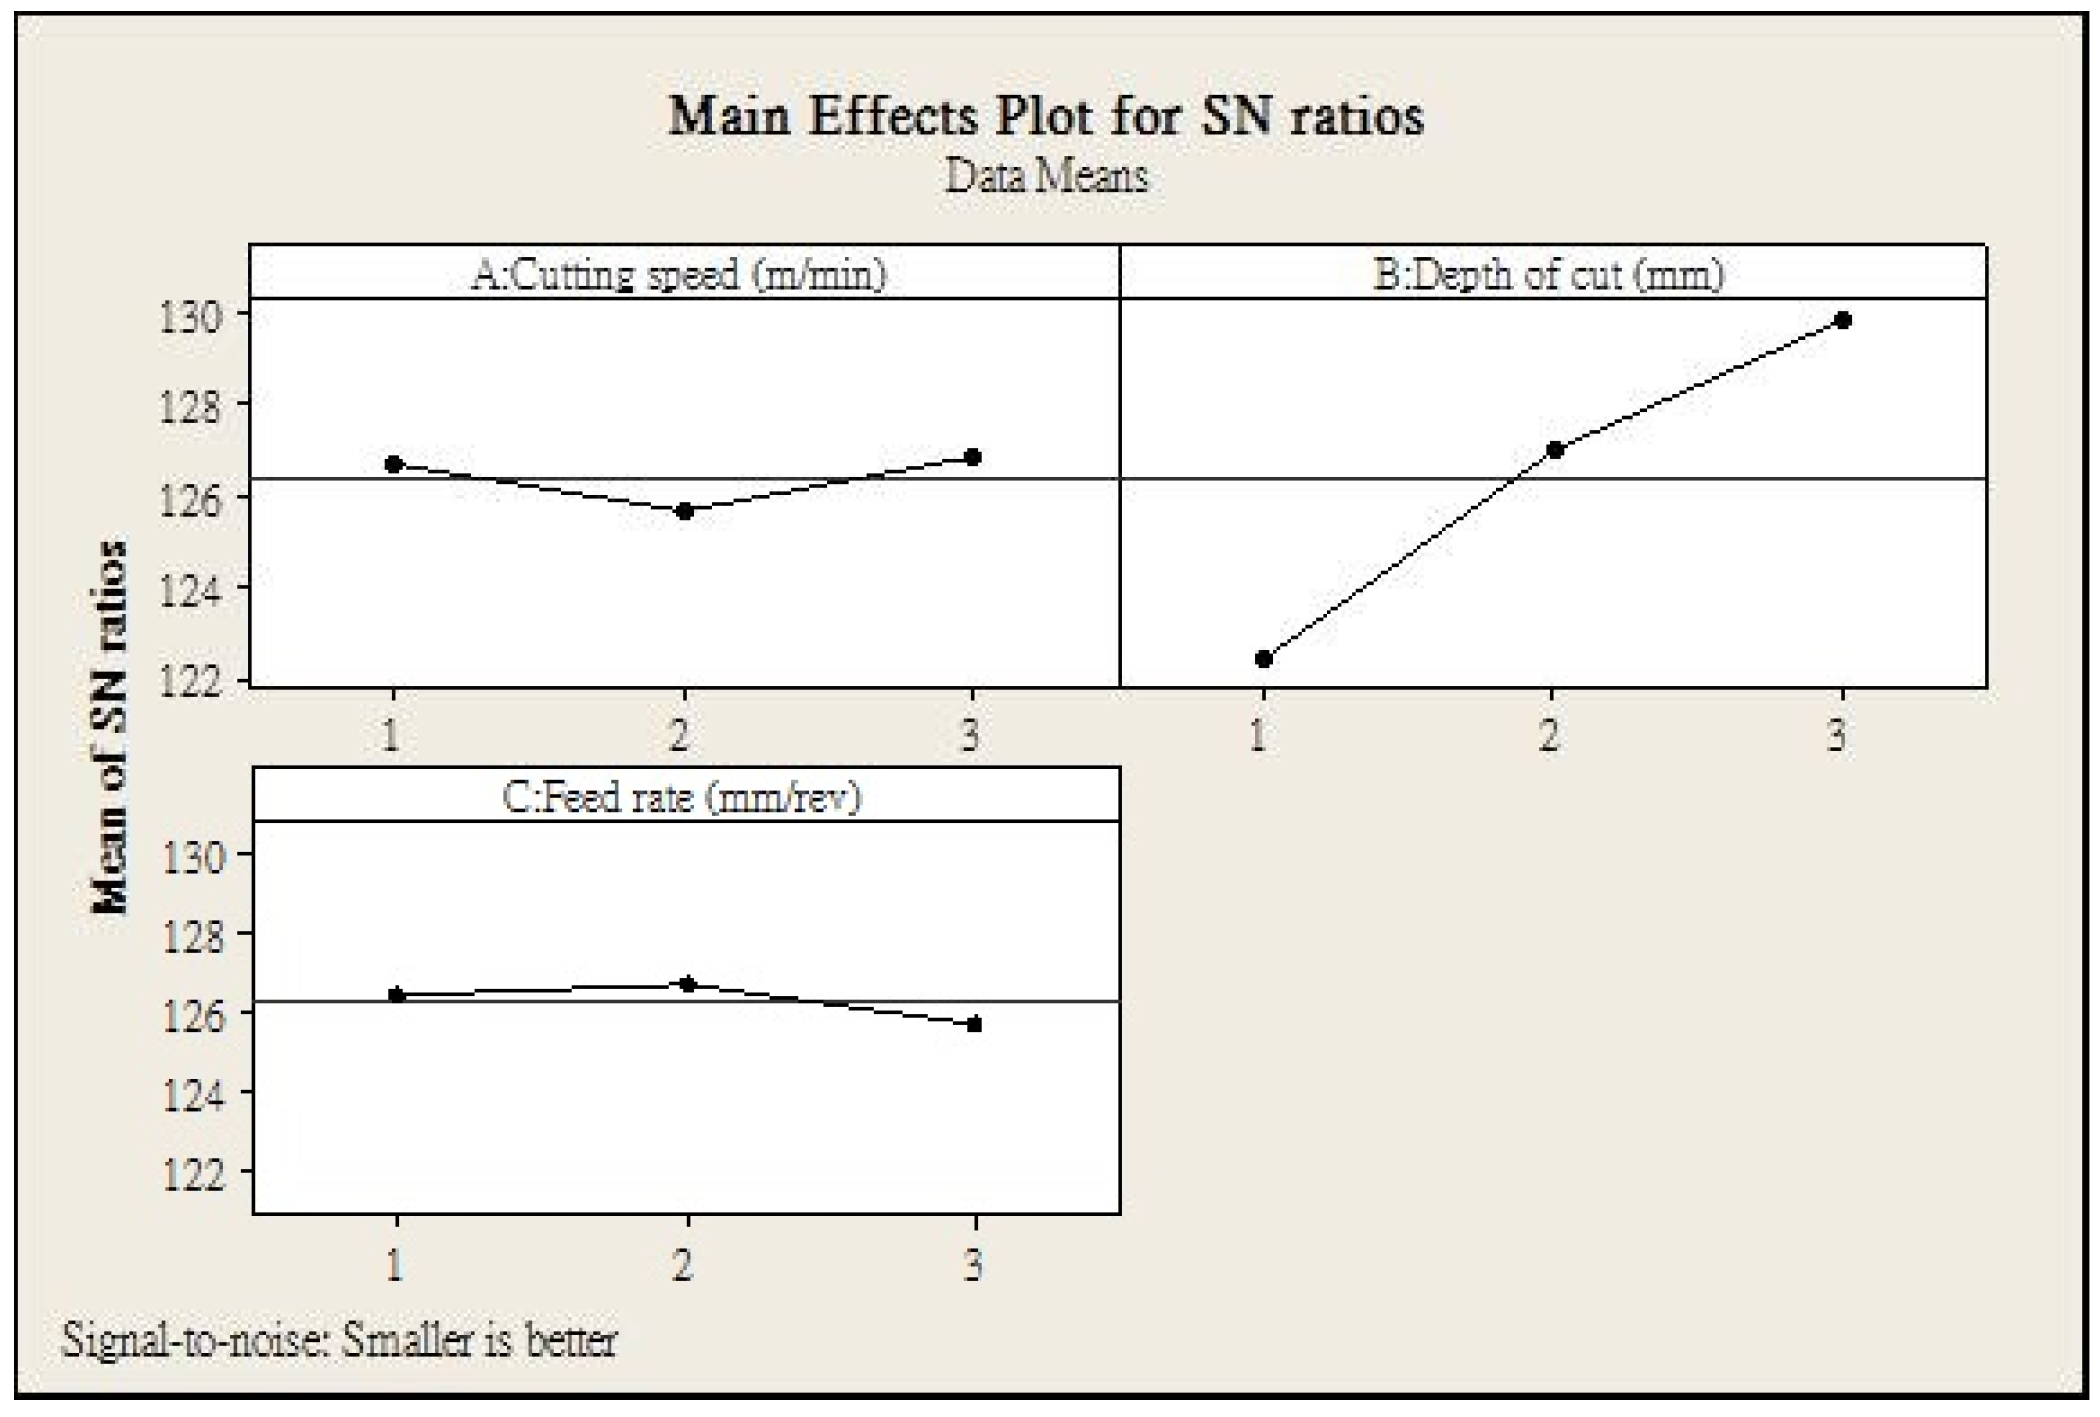
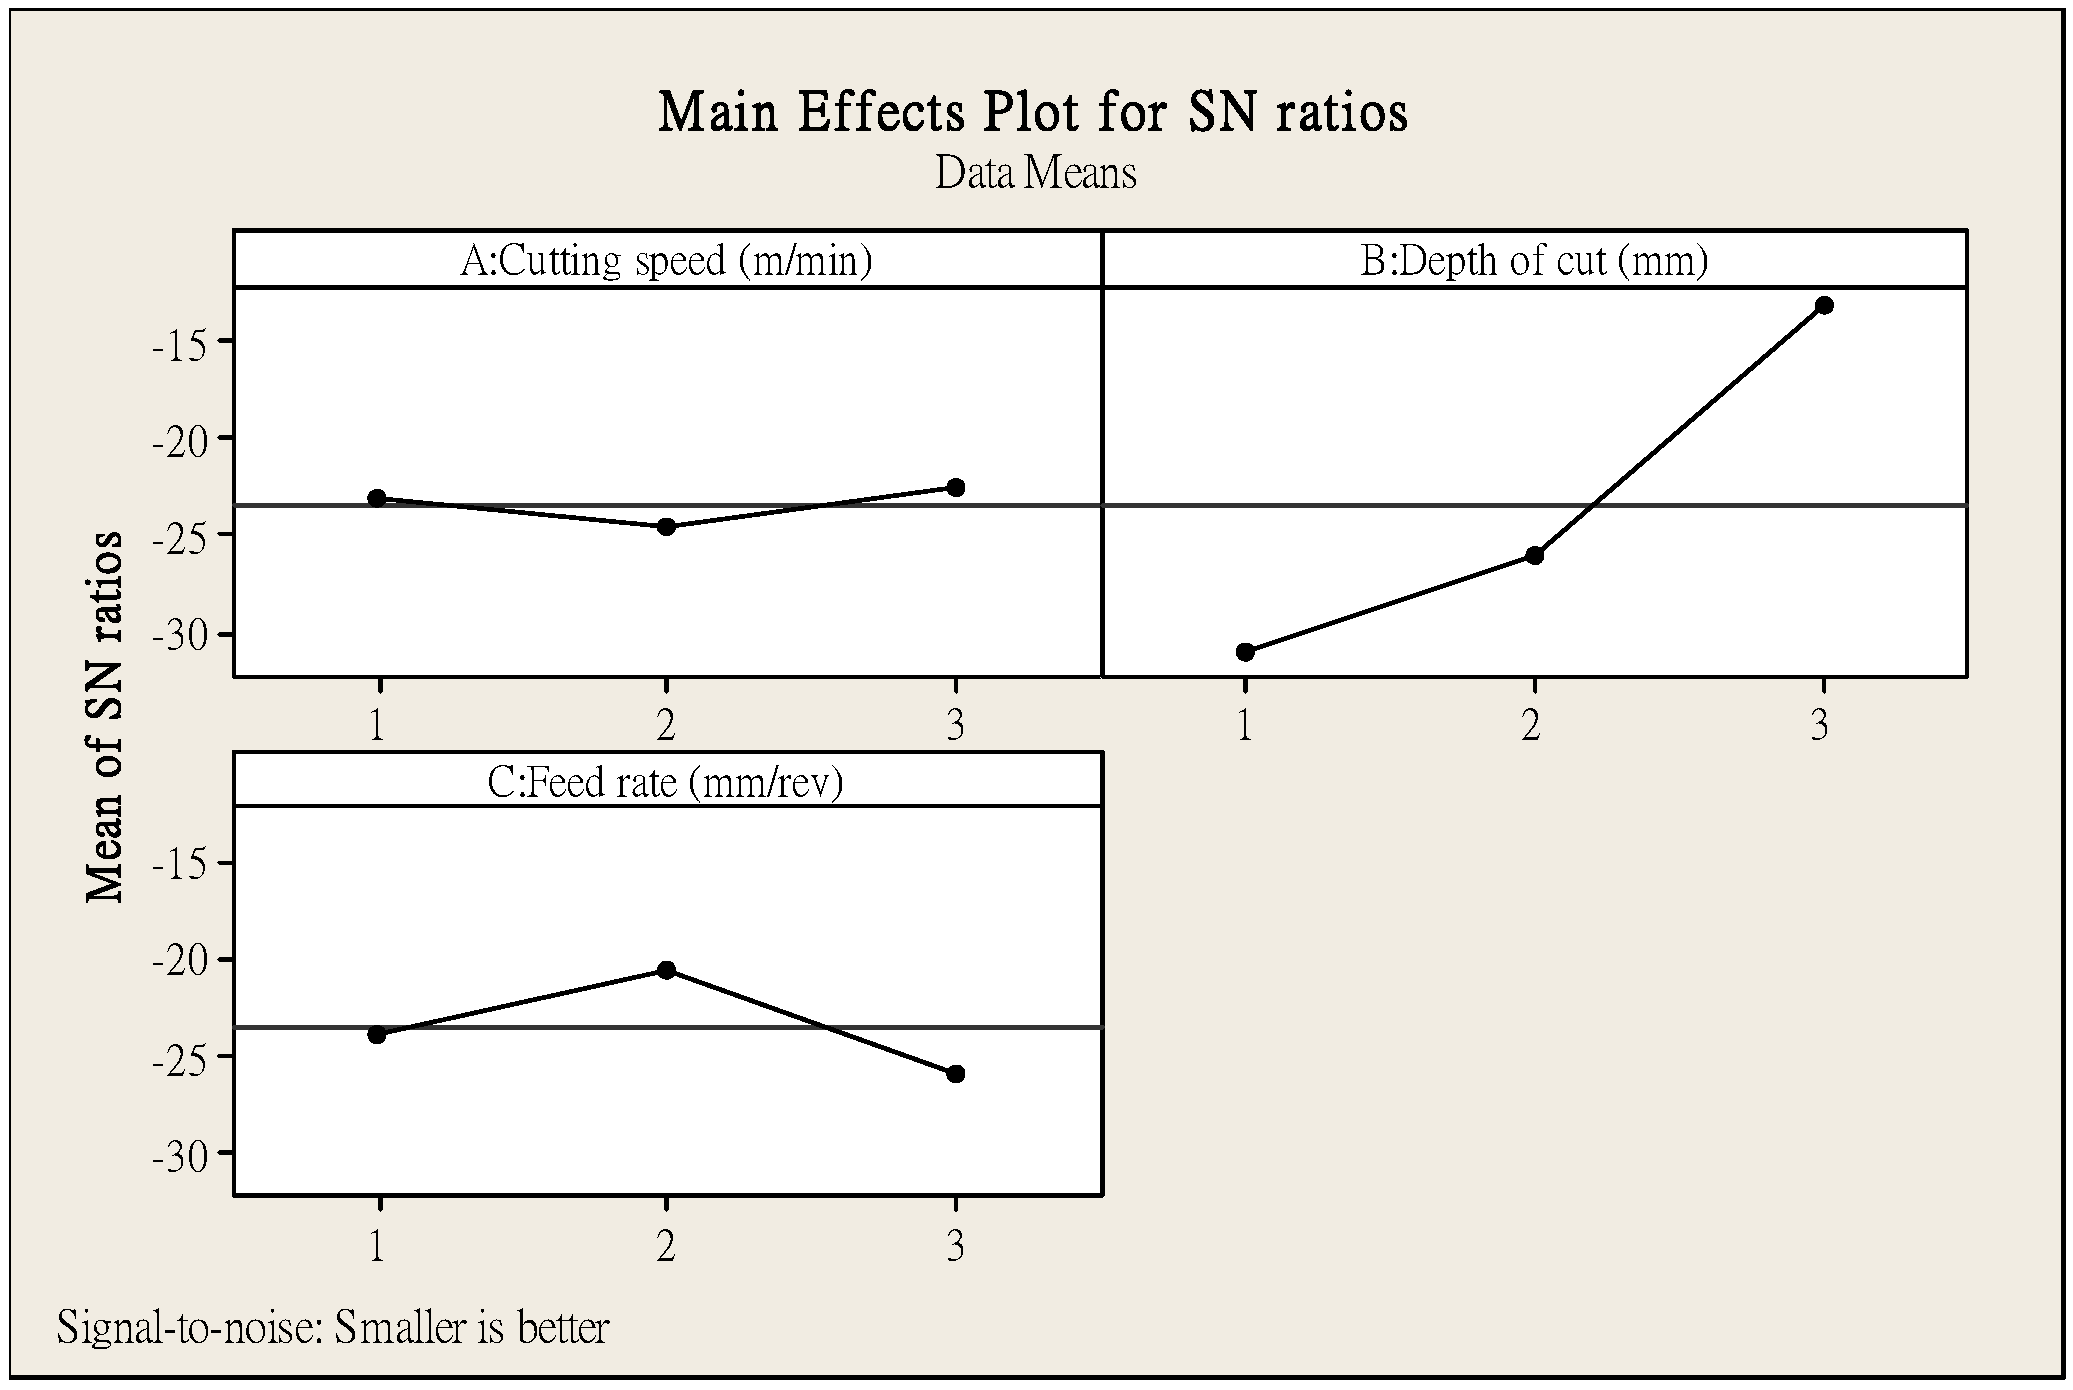
The main effects plot of the SNR was drawn using Minitab 15 (Figure 9). The slope in the plots represents the effects of the specified condition on the control factor. The combination of maximum values in each plot indicates the optimal cutting parameters. In this case, the optimal combination of cutting parameters is A3 B3 C2.
The optimal combination of the cutting parameters (A3 B3 C2) derived by the proposed Fuzzy Taguchi method was the same as that determined from experimental verification. This indicates that designing experiments using the fuzzy Taguchi method not only saves cutting cost but also provides reliable and accurate optimal production parameters. Thus, the method proposed in this study is surely meaningful and applicable for the industry.
5. Conclusions
For CNC precision turning, the cutting parameters (tool geometry and size, cutting speed, depth of cut, and feed rate) should be evaluated to meet the requirements of machining quality, accuracy, production time, and production cost. In this study, the tool wear is considered as machining quality and, speed, feed rate, and cutting depth are considered as control parameters. Based on the above, the tool wear is considered as the machining quality in this study. The cutting speed, depth, and federate are considered as control factors.
Through the fuzzy semantic quantification proposed in this study, a set of predicted models were obtained for selecting cutting parameters. The Taguchi method was then employed to determine the optimal combination of control factor levels. It is found that the optimal combination of the cutting parameters derived by the Fuzzy Taguchi method proposed in this study is the same as that determined from experimental verification. The semantic quantification is found to be a worthwhile technique. The results of this study definitely provide a set of prospective and applicable optimization methods for technicians to enhance the overall productivity in the precision machinery industry.
Author Contributions
Conceptualization, T.-S.L.; Methodology, T.-S.L.; Software, Y.-M.C.; Validation, K.-C.C. and Y.-M.C.; Formal Analysis, T.-S.L.; Investigation, K.-C.C.; Writing-Original Draft Preparation, K.-C.C. and T.-S.L.; Writing-Review & Editing, K.-C.C.; Project Administration, T.-S.L.
Funding
This research received no external funding.
Acknowledgments
The authors would like to thank for the comments from many reviewers to improve this work.
Conflicts of Interest
The authors declare no conflicts of interest.
References
- Jahanbakhsh, M.; Akhavan Farid, A.; Lotfi, M. Optimal flank wear in turning of Inconel 625 super-alloy using ceramic tool. Proc. Inst. Mech. Eng. Part B J. Eng. Manuf. 2018, 232, 208–216. [Google Scholar] [CrossRef]
- Mikołajczyk, T.; Nowicki, K.; Bustillo, A.; Pimenov, D.Y. Predicting tool life in turning operations using neural networks and image processing. J. Mech. Syst. Signal Process. 2018, 104, 503–513. [Google Scholar] [CrossRef]
- Pathan, L.K.; Bhivsane, S.V. Experimental Analysis and Investigation of Machining Parameters in Finish Hard Turning of AISI 4340 Steel. J. Procedia Manuf. 2018, 20, 265–270. [Google Scholar]
- Hossein, K.A.E.; Kops, N. Investigation on the use of cutting temperature and tool wear in the turning of mild steel bars. J. Mech. Eng. Sci. 2017, 11, 3038–3045. [Google Scholar] [CrossRef]
- Ramesh, S.; Viswanathan, R.; Ambika, S. Measurement and optimization of surface roughness and tool wear via grey relational analysis, TOPSIS and RSA techniques. J. Meas. 2016, 78, 63–72. [Google Scholar] [CrossRef]
- Abhang, L.B.; Hameedullah, M. Modeling and Analysis of Tool Wear Based on Cutting Force and Chip-Tool Interface Temperatures in Turning. In Advanced Manufacturing and Materials Science; Springer: Cham, Switzerland, 2018; pp. 411–420. [Google Scholar]
- Huang, T.C. Multi-Objective Optimization of CNC Turning Parameters Using Grey Relational Analysis and Taguchi’s Method. Master’s Thesis, Tatung University, Taipei, Taiwan, 2007. [Google Scholar]
- Zadeh, L.A. Information and Control. Fuzzy Sets 1965, 8, 338–353. [Google Scholar]
- Weng, Y.Z. Multi-Objective Optimization of CNC Turning Parameters Using Fuzzy Analysis. Master’s Thesis, Tatung University, Taipei, Taiwan, 2007. [Google Scholar]
- Chiu, T.Y. Micro-environment Control by Using Fuzzy Theory. Master’s Thesis, National Chung Hsing University, Taipei, Taiwan, 2015. [Google Scholar]
- Moshat, S.; Datta, S.; Bandyopadhyay, A.; Pal, P. Optimization of CNC end milling process parameters using PCA-based Taguchi method. J. Eng. Sci. Technol. 2010, 2, 92–102. [Google Scholar] [CrossRef]
- Ribeiro, J.; Lopes, H.; Queijo, L.; Figueiredo, D. Optimization of Cutting Parameters to Minimize the Surface Roughness in the End Milling Process Using the Taguchi Method. Period. Polytech. Mech. Eng. 2017, 61, 30–35. [Google Scholar] [CrossRef] [Green Version]
Figure 1.
Fuzzy logic control architecture.
Figure 2.
Degree of membership of the cutting speed.
Figure 3.
Degree of membership of the cutting depth.
Figure 4.
Degree of membership of the feed rate.
Figure 5.
Degree of membership of output variable.
Figure 6.
Main effects plot of the SNR (smaller-the-better).
Figure 7.
Measurement of tool frank wear.
Figure 8.
Digital microscope (SONY color video camera).
Figure 9.
Main effects plot of the SNR (smaller-the-better).

Table 1.
Input membership values of cutting speed.
| Fuzzy Term | 0 | 1.25 | 2.5 | 3.75 | 5 |
|---|---|---|---|---|---|
| low | 1 | 0.5 | 0 | 0 | 0 |
| medium | 0 | 0.5 | 1 | 0.5 | 0 |
| high | 0 | 0 | 0 | 0.5 | 1 |
Table 2.
Input membership values of cutting depth.
| Fuzzy Term | 0 | 1.25 | 2.5 | 3.75 | 5 |
|---|---|---|---|---|---|
| low | 1 | 0.5 | 0 | 0 | 0 |
| medium | 0 | 0.5 | 1 | 0.5 | 0 |
| high | 0 | 0 | 0 | 0.5 | 1 |
Table 3.
Input membership values of feed rate.
| Fuzzy Term | 0 | 1.25 | 2.5 | 3.75 | 5 |
|---|---|---|---|---|---|
| low | 1 | 0.5 | 0 | 0 | 0 |
| medium | 0 | 0.5 | 1 | 0.5 | 0 |
| high | 0 | 0 | 0 | 0.5 | 1 |
Table 4.
Output membership values.
| No. | Minimal | Small | Moderate | Large | Greatest |
|---|---|---|---|---|---|
| 0 | 1 | 0 | 0 | 0 | 0 |
| 1 | 0.84 | 0 | 0 | 0 | 0 |
| 2 | 0.68 | 0 | 0 | 0 | 0 |
| 3 | 0.52 | 0 | 0 | 0 | 0 |
| 4 | 0.36 | 0 | 0 | 0 | 0 |
| 5 | 0.2 | 0.04 | 0 | 0 | 0 |
| 6 | 0.04 | 0.2 | 0 | 0 | 0 |
| 7 | 0 | 0.36 | 0 | 0 | 0 |
| 8 | 0 | 0.52 | 0 | 0 | 0 |
| 9 | 0 | 0.84 | 0 | 0 | 0 |
| 10 | 0 | 1 | 0 | 0 | 0 |
| 11 | 0 | 0.68 | 0 | 0 | 0 |
| 12 | 0 | 0.52 | 0 | 0 | 0 |
| 13 | 0 | 0.36 | 0 | 0 | 0 |
| 14 | 0 | 0.2 | 0.04 | 0 | 0 |
| 15 | 0 | 0.04 | 0.2 | 0 | 0 |
| 16 | 0 | 0 | 0.36 | 0 | 0 |
| 17 | 0 | 0 | 0.52 | 0 | 0 |
| 18 | 0 | 0 | 0.68 | 0 | 0 |
| 19 | 0 | 0 | 0.84 | 0 | 0 |
| 20 | 0 | 0 | 1 | 0 | 0 |
| 21 | 0 | 0 | 0.84 | 0 | 0 |
| 22 | 0 | 0 | 0.68 | 0 | 0 |
| 23 | 0 | 0 | 0.52 | 0 | 0 |
| 24 | 0 | 0 | 0.36 | 0 | 0 |
| 25 | 0 | 0 | 0.2 | 0 | 0 |
| 26 | 0 | 0 | 0.04 | 0.04 | 0 |
| 27 | 0 | 0 | 0 | 0.2 | 0 |
| 28 | 0 | 0 | 0 | 0.36 | 0 |
| 29 | 0 | 0 | 0 | 0.52 | 0 |
| 30 | 0 | 0 | 0 | 0.68 | 0 |
| 31 | 0 | 0 | 0 | 0.84 | 0 |
| 32 | 0 | 0 | 0 | 1 | 0 |
| 33 | 0 | 0 | 0 | 0.84 | 0 |
| 34 | 0 | 0 | 0 | 0.68 | 0.04 |
| 35 | 0 | 0 | 0 | 0.52 | 0.2 |
| 36 | 0 | 0 | 0 | 0.36 | 0.36 |
| 37 | 0 | 0 | 0 | 0.2 | 0.52 |
| 38 | 0 | 0 | 0 | 0.04 | 0.68 |
| 39 | 0 | 0 | 0 | 0 | 0.84 |
| 40 | 0 | 0 | 0 | 0 | 1 |
Table 5.
Fuzzy orthogonal array.
| EXP | Cutting Speed (m/min) | Depth of Cut (mm) | Feed Rate (mm/rev) | Target Fuzzy Ranking Values |
|---|---|---|---|---|
| Tool Wear (mm−2) | ||||
| 1 | 1 | 1 | 1 | 32 |
| 2 | 1 | 1 | 2 | 38.23 |
| 3 | 1 | 1 | 3 | 32 |
| 4 | 1 | 2 | 1 | 20 |
| 5 | 1 | 2 | 2 | 32 |
| 6 | 1 | 2 | 3 | 32 |
| 7 | 1 | 3 | 1 | 1.769 |
| 8 | 1 | 3 | 2 | 1.769 |
| 9 | 1 | 3 | 3 | 9.966 |
| 10 | 2 | 1 | 1 | 38.23 |
| 11 | 2 | 1 | 2 | 38.23 |
| 12 | 2 | 1 | 3 | 38.23 |
| 13 | 2 | 2 | 1 | 20 |
| 14 | 2 | 2 | 2 | 20 |
| 15 | 2 | 2 | 3 | 32 |
| 16 | 2 | 3 | 1 | 9.966 |
| 17 | 2 | 3 | 2 | 1.769 |
| 18 | 2 | 3 | 3 | 9.966 |
| 19 | 3 | 1 | 1 | 32 |
| 20 | 3 | 1 | 2 | 38.23 |
| 21 | 3 | 1 | 3 | 38.23 |
| 22 | 3 | 2 | 1 | 20 |
| 23 | 3 | 2 | 2 | 9.966 |
| 24 | 3 | 2 | 3 | 9.966 |
| 25 | 3 | 3 | 1 | 9.966 |
| 26 | 3 | 3 | 2 | 1.769 |
| 27 | 3 | 3 | 3 | 9.966 |
Table 6.
Experiment orthogonal array.
| EXP | Cutting Speed (m/min) | Depth of Cut (mm) | Feed Rate (mm/rev) | Tool Wear (mm−2) |
|---|---|---|---|---|
| 1 | 1 | 1 | 1 | |
| 2 | 1 | 1 | 2 | |
| 3 | 1 | 1 | 3 | |
| 4 | 1 | 2 | 1 | |
| 5 | 1 | 2 | 2 | |
| 6 | 1 | 2 | 3 | |
| 7 | 1 | 3 | 1 | |
| 8 | 1 | 3 | 2 | |
| 9 | 1 | 3 | 3 | |
| 10 | 2 | 1 | 1 | |
| 11 | 2 | 1 | 2 | |
| 12 | 2 | 1 | 3 | |
| 13 | 2 | 2 | 1 | |
| 14 | 2 | 2 | 2 | |
| 15 | 2 | 2 | 3 | |
| 16 | 2 | 3 | 1 | |
| 17 | 2 | 3 | 2 | |
| 18 | 2 | 3 | 3 | |
| 19 | 3 | 1 | 1 | |
| 20 | 3 | 1 | 2 | |
| 21 | 3 | 1 | 3 | |
| 22 | 3 | 2 | 1 | |
| 23 | 3 | 2 | 2 | |
| 24 | 3 | 2 | 3 | |
| 25 | 3 | 3 | 1 | |
| 26 | 3 | 3 | 2 | |
| 27 | 3 | 3 | 3 |
Table 7.
Cutting parameters.
| Control Factor | Level 1 | Level 2 | Level 3 |
|---|---|---|---|
| A: Cutting speed (m/min) | 150 | 200 | 250 |
| B: Depth of cut (mm) | 0.5 | 1 | 1.5 |
| C: Feed rate (mm/rev) | 0.02 | 0.06 | 0.1 |
© 2018 by the authors. Licensee MDPI, Basel, Switzerland. This article is an open access article distributed under the terms and conditions of the Creative Commons Attribution (CC BY) license (http://creativecommons.org/licenses/by/4.0/).
Share and Cite
MDPI and ACS Style
Lan, T.-S.; Chuang, K.-C.; Chen, Y.-M. Optimization of Machining Parameters Using Fuzzy Taguchi Method for Reducing Tool Wear. Appl. Sci. 2018, 8, 1011. https://doi.org/10.3390/app8071011
AMA Style
Lan T-S, Chuang K-C, Chen Y-M. Optimization of Machining Parameters Using Fuzzy Taguchi Method for Reducing Tool Wear. Applied Sciences. 2018; 8(7):1011. https://doi.org/10.3390/app8071011
Chicago/Turabian StyleLan, Tian-Syung, Kai-Chi Chuang, and Yee-Ming Chen. 2018. "Optimization of Machining Parameters Using Fuzzy Taguchi Method for Reducing Tool Wear" Applied Sciences 8, no. 7: 1011. https://doi.org/10.3390/app8071011
Note that from the first issue of 2016, this journal uses article numbers instead of page numbers. See further details here.