A Versatile Velocity Map Ion-Electron Covariance Imaging Spectrometer for High-Intensity XUV Experiments

 ,
,  , , , , , ,
Abstract
:1. Introduction
2. Apparatus
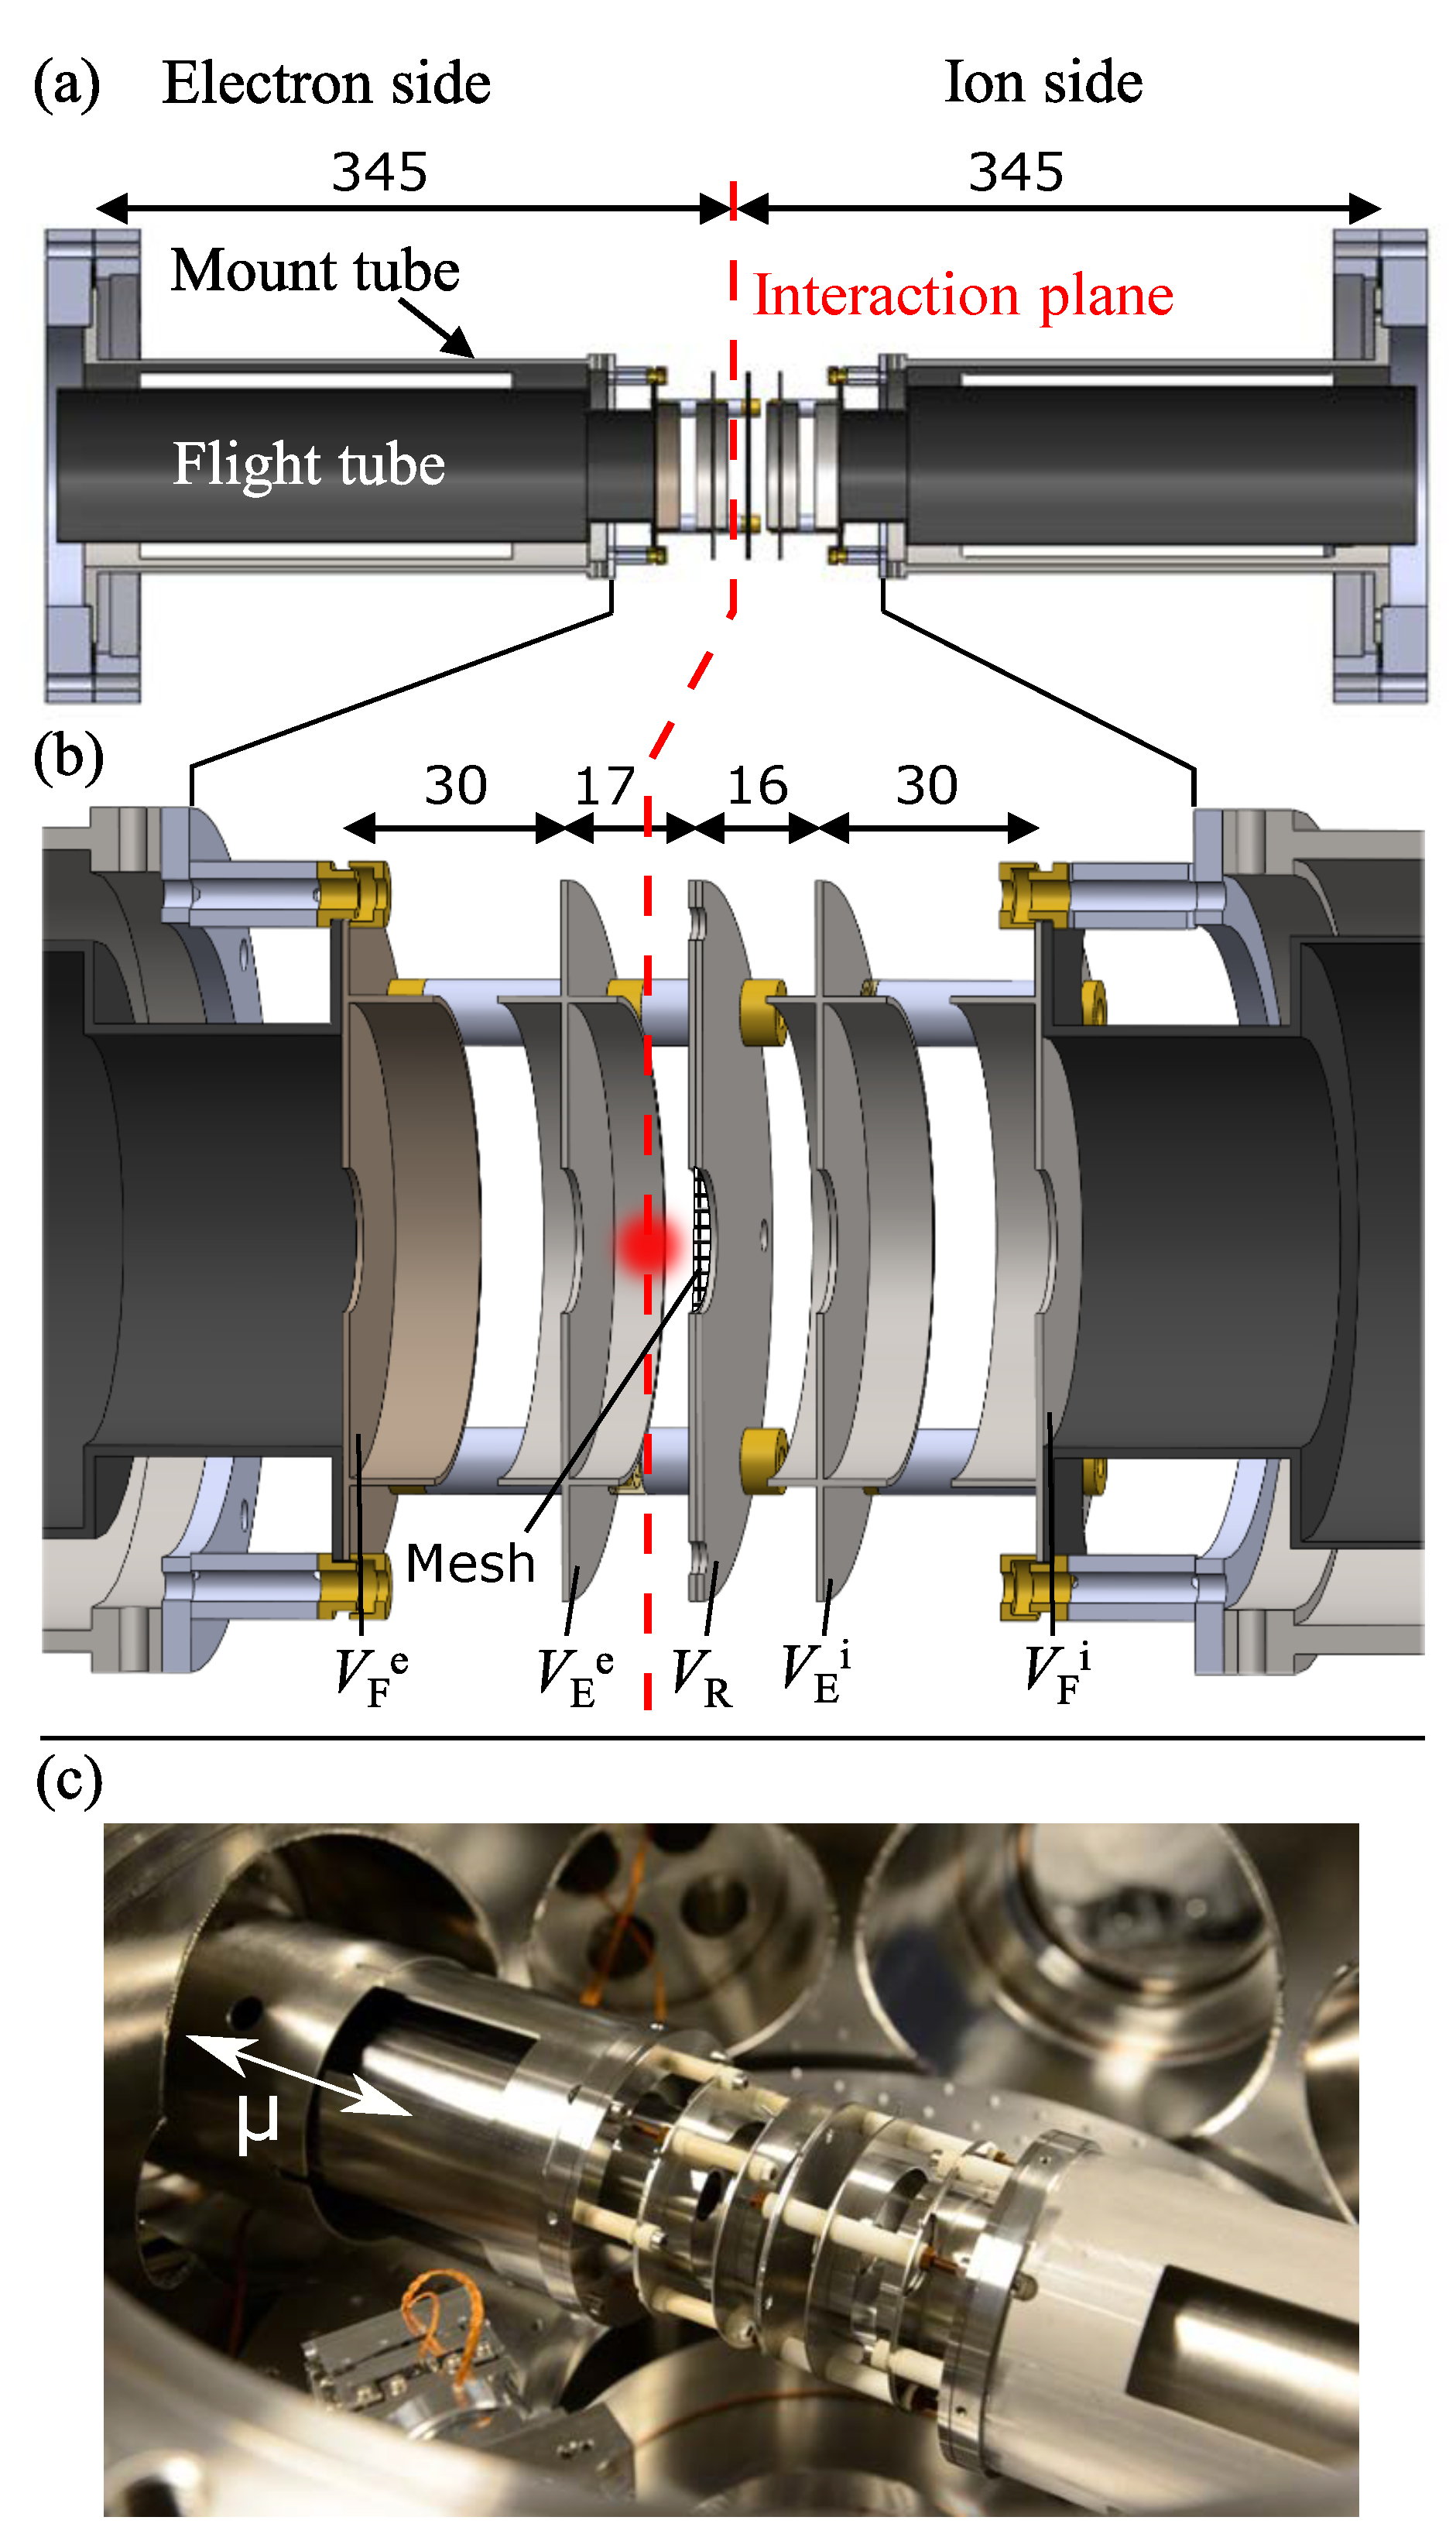
2.1. Design
2.2. Operation Modes
- (1)
- High resolution ion modes:
- (a)
- Ion TOF,
- (b)
- Ion VMI.
- (2)
- High resolution electron modes:
- (a)
- Electron VMI, ion TOF,
- (b)
- Electron VMI, ion VMI.
2.3. Simulations
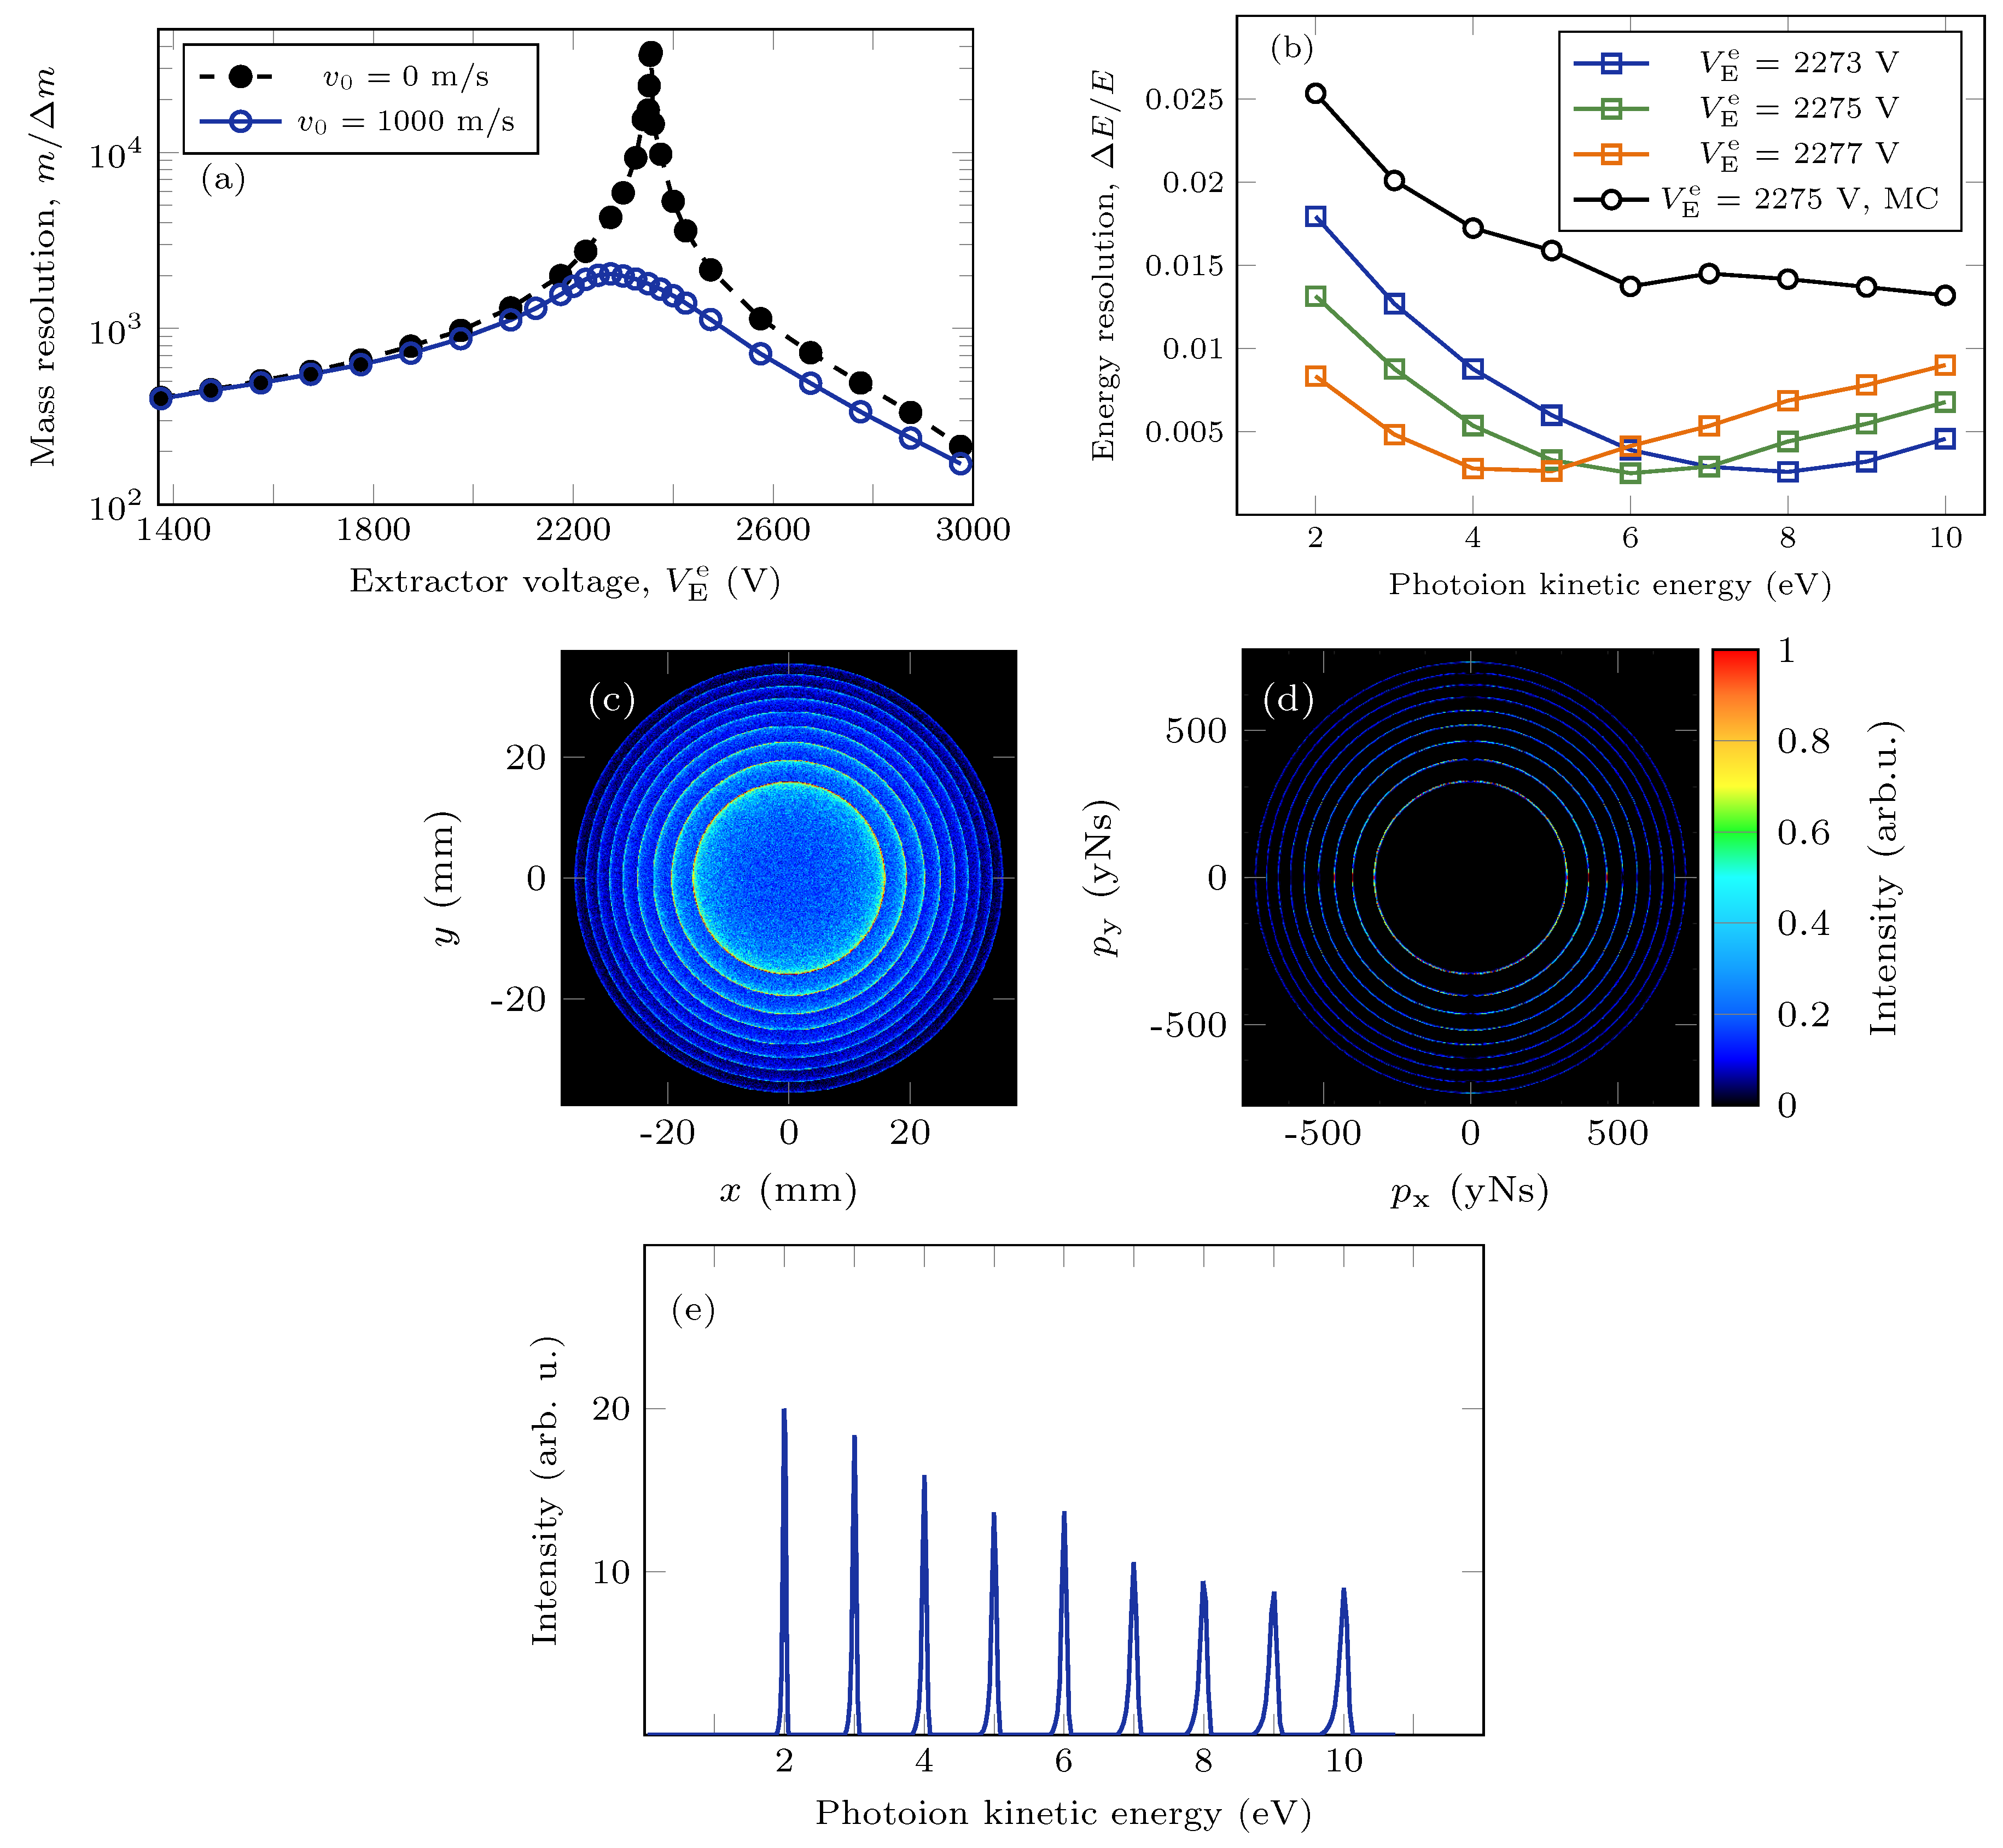
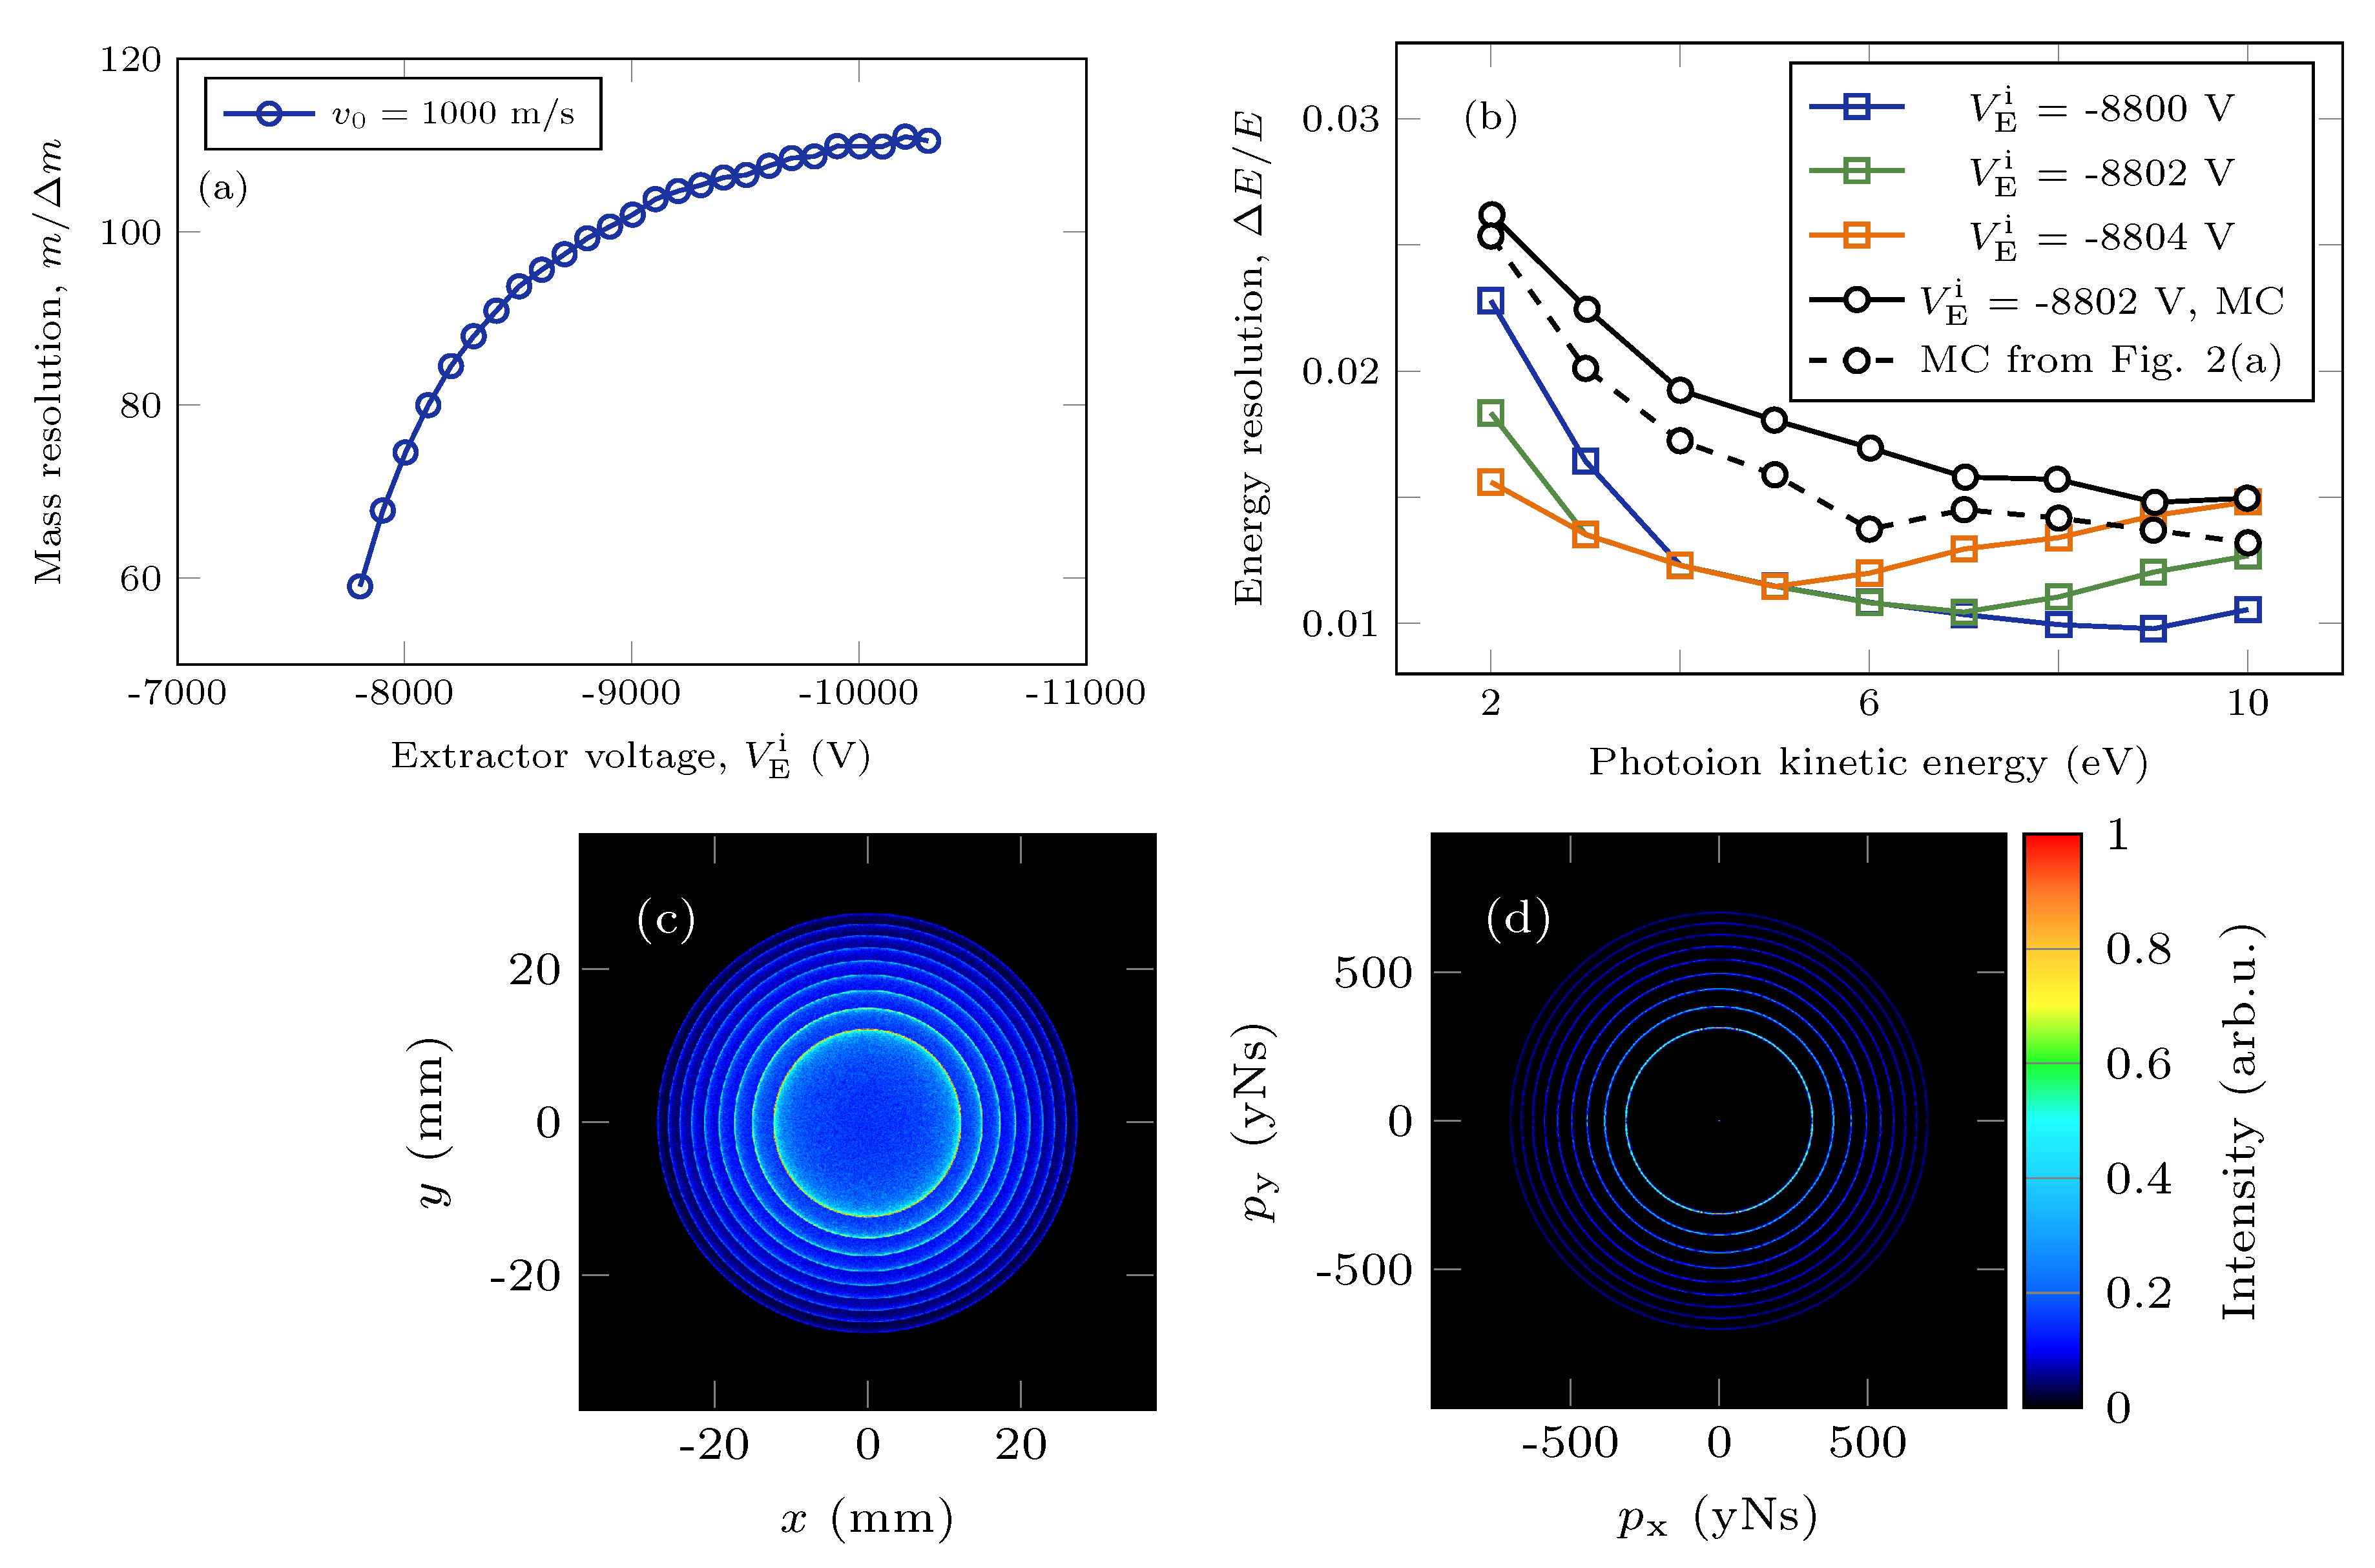
2.3.1. High Resolution Ion Modes
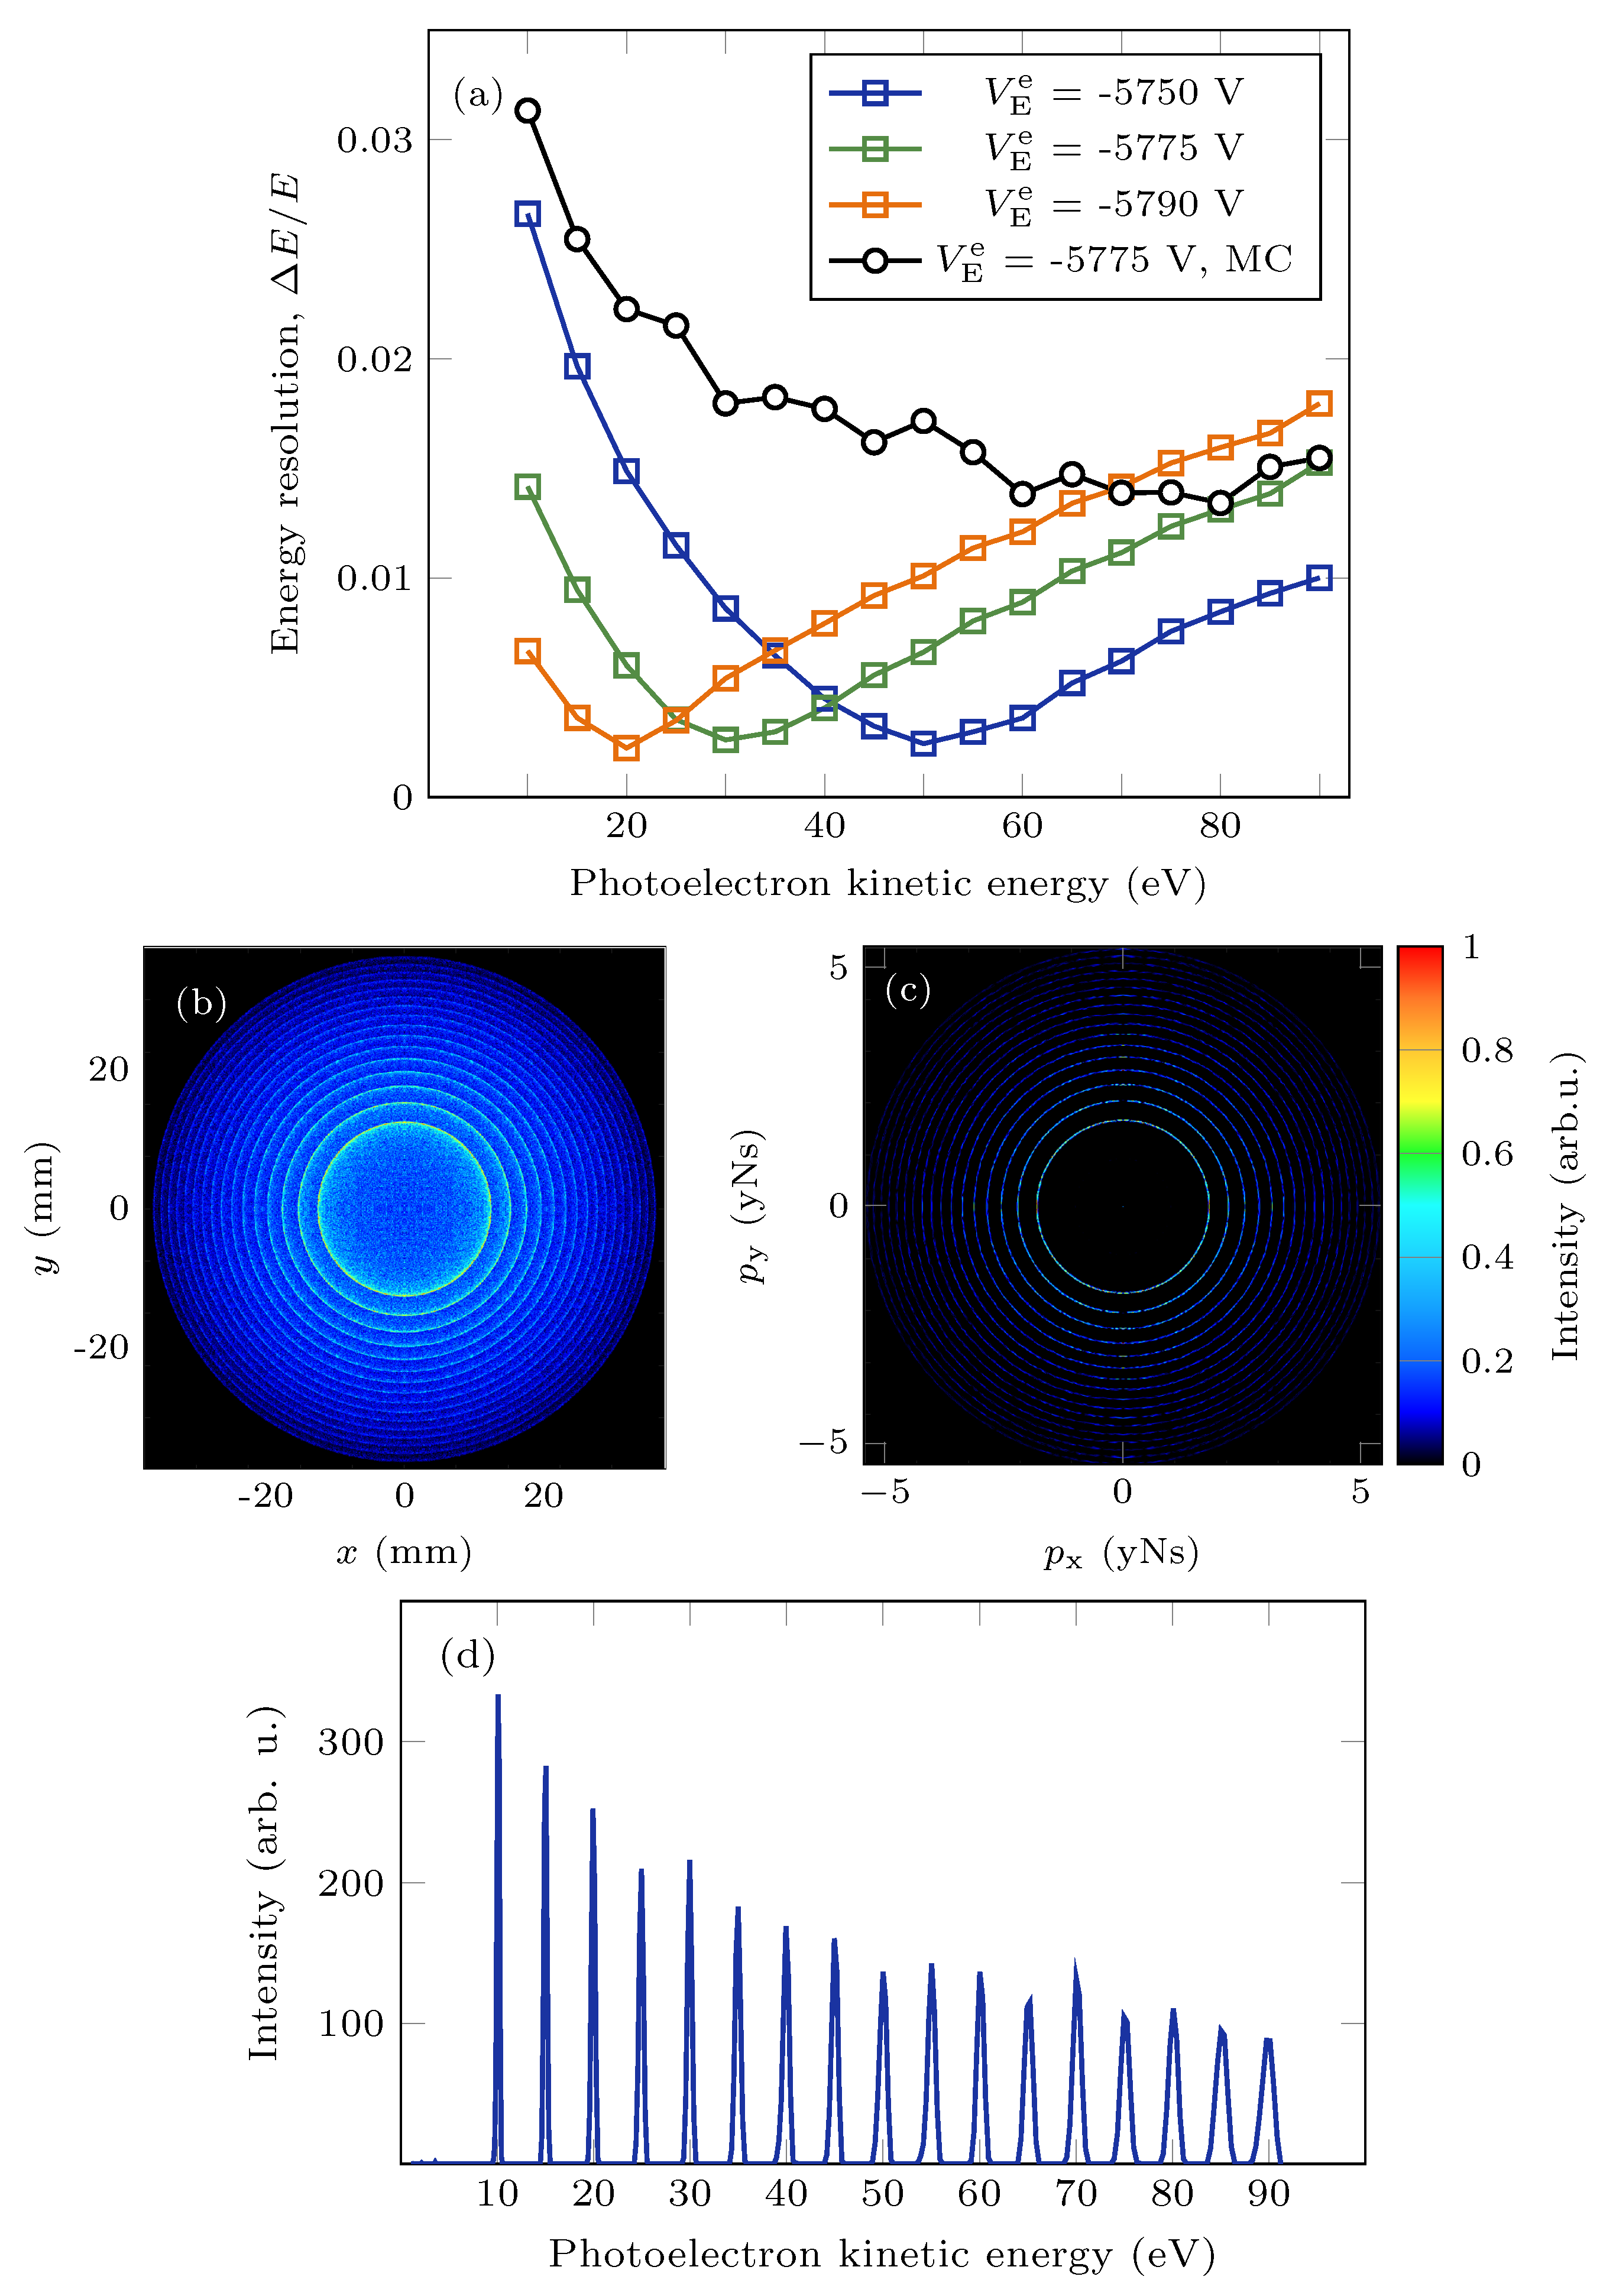
2.3.2. High Resolution Electron Modes
3. Experimental Results
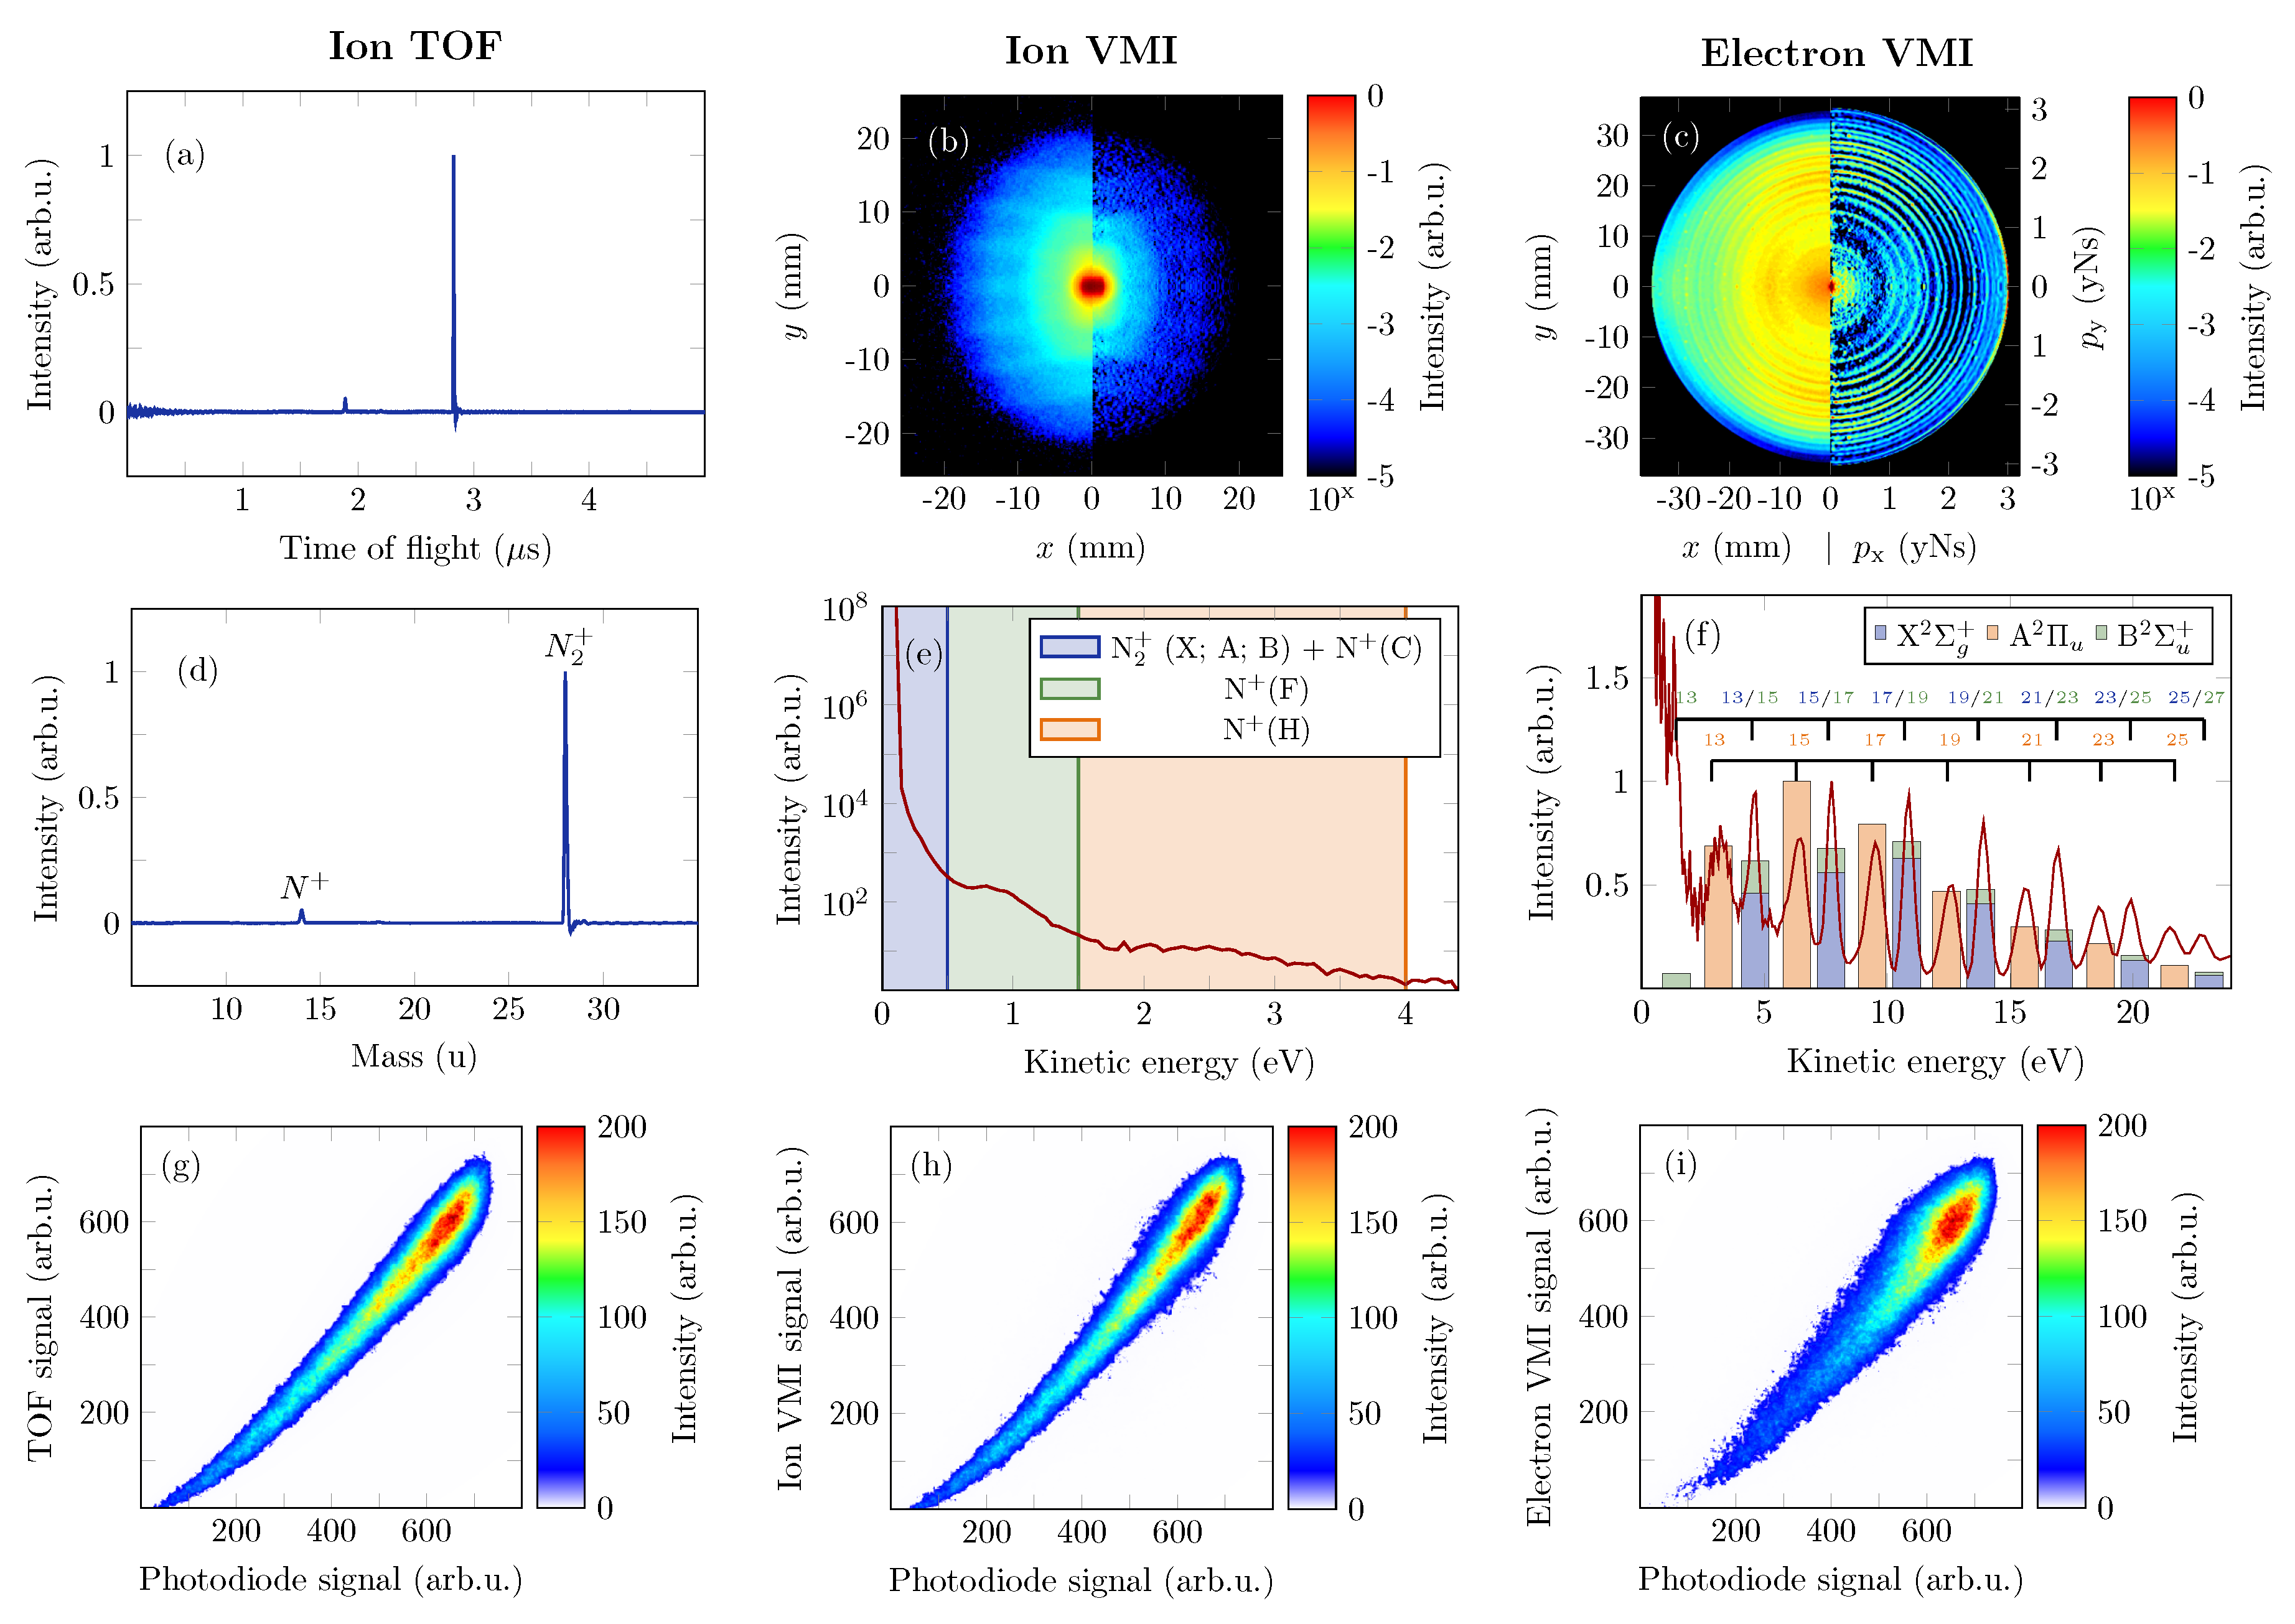
3.1. Data Acquisition
- Ion time-of-flight trace
- Ion velocity map image
- Electron velocity map image
- XUV intensity from photodiode
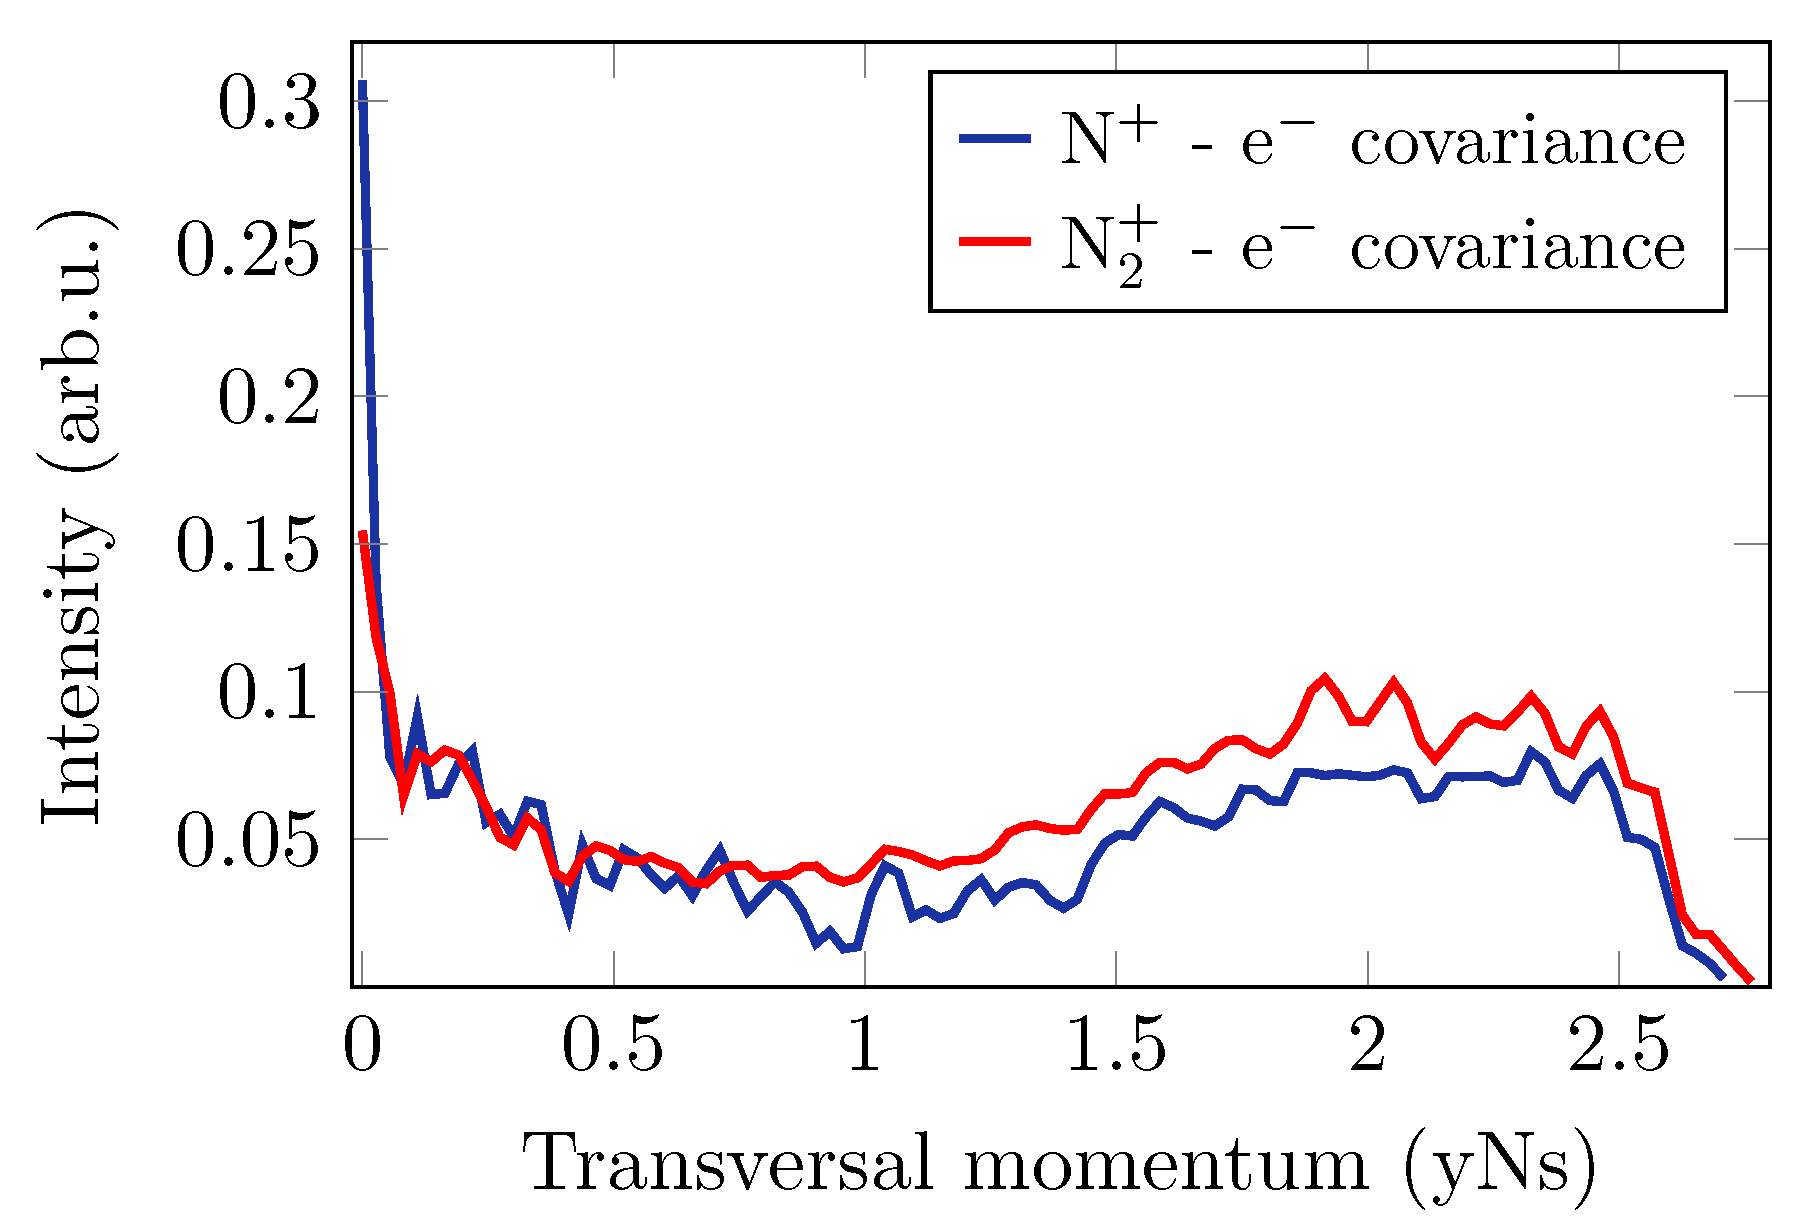
3.2. Covariance Analysis
4. Conclusions and Outlook
Author Contributions
Funding
Conflicts of Interest
References
- Ferray, M.; L’Huillier, A.; Li, X.; Lompre, L.; Mainfray, G.; Manus, C. Multiple-harmonic conversion of 1064 nm radiation in rare gases. J. Phys. B 1988, 21, L31. [Google Scholar] [CrossRef]
- Agostini, P.; DiMauro, L.F. The physics of attosecond light pulses. Rep. Prog. Phys 2004, 67, 813. [Google Scholar] [CrossRef]
- McPherson, A.; Gibson, G.; Jara, H.; Johann, U.; Luk, T.S.; McIntyre, I.A.; Boyer, K.; Rhodes, C.K. Studies of multiphoton production of vacuum-ultraviolet radiation in the rare gases. J. Opt. Soc. Am. B 1987, 4, 595–601. [Google Scholar] [CrossRef]
- Corkum, P. Plasma perspective on strong-field multiphoton ionization. Phys. Rev. Lett. 1993, 71, 1994. [Google Scholar] [CrossRef] [PubMed]
- Schafer, K.J.; Yang, B.; DiMauro, L.F.; Kulander, K.C. Above threshold ionization beyond the high harmonic cutoff. Phys. Rev. Lett. 1993, 70, 1599. [Google Scholar] [CrossRef] [PubMed]
- Ackermann, W.A.; Asova, G.; Ayvazyan, V.; Azima, A.; Baboi, N.; Bähr, J.; Balandin, V.; Beutner, B.; Brandt, A.; Bolzmann, A.; et al. Operation of a free-electron laser from the extreme ultraviolet to the water window. Nat. Photonics 2007, 1, 336. [Google Scholar] [CrossRef] [Green Version]
- Emma, P.; Akre, R.; Arthur, J.; Bionta, R.; Bostedt, C.; Bozek, J.; Brachmann, A.; Bucksbaum, P.; Coffee, R.; Decker, F.J.; et al. First lasing and operation of an ångstrom-wavelength free-electron laser. Nat. Photonics 2010, 4, 641. [Google Scholar] [CrossRef]
- Ishikawa, T.; Aoyagi, H.; Asaka, T.; Asano, Y.; Azumi, N.; Bizen, T.; Ego, H.; Fukami, K.; Fukui, T.; Furukawa, Y.; et al. A compact X-ray free-electron laser emitting in the sub-ångström region. Nat. Photonics 2012, 6, 540. [Google Scholar] [CrossRef]
- McNeil, B.W.J.; Thompson, N.R. X-ray free-electron lasers. Nat. Photonics 2010, 4, 814. [Google Scholar] [CrossRef]
- Glownia, J.M.; Cryan, J.; Andreasson, J.; Belkacem, A.; Berrah, N.; Blaga, C.I.; Bostedt, C.; Bozek, J.; DiMauro, L.F.; Fang, L.; et al. Time-resolved pump-probe experiments at the LCLS. Opt. Express 2010, 18, 17620–17630. [Google Scholar] [CrossRef] [PubMed] [Green Version]
- Lépine, F.; Ivanov, M.Y.; Vrakking, M.J.J. Attosecond molecular dynamics: Fact or fiction? Nat. Photonics 2014, 8, 195. [Google Scholar] [CrossRef]
- Krausz, F.; Ivanov, M. Attosecond physics. Rev. Mod. Phys. 2009, 81, 163–234. [Google Scholar] [CrossRef]
- Sorokin, A.; Wellhöfer, M.; Bobashev, S.; Tiedtke, K.; Richter, M. X-ray-laser interaction with matter and the role of multiphoton ionization: Free-electron-laser studies on neon and helium. Phys. Rev. A 2007, 75, 051402. [Google Scholar] [CrossRef]
- Berrah, N.; Bozek, J.; Costello, J.T.; Düsterer, S.; Fang, L.; Feldhaus, J.; Fukuzawa, H.; Hoener, M.; Jiang, Y.H.; Johnsson, P.; et al. Non-linear processes in the interaction of atoms and molecules with intense EUV and X-ray fields from SASE free electron lasers (FELs). J. Mod. Opt. 2010, 57, 1015–1040. [Google Scholar] [CrossRef] [Green Version]
- Bucksbaum, P.H.; Coffee, R.; Berrah, N. The First Atomic and Molecular Experiments at the Linac Coherent Light Source X-Ray Free Electron Laser. In Advances in Atomic, Molecular, and Optical Physics; Academic Press: Cambridge, MA, USA, 2011; p. 239. [Google Scholar]
- Fang, L.; Osipov, T.; Murphy, B.; Tarantelli, F.; Kukk, E.; Cryan, J.P.; Glownia, M.; Bucksbaum, P.H.; Coffee, R.N.; Chen, M.; et al. Multiphoton Ionization as a clock to Reveal Molecular Dynamics with Intense Short X-ray Free Electron Laser Pulses. Phys. Rev. Lett. 2012, 109, 263001. [Google Scholar] [CrossRef] [PubMed]
- Gallagher-Jones, M.; Bessho, Y.; Kim, S.; Park, J.; Kim, S.; Nam, D.; Kim, C.; Kim, Y.; Miyashita, O.; Tama, F.; et al. Macromolecular structures probed by combining single-shot free-electron laser diffraction with synchrotron coherent X-ray imaging. Nat. Commun. 2014, 5, 3798. [Google Scholar] [CrossRef] [PubMed] [Green Version]
- Seibert, M.M.; Ekeberg, T.; Maia, F.R.; Svenda, M.; Andreasson, J.; Jönsson, O.; Odić, D.; Iwan, B.; Rocker, A.; Westphal, D.; et al. Single mimivirus particles intercepted and imaged with an X-ray laser. Nature 2011, 470, 78–81. [Google Scholar] [CrossRef] [PubMed] [Green Version]
- Neutze, R.; Wouts, R.; Van der Spoel, D.; Weckert, E.; Hajdu, J. Potential for biomolecular imaging with femtosecond X-ray pulses. Nature 2000, 406, 752–757. [Google Scholar] [CrossRef] [PubMed]
- Ullrich, J.; Moshammer, R.; Dorn, A.; Dörner, R.; Schmidt, L.P.H.; Schmidt-Böcking, H. Recoil-ion and electron momentum spectroscopy: Reaction-microscopes. Rep. Prog. Phys. 2003, 66, 1463–1545. [Google Scholar] [CrossRef]
- Eppink, A.T.J.B.; Parker, D.H. Velocity map imaging of ions and electrons using electrostatic lenses: Application in photoelectron and photofragment ion imaging of molecular oxygen. Rev. Sci. Instrum. 1997, 68, 3477–3484. [Google Scholar] [CrossRef]
- Smith, L.M.; Keefer, D.R.; Sudharsanan, S. Abel inversion using transform techniques. J. Quant. Spectrosc. Radiat. Transf. 1988, 39, 367–373. [Google Scholar] [CrossRef]
- Vrakking, M.J.J. An iterative procedure for the inversion of two-dimensional ion/photoelectron imaging experiments. Rev. Sci. Instrum. 2001, 72, 4084–4089. [Google Scholar] [CrossRef]
- Eland, J.H.D. Improved resolution in fixed-wavelength photoelectron–photoion coincidence spectroscopy. Rev. Sci. Instrum. 1978, 49, 1688–1690. [Google Scholar] [CrossRef] [PubMed]
- Bodi, A.; Hemberger, P.; Gerber, T.; Sztáray, B. A new double imaging velocity focusing coincidence experiment: i2PEPICO. Rev. Sci. Instrum. 2012, 83, 083105. [Google Scholar] [CrossRef] [PubMed]
- Sztáray, B.; Voronova, K.; Torma, K.G.; Covert, K.J.; Bodi, A.; Hemberger, P.; Gerber, T.; Osborn, D.L. CRF-PEPICO: Double velocity map imaging photoelectron photoion coincidence spectroscopy for reaction kinetics studies. J. Chem. Phys. 2017, 147, 013944. [Google Scholar] [CrossRef] [PubMed] [Green Version]
- Garcia, G.A.; Soldi-Lose, H.; Nahon, L. A versatile electron-ion coincidence spectrometer for photoelectron momentum imaging and threshold spectroscopy on mass selected ions using synchrotron radiation. Rev. Sci. Instrum. 2009, 80, 023102. [Google Scholar] [CrossRef] [PubMed]
- O’keeffe, P.; Bolognesi, P.; Coreno, M.; Moise, A.; Richter, R.; Cautero, G.; Stebel, L.; Sergo, R.; Pravica, L.; Ovcharenko, Y.; et al. A photoelectron velocity map imaging spectrometer for experiments combining synchrotron and laser radiations. Rev. Sci. Instrum. 2011, 82, 033109. [Google Scholar] [CrossRef] [PubMed]
- Garcia, G.A.; Nahon, L. A refocusing modified velocity map imaging electron/ion spectrometer adapted to synchrotron radiation studies. Rev. Sci. Instrum. 2005, 76, 053302. [Google Scholar] [CrossRef]
- Frasinski, L.J.; Codling, K.; Hatherly, P.A. Covariance Mapping: A Correlation Method Applied to Multiphoton Multiple Ionization. Science 1989, 246, 1029–1031. [Google Scholar] [CrossRef] [PubMed] [Green Version]
- Frasinski, L.J.; Stankiewicz, M.; Hatherly, P.A.; Cross, G.M.; Codling, K.; Langley, A.J.; Shaikh, W. Molecular H2 in intense laser fields probed by electron-electron, electron-ion, and ion-ion covariance techniques. Phys. Rev. A 1992, 46, R6789–R6792. [Google Scholar] [CrossRef] [PubMed]
- Frasinski, L.J. Covariance mapping techniques. J. Phys. B 2016, 49, 152004. [Google Scholar] [CrossRef] [Green Version]
- Kornilov, O.; Eckstein, M.; Rosenblatt, M.; Schulz, C.P.; Motomura, K.; Rouzée, A.; Klei, J.; Foucar, L.; Siano, M.; Lübcke, A.; et al. Coulomb explosion of diatomic molecules in intense XUV fields mapped by partial covariance. J. Phys. B 2013, 46, 164028. [Google Scholar] [CrossRef] [Green Version]
- Boguslavskiy, A.E.; Mikosch, J.; Gijsbertsen, A.; Spanner, M.; Patchkovskii, S.; Gador, N.; Vrakking, M.J.J.; Stolow, A. The Multielectron Ionization Dynamics Underlying Attosecond Strong-Field Spectroscopies. Science 2012, 335, 1336–1340. [Google Scholar] [CrossRef] [PubMed]
- Zhu, J.; Hill, W.T. Momentum and correlation spectra following intense-field dissociative ionization of H2. J. Opt. Soc. Am. B 1997, 14, 2212–2220. [Google Scholar] [CrossRef]
- Hansen, J.L.; Nielsen, J.H.; Madsen, C.B.; Lindhardt, A.T.; Johansson, M.P.; Skrydstrup, T.; Madsen, L.B.; Stapelfeldt, H. Control and femtosecond time-resolved imaging of torsion in a chiral molecule. J. Chem. Phys. 2012, 136, 204310. [Google Scholar] [CrossRef] [PubMed] [Green Version]
- Slater, C.S.; Blake, S.; Brouard, M.; Lauer, A.; Vallance, C.; Bohun, C.S.; Christensen, L.; Nielsen, J.H.; Johansson, M.P.; Stapelfeldt, H. Coulomb-explosion imaging using a pixel-imaging mass-spectrometry camera. Phys. Rev. A 2015, 91, 053424. [Google Scholar] [CrossRef]
- Pickering, J.D.; Amini, K.; Brouard, M.; Burt, M.; Bush, I.J.; Christensen, L.; Lauer, A.; Nielsen, J.H.; Slater, C.S.; Stapelfeldt, H. Communication: Three-fold covariance imaging of laser-induced Coulomb explosions. J. Chem. Phys. 2016, 144, 161105. [Google Scholar] [CrossRef] [PubMed] [Green Version]
- Osipov, T.; Bostedt, C.; Castagna, J.C.; Ferguson, K.R.; Bucher, M.; Montero, S.C.; Swiggers, M.L.; Obaid, R.; Rolles, D.; et al. The LAMP instrument at the Linac Coherent Light Source free-electron laser. Rev. Sci. Instrum. 2018, 89, 035112. [Google Scholar] [CrossRef] [PubMed]
- Johnsson, P.; Rouzée, A.; Siu, W.; Huismans, Y.; Lépine, F.; Marchenko, T.; Düsterer, S.; Tavella, F.; Stojanovic, N.; Redlin, H.; et al. Characterization of a two-color pump–probe setup at FLASH using a velocity map imaging spectrometer. Opt. Lett. 2010, 35, 4163–4165. [Google Scholar] [CrossRef] [PubMed]
- Wiley, W.C.; McLaren, I.H. Time-of-Flight Mass Spectrometer with Improved Resolution. Rev. Sci. Instrum. 1955, 26, 1150. [Google Scholar] [CrossRef]
- Manschwetus, B.; Rading, L.; Campi, F.; Maclot, S.; Coudert-Alteirac, H.; Lahl, J.; Wikmark, H.; Rudawski, P.; Heyl, C.M.; Farkas, B.; et al. Two-photon double ionization of neon using an intense attosecond pulse train. Phys. Rev. A 2016, 93, 061402. [Google Scholar] [CrossRef]
- Coudert-Alteirac, H.; Dacasa, H.; Campi, F.; Kueny, E.; Farkas, B.; Brunner, F.; Maclot, S.; Manschwetus, B.; Wikmark, H.; Lahl, J.; et al. Micro-Focusing of Broadband High-Order Harmonic Radiation by a Double Toroidal Mirror. Appl. Sci. 2017, 11, 1159. [Google Scholar] [CrossRef]
- Rosca-Pruna, F. Alignment of Diatomic Molecules Induced by Intense Laser Fields. Ph.D. Thesis, VU University of Amsterdam, Amsterdam, The Netherlands, 2001. [Google Scholar]
- Dahl, D.A. Simion for the personal computer in reflection. Int. J. Mass Spectrom. 2000, 200, 3–25. [Google Scholar] [CrossRef]
- Ghafur, O.; Siu, W.; Johnsson, P.; Kling, M.F.; Drescher, M.; Vrakking, M.J.J. A velocity map imaging detector with an integrated gas injection system. Rev. Sci. Instrum. 2009, 80, 033110. [Google Scholar] [CrossRef] [PubMed]
- Even, U. Pulsed Supersonic Beams from High Pressure Source: Simulation Results and Experimental Measurements. Adv. Chem. 2014, 2014, 1–11. [Google Scholar] [CrossRef] [Green Version]
- Even, U. The Even-Lavie valve as a source for high intensity supersonic beam. EPJ Tech. Instrum. 2015, 2, 17. [Google Scholar] [CrossRef]
- Frasinski, L.J.; Giles, A.; Hatherly, P.; Posthumus, J.; Thompson, M.; Codling, K. Covariance mapping and triple coincidence techniques applied to multielectron dissociative ionization. J. Electron Spectrosc. Relat. Phenom. 1996, 79, 367–371. [Google Scholar] [CrossRef] [Green Version]
- Hochlaf, M.; Hall, R.I.; Penent, F.; Kjeldsen, H.; Lablanquie, P.; Lavollée, M.; Eland, J.H.D. Threshold photoelectrons coincidence spectroscopy of N22+ and CO2+ ions. Chem. Phys. 1996, 207, 159–165. [Google Scholar] [CrossRef]
- Lucchini, M.; Kim, K.; Calegari, F.; Kelkensberg, F.; Siu, W.; Sansone, G.; Vrakking, M.J.J.; Hochlaf, M.; Nisoli, M. Autoionization and ultrafast relaxation dynamics of highly excited states in N2. Phys. Rev. A 2012, 86, 043404. [Google Scholar] [CrossRef]
- Eckstein, M.; Yang, C.H.; Kubin, M.; Frasetto, F.; Poletto, L.; Ritze, H.H.; Vrakking, M.J.J.; Kornilov, O. Dynamics of N2 Dissociation upon Inner-Valence Ionization by Wavelength-Selected XUV Pulses. J. Phys. Chem. Lett. 2015, 6, 419–425. [Google Scholar] [CrossRef] [PubMed]
- Aoto, T.; Ito, K. Inner-valence states of N2+ and the dissociation dynamics studied by threshold photoelectron spectroscopy and configuration interaction calculation. J. Chem. Phys. 2006, 124, 234306. [Google Scholar] [CrossRef] [PubMed]
- Plummer, E.W.; Gustafsson, T.; Gudat, W.; Eastman, D.E. Partial photoionization cross sections of N2 and CO using synchrotron radiation. Phys. Rev. A 1977, 15, 2339–2355. [Google Scholar] [CrossRef]
- Hammet, A.; Stoll, W.; Brion, C. Photoelectron branching ratios and partial ionization cross-sections for CO and N2 in the energy range 18–50 eV. J. Electron Spectrosc. Relat. Phenom. 1976, 8, 367–376. [Google Scholar] [CrossRef]
- Baltzer, P.; Larsson, M.; Karlsson, L.; Wannberg, B.; Carlsson-Göthe, M. Inner-valence states of N2+ studied by uv photoelectron spectroscopy and configuration-interaction calculations. Phys. Rev. A 1992, 46, 5545–5553. [Google Scholar] [CrossRef] [PubMed]
- Ahmad, M.; Lablanquie, P.; Penent, F.; Lambourne, J.G.; Hall, R.I.; Eland, J.H.D. Structure and fragmentation dynamics of N22+ ions in double photoionization experiments. J. Phys. B 2006, 39, 3599. [Google Scholar] [CrossRef]


| Operation Mode | (Equation (1)) | (kV) | (kV) | (kV) | (kV) | (kV) |
|---|---|---|---|---|---|---|
| 1(a) Ion TOF | 0.76–0.78 | 0 | 2.275–2.354 | 3.000 | not used | not used |
| 1(b) Ion VMI | 0.76 | 0 | 2.275 | 3.000 | not used | not used |
| 2(a) Electron VMI + ion TOF | 0.76 | 5.000 | −5.775 | −9.200 | −10.000 | −10.000 |
| 2(b) Electron VMI + ion VMI | 0.76 | 5.000 | −5.775 | −9.200 | −8.802 | −10.000 |
© 2018 by the authors. Licensee MDPI, Basel, Switzerland. This article is an open access article distributed under the terms and conditions of the Creative Commons Attribution (CC BY) license (http://creativecommons.org/licenses/by/4.0/).
Share and Cite
Rading, L.; Lahl, J.; Maclot, S.; Campi, F.; Coudert-Alteirac, H.; Oostenrijk, B.; Peschel, J.; Wikmark, H.; Rudawski, P.; Gisselbrecht, M.; et al. A Versatile Velocity Map Ion-Electron Covariance Imaging Spectrometer for High-Intensity XUV Experiments. Appl. Sci. 2018, 8, 998. https://doi.org/10.3390/app8060998
Rading L, Lahl J, Maclot S, Campi F, Coudert-Alteirac H, Oostenrijk B, Peschel J, Wikmark H, Rudawski P, Gisselbrecht M, et al. A Versatile Velocity Map Ion-Electron Covariance Imaging Spectrometer for High-Intensity XUV Experiments. Applied Sciences. 2018; 8(6):998. https://doi.org/10.3390/app8060998
Chicago/Turabian StyleRading, Linnea, Jan Lahl, Sylvain Maclot, Filippo Campi, Hélène Coudert-Alteirac, Bart Oostenrijk, Jasper Peschel, Hampus Wikmark, Piotr Rudawski, Mathieu Gisselbrecht, and et al. 2018. "A Versatile Velocity Map Ion-Electron Covariance Imaging Spectrometer for High-Intensity XUV Experiments" Applied Sciences 8, no. 6: 998. https://doi.org/10.3390/app8060998