Detection of Impact Damage on PVA-ECC Beam Using Infrared Thermography


1
Key Laboratory of Earthquake Geodesy, Institute of Seismology, China Earthquake Administration, Wuhan 430071, China
2
College of Mechanical and Electronic Engineering, China University of Petroleum, Qingdao 266580, China
3
School of Civil Engineering, Shenyang Jianzhu University, Shenyang 110168, China
4
Department of Engineering Technology, University of Houston, Houston, TX 77204, USA
*
Author to whom correspondence should be addressed.
Appl. Sci. 2018, 8(5), 839; https://doi.org/10.3390/app8050839
Submission received: 16 April 2018
/
Revised: 16 May 2018
/
Accepted: 17 May 2018
/
Published: 22 May 2018
(This article belongs to the Special Issue Structural Damage Detection and Health Monitoring)
Abstract
:The main purpose of the current research is to pilot study the impact damage detection in a beam structure using infrared thermography. In this study, a beam structure, made of polyvinyl alcohol fiber reinforced engineering cementitious composite (PVA-ECC) was subjected to multiple low-velocity impacts at a constant energy level. After each impact, the structure was heated by means of halogen lamp, and acquisition of thermal images was conducted simultaneously. Sequences of thermal images were acquired with starting and ending time sets so as to include the entire evolution of thermal phenomenon, during both heating to cooling processes. Based on the relationship between the damage and the temperature variation under the thermal excitation, different damages in the impacted structures were analyzed in the thermographs. Through experimental investigation, the results demonstrated that different degrees of damage correspond to different infrared thermal characteristics. The generation and evolution of thermal signatures revealed the initiation and propagation of impact damages. It further illustrated that the proposed method is an innovative and effective approach to detect impact damage.
1. Introduction
Polyvinyl alcohol fiber reinforced engineering cementitious composite (PVA-ECC) is a class of ultra-ductile fiber reinforced cementitious composite, which has been widely adopted in the large material volume usage and cost sensitive construction industry [1]. PVA-ECC material has been demonstrated as an important structural material due to its excellent performance, such as high strength, high temperature resistance and corrosion resistance [2,3]. It is best suited for engineering applications that require large ductility, such as earthquake-resistant bridges. It also has been widely utilized in applications that require high durability, such as bridge piers, pavements and other infrastructure exposed to harsh environmental conditions [4].
In the past few decades, a large numbers of bridges spanning great rivers were built both at home and abroad. For the structures constructed in navigable waters, they constitute a hazard that is vulnerable to damage or destruction in the event of vessel collision. Among the most significant structures exposed to this hazard are bridges that cross coastal or inland waterways. According to relevant reports, impact accidents due to ship-bridge collision are increasingly common, and are a major cause of traffic disruption and economic loss. The records indicate an average of one serious ship-bridge collision accident per year worldwide [5]. However, impact-induced structural damage is a major concern and has not been fully characterized for PVA-ECC structures. Accidental impacts can severely reduce the structural strength and stability, which can lead to severe consequences due to the degradation of the mechanical properties. After impacts, there may be subsurface cracks or buried cracks under the surface, which will significantly reduce the bearing capacity of the structure. It is essential to develop an effective detection technique to monitor and study the impact damage, to provide early warning of possible faults.
In recent decades, different types of instruments and techniques have been utilized for structural damage detection and health monitoring. These techniques can be classified into acoustic emission [6,7,8,9,10,11,12,13], electromagnetic techniques [14,15], ultrasonic inspection [16,17,18], microscopy [19], sensors [20,21,22,23,24,25,26,27,28,29,30] and thermography [31,32,33,34,35,36,37]. For example, Santosa monitored the impact damage on fiberglass composite plates based on surface lava wave propagation [38]. Song et al. detected the impact damage on bridges due to high-speed vehicle collision using embedded piezoceramic transducers [39]. Jeon et al. studied the low velocity impact and delamination buckling behavior of composite laminates with embedded optical fibers [40]. Shih and Mal investigated the impact process based on the spectral analysis of acoustic emission signals [41]. Each monitoring technique has its own limitation and disadvantage. Most of them require an experienced technician to analyze the information, which leads to a significant decrease in effectiveness.
Among the various new techniques developed recently, infrared thermography is a well-known non-destructive evaluation (NDE) technique, which has attracted considerable interests in a wide variety of industries. It can transform the thermal energy emitted by objects in the infrared band of the electromagnetic spectrum into a visible image [42,43]. It allows fast inspection of large surfaces [44,45,46,47]. The active thermography method is fast and can provide full-field information of defects. It measures the surface heat-transfer response due to thermal excitation. Thermography is a surface thermal radiation measurement technique, which can be used to detect spatial variations of the surface temperature pattern [48,49]. The crack or flaw can be detected by searching anomalous hot-spots after thermal excitation.
In this study, the infrared thermography approach was adopted for impact damage detection of a PVA-ECC beam under low-velocity impact loading. A series of impact tests at constant impact energy were conducted. After each impact, infrared thermography was used for NDE of the PVA-ECC beam. Sequences of images were acquired with starting and ending times set so as to include the entire evolution of thermal phenomenon from both the heating and cooling processes. Experimental results verified the feasibility and effectiveness of infrared thermography for impact damage detection on a PVA-ECC structure.
2. Detection Principle
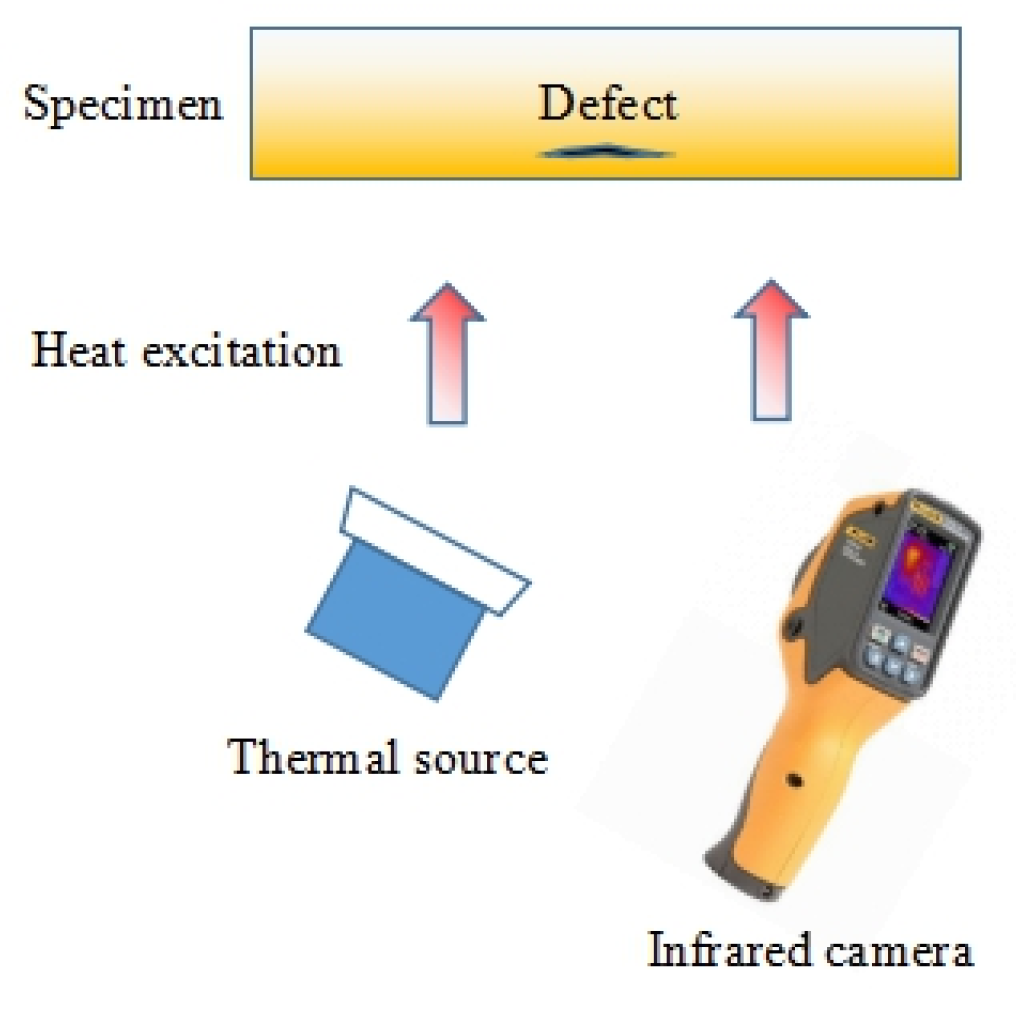
In active infrared thermography, a thermal source is applied to provide external heat stimulus. The applied thermal stimulation generates heat which propagates as thermal waves from the surface into the inside of the tested structure. When the thermal waves reach a defect or crack, they will change their propagation rate and produce thermal contrast on the surface above the anomaly immediately [50,51]. Figure 1 demonstrates the infrared thermography method for impact damage detection.
The entire process including temperature rise and decay is registered using an infrared camera and stored as a 3D matrix composed by N thermograms, where x and y are the spatial coordinates and t is the time [52]. The data is then processed to improve defect visibility and to perform quantitative characterization of defects. Analysis of the infrared signal series can reveal the occurrence and evolution of the impact damage when compared with a baseline or initial condition.
The propagation of heat not only depends on several material properties, such as thermal conductivity and density, but also on subsurface anomalies which result in temperature differences on the surface target. Active infrared thermography is particularly advantageous for impact damage detection, as this technique can be applied to the inspection of materials for subsurface defects detection. In addition, active thermography is a clean and non-contract technique, which has been proven successful for non-destructive testing [53,54,55].
3. Experimental Setup and Procedure
This section describes the experimental setup and demonstrates the impact damage detection based on active thermography. In addition, the temperature acquisition system will also be described in this section.
3.1. Experimental Setup
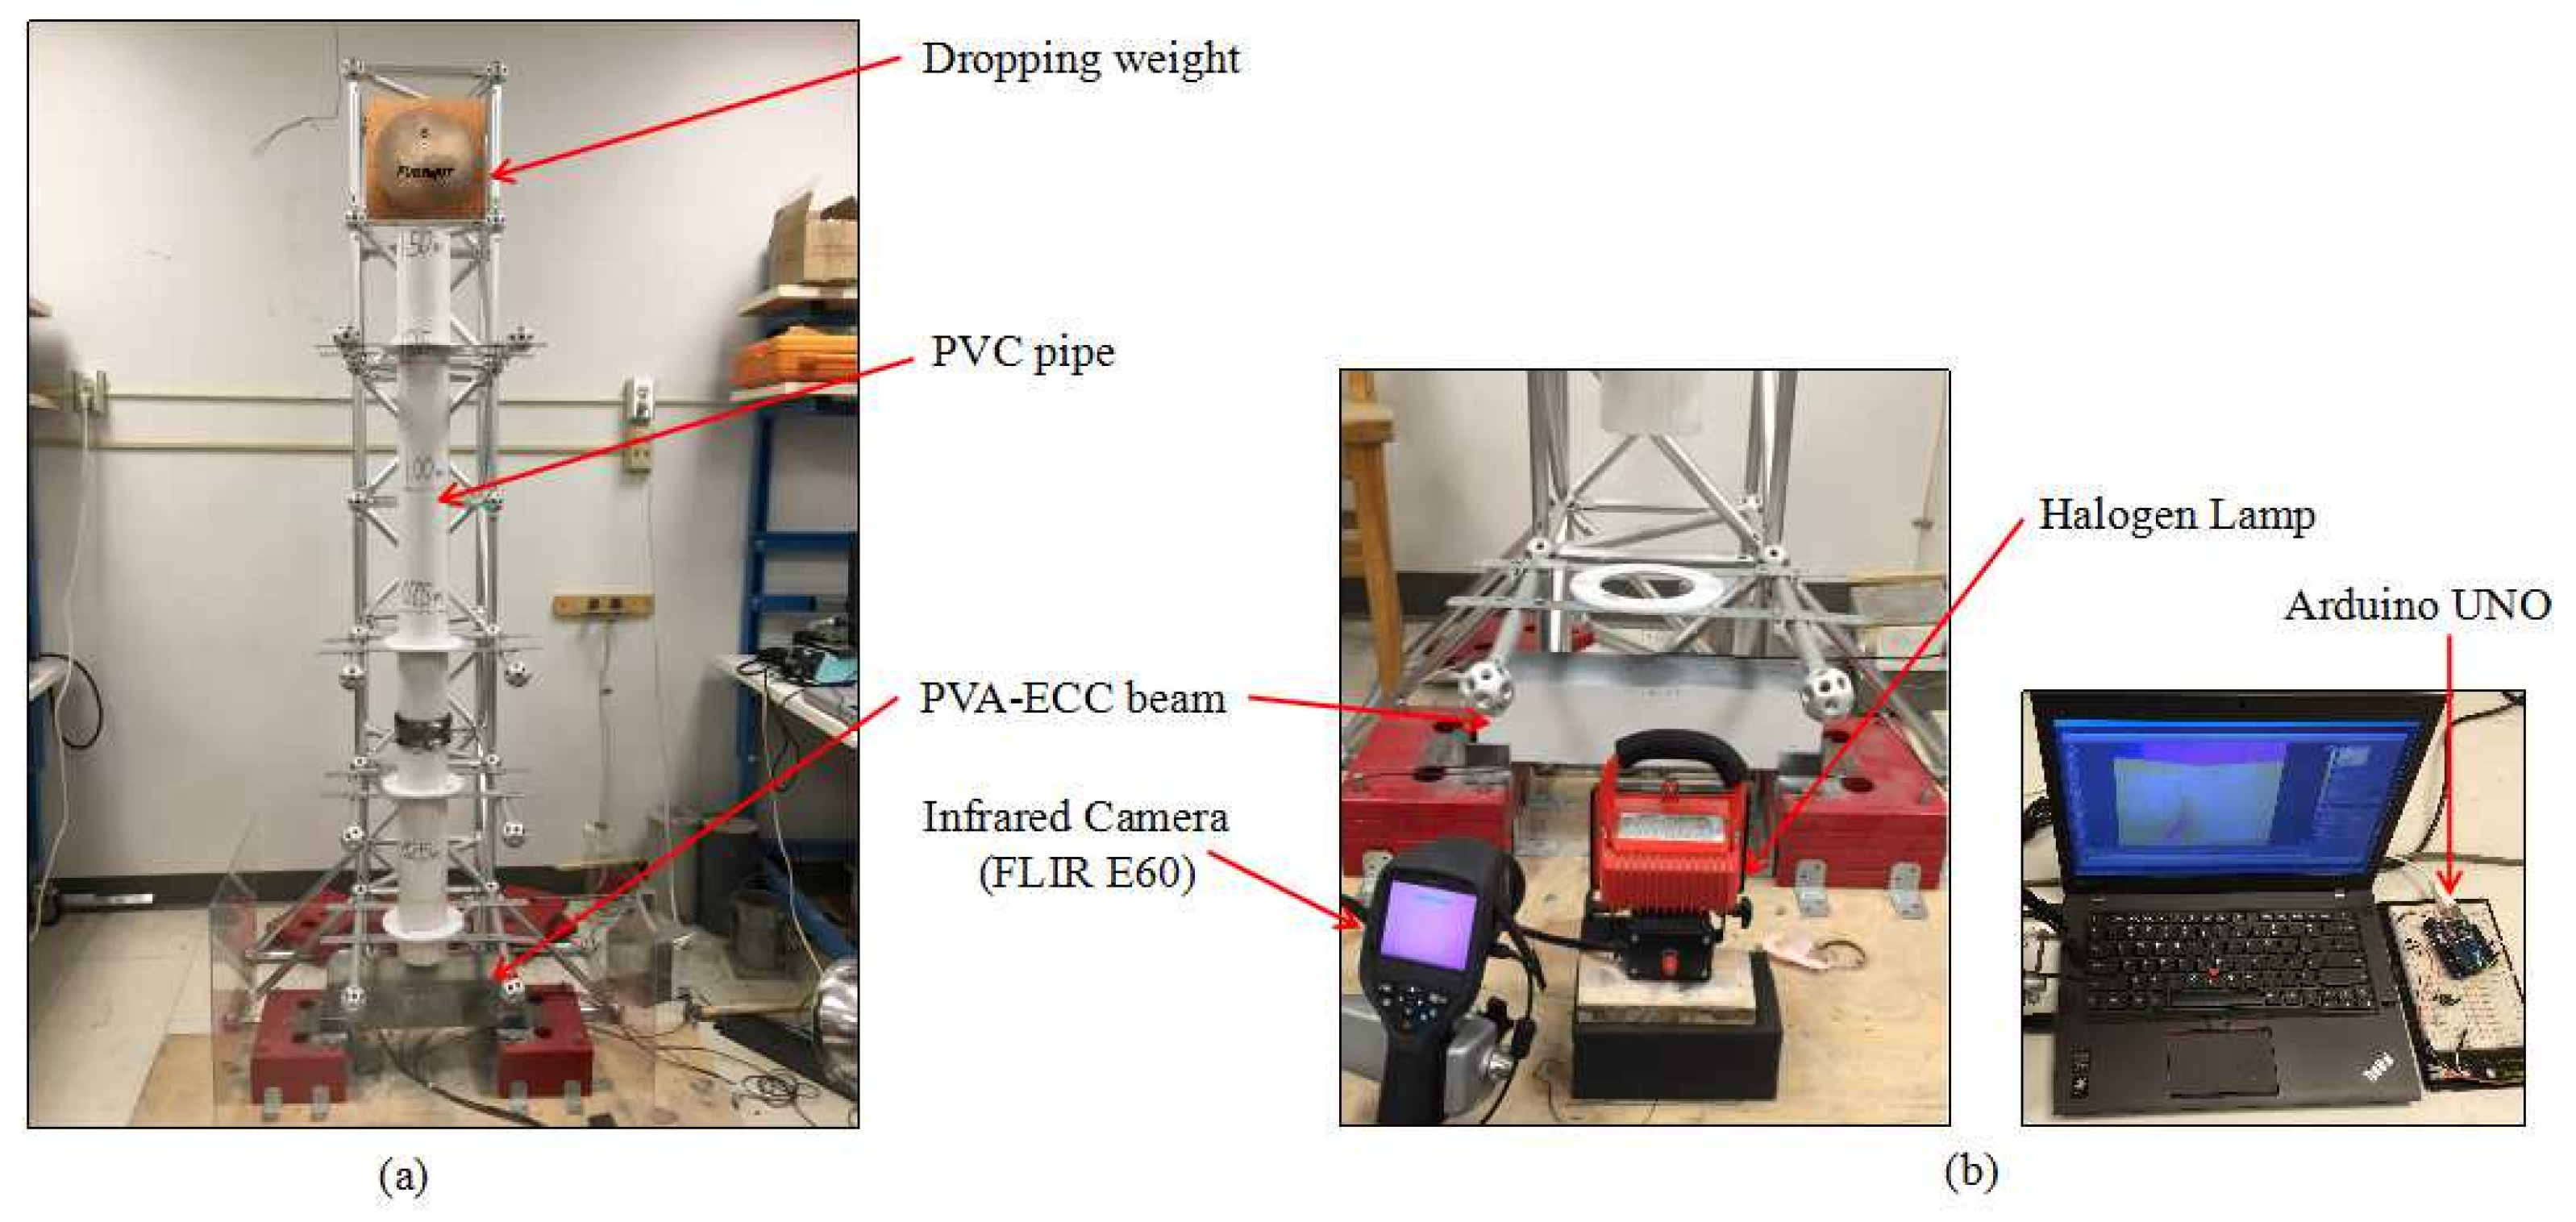
The experimental setup basically includes a PVA-ECC beam, an infrared camera and a halogen lamp for thermal stimulation, as shown in Figure 2. The camera and lamp are positioned and fixed on the same side to perform measurements in reflection mode. The thermal wave, which delivered to the specimen surface, propagates inside the specimen and gets reflected when it reaches crack or defects [56]. The reflected thermal wave will then be captured by the infrared camera (E60, FLIR Systems, Wilsonville, OR, USA).
The PVA-ECC beam was fabricated in the Smart Material and Structure Laboratory, University of Houston (Houston, TX, USA). The size of the beam specimen was 100 × 100 × 400 mm3 and its quantitative composition was given in Table 1. The properties of PVA fibers were listed in Table 2. The specimen was fixed in an L-shaped fixture, which was used to prevent horizontal movement during the impact test. Thereby, the location of each impact was limited at the top of the upper surface of the specimen. The L-shaped fixture was welded on a metal base, which was fixed to the ground in all directions. The drop weight is a spherical ball with a diameter of 90 mm. Its mass is 2.7 kg. The specimen was subjected to impact tests, with the drop weight falling from 1 m high. After each drop weight impact, the halogen lamp heats the side surface of the specimen to increase the temperature. In the meantime, the temperature of the side face was monitored with an infrared camera in order to visualize impact-induced thermal signatures. The impact test was repeated until a clear crack appeared on the beam due to the impact-induced damage. The total number of impact events in this study was nine.
Thermal stimulation was applied using a halogen lamp with a power of 250 W. The lamp was turned on for 20 s to heat the specimen. After the lamp was turned off, the temperature decay was also recorded for another 20 s, making a total duration of 40 s. Both the temperature increase and decay periods were of interest. Thermal graphs were acquired using the ThermaCam FLIR E60 (FLIR Systems, Wilsonville, OR, USA), which is an uncooled focal plane array camera. The thermal sensitivity is <0.05 °C at 30 °C and the frame rate is 60 Hz. It works in the far 7.5–13 μm band and has spatial resolution 320 × 240 pixels for a full frame.
Infrared images acquired from active thermography tests are greatly affected by the non-uniform properties of the material surface being inspected, and also by the uneven heat generated by the thermal stimulus [48]. Thus, it is necessary to subtract the background from the image before further processing. The FLIR Tools + software (6.4.18039.1003) was used, which allows manipulating of the infrared camera, handling of thermal images, visualization and processing of thermal images.
3.2. Impact Tests
After each impact, thermal videos were acquired in time sequence at 60 Hz under the thermal stimulation. To better account for thermal phenomena, sequences of these thermal images were re-arranged and processed by subtracting the first thermal image for each subsequent image [42,53,57]. The first thermal image was taken before the impacts and the thermal stimulation. Therefore, we obtain a map of temperature difference :
where i and j represents rows and columns of the thermal image. Therefore, a sequence of images was created [31]. images supply quantitative information about location and strength of hot spots and, in turn, of the impact induced damage. The hot spots imply the visualization of thermal signatures that develop under impact damage. They represent the thermal perception of impact damage arose on the specimen and the information on damage location, which is important to detect the severity of the impact damage. They also provide useful information to understand the PVA-ECC impact damage mechanisms, such as initiation of cracks and their propagation, severity of damages. Defects like cracks in the structure, which have different density, heat capacity and heat conductivity in comparison to the intact area, could be localized and partly quantified.
4. Results
4.1. Warm-up Period Analysis
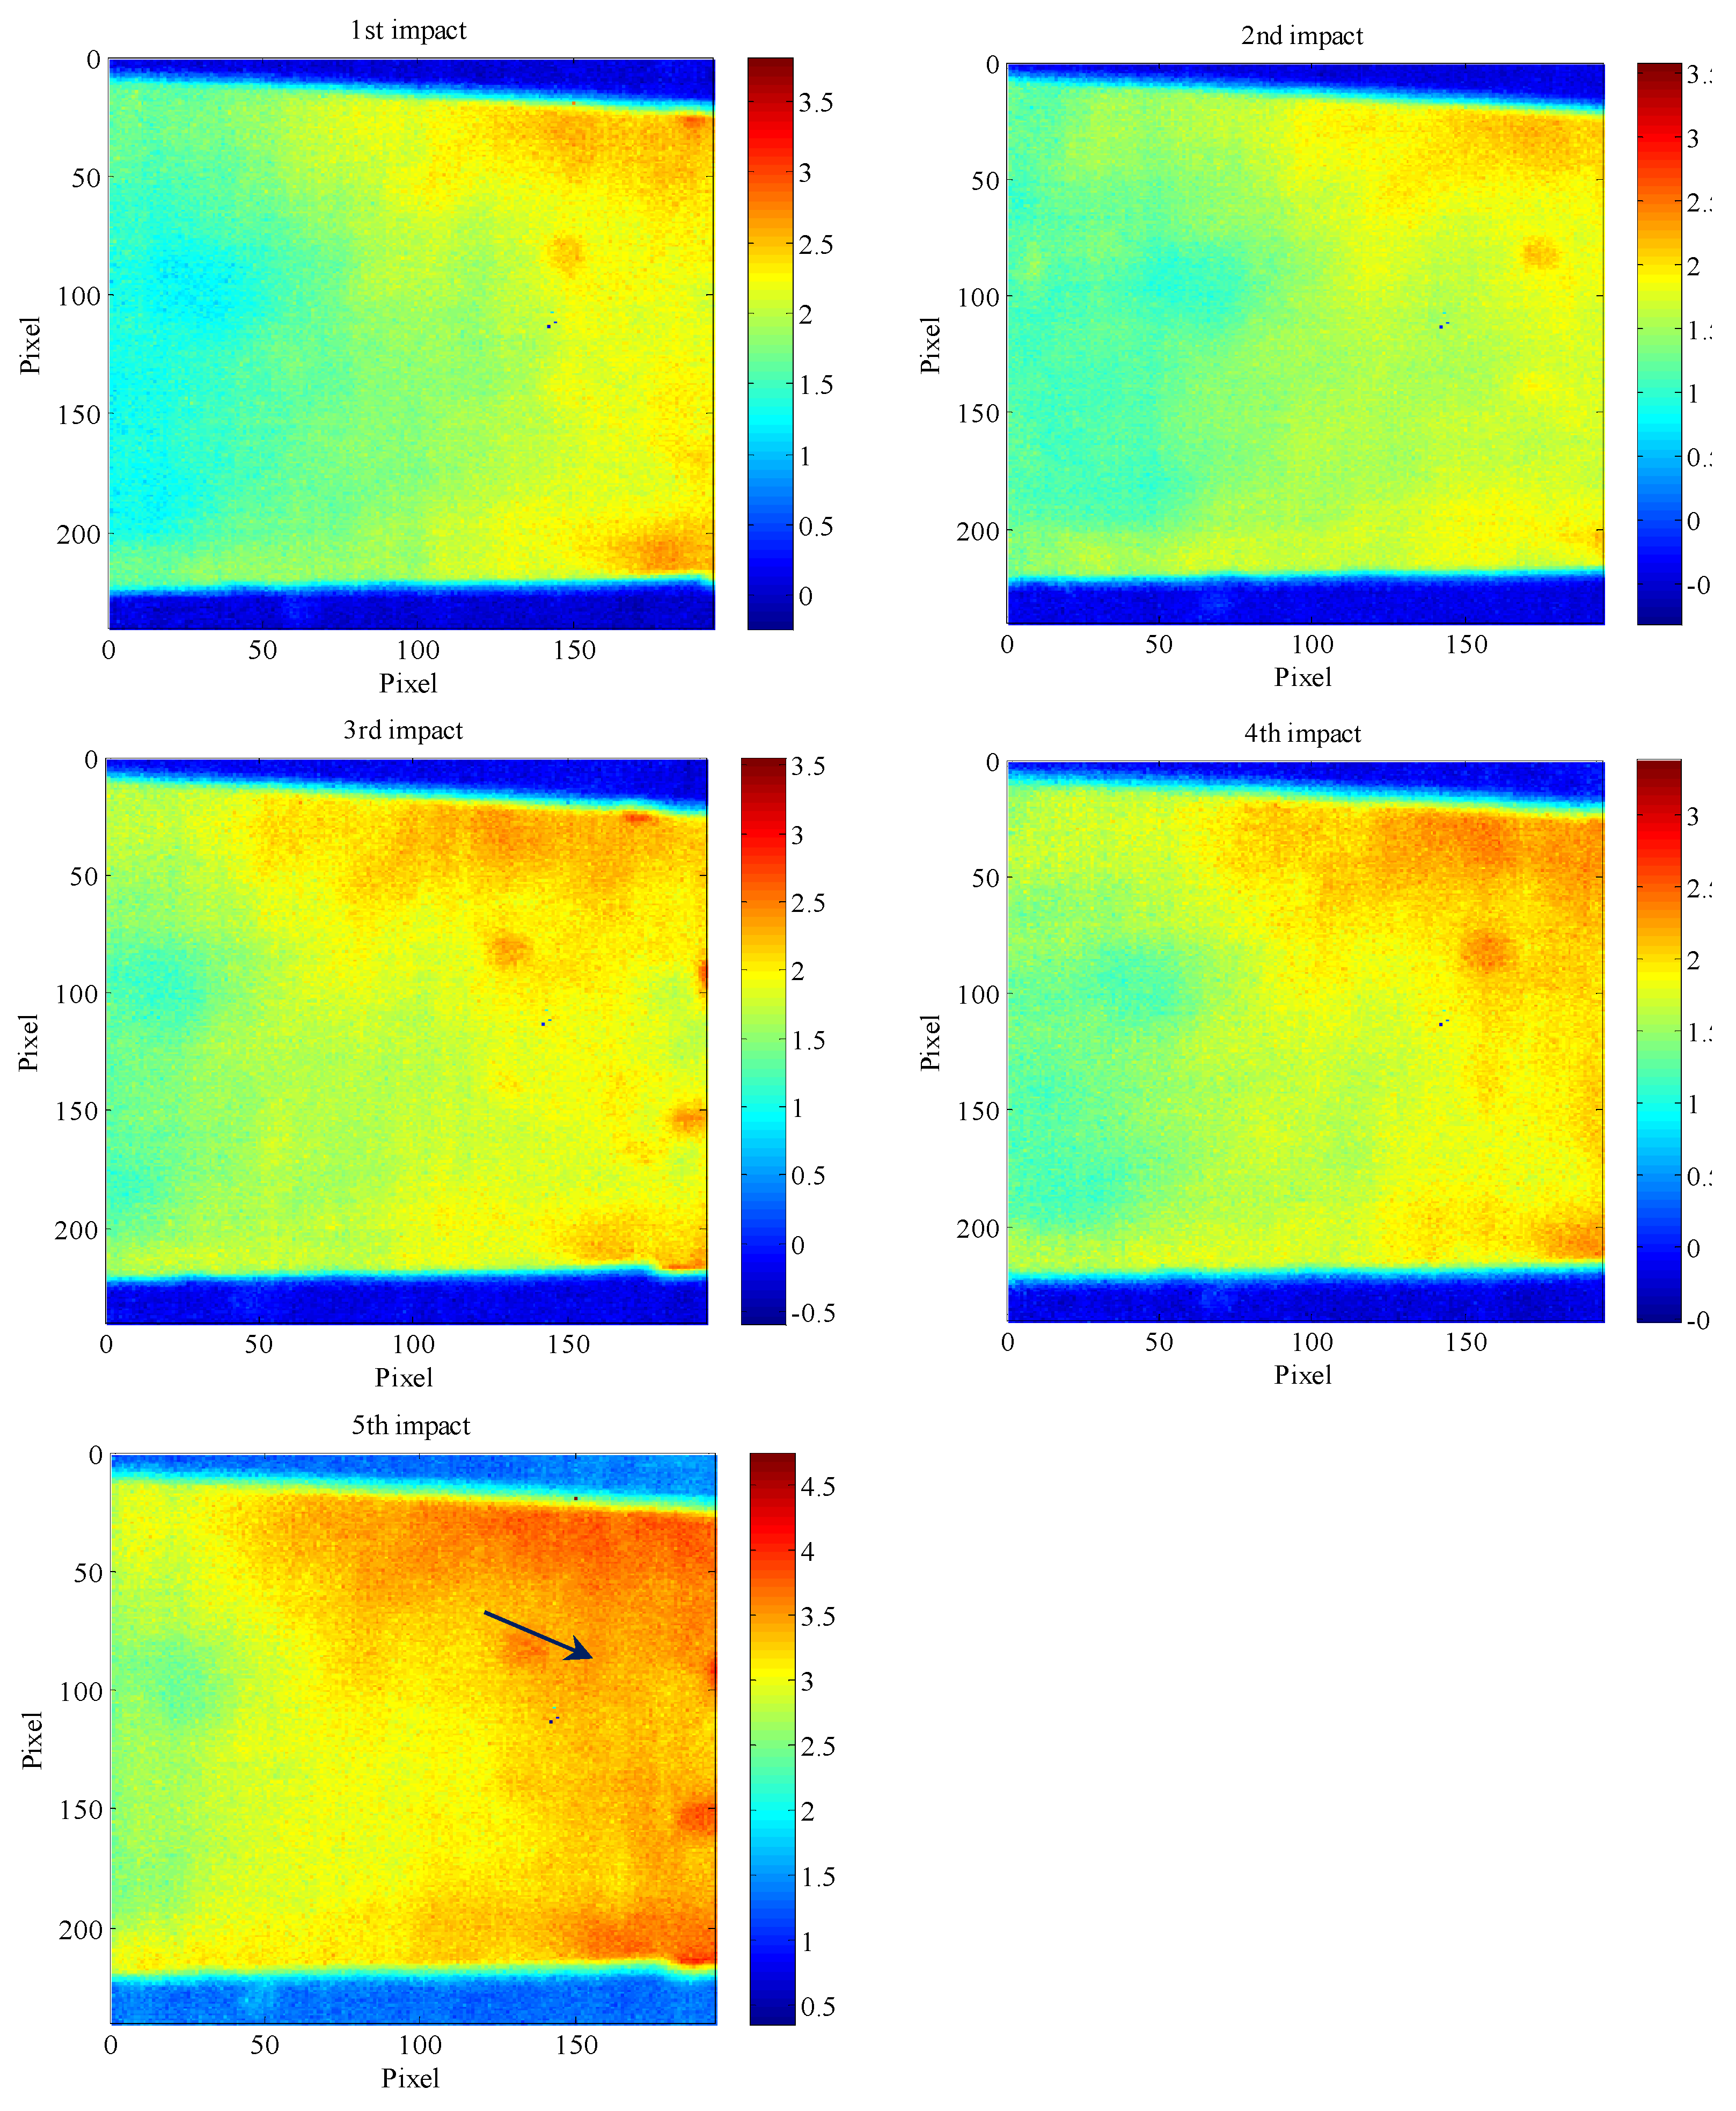
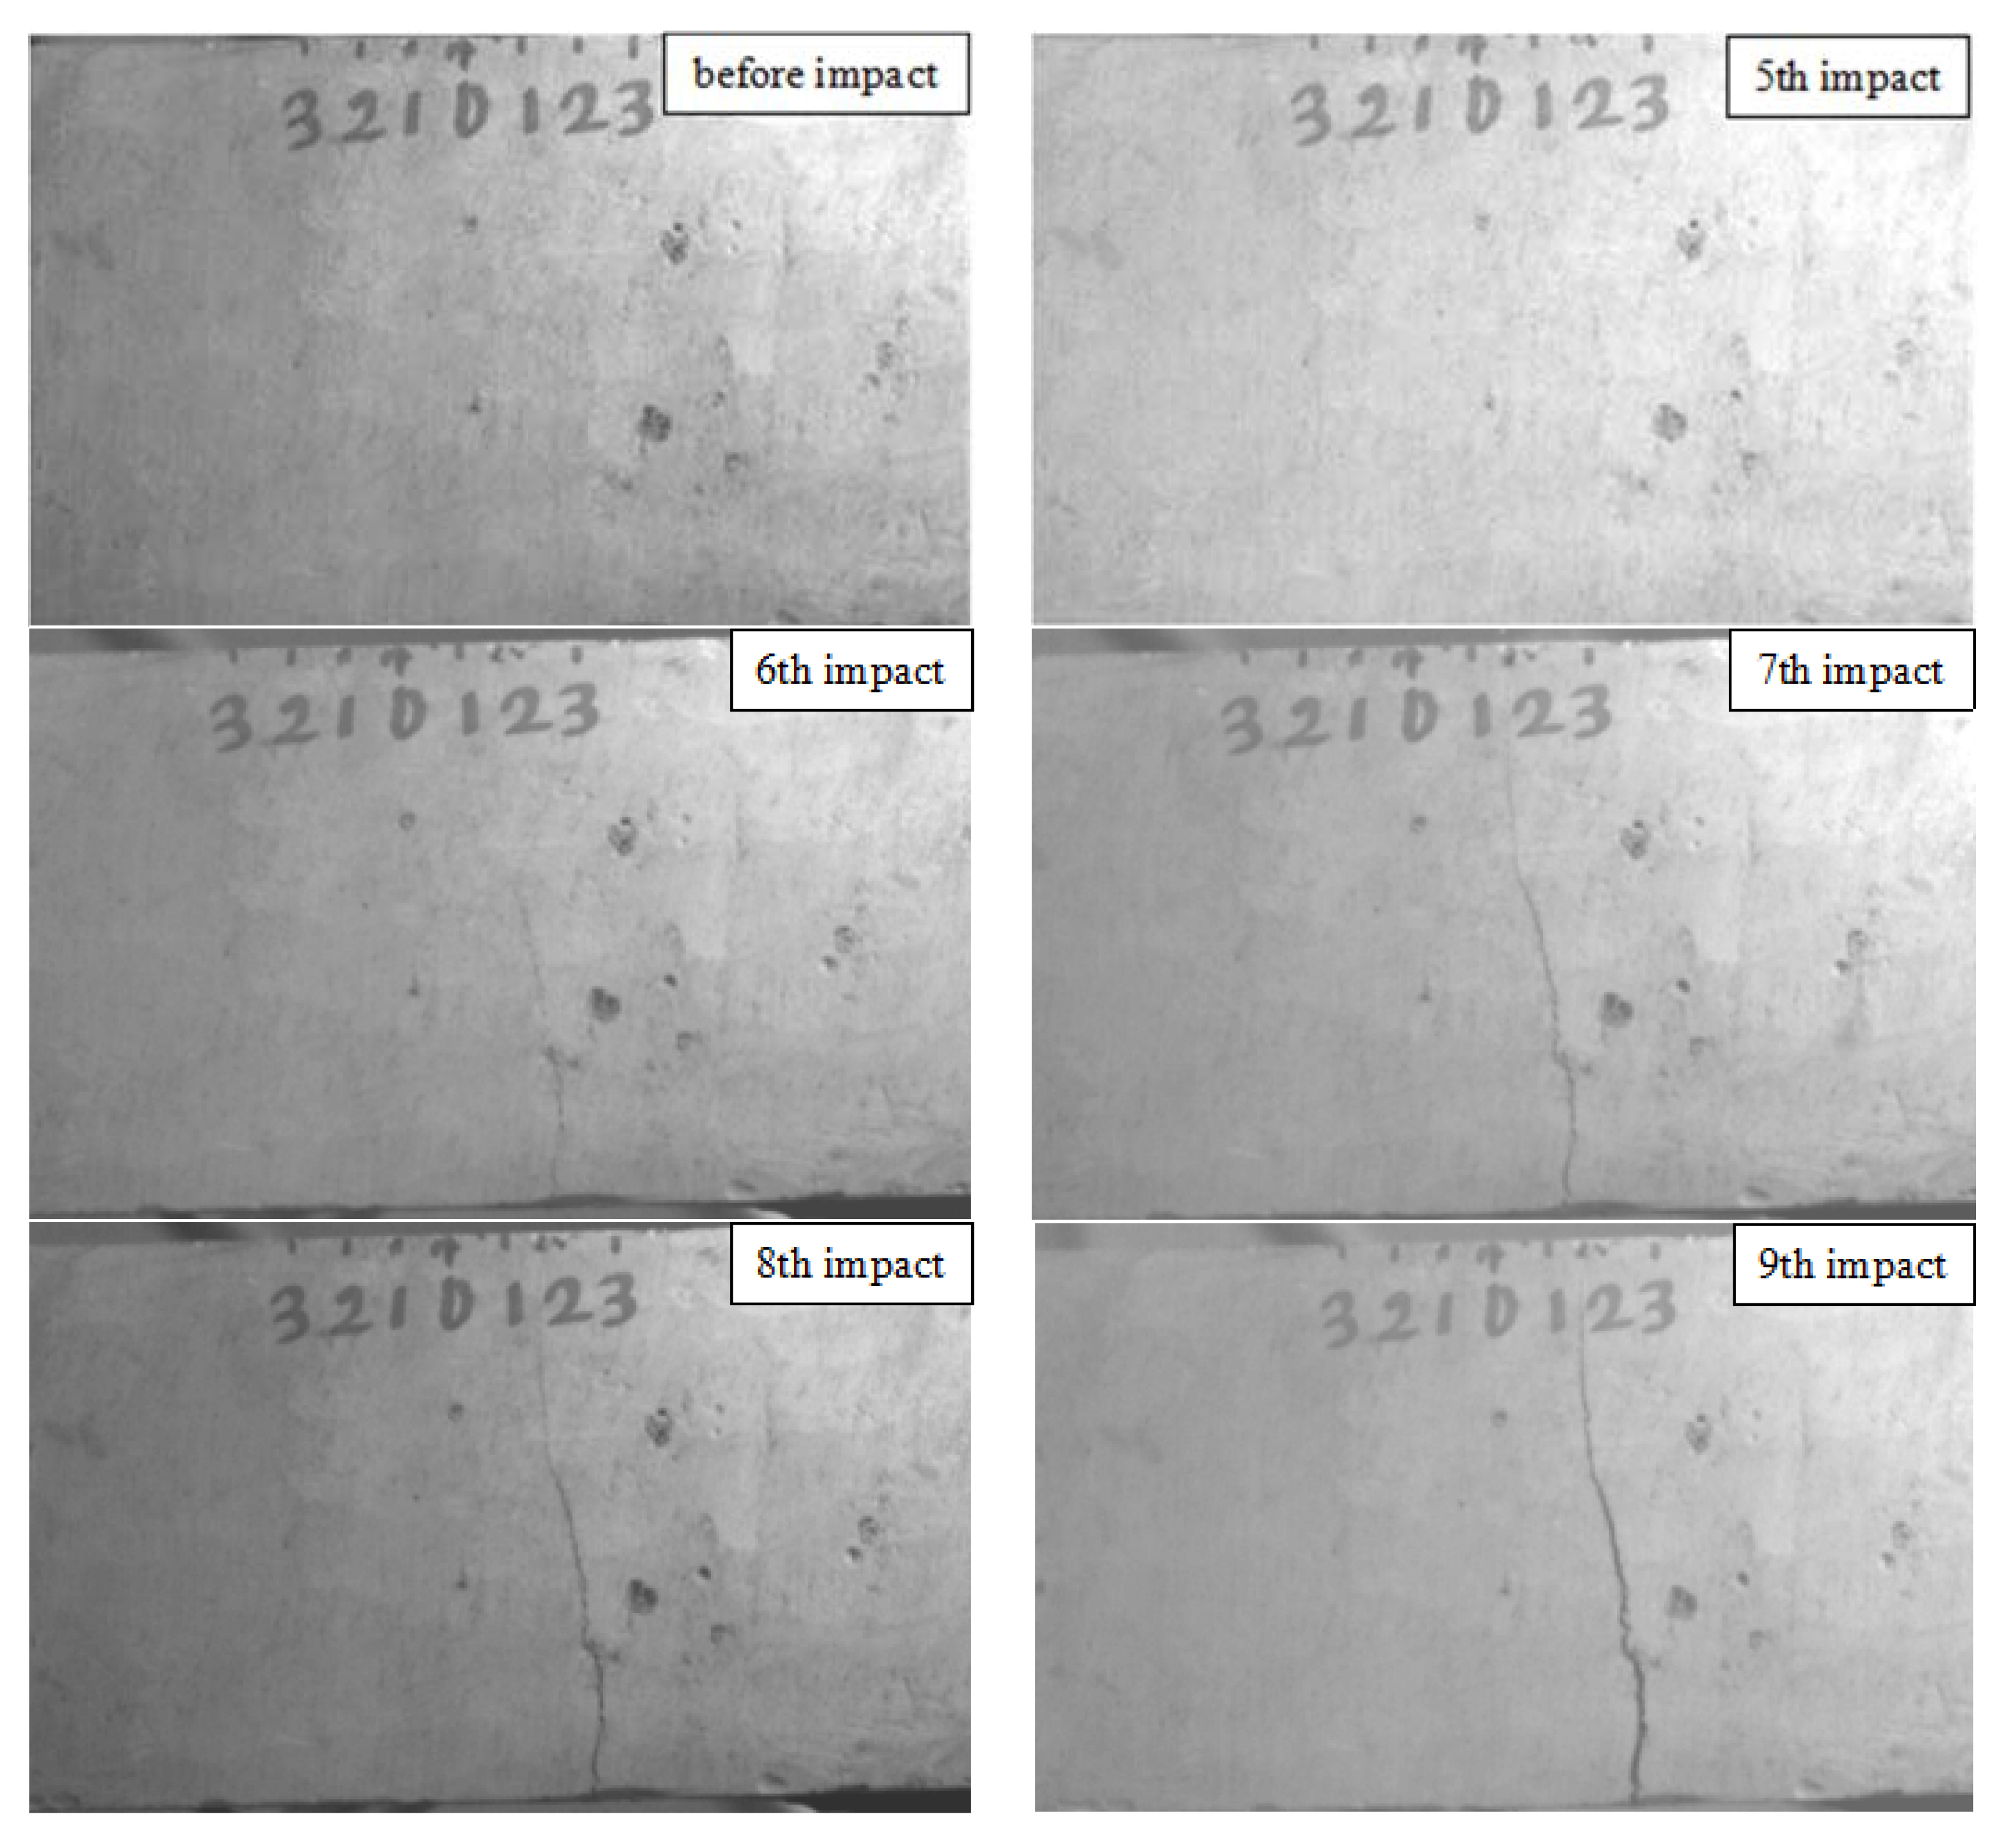
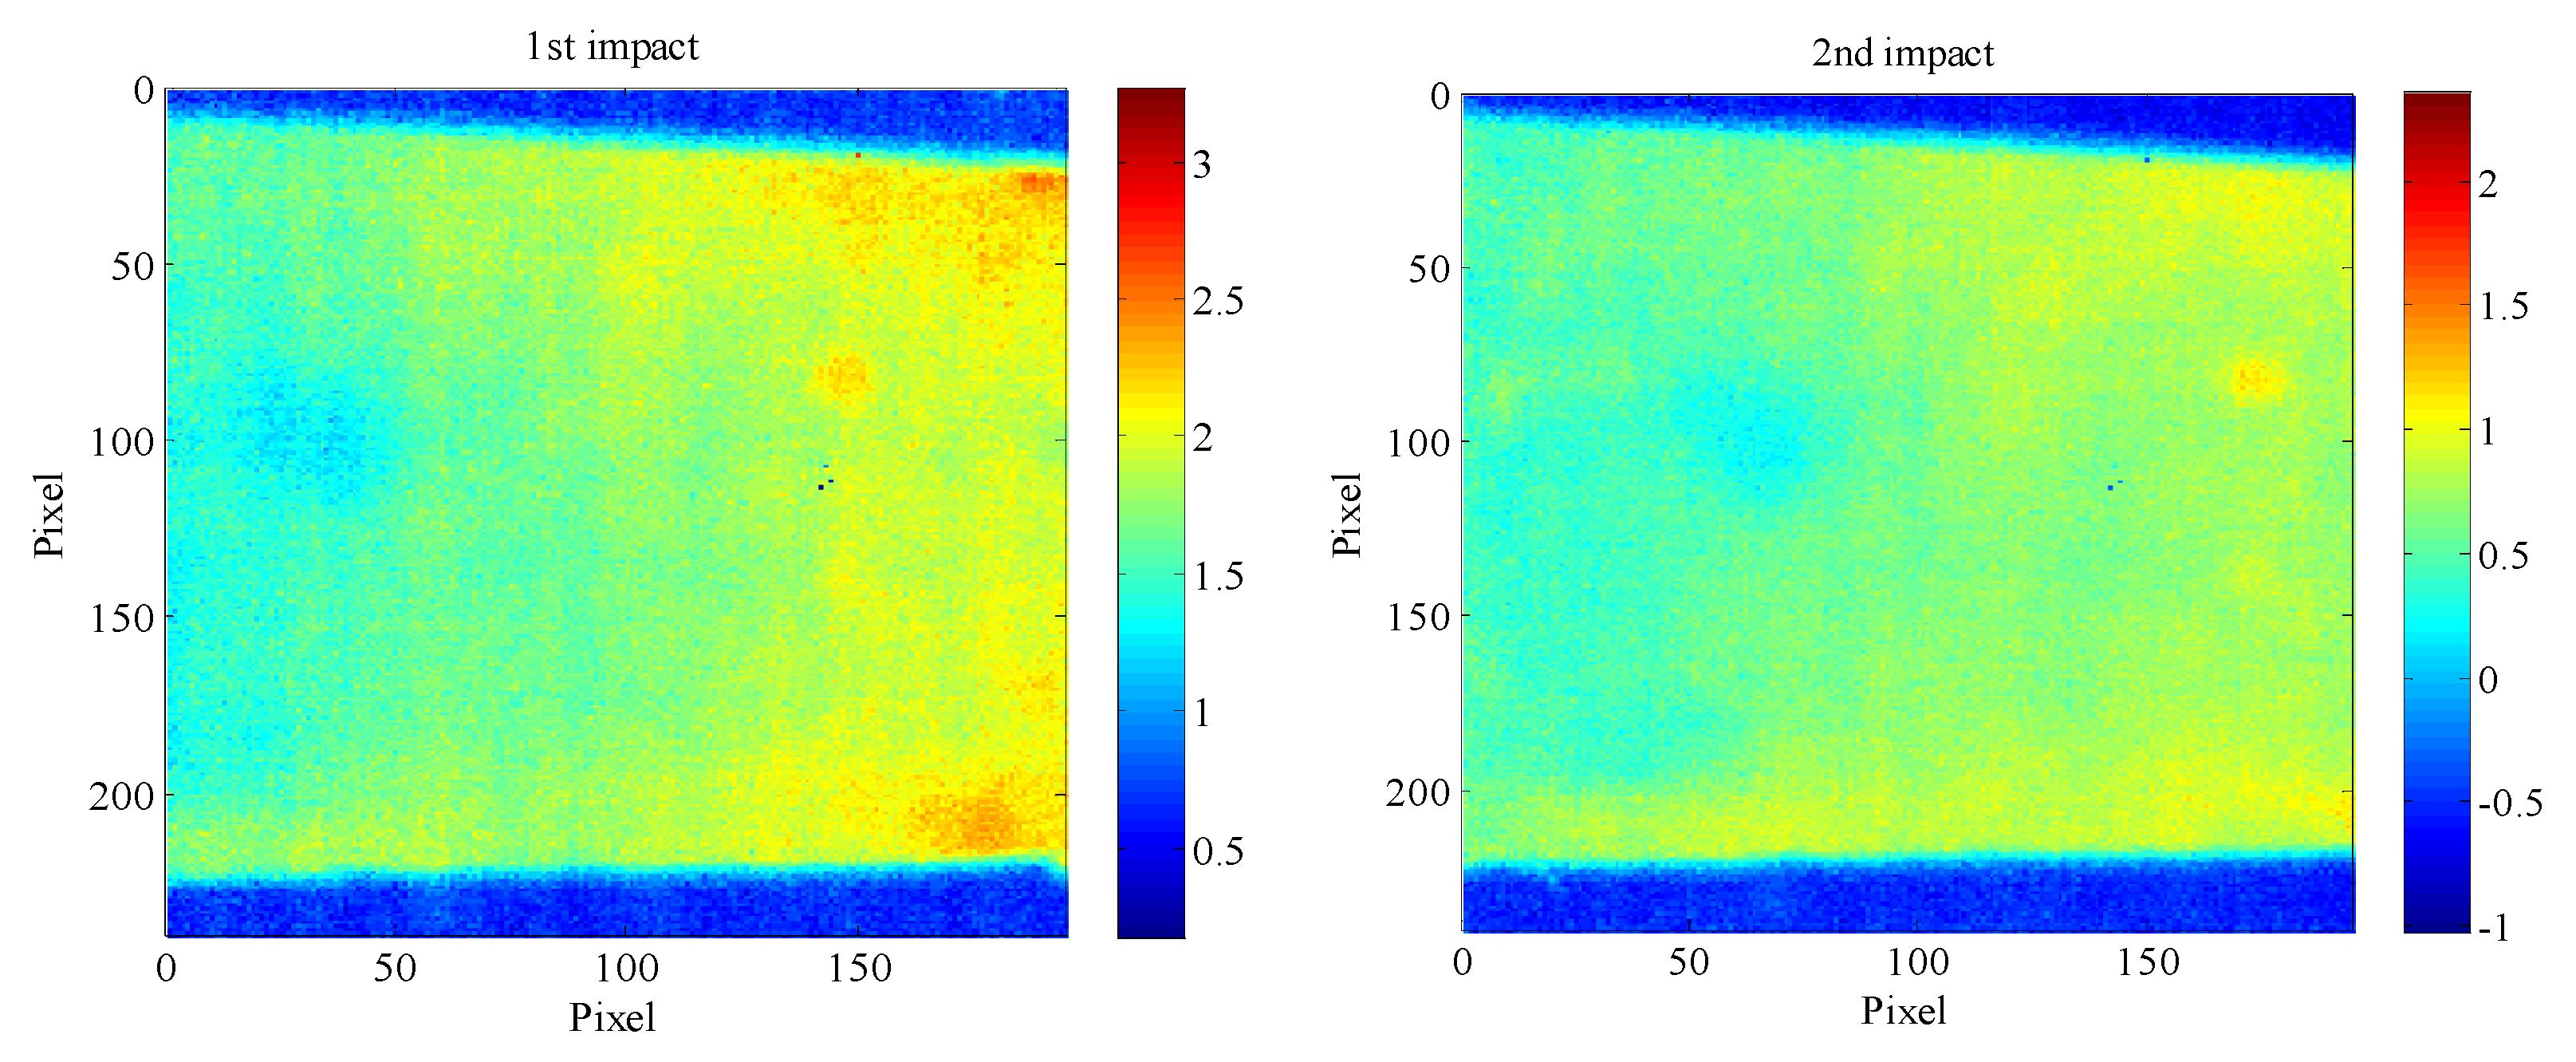
The proposed procedure to detect impact damage has been applied to a PVA-ECC beam specimen. It should be noted that a micro-crack began to occur on the specimen’s front side surface after the 6th impact. Then, as the impact tests continued, the micro-crack expanded and grew upwards. The thermal contrast images from the 1st to the 5th were shown in Figure 3. These figures represent the thermal signatures before the micro-crack appeared. As shown in Figure 3, the temperature differences of these first five impacts were similar. This is consistent with the result that no crack appears on the front side surface of the specimen. In the details, the temperature differences increased and concentrated gradually near the impact point of the specimen, especially after the 5th impact. It can be observed that there is a high temperature abnormal zone on the right side area of the image after the 5th impact, as the arrow indicates in Figure 3. After the 5th impact, the temperature contrast increased and the maximum value of the legend reached to 4.5 °C. A large area of high thermal contrast occurred on the right side area of the images. The thermal contrast in right side area was higher than that in the left side area. It means that the thermal energy was concentrated continuously on the right side area of the specimen after the 5th impact. Although we cannot find any micro-cracks on the surface until the 6th impact, we could speculate that there may be buried or subsurface cracks inside the specimen.
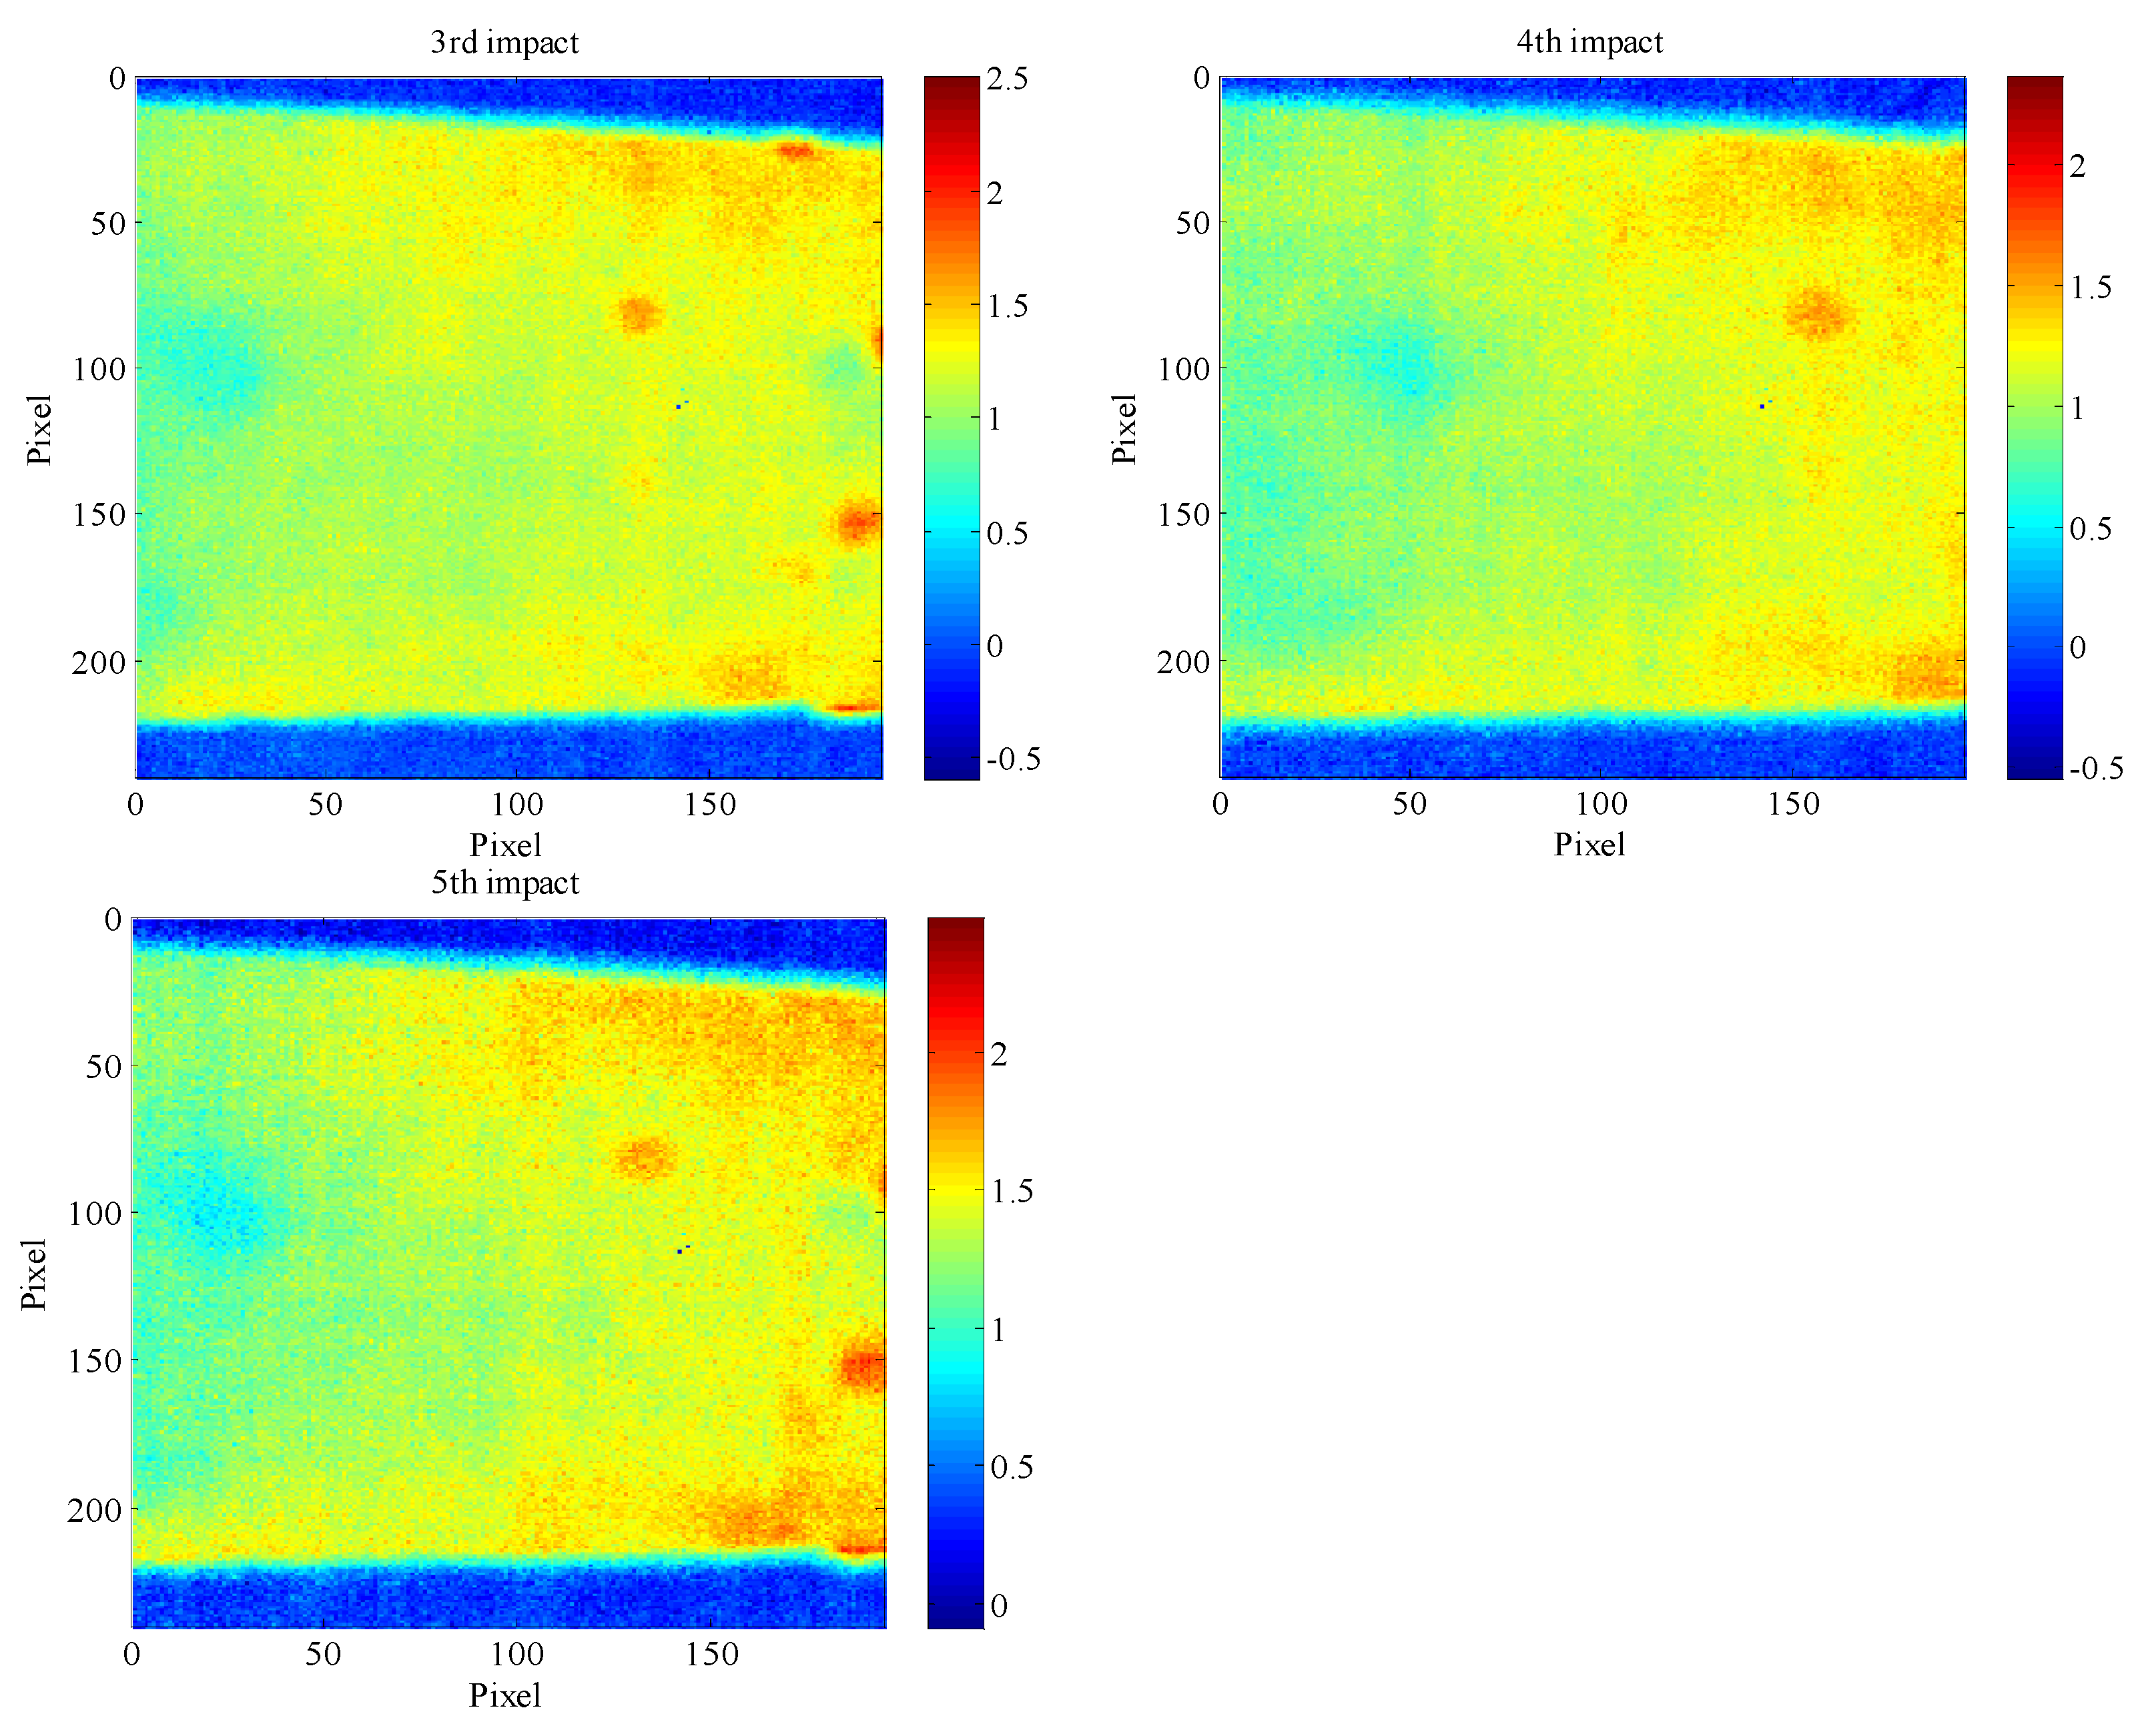
After the 6th impact, a vertical and narrow micro-crack appeared on the surface (Figure 4). From this point, the thermal contrast images were totally different from the first five, as shown in Figure 5. All the four thermal contrasts reached 4.5 °C and the temperature distribution was completely different, compared with the ones in Figure 3. It seems that the original high temperature zone on the right side area of the specimen suddenly cooled. The high thermal contrast zone was replaced by low thermal contrast zone. That may be interpreted by the explanation that there was a sudden energy release when the crack appeared on the surface. As a composite material, the PVA-ECC beam is comprised of materials with disparate thermal expansion coefficients. It will develop residual thermal stresses when subjected to a uniform thermal excitation [58]. If the beam develops cracks, the residual and mechanical stresses will change to accommodate the fracture surfaces. The redistribution of residual and mechanical stresses releases strain energy that can drive crack propagation—the energy release for crack growth [59,60]. As the rectangular box indicates in Figure 5, an elongated abnormal zone corresponding to the cracks occurred. As the impact continued, the crack expanded upwards and the abnormal temperature zone became longer and wider, which is easier to observe. In general, the wider the crack width, the quicker the maximum temperature difference is reached. The temperature difference increases when the area of crack increases.
4.2. Cool-down Period Analysis
Compared with the warm-up period, the cool-down period has roughly the same thermal contrast in general, as shown in Figure 6. However, there are two obvious differences. On the one hand, the values of the thermal contrast images were less than that in the warm-up period. The largest value occurred after the 1st impact and it was 3 °C. From the 1st to the 5th impact, the thermal contrast changed slightly by 2 °C. On the other hand, we can hardly find a concentrated thermal area in the middle of the images. As can be seen in Figure 7, after the 6th impact, thermal contrast for the last four impacts was totally different from the one after the first five impacts. The difference is that the thermal contrast is lower than that in the warm-up period. There is less interference of thermal contrast in the cool-down period. The elongated abnormal zone corresponding to the cracks can be observed more clearly. In summary, both the thermal contrast in warm-up and cool-down periods effectively detected the impact-induced crack. The signals in the warm-up period are much more sensitive than those in the cool-down period.
4.3. Temperature Variation Analysis
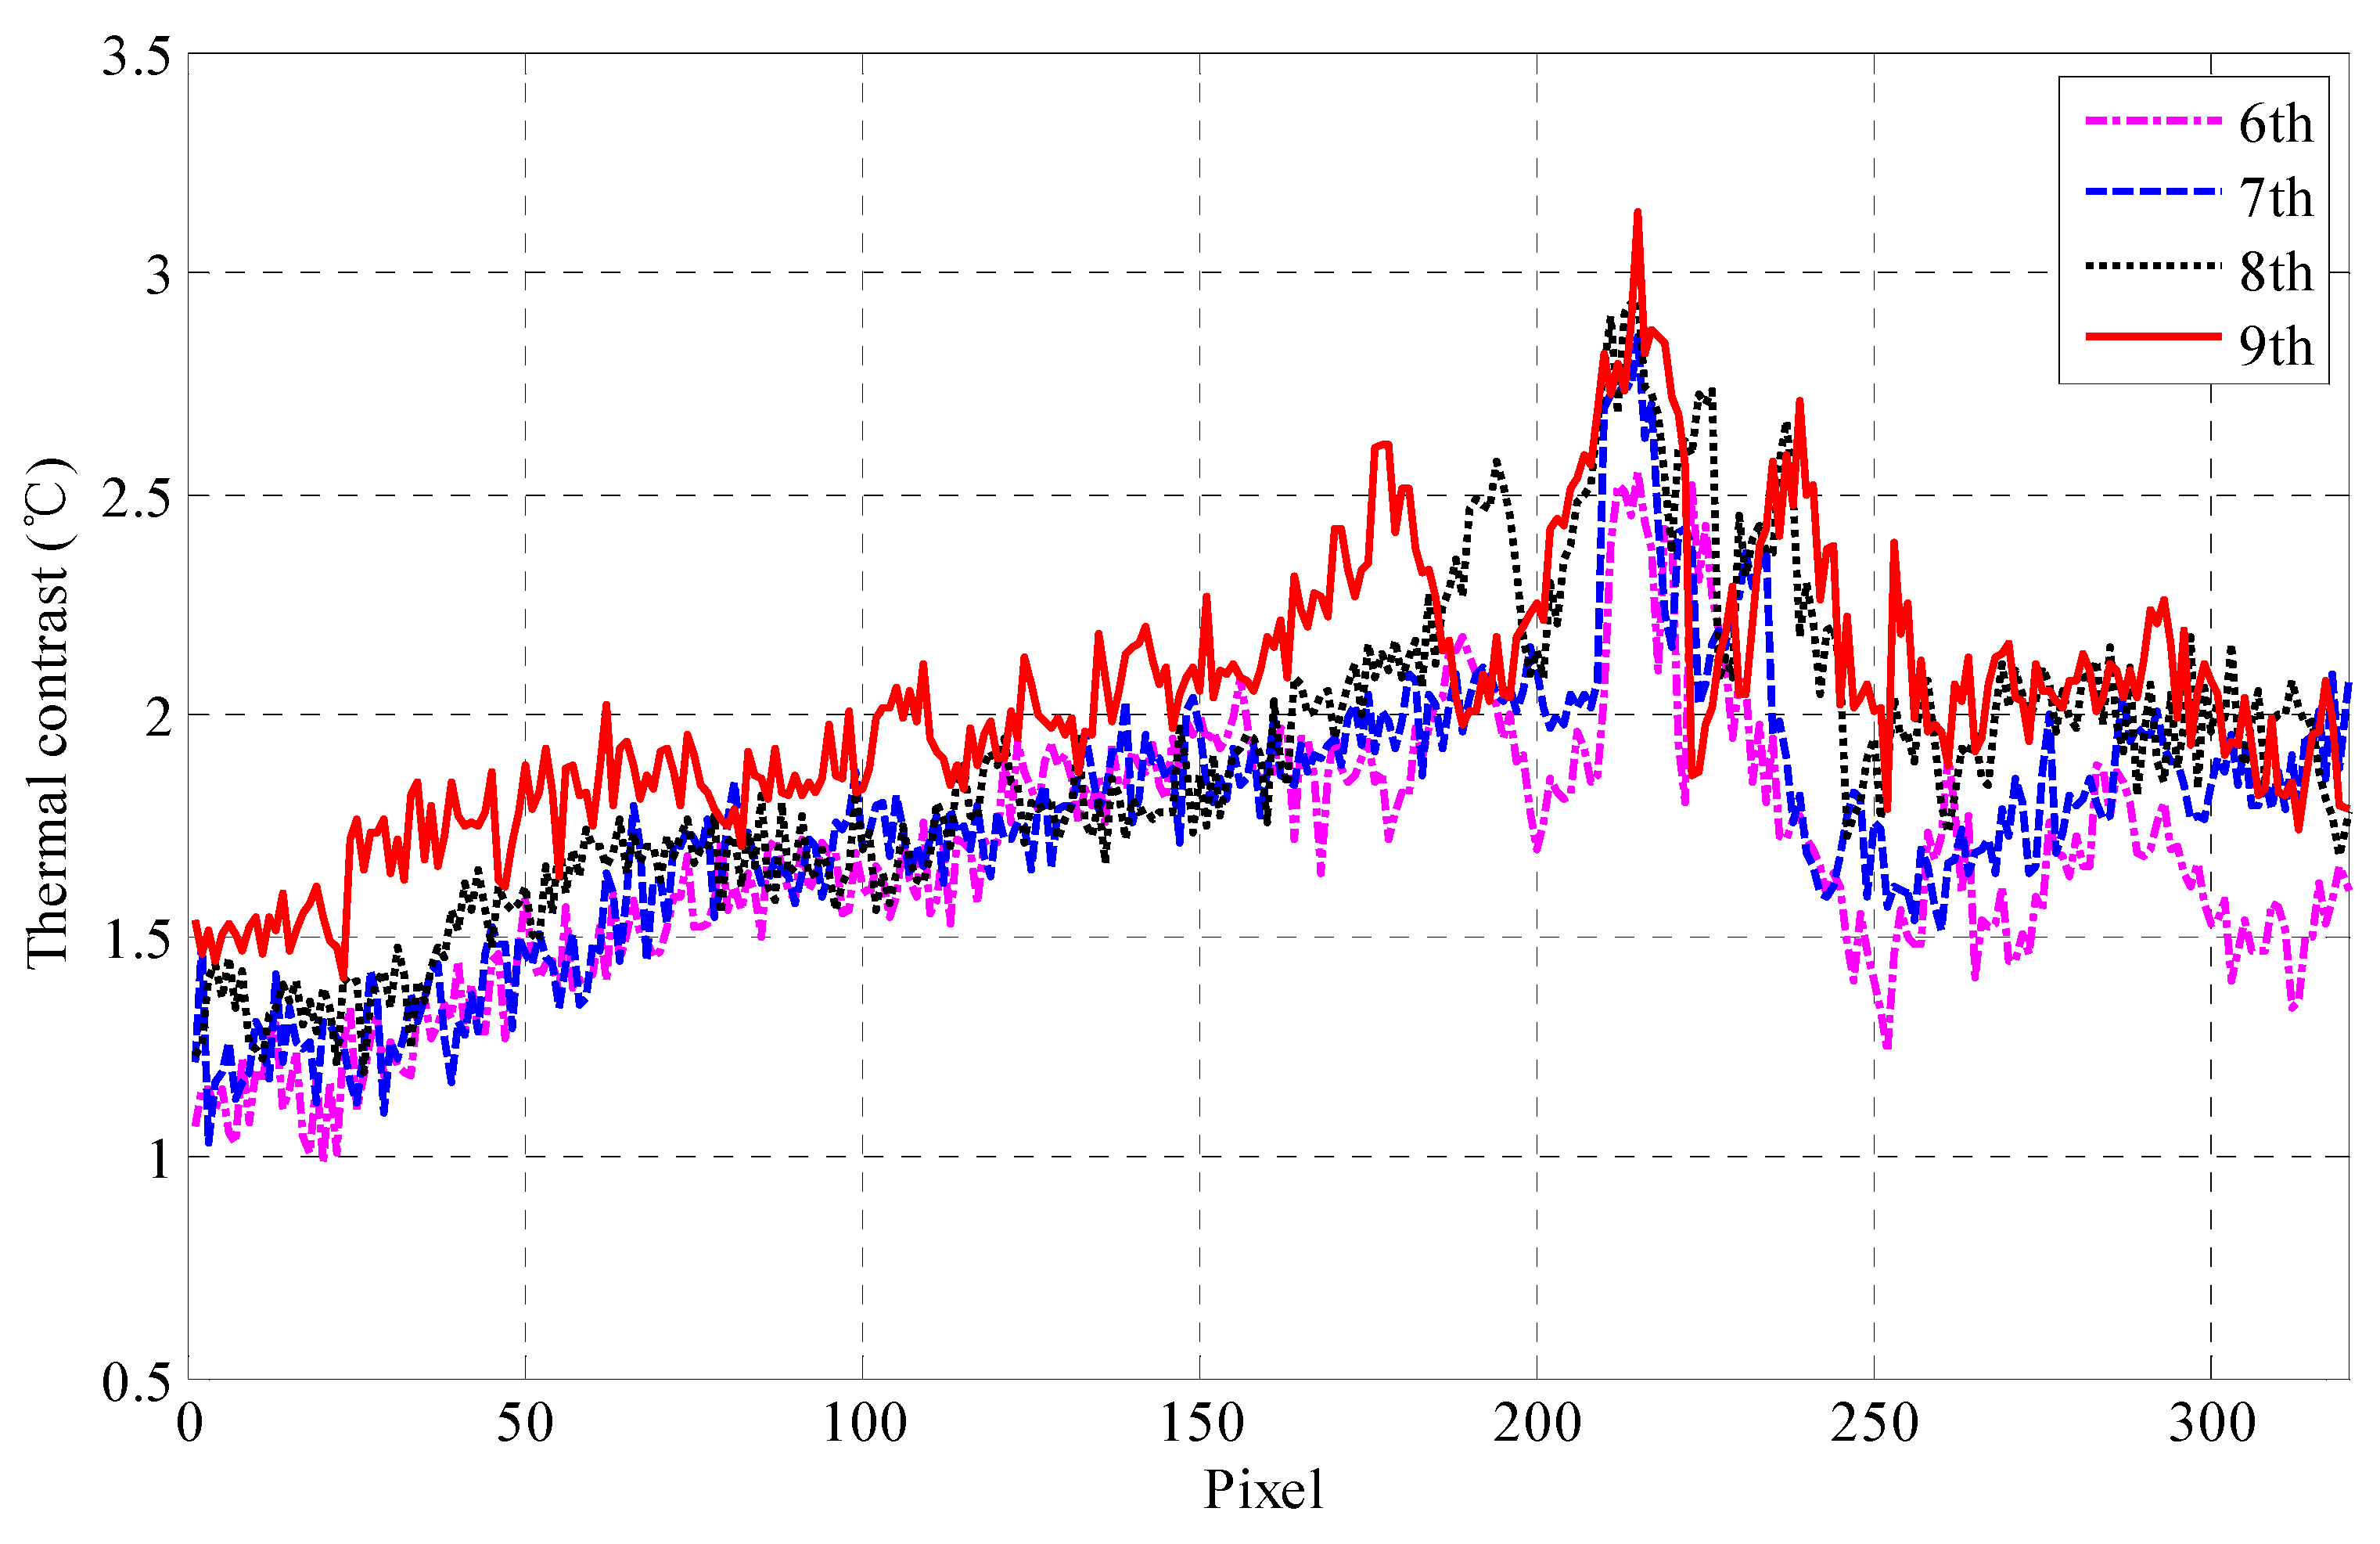
To provide quantitative analysis of the results, the thermal contrast variation profile was analyzed. The computed profile perpendicular to the extension direction of the crack along the x axis was shown in Figure 8, which revealed that the temperature variation gradually increased in the same profile line from the 6th to the 9th impact. It can be interpreted as the impact-induced cracks stretching and broadening as the impact continues. The thermal contrast was always the highest when it comes to the cracks. In this figure, we can easily find that the crack is near the 210 pixel on the x axis, where the temperature was higher than that of the nearby areas. We can also locate the position and even quantify the width of the crack from this figure. The width of the crack after the 9th impact was the most obvious. In Figure 8, the length of the highest temperature section was also the widest. These results agreed well with the actual crack width.
To compare the temperature variations for different locations in the warm-up and cool-down periods, the temperatures over time in the defective area and nearby intact area after the 9th impact were computed, as shown in Figure 9. The temperatures show an overall increasing trend, and a sharp increase was observed near the 24th min. The possible explanation is that the defective area is filled with air and slag, which have different density, heat capacity and heat conductivity. Therefore, it shows the higher temperature curve in the warm-up and cool-down periods. In summary, the temperature on the defective area was higher than that on the intact area.
The occurrence and evolution of impact-induced crack was monitored in real time by detecting the thermal responses under external heat stimulus. For both the warm-up period with the cool-down period, temperature variation analysis showed an abrupt temperature change that corresponded to the crack or damage. Under the same heat stimulus, the maximum of temperature variation depends on both the depth and area of the subsurface defects. Therefore, temperature variation analysis using the data from the infrared thermography has the capability to determine the occurrence of an impact-induced damage.
5. Discussion and Conclusions
Through experimental investigation, we have demonstrated that the infrared thermography technique was feasible and effective in detecting impact damage in a PVA-ECC beam. An external heat stimulus was adopted to induce relevant thermal contrasts between defective and intact areas on the specimen. It was found that the thermal contrasts in both the warm-up and cool-down period can be used to effectively detect the impact-induced crack. On the monitored surface, the thermal contrast images were totally different before and after the crack initiation. In addition, the evolution of the impact damage can be qualitatively determined by the temperature variation analysis, and it was consistent with warm-up and cool-down period results. A key finding of this study is that it was possible to obtain the width of the crack, even to predict the expansion of the cracks, by analyzing the thermal contrast images. In conclusion, the infrared thermography-based method is feasible and effective in detecting impact-induced damage in a PVA-ECC structure.
The success of infrared thermography in dealing with damage arising in service depends on the thermal properties of the material under test. It should be noted that the infrared images acquired from active thermography are greatly affected by many factors. For an in situ application, the signal detected may be affected by the non-uniform properties of the specimen surface. In addition, it may be affected by the ambient temperature variations. Moreover, more tests should be investigated to further verify the validity, reliability, and accuracy of the proposed approach. Thus additional building materials other than the PVA-ECC used in this study should be tested. Further calibrations are needed to deploy the proposed method to practical application. Despite this, the infrared thermography offers an additional advantage that it is a non-contact testing technique which allows for large areas to be examined and the data interpreted in a reasonably straightforward procedure. In future work, more studies on the structural impact behaviors, theoretical and experimental investigation will be performed.
Author Contributions
J.W. and B.Q. designed the experiment, performed the experiment and collected the data; C.X. analyzed the data; J.W. wrote the manuscript; F.R.H. made major revision of the manuscript.
Acknowledgments
This work was supported by China Earthquake Administration, Institute of Seismology Foundation (IS201726163). The first author would like to appreciate the support from China Scholarship Council and China Earthquake Administration.
Conflicts of Interest
The authors declare no conflict of interest.
References
- Li, V.C. On engineered cementitious composites (ECC) a review of the material and its applications. J. Adv. Concr. Technol. 2003, 1, 215–230. [Google Scholar] [CrossRef]
- Lepech, M.D.; Li, V.C. Application of ecc for bridge deck link slabs. Mater. Struct. 2009, 42, 1185–1195. [Google Scholar] [CrossRef]
- Li, V.C. Engineered cementitious composites (ECC) material, structural, and durability performance. In Concrete Construction Engineering Handbook; CRC Press: Boca Raton, FL, USA, 2008; Volume 24, pp. 4–15. [Google Scholar]
- Lepech, M.D.; Li, V.C. Large-scale processing of engineered cementitious composites. ACI Mater. J. 2008, 105, 358–366. [Google Scholar]
- Larsen, O.D. Ship Collision with Bridges: The Interaction between Vessel Traffic and Bridge Structures; IABSE: Zurich, Switzerland, 1993. [Google Scholar]
- Barré, S.; Benzeggagh, M. On the use of acoustic emission to investigate damage mechanisms in glass-fibre-reinforced polypropylene. Compos. Sci. Technol. 1994, 52, 369–376. [Google Scholar] [CrossRef]
- Santulli, C. Post-impact damage characterisation on natural fibre reinforced composites using acoustic emission. NDT E Int. 2001, 34, 531–536. [Google Scholar] [CrossRef]
- Martini, A.; Troncossi, M.; Rivola, A. Leak detection in water-filled small-diameter polyethylene pipes by means of acoustic emission measurements. Appl. Sci. 2017, 7, 2. [Google Scholar] [CrossRef]
- Song, G.; Li, W.; Wang, B.; Ho, S. A review of rock bolt monitoring using smart sensors. Sensors 2017, 17, 776. [Google Scholar] [CrossRef] [PubMed]
- Li, W.; Ho, S.C.M.; Patil, D.; Song, G. Acoustic emission monitoring and finite element analysis of debonding in fiber-reinforced polymer rebar reinforced concrete. Struct. Health Monit. 2016, 16, 674–681. [Google Scholar] [CrossRef]
- Xu, C.; Gong, P.; Xie, J.; Shi, H.; Chen, G.; Song, G. An acoustic emission based multi-level approach to buried gas pipeline leakage localization. J. Loss Prev. Process Ind. 2016, 44, 397–404. [Google Scholar] [CrossRef]
- Li, W.; Xu, C.; Ho, S.; Wang, B.; Song, G. Monitoring concrete deterioration due to reinforcement corrosion by integrating acoustic emission and fbg strain measurements. Sensors 2017, 17, 657. [Google Scholar] [CrossRef] [PubMed]
- Li, W.; Kong, Q.; Ho, S.C.M.; Lim, I.; Mo, Y.L.; Song, G.; Gangbing, S. Feasibility study of using smart aggregates as embedded acoustic emission sensors for health monitoring of concrete structures. Smart Mater. Struct. 2016, 25. [Google Scholar] [CrossRef]
- Angelidis, N.; Irving, P. Detection of impact damage in cfrp laminates by means of electrical potential techniques. Compos. Sci. Technol. 2007, 67, 594–604. [Google Scholar] [CrossRef]
- Savin, A.; Bruma, A.; Steigmann, R.; Iftimie, N.; Faktorova, D. Enhancement of spatial resolution using a metamaterial sensor in nondestructive evaluation. Appl. Sci. 2015, 5, 1412–1430. [Google Scholar] [CrossRef]
- Aymerich, F.; Meili, S. Ultrasonic evaluation of matrix damage in impacted composite laminates. Compos. Part B 2000, 31, 1–6. [Google Scholar] [CrossRef]
- Shen, Q.; Omar, M.; Dongri, S. Ultrasonic nde techniques for impact damage inspection on cfrp laminates. J. Mater. Sci. Res. 2012, 1. [Google Scholar] [CrossRef]
- Kersemans, M.; Martens, A.; Degrieck, J.; Van Den Abeele, K.; Delrue, S.; Pyl, L.; Zastavnik, F.; Sol, H.; Van Paepegem, W. The ultrasonic polar scan for composite characterization and damage assessment: Past, present and future. Appl. Sci. 2016, 6. [Google Scholar] [CrossRef]
- Sohn, M.-S.; Hu, X.Z.; Kim, J.K. Fractography of Damaged Carbon Fiber/Epoxy Composites after Low-Velocity Impact. In Key Engineering Materials; Scientific.Net: Zurich, Switzerland, 2000. [Google Scholar]
- Kaloop, M.R.; Hu, J.W.; Elbeltagi, E. Evaluation of high-speed railway bridges based on a nondestructive monitoring system. Appl. Sci. 2016, 6, 24. [Google Scholar] [CrossRef]
- Lei, H.; Pitt, W.G.; McGrath, L.K.; Ho, C.K. Resistivity measurements of carbon–polymer composites in chemical sensors: Impact of carbon concentration and geometry. Sens. Actuators B 2004, 101, 122–132. [Google Scholar] [CrossRef]
- Qi, B.; Kong, Q.; Qian, H.; Patil, D.; Lim, I.; Li, M.; Liu, D.; Song, G. Study of impact damage in pva-ecc beam under low-velocity impact loading using piezoceramic transducers and pvdf thin-film transducers. Sensors 2018, 18, 671. [Google Scholar] [CrossRef] [PubMed]
- Na, W.; Baek, J. Impedance-based non-destructive testing method combined with unmanned aerial vehicle for structural health monitoring of civil infrastructures. Appl. Sci. 2017, 7, 15. [Google Scholar] [CrossRef]
- Xu, K.; Kong, Q.; Chen, S.; Song, G. Early determination of the presence of low strength concrete in reinforced concrete beam-column joints using piezoceramic-based transducers. IEEE Sens. J. 2017, 17, 3244–3250. [Google Scholar] [CrossRef]
- Feng, Q.; Kong, Q.; Song, G. Damage detection of concrete piles subject to typical damage types based on stress wave measurement using embedded smart aggregates transducers. Measurement 2016, 88, 345–352. [Google Scholar] [CrossRef]
- Feng, Q.; Xiao, H.; Kong, Q.; Liang, Y.; Song, G. Damage detection of concrete piles subject to typical damages using piezoceramic based passive sensing approach. J. Vibroeng. 2016, 18, 801–812. [Google Scholar]
- Li, W.; Ho, S.C.M.; Song, G. Corrosion detection of steel reinforced concrete using combined carbon fiber and fiber bragg grating active thermal probe. Smart Mater. Struct. 2016, 25. [Google Scholar] [CrossRef]
- Seyed Mohammad, P.; Siu Chun Michael, H.; Qingzhao, K.; Reza, M.; Gangbing, S. Real time bolt preload monitoring using piezoceramic transducers and time reversal technique—A numerical study with experimental verification. Smart Mater. Struct. 2016, 25. [Google Scholar] [CrossRef]
- Zeng, L.; Parvasi, S.M.; Kong, Q.; Huo, L.; Li, M.; Song, G. Bond slip detection of concrete-encased composite structure using shear wave based active sensing approach. Smart Mater. Struct. 2015, 24. [Google Scholar] [CrossRef]
- Feng, Q.; Kong, Q.; Huo, L.; Song, G. Crack detection and leakage monitoring on reinforced concrete pipe. Smart Mater. Struct. 2015, 24. [Google Scholar] [CrossRef]
- Meola, C.; Carlomagno, G.M.; Ricci, F.; Lopresto, V.; Caprino, G. Investigation of impact damage in composites with infrared thermography. In Proceedings of the 6th NDT in Progress, Prague, Czech Republic, 10–12 October 2011; Mazal, P., Ed.; 2011; pp. 175–182. [Google Scholar]
- Ball, R.J.; Almond, D.P. The detection and measurement of impact damage in thick carbon fibre reinforced laminates by transient thermography. NDT E Int. 1998, 31, 165–173. [Google Scholar] [CrossRef] [Green Version]
- Meola, C.; Carlomagno, G.M. Impact damage in gfrp: New insights with infrared thermography. Compos. Part A 2010, 41, 1839–1847. [Google Scholar] [CrossRef]
- Xu, C.; Gong, X.; Zhang, W.; Chen, G. An investigation on eddy current pulsed thermography to detect surface cracks on the tungsten carbide matrix of polycrystalline diamond compact bit. Appl. Sci. 2017, 7, 429. [Google Scholar] [CrossRef]
- Xie, J.; Xu, C.; Gong, X.; Huang, W.; Chen, G. Sizing subsurface defects in metallic plates by square pulse thermography using an oriented gradient map. Appl. Sci. 2016, 6, 389. [Google Scholar] [CrossRef]
- Kong, Q.; Robert, R.; Silva, P.; Mo, Y. Cyclic crack monitoring of a reinforced concrete column under simulated pseudo-dynamic loading using piezoceramic-based smart aggregates. Appl. Sci. 2016, 6, 341. [Google Scholar] [CrossRef]
- Xu, C.; Xie, J.; Zhang, W.; Kong, Q.; Chen, G.; Song, G. Experimental investigation on the detection of multiple surface cracks using vibrothermography with a low-power piezoceramic actuator. Sensors 2017, 17, 2705. [Google Scholar] [CrossRef] [PubMed]
- Santos, M.; Santos, J.; Amaro, A.; Neto, M. Low velocity impact damage evaluation in fiber glass composite plates using pzt sensors. Compos. Part B 2013, 55, 269–276. [Google Scholar] [CrossRef] [Green Version]
- Song, G.; Gu, H.; Mo, Y.; Hsu, T.; Dhonde, H. Concrete structural health monitoring using embedded piezoceramic transducers. Smart Mater. Struct. 2007, 16. [Google Scholar] [CrossRef]
- Jeon, B.S.; Lee, J.J.; Kim, J.K.; Huh, J.S. Low velocity impact and delamination buckling behavior of composite laminates with embedded optical fibers. Smart Mater. Struct. 1999, 8. [Google Scholar] [CrossRef]
- Shih, J.; Mal, A. Acoustic emission from impact damage in cross-ply composites. Struct. Health Monit. 2000, 1, 209–217. [Google Scholar]
- Meola, C.; Carlomagno, G.M. Recent advances in the use of infrared thermography. Meas. Sci. Technol. 2004, 15. [Google Scholar] [CrossRef]
- Serrano-Cuerda, J.; Fernández-Caballero, A.; López, M. Selection of a visible-light vs. Thermal infrared sensor in dynamic environments based on confidence measures. Appl. Sci. 2014, 4, 331–350. [Google Scholar] [CrossRef]
- Li, Y.; Zhang, W.; Yang, Z.-W.; Zhang, J.-Y.; Tao, S.-J. Low-velocity impact damage characterization of carbon fiber reinforced polymer (CFRP) using infrared thermography. Infrared Phys. Technol. 2016, 76, 91–102. [Google Scholar] [CrossRef]
- Holland, S.D.; Reusser, R.S. Material evaluation by infrared thermography. Annu. Rev. Mater. Res. 2016, 46, 287–330. [Google Scholar] [CrossRef]
- Kylili, A.; Fokaides, P.A.; Christou, P.; Kalogirou, S.A. Infrared thermography (IRT) applications for building diagnostics: A review. Appl. Energy 2014, 134, 531–549. [Google Scholar] [CrossRef]
- Usamentiaga, R.; Venegas, P.; Guerediaga, J.; Vega, L.; López, I. Automatic detection of impact damage in carbon fiber composites using active thermography. Infrared Phys. Technol. 2013, 58, 36–46. [Google Scholar] [CrossRef]
- Hung, Y.; Chen, Y.S.; Ng, S.; Liu, L.; Huang, Y.; Luk, B.; Ip, R.; Wu, C.; Chung, P. Review and comparison of shearography and active thermography for nondestructive evaluation. Mater. Sci. Eng. 2009, 64, 73–112. [Google Scholar] [CrossRef]
- Mercuri, F.; Orazi, N.; Paoloni, S.; Cicero, C.; Zammit, U. Pulsed thermography applied to the study of cultural heritage. Appl. Sci. 2017, 7, 1010. [Google Scholar] [CrossRef]
- Usamentiaga, R.; Venegas, P.; Guerediaga, J.; Vega, L.; Molleda, J.; Bulnes, F.G. Infrared thermography for temperature measurement and non-destructive testing. Sensors 2014, 14, 12305–12348. [Google Scholar] [CrossRef] [PubMed]
- Junyan, L.; Liqiang, L.; Yang, W. Experimental study on active infrared thermography as a ndi tool for carbon–carbon composites. Compos. Part B 2013, 45, 138–147. [Google Scholar] [CrossRef]
- Sfarra, S.; Ibarra-Castanedo, C.; Santulli, C.; Paoletti, A.; Paoletti, D.; Sarasini, F.; Bendada, A.; Maldague, X. Falling weight impacted glass and basalt fibre woven composites inspected using non-destructive techniques. Compos. Part B 2013, 45, 601–608. [Google Scholar] [CrossRef]
- Meola, C. A new approach for estimation of defects detection with infrared thermography. Mater. Lett. 2007, 61, 747–750. [Google Scholar] [CrossRef]
- Maierhofer, C.; Arndt, R.; Röllig, M.; Rieck, C.; Walther, A.; Scheel, H.; Hillemeier, B. Application of impulse-thermography for non-destructive assessment of concrete structures. Cem. Concr. Compos. 2006, 28, 393–401. [Google Scholar] [CrossRef]
- Moropoulou, A.; Avdelidis, N.; Karoglou, M.; Delegou, E.; Alexakis, E.; Keramidas, V. Multispectral applications of infrared thermography in the diagnosis and protection of built cultural heritage. Appl. Sci. 2018, 8, 284. [Google Scholar] [CrossRef]
- Meola, C. Infrared thermography in the architectural field. Sci. World J. 2013, 8, 284. [Google Scholar] [CrossRef] [PubMed]
- Meola, C.; Carlomagno, G.M. Infrared thermography to evaluate impact damage in glass/epoxy with manufacturing defects. Int. J. Impact Eng. 2014, 67, 1–11. [Google Scholar] [CrossRef]
- Nairn, J.A.; Zoller, P. Matrix solidification and the resulting residual thermal stresses in composites. J. Mater. Sci. 1985, 20, 355–367. [Google Scholar] [CrossRef]
- Nairn, J.A. Fracture mechanics of composites with residual thermal stresses. J. Appl. Mech. 1997, 64, 804–810. [Google Scholar] [CrossRef]
- Hillerborg, A.; Modéer, M.; Petersson, P.-E. Analysis of crack formation and crack growth in concrete by means of fracture mechanics and finite elements. Cem. Concr. Res. 1976, 6, 773–781. [Google Scholar] [CrossRef]
Figure 1.
Schematic diagram of infrared thermography detection.

Figure 2.
Impact experimental setup (a) test setup; (b) data acquisition system. (PVC: polyvinyl chloride; PVA-ECC: polyvinyl alcohol fiber reinforced engineering cementitious composite).
Figure 2.
Impact experimental setup (a) test setup; (b) data acquisition system. (PVC: polyvinyl chloride; PVA-ECC: polyvinyl alcohol fiber reinforced engineering cementitious composite).

Figure 3.
Thermal contrast of first five impacts in the warm-up period (The arrow indicates the high temperature abnormal zone).
Figure 3.
Thermal contrast of first five impacts in the warm-up period (The arrow indicates the high temperature abnormal zone).

Figure 4.
Photograph of the specimen’s surface before and after impacts.

Figure 5.
Thermal contrast of last four impacts in the warm-up period (The rectangular box indicates the elongated abnormal zone corresponding to the cracks).
Figure 5.
Thermal contrast of last four impacts in the warm-up period (The rectangular box indicates the elongated abnormal zone corresponding to the cracks).

Figure 6.
Thermal contrast of first five impacts in the cool-down period.


Figure 7.
Thermal contrast of last four impacts in the cool-down period.

Figure 8.
Thermal contrast profile perpendicular to the extension of the crack.

Figure 9.
Temperature versus time in the defective area and nearby intact area.


Table 1.
Composition of polyvinyl alcohol fiber reinforced engineering cementitious composite (PVA-ECC) under study [22]. (PVA-ECC: Polyvinyl alcohol fiber reinforced engineering cementitious composite; SP: Superplasticizer, a high-range water-reducing admixture).
Table 1.
Composition of polyvinyl alcohol fiber reinforced engineering cementitious composite (PVA-ECC) under study [22]. (PVA-ECC: Polyvinyl alcohol fiber reinforced engineering cementitious composite; SP: Superplasticizer, a high-range water-reducing admixture).
| Cement | Sand | Fly Ash | Water | SP (%) | PVA (%) |
|---|---|---|---|---|---|
| 1.16 | 1.16 | 2.2 | 0.66 | 0.002 | 2 |
Table 2.
Properties of the polyvinyl alcohol (PVA) Fiber [22].
Table 2.
Properties of the polyvinyl alcohol (PVA) Fiber [22].
| Nominal Strength (MPa) | Apparent Strength (MPa) | Diameter (mm) | Length (mm) | Young’s Modulus (GPa) | Elongation (%) |
|---|---|---|---|---|---|
| 1620 | 1092 | 39 | 12 | 42.8 | 6.0 |
© 2018 by the authors. Licensee MDPI, Basel, Switzerland. This article is an open access article distributed under the terms and conditions of the Creative Commons Attribution (CC BY) license (http://creativecommons.org/licenses/by/4.0/).
Share and Cite
MDPI and ACS Style
Wu, J.; Xu, C.; Qi, B.; Hernandez, F.C.R. Detection of Impact Damage on PVA-ECC Beam Using Infrared Thermography. Appl. Sci. 2018, 8, 839. https://doi.org/10.3390/app8050839
AMA Style
Wu J, Xu C, Qi B, Hernandez FCR. Detection of Impact Damage on PVA-ECC Beam Using Infrared Thermography. Applied Sciences. 2018; 8(5):839. https://doi.org/10.3390/app8050839
Chicago/Turabian StyleWu, Jianchao, Changhang Xu, Baoxin Qi, and Francisco C. Robles Hernandez. 2018. "Detection of Impact Damage on PVA-ECC Beam Using Infrared Thermography" Applied Sciences 8, no. 5: 839. https://doi.org/10.3390/app8050839
Note that from the first issue of 2016, this journal uses article numbers instead of page numbers. See further details here.