Piezoelectric Poly(vinylidene fluoride) (PVDF) Polymer-Based Sensor for Wrist Motion Signal Detection
by
 ,
,
Yaohui Hu
1,2, 
Wuwei Kang
1,2,3,
Yong Fang
1,2,*,
Lingrui Xie
1,2,4,
Longzhen Qiu
1,2 and
Tao Jin
1,2,3 1
National Engineering Lab of Special Display Technology, National Key Lab of Advanced Display Technology, Hefei University of Technology, Hefei 230009, China
2
Academy of Photoelectric Technology, Hefei University of Technology, Hefei 230009, China
3
School of Computer Science and Information Engineering, Hefei University of Technology, Hefei 230009, China
4
School of Instrument Science and Opto-electronics Engineering, Hefei University of Technology, Hefei 230009, China
*
Author to whom correspondence should be addressed.
Appl. Sci. 2018, 8(5), 836; https://doi.org/10.3390/app8050836
Submission received: 10 April 2018
/
Revised: 10 May 2018
/
Accepted: 18 May 2018
/
Published: 22 May 2018
(This article belongs to the Special Issue Piezoelectric Actuators)
Abstract
:In this paper, a sensor based on polyvinylidene fluoride (PVDF) piezoelectric thin film was designed and fabricated to detect wrist motion signals. A series of dynamic experiments have been carried out, including the contrast experiments of different materials and force-charge signal characterization. The experimental results show that when the excitation signal exceeds 15 Hz, the sensitivity of the sensor is always stable at 3.10 pC/N. The signal acquisition experiment of the wrist motion has been carried out by using this sensor. The experiment results show that, with the advantages of small size, good flexibility, and high sensitivity, this wrist PVDF sensor can be used to detect the wrist motion signals with weak amplitude, low frequency, strong interference, and randomness.
1. Introduction
Recently, with the development of the mobile Internet and the introduction of the high-performance and low-power System-on-Chip (SoC), wearable devices have been widely applied in various fields such as health care, sports, communication, and virtual reality [1]. It emphasizes that the equipment is “worn” on the body and usually has sensors with the function of collecting and detecting information such as physiological signals, acceleration, and location. The sensors used for human–computer interaction are one of the more important types, which have the advantages of portability, comfort, non-invasion, and lower power consumption.
Gesture recognition technology is a research focus in the field of human–computer interaction. At present, there are two main implementations of this technology, including visual images and sensors [2]. The visual image has been widely studied, but it is limited in the application of wearable devices due to its complex process of installation and usage and high dependence on the environment [3]. Gesture recognition technology based on sensors is often realized by analyzing gestures and location information acquired by sensors such as Inertial Measurement Unit (IMU), magnetometer, and Micro-Electro-Mechanical Systems (MEMS) gyroscope [4]. However, this kind of sensor may not meet the application requirements of complex human–computer interaction scenarios, because it is difficult to identify some slight and complex gestures.
In 1969, Japanese scientists found that PVDF piezoelectric film had high piezoelectric properties after high-temperature and high-pressure polarization [5]. At present, PVDF piezoelectric film has become a kind of piezoelectric sensing material with excellent performance after many years of development. It has a variety of advantages such as high piezoelectric constant, wide frequency response, low acoustic impedance, high dielectric strength, and excellent mechanical properties [6]. The sensors fabricated by PVDF piezoelectric film are widely applied in biosensors and other fields [7,8,9,10,11,12,13,14,15]. Arabshahi et al. [10] designed a touch sensor based on PVDF piezoelectric film, which could help the blind to recognize texts by Braille. The sensor that was based on the PVDF piezoelectric film consisted of two layers of composite material with 12 Braille literacy covered to recognize pressure from fingers. Dargahic et al. [11] developed a system that could be used for remote pulse measurement based on the excellent sensing characteristics of PVDF piezoelectric film. The system utilized PVDF sensors to measure pulse and provide force and other information. Choi and Jiang [12] developed a new type of cardiopulmonary signal sensor consisting of a PVDF piezoelectric film and a pair of conductive fabric sheets to detect the cardiopulmonary signal during sleep. In prior research studies, it can be seen that PVDF piezoelectric film is very sensitive to dynamic stress and suitable for detecting weak physiological signals on the skin surface of the human body.
In order to meet the application needs of complex human–computer interactions and the recognition of slight gestures, we designed and built a sensor to detect wrist motion signals based on PVDF piezoelectric film in this paper. The innovations of this work include two aspects: a novel structure design and the detection of weak wrist motion signals.
2. Operating Principle and Structure
2.1. Operating Principle
PVDF is a piezoelectric plastic material that generates equal and opposite charges on both sides of the film when it is mechanically deformed [16]. Figure 1 is schematic picture of PVDF film. In our proposed sensor, there is no external electric field in the PVDF film. The piezoelectric equation is below [17,18]:
where P1, P2, and P3 are electric displacements in directions 1, 2, and 3; d31, d32, and d33 are the piezoelectric strain coefficient in directions 1, 2, and 3; d24 and d15 are the piezoelectric shearing strain coefficients of the film sides in directions 1 and 2; T1, T2, and T3 are the tensile stress in directions 1, 2, and 3; and T4, T5, and T6 are the shear stress in directions 1, 2, and 3. In our proposed sensor, the piezoelectric shearing strain coefficients are much smaller than the piezoelectric strain coefficients. The output charge in the electroded area of the PVDF film is below:
where Q is the output charge, and A is the electrode area.
The sensor mentioned in this paper detected motion signals by using the PVDF film. With silicone rubber as the backing material of the sensor, it can be considered that the PVDF is deformed only in the embedded direction, while the deformation in thickness is 0, which means that T3 is 0. Normally, d31 is much larger than d32, which can be ignored. Therefore, Equation (2) can be transformed into the equation below [19]:
Since the deformation of elastic material is directly proportional to stress, the quantity of charges Q that is generated by the sensor is directly proportional to the external force F, while the PVDF film and the backing of silicone rubber are all made of elastic materials. The output response of the sensor can be expressed as the equation below:
where the slope S is defined as the sensitivity of the sensor, and F is the external force.
2.2. Sensor Structure
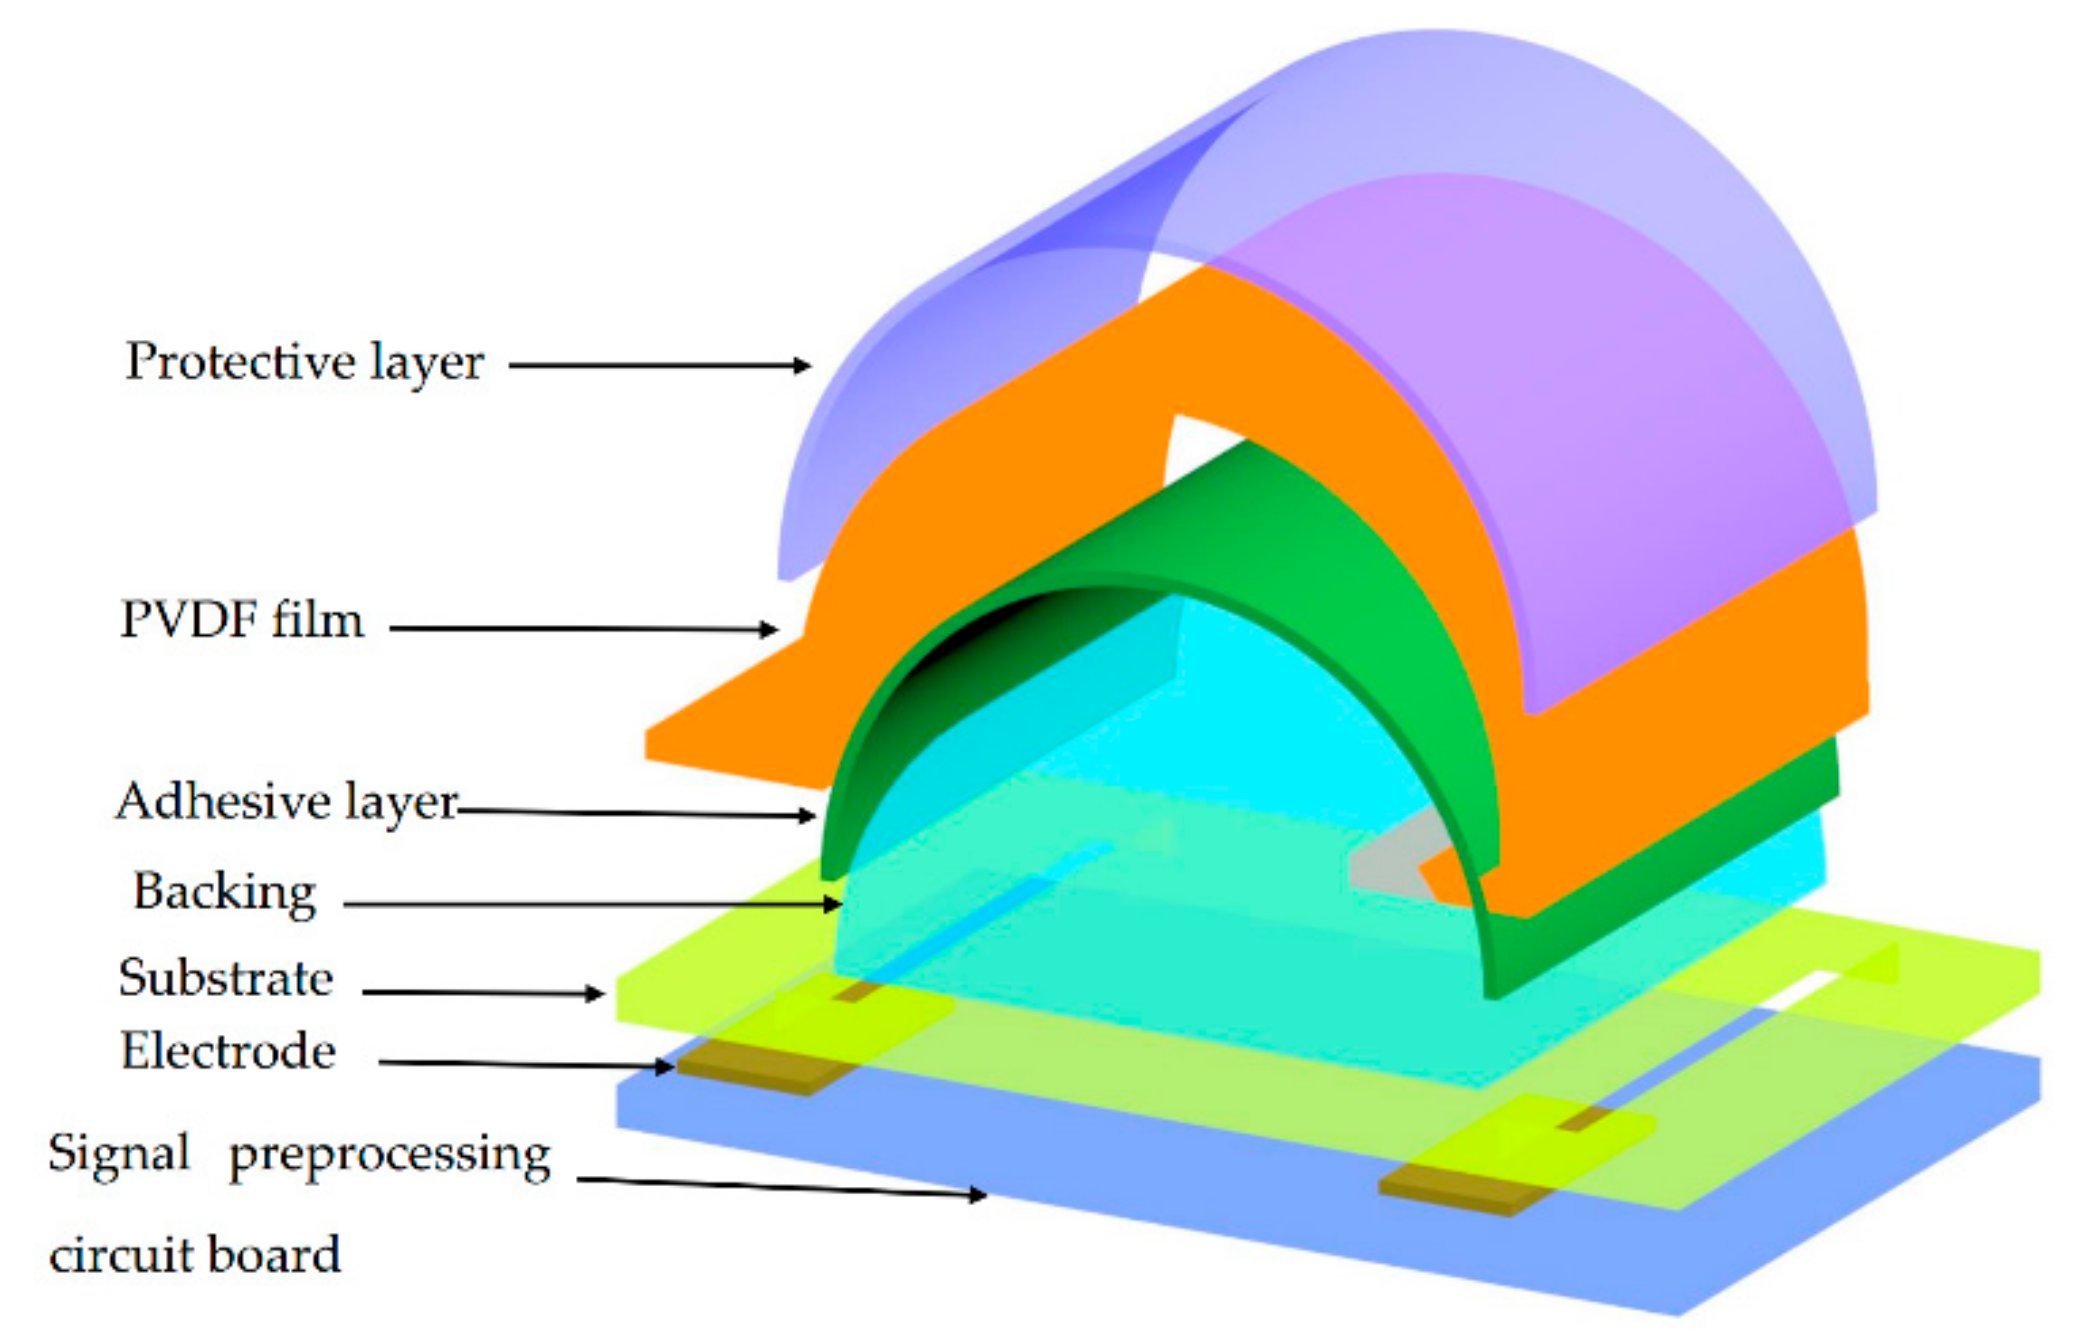
Since the sensor mentioned in this paper is installed on the wrist devices, it will be in contact with the human body frequently. In addition, the motion signals of the wrist are relatively weak and easily disturbed. Based on the above, the specific structure of the sensor was designed as Figure 2. It consists of seven layers: a protective layer, a PDVF film layer, an adhesive layer, a backing layer, a substrate layer, an electrode layer, and a signal preprocessing circuit board layer.
A protective layer is needed on the surface of PVDF to avoid wear or corrosion, which is a piece of transparent thin film made of high-molecular polymer PET (polyethylene glycol terephthalate). The PVDF film mentioned in this paper (area: 6 × 20 mm; thickness: 50 μm) was provided by Jinzhou Kexin Electronic Material Co., Ltd. (Jinzhou, China). The substrate (area: 11 mm × 8 mm; thickness: 0.4 mm) is plastic plate. There are two square through holes (area: 6 mm × 0.8 mm) on the substrate, which are used to pull the PVDF from the front to the back of the substrate.
The backing is a pad behind the PVDF film, which directly affects the performance of the sensors. The backing was designed as a half-cylinder (diameter: 5 mm; high: 6 mm), which could increase the deformation amplitude of the PVDF film effectively and produce more charges for a higher sensitivity and better directivity of the sensor. The output response of the sensor was based on silicone rubber and ABS (acrylonitrile–butadiene–styrene) backing, which were easily prepared; then, they were tested and compared. The silicone rubber backing was prepared through a mold, and the ABS backing was prepared through a three-dimensional (3D) printer. The silicone rubber was chosen as backing because of its better performance. The film and backing need to be anchored with adhesives to reduce the relative displacement between them. The curing agent and PSA (pressure-sensitive adhesive) can be used as adhesive. The sensor’s output responses based on them were tested and compared. The PSA was selected as the adhesive because of its better performance. The test details of adhesive and backing are described in Chapter 3.
The two printed electrodes (each area: 2 mm × 2 mm; material: Cu) on the back of the signal preprocess circuit board were designed for signals transduction. The electrodes were connected with the film through silver glue to improve the electrical conductivity. The output signal of the sensor needs to be preprocessed in order to achieve a high signal-to-noise ratio because of the complex electromagnetic environment when it is used in wearable devices such as smart watches. A differential charge amplifier, which is developed using one amplifier and a second-order Butterworth low-pass filter, has been integrated onto the circuit board of a signal preprocess (area: 11 mm × 8 mm; thickness: 0.4 mm). The main function of the charge amplifier is to amplify weak charge signals and match the impedance of the sensor, which transforms the medium or high-impedance input to a low-impedance output [20]. The main function of the filter is to filter out the high-frequency noise. The signal preprocess circuit board and the sensor were directly combined in the structure design for three advantages, which include greatly reducing the size, ease for clamping the PVDF piezoelectric film, and convenience for modular use of the sensor.
2.3. Fabrication
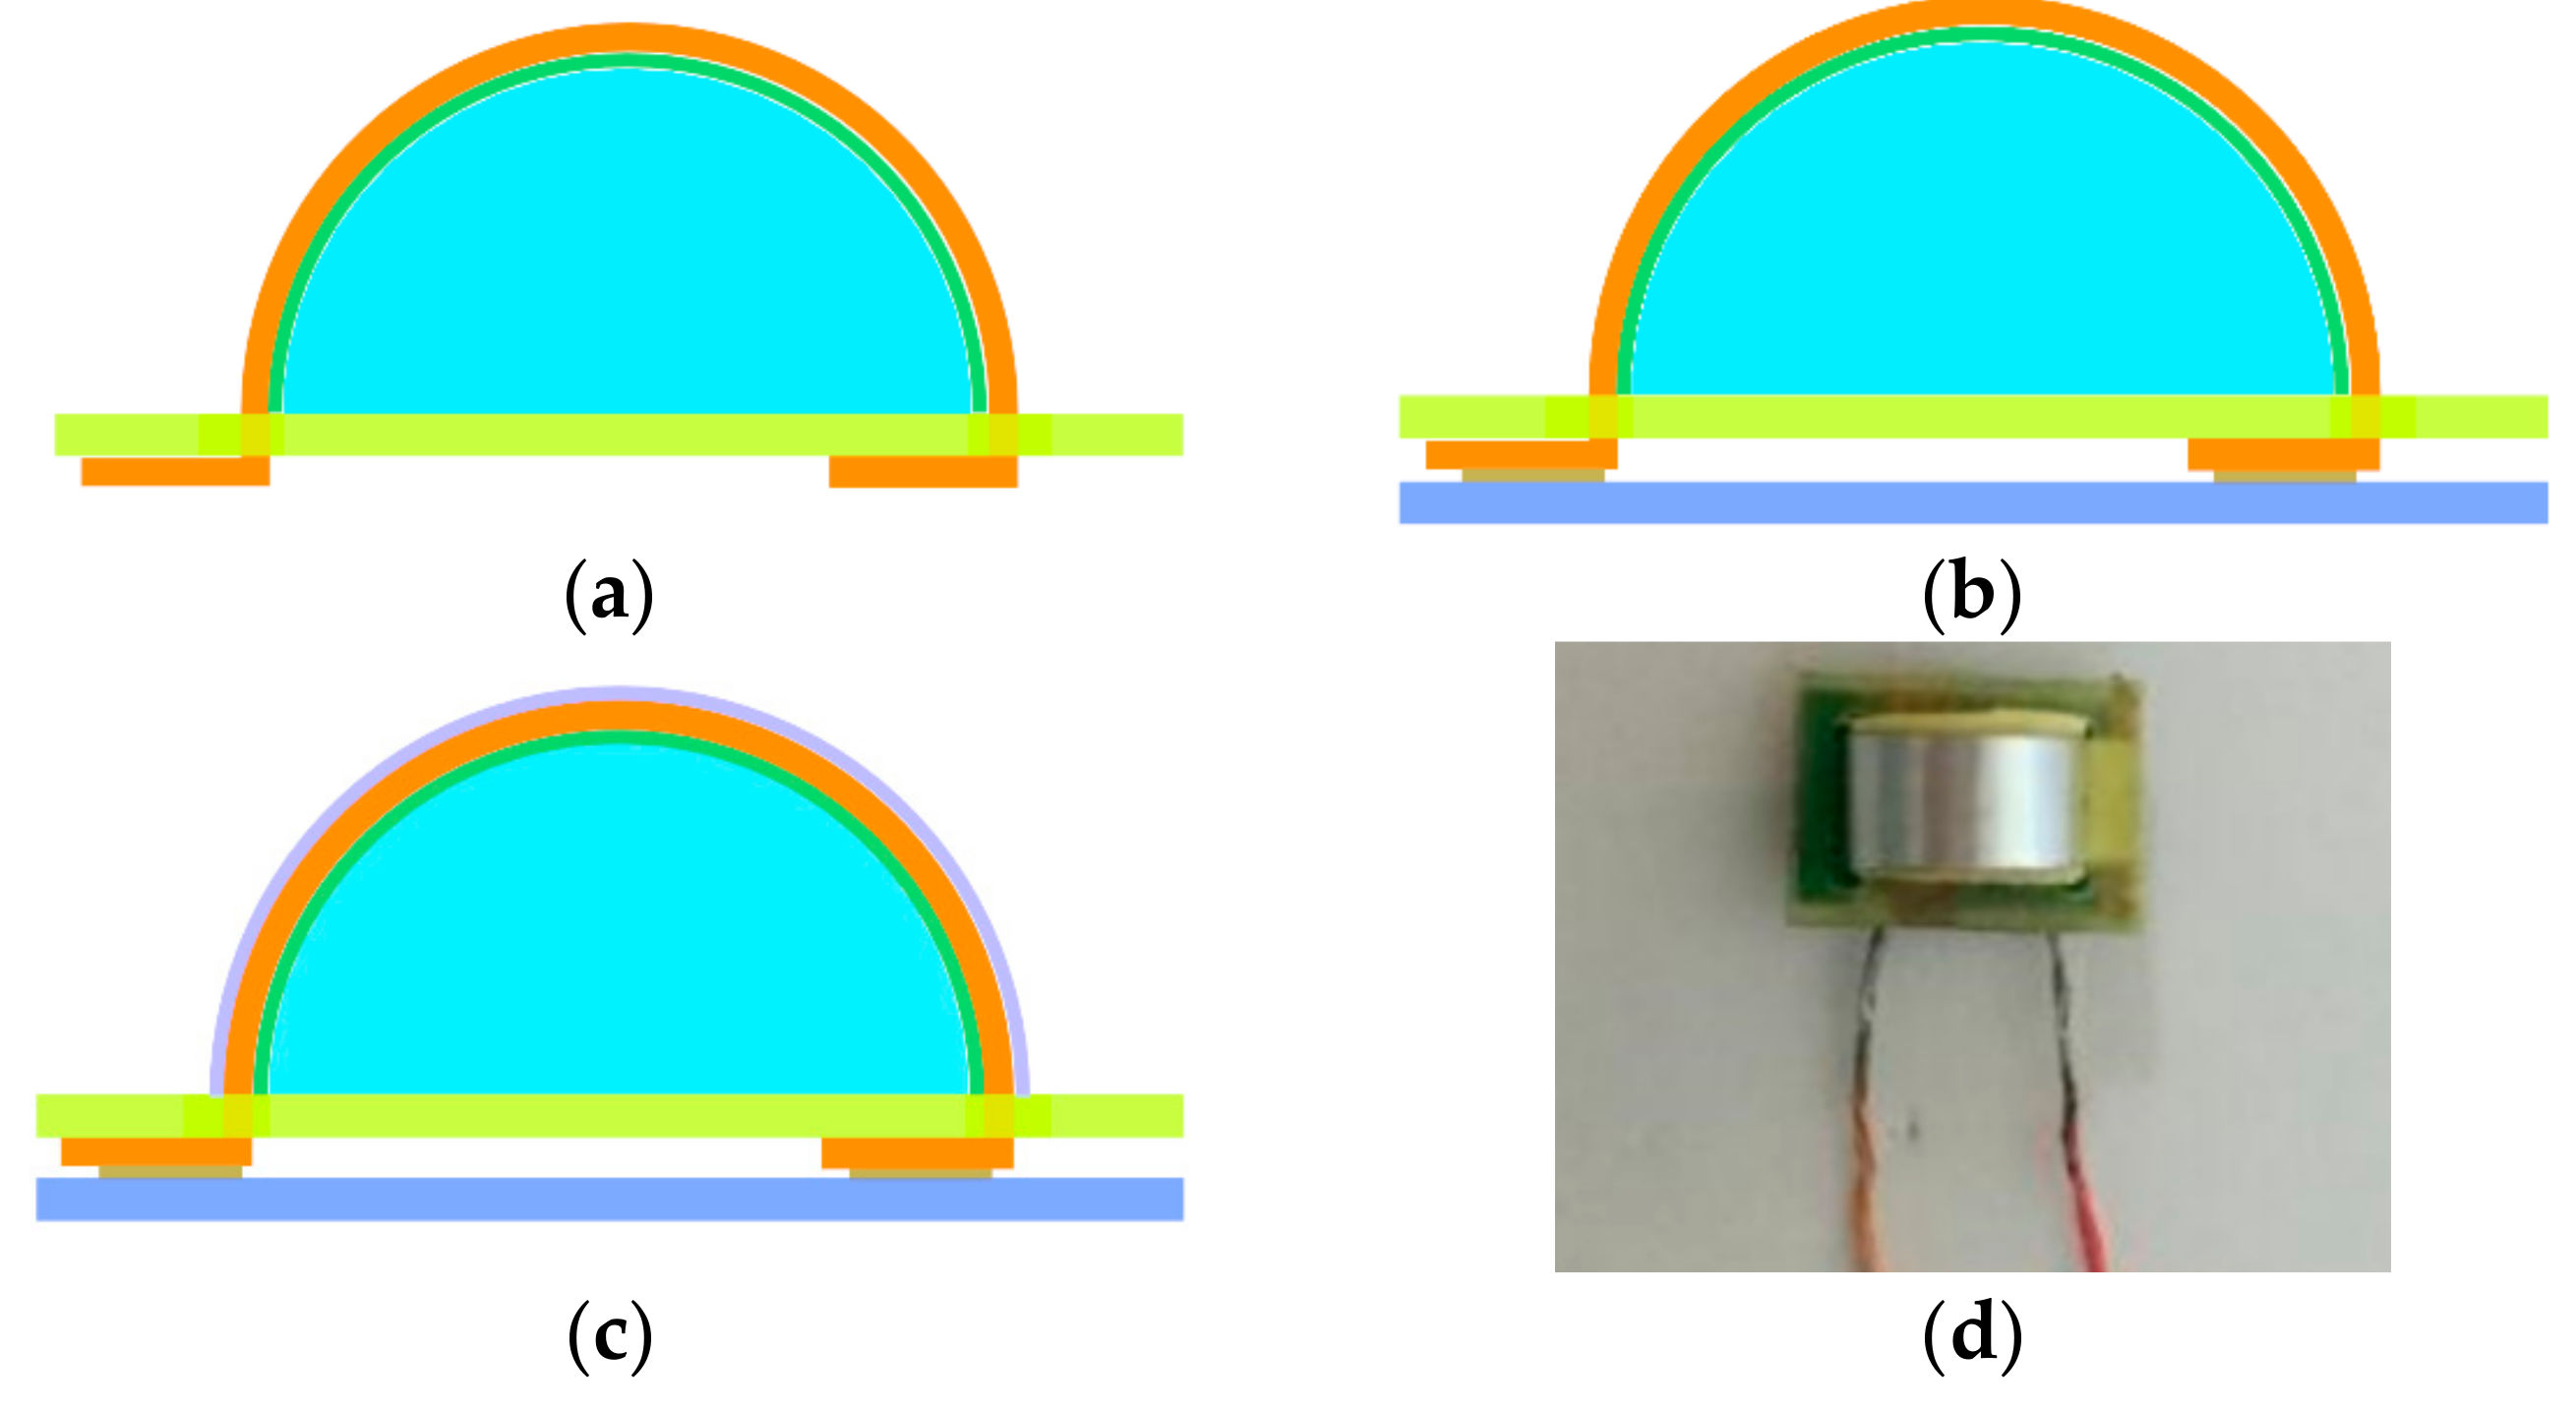
The fabrication process of the sensor is shown in Figure 3. The main materials required for making the sensor are PVDF film, silicone rubber, PET film, and Printed Circuit Board (PCB) et al.
- Step 1
- Make the backing by reverse mould, weld output signal line to signal preprocessing circuit board, and print substrate though the 3D printer.
- Step 2
- Paste the backing and the film together, as shown in Figure 3a. Attach the backing to the specified position on the substrate, and then paste the PVDF film on the backing with PSA. The two ends of the film are drawn from the through holes to the back of the substrate, and then bent in the same direction.
- Step 3
- Paste the signal preprocessing circuit board as shown in Figure 3b. Apply an appropriate amount of silver glue to the electrode on the back of the signal preprocessing circuit board, and then combine it with the substrate so that the two electrodes are respectively attached to both ends of the film. After the silver glue is solidified, fix them with the instantaneous adhesive.
- Step 4
- Cover the protective layer on the PVDF surface, as shown in Figure 3c.
The fabricated sample was shown in Figure 3d whose size was 9 mm × 6 mm × 2.75 mm.
3. Experiments and Discussion
3.1. Experimental Setup
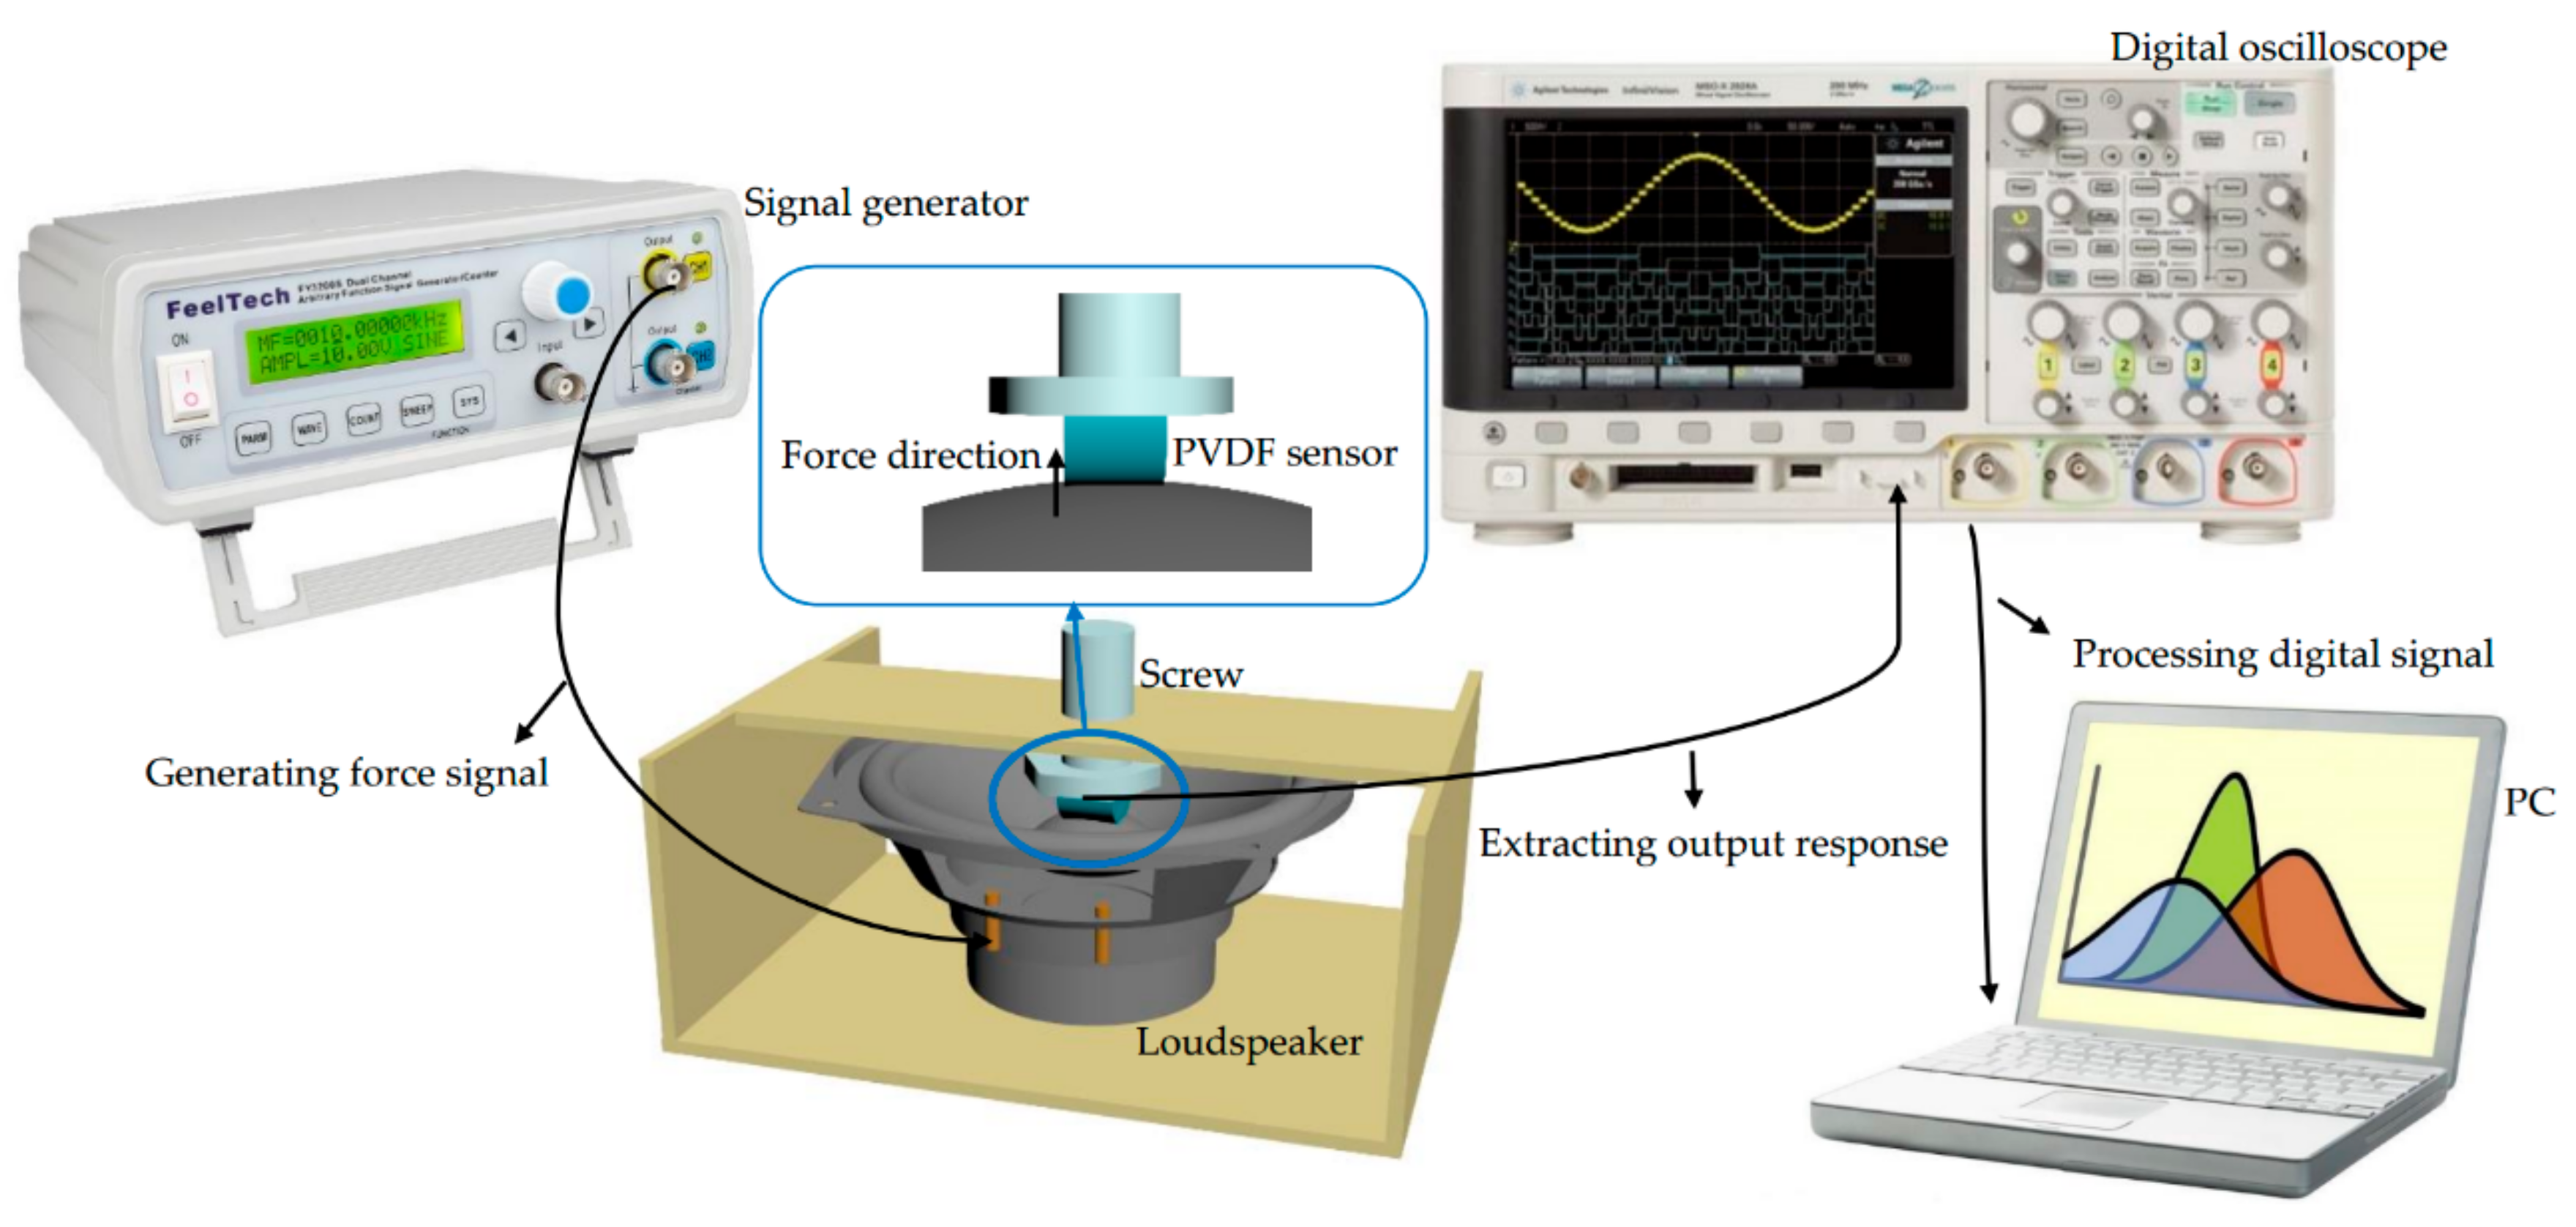
To measure the performance of the sensor and the influence of different structures on the sensor, a set of experimental systems was prepared, which is shown in Figure 4. According to the piezoelectricity of the sensor, when excited by a periodic force, there will be a periodic voltage of the same frequency on the two ends of the sensor. In order to produce a controllable periodic pressure, a high-power bass loudspeaker (YD176-8XPH, Nanjing Electro-acoustic Co., Ltd., Nanjing, Jiangsu province, China) is used as the source of periodic force. The sensor is fixed at the bottom of the screw and adjusted to a right position by moving the screw up and down. All of the beams in this experimental system were rigid beams to reduce the influence of other vibrations on the measurement.
In the experiment, the exciting signals of different frequencies and amplitudes from the signal generator (FY2200S, Zhengzhou Feeltech Technology Co., Ltd., Zhengzhou, Henan province, China) were put into the loudspeaker, so that the loudspeaker generated periodic force signals that were applied to the sensor. The output signals of the sensor were acquired by the digital oscilloscope (DSO7034B, Agilent Technologies Inc., Palo Alto, CA, USA).
3.2. Material Selection Test
3.2.1. Backing Material
The silicone rubber backing sensor and ABS backing sensor were tested and compared under the same experimental conditions through the above experimental system. In the experiment, a 0.1-s short pulse excitation signal was applied to both of them, and the output response is shown in Figure 5. The x-axis and y-axis show the time and the charge outputs of the sensor, respectively. It can be seen that the output waveform of the ABS backing sensor is of a smaller amplitude and longer tailing compared with the silicone rubber backing sensor.
When the backing layer is ABS plastic, the deformation of PVDF is only in the direction of thickness. However, the thickness of PVDF is only tens of micrometers, and the deformation in the thickness direction is far less than those in other directions. As a result, the response of the ABS backing sensor is very weak. In addition, because of the bidirectional radiation effect of the piezoelectric element, it not only generates the mechanical waves forward but also backward when the pulse excitation is emitted. The clutter interference from the rear should be discarded, and only the signal from the front should be kept [21]. Therefore, the backing needs a good sound absorption performance to consume the rear clutter interference quickly. In the experiment, due to the better sound absorption performance of silicone rubber backing than that of ABS backing, the clutter can be consumed more quickly, so that the tail of the output response waveform of the silicone rubber backing sensor is smaller than that of the ABS backing sensor.
The experimental results show that different backings have a significant influence on the sensor performance, and the silicone rubber-backing sensor has a better performance than the ABS backing sensor.
3.2.2. Adhesive Material
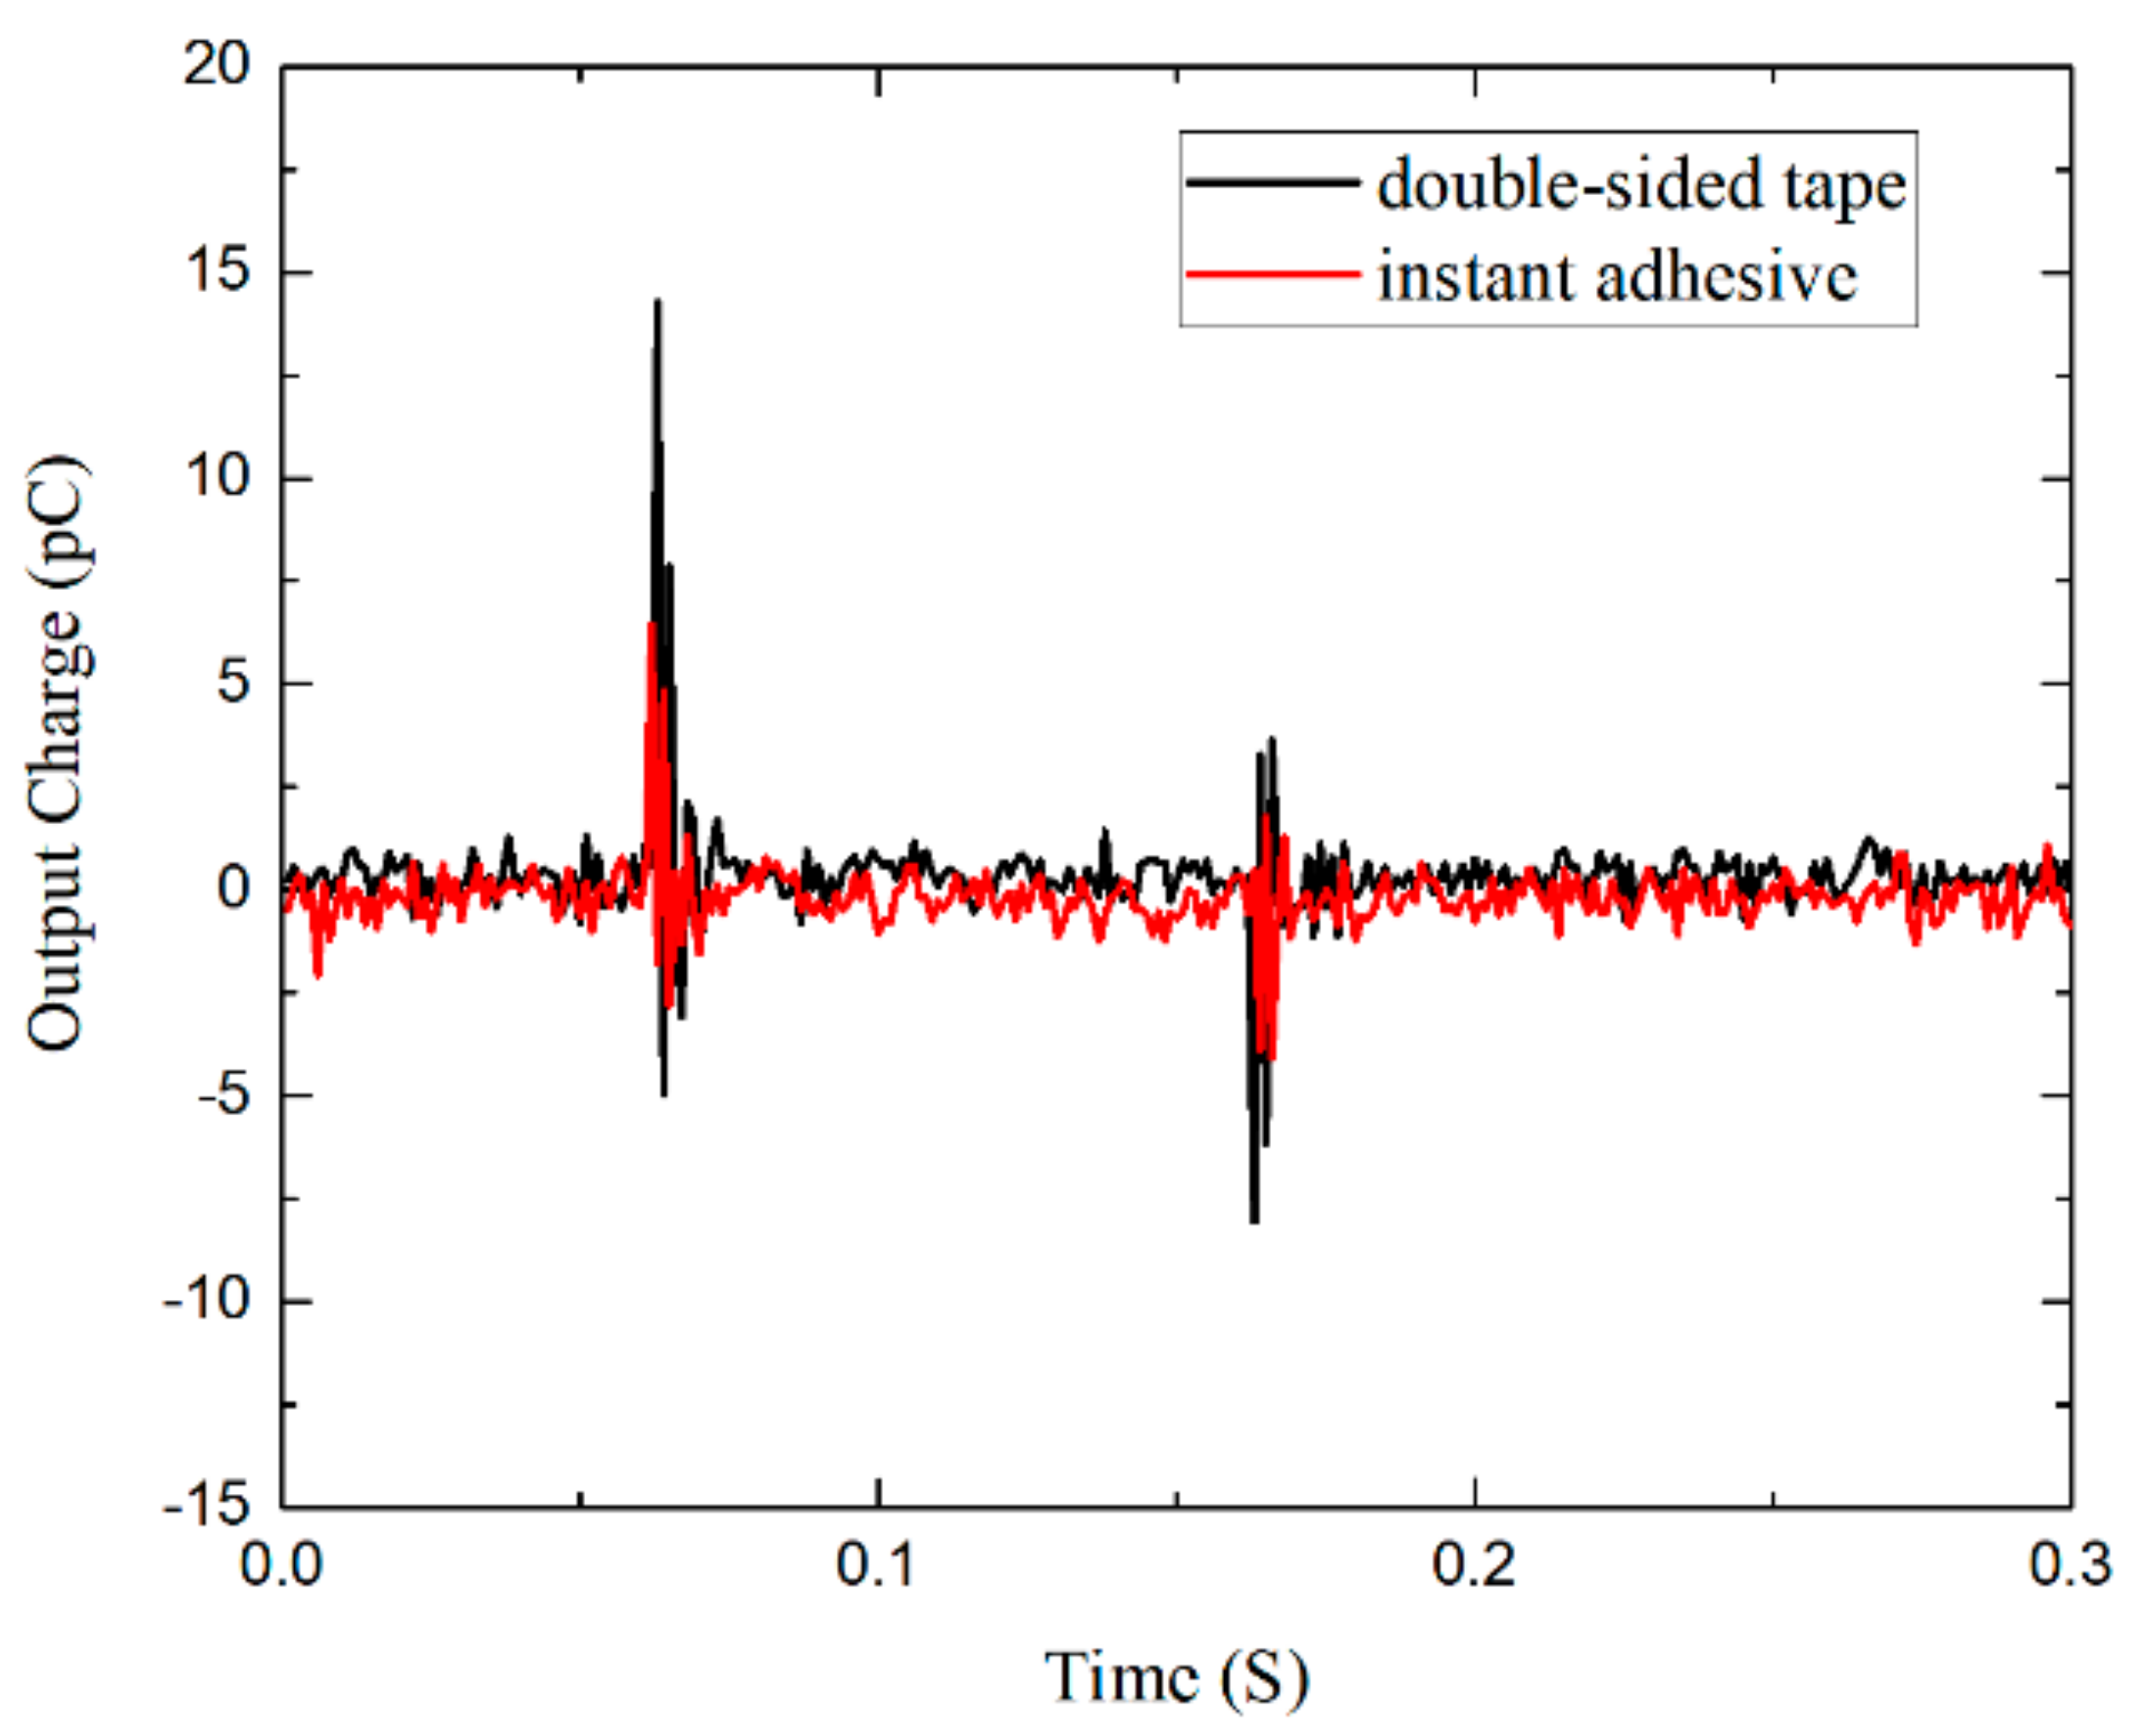
The curing agent and Pressure Sensitive Adhesive (PSA) were tested and contrasted in the same experimental conditions. The instantaneous adhesive (aron alona 707) was chosen as a curing agent, and the double-sided adhesive tape (3M9080) was selected as the PSA. The output response curve is shown in Figure 6. It shows that the output response of the sensor with a double-sided adhesive tape is significantly greater than that of the one with the instantaneous adhesive.
As for the selection of the adhesive, the instant curing agent forms a layer of film with a certain hardness on the backing surface after solidification, which increases the elastic coefficient of the backing. According to the backing material test, the greater the elastic coefficient of the backing, the worse the performance of the sensor. In comparison with the solidified instant curing agent ( kg/m2·s), the acoustic impedance of double-sided adhesive tape ( kg/m2·s) is much more closer to that of the PVDF film ( kg/m2·s), and the acoustic reflection at the contact surface is moderate, which is more conducive to matching acoustic impedance [22]. Therefore, the effect of the double-sided adhesive tape is obviously better than an instant curing agent under the same conditions.
3.3. Force-Charge Signal Characterization
3.3.1. Sensitivity Measurement
To measure the sensitivity quantitatively, the experiment to measure the force generated by using the resistance strain gauge (FRS402) and the loudspeaker was designed and carried out. The relationship between the output response of the signal generator and the force generated by the loudspeaker is shown in Table 1.
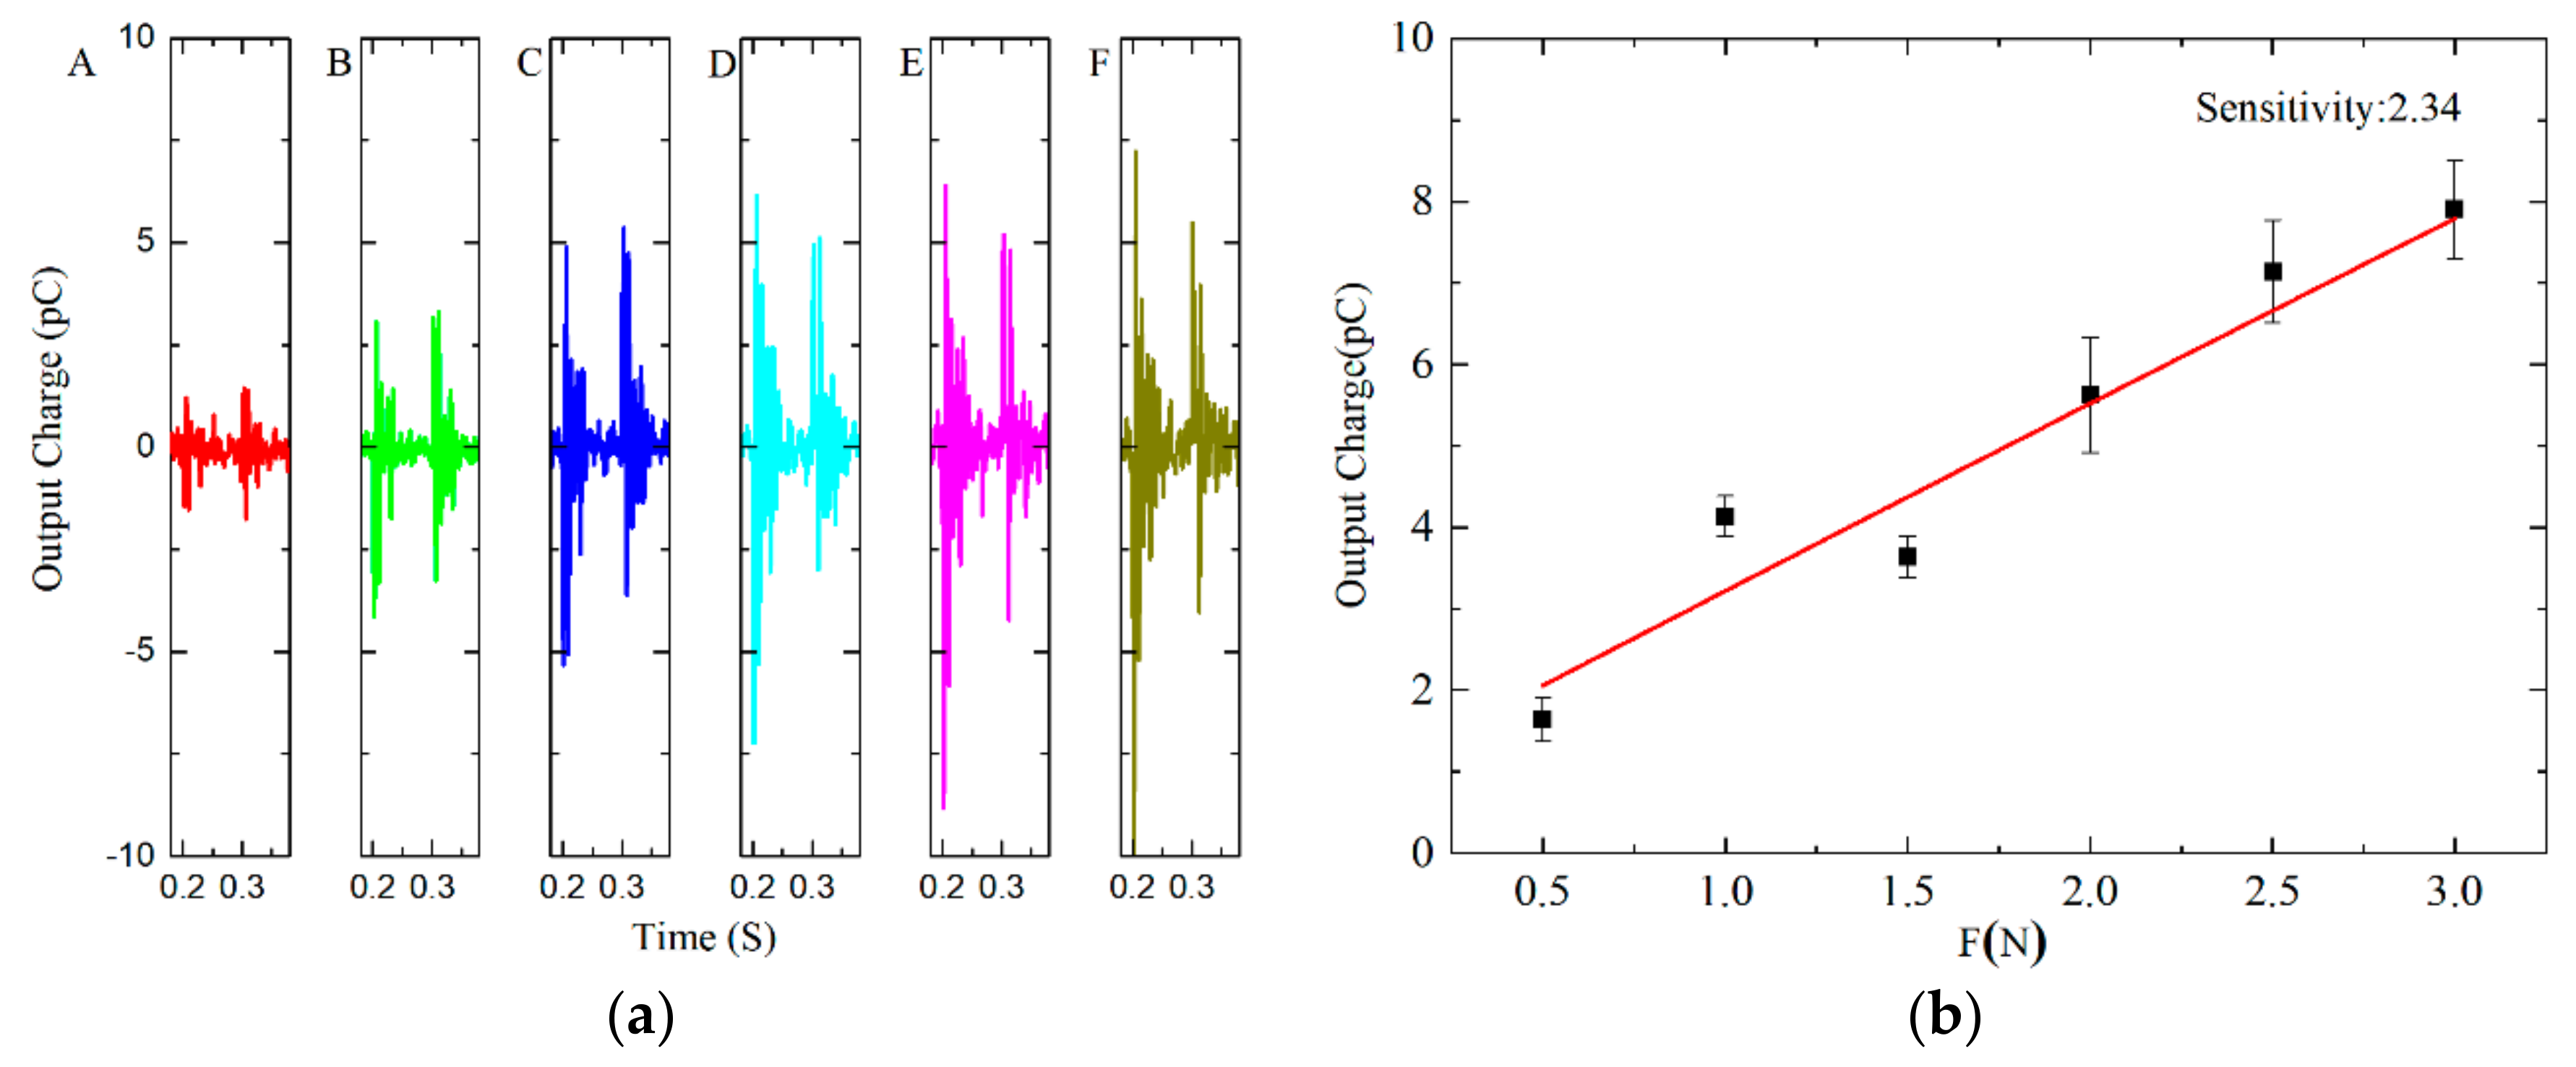
The sensitivity of the sensor was measured by changing the size and frequency of the force generated by the loudspeaker. Taking the 5-Hz excitation signal as an example, the output curves of the sensor under different voltages were obtained after power frequency interference filtering processing, which is shown in Figure 7. The response signal of the rising edge of the excitation signal is selected as the output response of the sensor. There are five rising edges in Figure 7a, which averages the corresponding response signal values and the output response amplitude of the sensor under which each voltage can be obtained. Lastly, the output of the sensor is linearly fitted by using the data analysis software ORIGIN, and the force-charge relationship of the sensor is obtained at the excitation frequency of 5 Hz, which is shown in Figure 7b. The slope of the fitting line aligns with the sensitivity of the sensor at 5-Hz excitation frequency. The sensitivity at other excitation frequencies was obtained by the same method, which is shown in Table 2.
From Figure 7b, it can be seen that the output response of the sensor linearly increased with the rising exerted force amplitude, which is in accordance with the theoretical derivation of the liner relationship between the output response of the sensor and the exerted force mentioned above. The comparison of the data in Table 2 shows that the sensitivity of the sensor increases with the rising of the frequency of the excitation signal. The magnitude of the increase is getting smaller and smaller, and it tends to be stable at about 15 Hz.
3.3.2. Frequency-Amplitude Characteristics and Impedance Measurement
In order to further explore the relationship between the sensitivity of the sensor and the frequency of the excitation signal, the frequency-amplitude characteristics of the sensor were measured by using the same experimental system and similar methods.
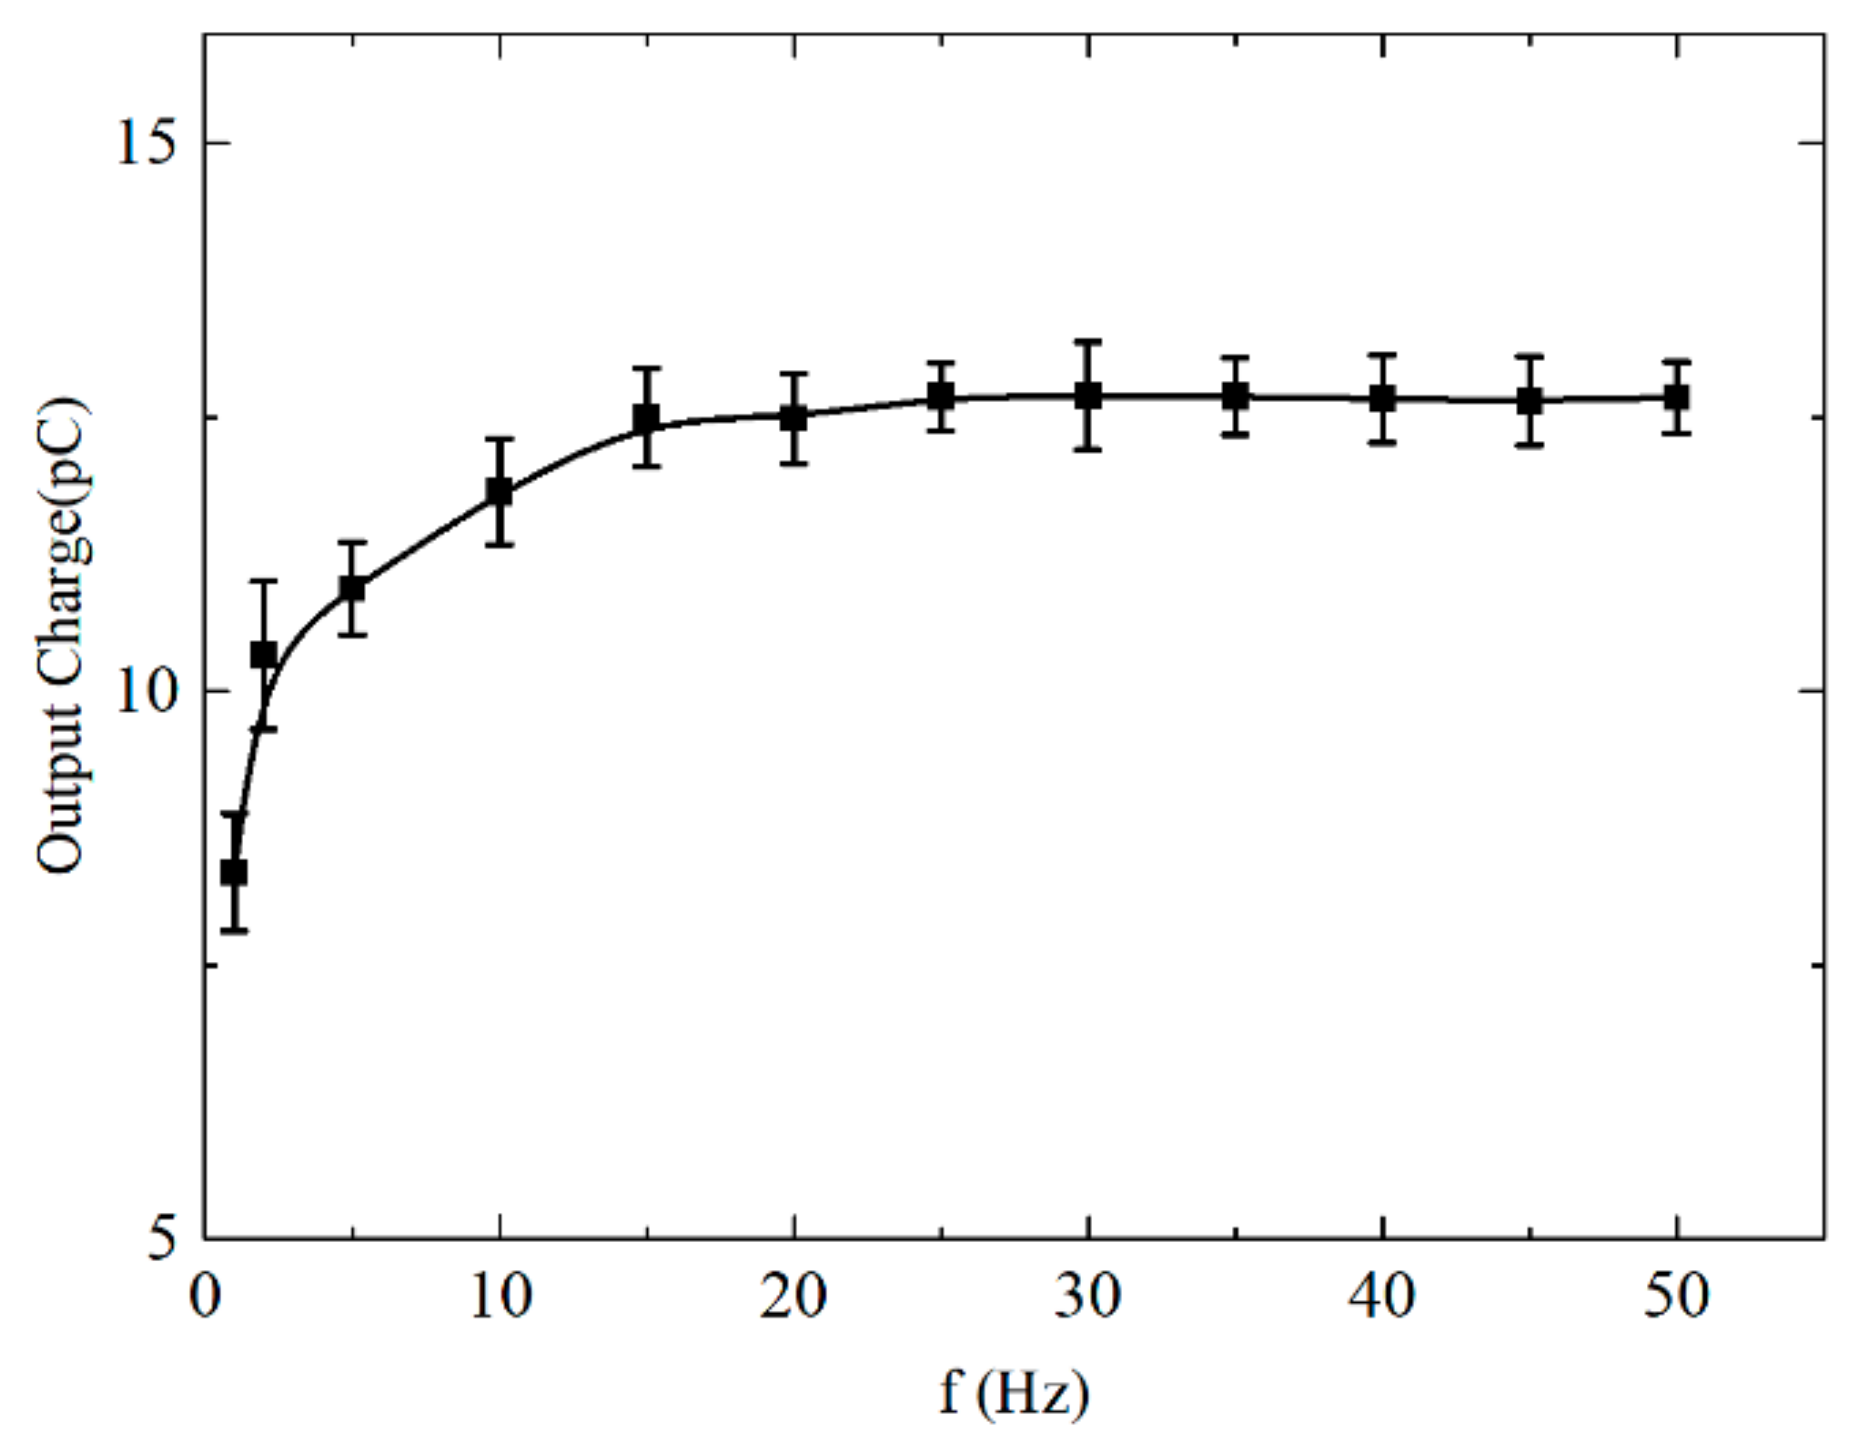
Figure 8 shows the relationship between the output response of the sensor and the frequency of the excitation signal, with the voltage amplitude of the excitation signal remaining constant. The transverse coordinate is the excitation signal frequency (in Hz) and the longitudinal coordinate is the sensor’s output response (in mV). With the increase of the excitation signal frequency, the output response of the sensor increases gradually until it reaches its maximum at 15 Hz. The slope of the curve indicates the growth rate of the sensitivity, which is low at a low frequency, and gets higher as the frequency rises.
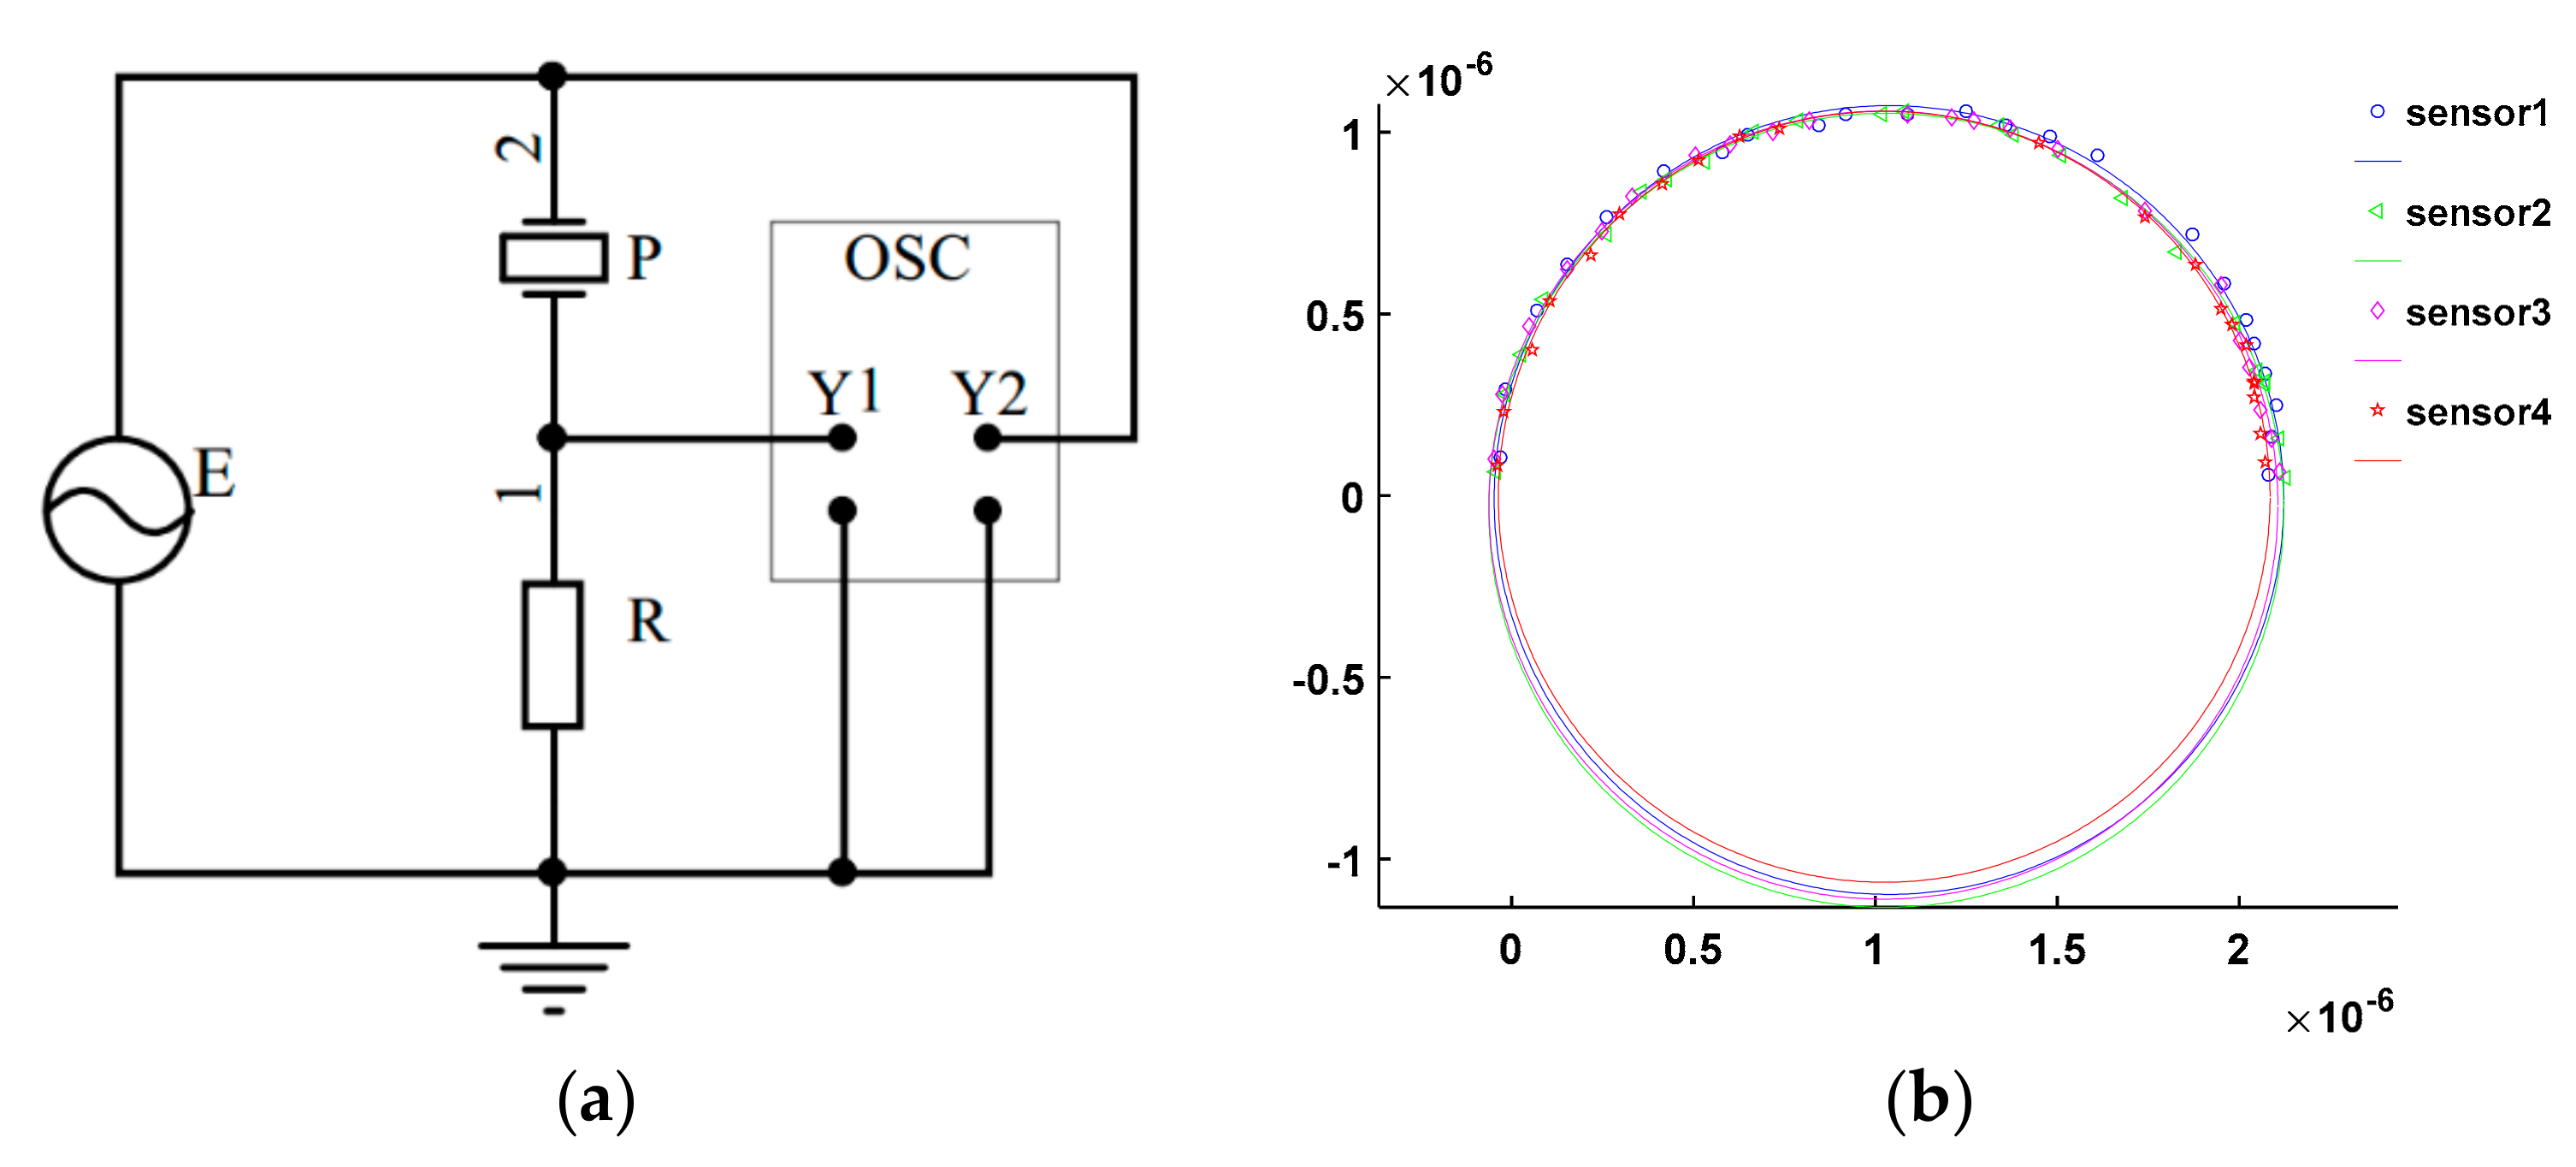
To study the reason for the low sensitivity of the sensor at low frequency, the admittance circles of four sensors prepared in the same batch were tested, and the output impedance values of the sensors were obtained. The measuring circuit and the admittance circles are shown in Figure 9, where E is the function signal generator, P is the measured sensor, and R is the non-inductive resistance. The average diameter of the four admittance circles is m. According to this, the output impedance is reciprocal to the diameter of the admittance circle, and the output impedance of the sensor is 462 KΩ.
The reason for the low sensitivity of the sensor at a low frequency is that the lower charge produced by the film in units of time, and the low internal resistance of PVDF film (462 KΩ), result in the poor low frequency that is characteristic of the sensor and obvious charges leakage, which is shown as the low sensitivity in low frequency. The necessity of adding a signal preprocessing circuit board near the sensor to improve the signal-to-noise ratio was also proven.
3.4. Wrist Motion Signal Detection
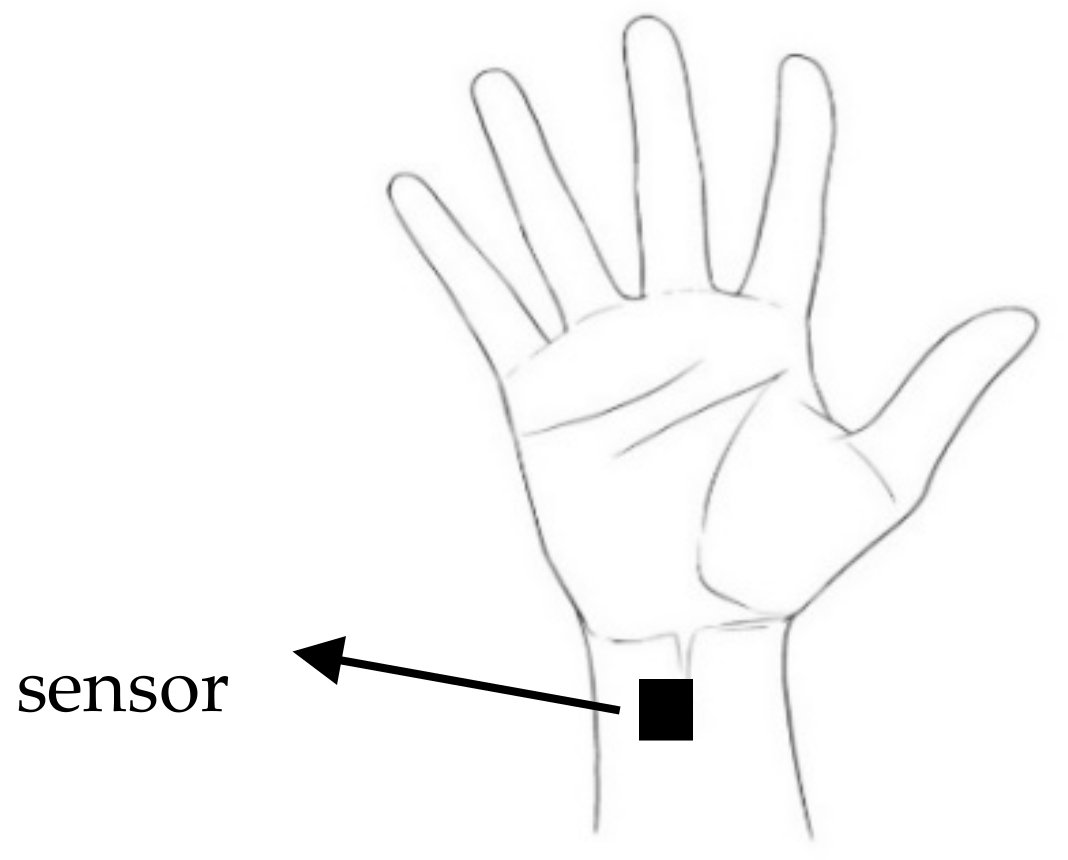
The overall performance of the wrist sensor in the actual application was tested by using the testing system in Figure 4. In order to reduce the random error and evaluate the sensor quickly, an adult male and an adult female were selected as two subjects. The sensor was worn on the wrists of the subjects, which is shown in Figure 10. During the test, the subjects were asked to keep their forearms horizontal and perform different gestures, each of which should be repeated five times. The original data collected by the digital oscilloscope and the same filtering processing was carried out as above.
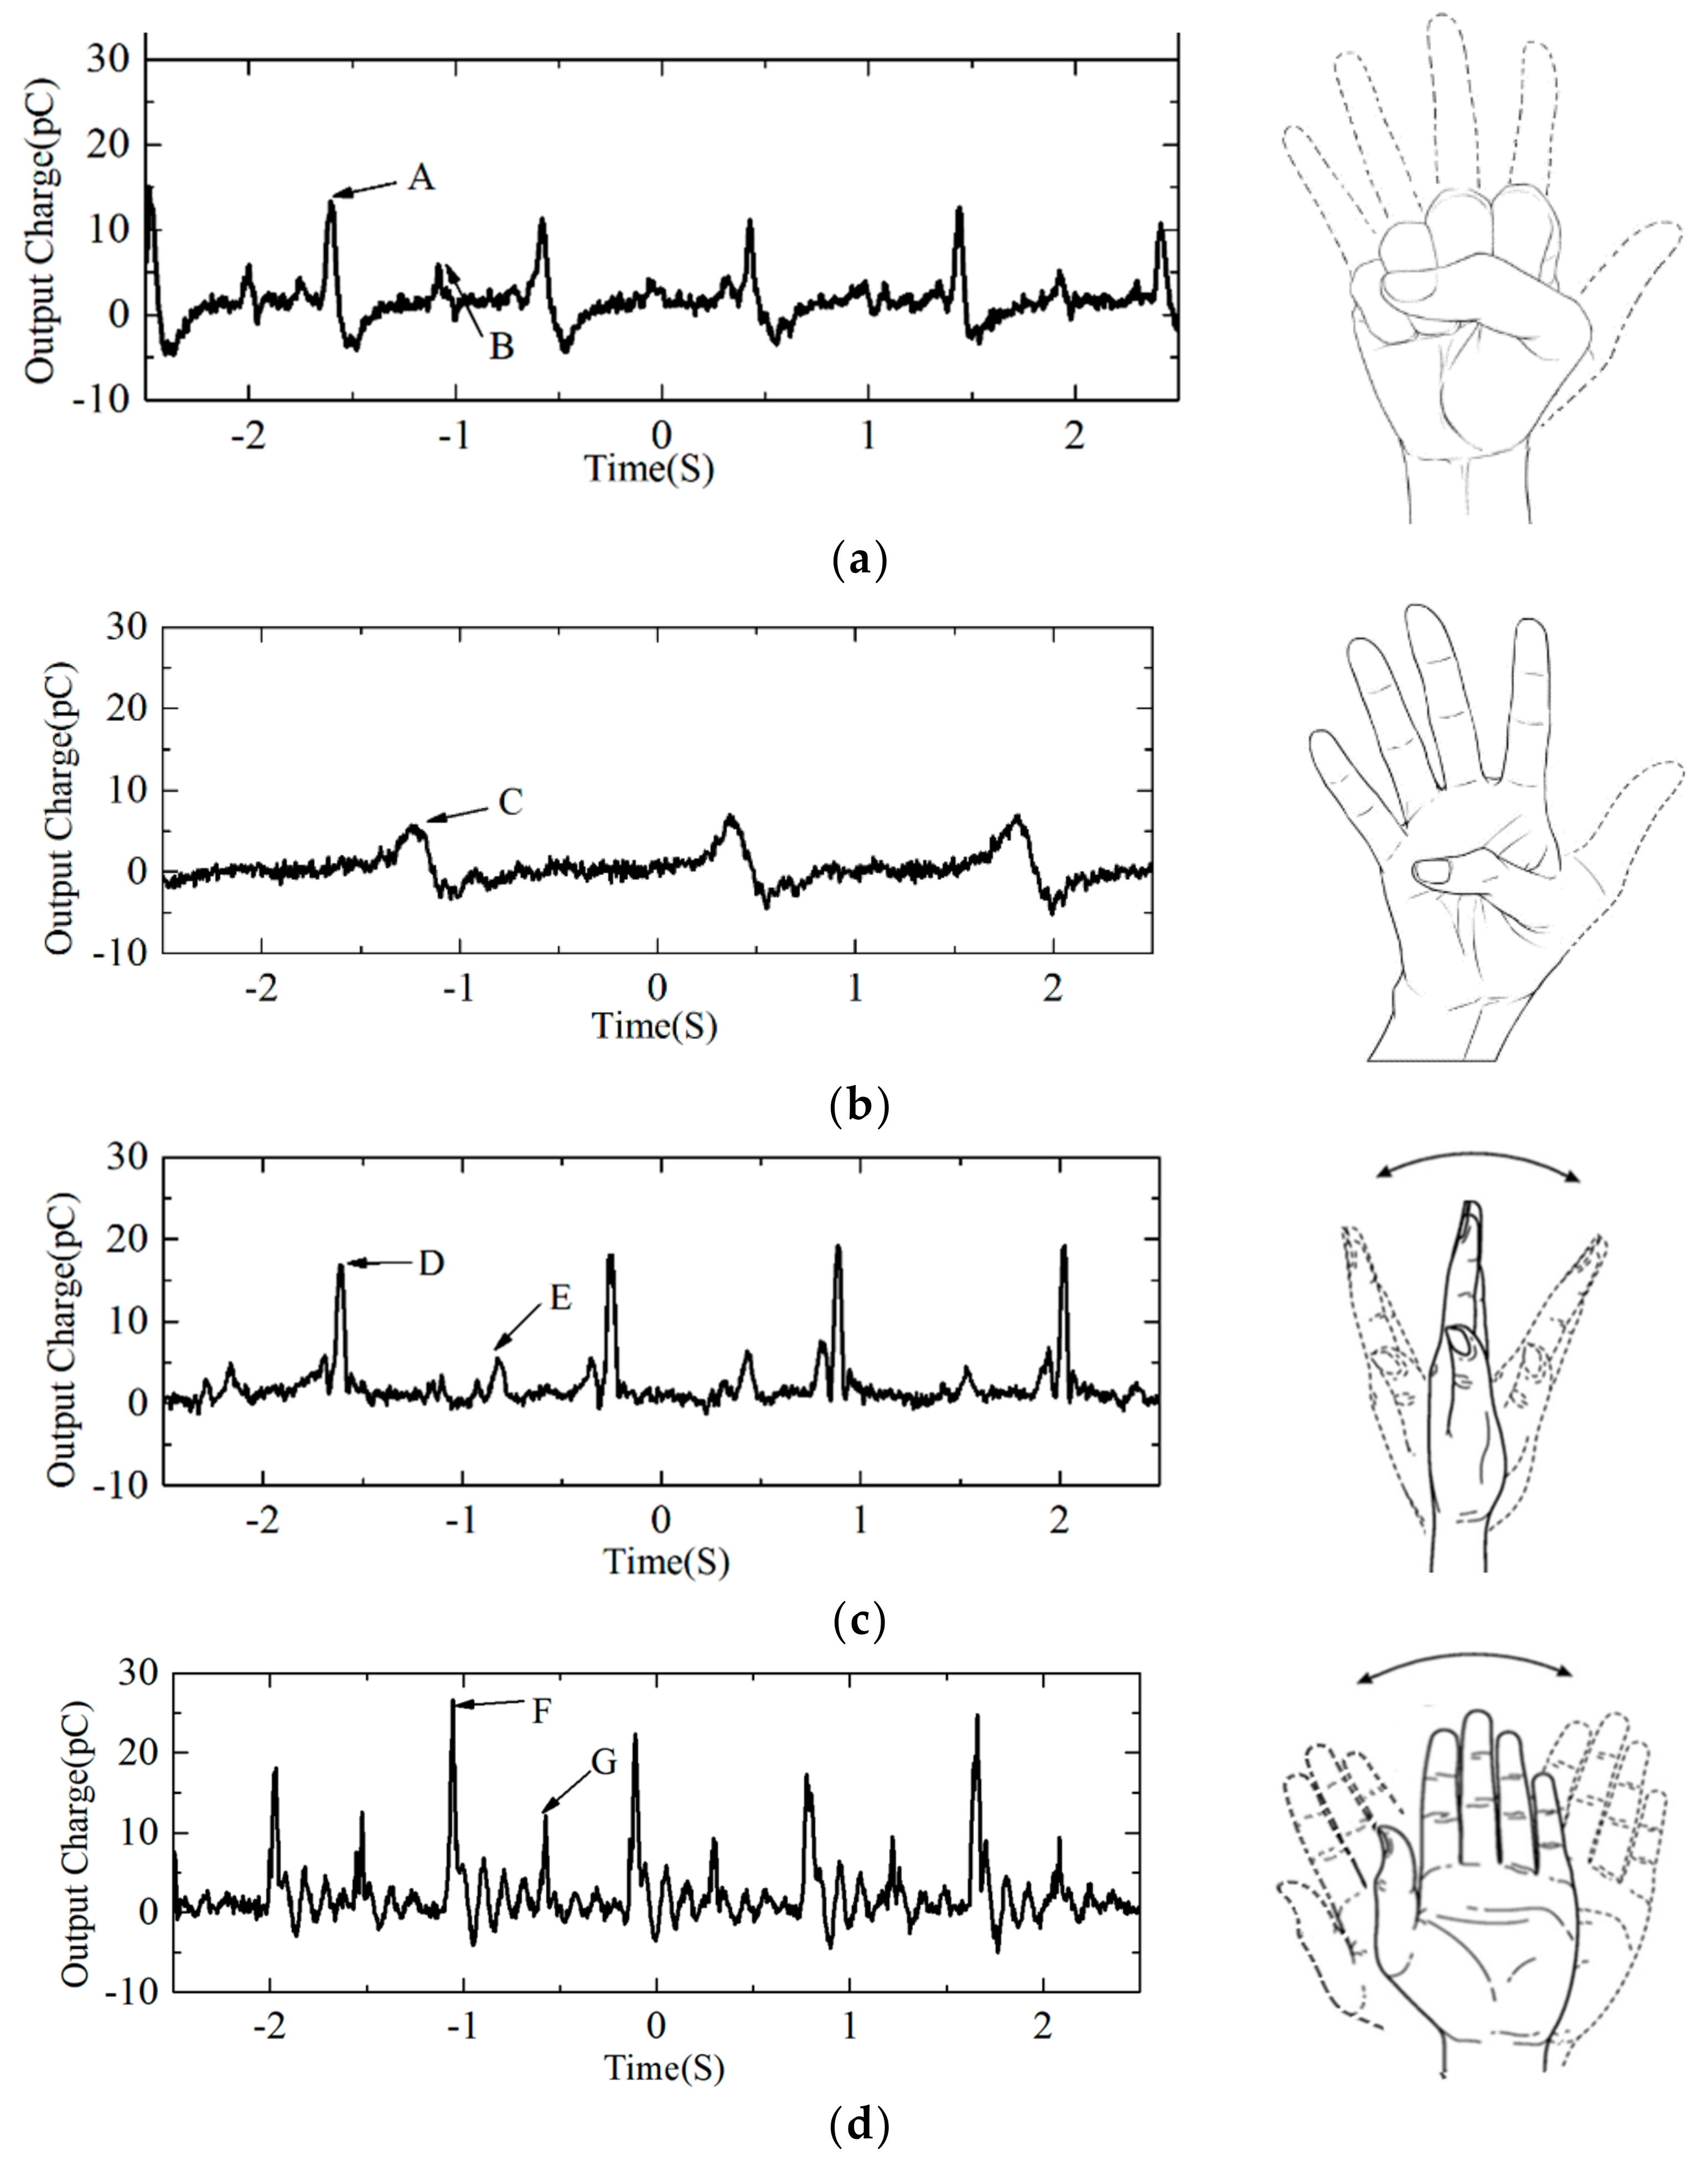
Figure 11 presents measured response waveforms of the sensor during different hand movements. The waveform collected when the subject made a fist is shown in Figure 11a. It can be clearly seen that there are five fist periods and two peaks in each period. Point A is the first peak corresponding to making a fist, while point B is the second peak corresponding to the return to the initial state. Figure 11b shows the waveform of the thumb-bending of the subject. There are three thumb-bending periods, and one peak Point C in each period at which the thumb is bending. Figure 11c shows the waveform of wrist stretching and bending. There are four periods and two peaks in each period consisting of Point D and Point E, respectively. Point D and Point E demonstrated the wrist in stretching and bending, respectively. The waveform of the wrist waving motion is shown in Figure 11d. There are four periods and two peaks consisting of Point F and Point G in each period at which the hand is at two ends of waving, respectively.
As clearly seen in Figure 11, the greater the motion amplitude, the greater the output response amplitude, and the sharper the waveform. As shown in Figure 11b, the output response amplitude is small, and the waveform is relatively flat, because of the small amplitude of thumb bending. As for the test results shown in Figure 11a,c,d, there is little difference in the amplitude between the three sets of different movements, but there is a distinct difference in the shape of the waveform. Making a fist is the most intense action, and the changes in the corresponding waveform are the greatest, while the other two sets are more placid. In summary, there is a significant difference in the four sets of signal waveforms that were acquired from different movements.
4. Conclusions
In this paper, a new structure of a wrist sensor was designed and fabricated based on PVDF film, and a series of experiments were carried out.
Through the material test and comparison, the silicone rubber and double-sided adhesive tape were finally selected as backing and adhesive, respectively. According to experimental results, the backing material should meet the requirements of good elasticity, small elastic coefficient, good absorption, and a tight fit to PVDF film, while the adhesive material should meet the requirements of effective toughness and acoustic impedance close to the PVDF film.
In the force-charge characterization experiment, the sensitivity of the sensor was measured. When the frequency of the excitation signal was greater than 15 Hz, the sensitivity was stable at around 3.10 pC/N. When the frequency of the excitation signal was less than 15 Hz, the sensitivity decreased duo to obvious charge leakage, which reached its lowest point at 1 Hz (1.54 pC/N).
The experiment of signal acquisition shows that the sensors with high sensitivity can meet the requirements of detecting motion signals and judging hand-movement states, according to the difference of signals from different motions.
In conclusion, in this paper, a PVDF piezoelectric sensor that can be applied to wearable devices was introduced, and the principle, structure, and performance of the sensor were demonstrated. A series of tests were carried out, and the results of the experiments were analyzed. It will be a reference for the application of PVDF film in the field of body motion signal detection.
Author Contributions
All authors have made great contributions to the work. Y.H. and Y.F. defined the research topic and designed the sensor; W.K. and Y.F. performed the experiments and wrote the paper; L.X. analyzed the data; L.Q. provided materials of the sensor; T.J. offered help in the process of experiments.
Conflicts of Interest
The authors declare no conflicts of interest.
References
- NPD Group. Wearable Device Market and Technology Research Report; NPD Display Search; NPD Group: Bentonville, AR, USA, 2014. [Google Scholar]
- Laviola, J.J. A Survey of Hand Posture and Gesture Recognition Techniques and Technology; Brown University: Providence, RI, USA, 1999. [Google Scholar]
- Lee, J.S.; Lee, Y.J.; Lee, E.H.; Hong, S.H. Hand region extraction and gesture recognition from video stream with complex background through entropy analysis. In Proceedings of the 26th Annual International Conference of the IEEE Engineering in Medicine and Biology Society, San Francisco, CA, USA, 1–5 September 2004; pp. 1513–1516. [Google Scholar]
- Zhu, C.; Sheng, W. Online hand gesture recognition using neural network based segmentation. In Proceedings of the IEEE/RSJ International Conference on Intelligent Robots and Systems, St. Louis, MO, USA, 10–15 October 2009; pp. 2415–2420. [Google Scholar]
- Kawai, H. The Piezoelectricity of Poly(vinylidene Fluoride). Jpn. J. Appl. Phys. 1969, 8, 975–976. [Google Scholar] [CrossRef]
- Varadan, V.V.; Roh, Y.R.; Varadan, V.K.; Tancrell, R.H. Measurement of all the elastic and dielectric constants of poled PVDF films. In Proceedings of the Ultrasonics Symposium, Montreal, QC, Canada, 3–6 October 1989; IEEE: Piscataway, NJ, USA, 1989; Volume 2, pp. 727–730. [Google Scholar]
- Woodward, B.; Chandra, R.C. Underwater Acoustic Measurements on Polyvinylidene Fluoride Transducers. ElectroCompon. Sci. Technol. 1978, 5, 149–157. [Google Scholar] [CrossRef]
- Lee, C.-K.; Moon, F.C. Laminated piezopolymer plates for torsion and bending sensors and actuators. J. Acoust. Soc. Am. 1989, 85, 2432–2439. [Google Scholar] [CrossRef]
- Matsumoto, E.; Biwa, S.; Katsumi, K.; Omoto, Y.; Iguchi, K.; Shibata, T. Surface strain sensing with polymer piezoelectric film. NDT E Int. 2004, 37, 57–64. [Google Scholar] [CrossRef]
- Arabshahi, S.A. Fundamental Study on Design of a Braille Tactile Sensor. In Proceedings of the International Conference on Complex Medical Engineering CME, Takamatsu, Japan, 15–18 May 2005. [Google Scholar]
- Dargahi, J.; Xie, W.F.; Ji, P. An experimental teletaction system for sensing and teleperception of human pulse. Mechatronics 2008, 18, 195–207. [Google Scholar] [CrossRef]
- Choi, S.; Jiang, Z. A novel wearable sensor device with conductive fabric and PVDF film for monitoring cardiorespiratory signals. Sens. Actuators A Phys. 2006, 128, 317–326. [Google Scholar] [CrossRef]
- Ma, L.; Melkote, S.N.; Morehouse, J.B.; Castle, J.B.; Fonda, J.W.; Johnson, M.A. Thin-Film PVDF Sensor Based Monitoring of Cutting Forces in Peripheral End Milling. J. Dyn. Syst. Meas. Control 2012, 134, 725–735. [Google Scholar] [CrossRef]
- Rajala, S.; Lekkala, J. Film-Type Sensor Materials PVDF and EMFi in Measurement of Cardiorespiratory Signals—A Review. IEEE Sens. J. 2012, 12, 439–446. [Google Scholar] [CrossRef]
- Chiu, Y.Y.; Lin, W.Y.; Wang, H.Y.; Huang, S.B.; Wu, M.H. Development of a piezoelectric polyvinylidene fluoride polymer-based sensor patch for simultaneous heartbeat and respiration monitoring. In Proceedings of the IEEE International Conference on Nano/micro Engineered and Molecular Systems, Suzhou, China, 7–10 April 2013; IEEE: Piscataway, NJ, USA, 2013; pp. 45–48. [Google Scholar]
- Rajala, S.; Tuukkanen, S.; Halttunen, J. Characteristics of piezoelectric polymer film sensors with solution-processable graphene-based electrode materials. IEEE Sens. J. 2015, 15, 3102–3109. [Google Scholar] [CrossRef]
- Song, A.; Han, Y.; Hu, H.; Li, J. A Novel Texture Sensor for Fabric Texture Measurement and Classification. IEEE Trans. Instrum. Meas. 2014, 63, 1739–1747. [Google Scholar] [CrossRef]
- Hu, H.; Han, Y.; Song, A.; Chen, S.; Wang, C.; Wang, Z. A finger-shaped tactile sensor for fabric surfaces evaluation by 2-dimensional active sliding touch. Sensors 2014, 14, 4899–4913. [Google Scholar] [CrossRef] [PubMed]
- Yu, P.; Liu, W.; Gu, C.; Cheng, X.; Fu, X. Flexible Piezoelectric Tactile Sensor Array for Dynamic Three-Axis Force Measurement. Sensors 2016, 16, 819. [Google Scholar] [CrossRef] [PubMed]
- Xu, K.J.; Huang, Y.Z.; Lv, X.H. Power-spectrum-analysis-based signal processing system of vortex flowmeters. IEEE Trans. Instrum. Meas. 2006, 55, 1006–1011. [Google Scholar] [CrossRef]
- Sirohi, J. Fundamental understanding of piezoelectric strain sensors. J. Intell. Mater. Syst. Struct. 1999, 11, 246–257. [Google Scholar] [CrossRef]
- Liedtke, R.J. The Fundamentals of Bioelectrical Impedance Analysis; RJL Systems: Clinton Township, MI, USA, 1998. [Google Scholar]
Figure 1.
Schematic of polyvinylidene fluoride (PVDF) film.

Figure 2.
Structure diagram of wrist PVDF sensor.

Figure 3.
Fabrication process of the sensor (a) backing and PVDF film; (b) the signal preprocess circuit board; (c) protective layer; and (d) physical map of wrist PVDF sensor.
Figure 3.
Fabrication process of the sensor (a) backing and PVDF film; (b) the signal preprocess circuit board; (c) protective layer; and (d) physical map of wrist PVDF sensor.

Figure 4.
Configuration diagram of the wrist PVDF sensor test system.

Figure 5.
The output curves of sensors with different backing materials.

Figure 6.
The output curves of sensors with different adhesives.

Figure 7.
(a) The output response of the PVDF sensor from the pressures of A: 0.48 N, B: 0.99 N, C: 1.45 N, D: 1.96 N, E: 2.45 N, and F: 2.95 N at 5 Hz of excitation frequency; (b) the force-charge curve of the PVDF Sensor at 5 Hz of excitation frequency.
Figure 7.
(a) The output response of the PVDF sensor from the pressures of A: 0.48 N, B: 0.99 N, C: 1.45 N, D: 1.96 N, E: 2.45 N, and F: 2.95 N at 5 Hz of excitation frequency; (b) the force-charge curve of the PVDF Sensor at 5 Hz of excitation frequency.

Figure 8.
Frequency-amplitude characteristic curve of the sensor.

Figure 9.
(a) Schematic of the measuring circuit; (b) Admittance circles.

Figure 10.
Schematic of the sensor position and initial state of the hand.

Figure 11.
Measured response waveforms of the sensor during different hand movements including (a) making a fist; (b) thumb bending; (c) wrist stretching and bending; and (d) wrist waving.
Figure 11.
Measured response waveforms of the sensor during different hand movements including (a) making a fist; (b) thumb bending; (c) wrist stretching and bending; and (d) wrist waving.


Table 1.
The relationship between the output response of the signal generator and the force generated by the loudspeaker.
Table 1.
The relationship between the output response of the signal generator and the force generated by the loudspeaker.
| Output Voltage (V) | 1 | 3 | 5 | 7 | 9 | 11 |
| Force (N) | 0.48 | 0.99 | 1.45 | 1.96 | 2.45 | 2.95 |
Table 2.
Sensitivity of wrist PVDF piezoelectric sensor under different excitation frequencies.
| Frequency (Hz) | 1 | 2 | 5 | 10 | 15 | 20 |
| Sensitivity (pC/N) | 1.54 | 2.01 | 2.34 | 2.81 | 3.01 | 3.10 |
© 2018 by the authors. Licensee MDPI, Basel, Switzerland. This article is an open access article distributed under the terms and conditions of the Creative Commons Attribution (CC BY) license (http://creativecommons.org/licenses/by/4.0/).
Share and Cite
MDPI and ACS Style
Hu, Y.; Kang, W.; Fang, Y.; Xie, L.; Qiu, L.; Jin, T. Piezoelectric Poly(vinylidene fluoride) (PVDF) Polymer-Based Sensor for Wrist Motion Signal Detection. Appl. Sci. 2018, 8, 836. https://doi.org/10.3390/app8050836
AMA Style
Hu Y, Kang W, Fang Y, Xie L, Qiu L, Jin T. Piezoelectric Poly(vinylidene fluoride) (PVDF) Polymer-Based Sensor for Wrist Motion Signal Detection. Applied Sciences. 2018; 8(5):836. https://doi.org/10.3390/app8050836
Chicago/Turabian StyleHu, Yaohui, Wuwei Kang, Yong Fang, Lingrui Xie, Longzhen Qiu, and Tao Jin. 2018. "Piezoelectric Poly(vinylidene fluoride) (PVDF) Polymer-Based Sensor for Wrist Motion Signal Detection" Applied Sciences 8, no. 5: 836. https://doi.org/10.3390/app8050836
Note that from the first issue of 2016, this journal uses article numbers instead of page numbers. See further details here.