Propagation of Elastic Waves in a One-Dimensional High Aspect Ratio Nanoridge Phononic Crystal
by
 , ,
, ,
Abdellatif Gueddida
1,2, 
Yan Pennec
1,*,
El Houssaine El Boudouti
1,2,
George Fytas
3,4 and
Bahram Djafari Rouhani
1 1
Institut d’Électronique, de Microélectronique et de Nanotechnologies, UMR-CNRS 8520, Université de Lille, 59655 Villeneuve d’Ascq, France
2
LPMR, Département de Physique, Faculté des Sciences, Université Mohamed I, 60000 Oujda, Morocco
3
Max Planck Institute for Polymer Research, Ackermannweg 10, 55021 Mainz, Germany
4
Department of Materials Science, University of Crete and IESL/FORTH, 71110 Heraklion, Greece
*
Author to whom correspondence should be addressed.
Appl. Sci. 2018, 8(5), 805; https://doi.org/10.3390/app8050805
Submission received: 11 April 2018
/
Revised: 13 May 2018
/
Accepted: 15 May 2018
/
Published: 17 May 2018
(This article belongs to the Special Issue Brillouin Scattering and Optomechanics)
Abstract
:We investigate the propagation of elastic waves in a one-dimensional (1D) phononic crystal constituted by high aspect ratio epoxy nanoridges that have been deposited at the surface of a glass substrate. With the help of the finite element method (FEM), we calculate the dispersion curves of the modes localized at the surface for propagation both parallel and perpendicular to the nanoridges. When the direction of the wave is parallel to the nanoridges, we find that the vibrational states coincide with the Lamb modes of an infinite plate that correspond to one nanoridge. When the direction of wave propagation is perpendicular to the 1D nanoridges, the localized modes inside the nanoridges give rise to flat branches in the band structure that interact with the surface Rayleigh mode, and possibly open narrow band gaps. Filling the nanoridge structure with a viscous liquid produces new modes that propagate along the 1D finite height multilayer array.
1. Introduction
The propagation of elastic and acoustic waves in phononic crystals has been intensely studied over the last three decades [1,2]. Similarly to photonic crystals that prohibit the propagation of optical or electromagnetic waves [3], phononic crystal can give rise to complete band gaps in which elastic waves are not allowed. The existence and the wideness of the phononic band gaps strongly depend on both the nature of the constituting media and the geometry of the crystal, including the filling fraction and the shape of the inclusions. Complete phononic band gaps have been first demonstrated for bulk waves [2,4] before being studied for Lamb [5,6] and surface acoustic waves [7,8]. Numerous attractive properties of phononic crystals as phononic waveguides, resonators, and stubs have been pointed out over different lengths and frequency scales [9].
Several works have been devoted to the study of surface acoustic waves (SAW). In contrast to uniform materials where only Rayleigh waves propagate at the surface, additional surface localized vibration modes can be observed when a periodic lattice is deposited on the substrate surface. Simple one-dimensional (1D) periodical ridges built on a uniform substrate were already an issue in the technological application of surface acoustic waves in the interdigitated transducers (IDT) [10]. Recently, they were met with renewed interest thanks to the boost of phononic crystal studies. The 1D periodic grating on surfaces has been first investigated theoretically, considering the propagation of sagittal and shear horizontal acoustic waves [11,12]. Experimentally, the investigation of the surface acoustic band in a 1D periodic array of nanowires has been performed using the laser-induced transient grating technique [13,14,15], revealing the resonant modes induced by the nanowires. Brillouin Light Scattering (BLS) has also proven its efficiency for demonstrating the elastic properties of 1D phononic crystal grating [16,17,18].
Due to progress in microfabrication technologies such as microlithography and molecular beam epitaxy, it is now possible to create well defined 1D micro or nanogratings on an otherwise planar surface in which the polymer material presents a high aspect ratio of up to 10 [19]. Additionally, while most of the 1D grating structures are based on semiconductor materials, hybrid 1D gratings comprising hard inorganic and soft polymers represent an alternative flexible platform with distinct advantages: large and tunable band gaps [20,21,22], easy fabrication [23], and variation of total thickness and spacing for concurrent operation at hypersonic phonon and visible photon frequencies. The structure investigated here is a one-dimensional nanoridge phononic crystal of finite height grafted on a semi-infinite substrate. The fabrication of such a sample, which is made of a grating of epoxy nanoridges deposited on a glass substrate, has been presented by Goldenberg et al. [23]. Recently, we have shown that the band structure of such a high aspect ratio (AR) nanoridges structure can be partly captured by means of Brillouin light scattering (BLS) experiments [24]. In particular, we demonstrated that the BLS modes can be explained theoretically with a good agreement with their intensities. In the present paper, our main purpose is to deeply investigate the high AR nanoridge structure as a function of the geometrical parameters, considering the two directions of propagation, i.e., parallel and perpendicular to the nanoridges, including wave localization and polarization (Section 3). The second objective, which will be developed in Section 4, is to study the new features in the band structure when the grooves of the native phononic crystal are filled with a liquid.
2. Model and Method
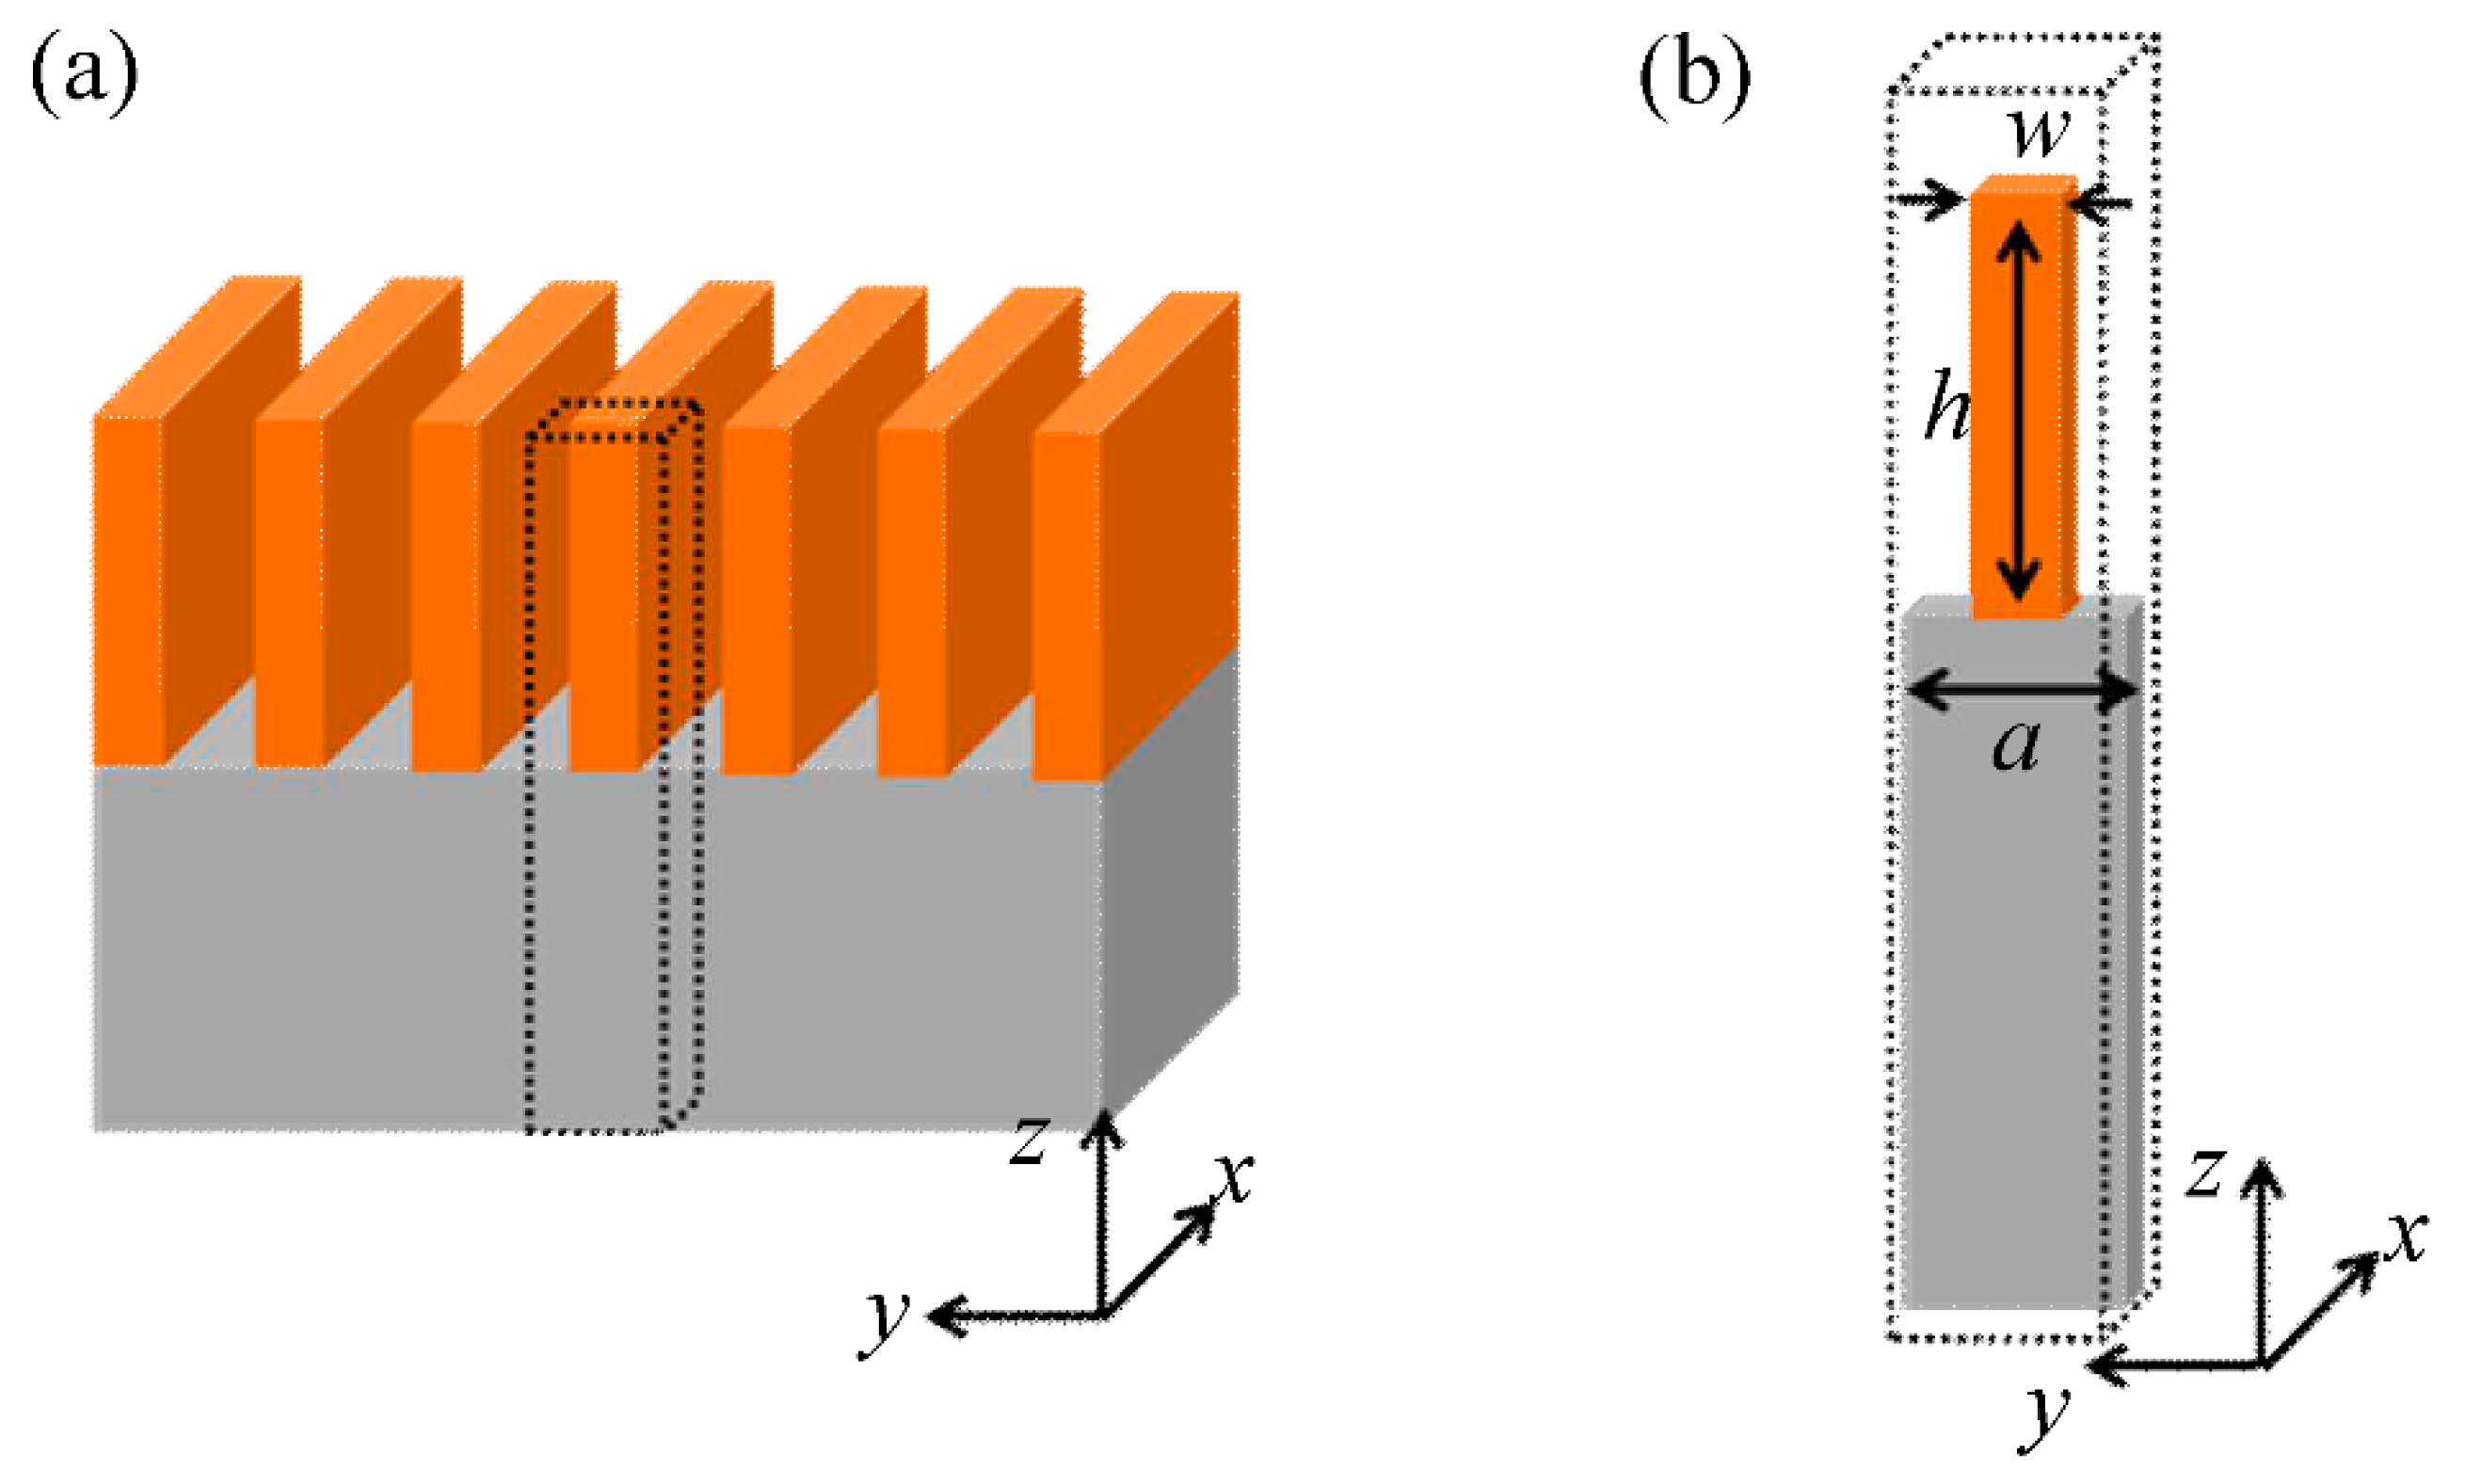
The sample is made of a periodic grating of epoxy (POSS) nanoridges grafted on the surface of a glass substrate. Figure 1 shows a three-dimensional (3D) representation of the structure, together with the elementary unit cell used for the calculations, in which a = 630 nm is the lattice parameter, and the height and the width of the nanoridges are h = 2.7 µm and w = 250 nm, respectively. With these geometrical parameters, the nanoridges present a high aspect ratio (AR), larger than ten (AR = h/w = 10.2) that has not yet been considered in the literature. The density, transverse velocity, and longitudinal velocity of the involved materials, i.e., epoxy and glass, are given in Table 1.
The dispersion curves (frequency versus wave vector) of the nanoridge structure are calculated by solving the elasticity equations of motion with the help of the finite element method (FEM) performed with the commercial code COMSOL multiphysics. Due to the periodicity of the structure along the y direction (Figure 1a), the problem is solved in a one-unit cell by assuming periodic boundary conditions at the limits of the unit cell. Free stress boundary conditions are used at the surfaces of the nanoridge that are in contact with vacuum. To simulate the semi-infinite nature of the substrate, we have considered a finite height of the glass substrate equal to “4 × h”, under which we add an artificial medium of height “h” with transverse and longitudinal velocities that are two times higher than those of the glass substrate. Thus, the surface mode at the bottom will not appear in the non-radiative area of the dispersion curves. The dispersion curves are plotted in terms of frequency as a function of the wave vector q in the x (resp. y) direction parallel (resp. perpendicular) to the nanoridges.
3. Results and Discussion
3.1. Propagation Parallel to the 1D Phononic Nanoridge
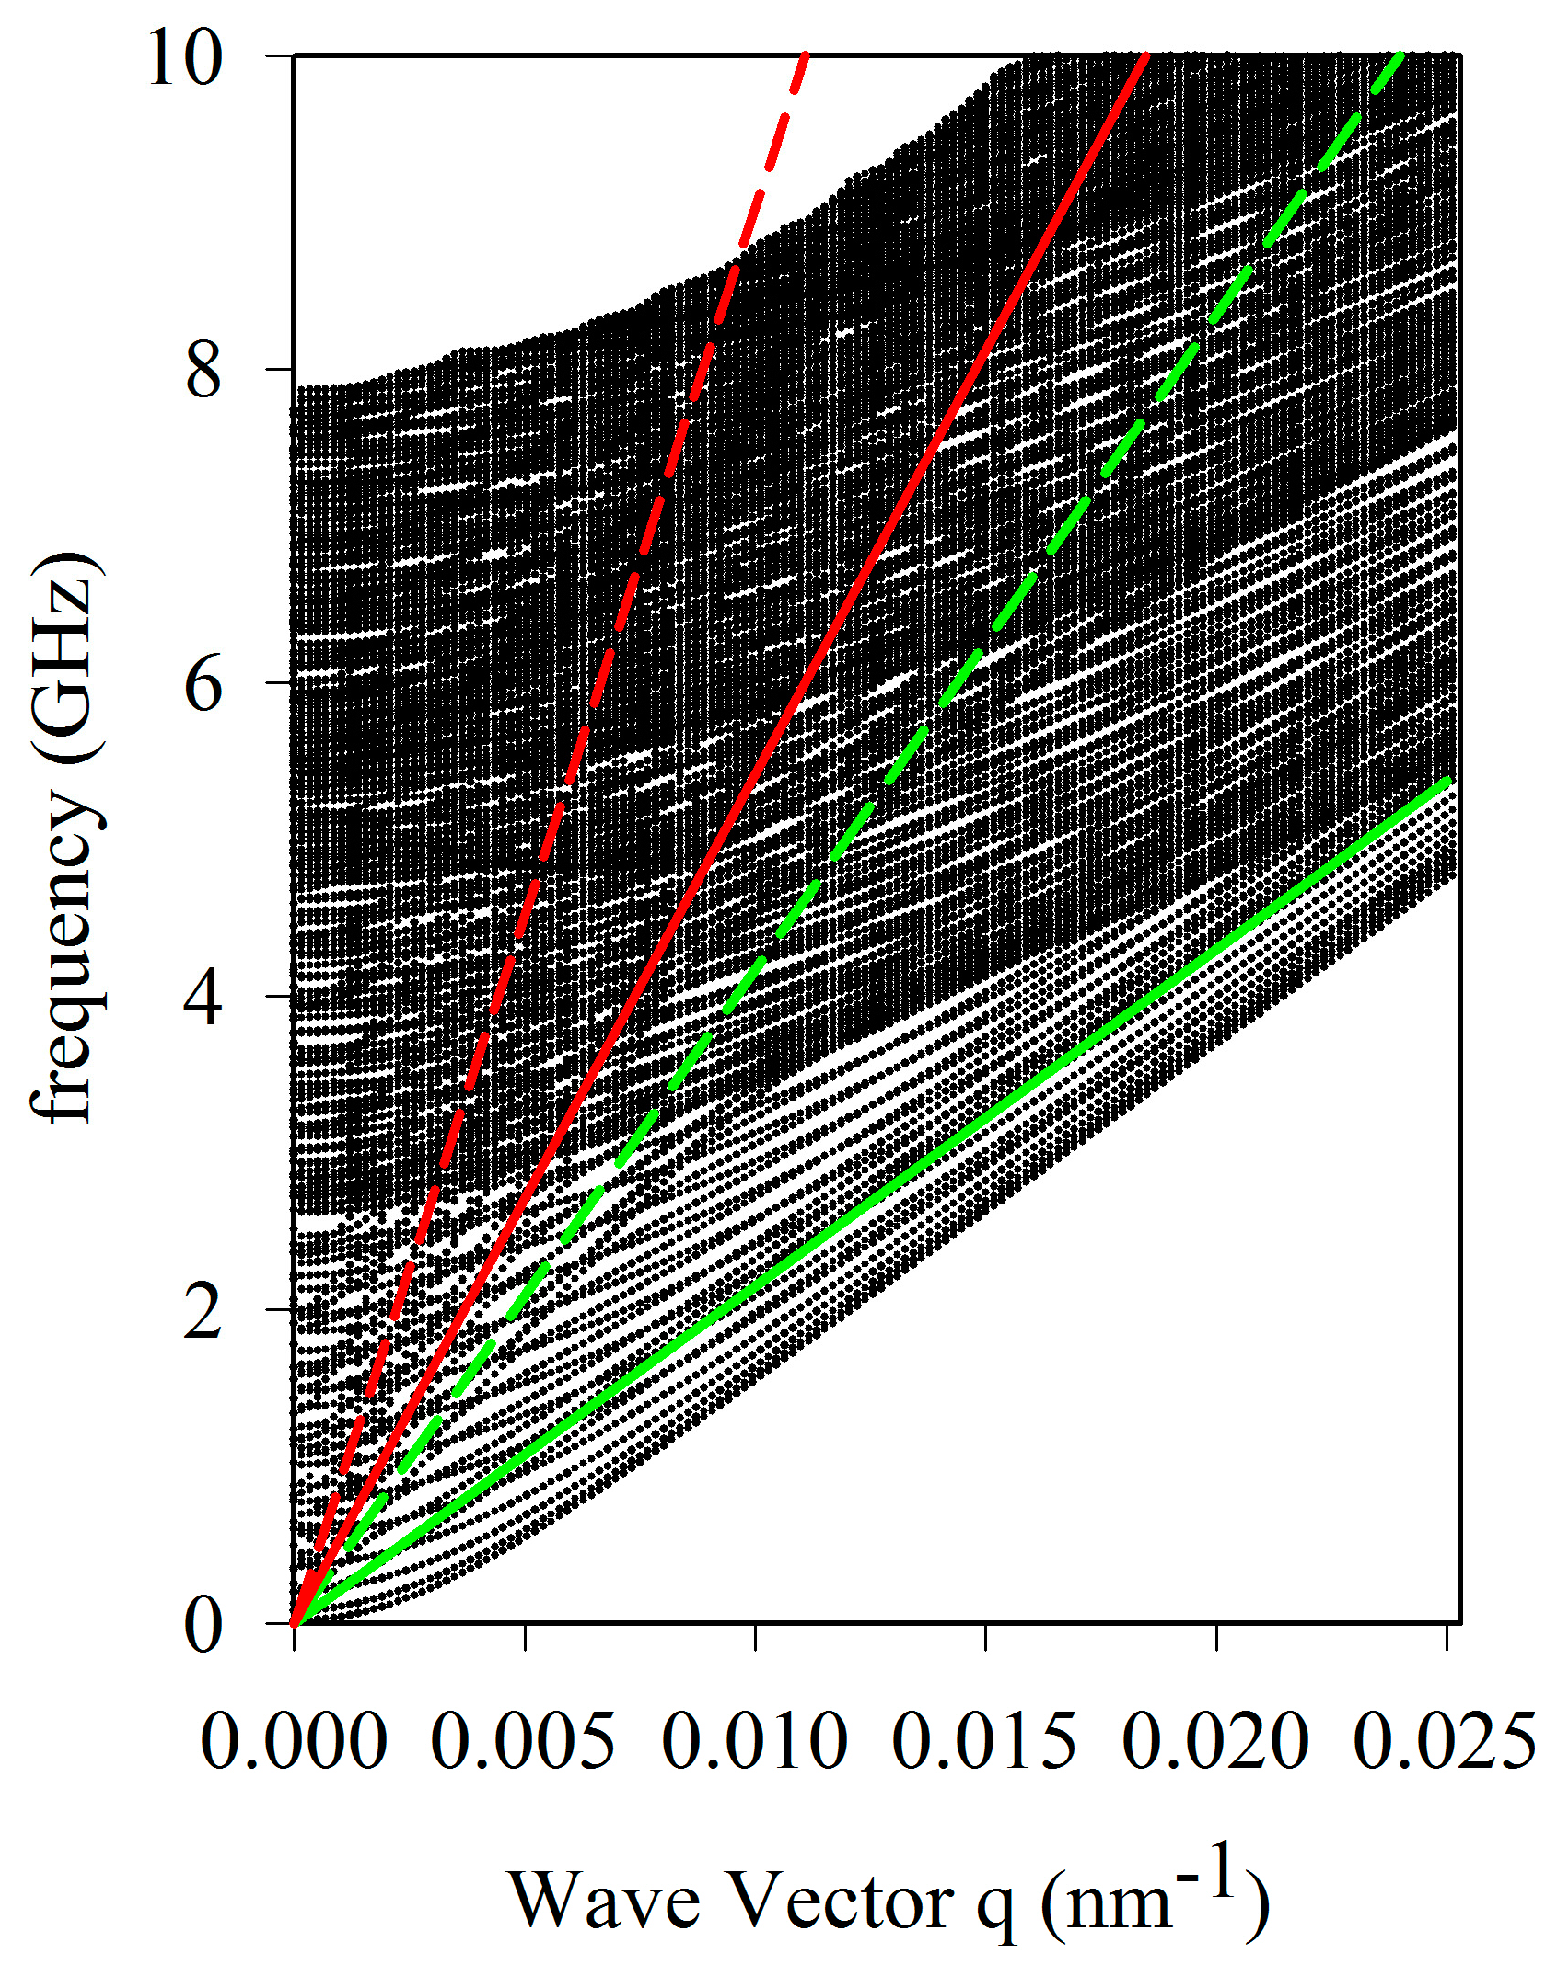
Figure 2 represents the dispersion curves for the propagation direction parallel to the nanoridges (along x). Since the structure does not present any periodicity in this direction, we chose an arbitrary q limit of 0.025 nm−1 in accordance with typical BLS experiments [24]. The dispersion curves of the nanoridge structure are calculated with the following parameters: a = 630 nm, h = 2.7 µm, and w = 250 nm. The calculated dispersion curves show a huge number of branches, mainly due to the high aspect ratio of the nanoridges (AR = 10.2).
We report in color on the same diagram the bulk phase velocities (straight lines) of the involved materials. The red (green) dashed and solid lines correspond respectively to the longitudinal and transverse velocities of the glass (epoxy). In the following, our interest will be focused on the modes below the transverse sound lines of the glass substrate (red solid line), which are expected to be localized at the surface of the substrate and/or localized in the nanoridge phononic structure.
To go further and learn more about the localization and polarization of the surface acoustic modes, we proceed to a selection of modes using a band-sorting method, which enables us to keep only the modes that are highly confined inside the nanoridges. In addition, we divide them into two sets according to the following relations:
The expression (resp. ) gives the contribution of the modes with the components and (resp. ), which are localized only inside the nanoridge. In particular, modes with high and (resp. ) components display a (resp. ) close to 1. The black curves in Figure 3a,d give respectively the dispersion branches obtained from the dispersion curves of Figure 2 that satisfy the conditions and .
From a general point of view, one can notice that the highlighted black modes coincide with the Lamb modes of an infinite plate with respectively xy and z polarizations, as mentioned by Heyliger et al. [25]. This conclusion is supported by the calculated dispersion curves of an infinite epoxy plate (red dotted lines) with a thickness of w = 250 nm where we can notice a good similarity between the modes belonging to the nanoridge structure with the Lamb modes of the plate of epoxy. The reason for this similarity is due to the high aspect ratio of the nanoridge, which brings the vibration modes of the nanoridge in close connection to those of a single plate. We called these modes A0, S0, SH0, and SH1 ‘-like’ modes in reference to the antisymmetric and symmetric propagation modes of the plate that are commonly called An and Sn for the modes with xy polarization, and SHn for the modes with z polarization. The calculation of the intensity of the displacement fields at the wave vector q = 0.0135 nm−1, which is indicated by a red arrow on the dispersion curves that are represented in Figure 3b,e, clearly shows the localization of the field inside the nanoridge together with their components and symmetries. This confinement is in perfect agreement with the corresponding modes of an infinite plate (not shown here). However, and contrary to an infinite plate, each of the fundamental plate ‘like’ modes is followed by a set of higher harmonics corresponding to stationary waves along the height of the nanoridge, and displaying more and more oscillations in the vertical direction. An illustration of the second and third harmonics is presented in Figure 3c,f.
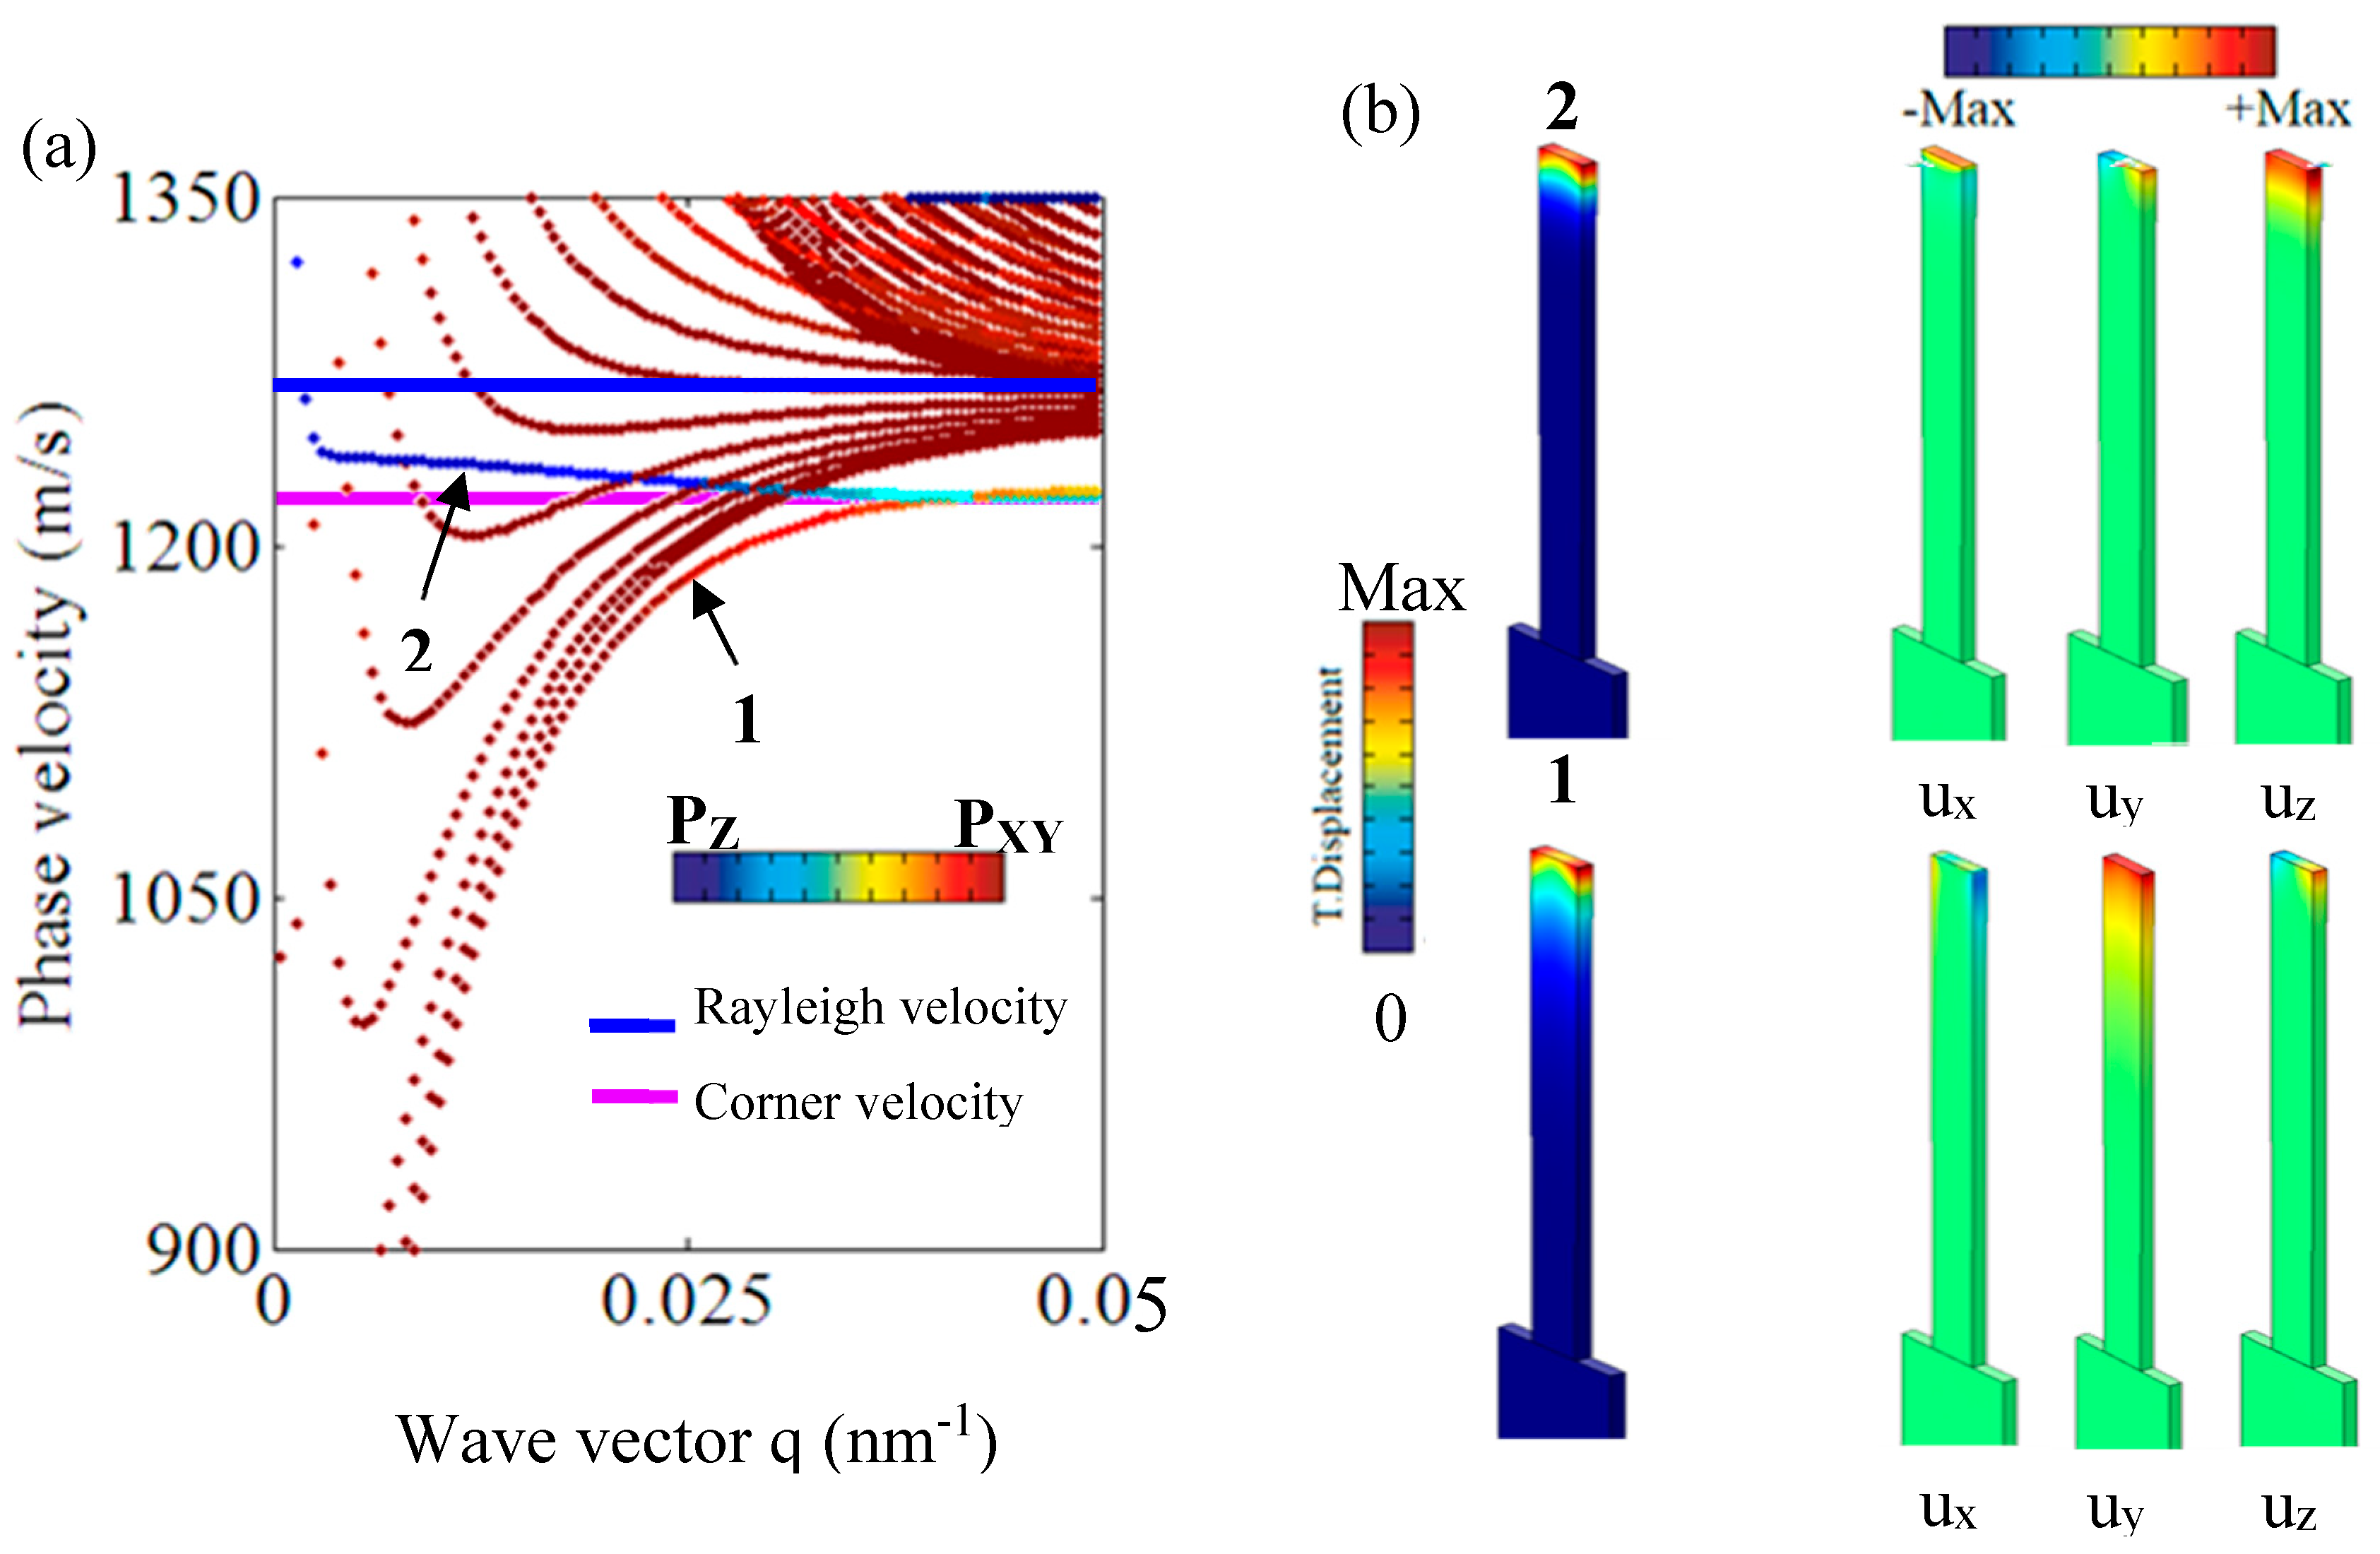
Another intriguing feature, which is actually not present in the dispersion curves of an infinite plate, concerns the modes lying in the region below the fundamental A0-like mode of the nanoridge. To give a better representation of the full set of modes calculated in Figure 2, we show in Figure 4a the phase velocity diagram versus the wave vector q. The diagram is represented with a band-sorting calculation following Equations (1) and (2). The red (resp. blue) color corresponds to modes that have a high value of Pxy (resp. Pz), meaning a strong xy (resp. z) polarization. As we can see, at a high-wave vector (q = 0.05 nm−1), the pseudo modes ‘A0-like’ and ‘S0-like’ of xy polarization, and their harmonics, below the transverse velocity of epoxy (1350 m/s), move toward a new limit represented by a blue solid line. This line corresponds to the velocity of the well-known Raleigh wave of epoxy. It means that, at a high q vector, the ‘A0-like’ and ‘S0-like’ modes move toward a localized mode at the surface of the nanoridge without fully penetrating inside the epoxy plate. In addition, two modes appear well below the Rayleigh wave velocity of epoxy and move towards another limit, which is represented by a pink solid line. As shown in Figure 4b, these modes are localized in the corners of the nanoridges. Moreover, one of the two modes is xy polarized (mode 1), while the other is z polarized (mode 2). This conclusion is supported both by the color of the modes ‘1′ and ‘2′ in Figure 4a and the components of their elastic fields, as represented Figure 4b. It is well known that such wedge waves, which are confined at solid edges, exhibit a phase velocity below those of surface and bulk waves [26]. These modes exist because of the finite size of the nanoridge.
3.2. Propagation Perpendicular to the 1D Phononic Nanoridge
We now consider the propagation along the direction perpendicular to the nanoridges of the same height and width, namely: h = 2.7 µm and w = 250 nm. The corresponding dispersion curves (Figure 5a) in the non-radiative region below the sound cone of the substrate display many flat branches with zero group velocities. It means that the modes do not propagate, and are strongly confined in the nanoridges. To understand the origin of these modes, we proceed to the calculation of the eigenmodes of a single nanoridge that is fixed at the bottom (Figure 5b). It results that the eigenfrequencies of the single nanoridge almost perfectly match the frequencies of the flat dispersion curves of the 1D nanoridge. This result is confirmed through an analysis of the displacement fields at the frequencies 1, 2, and 3 (Figure 5a). One can see that the distribution of the displacement fields of modes 4, 5, and 6 of the one side fixed plate (Figure 5b) exhibit the same behavior as those of the supported ridges. Just below the sound line of the SiO2 substrate, one can see that the flat branches interact with the surface Rayleigh mode, give rise to small anticrossings, and possibly lead to the opening of the small band gaps.
3.3. Effect of the Geometrical Parameters
The previous calculations have been realized in the particular case of a high aspect ratio of the nanoridges. In what follows, we investigate the effect of the geometrical parameters of the nanoridges for the directions that are parallel and perpendicular to the nanoridges.
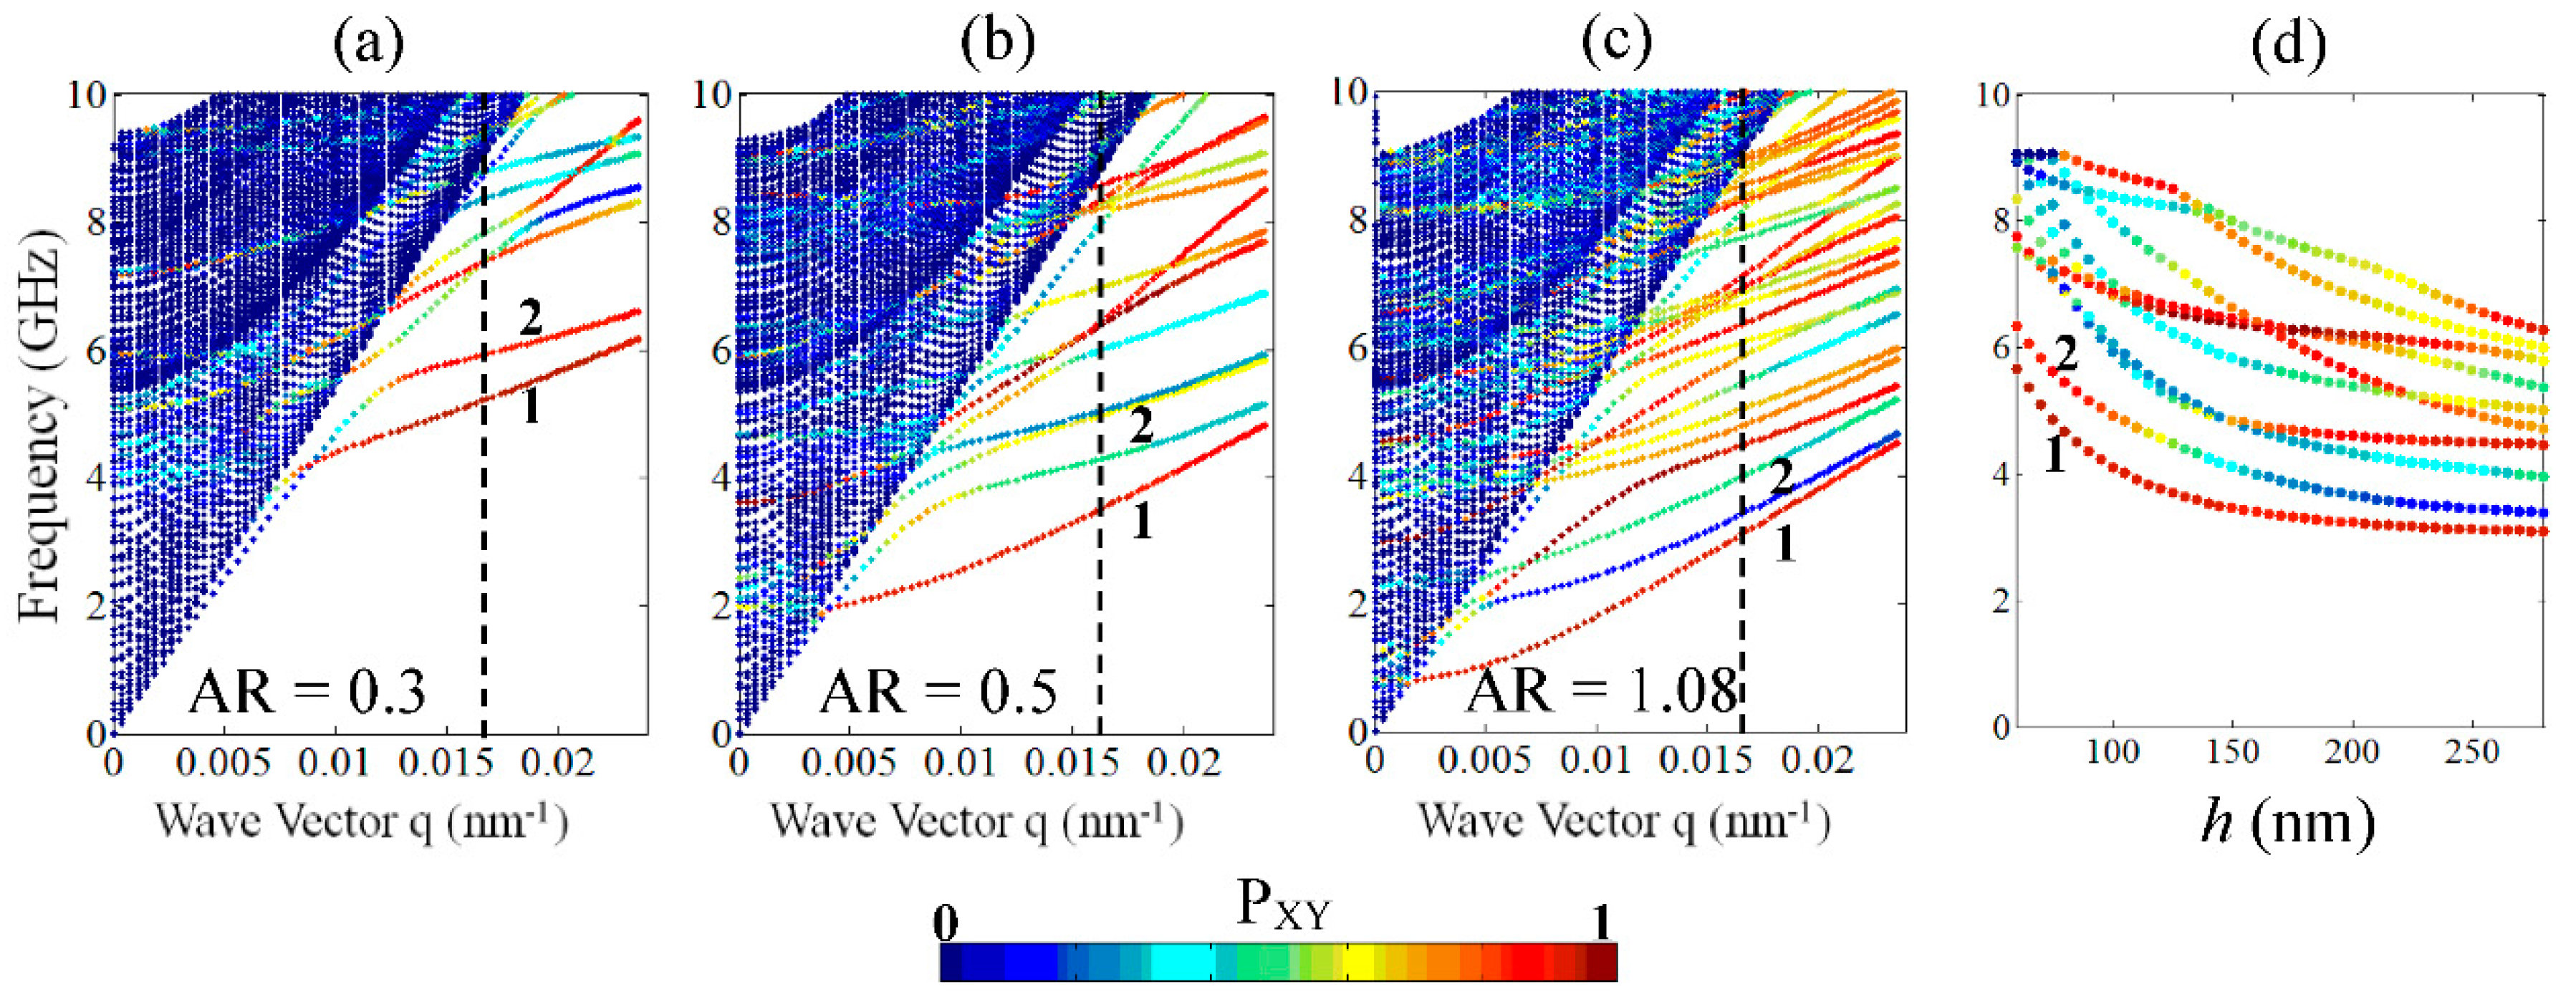
Figure 6 shows the dispersion curves for the parallel propagation direction to the nanoridges for three values of height: h = 68 nm (i.e., AR = 0.3), h = 135 nm (i.e., AR = 0.5), and h = 270 nm (i.e., AR = 1.087). The band diagrams are represented with a band-sorting calculation, which highlights the modes inside the nanoridges as a function of their ‘in-plane’ Pxy polarization with a color bar, following Equation (1).
Two features can be noticed from the analysis of the band diagrams. First, one can see that, as predicted, the number of branches increases with the height h of the nanoridges, leading to the limiting case that is presented in Figure 2 (AR = 10.2). For the low aspect ratios, the behavior of the branches cannot be compared to A0 and S0-like modes of a single plate, as shown previously for high AR. Second, one can see that the polarizations of the branches generally change when the height increases. For example, when h = 68 nm, branch 2 is red, indicating that the mode is polarized in the (x, y) plane; meanwhile, when the height increases, the second branch becomes green for h = 135 nm and blue for h = 270 nm, meaning that the polarization becomes along z (Pz close to 1). Figure 6d reports in detail the evolution of the frequency of the first 10 modes and their polarization as a function of the height h for a fixed wave vector q = 0.0167 nm−1. Focusing specifically on branch 2, one can notice a progressive conversion of the polarization from xy to z (red to blue color) as far as the height of the nanoridge increases. At the same time, the polarization of branch 1 remains unchanged. Such a physical behavior can have a considerable effect on the BLS experimental measurements spectra where the polarization plays a central role [27]. One can note that branch 1 corresponds to the A0-like mode, and branch 2 corresponds to one of the edge modes.
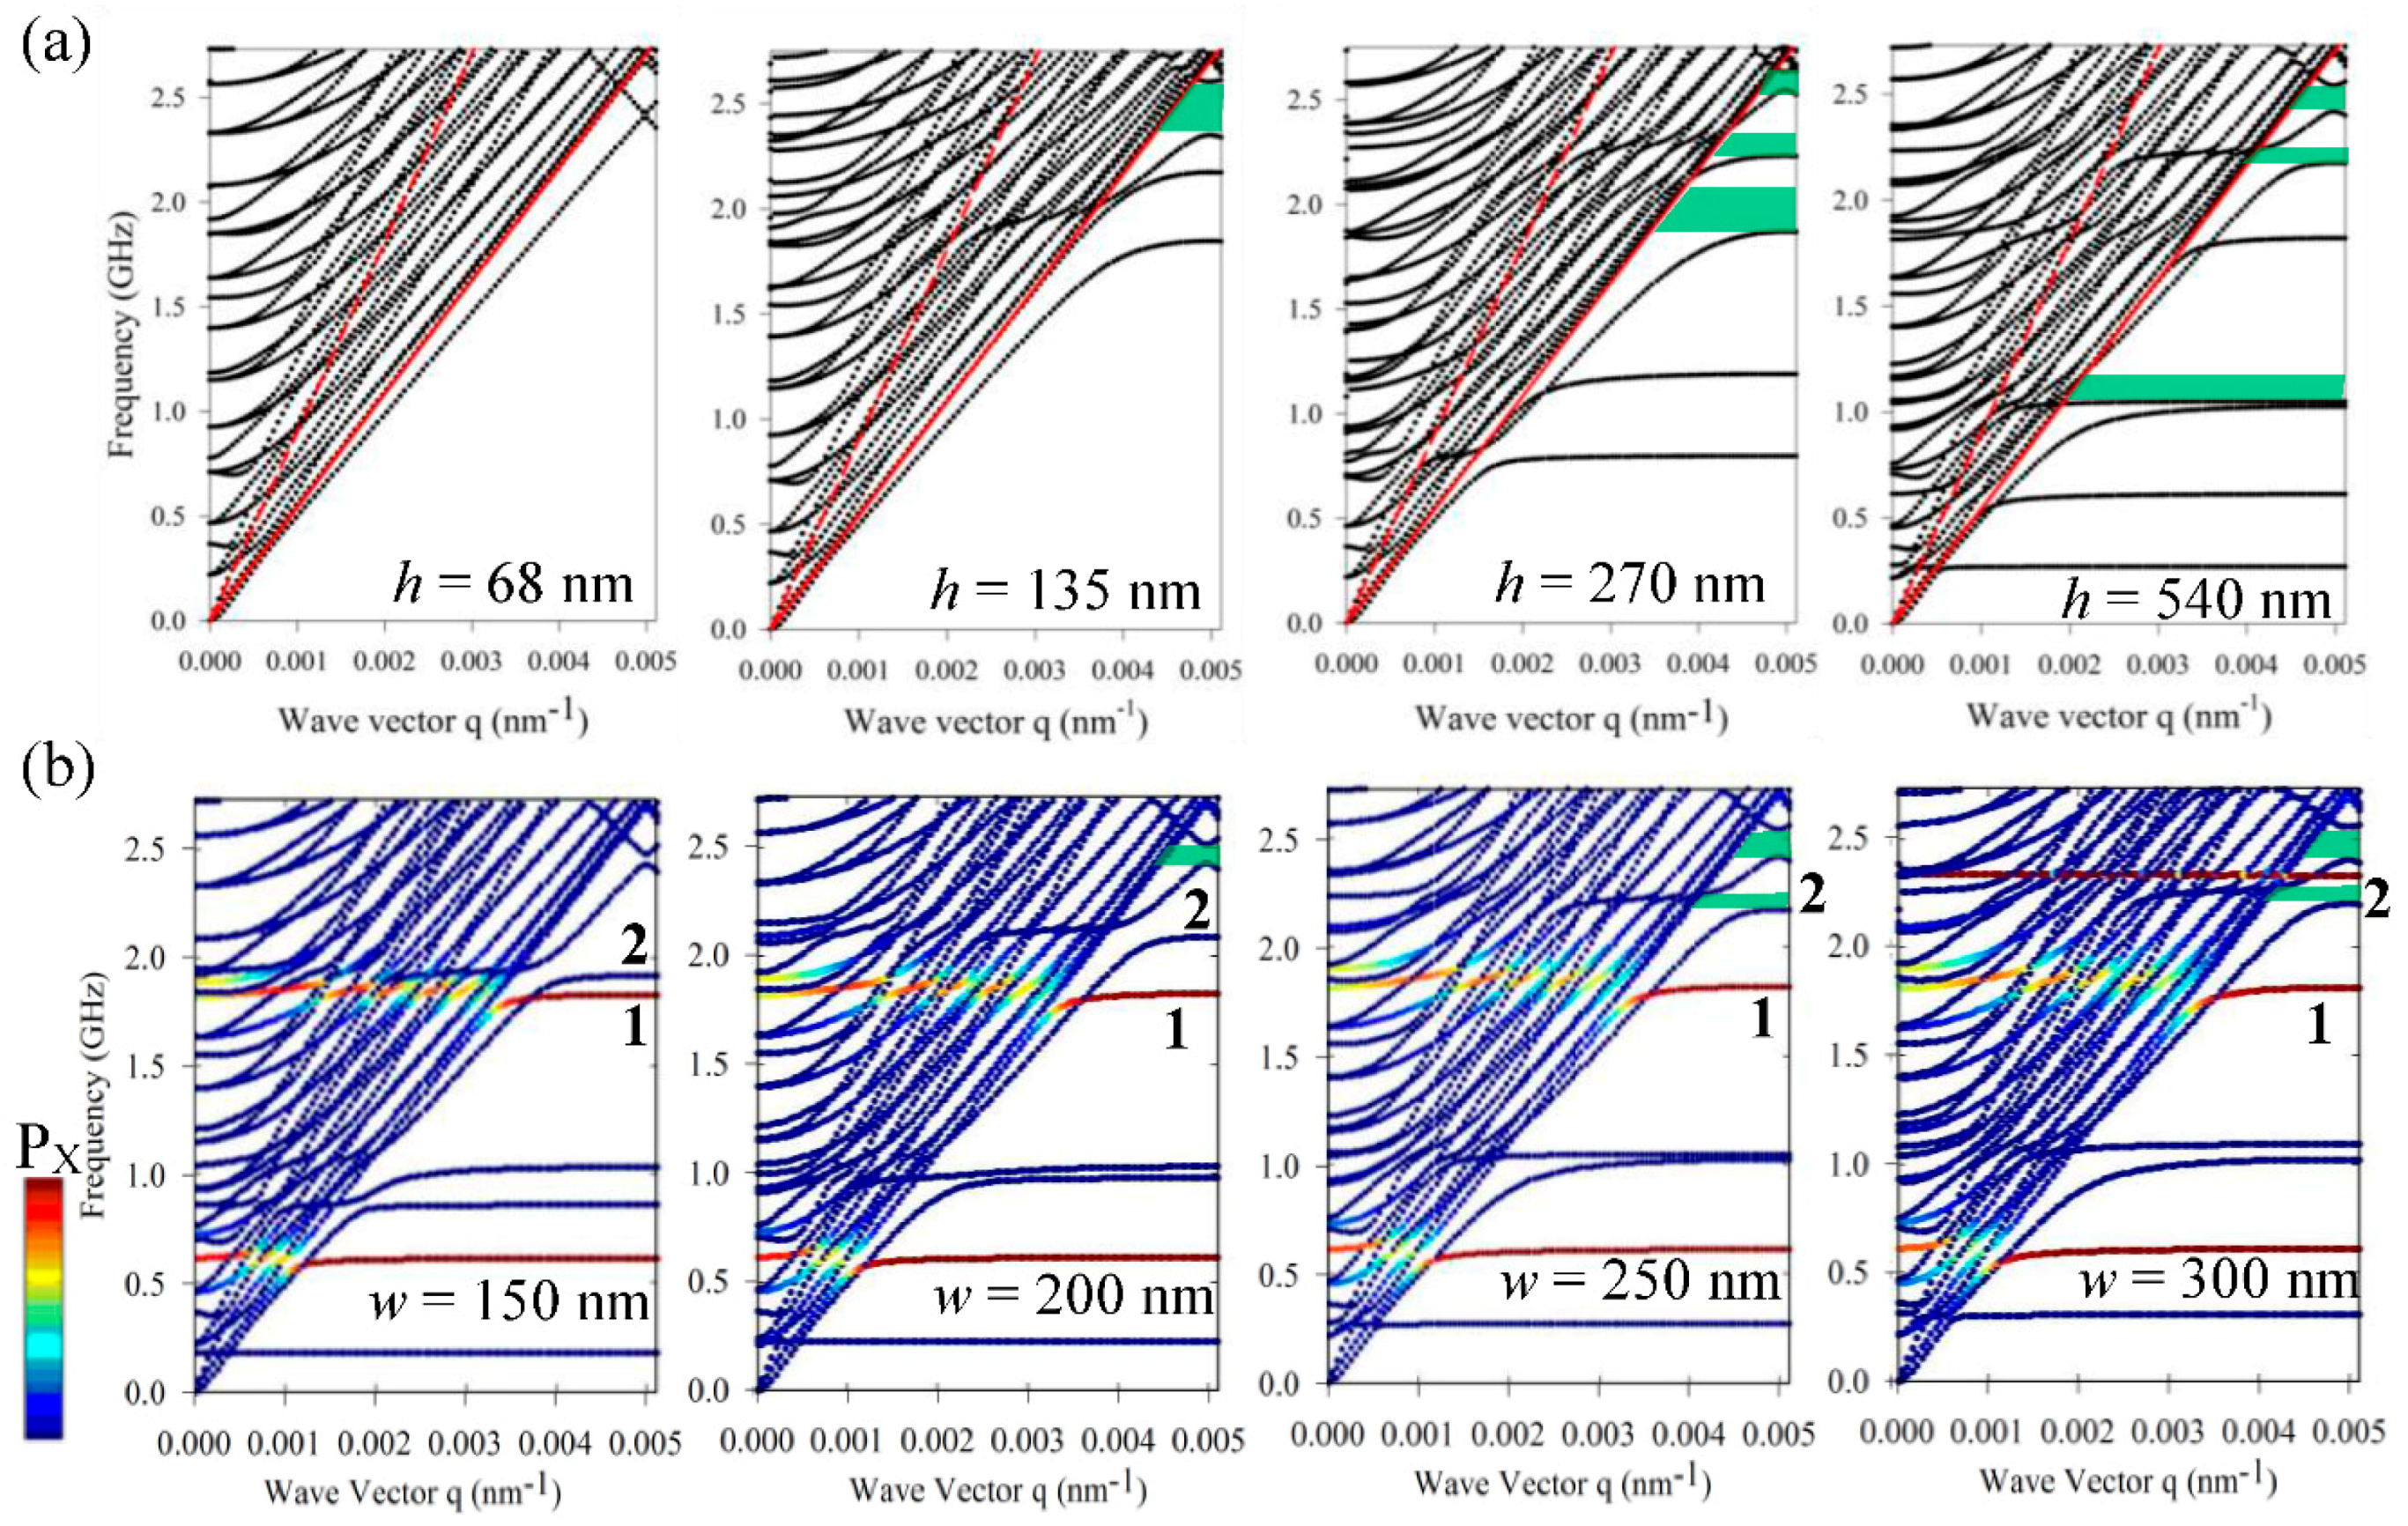
Figure 7 sketches the evolution of the dispersion curves as a function of the geometrical parameters of the nanoridge for the direction perpendicular to the nanoridges. When the height of the nanoridge increases from 68 nm to 540 nm, with the the thickness w = 250 nm being constant, one can see that the number of flat branches increases and shifts to low frequencies. As mentioned in the previous section, the flat branches correspond to eigenmodes of the clamped nanoridge. In the band structures of Figure 7, one can see the occurrence of small band gaps where the surface acoustic waves cannot propagate at the surface of the substrate (green area).
Similarly, we proceed to the calculation of the dispersion curves as a function of the width w from 150 nm to 300 nm, for a constant value of the height h = 540 nm (Figure 7b). In this case, some of the branches shift to high frequencies (see for instance the branch labeled 2), while others slightly decrease toward low frequencies (see for instance the branch labeled 1). To find the origin of such a behavior, we proceed to a band-sorting calculation and represent bar the modes inside the nanoridges of polarization x, i.e., in the direction of propagation, with a color. Within this representation, one can clearly see that the width of the nanoridges affects the branches of vibration that are polarized respectively parallel and perpendicular to the propagation direction.
3.4. Infiltration with a Liquid
In this last section, we have filled the grooves between the nanoridges with a polymer liquid with the commercial name ‘Cargille’. This polymer has a density of 1000 kg/m3 and a longitudinal velocity of 1670 m/s. The contrast between epoxy and Cargille comes from their different physical natures, i.e., liquid and solid, while the densities are almost the same (see Table 1). The nanoridge structure that was considered for the calculations presents the following parameters: a = 630 nm, h = 2.7 µm, and w = 250 nm. In the numerical FEM model, free stress boundary conditions have been applied at the surface of the liquid, on top of the unit cell. At the liquid/solid interface, the normal component of the displacement, as well as the normal stress, are continuous. We do not include capillary forces, which at the considered wavelengths should be significant at much lower frequencies than those (GHz) considered in this work. The validity of the model is also supported by our previous investigations of solid/liquid phononic crystal, in which we obtained a good agreement between the experimental and the theoretical band structure using the same numerical model [24,28].
As the structure is mixed, i.e., contains simultaneously a liquid and a solid, we have to adapt the method of calculation to these two different media. First, the solid part follows the elastic wave equation:
where represents the density, represents the angular frequency, u represents the displacement field vector, and represents the stress tensor. Second, the liquid part of the structure is computed with the pressure equation of propagation:
where p represents the acoustic pressure, and c represents the sound velocity in the liquid.
At the solid/liquid interface, the boundary conditions are given by the continuity of the displacements and stress normal components. These conditions are given by the two equations:
where is the normal direction at the solid/liquid interface, is the stress tensor, is the displacement field in the solid, and p is the pressure field in the liquid part.
We then calculated the dispersion curves of the phononic crystal infiltrated with the liquid (Cargille) in the two directions of propagation: parallel and perpendicular to the nanoridges.
For the direction parallel to the nanoridges, we applied a band-sorting calculation to select, among the huge number of modes, those that presented an ‘in-plane’ polarization Pxy that was close to 1 (Equation (1)). To do so, the components of the displacement field in the liquid part have been deducted from the following equations:
The results of the calculations are presented in Figure 8a where only the modes that satisfied the condition were kept. These curves can be compared with Figure 3a for the structure without the infiltration. Let us remind that in the latter case, the modes have been attributed to fundamental Lamb-like modes of the nanoridges and their harmonics. Similarly, we have performed the calculation of a 1D infinite multilayer array alternately constituted of epoxy and Cargille. The corresponding dispersion curves are presented with blue color on the same figure. When we compare the two dispersion curves, one can see that the branches of the 1D nanoridges structure infiltrated with Cargille can be associated to the fundamental modes of the 1D infinite multilayer array. In addition, due to the finite size effect of the nanoridges in the vertical direction, the fundamental modes are followed by many others that correspond to higher orders of vibration (harmonic modes)
For propagation in the direction perpendicular to the nanoridges (Figure 8b), we also show in blue the dispersion curves of the infinite 1D periodic epoxy/Cargille multilayer. The dispersion curves of the actual structures, under the condition , can qualitatively be distinguished into the following three categories. (i) Above the SiO2 transverse velocity (red line), the selected modes are localized inside the 1D periodic structure, but can couple to the semi-infinite substrate. Such modes are known as leaky waves. (ii) The modes situated below the transverse velocity of SiO2 (red solid line) and above the lower blue branch are dispersive modes that result from propagation inside the multilayer and interact with the surface of the substrate. They are analogous to the Sezawa waves that are associated with an ad-layer deposited on a substrate. (iii) The branches below the lower blue curve are almost flat, which represents a signature of their localization in the 1D periodic nanostructure. Indeed, as the flat bands fall below the longitudinal velocity of sound in the fluid (Cargille), these modes do not propagate in the fluid.
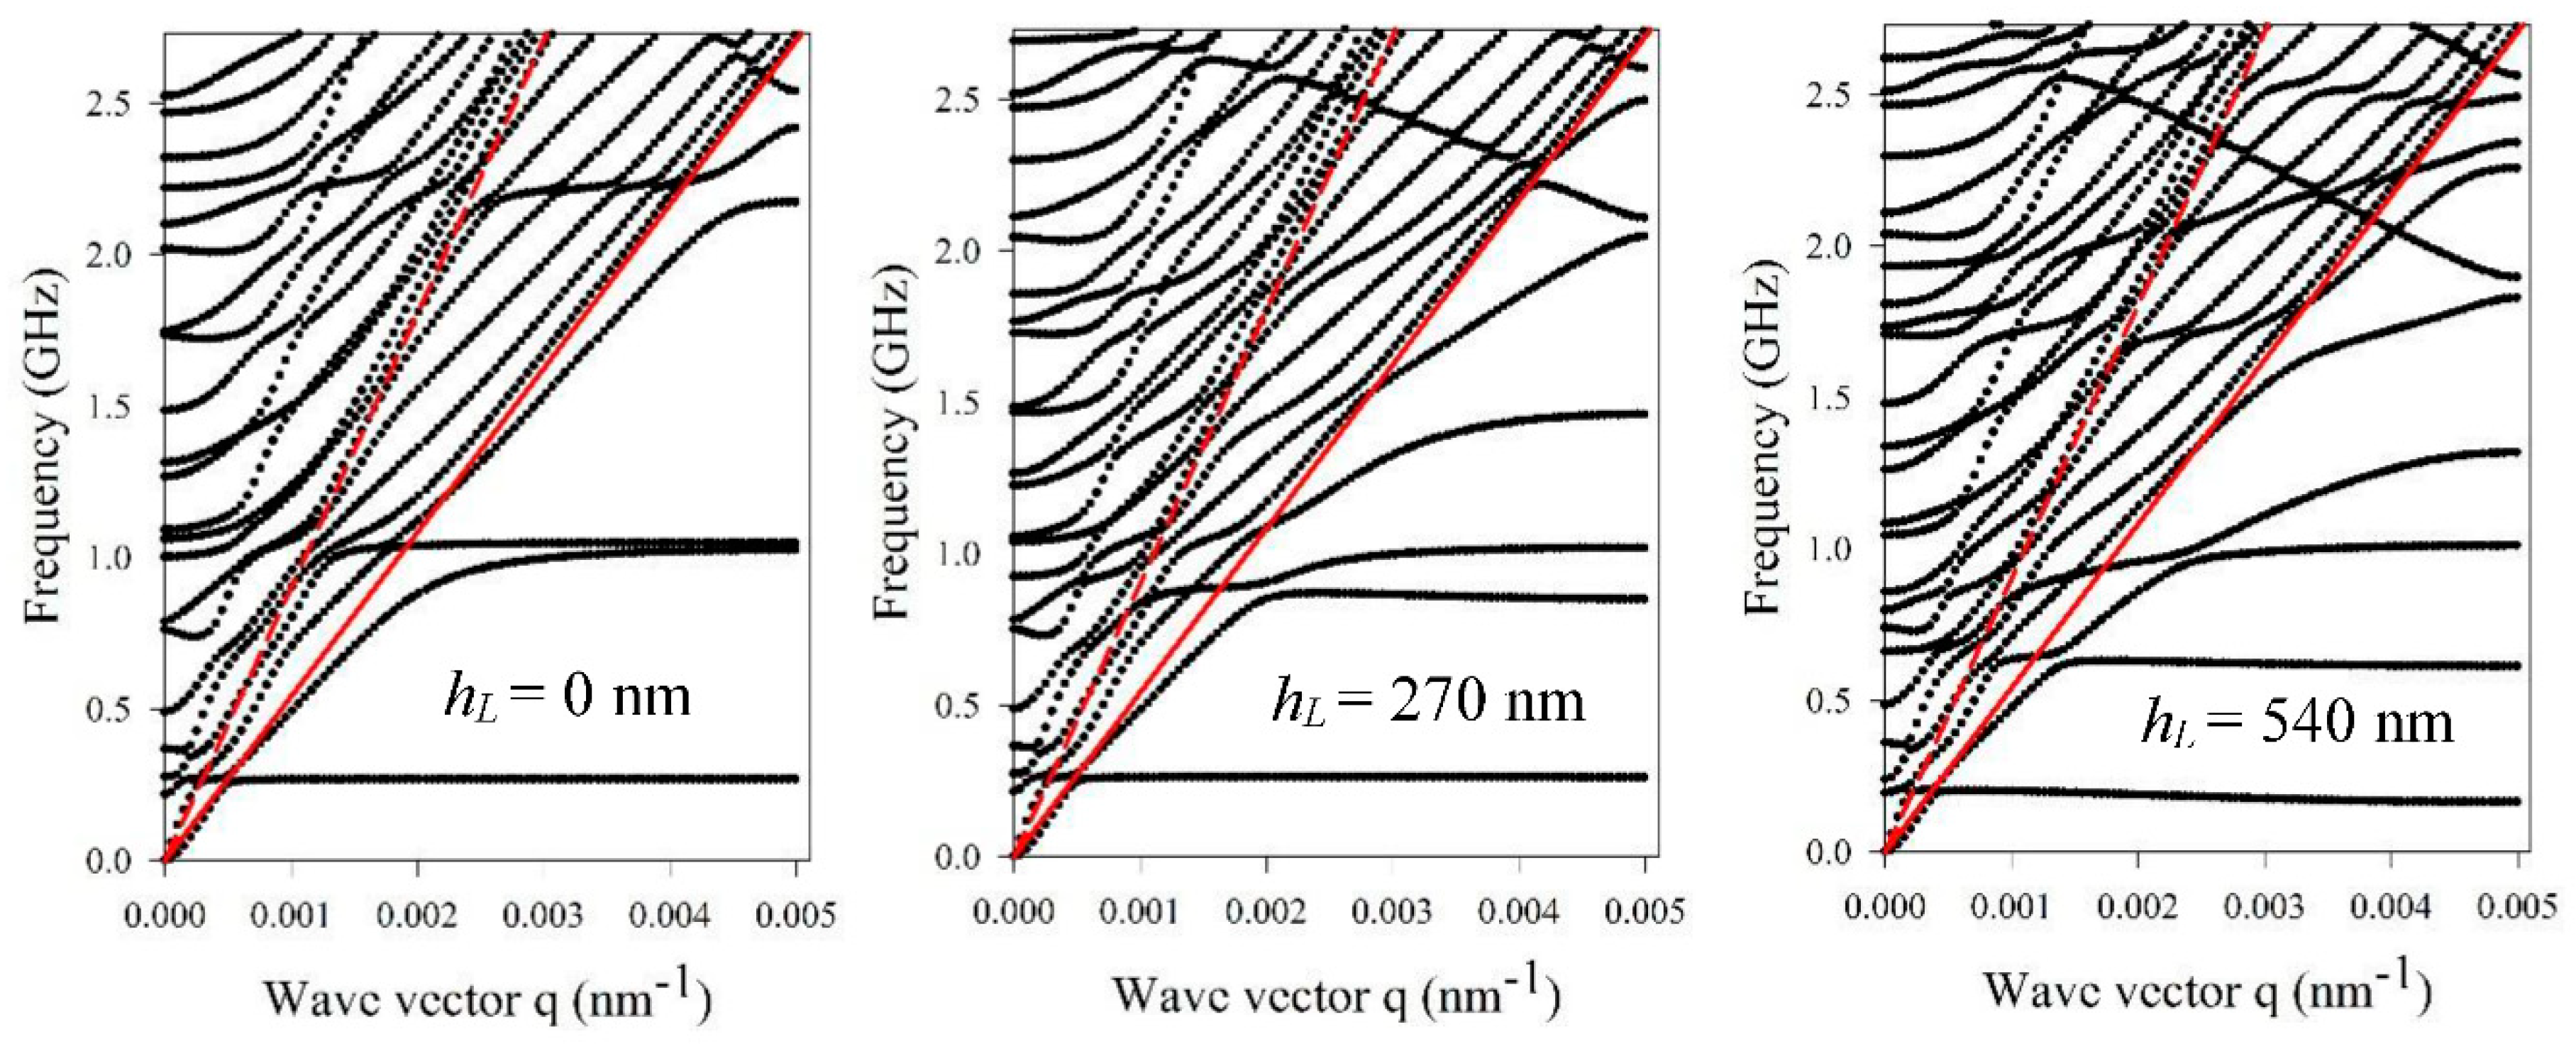
In Figure 9, we discuss the evolution of the dispersion curves as a function of the height of the liquid filling the grooves. The left panel in Figure 9 recalls the dispersion curves corresponding to the nanoridges with a height of 540 nm without infiltration. The middle and right panels in Figure 9 present the calculation when the grooves are filled with two different heights of the liquid polymer: 270 nm and 540 nm, respectively. In each case, one can see that the level of liquid drastically modifies the dispersion curves with the creation of new branches. As discussed previously, these new dispersive branches present a group velocity that is different from zero, and associated with propagating waves at and above the surface of the semi-infinite glass substrate. This propagation can be understood as the ridges now being connected through the grooves filled with a liquid. Therefore, the modes can now propagate through the 1D multilayer array on top of the semi-infinite substrate.
4. Conclusions
In summary, we have investigated the propagation of elastic waves along the parallel and perpendicular directions of epoxy nanoridges with high aspect ratios deposited at the surface of a glass substrate. With the help of the finite element method (FEM), we have been able to discriminate the modes belonging to the 1D grating from the full modes of the whole nanostructure. To do so, we have introduced a band-sorting method and separated the modes as a function of their localization, polarization, and symmetry. In the direction parallel to the nanoridges, we found that, due to the high aspect ratio, the surface acoustic waves coincided with fundamental and higher order Lamb modes of a single plate. Due to the finite size of the nanoridge, we also found harmonic vibrations of the fundamental Lamb modes and two edges’ eigenmodes localized at the free corners of the nanoridge.
In the direction perpendicular to the nanoridges, we have shown the emergence of band gaps for SAW due to the interaction of flat branches with the Rayleigh wave near the sound line of the SiO2 substrate. We also described the evolution of the band gaps as a function of the geometrical parameters of the nanoridges. In particular, we have shown that a polarization mode conversion occurs by changing the height of the ridges. The results presented here can be used as a support in perspective of Brillouin light scattering measurements in this high aspect ratio nanoridge structure [24].
We also investigated the modes of vibration when the grooves between the solid nanoridges (epoxy) are filled with a viscous liquid (Cargille). The liquid layers enable the constitution of a finite 1D multilayer array at the origin of wave propagation on top of the semi-infinite substrate. In the direction parallel to the nanoridges, the modes follow the dispersion curves of a 1D infinite multilayer array with harmonic modes, whereas in the direction perpendicular to the nanoridges, propagative modes with group velocities different from zero have been introduced. These dispersive modes are the consequence of the coupling between the eigenmodes of the nanoridges through the liquid layers. The manipulation and the control of the elastic properties of such devices, and moreover the behaviors emerging from the periodic arrangement of surfaces, could enable developing a new generation of SAW devices. Since some of the features in the band diagram can be very sensitive to the physical and geometrical parameters of the infiltrating fluid, such a device can be useful for sensing purposes, as both theoretically and experimentally proposed recently, in mixed solid/liquid phononic crystal structures [29,30,31].
Author Contributions
A.G. designed and performed the simulations; B.D.R. supervised the research; A.G. and Y.P. prepared the manuscript; A.G., Y.P., E.H. E.B., G.F and B.D.R. discussed the results and reviewed the manuscript.
Acknowledgments
The work was partially supported by ERC SmartPhon No. 694977.
Conflicts of Interest
The authors declare no conflicts of interest
References
- Sigalas, M.; Economou, E.N. Band structure of elastic waves in two dimensional systems. Solid State Commun. 1993, 86, 141–143. [Google Scholar] [CrossRef]
- Kushwaha, M.S. Acoustic band structure of periodic elastic composites. Phys. Rev. Lett. 1993, 71, 2022–2025. [Google Scholar] [CrossRef] [PubMed]
- Yablonovitch, E. Inhibited spontaneous emission in solid-state physics and electronics. Phys. Rev. Lett. 1987, 58, 2059–2062. [Google Scholar] [CrossRef] [PubMed]
- Kushwaha, M.S.; Halevi, P.; Martínez, G.; Dobrzynski, L.; Djafari-Rouhani, B. Theory of acoustic band structure of periodic elastic composites. Phys. Rev. B 1994, 49, 2313–2322. [Google Scholar] [CrossRef]
- Vasseur, J.O.; Deymier, P.A.; Djafari-Rouhani, B.; Pennec, Y.; Hladky-Hennion, A.-C. Absolute forbidden bands and waveguiding in two-dimensional phononic crystal plates. Phys. Rev. B 2008, 77, 085415. [Google Scholar] [CrossRef]
- Pennec, Y.; Djafari-Rouhani, B.; Vasseur, J.O.; Khelif, A.; Deymier, P.A. Tunable filtering and demultiplexing in phononic crystals with hollow cylinders. Phys. Rev. E 2004, 69, 046608. [Google Scholar] [CrossRef] [PubMed]
- Laude, V.; Wilm, M.; Benchabane, S.; Khelif, A. Full band gap for surface acoustic waves in a piezoelectric phononic crystal. Phys. Rev. E 2005, 71, 036607. [Google Scholar] [CrossRef] [PubMed]
- Yudistira, D.; Pennec, Y.; Djafari Rouhani, B.; Dupont, S.; Laude, V. Non-radiative complete surface acoustic wave bandgap for finite-depth holey phononic crystal in lithium niobate. Appl. Phys. Lett. 2012, 100, 061912. [Google Scholar] [CrossRef]
- Pennec, Y.; Vasseur, J.O.; Djafari-Rouhani, B.; Dobrzyński, L.; Deymier, P.A. Two-dimensional phononic crystals: Examples and applications. Surf. Sci. Rep. 2010, 65, 229–291. [Google Scholar] [CrossRef]
- Oliner, A.A. (Ed.) Acoustic Surface Waves. In Topics in Applied Physics; Springer: Berlin/Heidelberg, Germany, 1978; ISBN 978-3-662-30917-9. [Google Scholar]
- Maradudin, A.A.; Zierau, W. Surface acoustic waves of sagittal and shear-horizontal polarizations on large-amplitude gratings. Geophys. J. Int. 1994, 118, 325–332. [Google Scholar] [CrossRef]
- Khelif, A.; Djafari-Rouhani, B.; Lambin, P. Surface shear horizontal waves associated with a periodic array of wires deposited on a substrate. Eur. Phys. J. B 2001, 21, 437–445. [Google Scholar] [CrossRef]
- Dhar, L.; Rogers, J.A. High frequency one-dimensional phononic crystal characterized with a picosecond transient grating photoacoustic technique. Appl. Phys. Lett. 2000, 77, 1402–1404. [Google Scholar] [CrossRef]
- Maznev, A.A.; Wright, O.B. Optical generation of long-lived surface vibrations in a periodic microstructure. J. Appl. Phys. 2009, 105, 123530. [Google Scholar] [CrossRef]
- Malfanti, I.; Taschin, A.; Bartolini, P.; Bonello, B.; Torre, R. Propagation of acoustic surface waves on a phononic surface investigated by transient reflecting grating spectroscopy. J. Mech. Phys. Solids 2011, 59, 2370–2381. [Google Scholar] [CrossRef]
- Hartschuh, R.D.; Kisliuk, A.; Novikov, V.; Sokolov, A.P.; Heyliger, P.R.; Flannery, C.M.; Johnson, W.L.; Soles, C.L.; Wu, W.-L. Acoustic modes and elastic properties of polymeric nanostructures. Appl. Phys. Lett. 2005, 87, 173121. [Google Scholar] [CrossRef]
- Graczykowski, B.; Sledzinska, M.; Kehagias, N.; Alzina, F.; Reparaz, J.S.; Sotomayor Torres, C.M. Hypersonic phonon propagation in one-dimensional surface phononic crystal. Appl. Phys. Lett. 2014, 104, 123108. [Google Scholar] [CrossRef]
- Trzaskowska, A.; Mielcarek, S.; Wiesner, M. One-dimensional modulation of the stripe in a surface phononic lattice: The effect on propagation of surface waves. J. Appl. Phys. 2014, 116, 214303. [Google Scholar] [CrossRef]
- Li, J.; Yang, S. Fabrication of high-aspect-ratio (up to 10) one-dimensional organic/inorganic hybrid nanogratings via holographic lithography. Microelectron. Eng. 2014, 128, 7–11. [Google Scholar] [CrossRef]
- Gomopoulos, N.; Maschke, D.; Koh, C.Y.; Thomas, E.L.; Tremel, W.; Butt, H.-J.; Fytas, G. One-Dimensional Hypersonic Phononic Crystals. Nano Lett. 2010, 10, 980–984. [Google Scholar] [CrossRef] [PubMed]
- Schneider, D.; Liaqat, F.; El Boudouti, E.H.; El Hassouani, Y.; Djafari-Rouhani, B.; Tremel, W.; Butt, H.-J.; Fytas, G. Engineering the Hypersonic Phononic Band Gap of Hybrid Bragg Stacks. Nano Lett. 2012, 12, 3101–3108. [Google Scholar] [CrossRef] [PubMed]
- Walker, P.M.; Sharp, J.S.; Akimov, A.V.; Kent, A.J. Coherent elastic waves in a one-dimensional polymer hypersonic crystal. Appl. Phys. Lett. 2010, 97, 073106. [Google Scholar] [CrossRef]
- Goldenberg, L.M.; Lisinetskii, V.; Schrader, S. Fast and simple fabrication of organic Bragg mirrors—Application to plastic microchip lasers. Laser Phys. Lett. 2013, 10, 055808. [Google Scholar] [CrossRef]
- Alonso-Redondo, E.; Gueddida, A.; Li, J.; Graczykowski, B.; Torres, C.M.S.; Pennec, Y.; Yang, S.; Djafari-Rouhani, B.; Fytas, G. Directional elastic wave propagation in high-aspect-ratio photoresist gratings: Liquid infiltration and aging. Nanoscale 2017, 9, 2739–2747. [Google Scholar] [CrossRef] [PubMed]
- Heyliger, P.R.; Flannery, C.M.; Johnson, W.L. Vibrational modes of nanolines. Nanotechnology 2008, 19, 145707. [Google Scholar] [CrossRef] [PubMed]
- Lomonosov, A.M. Nonlinear one-dimensional guided wedge waves. Phys. Rev. B 2015, 92. [Google Scholar] [CrossRef]
- Kieffer, J. Brillouin Light Scattering. In Modern Glass Characterization; Wiley-Blackwell: Hoboken, NJ, USA, 2015; pp. 1–51. ISBN 978-1-119-05186-2. [Google Scholar]
- Sato, A.; Pennec, Y.; Shingne, N.; Thurn-Albrecht, T.; Knoll, W.; Steinhart, M.; Djafari-Rouhani, B.; Fytas, G. Tuning and Switching the Hypersonic Phononic Properties of Elastic Impedance Contrast Nanocomposites. ACS Nano 2010, 4, 3471–3481. [Google Scholar] [CrossRef] [PubMed]
- Amoudache, S.; Moiseyenko, R.; Pennec, Y.; Rouhani, B.D.; Khater, A.; Lucklum, R.; Tigrine, R. Optical and acoustic sensing using Fano-like resonances in dual phononic and photonic crystal plate. J. Appl. Phys. 2016, 119, 114502. [Google Scholar] [CrossRef] [Green Version]
- Jin, Y.; Pennec, Y.; Pan, Y.; Djafari-Rouhani, B. Phononic Crystal Plate with Hollow Pillars Actively Controlled by Fluid Filling. Crystals 2016, 6, 64. [Google Scholar] [CrossRef]
- Wang, T.-T.; Wang, Y.-F.; Wang, Y.-S.; Laude, V. Tunable fluid-filled phononic metastrip. Appl. Phys. Lett. 2017, 111, 041906. [Google Scholar] [CrossRef]
Figure 1.
(a) Three-dimensional (3D) schematic representation of the one-dimensional (1D) periodic nanoridges phononic crystal (b) Elementary unit cell used for the finite infinite method (FEM) calculation where the lattice constant is a, the height of the nanoridge is h, and the width is w.
Figure 1.
(a) Three-dimensional (3D) schematic representation of the one-dimensional (1D) periodic nanoridges phononic crystal (b) Elementary unit cell used for the finite infinite method (FEM) calculation where the lattice constant is a, the height of the nanoridge is h, and the width is w.

Figure 2.
Dispersion curves calculation for the direction parallel to the nanoridges, limited to the 300 first eigenmodes for the set of geometrical parameters: a = 630 nm, h = 2.7 µm and w = 250 nm. The red (green) dashed and solid lines correspond respectively to the longitudinal and transverse velocities of the glass (epoxy).

Figure 3.
(a) Dispersion curves of the modes obtained by applying the relation Pxy (Equation (1)) on the full dispersion curves of the nanoridge in Figure 2. (b) Displacement field intensities of both S0-like and A0-like modes and their corresponding ux and uy components at the wave vector q = 0.0135 nm−1, which is indicated by a red arrow in (a). (c) Representation of the second and third harmonics of the S0-like and A0-like modes. (d) Same as (a) by applying the relation Pz (Equation (2)). (e) Same as (b) for the SH0-like and SH1-like modes and (f) second and third harmonics of the SH0-like and SH1-like modes. The red dotted lines in (a) and (d) give the dispersion curves of the Lamb and SH modes, respectively, in an infinite plate with a thickness of w = 250 nm.
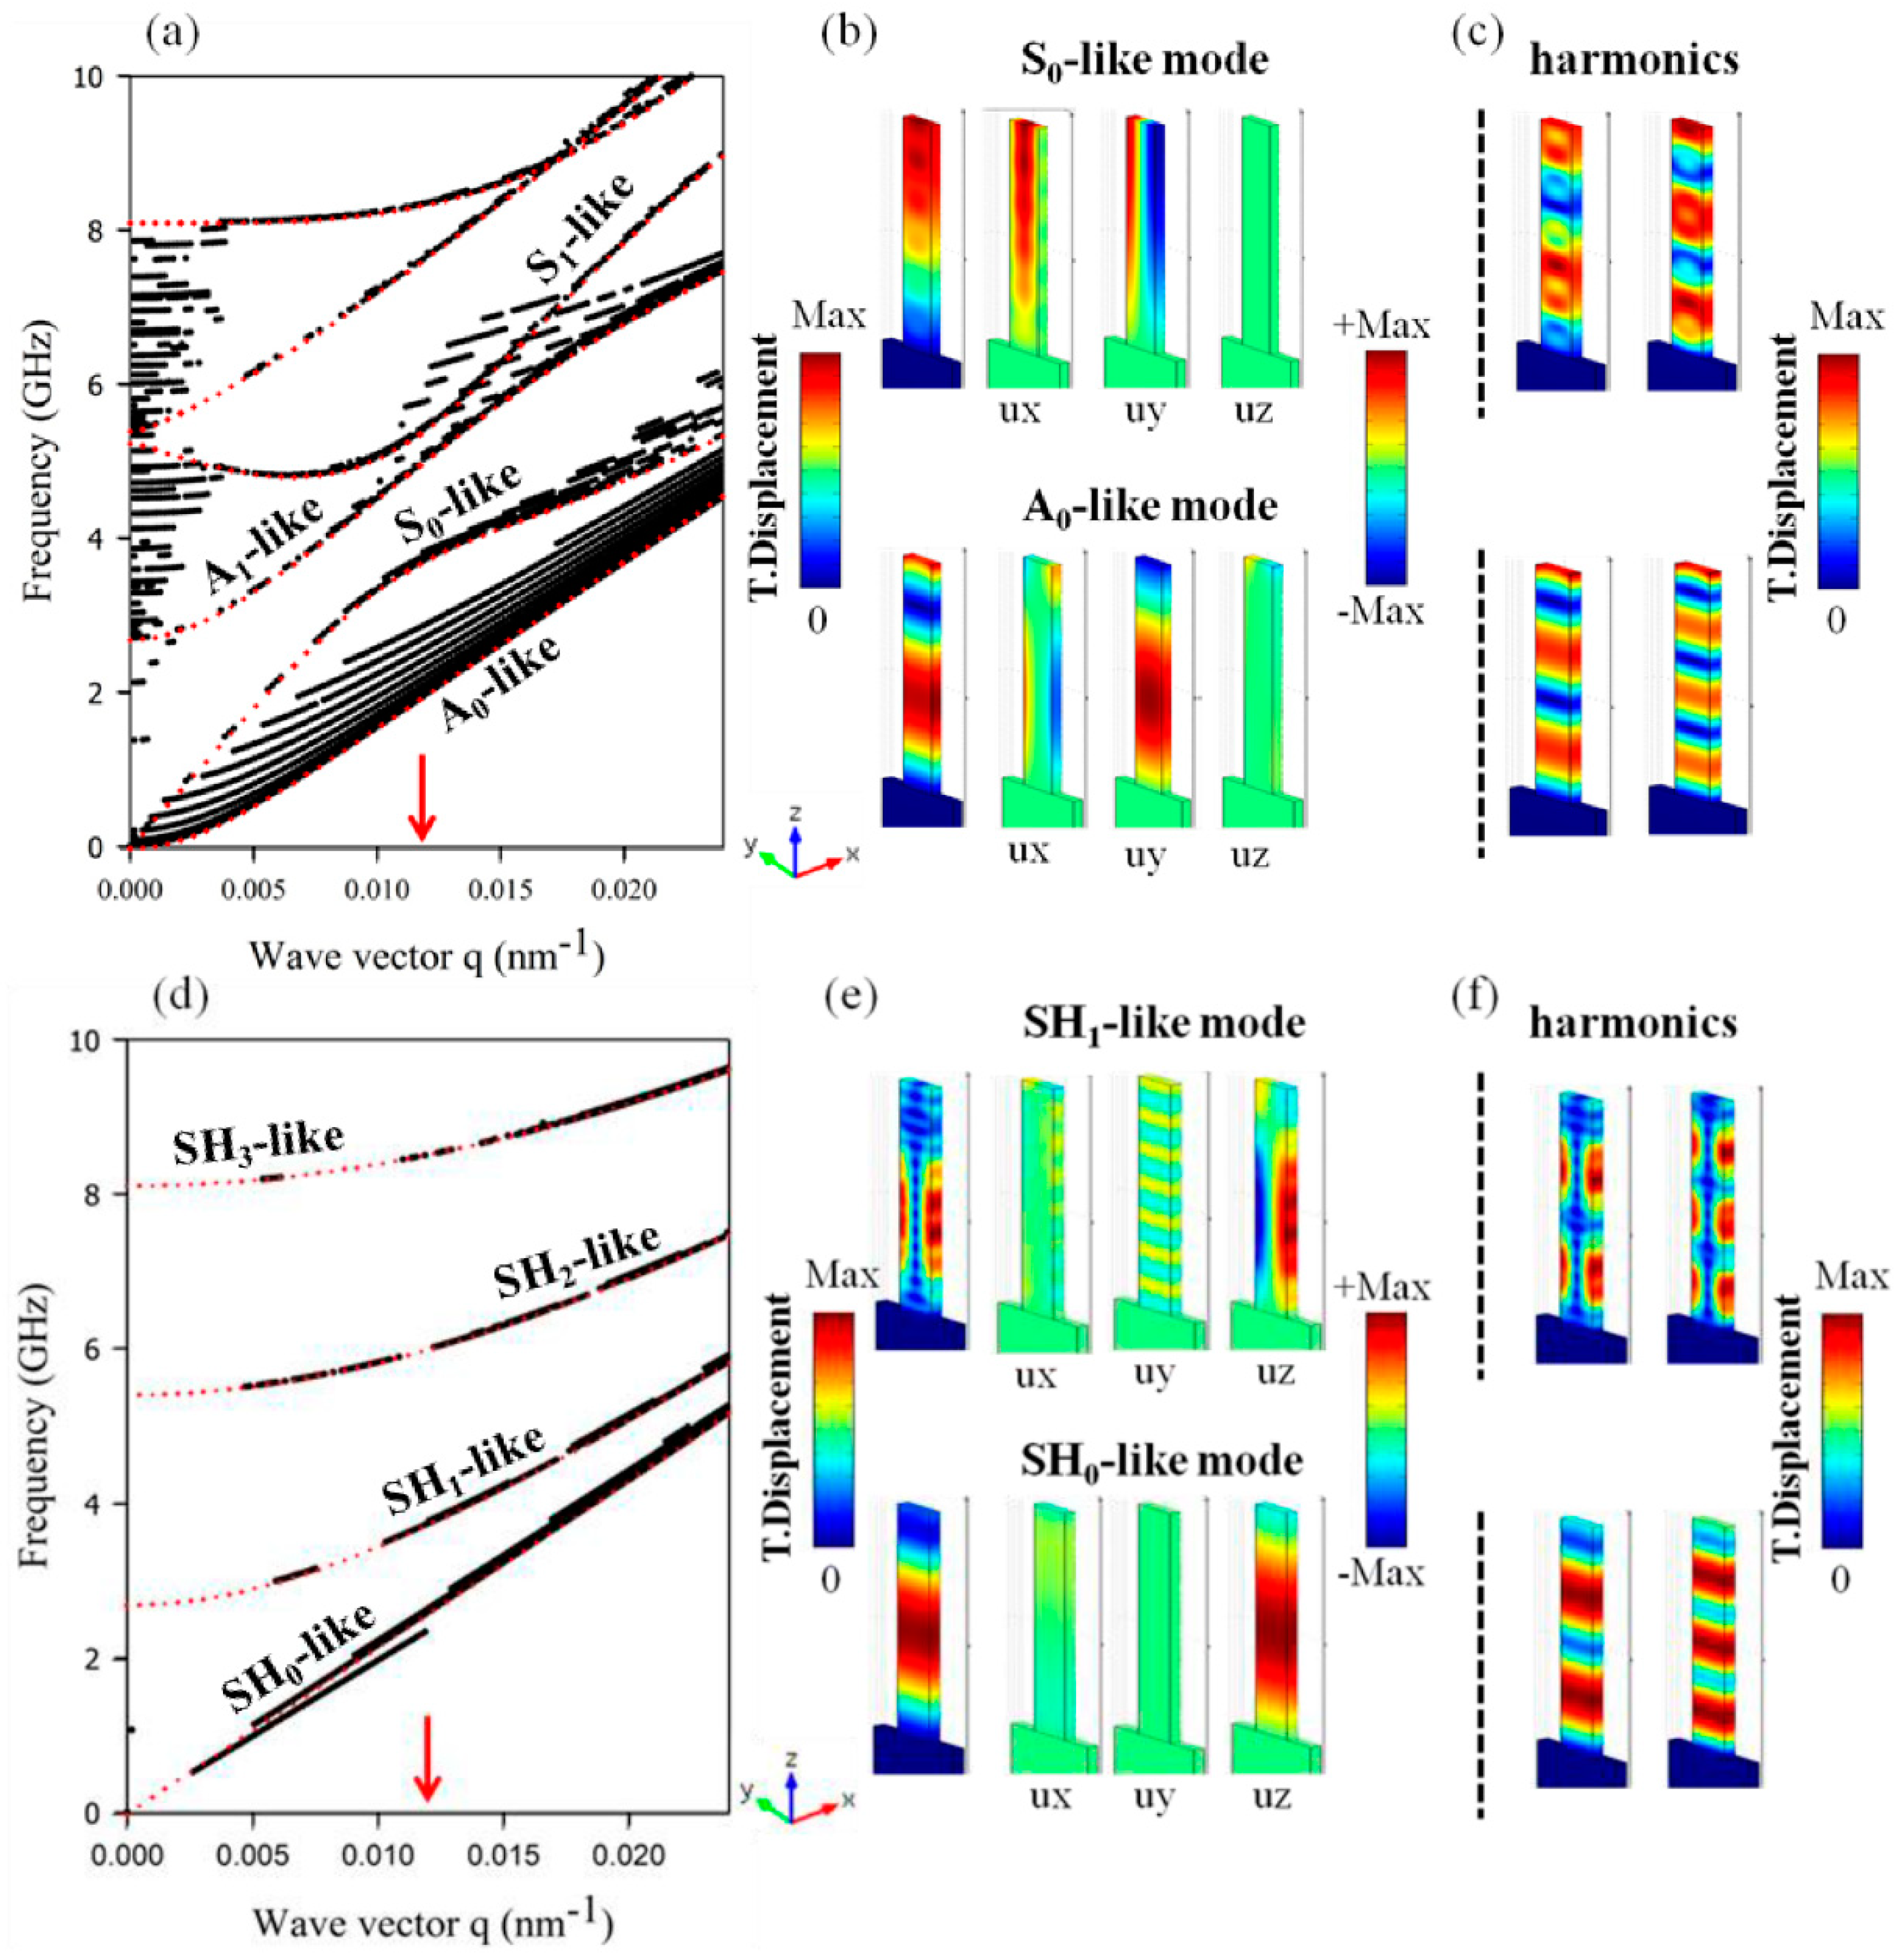
Figure 4.
(a) Phase velocity diagram as a function of the wave vector where the blue solid line represents the Rayleigh wave velocity of epoxy, and the pink solid line represents the edge wave velocity. The modes have been selected as a function of their polarization following Equations (1) and (2). The red (resp. blue) color corresponds to the polarization Pxy (resp. Pz) (b) Displacement field maps of the two edge modes ‘1′ and ‘2′ at the wave vector q = 0.02 nm−1.

Figure 5.
(a) Dispersion curves for the propagation perpendicular to the nanoridges for the set of geometrical parameters: a = 630 nm, h = 2.7 µm, and w = 250 nm; (b) Eigenfrequencies calculation of a single nanoridge with a rigid boundary condition at the bottom; (c) Representation of the displacement fields at the frequencies 1, 2, and 3 of the ridges deposited on a substrate, and for the frequencies 4, 5, and 6 of one ridge with a rigid bottom surface.
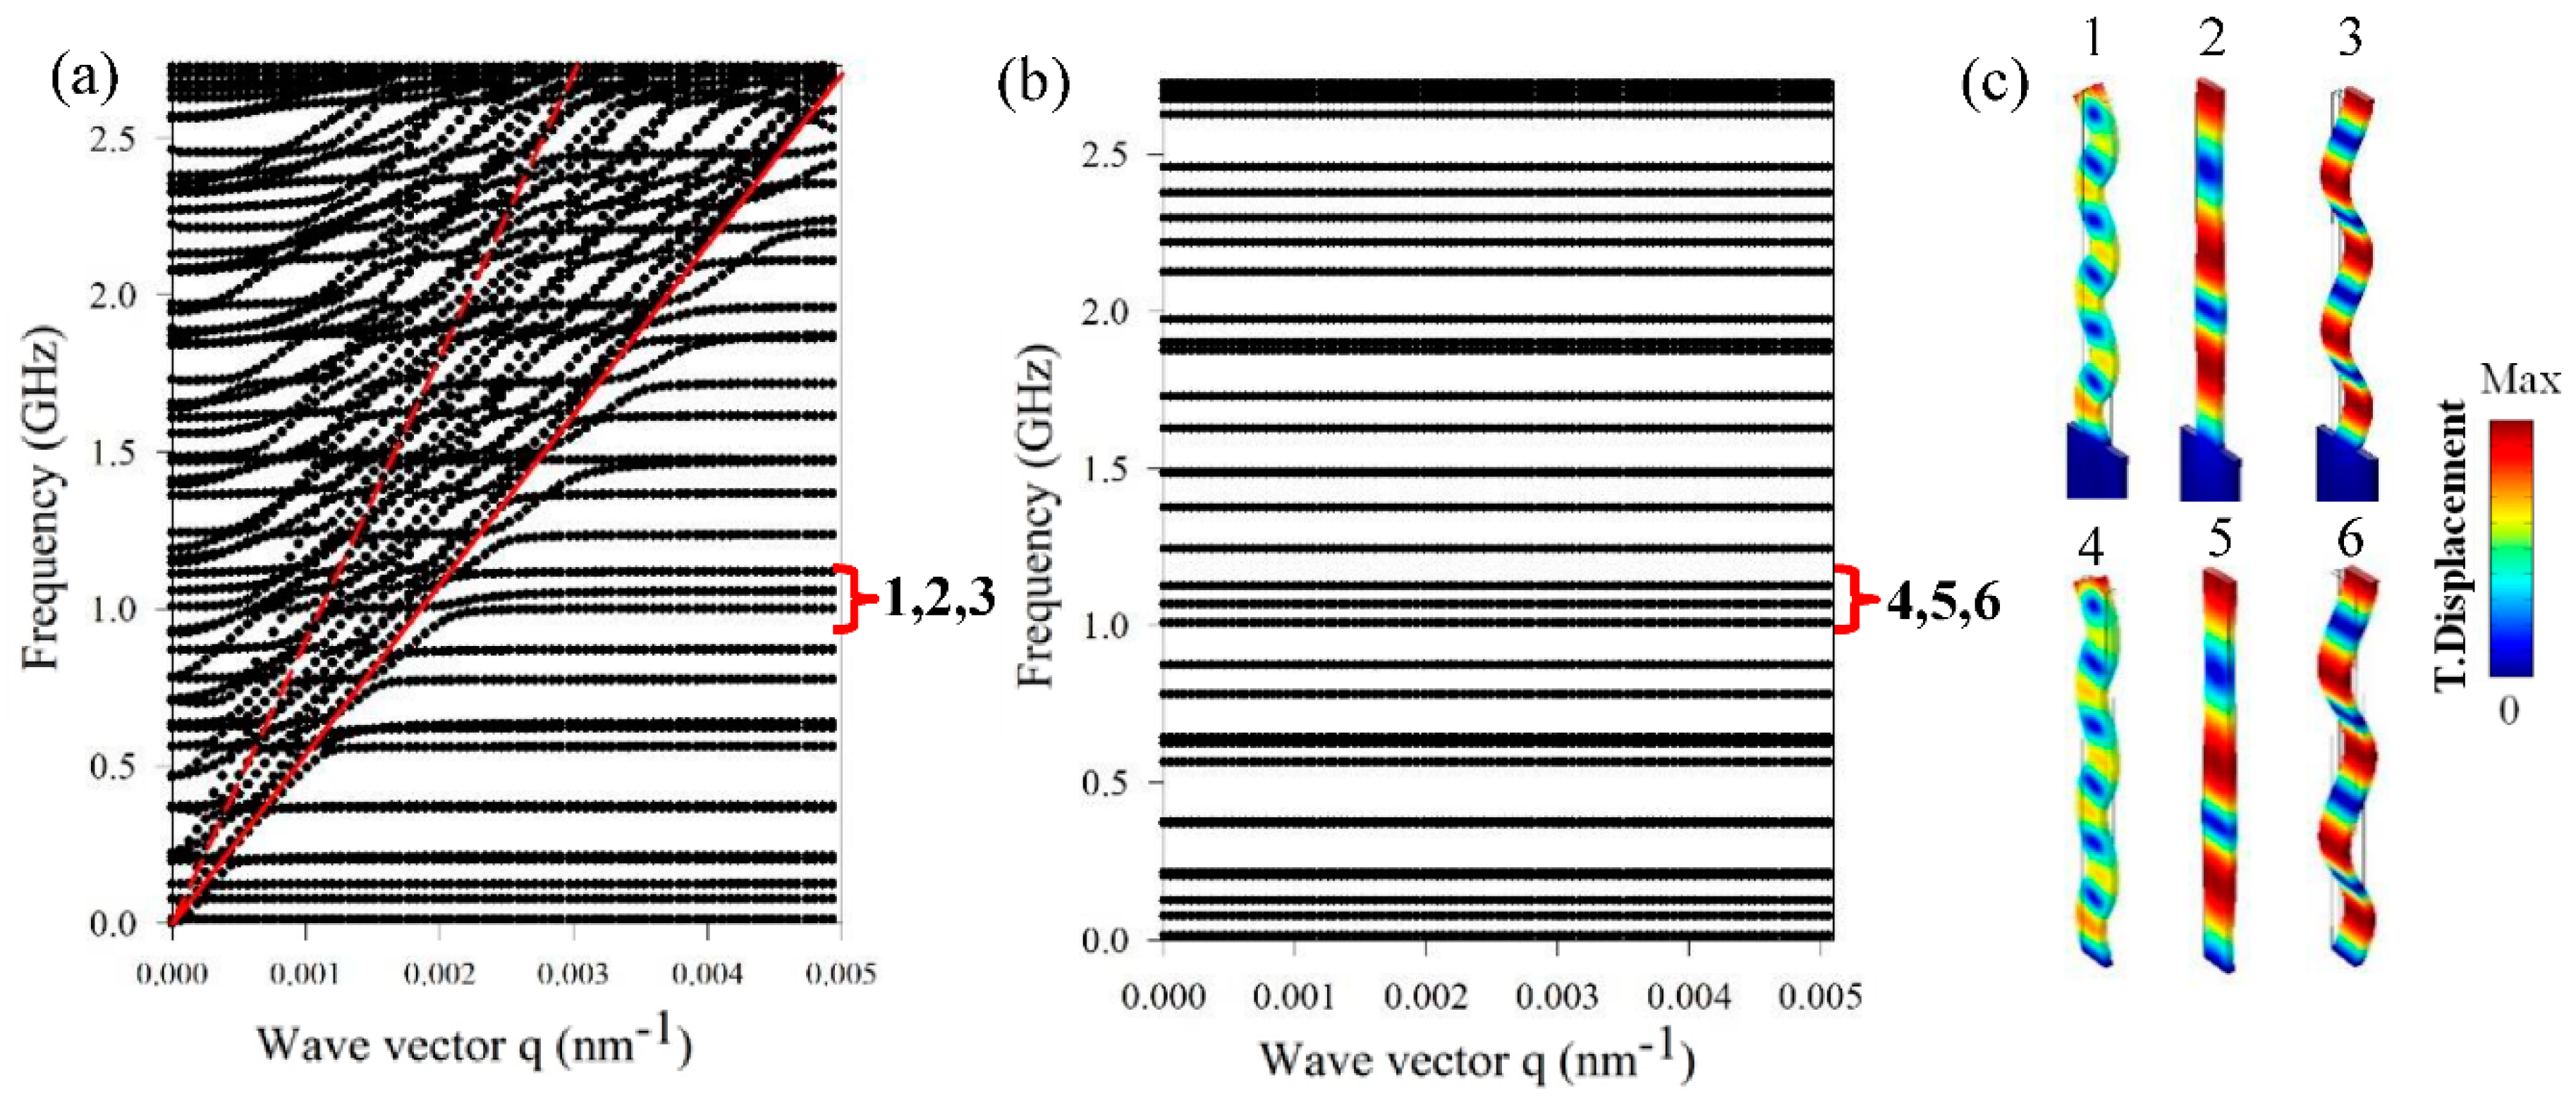
Figure 6.
Dispersion curves for the direction parallel to the nanoridges with a fixed width of w = 250 nm and for different heights (a) h = 68 nm, (b) h = 135 nm, and (c) h = 270 nm. (d) Calculation of the first 10 branches at q = 0.0167 nm−1 versus the height of the nanoridges. The color bar selects the modes of Pxy polarization inside the nanoridges.

Figure 7.
Evolution of the dispersion curves for propagation perpendicular to the ridges as a function of (a) the height with w = 250 nm and (b) the width with h = 540 nm.
Figure 7.
Evolution of the dispersion curves for propagation perpendicular to the ridges as a function of (a) the height with w = 250 nm and (b) the width with h = 540 nm.

Figure 8.
Dispersion curves of the one-dimensional (1D) nanoridge structure of high aspect ratio (AR) (h = 2.7 µm) infiltrated with the liquid (Cargille) (a) for the direction parallel to the nanoridges under the condition Pxy (w, q) ≥ 80% (black curves) and (b) for the direction perpendicular to the nanoridges under the condition Pyz (w, q) ≥ 80% (black curves). The dispersion curves of an infinite 1D epoxy/Cargille multilayer array are reported in blue.
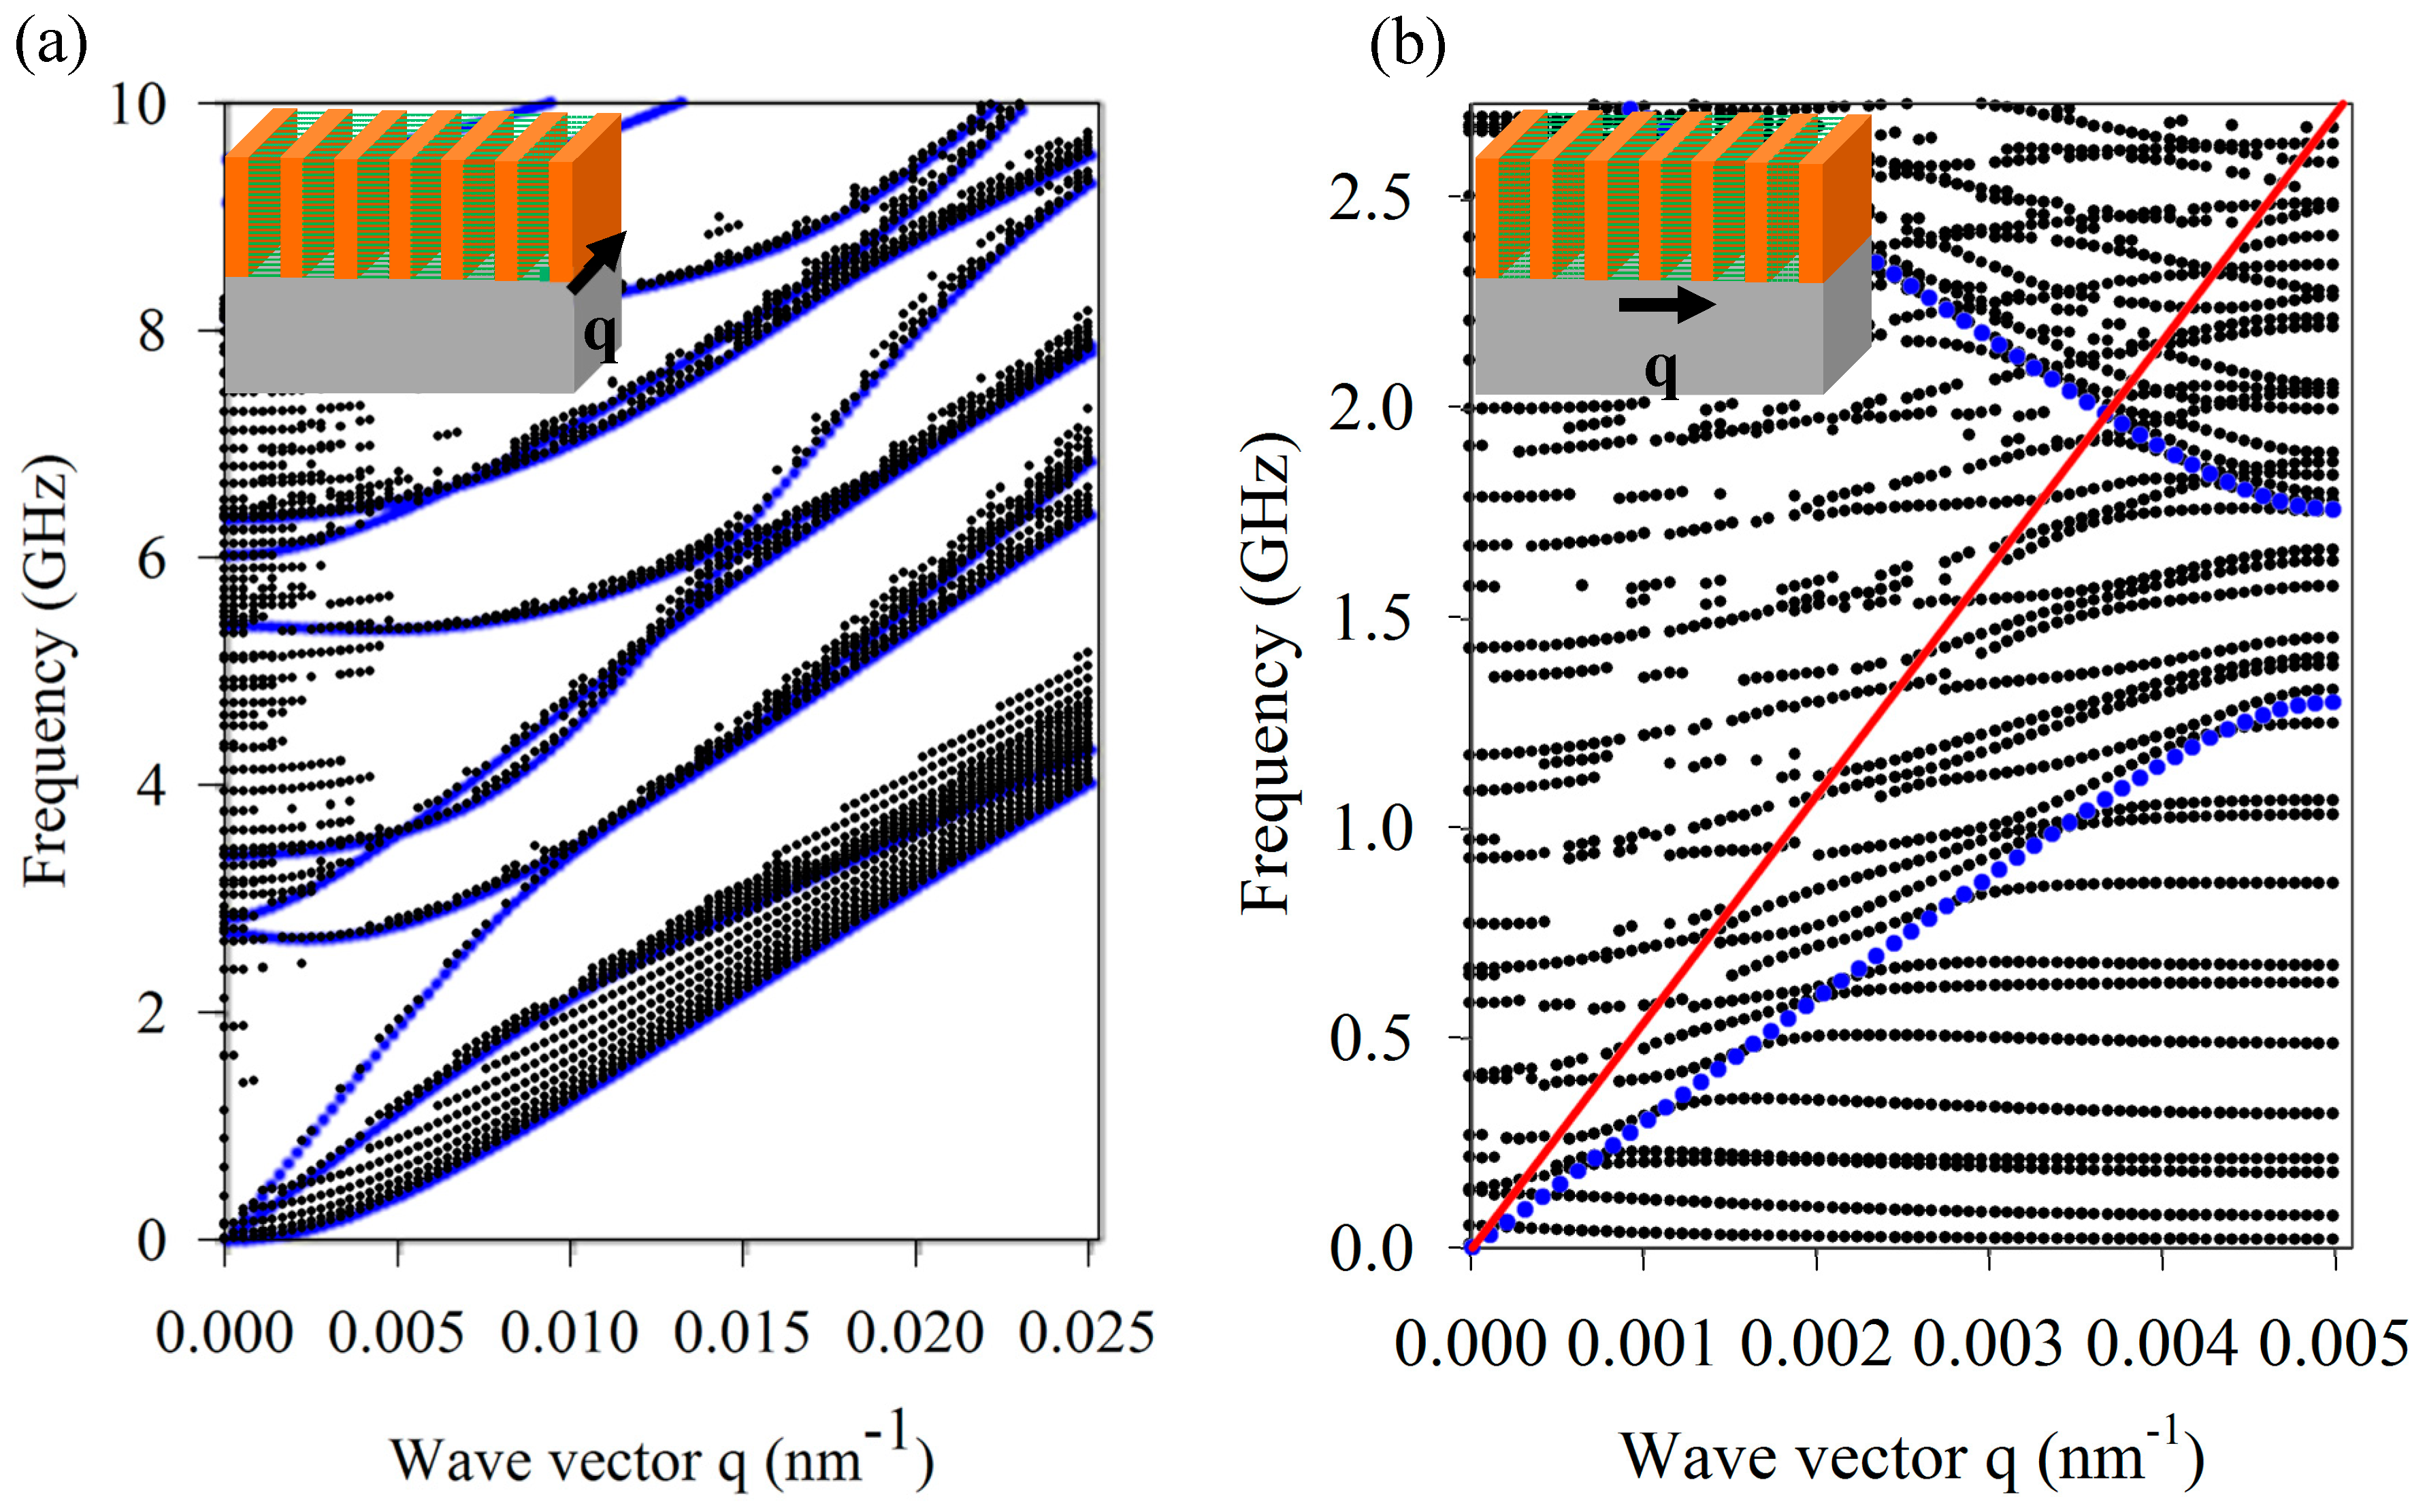
Figure 9.
Dispersion curves calculated in the direction perpendicular to the nanoridges for different heights of the liquid (Cargille) infiltrating the grooves of height h = 540 nm.
Figure 9.
Dispersion curves calculated in the direction perpendicular to the nanoridges for different heights of the liquid (Cargille) infiltrating the grooves of height h = 540 nm.


Table 1.
Density (ρ), transverse (ct), and longitudinal (cl) velocities of sound used in the calculation.
Table 1.
Density (ρ), transverse (ct), and longitudinal (cl) velocities of sound used in the calculation.
| Constant | Epoxy (POSS) | Glass | Cargille |
|---|---|---|---|
| ρ (kg/m3) | 1190 | 2275 | 1000 |
| ct (m/s) | 1350 | 3400 | / |
| cl (m/s) | 2620 | 5670 | 1670 |
© 2018 by the authors. Licensee MDPI, Basel, Switzerland. This article is an open access article distributed under the terms and conditions of the Creative Commons Attribution (CC BY) license (http://creativecommons.org/licenses/by/4.0/).
Share and Cite
MDPI and ACS Style
Gueddida, A.; Pennec, Y.; El Boudouti, E.H.; Fytas, G.; Djafari Rouhani, B. Propagation of Elastic Waves in a One-Dimensional High Aspect Ratio Nanoridge Phononic Crystal. Appl. Sci. 2018, 8, 805. https://doi.org/10.3390/app8050805
AMA Style
Gueddida A, Pennec Y, El Boudouti EH, Fytas G, Djafari Rouhani B. Propagation of Elastic Waves in a One-Dimensional High Aspect Ratio Nanoridge Phononic Crystal. Applied Sciences. 2018; 8(5):805. https://doi.org/10.3390/app8050805
Chicago/Turabian StyleGueddida, Abdellatif, Yan Pennec, El Houssaine El Boudouti, George Fytas, and Bahram Djafari Rouhani. 2018. "Propagation of Elastic Waves in a One-Dimensional High Aspect Ratio Nanoridge Phononic Crystal" Applied Sciences 8, no. 5: 805. https://doi.org/10.3390/app8050805
Note that from the first issue of 2016, this journal uses article numbers instead of page numbers. See further details here.