Article

Nanostructured Composites of Sodium Montmorillonite Clay and PEO Used in Dissolution Improvement of Aprepitant Drug by Melt Mixing

by
Christina Pappa
1,2,
Stavroula Nanaki
1,
Dimitrios Giliopoulos
1,
Konstantinos Triantafyllidis
1,
Margaritis Kostoglou
1,
Apostolos Avgeropoulos
2 and
Dimitrios Bikiaris
1,*
1
Department of Chemistry, Aristotle University of Thessaloniki, 54124 Thessaloniki, Greece
2
Department of Materials Science and Engineering, University of Ioannina, 45110 Ioannina, Greece
*
Author to whom correspondence should be addressed.
Appl. Sci. 2018, 8(5), 786; https://doi.org/10.3390/app8050786
Submission received: 28 March 2018 / Revised: 27 April 2018 / Accepted: 9 May 2018 / Published: 15 May 2018
(This article belongs to the Special Issue Eco-Friendly Nanocomposites for Biomedical Applications)

Abstract

:
In this work, aprepitant (APR) was loaded in a high-molecular-weight poly(ethylene oxide) (PEO) and PEO/clay nanocomposites via the melt-mixing process in order to investigate the combined effect of the PEO and PEO/clay phases on the dissolution profile of APR. Various drug (5, 10, 20 wt %) and Cloisite-Na+ microgranuled nanoclay (5 and 10 wt %) loadings were used for the preparation of the solid dispersions using a twin screw melt mixer at temperatures below the drug’s melting point. X-ray diffraction (XRD) and infrared (FTIR) data of the prepared formulations confirmed that the semicrystalline structure of the PEO and the structure of APR have remained intact. The PEO chain intercalation in the intragallery space between the clay nanolayers was also confirmed by XRD, especially in the APR/PEO formulations containing 5 wt % microgranuled nanoclay. The in vitro release study demonstrated that in all formulations, the dissolution rate of APR was substantially enhanced compared to neat drug. Immediate release formulations have been prepared, and the combination of PEO/5 wt % clay nanocomposite phase with 5 or 10 wt % drug loading gives much higher maximum dissolution (reaching 98 and 85%, respectively) compared to the neat drug (40%). This improved performance was attributed to the highly intercalated/exfoliated state of clay nanolayers in the APR/PEO/5 wt % clay formulations. A model was also investigated to explain the physical mechanism of drug release in all formulations.

Graphical Abstract

1. Introduction

The production of polymer nanocomposites containing layered silicates (clays) has been a case of great interest for many industries through the last decades, for example, automotive, aerospace, sports, pharmaceutics, and others [1,2]. The increased research activity on polymer/clay nanocomposites may be attributed to the great improvement in properties achieved when using clay nanoadditives [3,4], combined with the fact that clays are natural products in high abundance and with rich intercalation chemistry [5,6]. Nylon was the first type of polymer used to produce clay nanocomposites commercially [7], and since then, numerous types of polymers have also been used as matrices, such as epoxies [8], polyesters [9], polyglycols [10], and other. Homogeneous dispersion of silicate nanolayers is the key point for attaining the maximum benefit of polymer/clay interaction and many physical and chemical methods have been implemented for this purpose. Most of these composites are prepared by melt-mixing processes (e.g., extrusion, injection, or mixing).
These processes are considered as some of the most rapidly growing technologies and are already used widely, except for those of polymer and food processing, also in drug delivery research [11] and pharmaceutical product development [12,13,14,15,16,17,18,19]. Melt mixing is a process that involves the mixing of a polymer, one or more active pharmaceutical ingredients (APIs), and perhaps other additives such as clays or other excipients, at elevated temperatures just above their melting point to provide a molten material of uniform shape by using processing machines equipped with one or more rotating screws. This process offers many advantages as it is a solvent-free technique, which is an important environmental consideration, and provides the ability of continuous operation while being economically viable at the same time, since a lot of processing steps can be eliminated [20]. Thus, less time is needed for the preparation of the final formulation. Furthermore, melt mixing enhances the solubility of poorly water-soluble drugs and hence it improves the APIs’ bioavailability [21,22,23,24,25].
Various types of polymers have been used for the development of drug-loaded systems via hot melt processes, and poly(ethylene oxide) (PEO) is one of them. PEO is a semicrystalline, hydrophilic, nonionic, water-soluble polymer, with a relatively low melting point (below 80 °C for PEO used in this study (Mv ~ 2,000,000 g/mol). PEO has been used as the matrix of several release systems [26] and as a carrier of drugs such as ibuprofen [27], ketoprofen [28], and flurbiprofen [29]. PEO creates a matrix inside which the drug is trapped and generally homogeneously distributed. When the carrier/drug system is administered, the already-existing water penetrates the system, which leads to the swelling of the polymer and the drug’s dissolution. Once the carrier system is dissolved, the drug starts to diffuse, going through the polymeric matrix, while the PEO chains start to disentangle and result in system erosion [30,31].
Except in a polymer matrix, the addition of nanoadditives such as clays, SiO2, TiO2, carbon-based nanomaterials, and so forth also plays an important role in drug dissolution. Polymeric nanocomposite materials are used in drug delivery system applications with the nanofiller playing a crucial double functionality. Concerning the drug, nanofillers can act as transport vehicles/carriers for the efficient delivery of therapeutic molecules by modifying the rate and/or time of release, increasing the stability of the drug, or improving the dissolution profile of a drug concerning self-healing [32,33]. The high surface area of nanoadditives (200–1500 m2/g) is an advantage that cannot be found in polymeric matrices because drug can be dispersed in a huge surface area, increasing in most cases its dissolution rate. Concerning the polymer nanofillers, they improve its mechanical properties, swelling capacity, film-forming capability, rheological properties, and bioadhesion, without losing the inherent processability of the matrix [34,35].
The use of PEO/clay nanocomposites as drug carriers, prepared via hot melt processes, has been studied previously. Yang et al. used two types of nanoclay, Cloisite® 15A and 30B, to adjust acetaminophen’s dissolution rate when mixed with PEO. As it was found, the drug recrystallization rate was increased, and the drug releasing rate was decreased with the addition of both types of clay. It was proposed that the drop of the release rate was due to decrease of wettability, while the drug’s release mechanism changed from being erosion-dominant to diffusion-dominant [36]. The effect of clay addition on the drug release rate was reported in another study as well, where the ibuprofen release from a PEO matrix was retarded after the inclusion of montmorillonite, although PEO crystallinity was significantly reduced [27].
Aprepitant (APR) is an antiemetic drug used for the treatment of chemotherapy-induced nausea and vomiting, as well as postoperative nausea and vomiting [37]. APR is characterized as a hydrophobic compound [38] and is categorized as “low soluble” and “low permeable” [39]. It is a white crystalline solid powder that is practically insoluble in water, with water solubility of 3–7 μg/mL, pH 2–10 [40]. This low aqueous solubility of APR is the rate-limiting step for APR’s poor gastrointestinal absorption. However, it is well known that the preparation of drug solid dispersions in a polymer matrix can drastically enhance the dissolution rate of poorly water-soluble drugs [41,42,43,44]. Chandrasekhara Rao et al. studied the effect of solid dispersion systems, prepared using hot melt extrusion, in the dissolution profile of aprepitant using carrier/plastisizer and additive mixtures such as Hydroxypropyl cellulose (HPC), Vitamin E-TPGS and PEG-4000. As it was found, the solid dispersions prepared by the hot melt extrusion process increased the dissolution rate of poorly soluble aprepitant, by reducing the drug’s crystallinity to an amorphous phase [45]. The application of the hot melt extrusion process to deliver APR as a hot-melt-extruded drug product with PVP polymers has been previously reported [46]. Penumetcha et al. found that solid dispersions prepared by hot melt extrusion of APR and Soluplus did in fact improve dissolution kinetics and resulted in a significant improvement in the drug release that was attributed to the amorphization of APR as well as the crystal growth inhibition effect of the Soluplus [47]. Similar results were obtained by Liu et al., who reported that the dissolution rate of solid dispersions of APR with Soluplus were significantly increased and nearly five-fold faster than that of pure APR [48].
The aim of this study was to develop APR-loaded PEO/clay carriers with improved drug dissolution rates via melt mixing and investigate the effect of drug and clay loading on the drug release profile.

2. Materials and Methods

2.1. Materials

Poly(ethylene oxide) (PEO) with a molar mass of Mv ~ 2,000,000 g/mol and viscosity 2000–4000 cP, 2% in H2O (25 °C, Brookfield, New York, USA) was supplied from Aldrich (Saint Louis, MO, USA) and Aprepitant (APR) was kindly donated by Pharmathen S.A (Athens, Greece). The sodium montmorillonite clay used was the Cloisite-Na+ (Southern Clay Products Inc., Gonzales, TX, USA—BYK Additives & Instruments) with an average particle size of 2–13 μm in length.

2.2. Methods

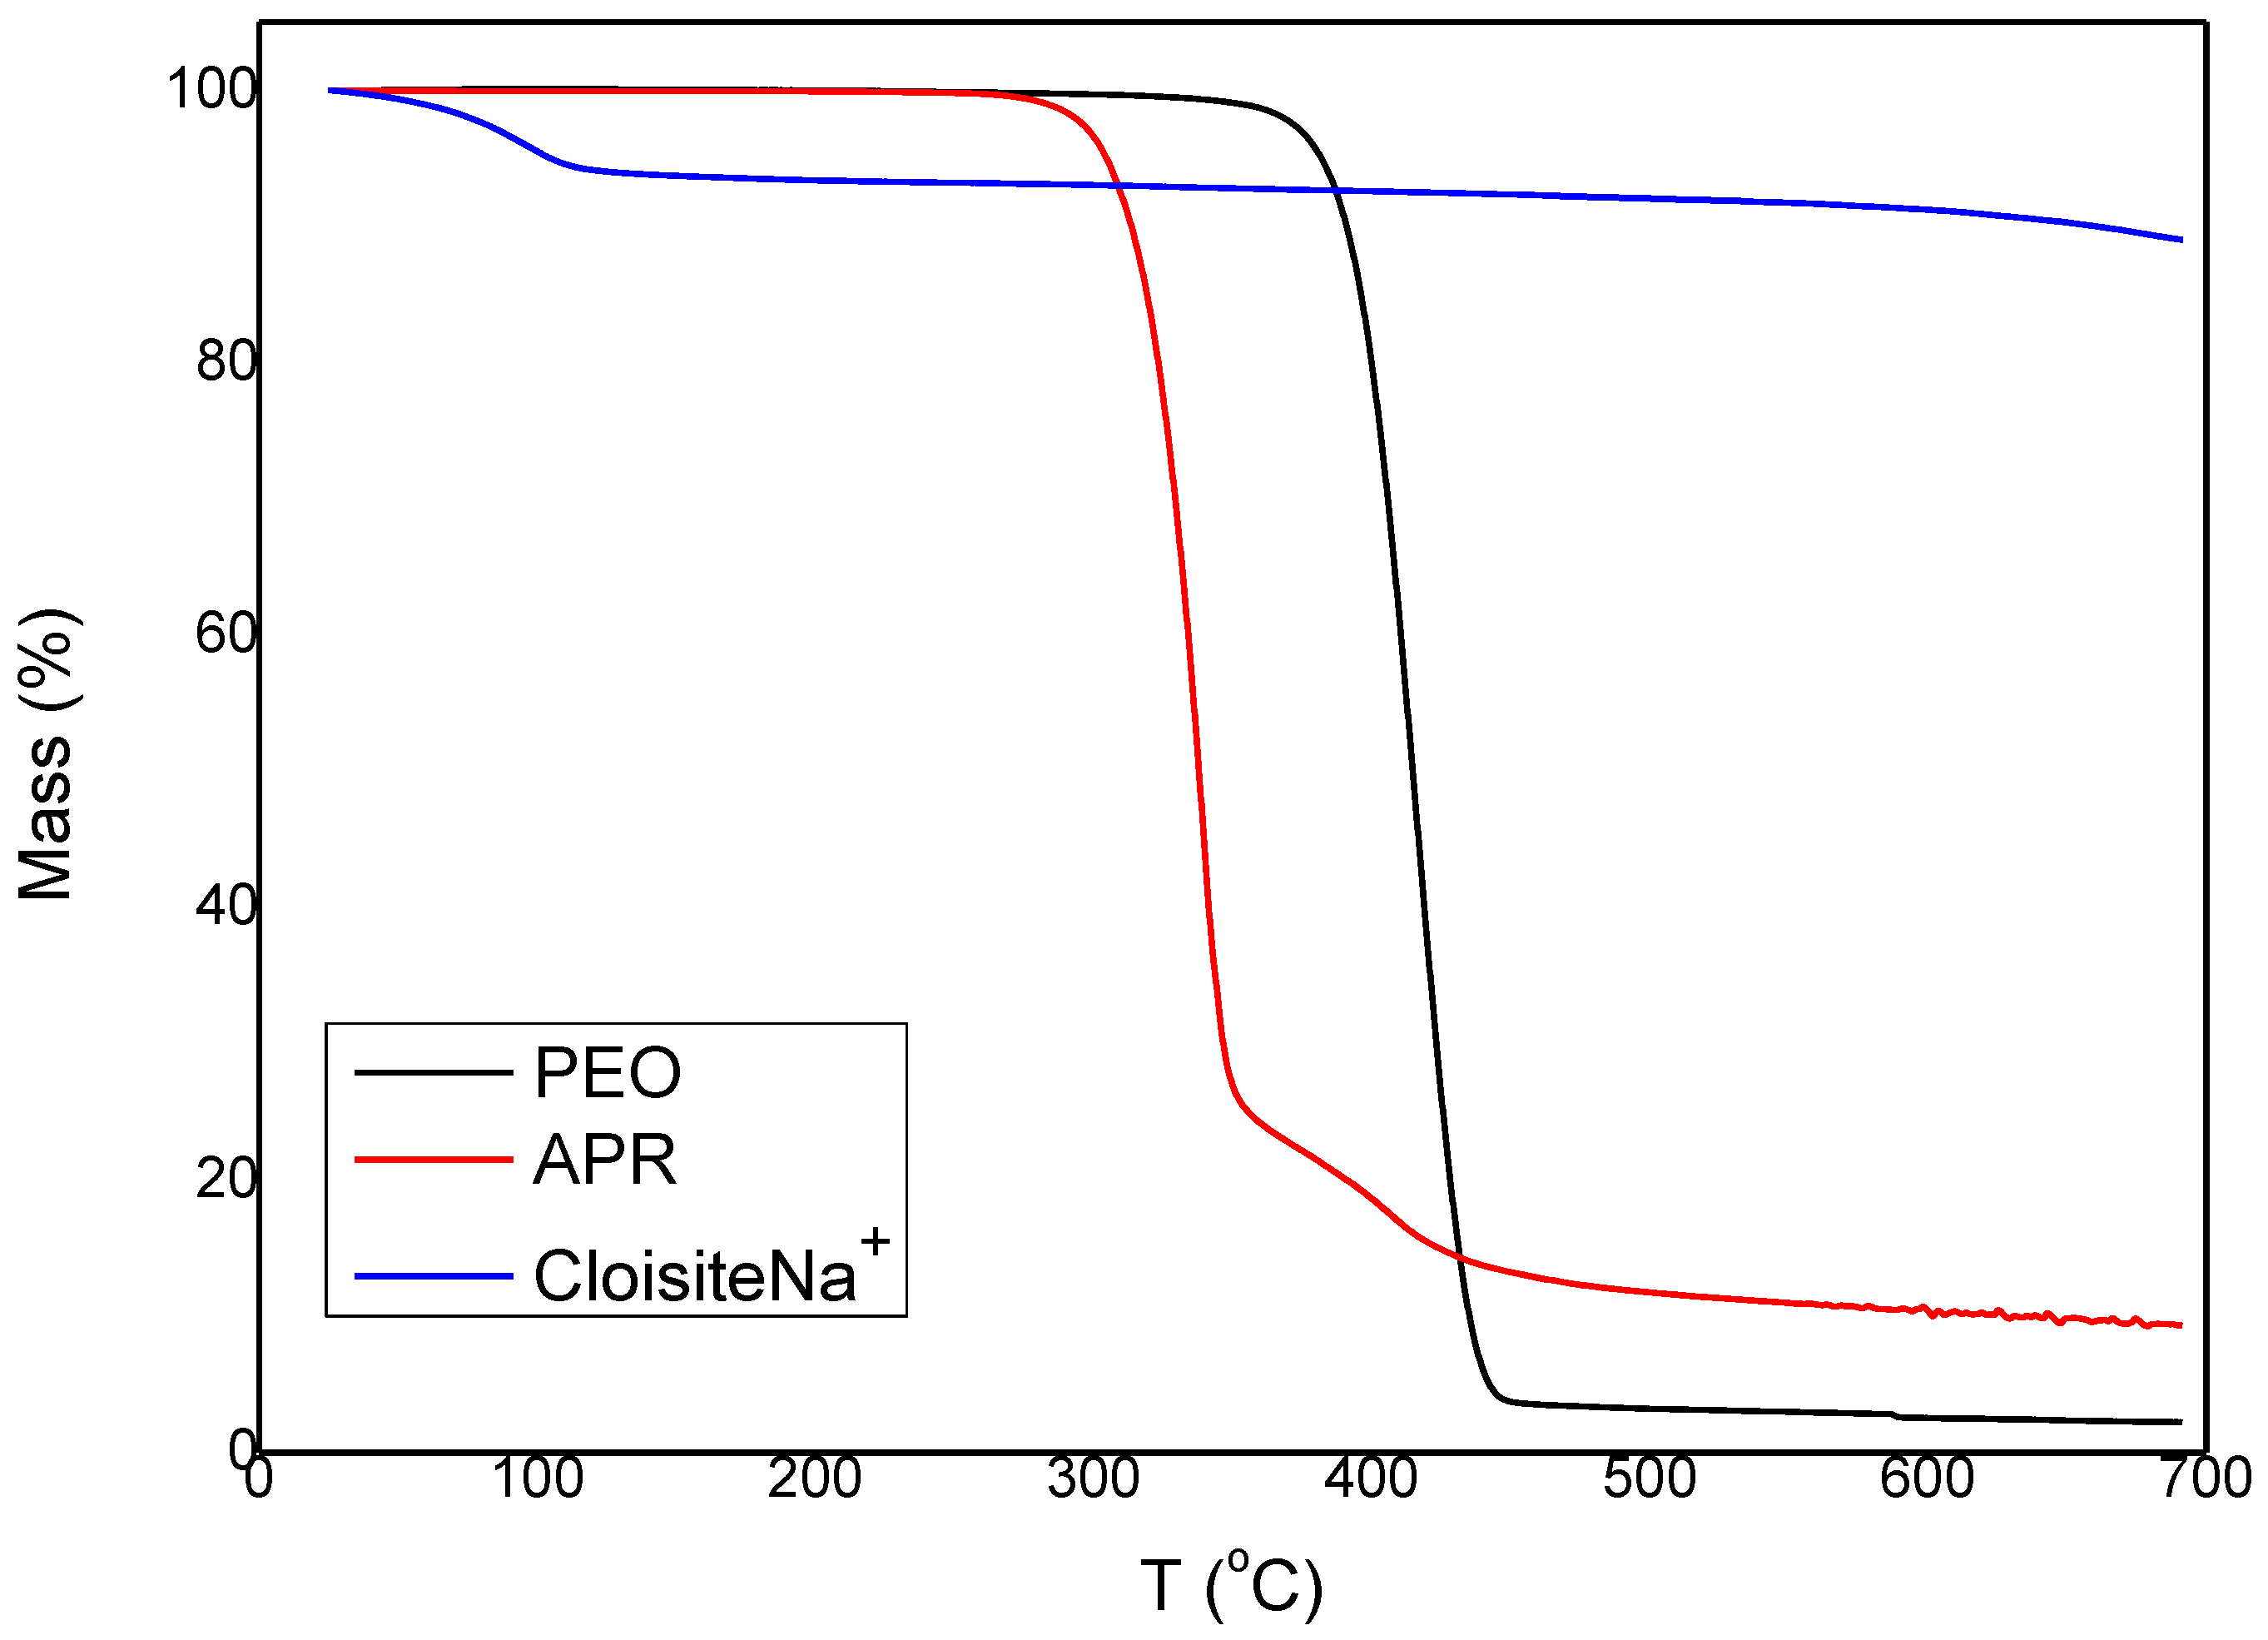
2.2.1. Thermogravimetric Analysis (TGA)

Thermogravimetric analysis was carried out with a SETARAM SETSYS TG-DTA 16/18 (Setaram Instrumentation, Caluire, France). Samples (6.0 ± 0.2 mg) were placed in alumina crucibles. An empty alumina crucible was used as reference. Aprepitant, PEO, and Cloisite-Na+ were heated from ambient temperature to 700 °C in a 50 mL/min flow of N2 at heating rate.

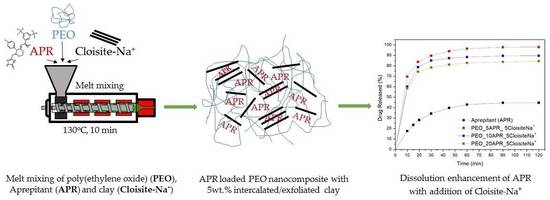
2.2.2. Preparation of Drug-Loaded Polymer and Nanocomposites by Melt Mixing

Drug loaded polymer and nanocomposites containing 5, 10, and 20 wt % APR with 0, 5, and 10 wt % Cloisite-Na+ (PEO/APR/Cloisite-Na+ 100/0/0, 95/5/0, 90/10/0, 80/20/0, 95/0/5, 90/5/5, 85/10/5, 75/20/5, 85/5/10, 80/10/10, 70/20/10) were prepared by melt mixing on a twin-screw corotating melt mixer. Predetermined amounts of the powdered PEO, APR, and Cloisite-Na+ were preweighed and physically mixed before being fed into the throat of the extruder in order to achieve a fine dispersion of the drug and clay particles in the polymer melt. Melt mixing was performed at 130 °C, while the mixing time was 10 min and the screw speed was 30 rpm. Prior to melt mixing, drug and Cloisite-Na+ were dried by heating in an oven overnight at 100 °C.

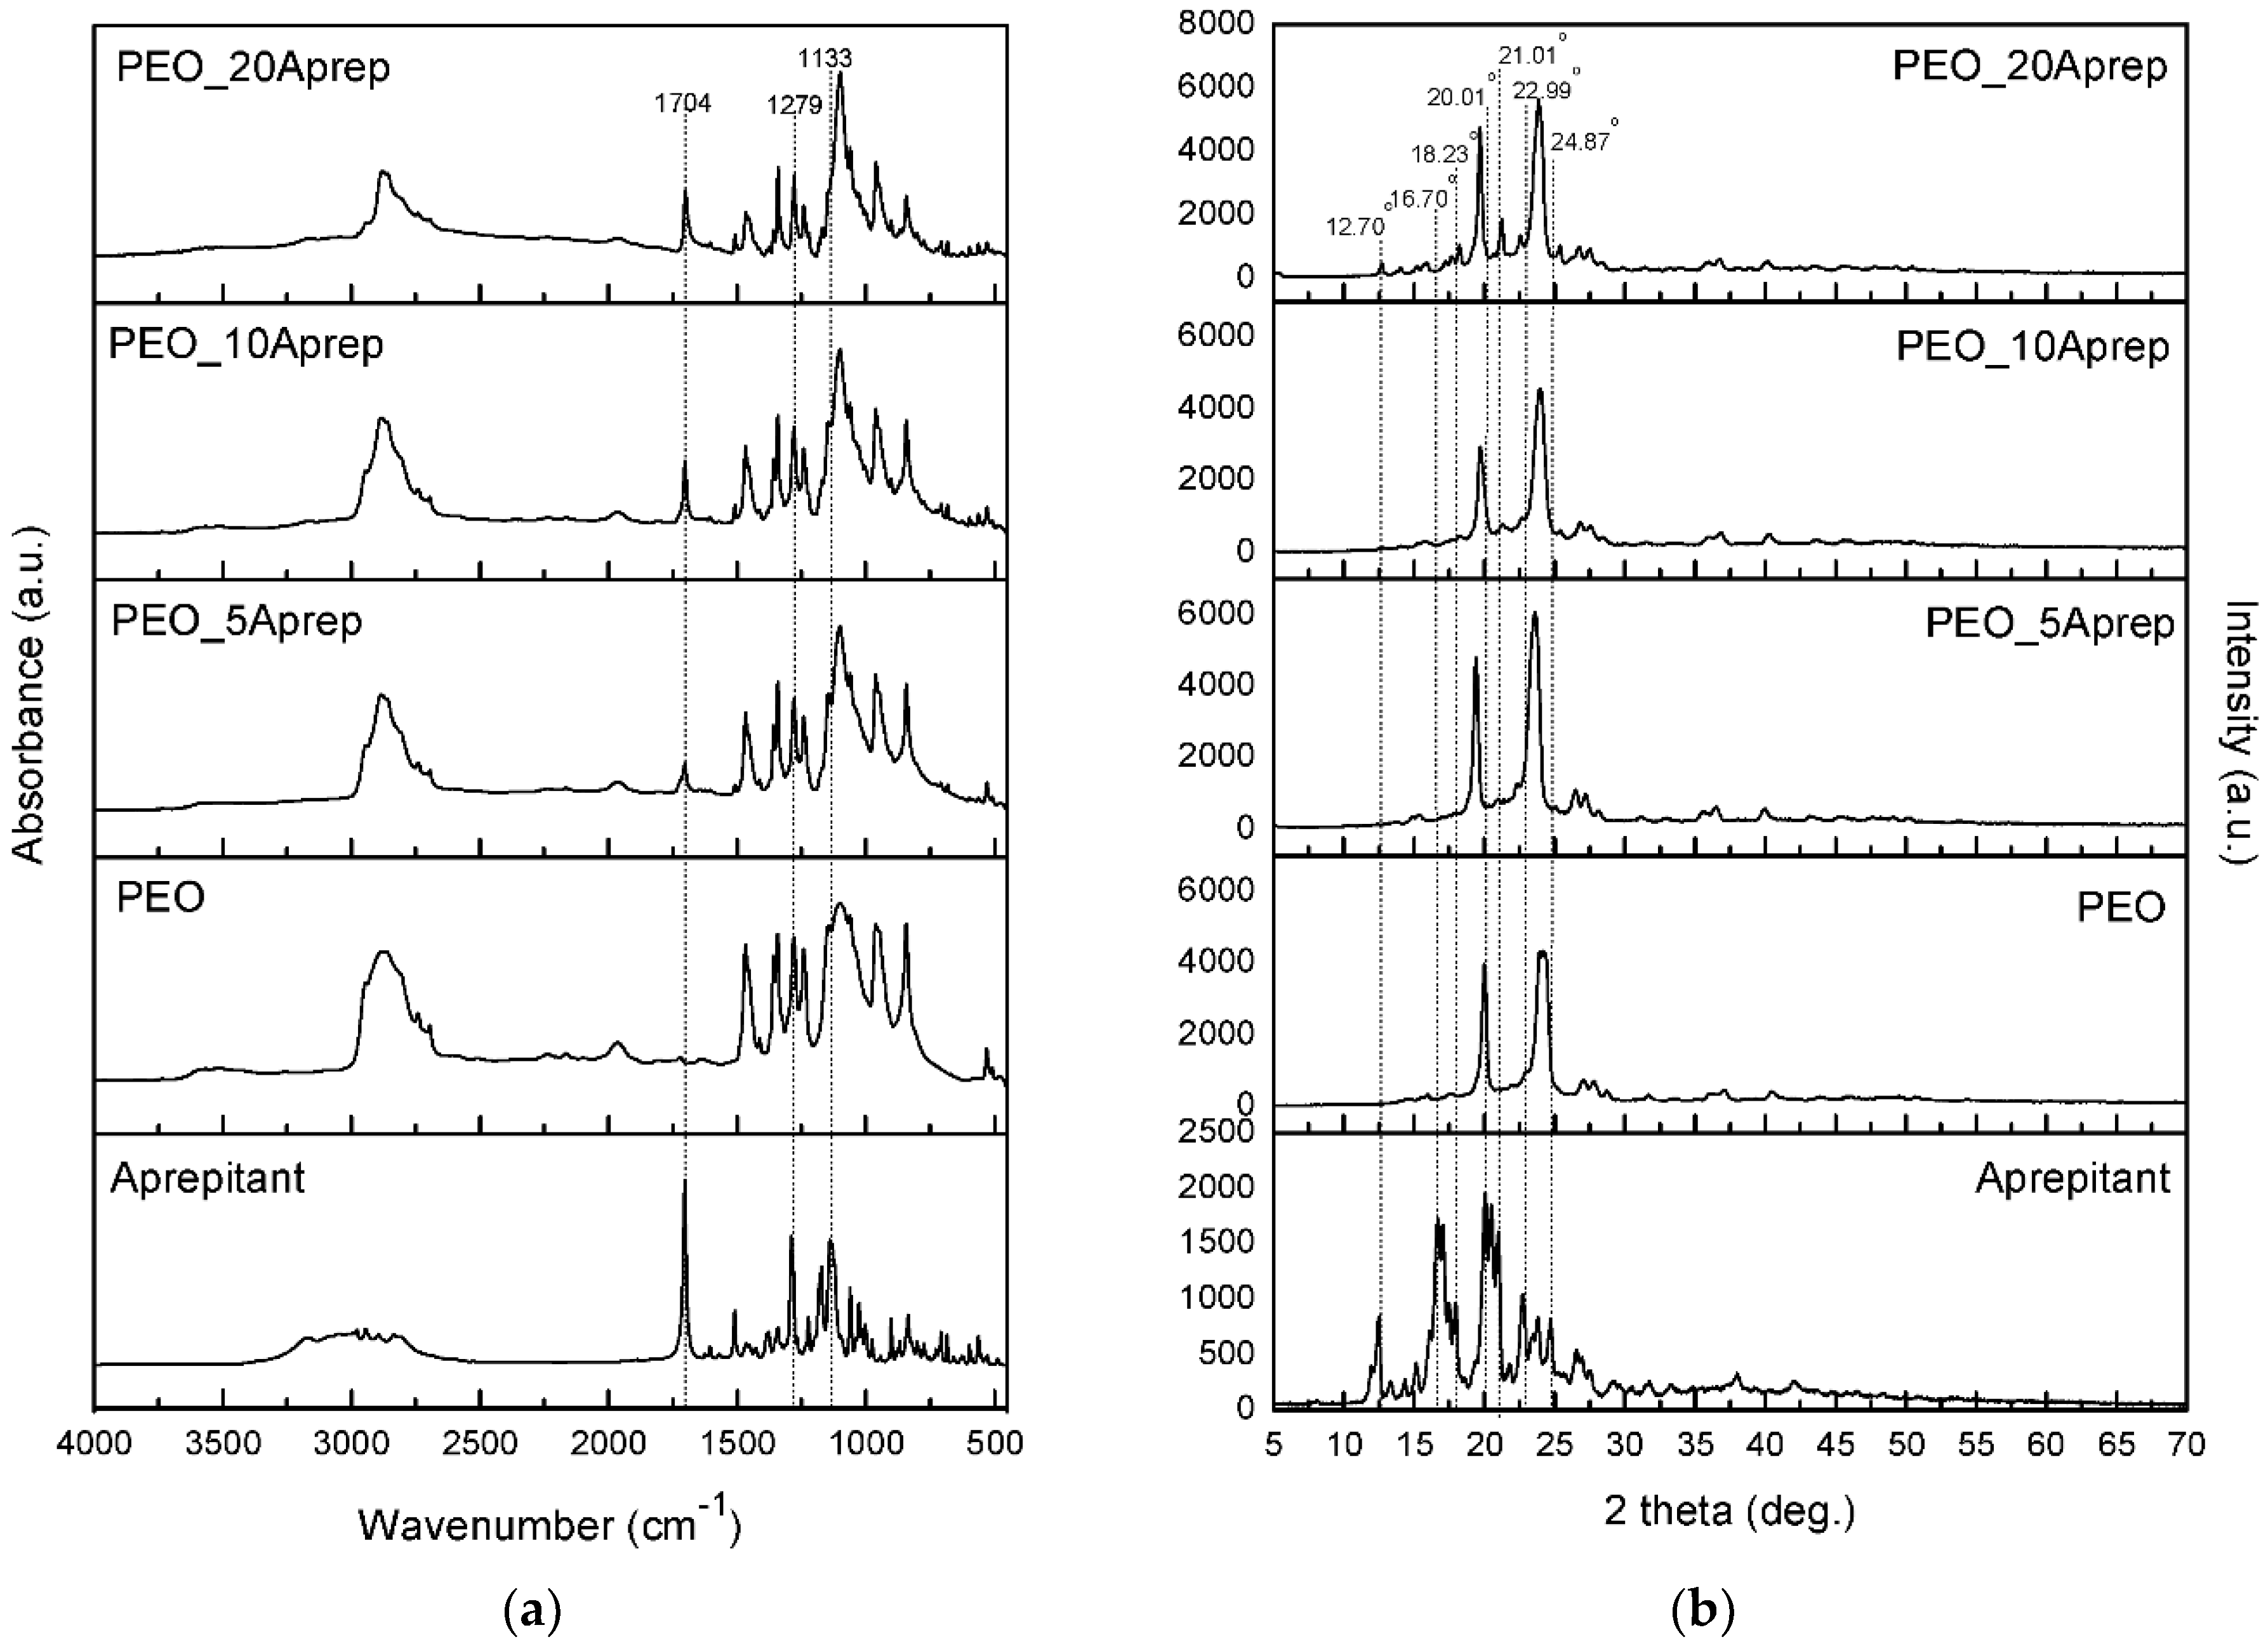
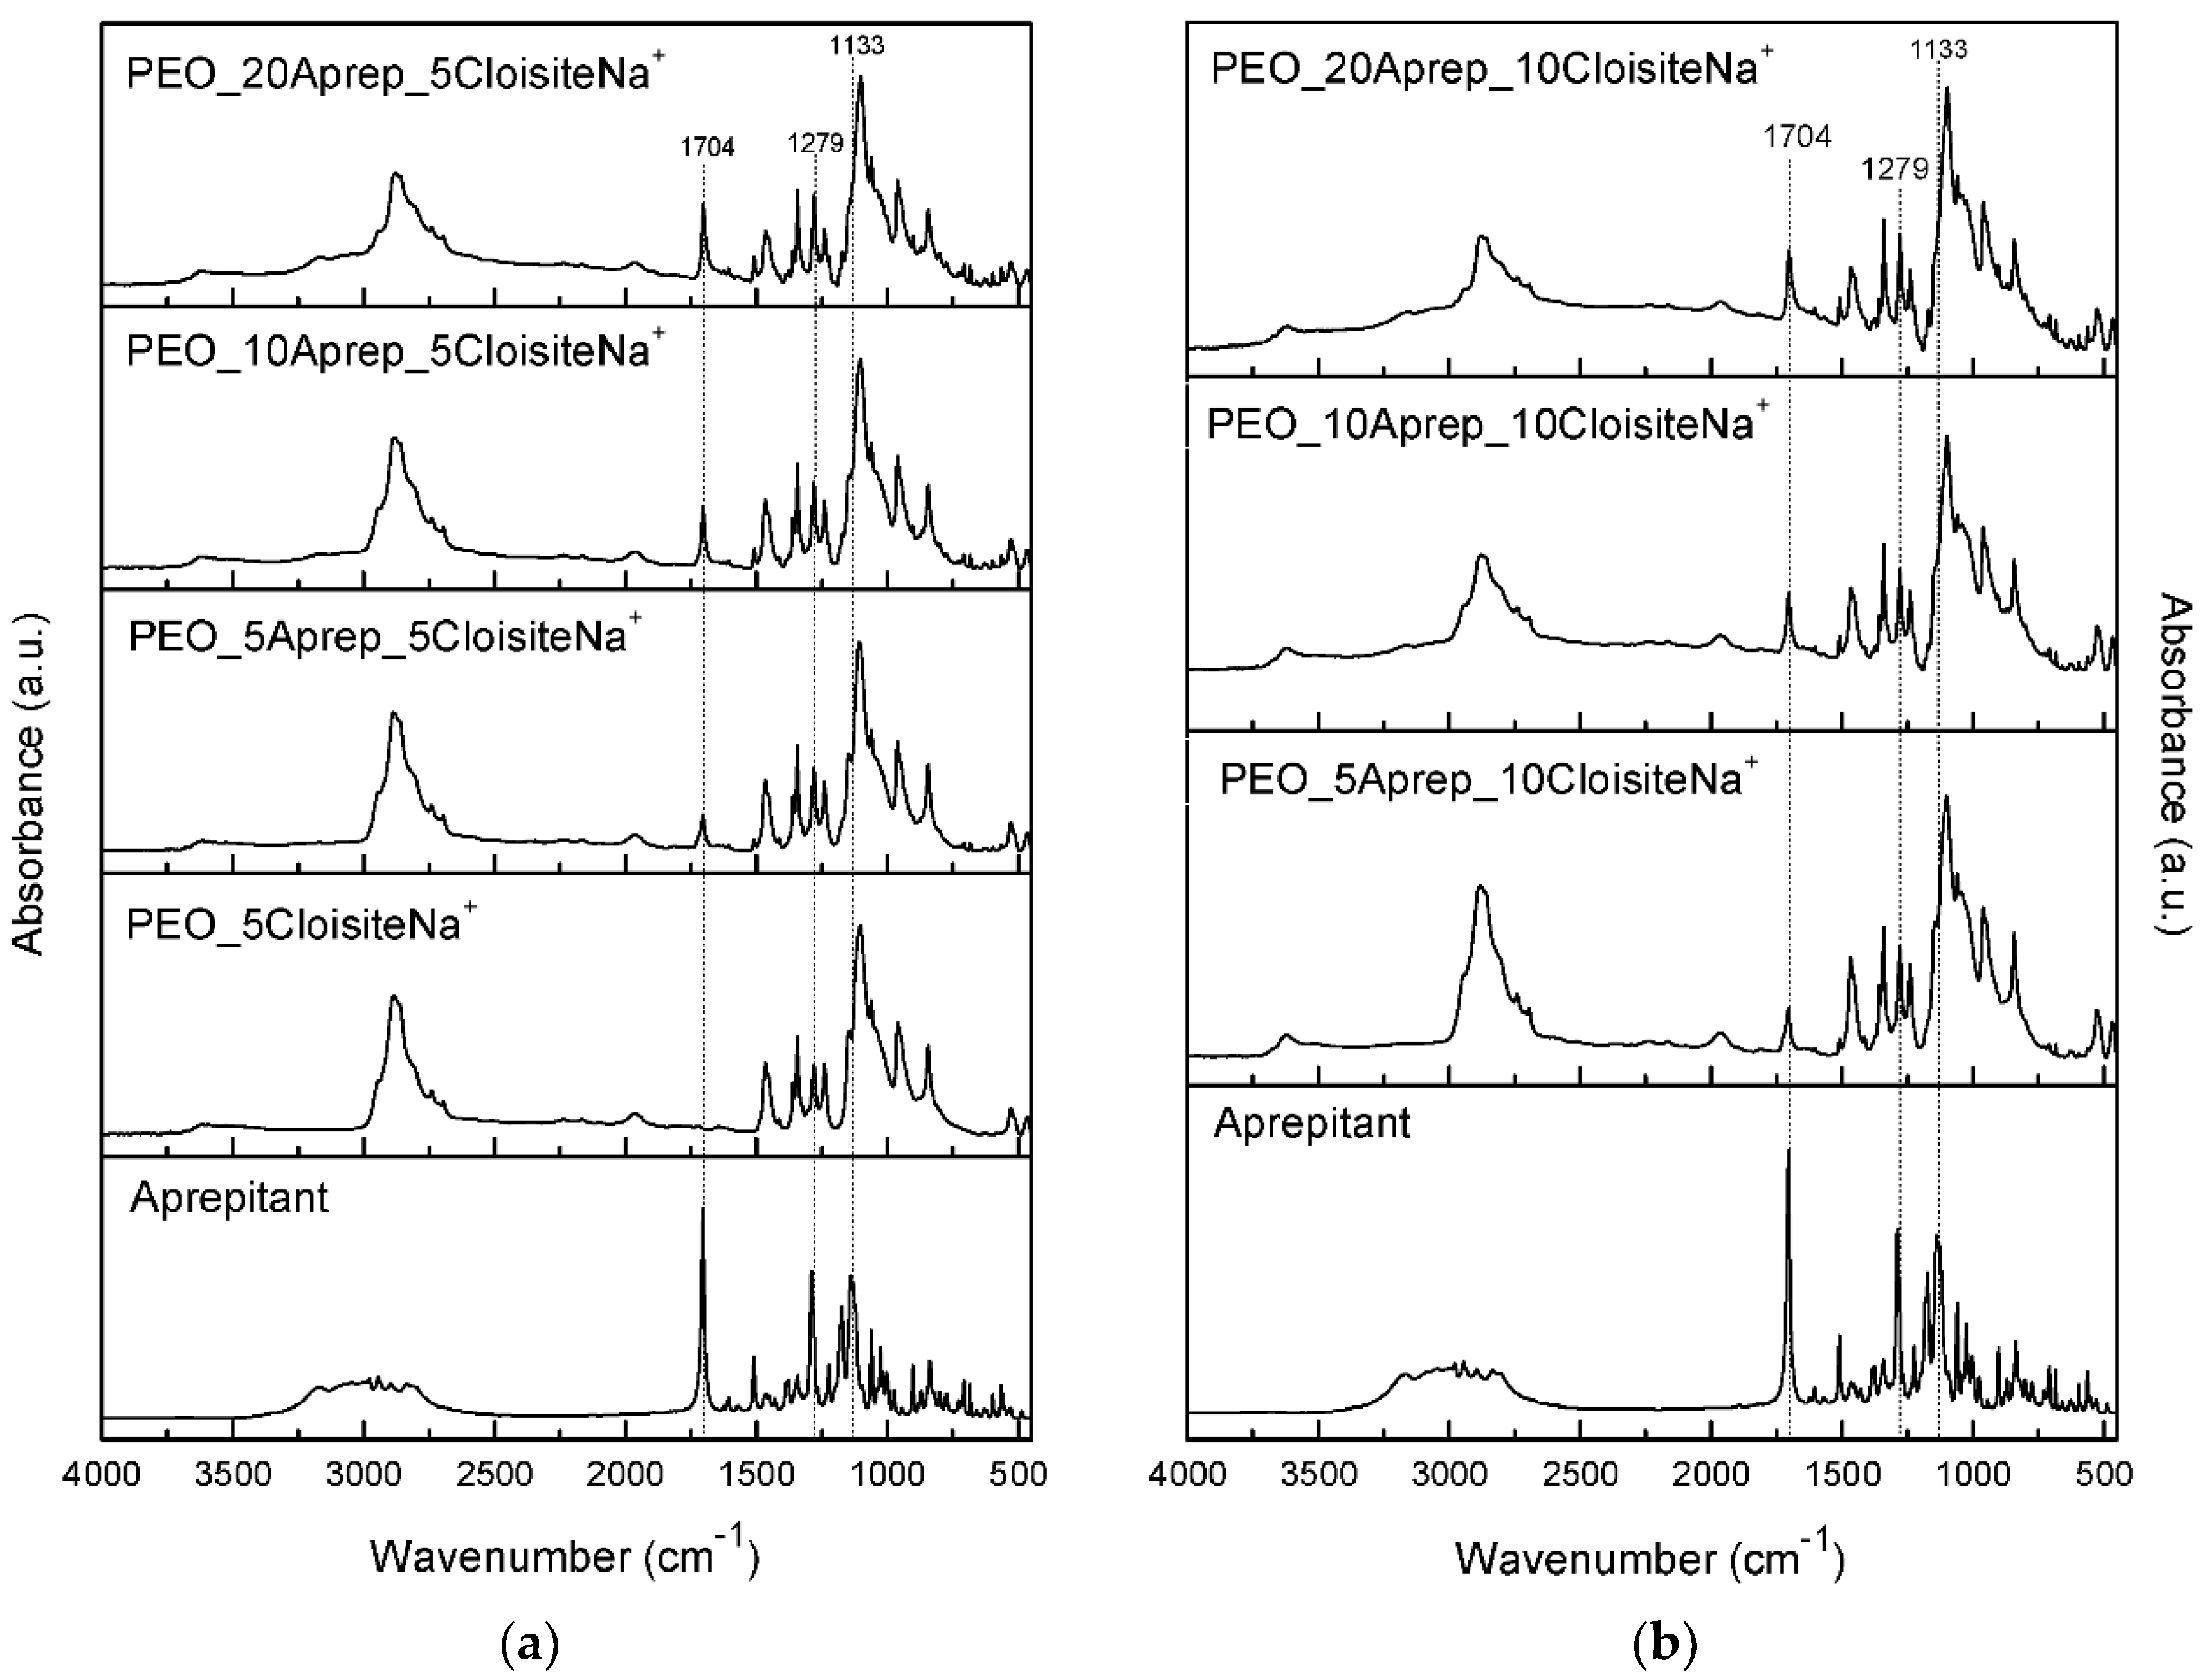
2.2.3. Fourier-Transform Infrared Spectroscopy (FTIR)

Prior to the FTIR analysis, the formulations were pressed into transparent thin films using a hydraulic press heated at 130 °C and pressing with 100 kN. For the pure APR and Cloisite-Na+ samples, approximately 10 mg of APR and Cloisite-Na+ were mixed with 180 mg of KBr in an agate mortal. The mixture was pressed under 8 tons for 30 s to form a pellet. All pellets and films were placed in the optical compartment of a Perkin-Elmer FTIR spectrometer (PerkinElmer Corporation, Waltham, MA, USA), and infrared (IR) absorbance spectra were obtained between 450 and 4000 cm−1 at a resolution of 4 cm−1 using 10 coadded scans. All spectra presented are baseline corrected and normalized.

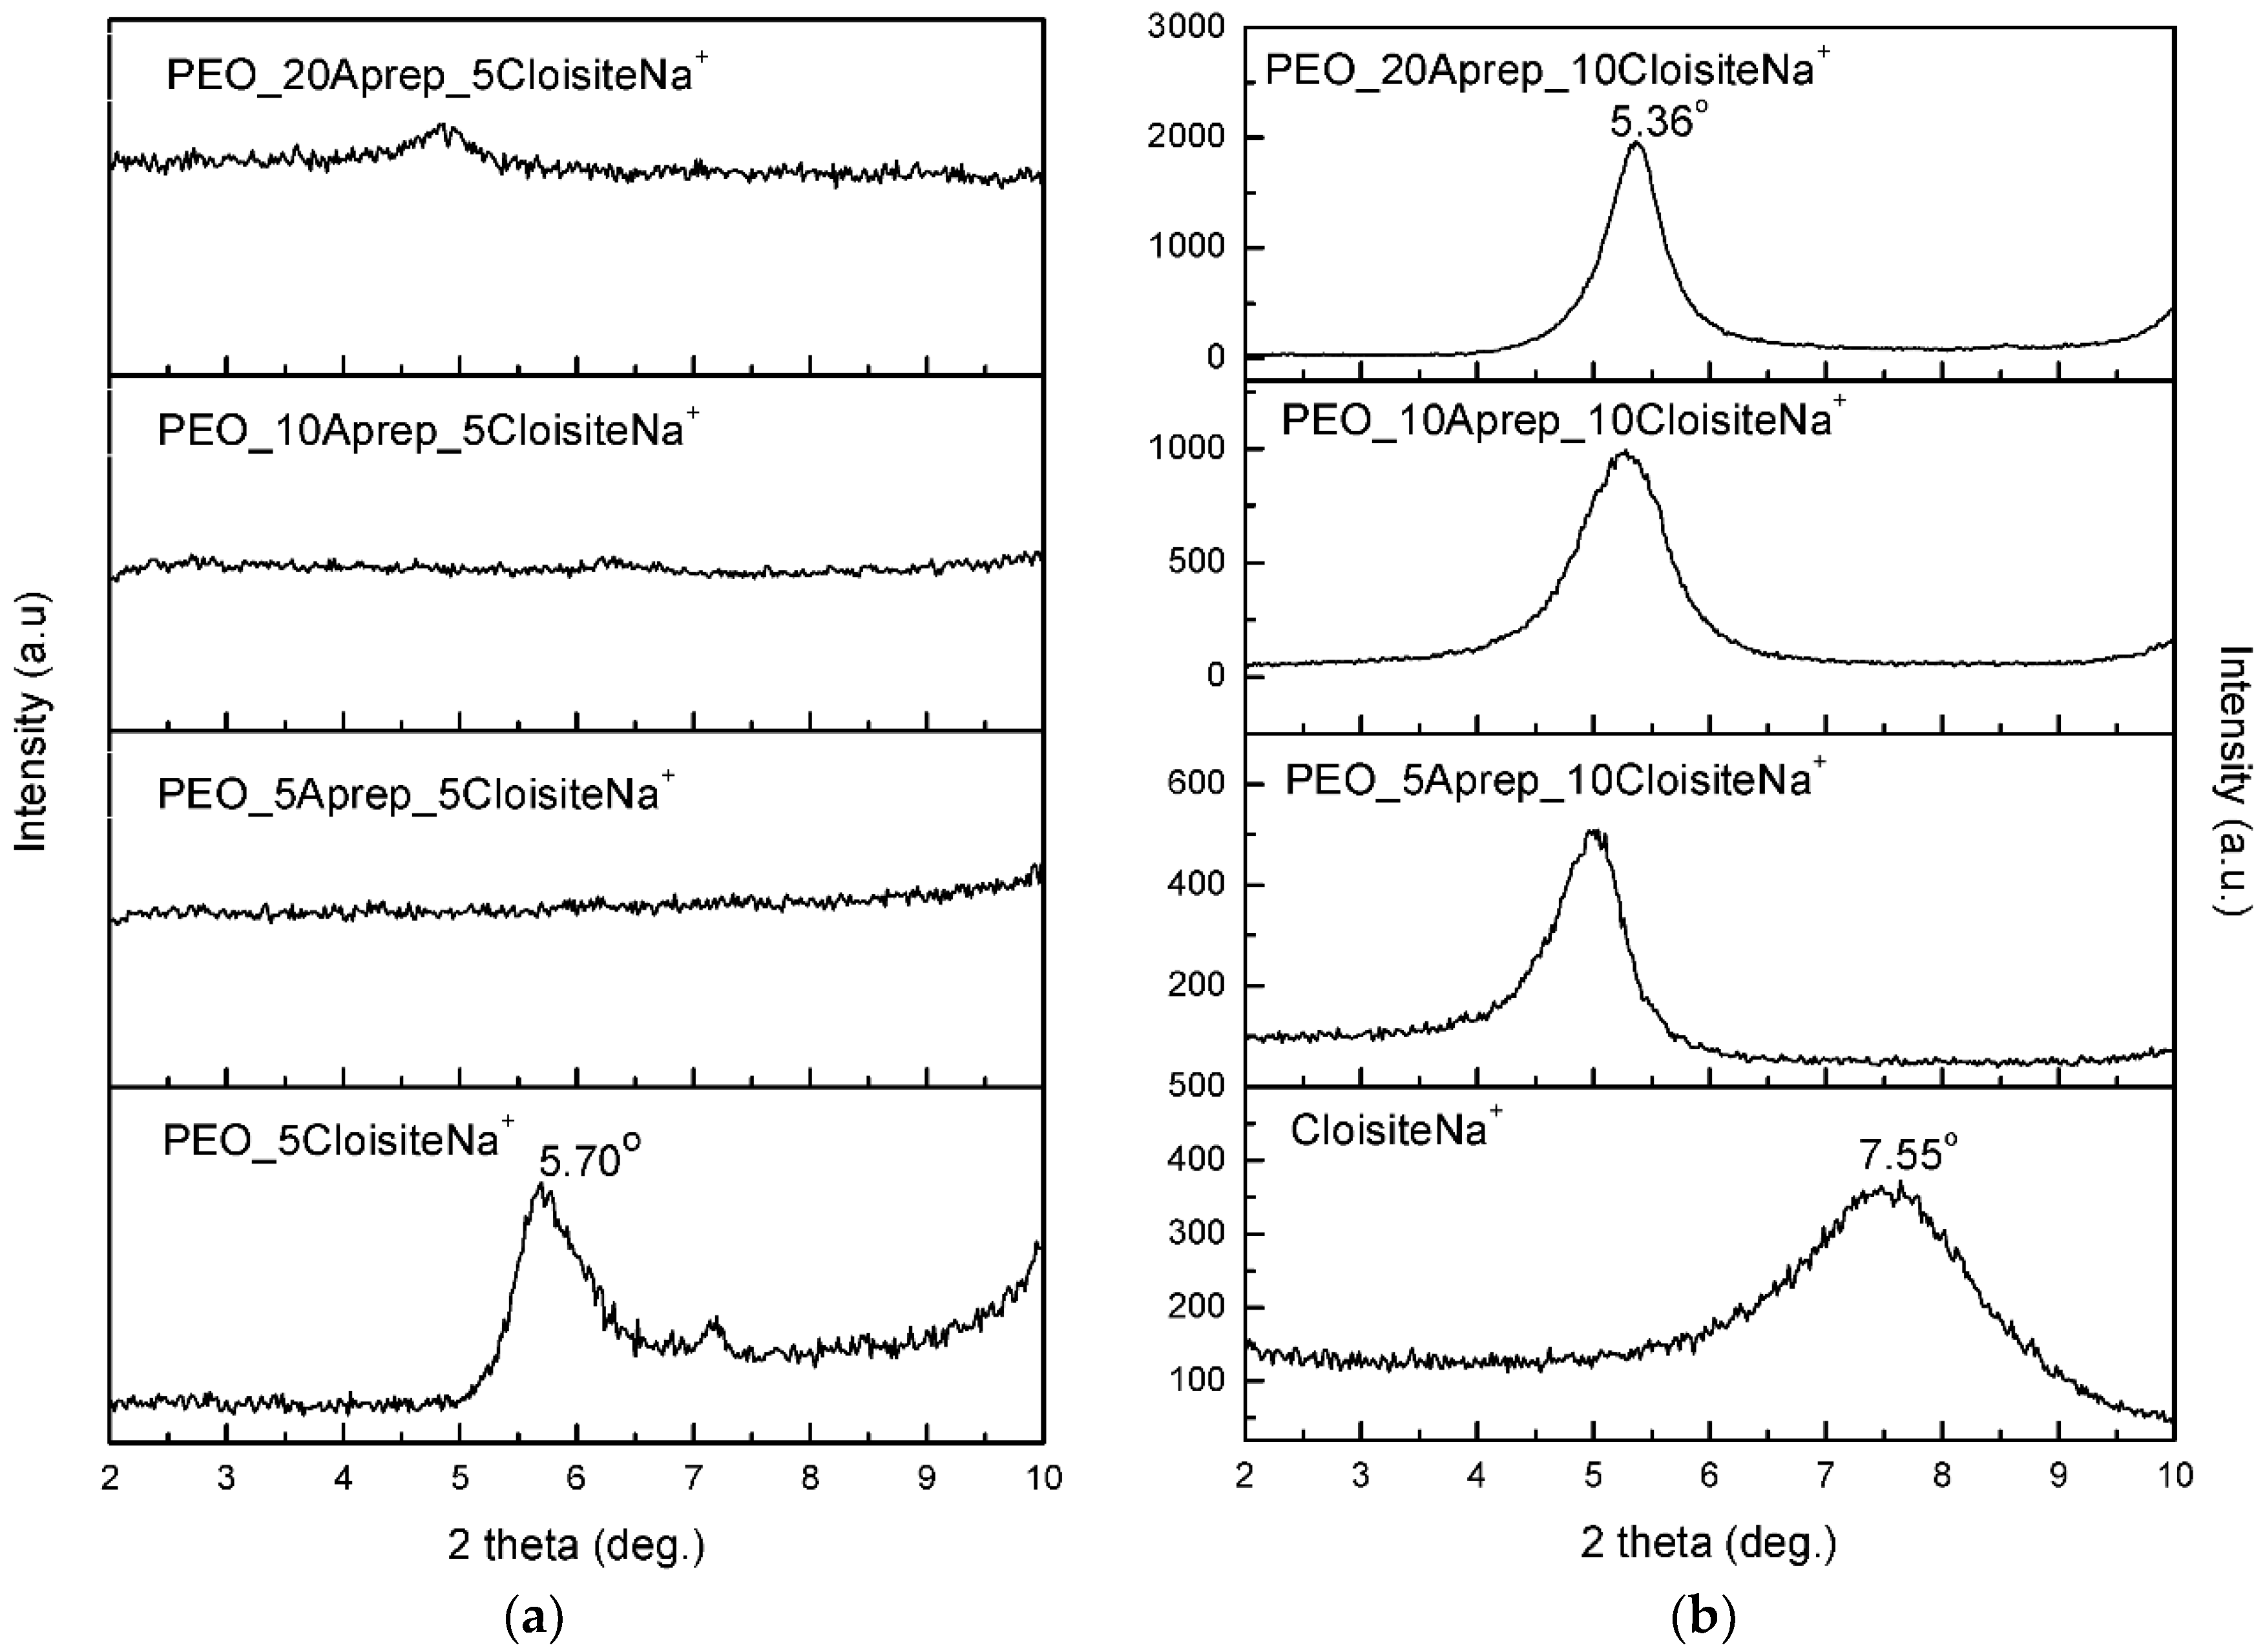
2.2.4. X-Ray Diffraction (XRD)

XRD measurements of the PEO, APR, Cloisite-Na+, and all solid dispersions were performed by scanning over the 2θ range of 2–10° and 5–70°, at steps of 0.02° and 0.05° and counting time of 3 s and 1.2 s per step, respectively, using a MiniFlex II diffractometer (Rigaku Co., Tokyo, Japan) with Bragg–Brentano geometry (θ, 2θ) and a Ni-filtered Cu Kα radiation (λ = 0.154 nm).

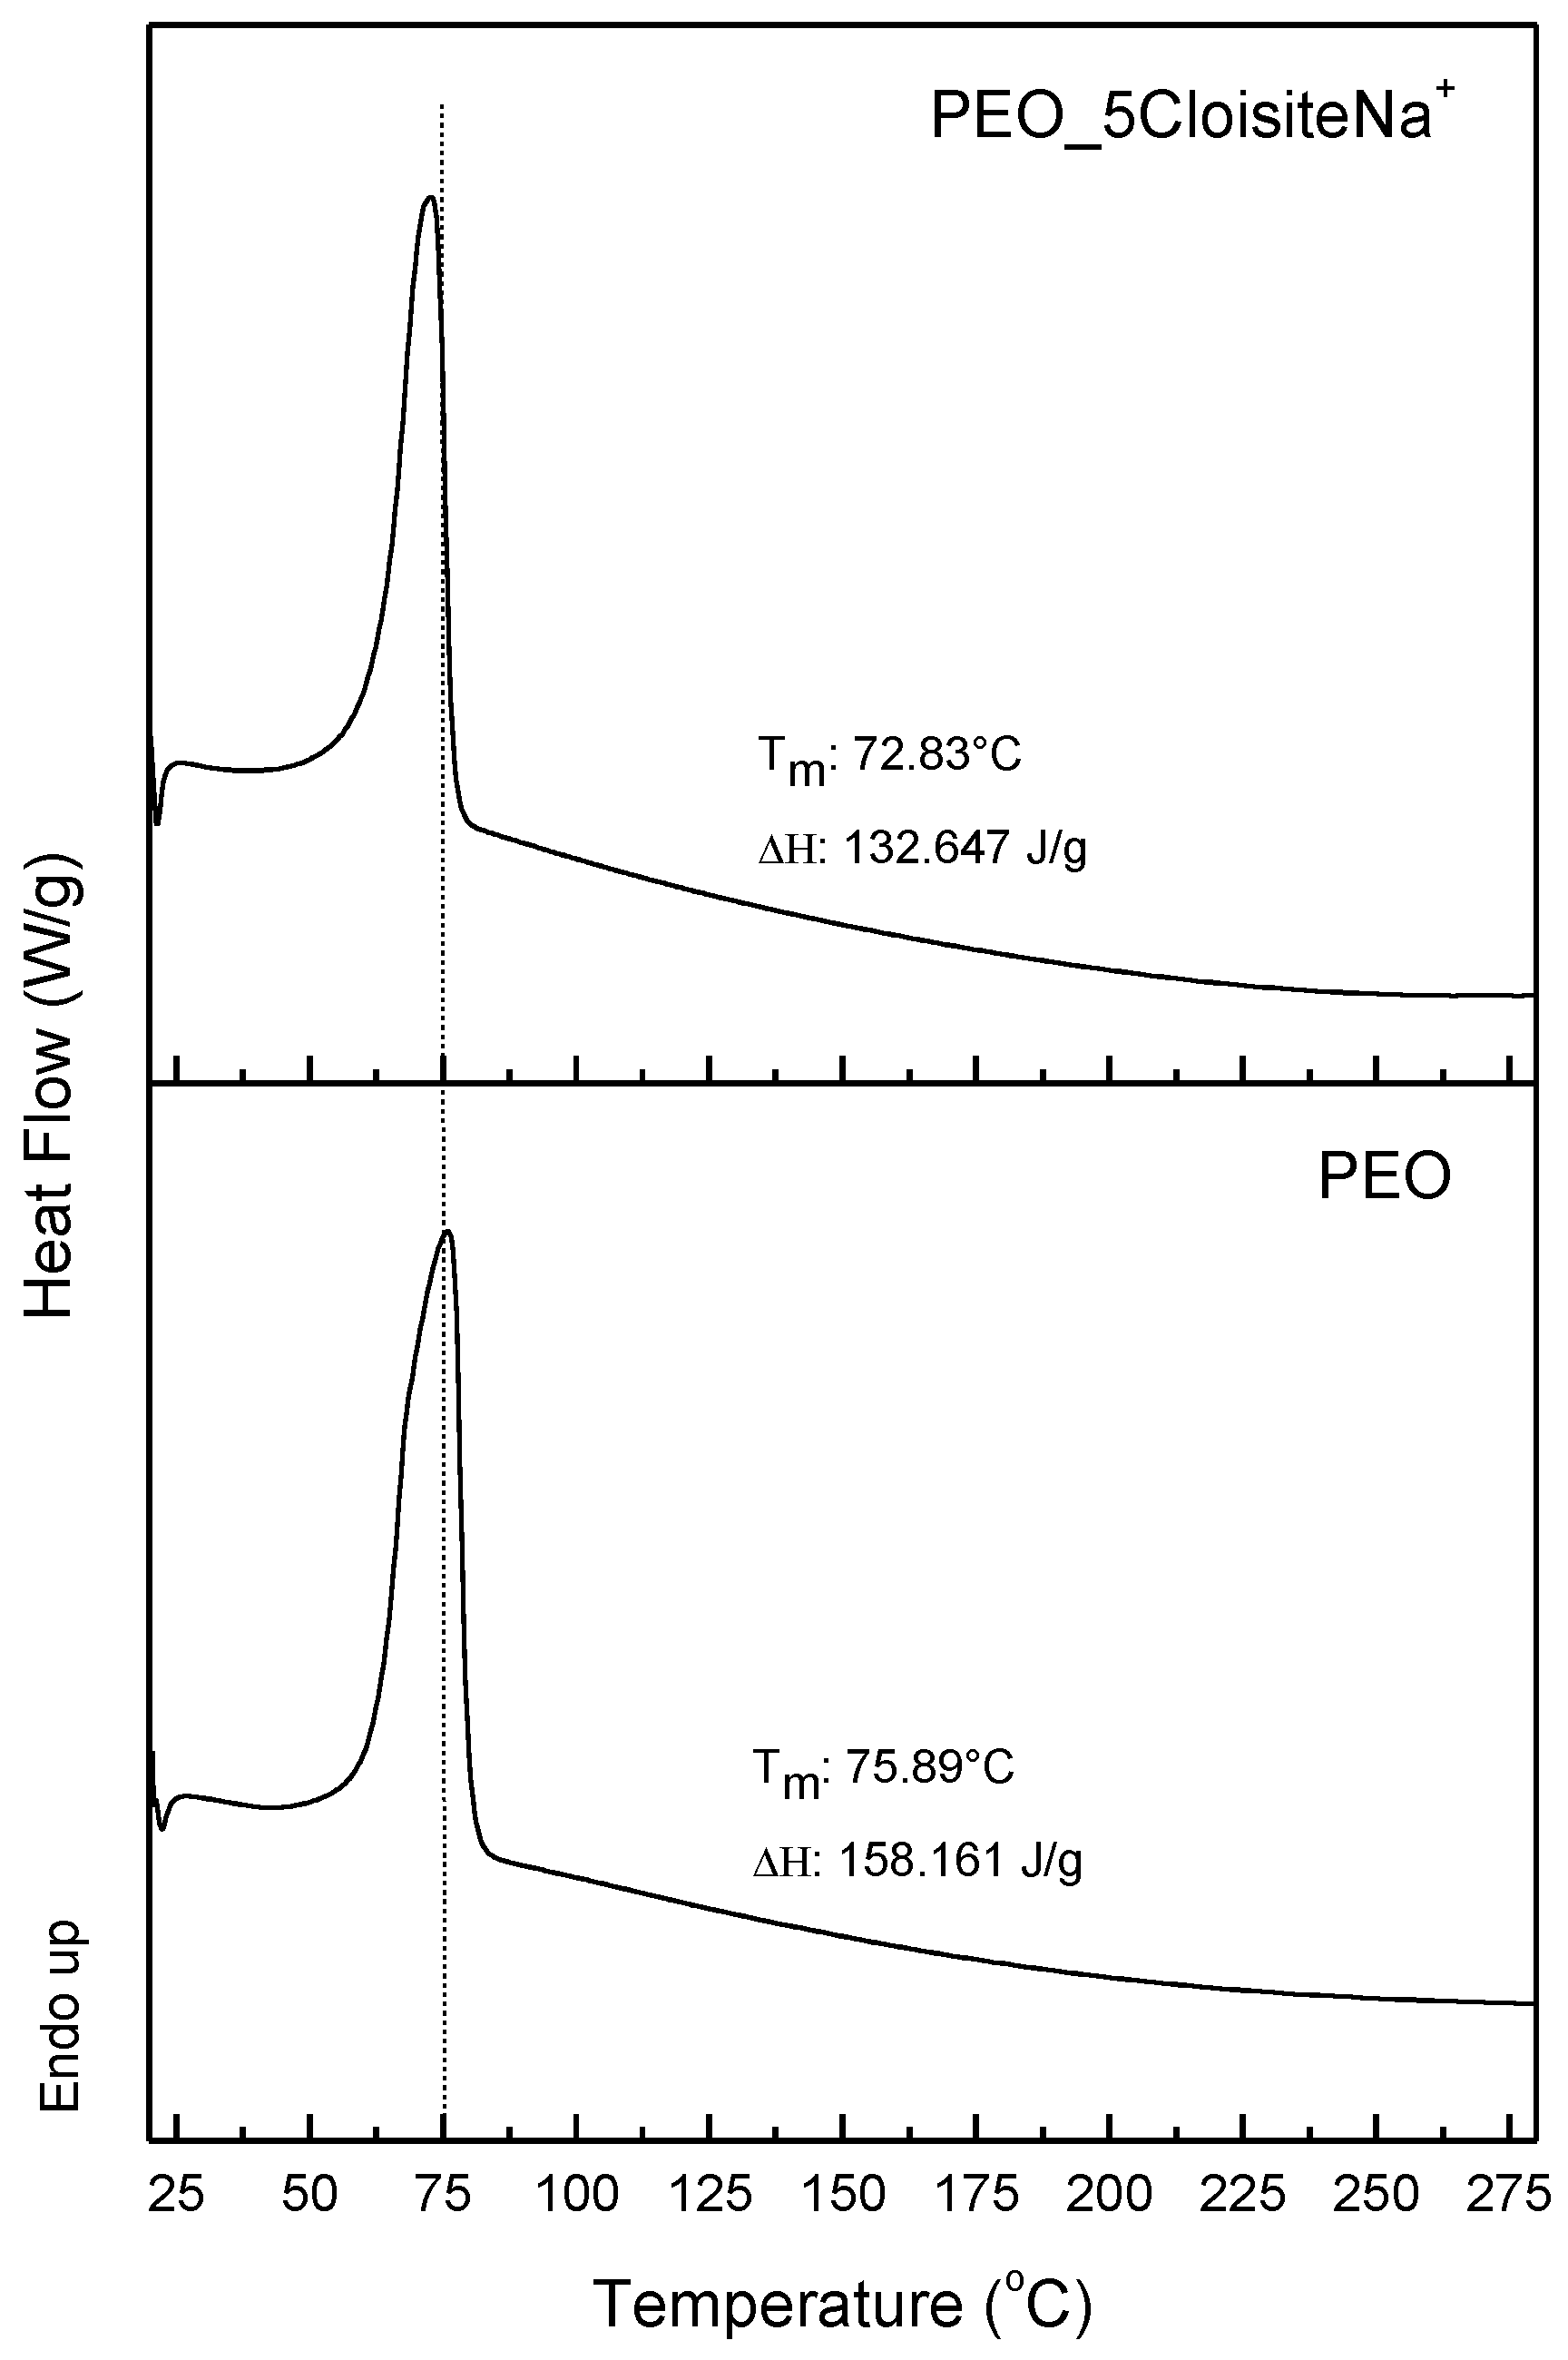
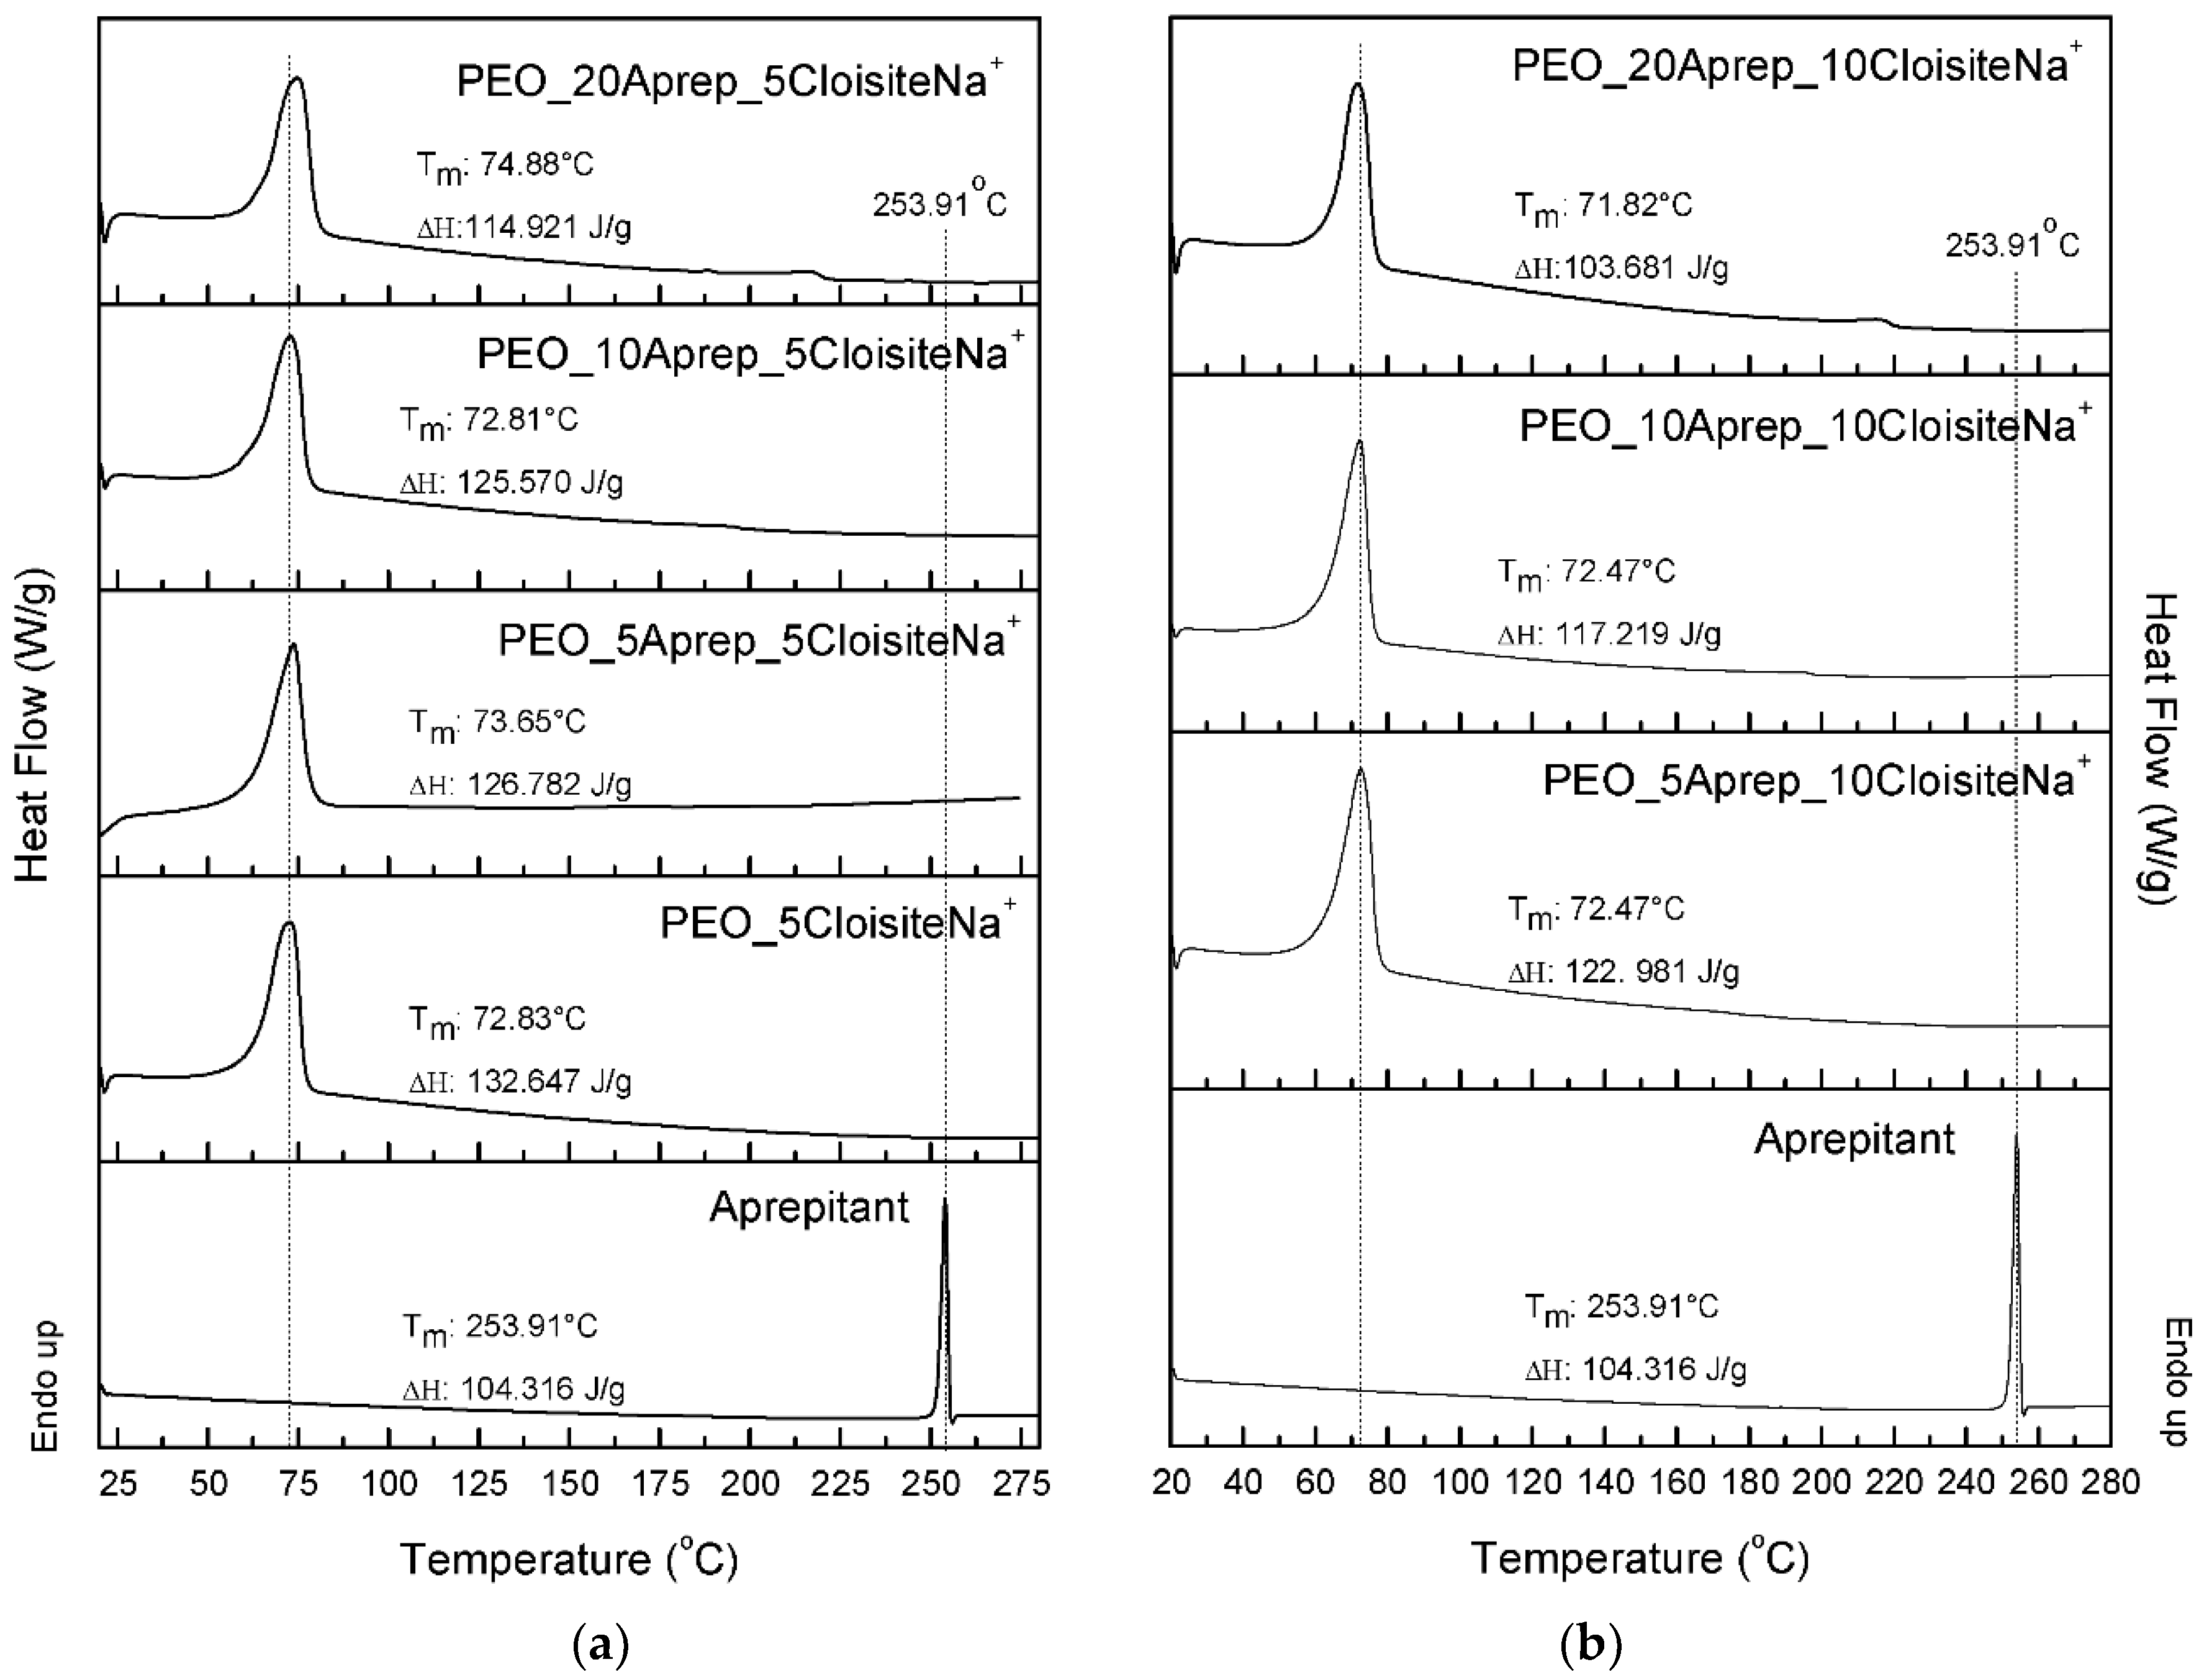
2.2.5. Differential Scanning Calorimetry (DSC)
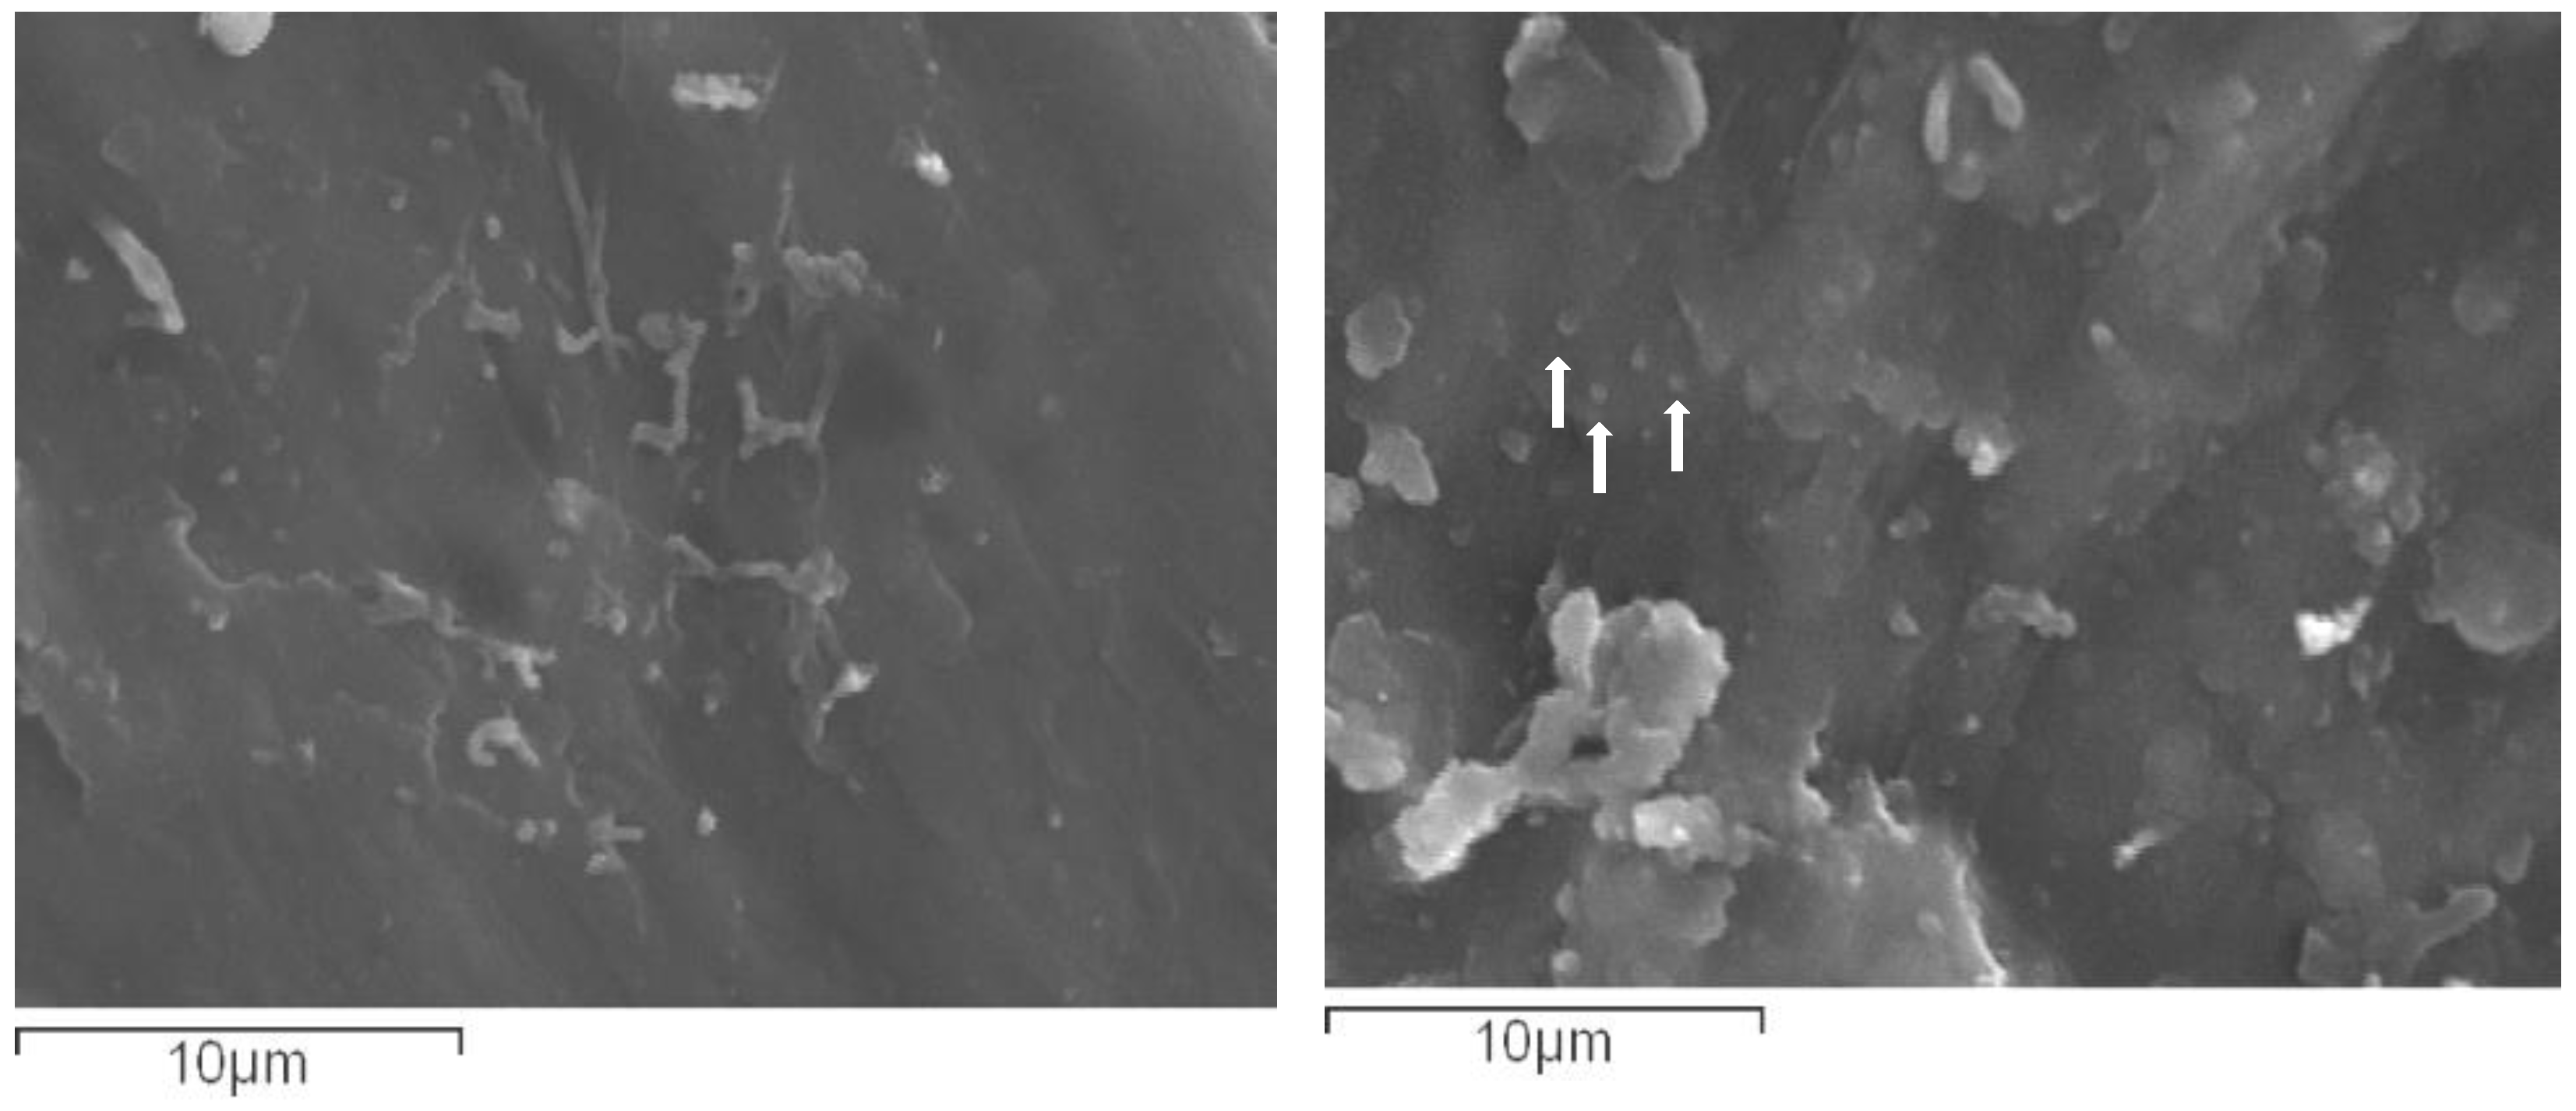
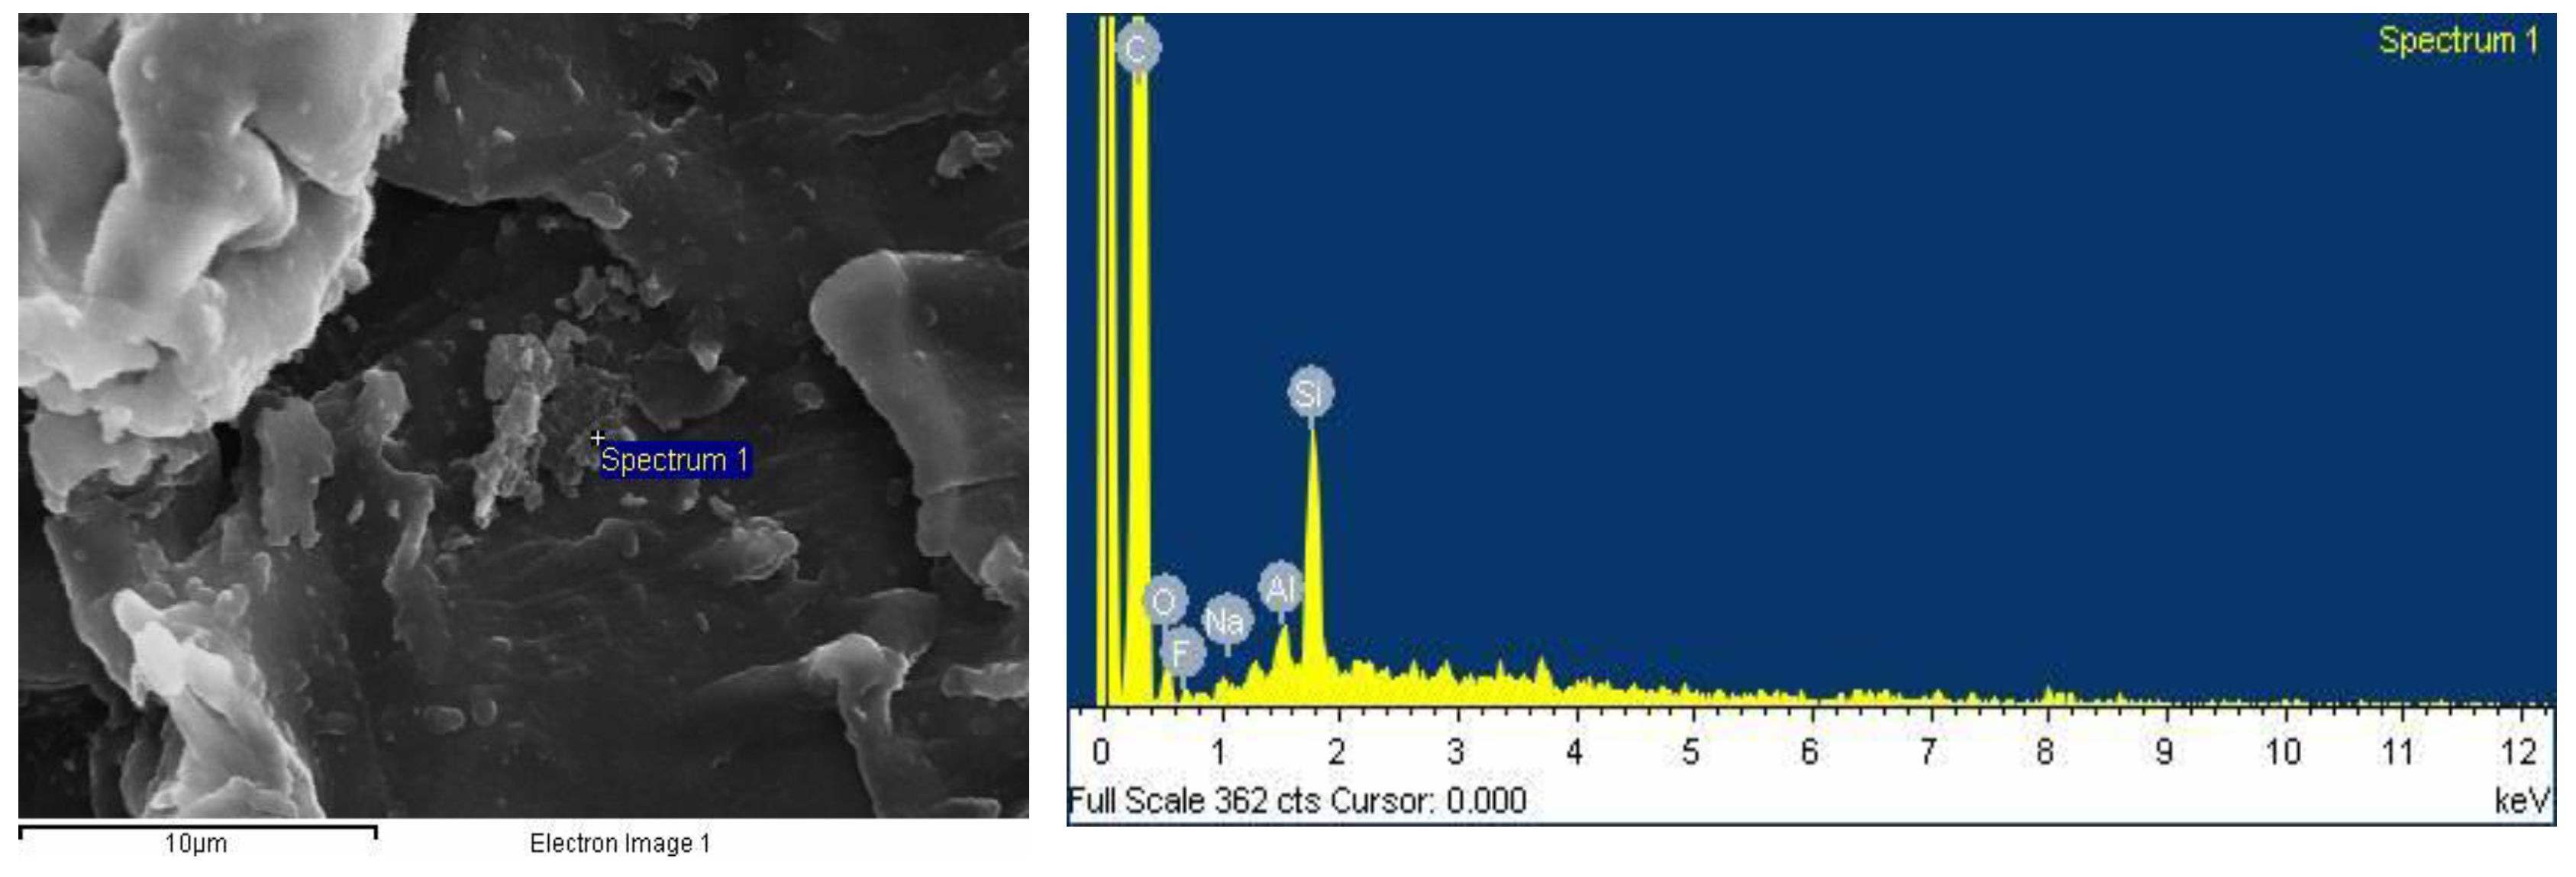
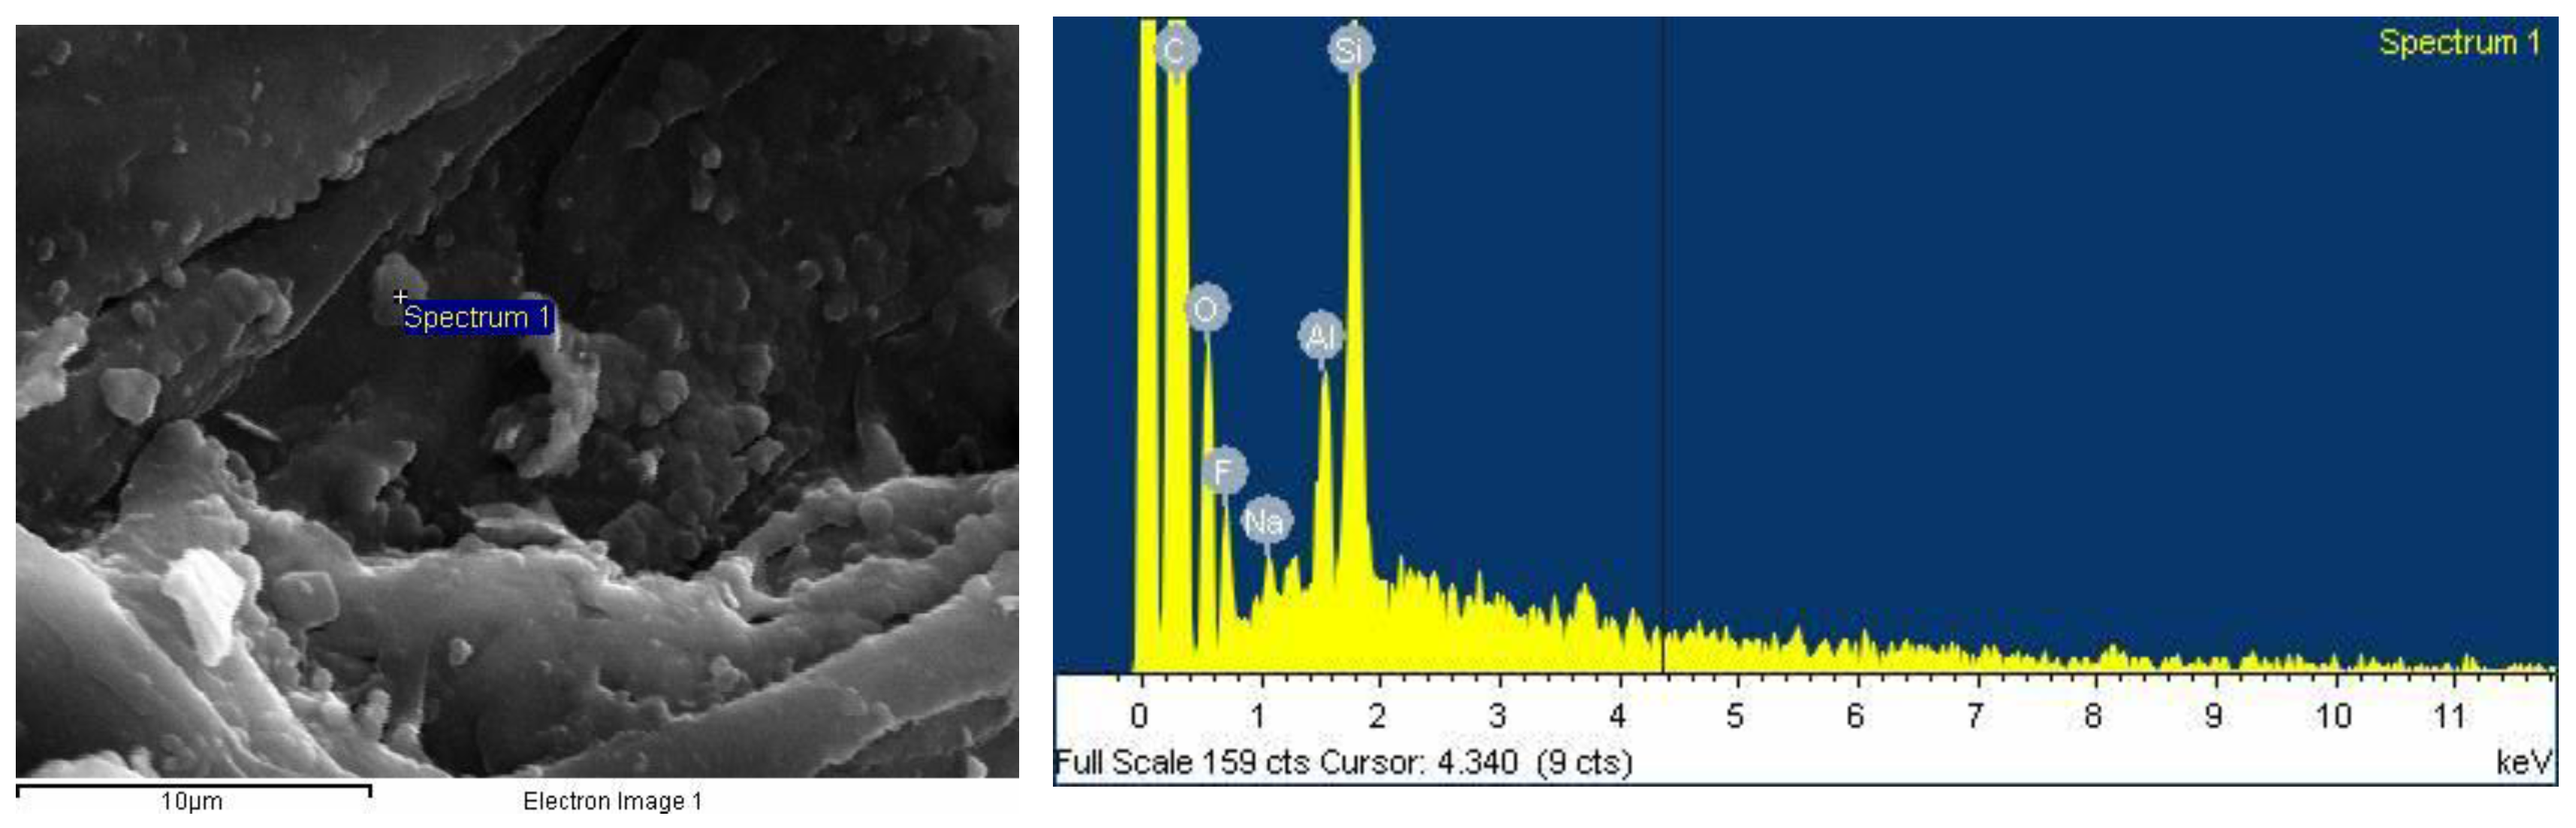
A Perkin-Elmer Pyris Diamond (PerkinElmer Corporation, Waltham, MA, USA) differential scanning calorimeter (DSC), equipped with a Perkin-Elmer Intracooler II and calibrated with high-purity indium and zinc standards, was used for DSC measurements. About 5 mg of sample was placed in a sealed aluminum sample pan and was heated from 20 °C to 280 °C at a heating rate of 20 °C/min. During the analysis, an inert environment was maintained using nitrogen gas (50 mL/min).

2.2.6. SEM

The morphology of the prepared samples was examined using a scanning electron microscope (SEM), type Jeol (JMS-840, Peabody, MA, USA). The samples were covered with a carbon coating in order to provide good conductivity of the electron beam and avoid charging.

2.2.7. Dissolution Study/In Vitro Release Profile

In vitro release rates of APR from the prepared drug-loaded nanocomposites were measured in USP dissolution apparatus II (paddles). DISKTEK 2100 C (Markham, ON, Canada) with an auto sampler DISTEK EVOLUTION 4300 was used. Dissolution study was performed in 900 mL phosphate buffered saline (pH = 6.8, for oral administration) under sink conditions, containing 2.2% SLS (Food and Drug Administration, FDA-suggested comparative for aprepitant), the temperature was set at 37 ± 1 °C, and the rotation speed was 100 rpm. Each dissolution vessel (n = 10) was loaded with a quantity of drug-loaded polymer/nanocomposite corresponding to 80 mg of APR. All formulations were in the form of flakes with a 2 mm diameter, while pure APR was in powder form for the dissolution test. At predetermined time intervals (10, 19, 30, 45, 60, 90, and 120 min), 2 mL of each sample was collected, filtered through a 0.45 μm nylon filter, and quantified according to the HPLC method described below. Dissolution study was performed as indicated by the FDA guidelines on aprepitant dissolution [49].

2.2.8. HPLC

Quantitative analysis was performed using a Shimadzu (Kyoto, Japan) high-pressure liquid chromatography (HPLC) prominence system consisting of a degasser (DGU-20A5), a liquid chromatograph (LC-20 AD), an auto sampler (SIL-20AC), a UV/vis detector (SPD-20A), and a column oven (CTO-20AC). In details, an Athena C18 reversed-phase column (250 × 4.6 mm, 5 μm particle size) was used, and the mobile phase consisted of ACN/phosphate buffer (1.36 g KH2PO4 dissolved in 1000 mL distilled water, adjusted to pH 7 with 1 M NaOH) 70/30 in ratio. The flow rate was 1 mL/min and UV detection was performed at 215 nm. The injection volume was 20 μL.

3. Results and Discussion

3.1. Characterization and Properties of PEO/Clay Nanocomposites

TGA was initially used to study thermal stability of aprepitant, PEO, and Cloisite-Na+ before the melt-mixing process in order to ensure that no decomposition occurs during the proper study. As can be seen in Figure 1, aprepitant showed thermal stability from ambient temperature until 262 °C, from which point onward, decomposition occurred. Aprepitant showed a two-stage thermal decomposition: a first stage from 262 till 355 °C and a second one from 355 till 428 °C, after which temperature no significant change in its mass loss was observed. PEO appeared to be more stable, with only one thermal decomposition stage, starting from 333 °C and ending at 455 °C, with a mass loss of 96%. Finally, clay showed an initial loss in its mass until 100 °C, corresponding to humidity loss—which was found to be present even after its heating in an oven overnight at 100 °C—while no significant change in its mass was observed till 700 °C. TGA study showed that no thermal decomposition happens at 130 °C, the temperature at which the melt-mixing process took place.
Τhe dispersion of sodium montmorillonite clay (Cloisite-Na+) microsized particles within PEO was quite effective as can be seen from the photographs in Figure 2, where the transparency of the 5 wt % clay/PEO composite was similar to that of the neat polymer. At the relatively high loading of 10 wt % clay, the composite films became less transparent. However, no aggregates of clay particles were observed for both loadings, proving the high efficiency of the melt mixing (by the twin-screw melt mixer) of PEO with the sodium clay.
The structural characteristics of the PEO, the Cloisite-Na+ clay, and the respective composites were investigated by means of FTIR and XRD measurements. Figure 3 displays the FTIR spectra of the respective samples. The characteristic peaks of pure semicrystalline PEO appear at 2868 cm−1 (C–H stretching); 1465 cm−1 (CH2 scissoring); 1358 cm−1 and 1343 cm−1 (CH2 wagging); 1280 cm−1 and 1240 cm−1 (CH2 twisting); the triplet peak of C–O–C stretching at 1146 cm−1, 1100 cm−1, and 1061 cm−1, with maximum intensity presenting at 1100 cm−1 [50,51,52]; and the peaks at 960 cm−1 (CH2 rocking and C–O–C deformation); 842 cm−1 (CH2 rocking); and 528 cm−1 (C–O–C bending) [53,54]. The characteristics bands of Cloisite-Na+ clay appear at 3630 cm−1 (–OH stretching of Al–OH and Si–OH), 3443 cm−1 (–OH stretching of interlayer H–O–H), 1695 cm−1 (–OH bending), 1639 cm−1 (interlayer H–O–H deformation), 1043 cm−1 (Si–OH and Si–O–Si stretching), 916 cm−1 and 798 cm−1 (Al–Al–O–H and Al–O–Si bending, respectively), 622 cm−1 (Al–O bending), 522 cm−1 and 466 cm−1 (Al–O–Si and Si–O–Si bending, respectively) [55]. The comparison of the FTIR spectra of the polymer, the clay, and the PEO/clay composite indicates that the structural features of PEO have not been deteriorated or changed, while the presence of the clay is verified by the increase of the intensity of the peak at about 1100 cm−1 (from PEO) due to the superimposition of the peak at 1343 cm−1 (from the clay).
The XRD patterns of PEO, Cloisite-Na+ clay, and the respective nanocomposites are shown in Figure 4, both at low (Figure 4a) and wide-angle (Figure 4b) range. The basal spacing (d001) of the Cloisite-Na+ powder, calculated from the diffraction peak at 2θ = 7.55°, was = 11.7 Å (Figure 4a). In the XRD pattern of PEO/5 wt % Cloisite-Na+ nanocomposite, the diffraction peak related to the basal spacing d001 was shifted and was observed at 2θ = 5.70° (d001 = 15.5 Å). This increase of the basal spacing is a clear indication that fractions of the PEO chains have been intercalated in the intragallery space between the clay nanolayers [56]. The wide-angle XRD pattern of the pure Cloisite-Na+ (Figure 4b) exhibits the characteristic peaks of its crystalline structure at ~19.8°, 28.2°, and 35.1° 2θ. Similarly, the peaks at 15.98°, 19.9°, 24.14°, 27.02°, 27.80°, and 28.73° in the pattern of the pure PEO indicate its semicrystalline state. After the melt mixing with the clay, the PEO retained its structure, while the highest intensity peak of the clay at ~ 19.9° is superimposed by that of the PEO.
The thermal characteristics of the PEO/clay nanocomposites have been extensively discussed in previous studies [57,58,59,60]. DSC analysis is one of the most used methods for analyzing first-order transitions such as melting and crystallization. From the DSC curves presented in Figure 5, the melting point (Τm) and heat enthalpy of fusion (ΔΗ) of the pure PEO and the PEO/5 wt % clay were determined.
The intense peak due to PEO melting appears at 75.89 °C, indicating the semicrystalline nature of the polymer, while the corresponding peak of the PEO/5 wt % Cloisite-Na+ nanocomposite has been shifted to a lower temperature (Tm = 72.83 °C) along with a decreased endotherm peak area, ΔΗ (ΔHPEO = 158.161 J/g, ΔΗPEO/5Cloisite-Na+ = 132.647 J/g). This shift to lower Tm by ca. 3 °C indicates a slight decrease in the crystallinity of PEO in the nanocomposite, while the decrease of ΔΗ confirms the intercalation of the PEO between clay nanolayers, as indicated above by the XRD results [61]. The decreased heat of fusion (ΔΗ) also indicates that the clay nanolayers may inhibit the crystallization of the PEO matrix. The presence of the nanolayers or even of the finely dispersed clay microparticles in the polymeric matrix disturbs the crystal growth, as the polymer’s mobility is decreased due to the presence of these nano-/microparticles [57,58,60].

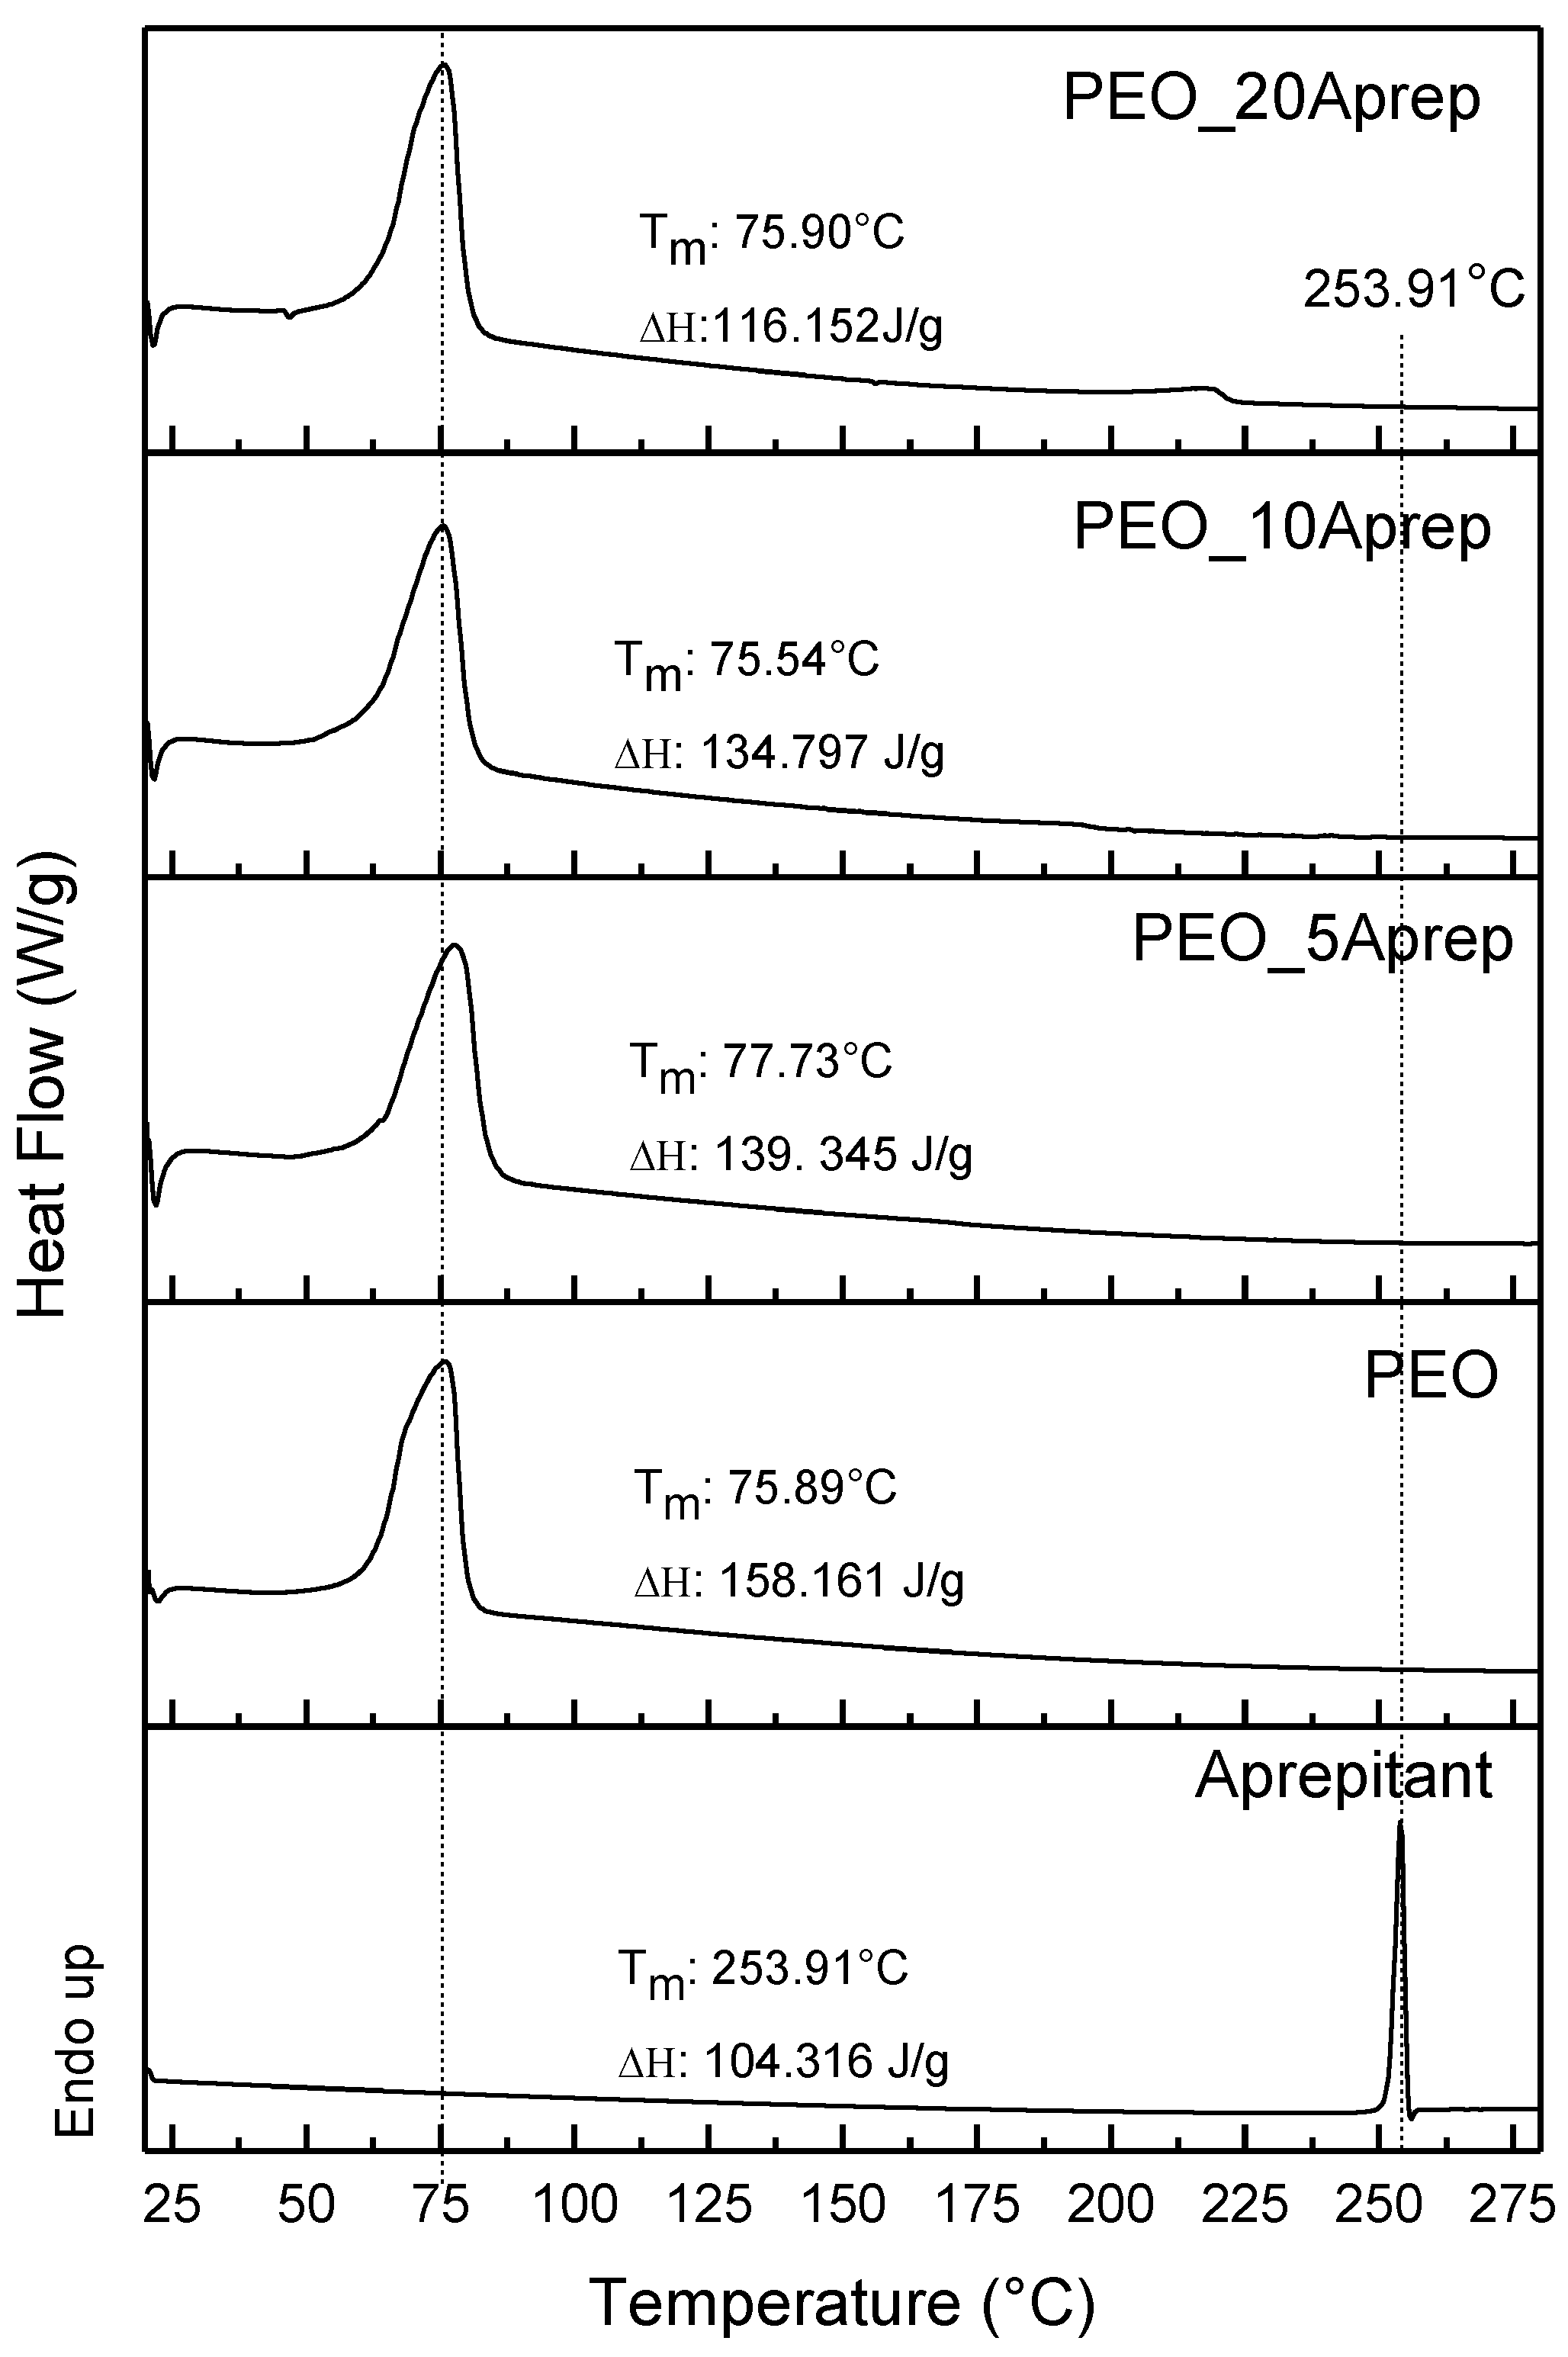
3.2. Characterization of Drug Loaded PEO

Representative SEM images of the drug-loaded PEO are shown in Figure 6. It can be suggested that aprepitant is highly dispersed, almost “fused” in the polymer matrix, as only some very small particles in the form of spheres (indicated by white arrows) lower than 0.25 μm in size could be identified in the SEM images.
FTIR spectroscopy is a very useful and widely used method to examine any possible interactions between polymers and “dissolved” drugs or possible structural changes in either of the blend components. The most probable type of bonding that is expected to happen between PEO and APR is hydrogen bonding between the amine group of APR and the oxygen or hydroxyl end groups (–OH groups) of PEO. However, as can be seen from the FTIR spectrum of the pure APR compound (Figure 7a), the respective peak at 1605 cm−1 (N–H bending) is of very low intensity due to the relative low abundance of these groups in the APR molecule. Thus, it is difficult to identify and discuss the presence of absence of this peak in the PEO/APR formulations (spectra also included in Figure 7a). Other characteristic peaks of APR can be identified at 3167 cm−1 (secondary N–H stretching), 1704 cm−1 (amide C=O stretch) [62], and 1509 cm−1 (C=C stretch). Peaks at 1289 cm−1, 1169 cm−1, and 1069 cm−1 are due to C–O stretching [63], while peaks at 1129 cm−1, 1140 cm−1, and 1117 cm−1 correspond to C–F stretching. The presence of the band at 1140 cm−1 indicates that the APR was a form II polymorph, as reported in literature [64]. The FTIR spectra of the APR-loaded PEO exhibited all the characteristic peaks of pristine PEO (Figure 7a), thus indicating the retention of its structure. Furthermore, the peak at 1704 cm−1 verifies the presence and structural integrity of APR in the PEO/APR solid dispersions. Since this peak remains at the same position as in neat drug, any interactions with PEO should be excluded.
The XRD patterns of pure APR and PEO and the APR-loaded PEO are also shown in Figure 7b. Pure APR exists in two crystal polymorphs: form I and II. Each form exhibits different characteristic reflections. In accordance with the data reported in the literature, it can be seen that both forms can be identified in the drug used in this study, that is, peaks at about 12.7°, 16.7°, 20.0°, and 23.0° corresponding to form I and peaks at about 18.2° and 21.0° attributed to form II [64,65]. Some of these peaks can also be seen in the pattern of the 10 and 20 wt % APR-loaded PEO sample, indicating that the drug is dispersed in crystalline, or better still, in semicrystalline form inside the polymer matrix. This was expected since melt mixing was taking place at a lower temperature than the melting point of the drug, in order to avoid drug decomposition. Also, this is very common when semicrystalline polymers are used for the preparation of drug solid dispersions [66,67,68]. This is ought to improve polymer microstructure and especially that of existing polymer crystal which acts as a nucleating agent for drug crystallization. However, as can be seen, the intensity of drug peaks is very small, which is a clear indication that their crystallinity was reduced in solid dispersions. The absence of the APR peaks in the patterns of the composites with the lower drug loading can be justified based on the relatively lower absolute crystallinity of the drug compared to that of the PEO and the lower loading degree (5 wt %). The drug in this formulation may be dispersed in amorphous form.
The DSC curves of PEO, APR, and the drug-loaded polymer are shown in Figure 8. PEO exhibits an endothermic peak at 75.89 °C, while the APR exhibits a sharp endothermic peak at 253.91 °C. The sharp peak attributed to the APR is not present in either of the curves of the drug-loaded PEOs. Since a pronounced decrease in the crystallinity of APR was justified on the basis of XRD data of the APR/PEO blends, it can be suggested that the absence of this peak is due to APR amorphisation. However, in formulations with 10 and 20 wt % APR, some crystalline peaks have been identified in XRD patterns. Thus, the absence of any APR peak can be attributed to dissolution of APR into the molten state of PEO during the increase of the temperature in the DSC experiment.

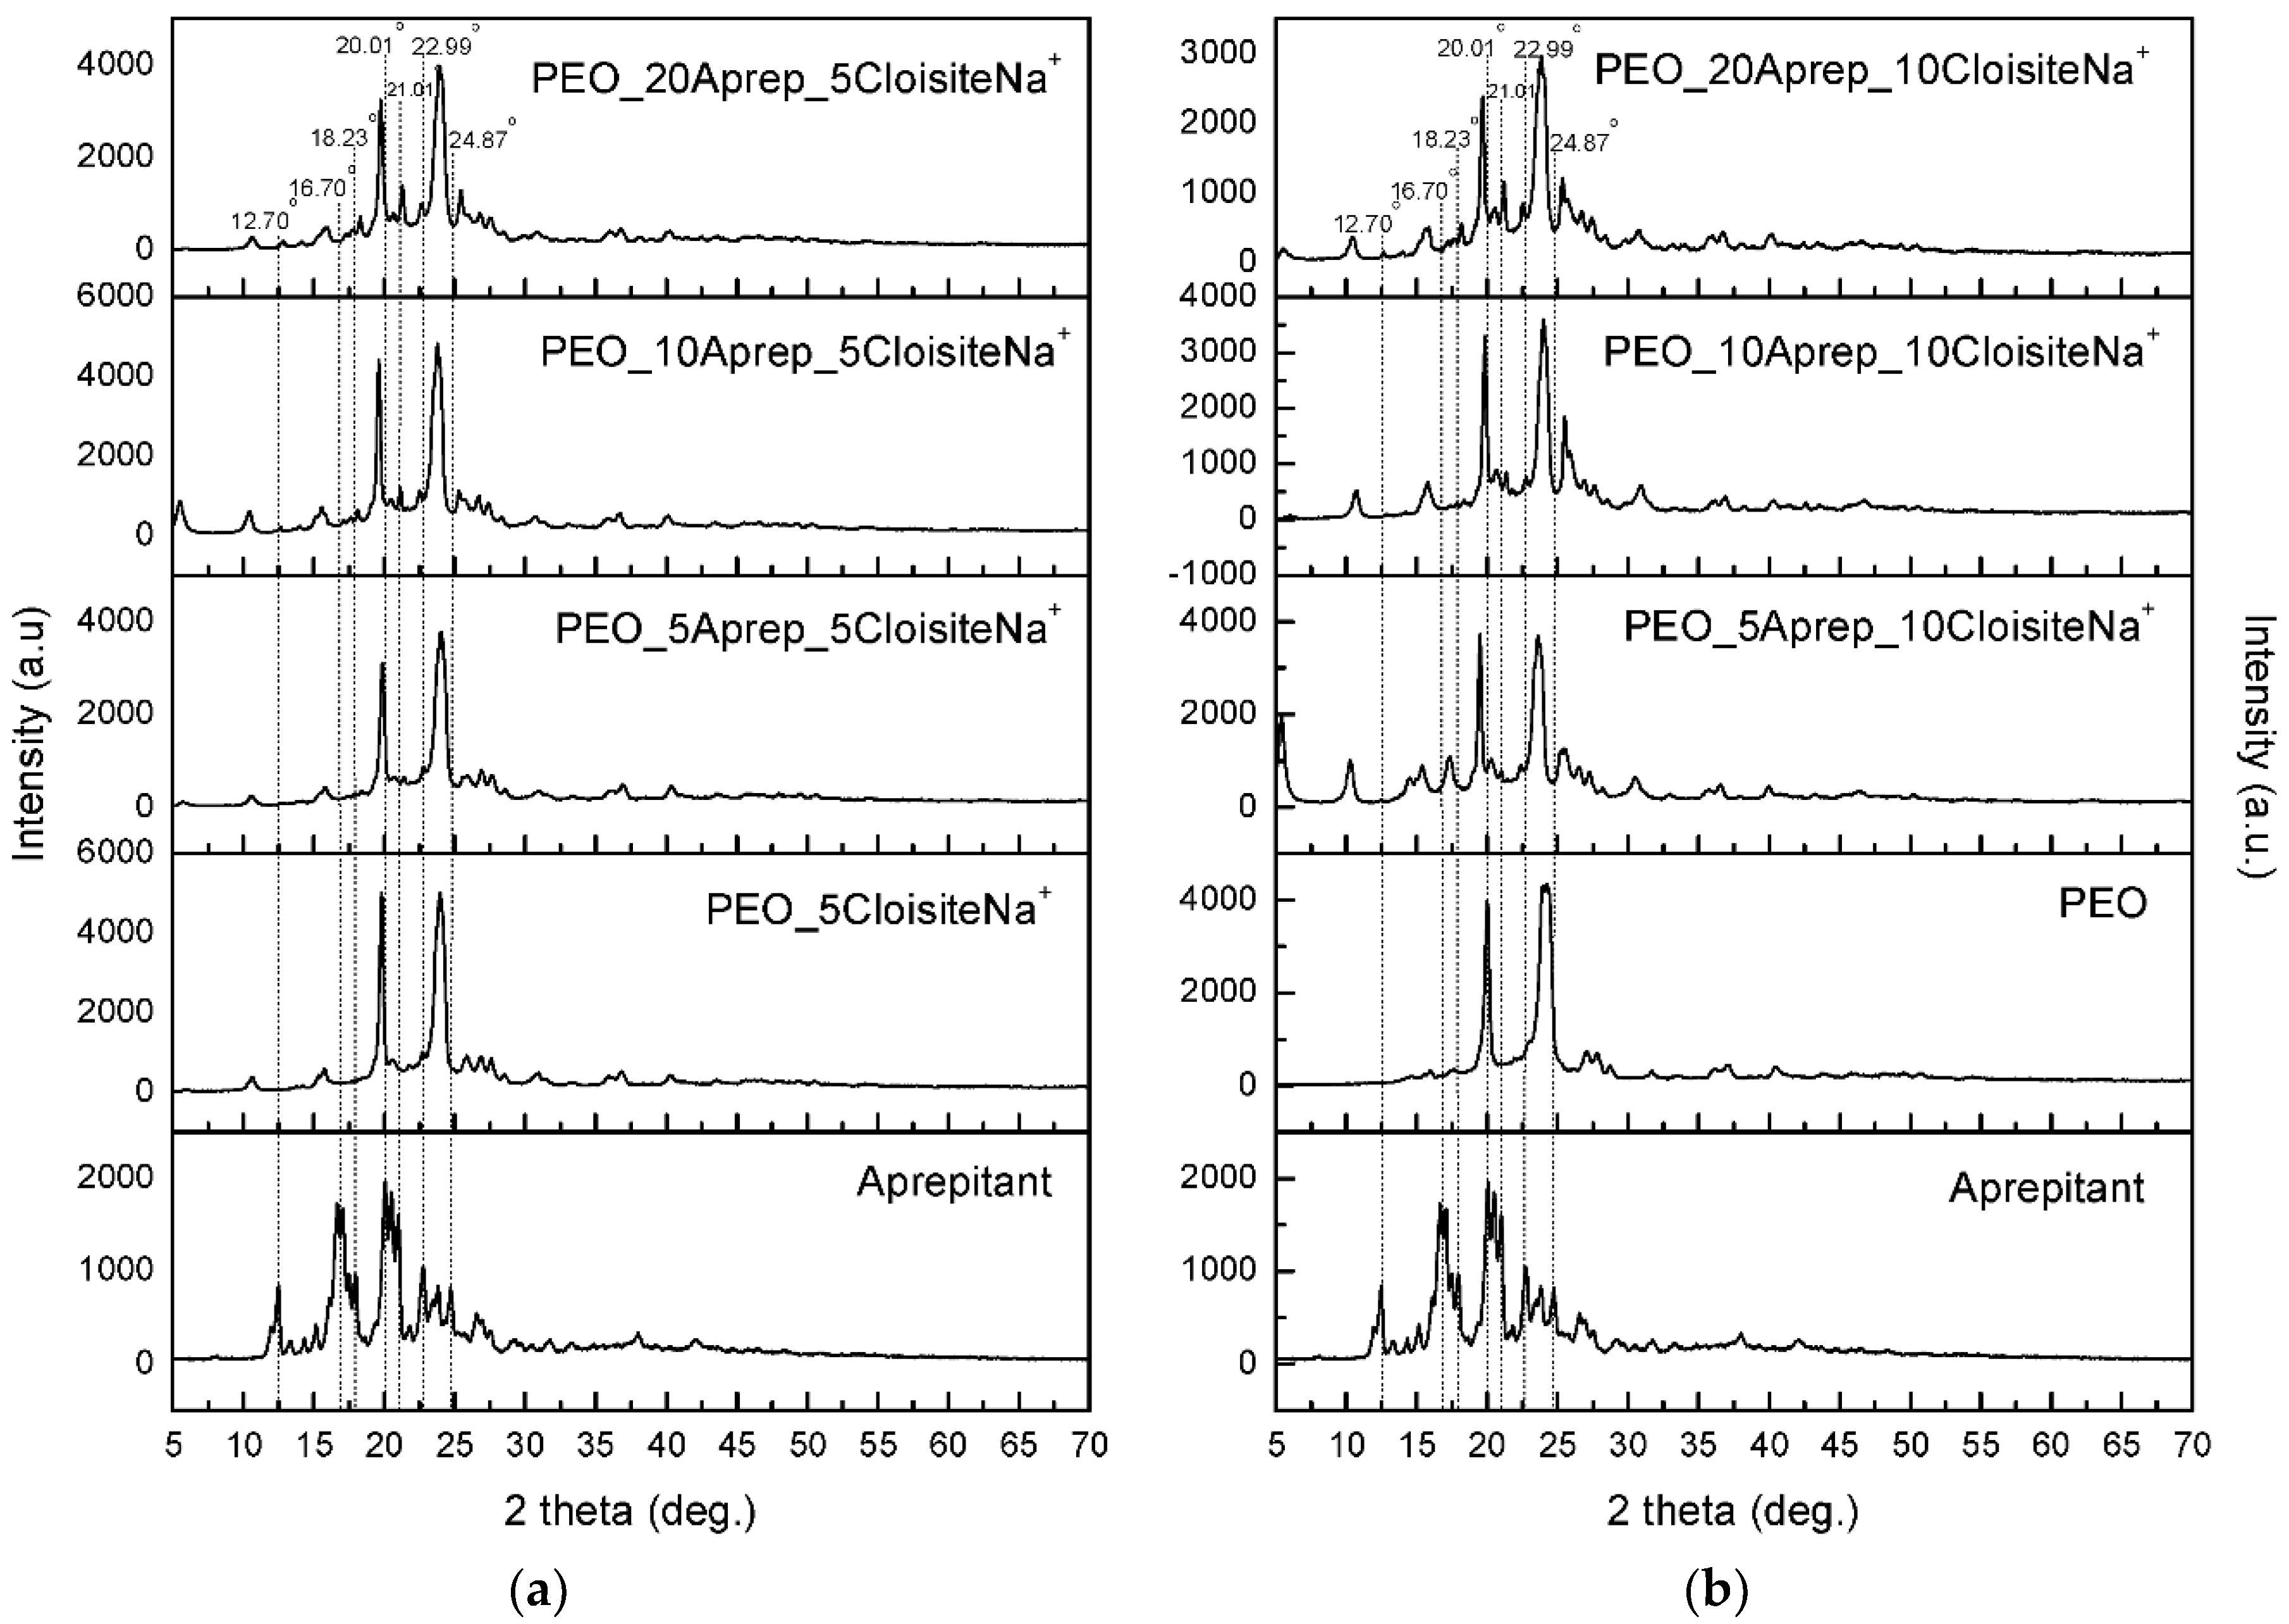
3.3. Characterization of Drug-Loaded PEO with 5 and 10 wt % Clay

The SEM images along with the EDX (Energy Dispersive X-ray) spectra of the APR/PEO/clay formulations are shown in Figure 9 and Figure 10. EDX analysis showed the copresence of both drug (element F) and clay (Al, Si, Na) in the point (microarea) analyzed, thus suggesting the good dispersion and interaction of both components within the PEO matrix.
The FTIR spectra of the APR-loaded PEO/clay nanocomposites are shown in Figure 11 and exhibit similar features to those of the APR/neat PEO spectra shown in Figure 7. More specifically, the peak at 1704 cm−1 verifies the presence and retention of the structure of APR in the PEO/clay nanocomposites, while the increase of the intensity of the peak at about 1100 cm−1 is attributed to the presence of Cloisite-Na+ clay, as also discussed above (Figure 3). Characteristic peaks of APR remained at the same positions, as in the case of neat drug, indicating that no interactions are taking place between the drug and the polymer matrix or clay.
The wide-angle XRD patterns of pure aprepitant and PEO, as well as of the PEO/clay nanocomposites and the drug-loaded nanocomposites, are shown in Figure 12. As in the case of the APR/neat PEO blends (Figure 7), the only clearly identifiable peak in the patterns of drug-loaded nanocomposites attributed to APR is the one at about 21.01°, being clearly shown only in the 10 and mainly in the 20 wt % loaded APR. This is an indication that the drug was dispersed in a crystalline state also in both formulations containing clays. However, these peaks, as in the case of PEO/APR solid dispersions, present with lower intensity, indicating a small reduction of its crystallinity. Comparing the formulations between 5 and 10 wt % clay, it can be seen that in the second case, the characteristic peak of APR may exhibit higher intensity, attributed to higher crystallinity of APR. This could be due to the different dispersion of clay inside the polymer matrix, which induces different degree of drug crystallinity. To confirm this, all XRD patterns have been recorded also in lower angles (2–10°) and are shown in Figure 13.
The patterns of the APR-loaded PEO/5 wt % clay nanocomposites do not exhibit the d001 reflection of the clay that is present in the PEO/clay nanocomposite without the drug at about 5.7° due to the intercalation of the PEO chains, as discussed above (Figure 4). The absence of this reflection implies a highly intercalated or exfoliated clay nanolayer structure within the PEO being induced by the presence of APR. On the other hand, in the patterns of the PEO/10 wt % clay nanocomposites loaded with APR, the d001 reflection of the clay that appears at about 5.36° (d001 = 16.5 Å) is partially intercalated compared to the parent Cloisite-Na+ clay (d001= 11.7 Å), but not as highly intercalated/exfoliated as in the case of PEO/5 wt % clay nanocomposites loaded with APR. This could justify the different crystallinity of the APR drug in PEO/clay/APR formulations containing different clay contents (5 and 10 wt %).
The DSC curves (Figure 14) of the APR-loaded PEO/clay nanocomposites exhibit similar characteristics (Tm and ΔΗ) with those of the PEO/clay nanocomposites without the drug (Figure 5) in terms of the properties of PEO, that is, slightly decreased Tm and ΔH of fusion. In addition, the peak due to the melting of the drug is not present in the case of the APR/neat PEO blends (Figure 8), due to its lower degree of crystallinity or due to its dissolution inside the melt of PEO during heating.

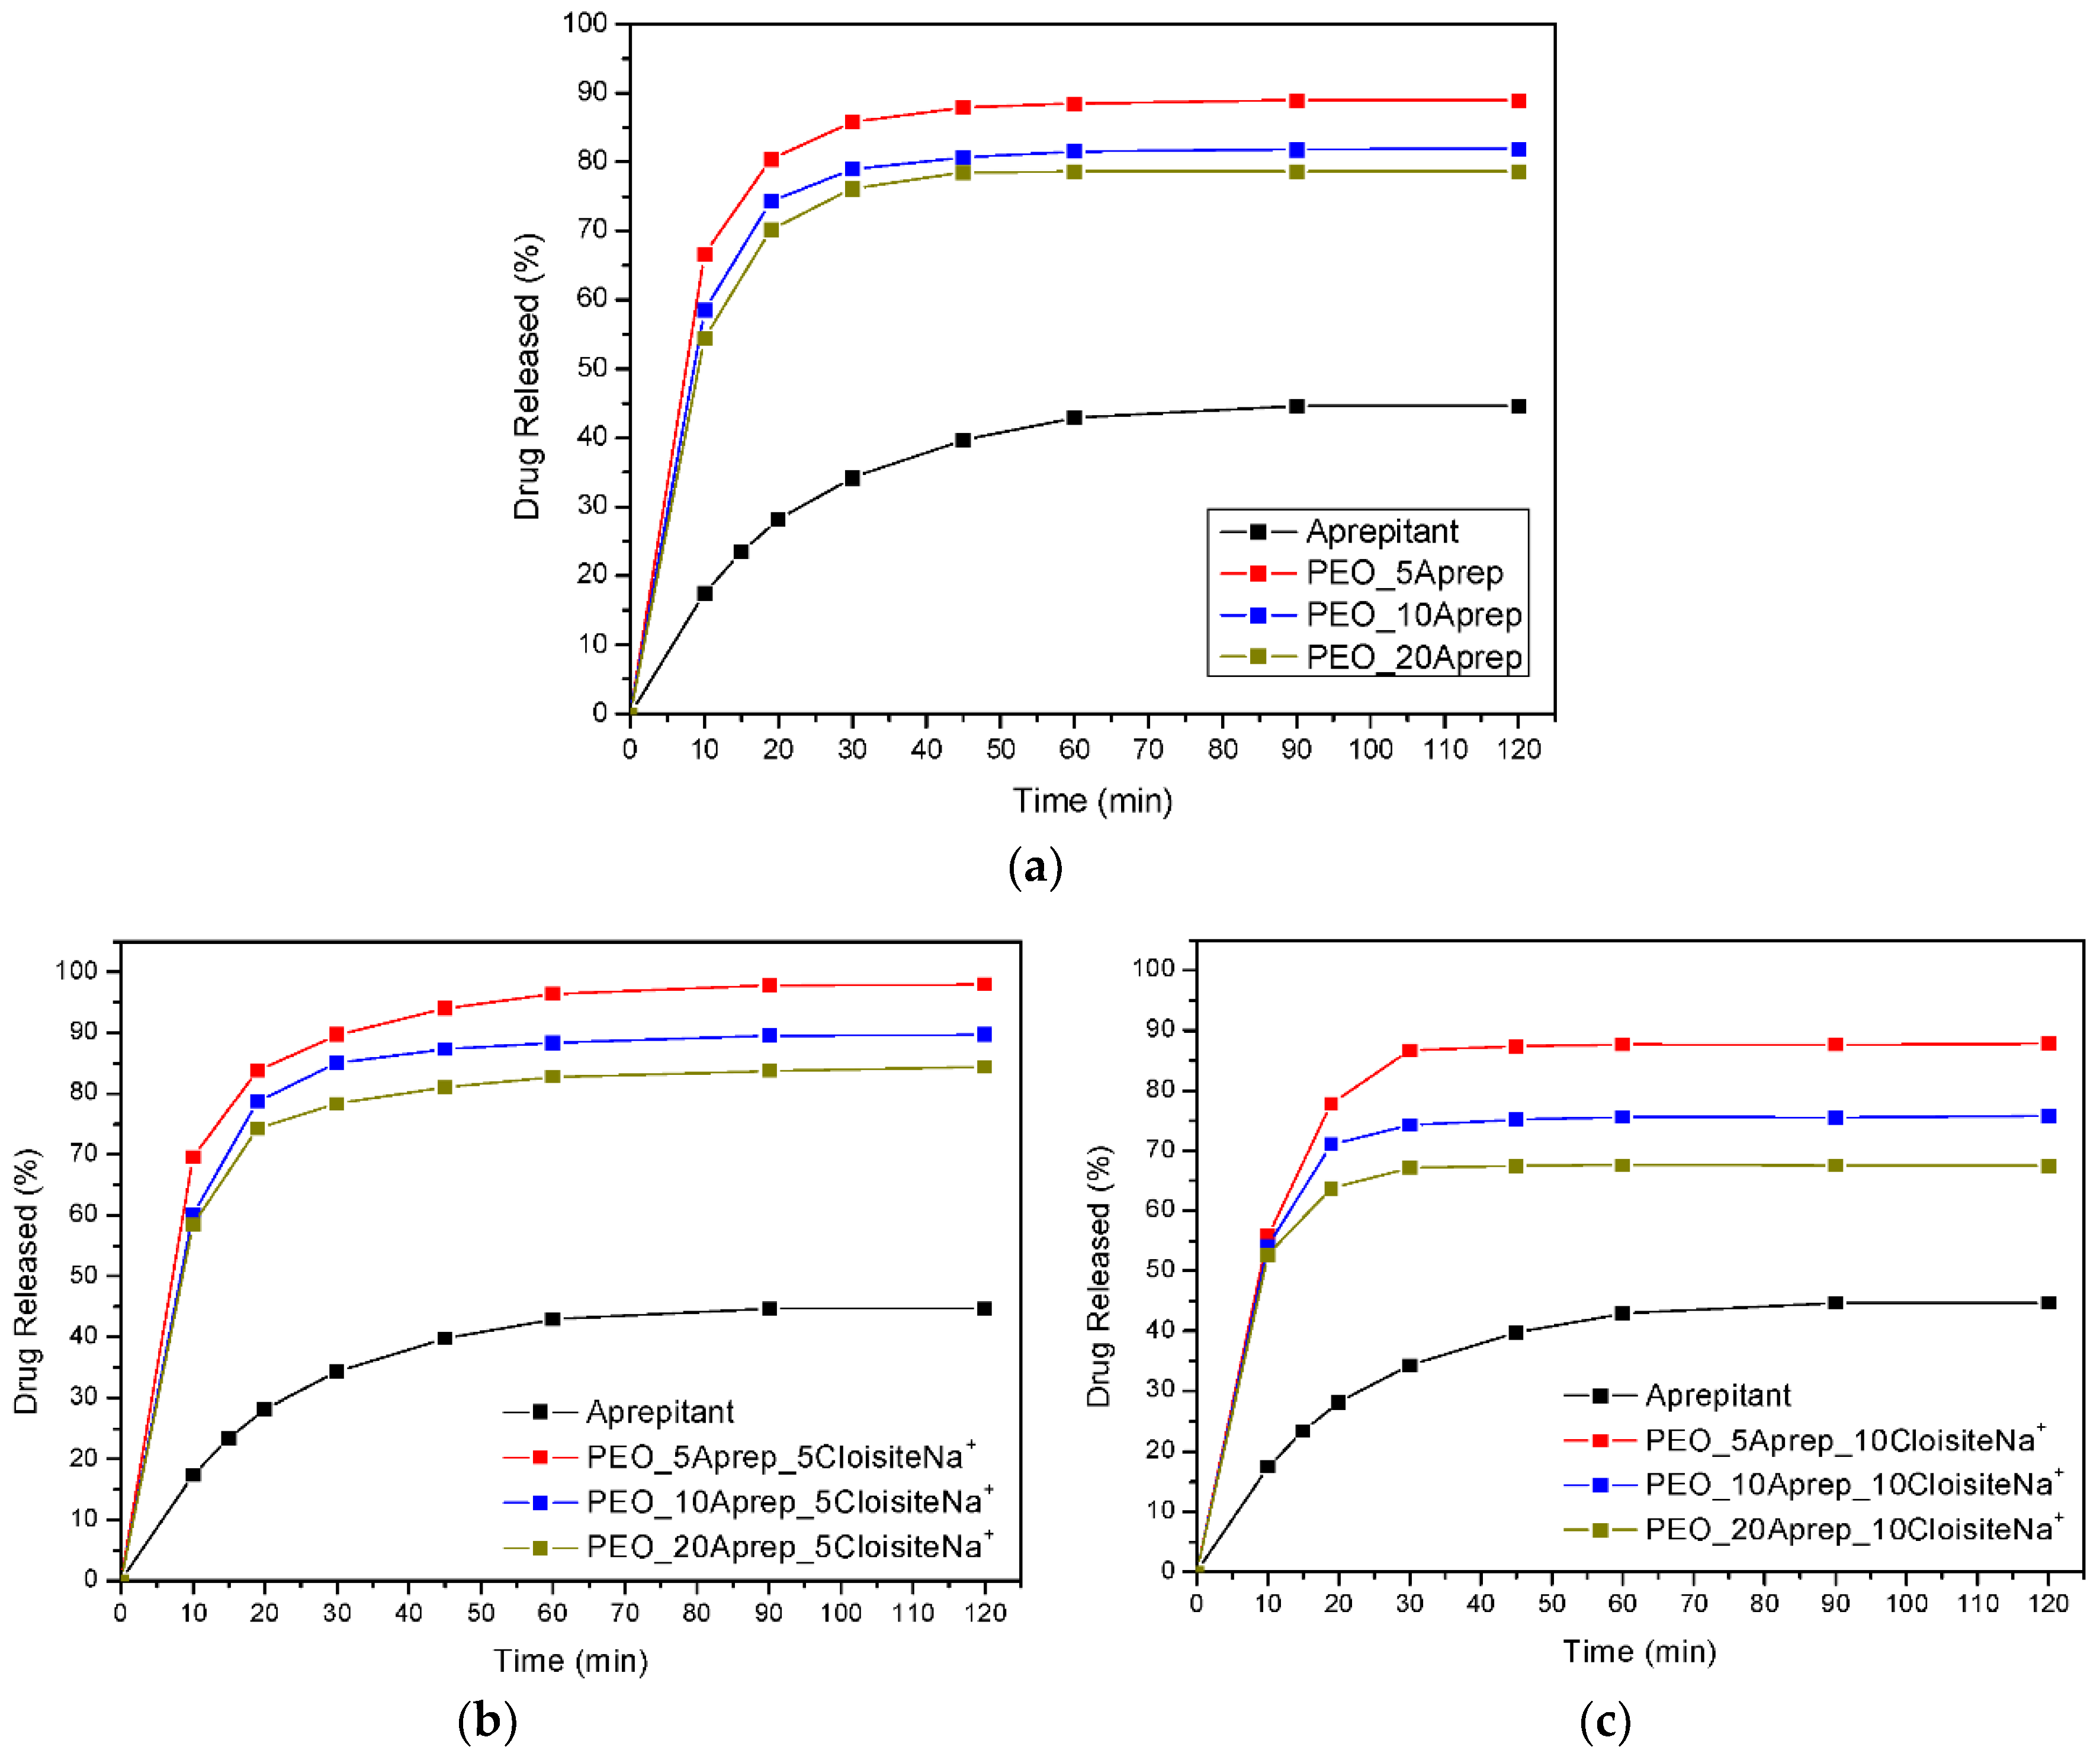
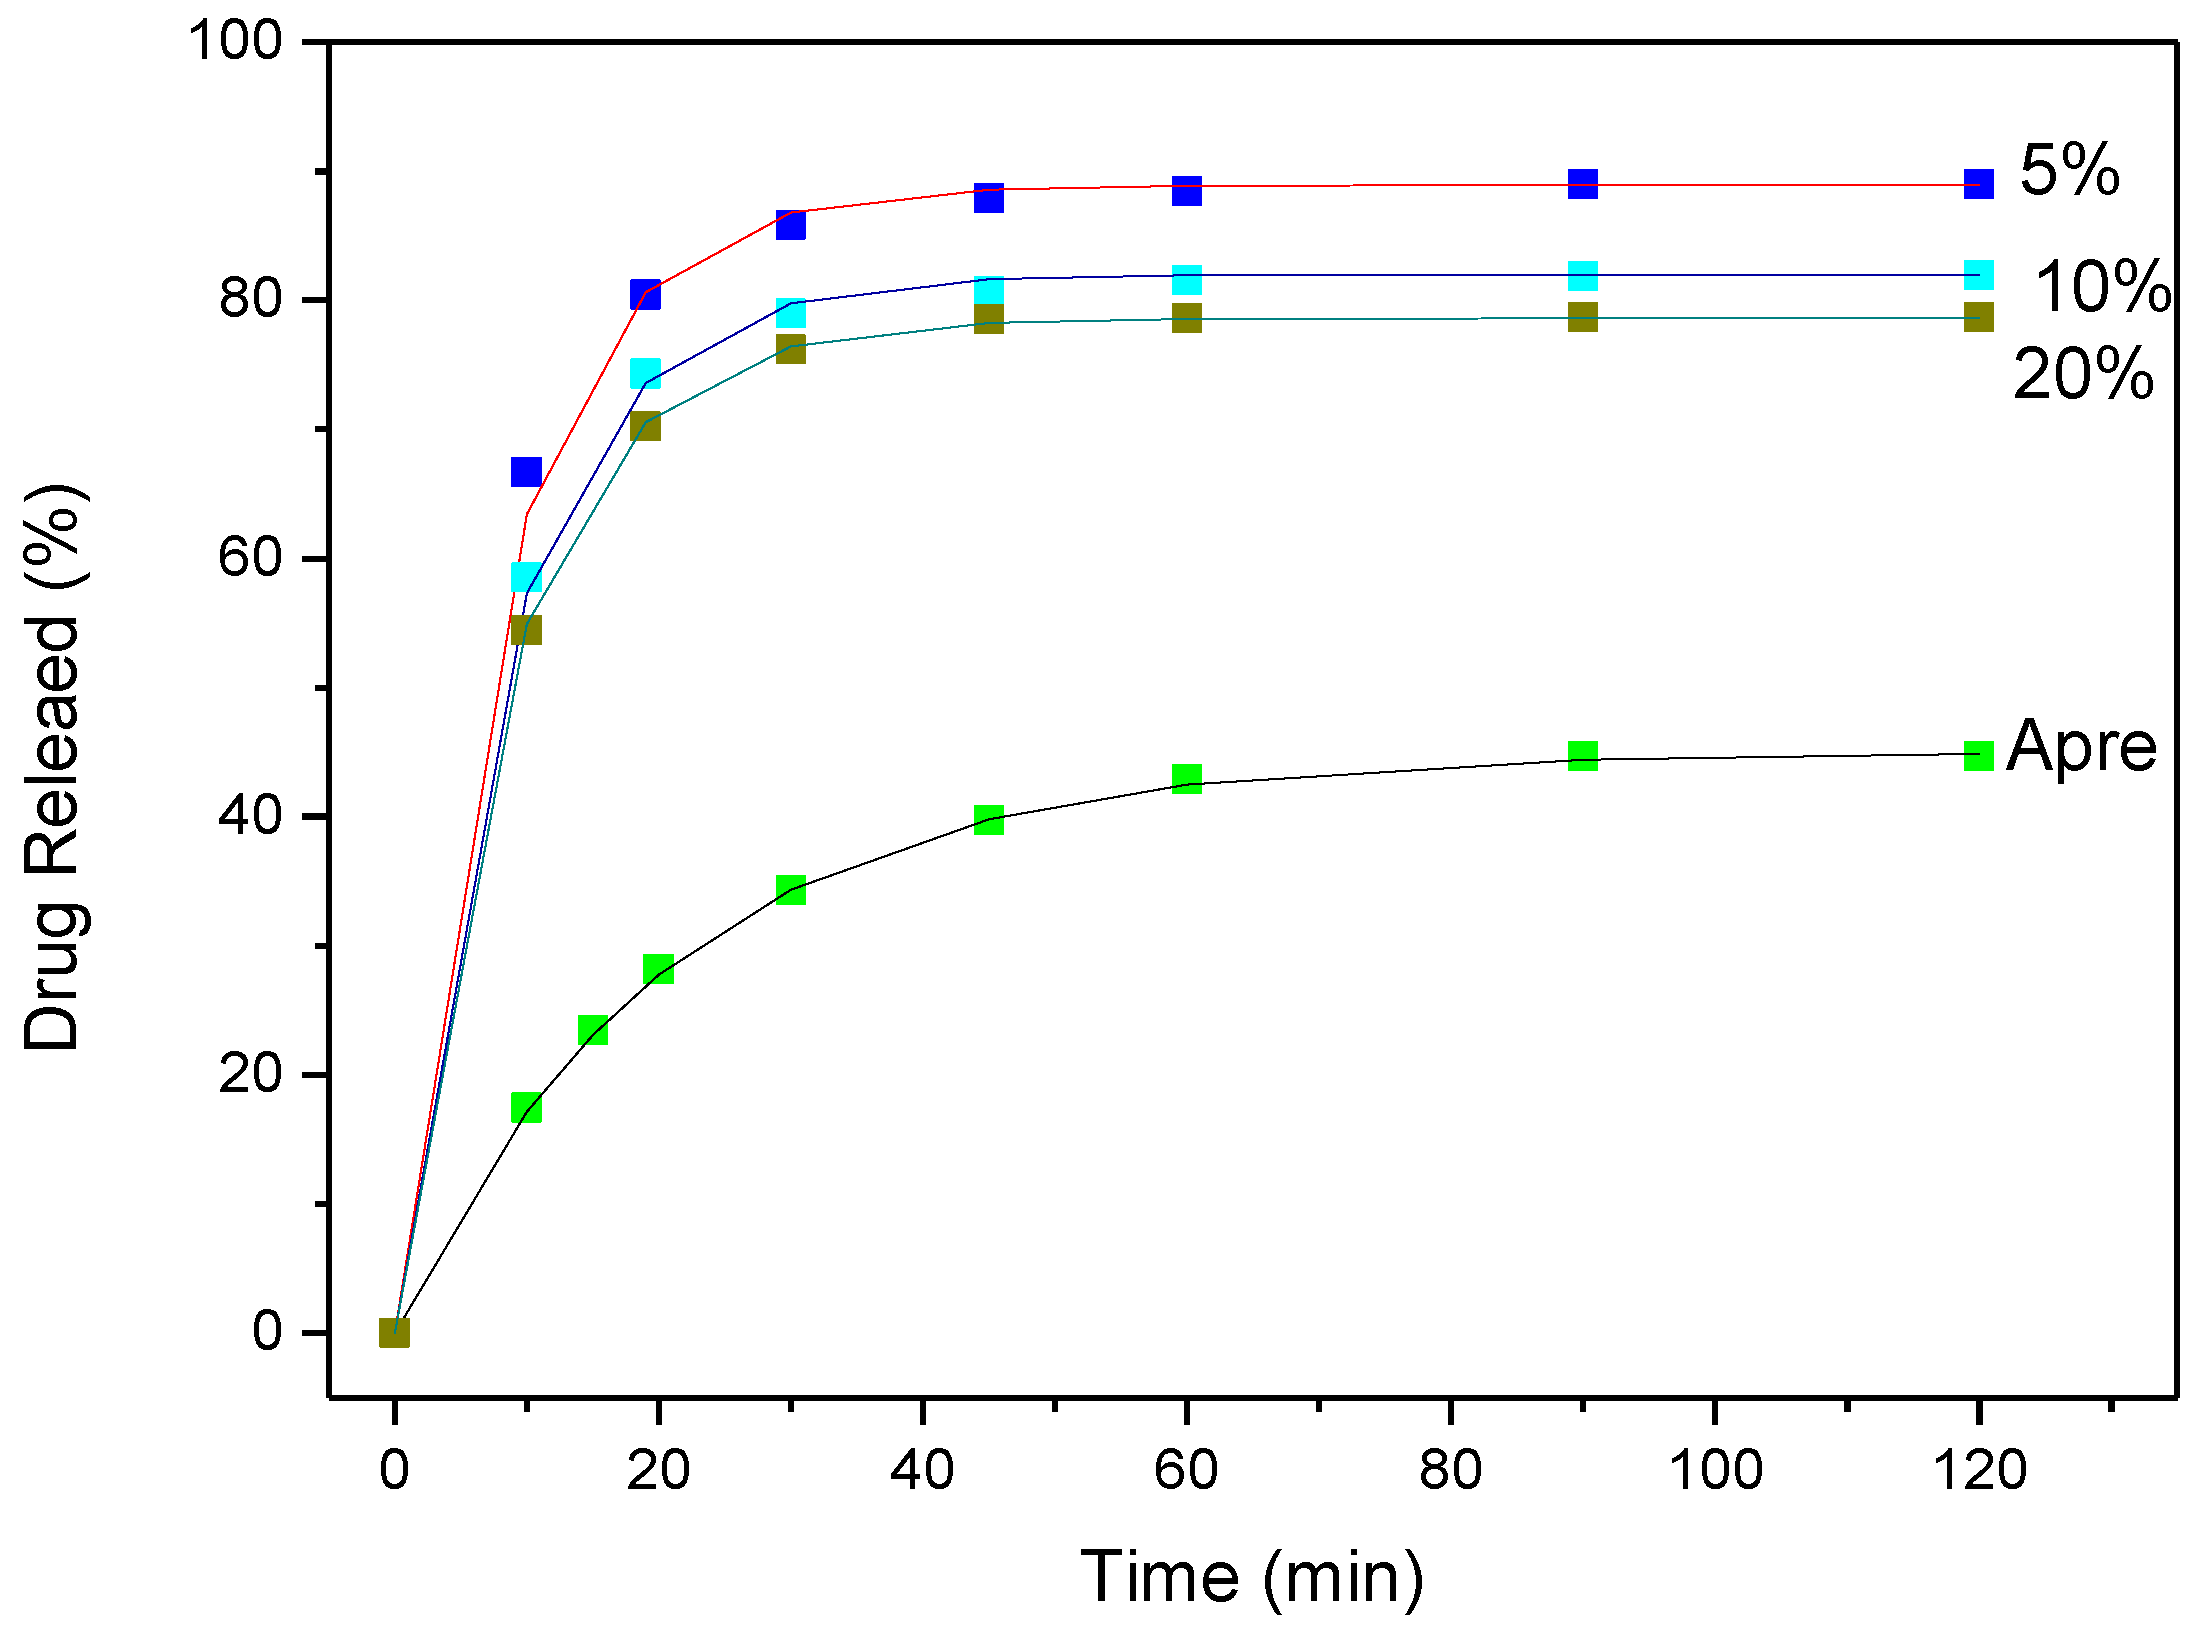
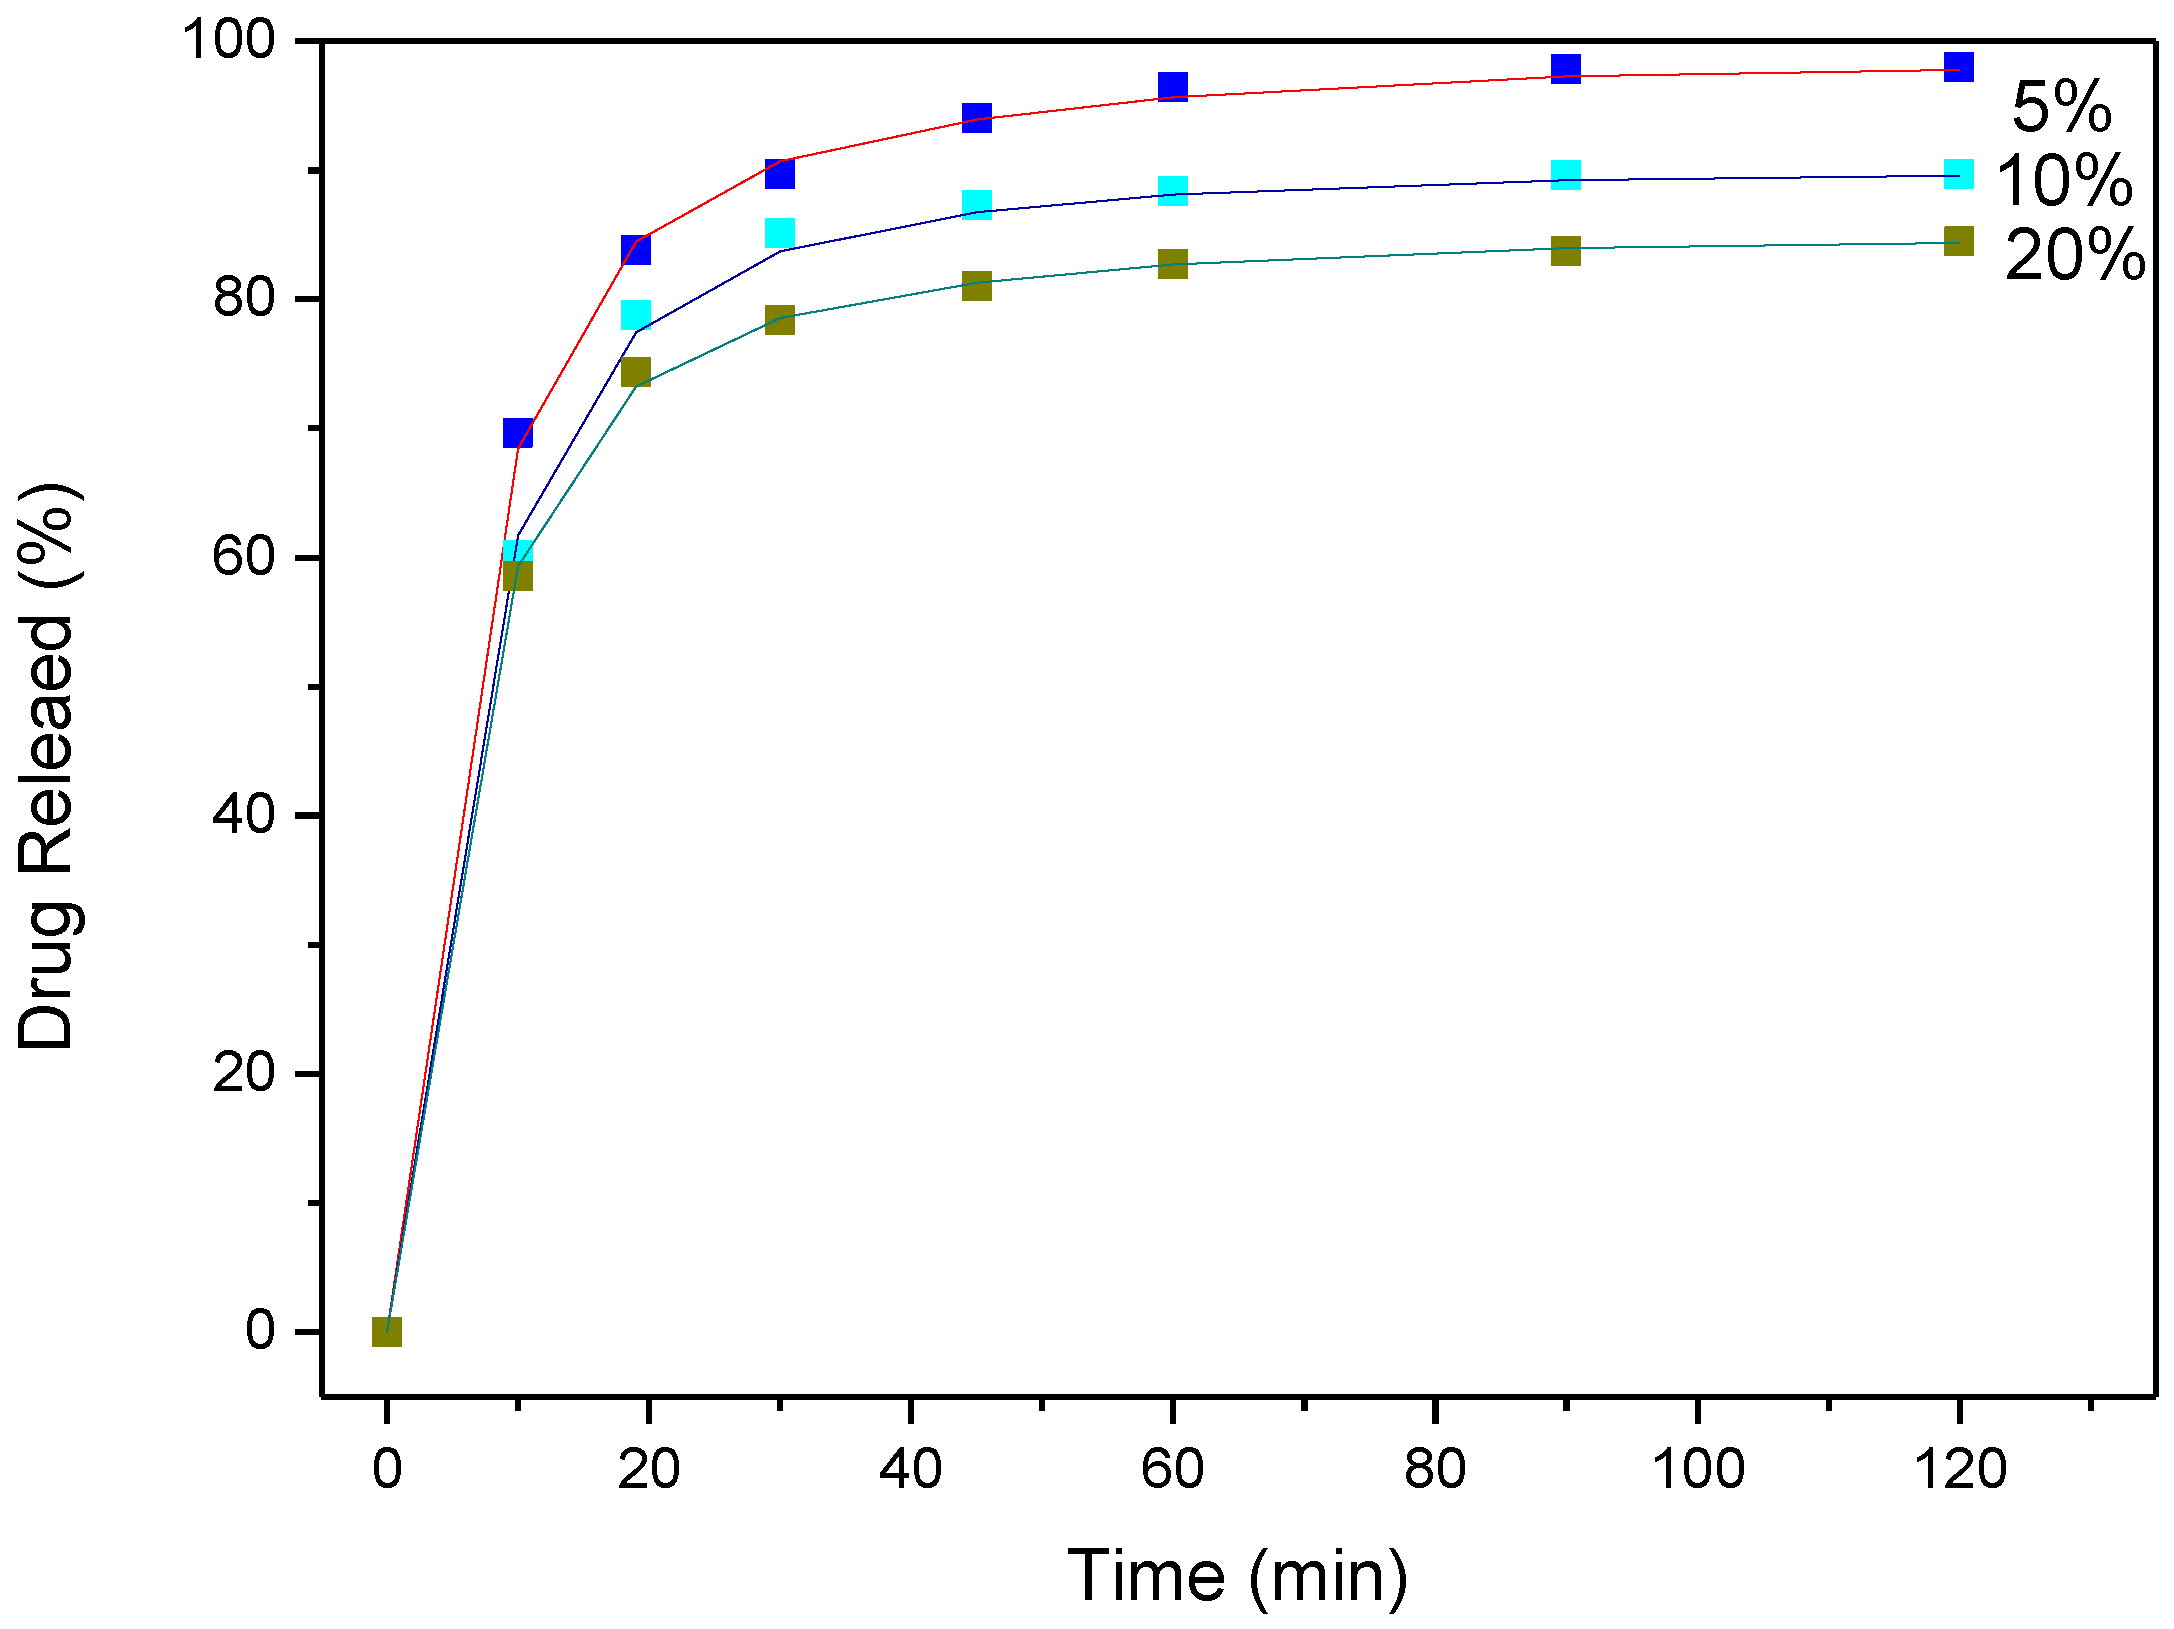
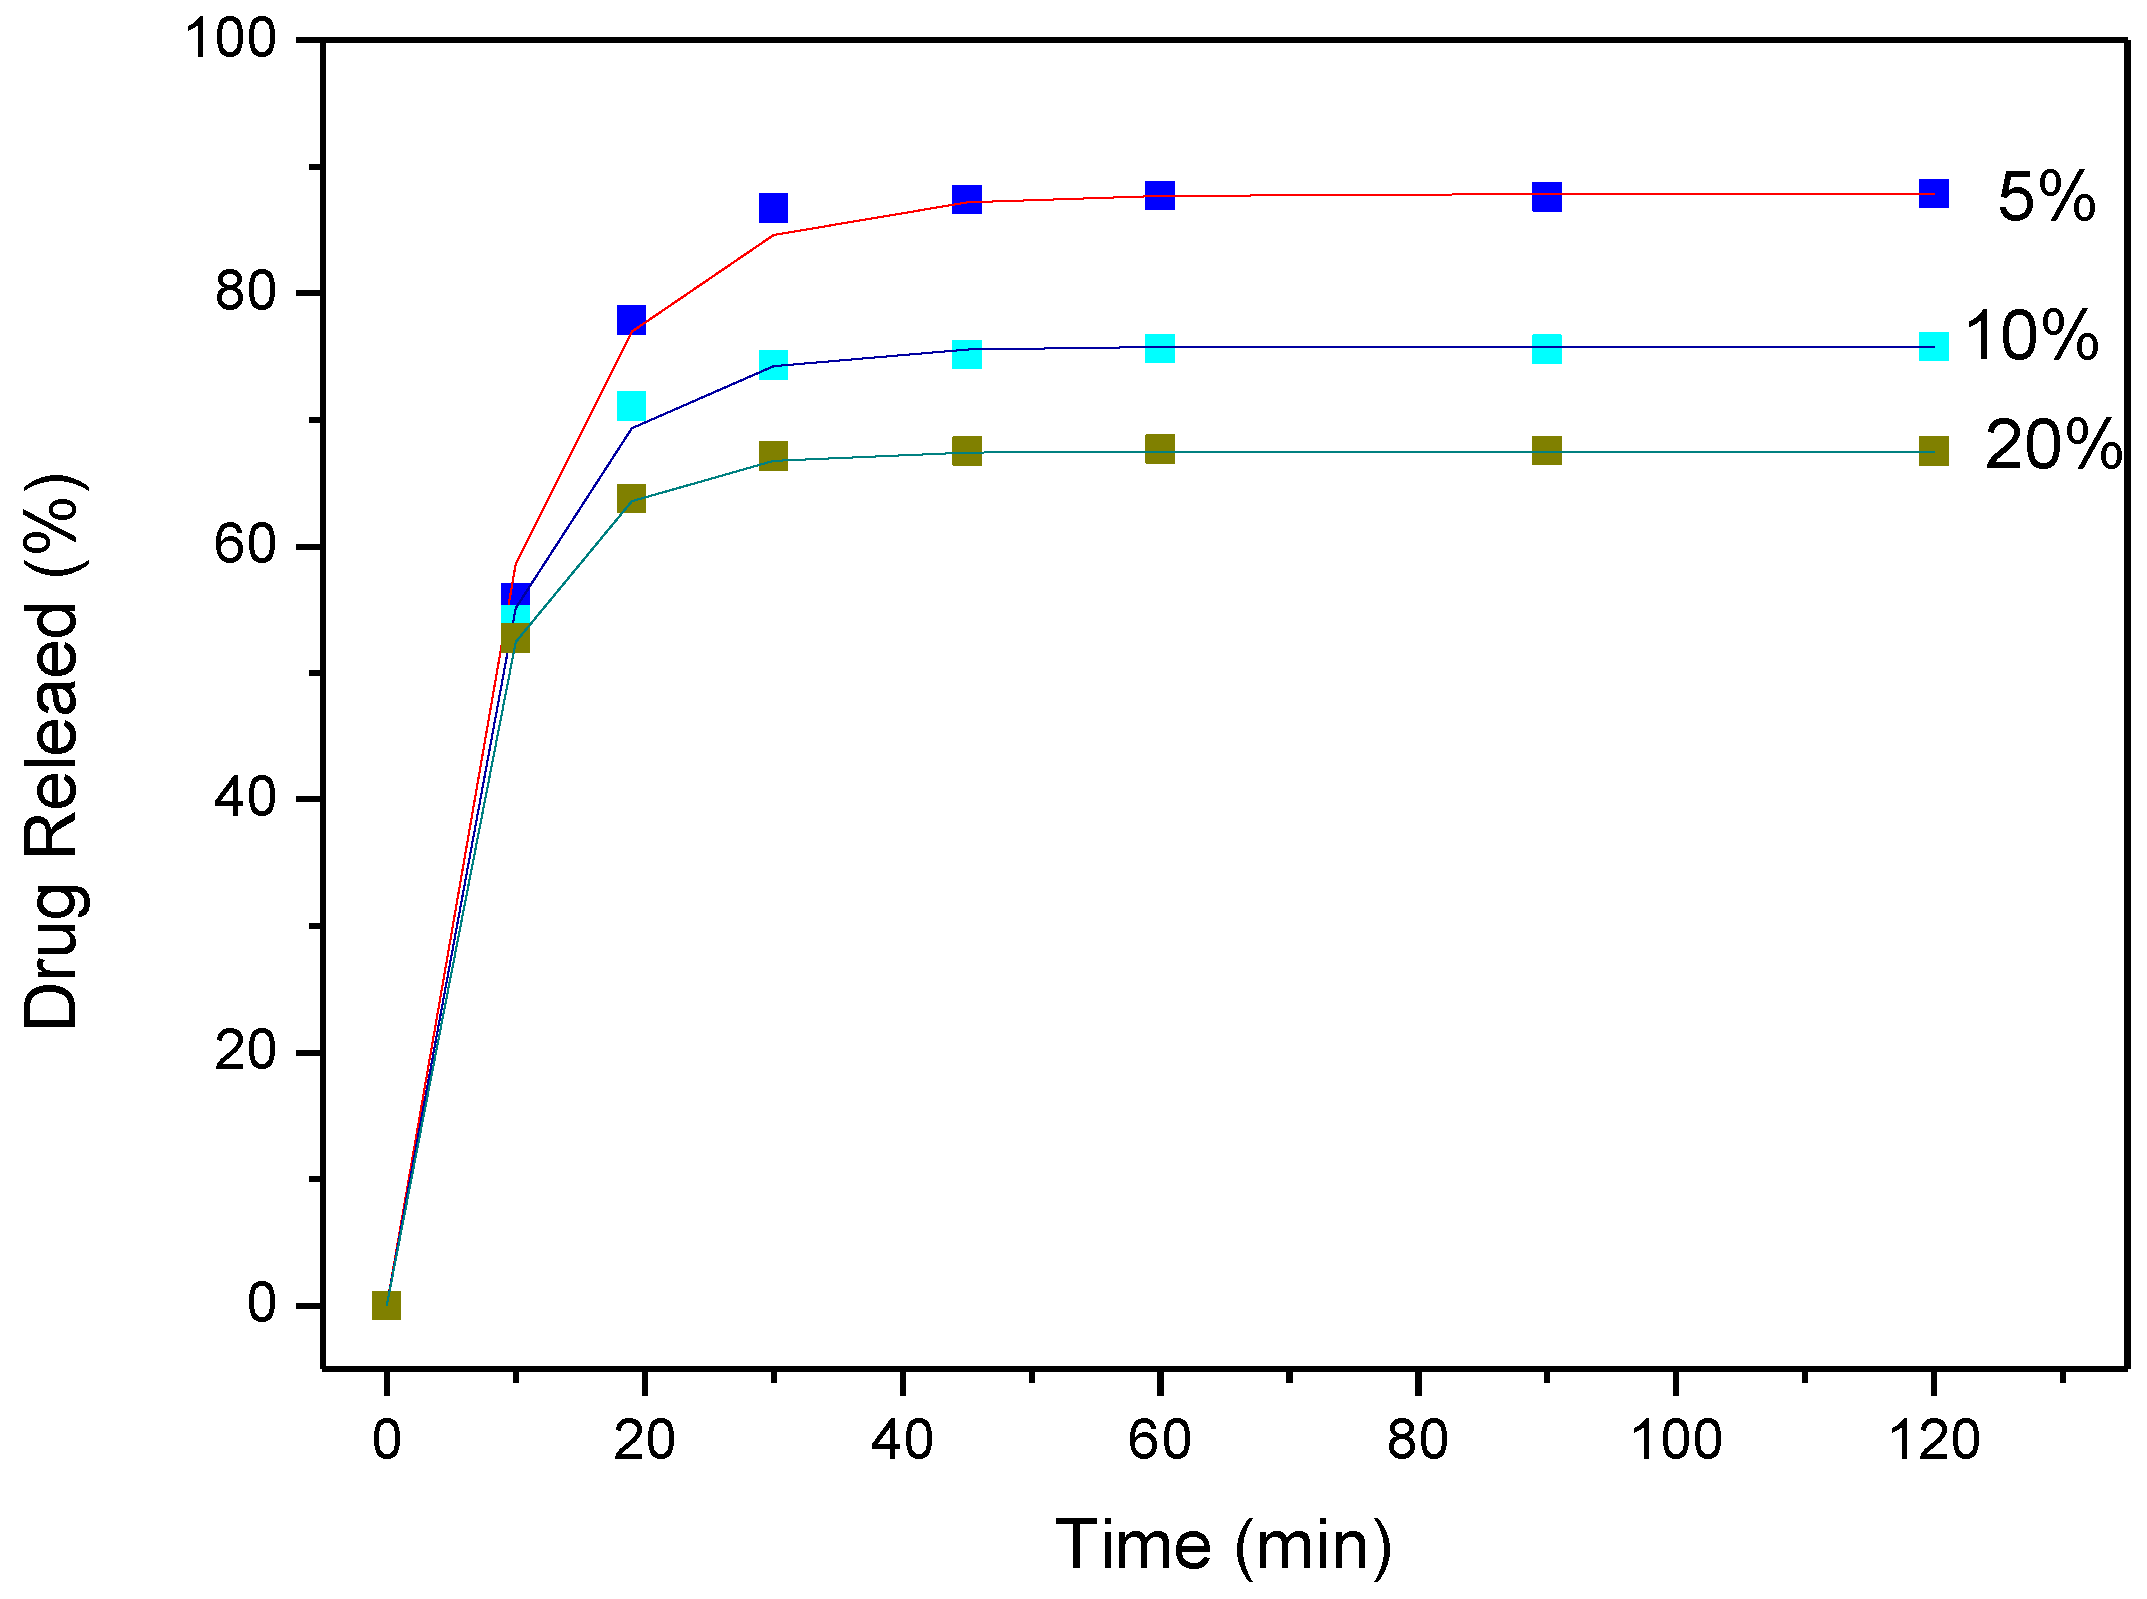
3.4. Drug (APR) Dissolution Study

The dissolution study of aprepitant (APR) was performed in all the above prepared and characterized APR/PEO and APR/PEO/clay nanocomposite samples. The dissolution profiles of pure APR and APR/PEO melt-mixed formulations without the addition of the clay are shown in Figure 15. APR reached a dissolution percentage of about 15% in the first 10 min, while after that time, the dissolution degree continued to increase with reduced rate and reached a value of approximately 40% at 60 min, without any other change thereafter. This was due to the crystalline structure of the drug, which reduced its solubility. All the APR/PEO formulations showed increased values in the first 10 min compared to that of the neat APR, with percentages reaching approximately 55–65%. After that time, the drug dissolution continued to increase, while the dissolution reached its maximum on the 30 min time mark, with values ranged between 75 and 90%. As can be seen, the drug release is directly dependent on the drug amount. The PEO/APR formulation with 5 wt % drug had the highest rate, that in fact decreased by increasing its amount in solid dispersion. Thus, the formulation with 20 wt % APR exhibits the lowest release from all formulations, which is ca. 75% after 60 min. It seems that PEO has succeeded to increase the initial release of the drug, leading to an immediate release profile followed by a sustained release till t = 60 min. The release rate decreased by increasing the drug amount, due to the different degree of crystallinity of the drug in the solid dispersions. In the formulation containing 5 wt % APR, the whole amount, as was found from XRD, was almost in an amorphous state. Thus, the release rate was the highest, since it is well known that amorphous drugs have up to 1000 times higher solubility than crystalline forms [41,42]. As the drug amount increased in the formulations, a higher drug amount existed in a crystalline form, and thus the maximum release rate decreased gradually from 10 to 20 wt % APR.
The drug dissolution profiles of the APR/PEO formulations also containing 5 and 10 wt % clay are shown in Figure 15b,c, respectively. The incorporation of 5 wt % clay in the formulations seems to increase the drug release of net APR at values slightly higher compared to the formulations without clay; that is, 55–70% in the first 10 min. The main difference is that the presence of clay induces further dissolution enhancement of APR, which reached a release of approximately 98% after 60–120 min. This also happens in the other formulations containing 10 and 20 wt % APR, with maximum drug release of about 85 and 76%, respectively. Hence, the combination of 5 wt % clay and 5 wt % APR showed higher release rates compared to the neat drug as well as to the formulation without the clay. Based on the above results, it seems that the highly intercalated/exfoliated clay nanolayers present in the APR/PEO/5 wt % clay formulation (Figure XRD data in Figure 13) provide a high external surface for interaction with the drug and thus higher amorphisation. However, these effects depend also on the drug loading, even though in all formulations, the drug release is enhanced compared to the PEO/APR formulations, while 5–10 wt % APR loading appears to be the most appropriate range.
For APR/PEO/clay formulations with 10 wt % clay (Figure 15c), different observations were made. It can be seen that even though enhanced release rates are recorded compared to the neat drug, they are slightly slower compared not only to the APR/PEO/5 wt % clay, but also to the APR/PEO formulations. The maximum release from the 5 wt % APR formulation was about 87% after 60–120 min, and reduced to approximately 75 and 67% for formulations with 10 and 20 wt % APR, respectively. Taking into consideration the relatively limited intercalation of the clay nanolayers in the APR/PEO/10 wt % clay formulations (XRD data in Figure 13), it can be suggested that the improved dissolution profiles of APR from PEO/clay formulations requires both increased dispersion of the clay nanolayers in the PEO matrix and the appropriate balance between clay and drug loading. Further studies on improving the dispersion/intercalation of the APR/PEO/10 wt % clay formulations with more intensive melt-mixing process parameters or by using organo-modified clay are underway. Also, it seems that such high clay content also acts as a barrier layer to drug diffusion from the polymer matrix or increases the drug crystallinity, both of which lead to lower APR solubility.

3.5. Analysis and Discussion of Release Results

An attempt to quantify the drug release curves and to associate them with the dominant physical mechanisms will be presented here. Let us start from the simplest case, which is the direct release of the drug. The process in this case can be characterized as dissolution. The final concentration of the aprepitant is simply its solubility in the liquid Ceq. The drug concentration evolution can be described from the solution of the following simple conservation equation for the drug concentration in liquid:
V dC dt = AK ( C C eq )
where V is the volume of the fluid, A the sample–fluid interfacial area, and K the overall dissolution rate constant. In general, the dissolution is a two-step process: the first step is the removal of the drug from the solid to the dissolved state, and the second the mass transfer from the solid–liquid interface to the bulk liquid. In principle, the constant K is related to the partial dissolution rate constant k and to the mass transfer coefficient h as K = 1/(1/k + 1/h). However, it is not possible to assess experimentally the relative contributions of mass transfer and dissolution on the release rate. Considering the experimental characteristic release time of thirty minutes and the high mixing rate employed (100 rpm), it can be argued that the dominant step is the dissolution, so K coincides to k. Assuming the initial condition C = 0, the above equation can be integrated to give:
C = C eq ( 1 exp ( Ak V t ) )
The fractional release curve can simply be computed by the ratio CV/m, where m is the mass of the drug, which is the same for all experiments performed in the present work. The above equation is fitted to the experimental data and leads to the following parameter value: AK/V = 8 × 10⁻⁴ s−1.
The next system to analyze is the PEO–drug system. In general, PEO undergoes swelling and erosion (dissolution) in the liquid phase. The relative rate of the two processes depends on the PEO chain length (i.e., on the molecular weight of the PEO). In particular, large chains inhibit the erosion of the polymer matrix, so considerable swelling occurs prior to erosion. The behavior of PEO influences the release profile of the drug. In the case of erosion domination, the drug is released from the eroded matrix, so a zero-order release kinetic profile is expected. In the case of swelling domination, the drug has to diffuse through the gel layer created by polymer swelling, so the undergoing release mechanism is diffusion, which can be described (employing an approximating technique like the linear driving force formula [69]) as a first-order process. The experimental release data for the PEO–aprepitant system are fitted using both zero- and first-order kinetic models, and it was found that the first-order model can perfectly characterize the data. This means that swelling dominates erosion, which is quite compatible to the high-molecular-weight (2 × 10⁶) of the PEO of the present work [70,71]. The integrated first-order equation for evolution of drug concentration is given as C = CF(1 − exp(−KDt)), where CF is the final drug concentration in the liquid and KD is the first-order rate coefficient, which is related to the drug diffusivity in a gel slab of thickness L as KD = 3D/L2. The comparison between the experimental and model release curves are shown in Figure 16. It appears that the kinetic constant does not depend on the drug content in the PEO matrix and it takes the value KD = 2 × 10⁻³ s−1.
The next step is the system modeling in the presence of clay. A first attempt is to try a first-order kinetic model (diffusion through swollen gel layer), found to work in the absence of clay. The fitting procedure was fairly successful (deviation smaller than 2% from the experimental data points) for the case of 10 wt % clay. The comparison between experimental data and model curves is shown in Figure 17. The small nonsystematic deviation between the model and data may be due to experimental uncertainties and it clearly suggests that it is worthless to seek for a more elaborate model. The coefficient KD found from fitting of the experimental curves appears to depend on the drug content (unlike in the case without clay). The values found are KD = 1.83 × 10⁻³ s−1, 2.17 × 10⁻³ s−1, and 2.5 × 10⁻³ s−1 for drug contents of 5 wt %, 10 wt %, and 20 wt % respectively. So, it appears that the ratio of clay to drug content has an effect on the diffusion kinetics of drug in the gel.
The release curves for the case of 5 wt % clay content in PEO matrix cannot be described by the first-order kinetic model. The deviation between the data and model is systematic, suggesting that there is a second release characteristic time which is much smaller than the primary one, which corresponds to molecular diffusion through the gel. An amount of drug is released by diffusion and another amount by combination of diffusion and dissolution in bulk liquid steps. So, a physically reasonable model which can describe the data must be developed. This physical model is the following: A fraction (1 − f) of the drug amenable to dissolution is in molecular form and a fraction f is in solid form (i.e., nanometer size particles). Both types of drug diffuse through the gel layer and reach the bulk liquid. Then, in the bulk liquid, the second fraction (solid particles) undergoes a slow dissolution process (similar to that of solid drug shown in Figure 16). The mathematical model describing the above scenario is:
d C 1 dt = K D ( ( 1 f ) C F C 1 )
d X 1 dt = K Ds X 1
d X 2 dt = K Ds X 1 k s X 2
where X1 is the weight fraction of solid (amenable to dissolution) drug in the matrix and X2 is the fraction of solid drug located in the bulk liquid. The rate coefficient KDS corresponds to the diffusion of the solid particles through the gel layer and the rate coefficient k to particle dissolution. The bulk drug concentration can be found as:
C = C1 + fCF(1 − X1 − X2). The systems of the equation with initial conditions C1 = 0, X1 = 1, X2 = 0 is solved analytically to give:
C = ( 1 f ) C F ( 1 exp ( K D t ) ) + f C F ( 1 exp ( K Ds t ) K DS k s K DS ( exp ( K Ds t ) exp ( k s t ) ) )
The above equation must be fitted to the experimental data by appropriate choice of KD, KDs, ks, and f. A very good fitting was achieved by considering a single set of parameters (assuming drug content-independent parameter values). The comparison between the data and model curves is shown in Figure 18. The fitting parameters are f = 0.11 (i.e., 11% of the finally dissolved drug is initially in solid form), KD = 2.5 × 10⁻³ s−1 (diffusion through gel layers is somewhat faster than in the absence of clay), KDS = 0.82 × 10⁻³ s−1 (i.e., diffusion of particles is much slower than the diffusion of molecular drug), and ks = 0.8 × 10⁻³ s−1. The rate constants found are compatible with the physics of the problem. The fact that the solid dissolution rate constant is the same with the one found before for the pure drug supports the physical validity of the model.
The total fraction of released drug is computed as CFV/m. The rest of the drug is in a crystallized insoluble form (fraction φ). The value of φ is 0.11, 0.18, and 0.214 for drug content 5%, 10%, and 20% without clay, respectively; 0.121, 0.242, and 0.325 for drug content 5 wt %, 10 wt %, and 20 wt % with 10 wt % clay, respectively; 0.02, 0.103, and 0.156 for drug content 5 wt %, 10 wt %, and 20 wt % with 5 wt % clay, respectively. The insoluble fraction increases with drug content, but shows a nonmonotonic behavior with clay content, indicating the complexity of drug–clay interaction.

4. Conclusions

Aprepitant (APR)-loaded PEO and PEO/clay nanocomposite solid dispersions were successfully prepared by melt mixing in order to investigate the effect of polymer and clay on the dissolution enhancement of the drug. SEM images verified the good dispersion of the clay and APR into PEO. Even though, as was found from FTIR studies, there are no interactions between PEO or clay and drug, APR in its 5 wt % concentrations may be dispersed in an amorphous phase. In concentrations of APR 10 and 20 wt %, the drug showed a reduced crystallinity concerning the neat APR. Due to this, the APR/PEO formulations induced a slightly higher drug release in the first 10 min compared to the neat drug, as well as significantly higher maximum dissolution percentages after 60–120 min, reaching about 90%. The addition of 5 wt % Cloisite-Na+ clay in the APR/PEO formulations led to substantial improvement of the APR dissolution profile, reaching a very high maximum dissolution of about 98% for drug content 5 wt %. Higher content of clay (ca. 10 wt %) resulted in poorer drug release profiles, owing mostly to the limited intercalation of the clay nanolayers compared to the 5 wt % clay formulations, where highly intercalated/exfoliated structures where achieved. A comprehensive analysis of the release kinetic data revealed that the dominant release mechanism is the diffusion through the swollen polymer and erosion for the case of 0 wt % and 10 wt % clay. The release mechanism in the case of 5 wt % clay is more complex. An amount of drug is released by diffusion and another amount by combination of diffusion and dissolution in bulk liquid steps. These results prove the effectiveness of PEO/clay nanocomposites as drug carriers for sustained release.

Author Contributions

D.B., K.T, A.A., C.P., S.N, and D.G. conceived and designed the experiments; C.P., S.N, and D.G. performed the experiments; M.K. performed the model analysis, D.B., K.T., A.A., C.P., S.N, and D.G. analyzed the data; D.B. and K.T. contributed reagents/materials/analysis tools; D.B., K.T., A.A., C.P., S.N, and D.G. wrote the paper.

Conflicts of Interest

The authors declare no conflict of interest.

References

  1. Blumstein, A. Polymerization of adsorbed monolayers. Ii. Thermal degradation of the inserted polymer. J. Polym. Sci. Part A Gen. Pap. 1965, 3, 2665–2672. [Google Scholar] [CrossRef]
  2. Theng, B.K.G. Formation and Properties of Clay-Polymer Complexes; Elsevier: New York, NY, USA, 2012. [Google Scholar]
  3. Giannelis, E.P. Polymer-layered silicate nanocomposites: Synthesis, properties and applications. Appl. Organomet. Chem. 1998, 12, 675–680. [Google Scholar] [CrossRef]
  4. Sinha Ray, S.; Yamada, K.; Okamoto, M.; Ueda, K. Polylactide-layered silicate nanocomposite:  A novel biodegradable material. Nano Lett. 2002, 2, 1093–1096. [Google Scholar] [CrossRef]
  5. Makoto, O.; Kazuyuki, K. Preparation of inorganic–organic nanocomposites through intercalation of organoammonium ions into layered silicates. Bull. Chem. Soc. Jpn. 1997, 70, 2593–2618. [Google Scholar]
  6. Theng, B.K.G. The Chemistry of Clay-Organic Reactions; Wiley: Hoboken, NJ, USA, 1974. [Google Scholar]
  7. Fukushima, Y.; Inagaki, S. Synthesis of an intercalated compound of montmorillonite and 6-polyamide. J. Incl. Phenom. 1987, 5, 473–482. [Google Scholar] [CrossRef]
  8. Burnside, S.D.; Giannelis, E.P. Synthesis and properties of new poly(dimethylsiloxane) nanocomposites. Chem. Mater. 1995, 7, 1597–1600. [Google Scholar] [CrossRef]
  9. Chen, B.; Evans, J.R.G. Poly(ε-caprolactone)−clay nanocomposites:  Structure and mechanical properties. Macromolecules 2006, 39, 747–754. [Google Scholar] [CrossRef]
  10. Zhao, Q.; Samulski, E.T. Supercritical CO2-mediated intercalation of peo in clay. Macromolecules 2003, 36, 6967–6969. [Google Scholar] [CrossRef]
  11. Breitenbach, J. Melt extrusion: From process to drug delivery technology. Eur. J. Pharm. Biopharm. 2002, 54, 107–117. [Google Scholar] [CrossRef]
  12. Andrews, G.P.; Jones, D.S.; Diak, O.A.; McCoy, C.P.; Watts, A.B.; McGinity, J.W. The manufacture and characterisation of hot-melt extruded enteric tablets. Eur. J. Pharm. Biopharm. 2008, 69, 264–273. [Google Scholar] [CrossRef] [PubMed]
  13. Liu, H.; Wang, P.; Zhang, X.; Shen, F.; Gogos, C.G. Effects of extrusion process parameters on the dissolution behavior of indomethacin in eudragit® E PO solid dispersions. Int. J. Pharm. 2010, 383, 161–169. [Google Scholar] [CrossRef] [PubMed]
  14. Schilling, S.U.; Shah, N.H.; Waseem Malick, A.; McGinity, J.W. Properties of melt extruded enteric matrix pellets. Eur. J. Pharm. Biopharm. 2010, 74, 352–361. [Google Scholar] [CrossRef] [PubMed]
  15. Maniruzzaman, M.; Morgan, D.J.; Mendham, A.P.; Pang, J.; Snowden, M.J.; Douroumis, D. Drug–polymer intermolecular interactions in hot-melt extruded solid dispersions. Int. J. Pharm. 2013, 443, 199–208. [Google Scholar] [CrossRef] [PubMed]
  16. Maniruzzaman, M.; Rana, M.; Boateng, J.; Mitchell, J.; Douroumis, D. Dissolution enhancement of poorly water-soluble APIs processed by hot-melt extrusion using hydrophilic polymers. Drug Dev. Ind. Pharm. 2013, 39, 218–227. [Google Scholar] [CrossRef] [PubMed]
  17. Maniruzzaman, M.; Boateng, J.; Snowden, M.; Douroumis, D. A review of hot-melt extrusion: Process technology to pharmaceutical products. ISRN Pharm. 2012, 2012, 1–9. [Google Scholar] [CrossRef] [PubMed]
  18. Maniruzzaman, M.; Nair, A.; Scoutaris, N.; Bradley, M.S.A.; Snowden, M.J.; Douroumis, D. One-step continuous extrusion process for the manufacturing of solid dispersions. Int. J. Pharm. 2015, 496, 42–51. [Google Scholar] [CrossRef] [PubMed]
  19. Vithani, K.; Maniruzzaman, M.; Slipper, I.J.; Mostafa, S.; Miolane, C.; Cuppokc, Y.; Marchaud, D.; Douroumis, D. Sustained release solid lipid matrices processed by hot-meltextrusion (HME). Colloids Surf. B Biointerfaces 2013, 110, 403–410. [Google Scholar] [CrossRef] [PubMed]
  20. Alshehri, S.M.; Tiwari, R.V.; Alsulays, B.B.; Ashour, E.A.; Alshetaili, A.S.; Almutairy, B.; Park, J.-B.; Morott, J.; Sandhu, B.; Majumdar, S.; et al. Investigation of the combined effect of mgo and peg on the release profile of mefenamic acid prepared via hot-melt extrusion techniques. Pharm. Dev. Technol. 2017, 22, 740–753. [Google Scholar] [CrossRef] [PubMed]
  21. Patil, H.; Tiwari, R.V.; Repka, M.A. Hot-melt extrusion: From theory to application in pharmaceutical formulation. AAPS PharmSciTech 2016, 17, 20–42. [Google Scholar] [CrossRef] [PubMed]
  22. Shah, S.; Maddineni, S.; Lu, J.; Repka, M.A. Melt extrusion with poorly soluble drugs. Int. J. Pharm. 2013, 453, 233–252. [Google Scholar] [CrossRef] [PubMed]
  23. Bikiaris, D.; Karavelidis, V.; Karavas, E. Effectiveness of various drug Carriers in controlled release formulations of raloxifene HCl prepared by melt mixing. Curr. Drug Deliv. 2009, 6, 425–436. [Google Scholar] [CrossRef]
  24. Fousteris, E.; Tarantili, P.A.; Karavas, E.; Bikiaris, D. Polyvinylpyrrolidone-poloxamer-188 solid dispersions prepared by hot melt extrusion: Thermal properties and release behavior. J. Therm. Anal. Calorim. 2013, 113, 1037–1047. [Google Scholar] [CrossRef]
  25. Palazi, E.; Karavas, E.; Barmpalexis, P.; Kostoglou, M.; Nanaki, S.; Christodoulou, E.; Bikiaris, D. Melt extrusion process for adjusting drug release of poorly water soluble drug felodipine using different polymer matrices. Eur. J. Pharm. Sci. 2018, 114, 332–345. [Google Scholar] [CrossRef] [PubMed]
  26. Prodduturi, S.; Manek, R.V.; Kolling, W.M.; Stodghill, S.P.; Repka, M.A. Solid-state stability and characterization of hot-melt extruded poly(ethylene oxide) films. J. Pharm. Sci. 2005, 94, 2232–2245. [Google Scholar] [CrossRef] [PubMed]
  27. Campbell, K.T.; Craig, D.Q.M.; McNally, T. Modification of ibuprofen drug release from poly(ethylene glycol) layered silicate nanocomposites prepared by hot-melt extrusion. J. Appl. Polym. Sci. 2014, 131. [Google Scholar] [CrossRef]
  28. Schachter, D.M.; Xiong, J.; Tirol, G.C. Solid state NMR perspective of drug–polymer solid solutions: A model system based on poly(ethylene oxide). Int. J. Pharm. 2004, 281, 89–101. [Google Scholar] [CrossRef] [PubMed]
  29. Ozeki, T.; Yuasa, H.; Kanaya, Y. Application of the solid dispersion method to the controlled release of medicine. IX. Difference in the release of flurbiprofen from solid dispersions with poly(ethylene oxide) and hydroxypropylcellulose and the interaction between medicine and polymers. Int. J. Pharm. 1997, 155, 209–217. [Google Scholar] [CrossRef]
  30. Siepmann, J.; Siepmann, F. Mathematical modeling of drug delivery. Int. J. Pharm. 2008, 364, 328–343. [Google Scholar] [CrossRef] [PubMed]
  31. Siepmann, J.; Siepmann, F. Modeling of diffusion controlled drug delivery. J. Control. Release 2012, 161, 351–362. [Google Scholar] [CrossRef] [PubMed]
  32. Viseras, C.; Cerezo, P.; Sanchez, R.; Salcedo, I.; Aguzzi, C. Current challenges in clay minerals for drug delivery. Appl. Clay Sci. 2010, 48, 291–295. [Google Scholar] [CrossRef]
  33. Mousa, M.; Evans, N.D.; Oreffo, R.O.C.; Dawson, J.I. Clay nanoparticles for regenerative medicine and biomaterial design: A review of clay bioactivity. Biomaterials 2018, 159, 204–214. [Google Scholar] [CrossRef] [PubMed]
  34. Bitinis, N.; Hernandez, M.; Verdejo, R.; Kenny, J.M.; Lopez-Manchado, M.A. Recent advances in clay/polymer nanocomposites. Adv. Mater. 2011, 23, 5229–5236. [Google Scholar] [CrossRef] [PubMed]
  35. Mittal, G.; Rhee, K.Y.; Mišković-Stanković, V.; Hui, D. Reinforcements in multi-scale polymer composites: Processing, properties, and applications. Compos. Part B 2018, 138, 122–139. [Google Scholar] [CrossRef]
  36. Yang, M.; Wang, P.; Huang, C.-Y.; Ku, M.S.; Liu, H.; Gogos, C. Solid dispersion of acetaminophen and poly(ethylene oxide) prepared by hot-melt mixing. Int. J. Pharm. 2010, 395, 53–61. [Google Scholar] [CrossRef] [PubMed]
  37. Poli-Bigelli, S.; Rodrigues-Pereira, J.; Carides, A.D.; Julie Ma, G.; Eldridge, K.; Hipple, A.; Evans, J.K.; Horgan, K.J.; Lawson, F.; On Behalf of the Aprepitant Protocol 054 Study Group. Addition of the neurokinin 1 receptor antagonist aprepitant to standard antiemetic therapy improves control of chemotherapy-induced nausea and vomiting. Cancer 2003, 97, 3090–3098. [Google Scholar] [CrossRef] [PubMed]
  38. Sharma, R.; Kamboj, S.; Singh, G.; Rana, V. Development of aprepitant loaded orally disintegrating films for enhanced pharmacokinetic performance. Eur. J. Pharm. Sci. 2016, 84, 55–69. [Google Scholar] [CrossRef] [PubMed]
  39. Kesisoglou, F.; Mitra, A. Crystalline nanosuspensions as potential toxicology and clinical oral formulations for bcs ii/iv compounds. AAPS J. 2012, 14, 677–687. [Google Scholar] [CrossRef] [PubMed]
  40. Kesisoglou, F.; Wu, Y. Understanding the effect of API properties on bioavailability through absorption modeling. AAPS J. 2008, 10, 516–525. [Google Scholar] [CrossRef] [PubMed]
  41. Bikiaris, D.N. Solid dispersions, Part I: Recent evolutions and future opportunities in manufacturing methods for dissolution rate enhancement of poorly water-soluble drugs. Expert Opin. Drug Deliv. 2011, 8, 1501–1519. [Google Scholar] [CrossRef] [PubMed]
  42. Bikiaris, D.N. Solid dispersions, Part II: New strategies in manufacturing methods for dissolution rate enhancement of poorly water-soluble drugs. Expert Opin. Drug Deliv. 2011, 8, 1663–1680. [Google Scholar] [CrossRef] [PubMed]
  43. Barmpalexis, P.; Koutsidis, I.; Karavas, E.; Louka, D.; Papadimitriou, S.A.B.; Bikiaris, D.N. Development of PVP/PEG mixtures as appropriate carriers for the preparation of drug solid dispersions by melt mixing technique and optimization of dissolution using artificial neural networks. Eur. J. Pharm. Biopharm. 2013, 85, 1219–1231. [Google Scholar] [CrossRef] [PubMed]
  44. Papadimitriou, S.A.; Barmpalexis, P.; Karavas, E.; Bikiaris, D.N. Optimizing the ability of PVP/PEG mixtures to be used as appropriate carriers for the preparation of drug solid dispersions by melt mixing technique using artificial neural networks: I. Eur. J. Pharm. Biopharm. 2012, 82, 175–186. [Google Scholar] [CrossRef] [PubMed]
  45. Chandrasekhara Rao, B.; Vidyadhara, S.; Rlc, S.; Chowdary, D.Y. Dissolution enhancement of poorly soluble drug aprepitant by hot melt extrusion method using hydrophilic polymer: A solid dispersion technique. Res. J. Pharm. Biol. Chem. Sci. 2014, 5, 1469–1485. [Google Scholar]
  46. Prodduturi, S.; Dhawan, S.; Jatla, V.; Dintakurthi, N.; Venkata Gopal Krishna, K.; Gunturu, G.; Ansari, K.A.; Ridhurkar, D.; Rudraraju, V.; Pillai, R. Enhancement of dissolution rate of aprepitant using melt-extrusion technology. In Proceedings of the AAPS, Washington, DC, USA, 23–27 October 2011. [Google Scholar]
  47. Penumetcha, S.S.; Gutta, L.N.; Dhanala, H.; Yamili, S.; Challa, S.; Rudraraju, S.; Rudraraju, S.; Rudraraju, V. Hot melt extruded aprepitant–soluplus solid dispersion: Preformulation considerations, stability and in vitro study. Drug Dev. Ind. Pharm. 2016, 42, 1609–1620. [Google Scholar] [CrossRef] [PubMed]
  48. Liu, J.; Zou, M.; Piao, H.; Liu, Y.; Tang, B.; Gao, Y.; Ma, N.; Cheng, G. Characterization and pharmacokinetic study of aprepitant solid dispersions with soluplus®. Molecules 2015, 20, 11345–11356. [Google Scholar] [CrossRef] [PubMed]
  49. Dissolution Methods. Available online: https://www.accessdata.fda.gov/scripts/cder/dissolution (accessed on 2018).
  50. Hoffmann, C.L.; Rabolt, J.F. Self-assembled thin-film blends by polymer codeposition:  Poly(ethylene oxide) and poly(methyl methacrylate). Macromolecules 1996, 29, 2543–2547. [Google Scholar] [CrossRef]
  51. Rocco, A.; Polo da Fonseca, C.; Pereira, R. A polymeric solid electrolyte based on a binary blend of poly(ethylene oxide), poly(methyl vinyl ether-maleic acid) and liclo4. Ploymer 2002, 43, 3601–3609. [Google Scholar] [CrossRef]
  52. Tang, Z.; Wang, J.; Chen, Q.; He, W.; Shen, C.; Mao, X.-X.; Zhang, J. A novel peo-based composite polymer electrolyte with absorptive glass mat for li-ion batteries. Electrochim. Acta 2007, 52, 6638–6643. [Google Scholar] [CrossRef]
  53. Sundar, M.; Selladurai, S. Effect of fillers on magnesium–poly(ethylene oxide) solid polymer electrolyte. Ionics 2006, 12, 281–286. [Google Scholar] [CrossRef]
  54. Yoshihara, T.; Tadokoro, H.; Murahashi, S. Normal vibrations of the polymer molecules of helical conformation. Iv. Polyethylene oxide and polyethylene-d4 oxide. J. Chem. Phys. 1964, 41, 2902–2911. [Google Scholar] [CrossRef]
  55. Mallakpour, S.; Barati, A. Application of modified cloisite Na+ with l-phenylalanine for the preparation of new poly(vinyl alcohol)/organoclay bionanocomposite films. Polym.-Plast. Technol. Eng. 2012, 51, 321–327. [Google Scholar] [CrossRef]
  56. Junior, C.R.F.; de Moura, M.R.; Aouada, F.A. Synthesis and characterization of intercalated nanocomposites based on poly(methacrylic acid) hydrogel and nanoclay cloisite-Na+ for possible application in agriculture. J. Nanosci. Nanotechnol. 2017, 17, 5878–5883. [Google Scholar] [CrossRef]
  57. Loyens, W.; Maurer, F.H.J.; Jannasch, P. Melt-compounded salt-containing poly(ethylene oxide)/clay nanocomposites for polymer electrolyte membranes. Ploymer 2005, 46, 7334–7345. [Google Scholar] [CrossRef]
  58. Loyens, W.; Jannasch, P.; Maurer, F.H.J. Effect of clay modifier and matrix molar mass on the structure and properties of poly(ethylene oxide)/cloisite nanocomposites via melt-compounding. Polymer 2005, 46, 903–914. [Google Scholar] [CrossRef]
  59. Ratna, D.; Divekar, S.; Samui, A.; Chakraborty, B.; Banthia, A. Poly(ethylene oxide)/clay nanocomposite: Thermomechanical properties and morphology. Polymer 2006, 47, 4068–4074. [Google Scholar] [CrossRef]
  60. Strawhecker, K.E.; Manias, E. Crystallization behavior of poly(ethylene oxide) in the presence of Na+ montmorillonite fillers. Chem. Mater. 2003, 15, 844–849. [Google Scholar] [CrossRef]
  61. Liao, B.; Song, M.; Liang, H.J.; Pang, Y.X. Polymer-layered silicate nanocomposites. 1. A study of poly(ethylene oxide)/Na+-montmorillonite nanocomposites as polyelectrolytes and polyethylene-block-poly(ethylene glycol) copolymer/Na+-montmorillonite nanocomposites as fillers for reinforcement of polyethylene. Polymer 2001, 42, 10007–10011. [Google Scholar]
  62. Ridhurkar, D.N.; Ansari, K.A.; Kumar, D.; Kaul, N.S.; Krishnamurthy, T.; Dhawan, S.; Pillai, R. Inclusion complex of aprepitant with cyclodextrin: Evaluation of physico-chemical and pharmacokinetic properties. Drug Dev. Ind. Pharm. 2013, 39, 1783–1792. [Google Scholar] [CrossRef] [PubMed]
  63. Ren, L.; Zhou, Y.; Wei, P.; Li, M.; Chen, G. Preparation and pharmacokinetic study of aprepitant–sulfobutyl ether-β-cyclodextrin complex. AAPS PharmSciTech 2014, 15, 121–130. [Google Scholar] [CrossRef] [PubMed]
  64. Helmy, R.; Zhou, G.X.; Chen, Y.W.; Crocker, L.; Wang, T.; Wenslow, R.M.; Vailaya, A. Characterization and quantitation of aprepitant drug substance polymorphs by attenuated total reflectance fourier transform infrared spectroscopy. Anal. Chem. 2003, 75, 605–611. [Google Scholar] [CrossRef] [PubMed]
  65. Braun, D.E.; Gelbrich, T.; Kahlenberg, V.; Laus, G.; Wieser, J.; Griesser, U.J. Packing polymorphism of a conformationally flexible molecule (aprepitant). New J. Chem. 2008, 32, 1677–1685. [Google Scholar] [CrossRef]
  66. Van Renterghem, J.; Dhondt, H.; Verstraete, G.; De Bruyne, M.; Vervaet, C.; De Beer, T. The impact of the injection mold temperature upon polymer crystallization and resulting drug release from immediate and sustained release tablets. Int. J. Pharm. 2018, 541, 108–116. [Google Scholar] [CrossRef] [PubMed]
  67. Liu, C.; Liu, Z.; Chen, Y.; Chen, Z.; Chen, H.; Pui, Y.; Qian, F. Oral bioavailability enhancement of β-lapachone, a poorly soluble fast crystallizer, by cocrystal, amorphous solid dispersion, and crystalline solid dispersion. Eur. J. Pharm. Biopharm. 2018, 124, 73–81. [Google Scholar] [CrossRef] [PubMed]
  68. Van Duong, T.; Goderis, B.; Van Humbeeck, J.; Van Den Mooter, G. Microstructure of Pharmaceutical Semicrystalline Dispersions: The Significance of Polymer Conformation. Mol. Pharm. 2018, 15, 629–641. [Google Scholar] [CrossRef] [PubMed]
  69. Tien, C. Adsorption Calculations and Modeling; Butterworth-Heinemann: Boston, MA, USA, 1994. [Google Scholar]
  70. Kim, C.J. Effects of drug solubility, drug loading, and polymer molecular weight on drug release from Polyox tablets. Drug Dev. Ind. Pharm. 1998, 24, 645–651. [Google Scholar] [CrossRef] [PubMed]
  71. Cantin, O.; Siepmann, F.; Danede, F.; Willart, J.F.; Karrout, Y.; Siepmann, J. PEO hot melt extrudates for controlled drug delivery: Importance of the molecular weight. J. Drug Deliv. Sci. Technol. 2016, 36, 130–140. [Google Scholar] [CrossRef]
Figure 1. Thermogravimetric analysis curves of aprepitant, poly(ethylene oxide) (PEO), and Cloisite-Na+ clay.
Applsci 08 00786 g001
Figure 2. Transparency of films made of pure PEO, drug-loaded (10 wt %) PEO (PEO_10Aprep), nanocomposites (5 and 10 wt % clay, PEO_5Cloisite-Na+ and PEO_10Cloisite-Na+, respectively) and drug-loaded nanocomposites (PEO_10Aprep_5Cloisite-Na+, PEO_10Aprep_10Cloisite-Na+, respectively).
Applsci 08 00786 g002
Figure 3. FTIR spectra of pure PEO, Cloisite-Na+, and PEO/5 wt % Cloisite-Na+ (PEO_5CloisiteNa+) nanocomposite.
Applsci 08 00786 g003
Figure 4. XRD patterns of PEO and PEO/clay nanocomposites with 5 and 10 wt % clay loading (PEO_5CloisiteNa+ and PEO_10CloisiteNa+): (a) low angle range; (b) wide angle range.
Applsci 08 00786 g004
Figure 5. DSC curves of pure PEO and PEO/5 wt % clay (PEO_5Cloisite-Na+) nanocomposite.
Applsci 08 00786 g005
Figure 6. SEM images of drug-loaded PEO with 10 wt % APR (PEO_10Aprep) (left) and 20 wt % APR (PEO_20Aprep) (right).
Applsci 08 00786 g006
Figure 7. FTIR spectra (a) and XRD patterns (b) of pure aprepitant (APR), pure PEO, and PEO loaded with 5, 10, and 20 wt % APR (PEO_5Aprep, PEO_10Aprep, and PEO_20Aprep, respectively).
Applsci 08 00786 g007
Figure 8. DSC curves of pure aprepitant (APR), pure PEO, and PEO loaded with 5, 10, and 20 wt % of APR (PEO_5Aprep, PEO_10Aprep and PEO_20Aprep, respectively).
Applsci 08 00786 g008
Figure 9. SEM image and EDX analysis of drug-loaded PEO nanocomposites with 5 wt % APR and 5 wt % clay (PEO_5Aprep_5CloisiteNa+).
Applsci 08 00786 g009
Figure 10. SEM image and EDX analysis of drug-loaded PEO nanocomposite with 10 wt % APR and 10 wt % clay (PEO_10Aprep_10CloisiteNa+).
Applsci 08 00786 g010
Figure 11. FTIR spectra of pure APR and the 5, 10, and 20 wt % drug-loaded PEO/clay nanocomposites containing (a) 5 wt % clay and (b) 10 wt % clay.
Applsci 08 00786 g011
Figure 12. XRD patterns of pure aprepitant and PEO, and of the APR-loaded PEO/clay nanocomposites at different drug loadings containing (a) 5 wt % and (b) 10 wt % clay.
Applsci 08 00786 g012
Figure 13. XRD patterns (low angle) of APR-loaded PEO/clay nanocomposites with: (a) 5 wt % (PEO_5Aprep_5CloisiteNa+, PEO_10Aprep_5CloisiteNa+ and PEO_20Aprep_5CloisiteNa+) and (b) 10 wt % clay (PEO_5Aprep_10CloisiteNa+, PEO_10Aprep_10CloisiteNa+ and PEO_20Aprep_10CloisiteNa+).
Applsci 08 00786 g013
Figure 14. DSC curves of pure aprepitant and different drug-loaded nanocomposites containing (a) 5 wt % (PEO_5Aprep_5CloisiteNa+, PEO_10Aprep_5CloisiteNa+ and PEO_20Aprep_5CloisiteNa+) and (b) 10 wt % clay (PEO_5Aprep_10CloisiteNa+, PEO_10Aprep_10CloisiteNa+ and PEO_20Aprep_10CloisiteNa+).
Applsci 08 00786 g014
Figure 15. Dissolution profile of (a) aprepitant (APR)/PEO formulations prepared by melt mixing with 5, 10, and 20 wt % drug and (APR)/PEO/clay formulations with (b) 5 wt % (PEO_5Aprep_5CloisiteNa+, PEO_10Aprep_5CloisiteNa+ and PEO_20Aprep_5CloisiteNa+) and (c) 10 wt % clay (PEO_5Aprep_10CloisiteNa+, PEO_10Aprep_10CloisiteNa+ and PEO_20Aprep_10CloisiteNa+).
Applsci 08 00786 g015
Figure 16. Comparison between experimental (symbols) and model (continuous lines) release curves for several PEO and aprepitant formulations.
Applsci 08 00786 g016
Figure 17. Comparison between experimental (symbols) and model (continuous lines) release curves for several PEO/aprepitant/clay formulations. Clay weight fraction = 5 wt %.
Applsci 08 00786 g017
Figure 18. Comparison between experimental (symbols) and model (continuous lines) release curves for several PEO/aprepitant/clay formulations. Clay weight fraction = 10 wt %.
Applsci 08 00786 g018

