Generation of Ultrashort Optical Pulses in the Deep-Ultraviolet Region Based on Four-Wave Raman Mixing

1
Department of Applied Chemistry, Graduate School of Engineering, Kyushu University, 744, Motooka, Nishi-ku, Fukuoka 819-0395, Japan
2
Division of International Strategy, Center of Future Chemistry, Kyushu University, 744, Motooka, Nishi-ku, Fukuoka 819-0395, Japan
*
Author to whom correspondence should be addressed.
Appl. Sci. 2018, 8(5), 784; https://doi.org/10.3390/app8050784
Submission received: 11 April 2018
/
Revised: 9 May 2018
/
Accepted: 14 May 2018
/
Published: 15 May 2018
(This article belongs to the Special Issue Femtosecond Light Sources and Their Applications in the Deep UV, Vacuum UV, and Extreme UV)
Abstract
:A two-color pump beam (800 and 1200 nm) was introduced into hydrogen for molecular phase modulation, and a probe beam (267 nm) to generate Raman sidebands, by coherent frequency modulation based on four-wave Raman mixing. The phase and temporal profile were evaluated by means of a self-diffraction frequency resolved optical gating (SD FROG) system. The relative phases among the Raman sidebands were controlled by changing the angle of a thin CaF2-plate inserted into the 267-nm beam path, suggesting that a train of 2.6-fs pulses was generated in the deep-ultraviolet region.
1. Introduction
Ultrashort optical pulses have been successfully used in a variety of fundamental studies related to ultrafast phenomena. The binding energy of an electron in an outer-shell orbital is several eV, and therefore, a femtosecond laser emitting in the deep-ultraviolet (DUV) region (200–300 nm) can be employed in chemical reactions such as photo dissociations. On the other hand, the ionization energy is ca. 10 eV for most organic molecules, suggesting the possibility of efficient two-photon ionization using a DUV femtosecond laser. In fact, such a laser has been used practically as an ionization source in the studies of multiphoton ionization mass spectrometry for numerous organic molecules, including toxic compounds such as dioxins and pesticides, explosives such as trinitrotoluene and triacetone triperoxide, and even nerve agent metabolites [1]. The molecular ion, which is useful for identifying the molecule and for determining molecular weight, can be observed in many cases when the pulse width of the DUV laser is decreased to several tens of femtoseconds [2]. As a result, a technique for generating an ultrashort DUV optical pulse has attracted the interest of many researchers, not only in fundamental studies, but also in practical applications.
Several approaches have been reported for generating ultrashort optical pulses in the DUV region. One such approach is the use of self phase modulation of a Ti:sapphire laser to generate ca. 10-fs pulses [3,4,5,6]. Four-wave mixing is another approach [7,8,9,10], in which a negatively-chirped pulse can be generated in the DUV region, and even in the vacuum-ultraviolet (VUV) region, and is then compressed to 10–20 fs pulses by positive dispersion in the optical media—such as air—and a MgF2 plate inserted into the beam path. The other approach is through direct frequency upconversion (harmonic generation) of a near-infrared few-cycle optical pulse to generate an ultrashort DUV pulse (2.8–3.7 fs) [11,12].
In order to generate shorter optical pulses, it is necessary to further expand the spectral domain. It is possible to generate a supercontinuum in a very wide spectral domain using a gas-filled photonic crystal fibers [13,14]. Another approach is the generation of multiple sidebands based on four-wave Raman mixing [15]. In fact, the generation of a train of 1.6-fs optical pulses in a nanosecond envelope in the visible to near-infrared region was reported [16,17]. In a recent study, a series of Raman sidebands was generated in the DUV region by a pump-probe technique, in which a two-color beam emitting at 800 and 1200 nm was utilized as the pump beam with a single-color beam emitting at 267 nm or 200 nm as the probe beam, to generate several Raman sidebands in the DUV and VUV regions [18,19]. A hollow-core capillary was employed as a waveguide to improve the conversion efficiency by increasing the interaction distance between the laser and the Raman medium. However, the temporal shape and phase of such Raman sidebands have not yet been evaluated [18,19].
In this study, we used the pump-probe technique to generate Raman sidebands, and evaluated the temporal profile and the phase of the emissions using a self-diffraction (SD) frequency resolved optical gating (FROG) system [20,21,22]. From the fringe patterns observed in the FROG trace, we verified that the Raman sidebands were phase locked, and confirmed the generation of ultrashort optical pulses. This proof-of-principle experiment points to the potential advantage of four-wave Raman mixing to be used for the generation of an ultrashort optical pulse, and for applications to practical spectrometric studies [1].
2. Experimental Section
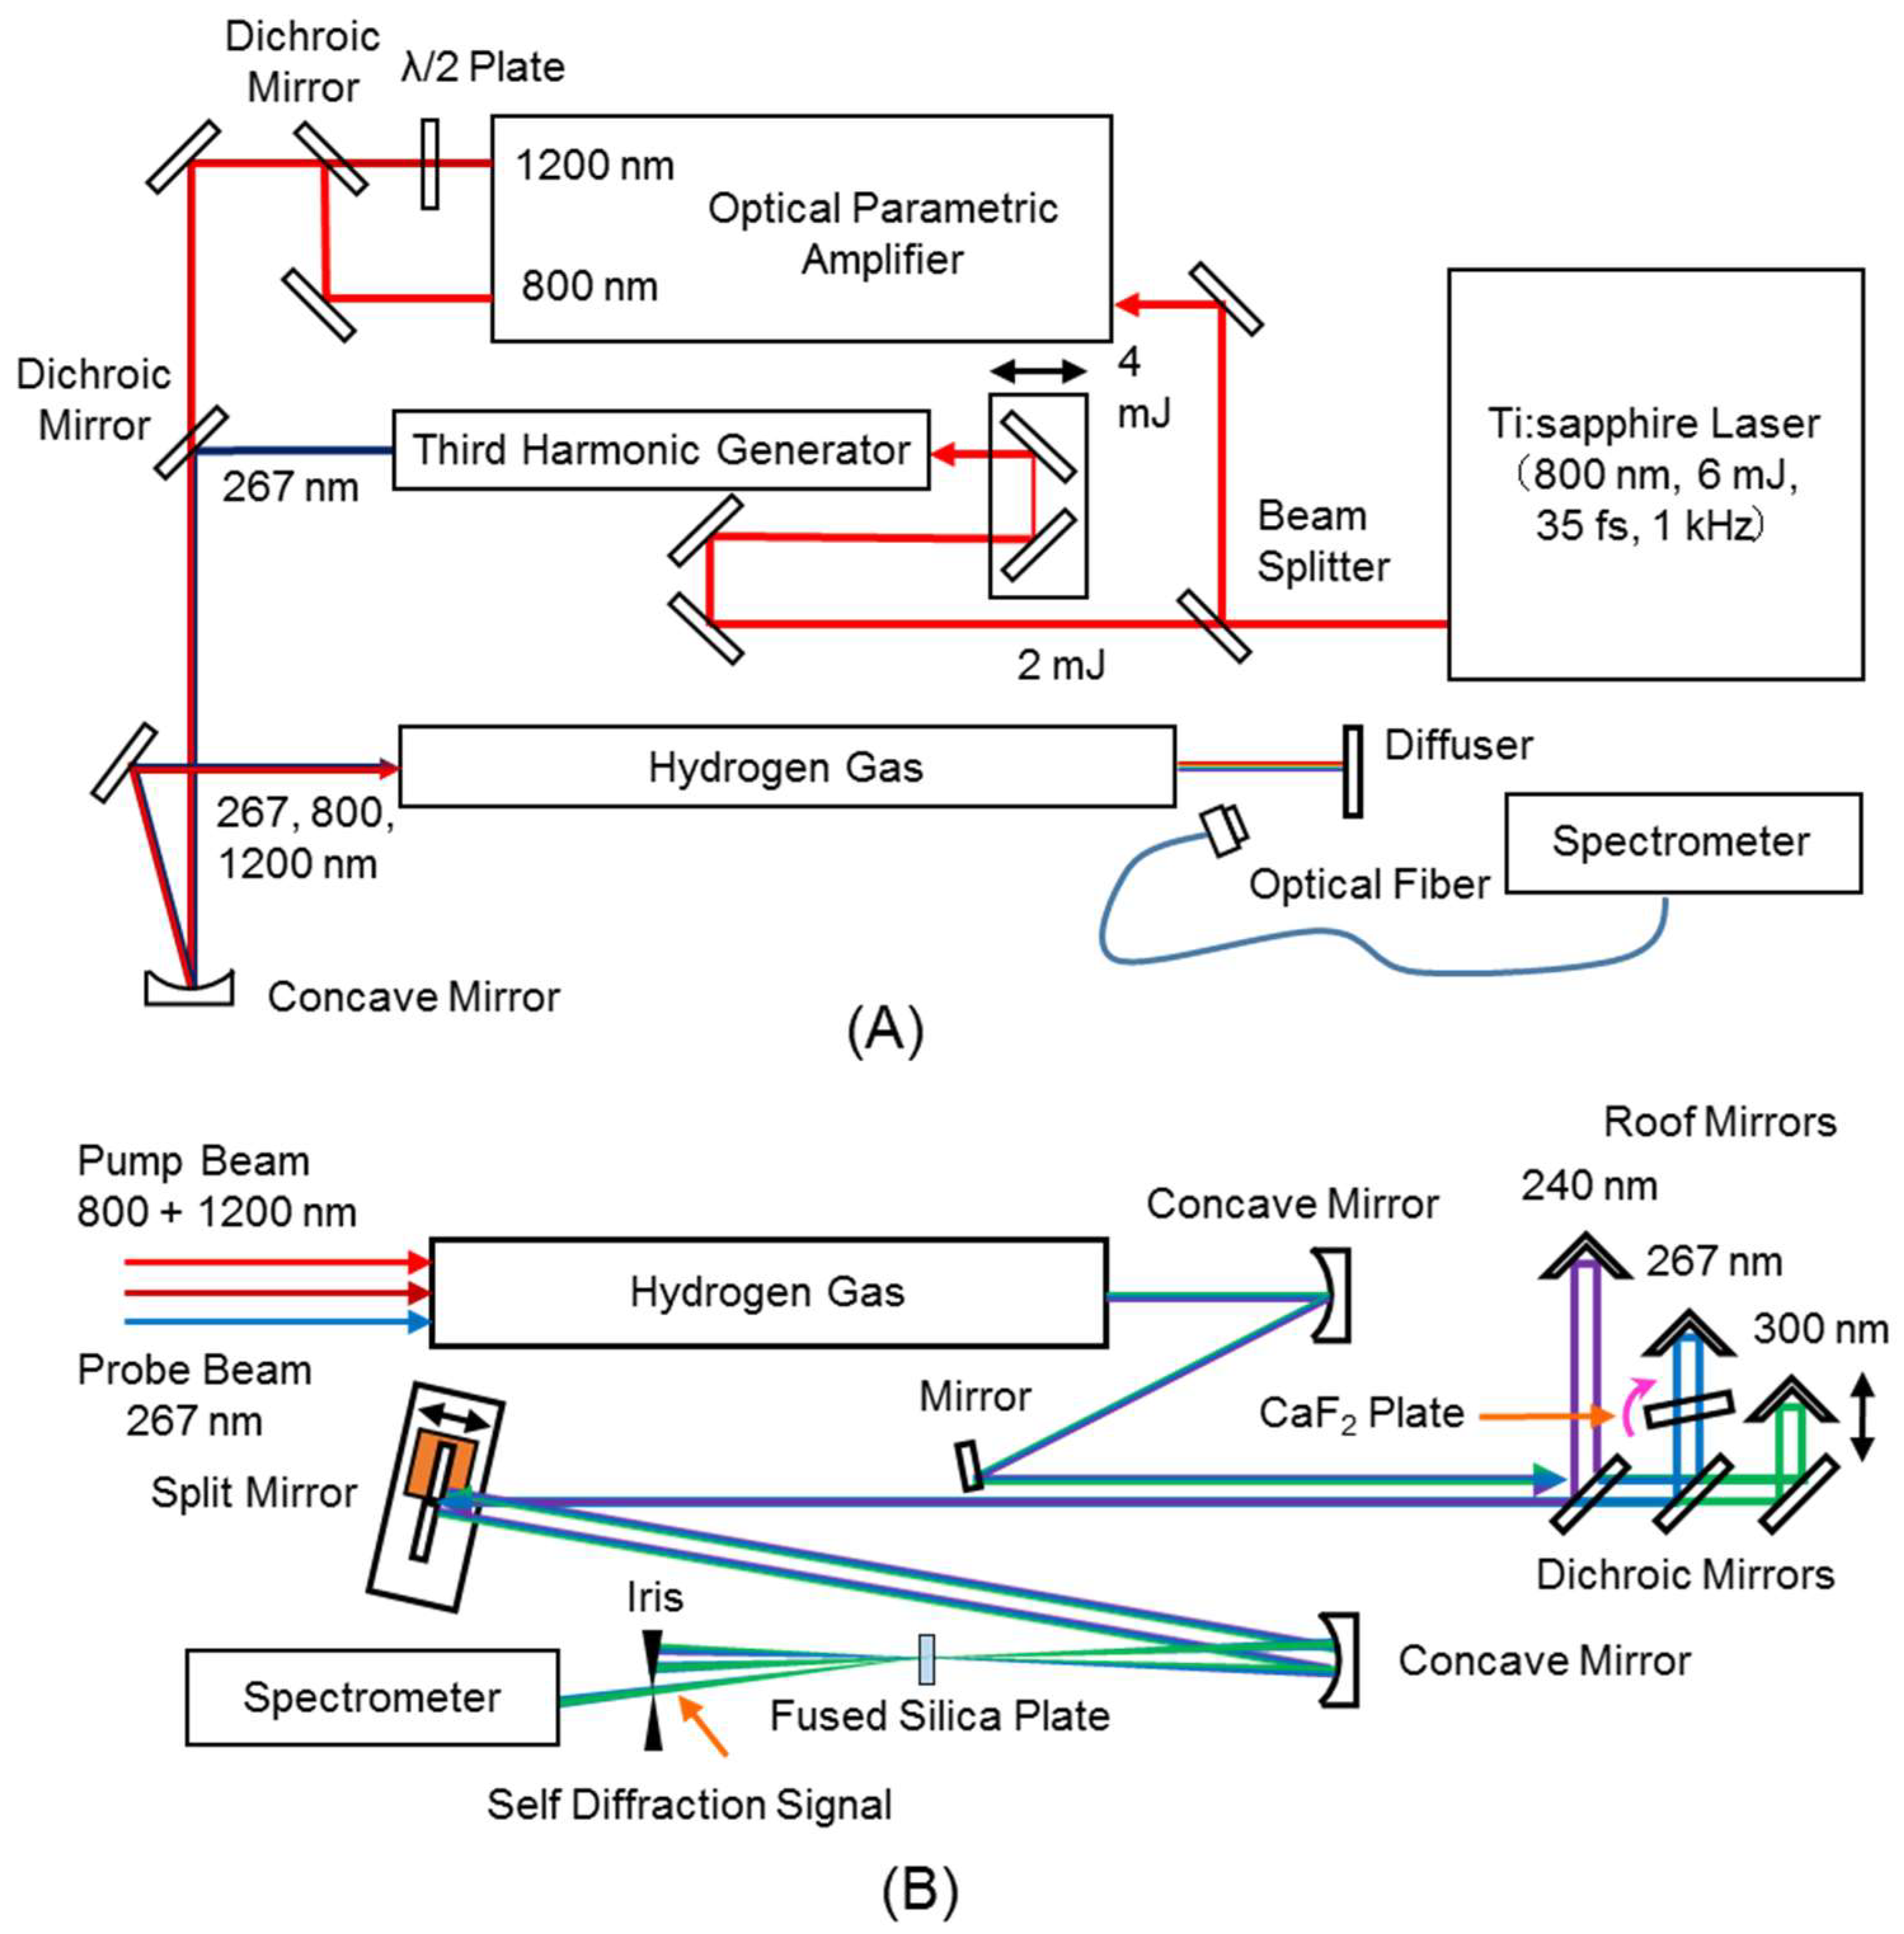
Figure 1A shows a block diagram of the setup for the pump-probe technique to generate Raman sidebands. A fundamental beam of a Ti:sapphire laser (800 nm, 35 fs, 1 kHz, 6 mJ, Solstice Ace, Spectra-Physics, Santa Clara, CA, USA) was separated into two parts (ratio, 2:1) by a beam splitter (1 mm thick, FEMTO OPTICS) composed of a dichroic mirror. One part (4 W) of the beam was used as the pump source for an optical parametric amplifier (TOPAS Prime, Spectra-Physics) to generate a near-infrared beam (1200 nm, 470 mW, ca. 40 fs), the polarization of which was rotated horizontally (p-wave) using a half-wave plate (WPZA-200-1/2-W 1200, CASTECH, Fuzhou, China). The output of OPA and the remaining fundamental beam (800 nm, 664 mW, ca. 40 fs) in the OPA were combined using a dichroic mirror (HR at 740–860 nm, LAYERTEC, Mellingen, Germany) for use as a two-color pump beam. The remaining part of the fundamental beam from the Ti:sapphire laser (2 W) was passed through an optical delay consisting of a series of dichroic mirrors (107978, LAYERTEC) mounted on the translational stage (TSD-401C, SIGMA KOKI), and a telescope consisting of fused silica lens (focal lengths, 40 and −25 cm, EKSMA OPTICS, Vilnius, Lithuania). The laser beam was introduced into an optical system for third harmonic generation, which consisted of a BBO crystal (θ = 29.2°, ∅ = 0°, thickness 0.2 mm, CASTON, Jin’an, China) for second harmonic generation, a time plate made of a BBO crystal (θ = 29.2°, thickness 3 mm, NEWLIGHT, Huntington Beach, USA) for adjustment of the optical delay between the fundamental and second harmonic pulses, a dual-wave plate (WPD05-H800-F400-SP, NEWLIGHT) for the adjustment of the polarization of the beams (half-wave plate at 800 nm and one-wave plate at 400 nm), and a BBO crystal (Type I, θ = 29.2°, ∅ = 0°, thickness 0.1 mm, CASTON) for the third harmonic generation (267 nm, 165 mW, ca. 60 fs, conversion efficiency 45%). A fused silica plate (1–5 mm thick) was inserted so as to positively chirp the pulse occasionally. The pump beam (800 and 1200 nm) and the probe beam (267 nm) were combined with each other using a dichroic mirror (LWP-laser mirror 2005500, thickness 2 mm, LASER COMPONENTS, Olching, Germany) and was focused into a Raman cell (CaF2 windows, thickness 0.5 mm) containing a hydrogen gas (0.7 atm), using a UV-enhanced aluminum concave mirror with a focal length of 50 cm (TCAE-30C05-1000, SIGMA KOKI, Tokyo, Japan), and a flat UV-enhanced aluminum mirror (TFAE-25.4C05-10, SIGMA KOKI). The spectrum of the Raman emission irradiating on a diffuser plate (silica, DFSQ1-30C02-240, SIGMA KOKI) was measured using a spectrometer coupled with an optical fiber (Maya2000Pro, 200–1100 nm or 190–410 nm, OCEAN OPTICS, Largo, FL, USA). The time delay between the pump and probe pulses was adjusted to ca. 6 ps, which was optimized for the generation of the Raman sidebands. The laser power was measured using a power meter (S310C, PM100D, THORLABS, Newton, NJ, USA).
Figure 1B shows a block diagram of the SD FROG system used for evaluating the phase and the temporal profile of the Raman sidebands. The three-color beam emitting at 240, 267, and 300 nm, i.e., the anti-Stokes, the probe, and the Stokes beam, respectively, was collimated using a concave aluminum mirror, and was reflected by the flat aluminum mirror. The beam was reflected by three dichroic mirrors (DIMQ-25C01-10-Rp241-Tp267/1200-NOAR, DIMQ-25C01-10-Rp267-Tp300/1200-NOAR, DIMQ-25C01-10-Rp300-Tp200/1200-NOAR, SIGMA KOKI), and the resulting three beams were reflected by means of three pairs of aluminum roof mirrors mounted on translational stages with precisions of 0.5 μm (TAM-401SWP, SIGNA KOKI), and were recombined with the dichroic mirrors. The time delay, i.e., the position of the translational stage, was adjusted to permit the maximum spectral bandwidth by cross phase modulation to be observed when focused on a fused silica plate (thickness, 1 mm). The three-color beam was then reflected by a knife-wedged split mirror (TFAE-25S05-10-200/1200-0/5D-Knife, SIGMA KOKI), consisting of a pair of flat aluminum mirrors spaced by <0.5 mm, which are mounted on the holders (MHG-MP12.7-NL, SIGNA KOKI). One of the mirrors was moved by using a translator (TSD-401SR and TSD-402S, SIGMA KOKI), equipped with a piezo-electric device (PX400SG, PIEZO SYSTEM JENA, Jena, Germany), and scanned by a function generator (WF1943, WAVE FACTORY, NF Corporation, Yokohama, Japan). The laser beam was focused by a concave aluminum mirror with a focal length of 20 cm (TCAE-25C05-400, SIGMA KOKI) into a fused silica plate with a thickness of 10 μm, or a sapphire plate with a thickness of 0.1 mm (c-axis cut, OYO KOKEN KOGYO, Kumagawa, Japan). The spatial overlapping was confirmed by observing the 267-nm beams reflected on the surface of the dichroic mirrors at the position of the sapphire plate, using a charge-coupled device (CCD) camera. The SD signal beam was passed through an orifice, and was measured using a spectrometer. In order to reduce the intensity of the 267-nm beam, a pair of roof mirrors made of aluminum was replaced with a pair of gold mirrors (PF10-03-M01, THORLABS). A CaF2 plate (thickness 0.5 mm) mounted on the rotational stage was inserted into the path of the 267-nm beam to scan the phase. In the alignment of the three-color beam, a fused-silica cell (path length 1 cm, SHIMADZU, Kyoto, Japan) containing an aqueous solution of NiSO4·6H2O (500 g/L, WAKO, Osaka, Japan) was used to suppress the pump beam emitting at 800 nm.
3. Results and Discussion
3.1. Generation of Raman Sidebands
Figure 2 shows the spectral profile of the Raman sidebands measured by the spectrometer, which mainly consisted of first Stokes (300 nm), probe (267 nm), and first anti-Stokes (240 nm) emissions. Higher-order Raman sidebands, such as second Stokes (342 nm) and second anti-Stokes (219 nm) emissions, were also clearly observed. The relative intensities of the sidebands against the probe beam were slightly less than 20%, and this value was nearly equal to the ratios obtained using a two-color beam in the NIR region (800 and 1200 nm). It is well known that the efficiency for generating Raman sidebands can be improved by using a hollow-core capillary to increase the length of interaction between the laser beam and the nonlinear medium, hydrogen. This approach of using the waveguide (core diameter, 0.24 mm; length, 400 mm; fused silica) was examined in the present study. As expected, the relative intensity of the Raman sidebands against the probe beam was significantly improved (70%) [18]. However, the transmission efficiency of the UV beam in the capillary decreased to 10%. In addition, the quality of the beam from the capillary had deteriorated, thus preventing the Raman sidebands from being used for Fourier synthesis to produce ultrashort pulses. Because of this, the above approach was not pursued further in this study.
3.2. FROG Trace
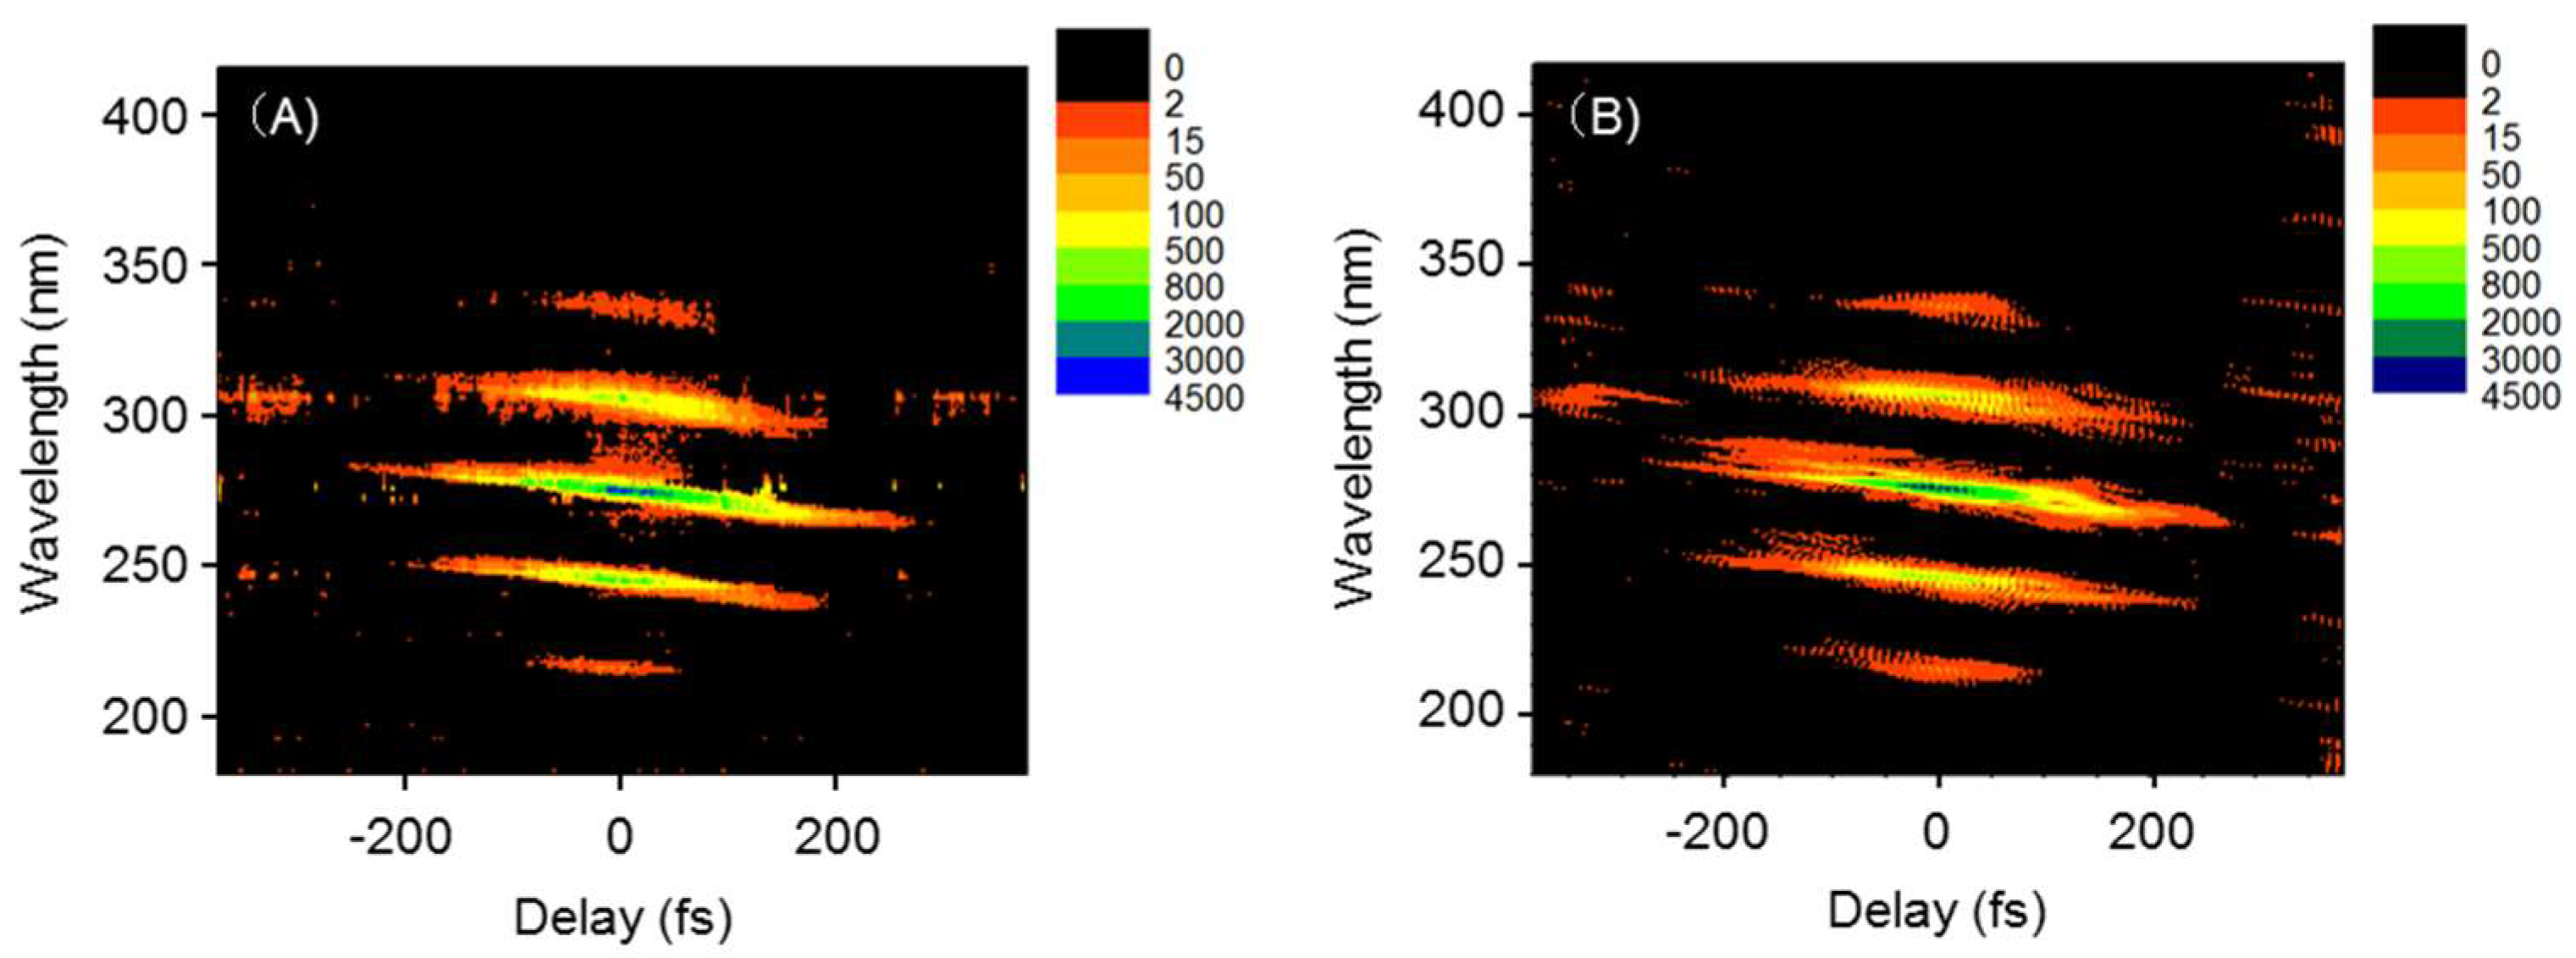
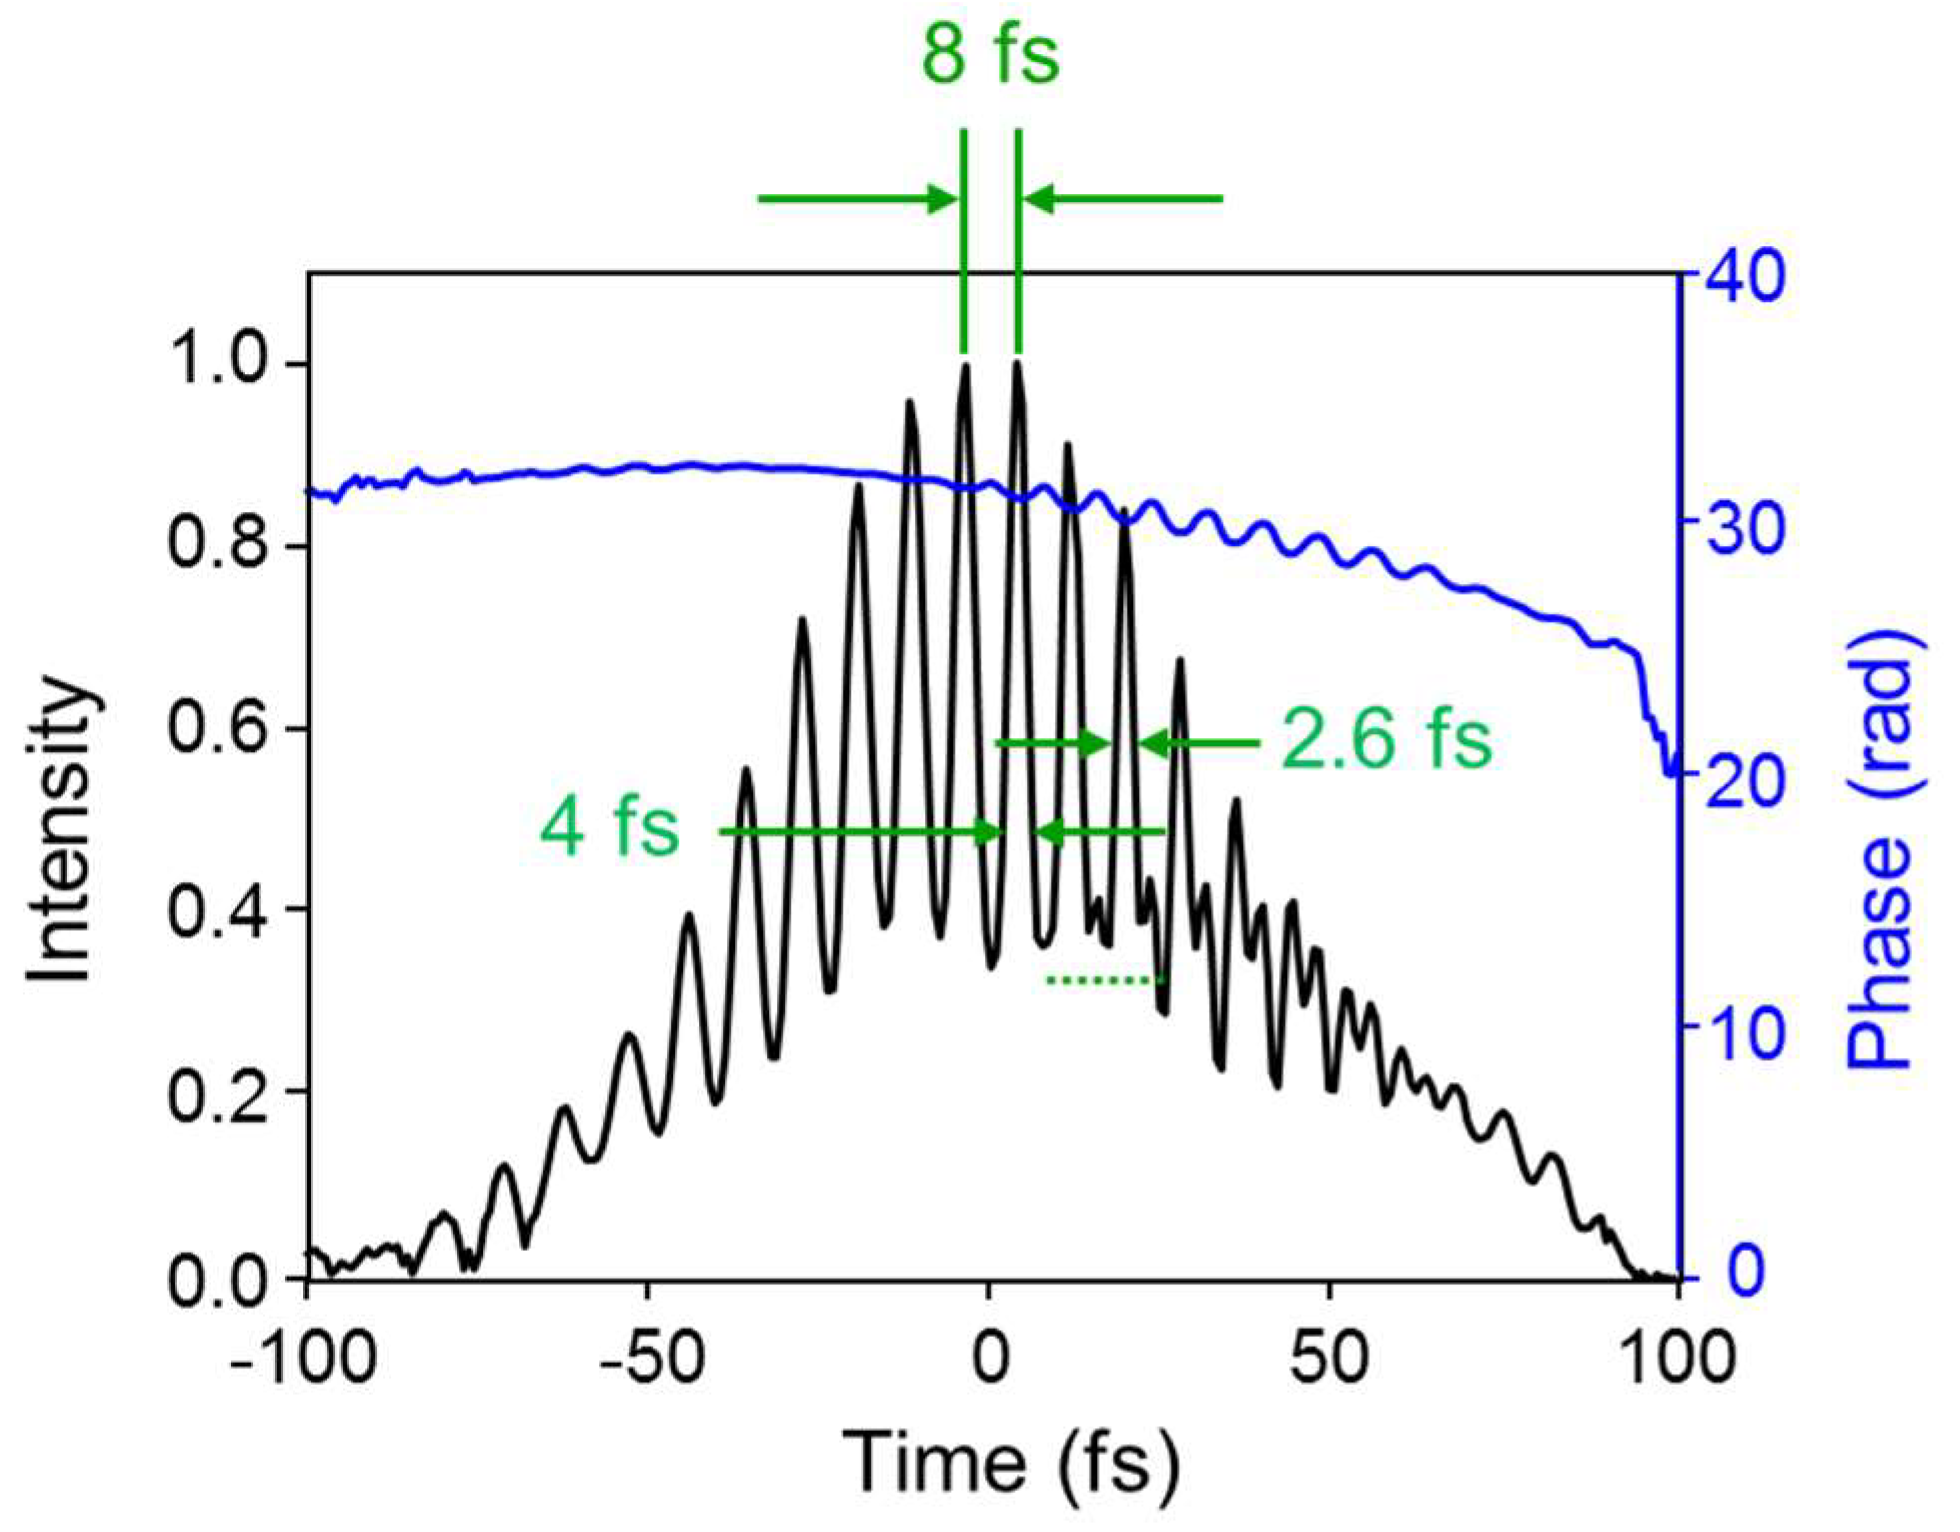
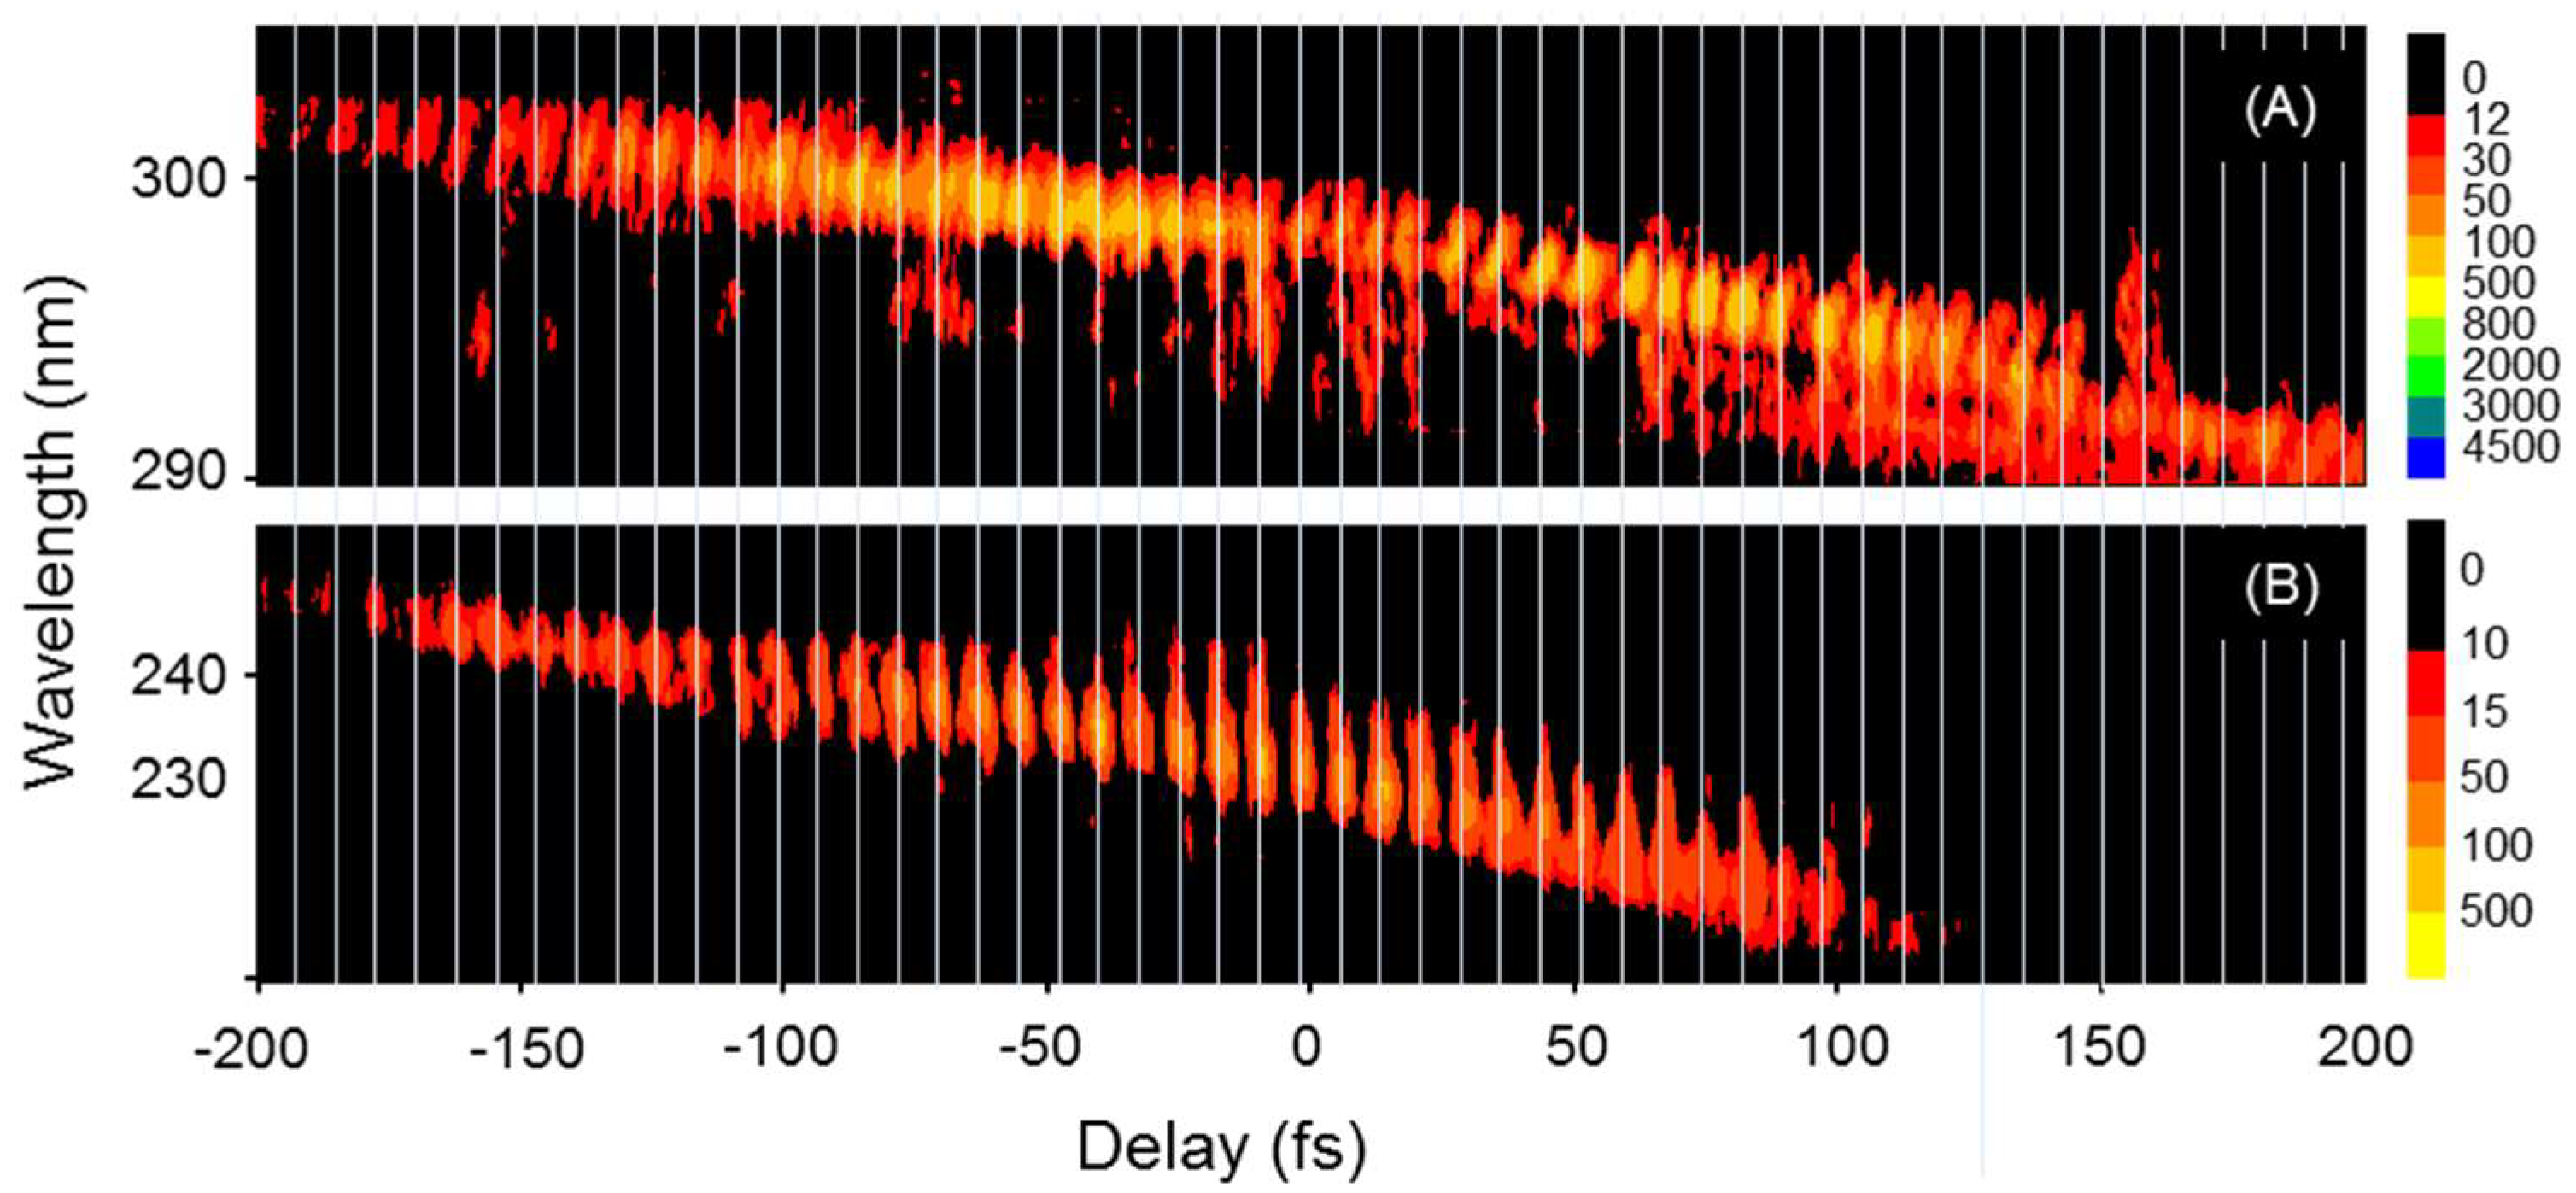
Figure 3A shows the observed FROG trace, which mainly consists of five components. From the tilt angle of the SD FROG trace, the pulse emitting at 267 nm was found to be positively chirped by a group delay dispersion (GDD) of 1500 fs2, and was eventually extended to 147 fs. The trace retrieved from the observed data using the standard SD FROG algorithm is shown in Figure 3B. The result of the retrieved trace was very similar to the observed one, with a FROG error of 0.86%. The temporal profile was then calculated, the result of which is shown in Figure 4. A train of pulses was generated, and the spacing between the pulses was 8 fs, corresponding to the vibrational period of molecular hydrogen (a reciprocal value of the vibrational energy of 4155 cm−1). This result suggests that coherent Raman sidebands were generated as the result of the molecular phase modulation of hydrogen by the two-color pump beam, and the frequency modulation of the probe pulse. The pulse width in the train, which was calculated by a half width at half maximum (HWHM), was ca. 4 fs at nearly the center of the pulse. The value calculated from the shifted baseline was 2.6 fs at around 25 fs in Figure 4. These results suggest that the intensities of the spectral components (240, 267, 300 nm) are very different from each other, and that the three pulses are not temporarily (or spatially) overlapped, resulting in the generation of short optical pulses only at around 25 fs where the three components would have a flat intensity distribution due to a slight mismatch in the temporal overlap. In fact, the relative intensities of the Raman sidebands (Stokes and anti-Stokes) against the intensity of the probe beam in the retrieved spectrum are much smaller than those in the observed data (cf. Figure 2B), suggesting that the temporal and spatial overlaps are not sufficient among the pulses.
3.3. Relative Phases among Raman Sidebands
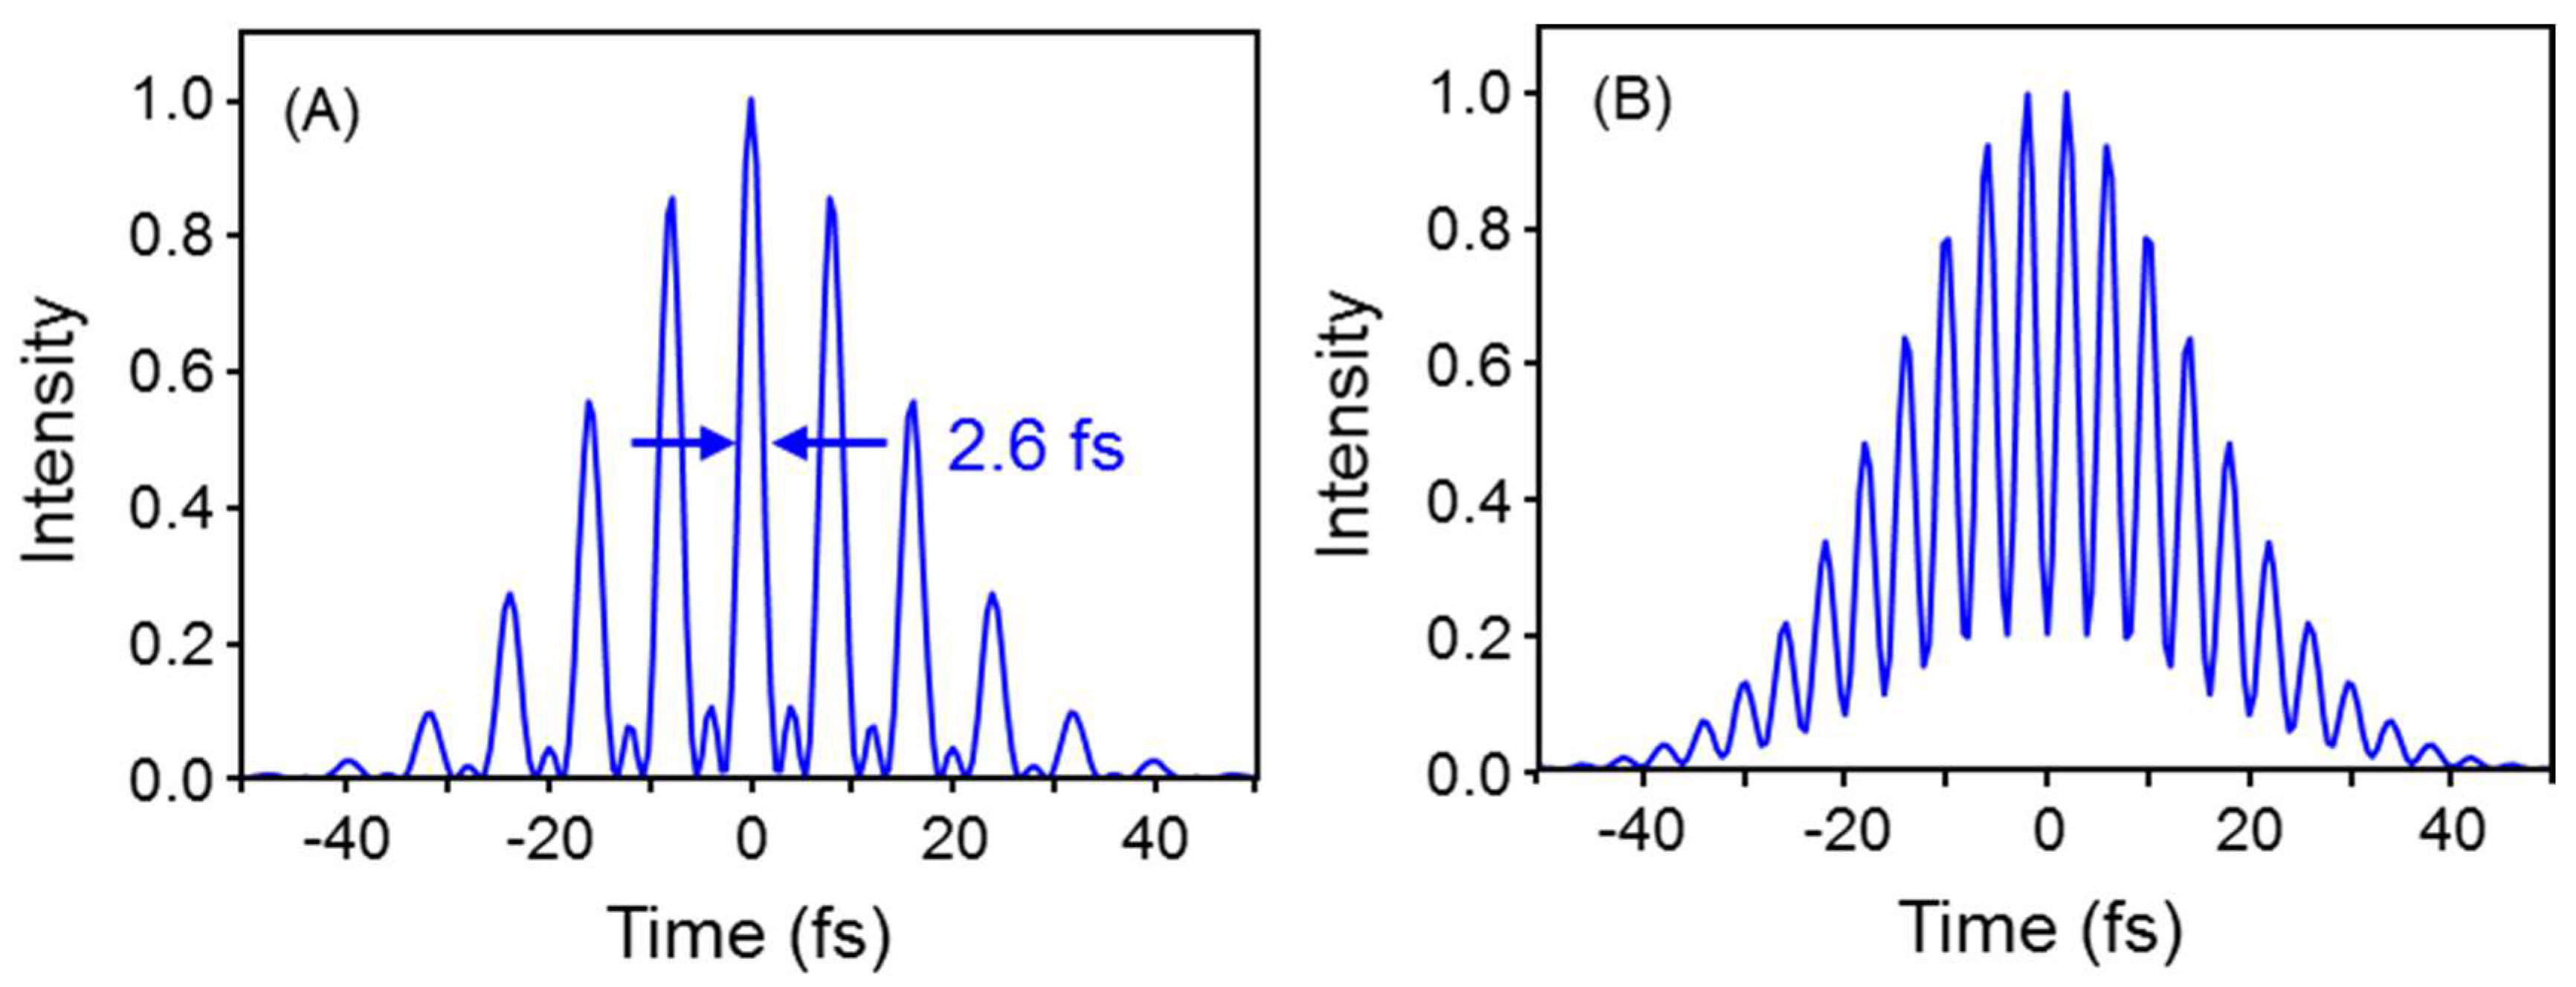
The Raman sidebands can be generated under phase-matched conditions in four-wave mixing [23]. It should be noted that the relative phases among these emission lines plays an important role in the temporal shape of the synthesized pulse. Figure 5A shows the temporal shape of the pulse calculated under the assumption that the relative phase is zero (ideal case). A train of 2.6-fs pulses can be observed with a spacing of 8 fs in the envelope of the laser pulse (35 fs). On the other hand, the data calculated under the assumption that the relative phase is shifted by π, 0, 0 for the beams emitting at 240, 267, and 300 nm is shown in Figure 5B. A train of 2.6-fs pulses with a spacing of 4 fs is generated. These data suggest that controlling the relative phases of the emissions is desirable for generating short optical pulses with a sufficient spacing, as mentioned in the following section.
Figure 6 shows the calculated FROG trace, in which three transform-limited pulses (240, 267, 300 nm) are assumed to have equal intensities. Seven components appear in the trace, and five, which appear at 342, 300, 267, 240, 219 nm, have fringe patterns separated by 8 fs. Table 1 shows the origins for these seven components.
Note that the components appearing at 200 and 400 nm are generated with a single pair of weak components emitting at 240/240 nm and 300/300 nm, respectively. As a result, only the weak component with no fringe pattern was observed in the trace. These weak signals would likely be buried in the noise, when the intensities of the Raman sidebands are relatively small against the intensity of the probe beam. It should be noted that the SD FROG signal appears through a third-order, nonlinear process, and decreases significantly at low emission intensities. For the other five components, more than two origins contribute to the appearance of the components, which explains the generation of fringe patterns. Note that at least two components emitting at 267 nm are required for the generation of the SD signal. Thus, these components were clearly observed in the trace. In order to generate the fringe pattern, the intensity of the pulses emitting at 240, 267, and 300 nm should be nearly equal. In this study, the probe pulse (267 nm) was attenuated by replacing the pair of aluminum mirrors used in the roof mirror with gold mirrors, which have a lower reflectivity in the DUV region. The relative intensity distribution was measured to be 45:100:53 for the emissions at 240, 267, and 300 nm using the spectrometer, which is nearly ideal for a Fourier synthesis of the emissions to generate short optical pulses.
3.4. Phase Control of the Raman Sidebands
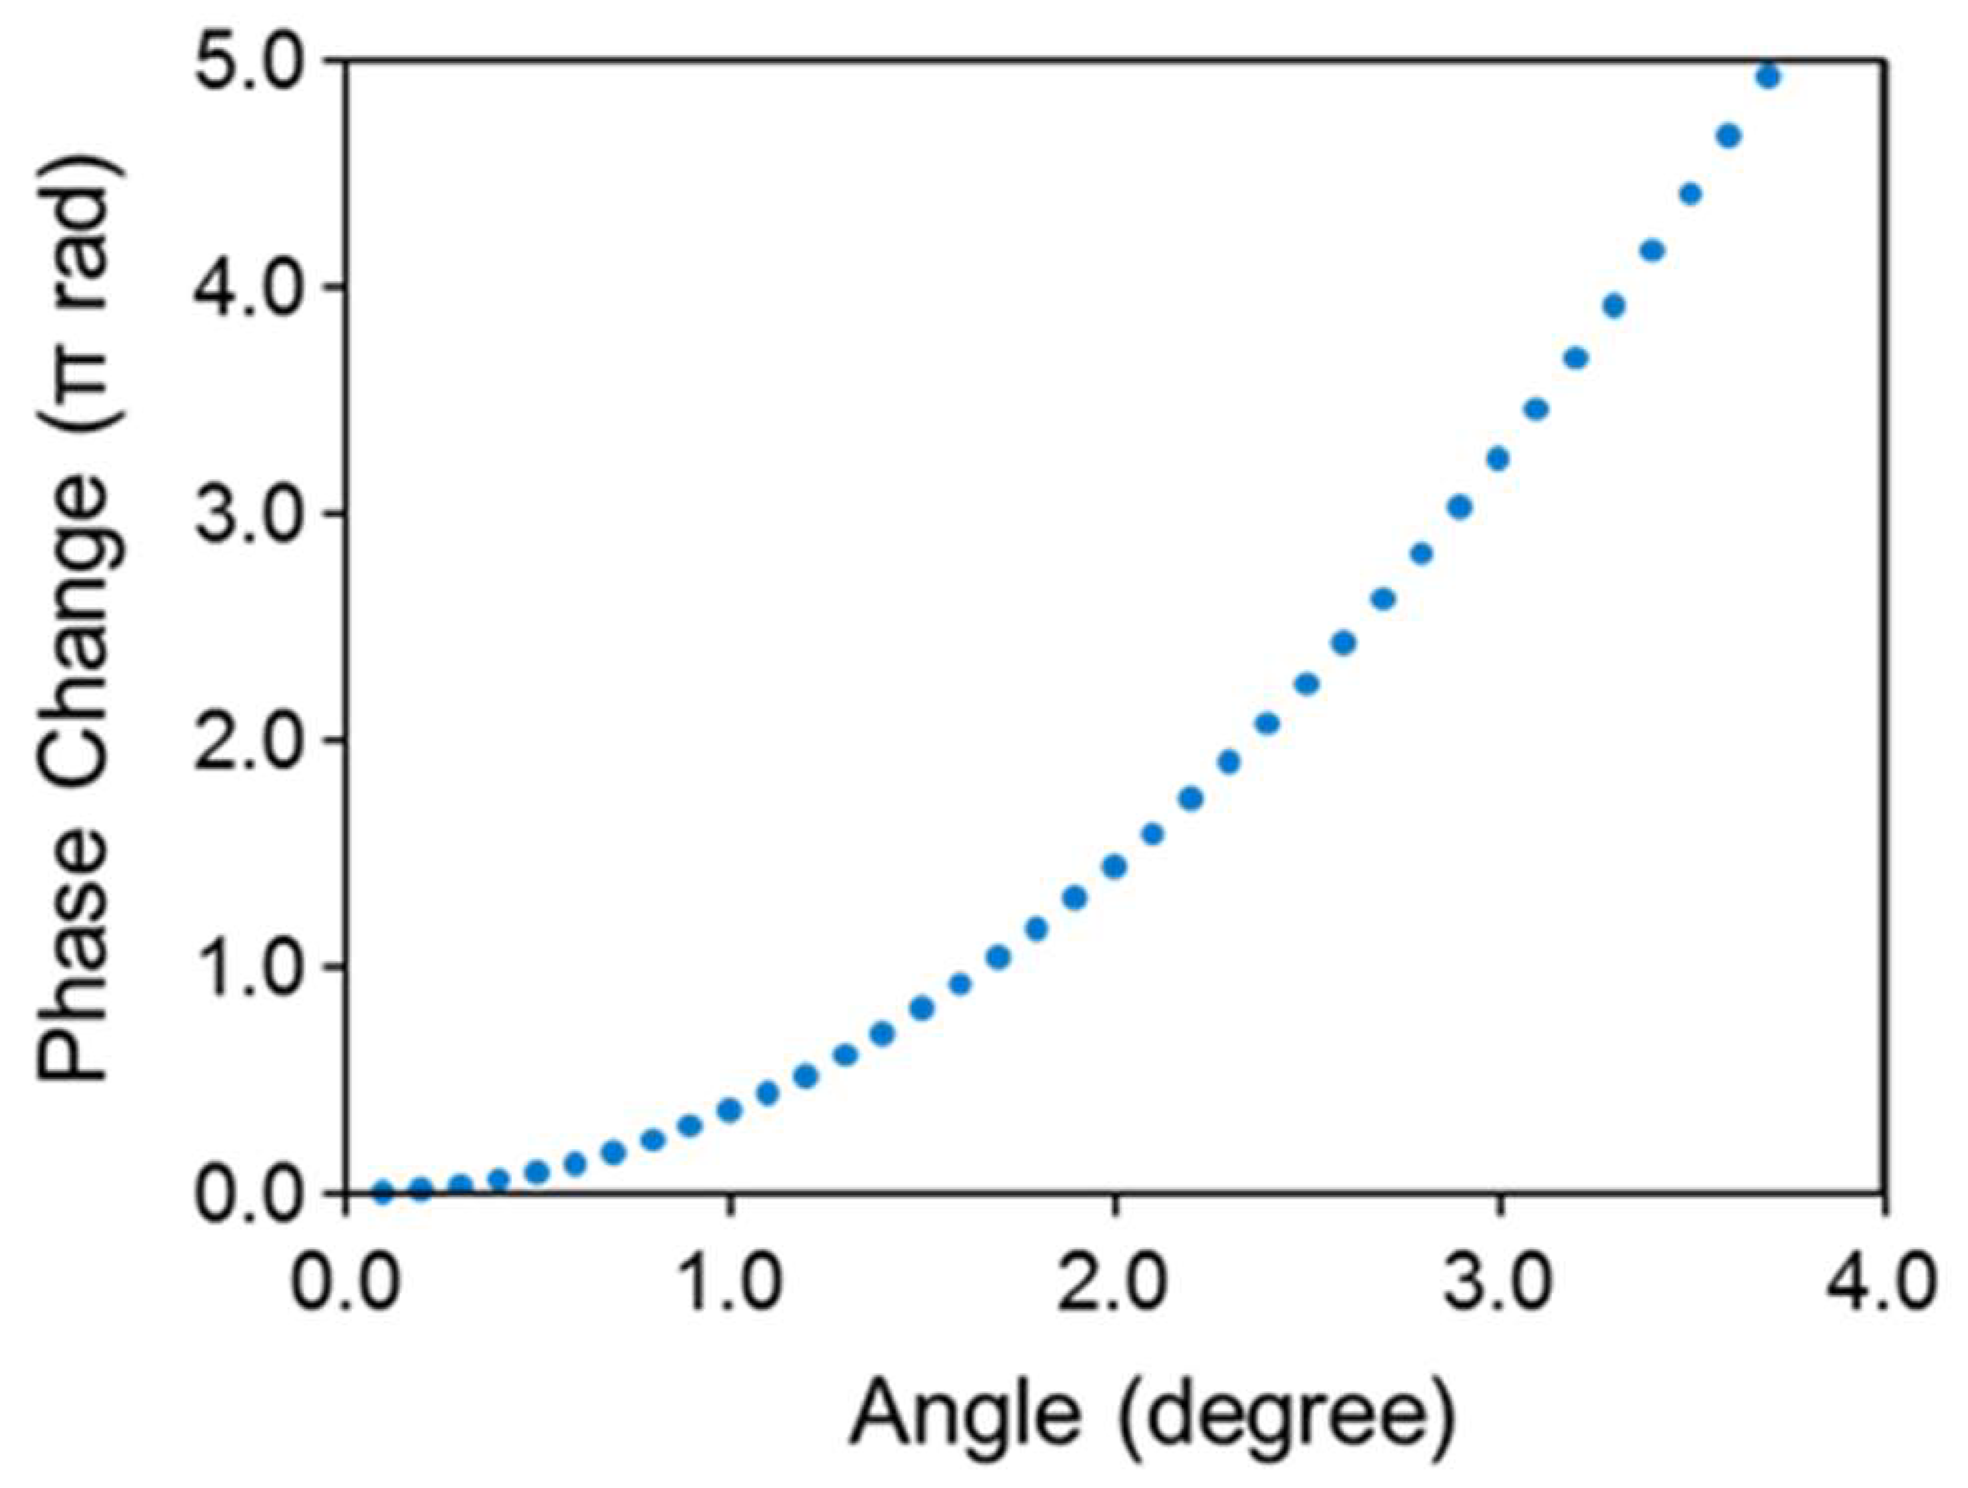
FROG traces calculated under different relative phases are shown in Figure 7. These data suggest that the relative phases can be evaluated from the fringe patterns observed in the FROG trace. In fact, a train of pulses with a spacing of 8 fs can be generated (see Figure 7A), as is shown in Figure 5A, which is in contrast to the generation of a train of pulses with a spacing of 4 fs (see Figure 7C), as is shown in Figure 5B. The dependence of the angle of the CaF2 plate inserted into the 267-nm beam on phase change was calculated, and the result is shown in Figure 8. These data suggest that the phase can be changed by more than 2π by changing the angle of the CaF2 plate from 0 to 3.7°. The fringe patterns observed for the components at 300 and 240 nm are shown in Figure 9. The observed data indicate that the emission lines are in phase, and produce a train of pulses, as shown in Figure 5A. An attempt was made to retrieve the FROG trace, but the 267-nm pulse was attenuated by ca. 10 fold. As a result, the SD FROG signal was reduced by ca. 1000 fold, thus preventing the FROG trace from being measured accurately. In addition, the spatial and temporal adjustments of the three beams emitting at 240, 257, and 300 nm became more difficult due to a small SD signal, which increased the FROG error. One of the approaches to solve this problem would be the use of a more sensitive transient grating (or cross-correlation) FROG system [24]. This approach was, however, not pursued in this study because of the complexity of the FROG system.
Note that the total number of fringes in the trace is much larger than the value predicted from calculations (see Figure 6), which can be attributed to the pulse width (ca. 170 fs) being expanded by the optics, such as the dichroic mirrors, and also by the air in the beam path of the Raman emissions. In order to generate a single optical pulse, it would be necessary to expand the spectral domain for the probe beam, e.g., the use of a <8-fs pulse with a negative chirp for pulse compression by the optical components and the air in the beam path. This approach would be applied for generating sub-femtosecond, or even attosecond pulses, with energy higher than 10 eV (<120 nm). Since it is difficult to generate a negatively-chirped pulse in the DUV region (e.g., no such chirp mirror is available), a positively-chirped probe pulse was prepared by passing the beam through the SiO2 plate, and the effect of chirping on the generation of Raman sidebands was examined. When the pulse width was increased to 50–220 fs, the efficiency for the generation of Raman sidebands was decreased by 25%, some (or most) of which can be attributed to a slight beam walk-off in the alignment of the laser beam. Thus, this type of approach using a (negatively) chirp pulse would be useful for pulse compression in the DUV region. It should be noted that the electric field of the optical pulse can be controlled by changing the carrier envelope phase of the fundamental laser, thus providing optimal performance in the applications such as high-order harmonic generation.
4. Conclusions
In this study, we report on the generation of Raman sidebands in the DUV region based on a pump-probe technique, and on an evaluation of the temporal shape using the SD FROG system. The observed fringe patterns indicate that the relative phases are locked in the process of four-wave Raman mixing, and can be controlled by changing the angle of the CaF2 plate that is inserted in the beam path. The data presented herein suggest that it is possible to generate a train of 2.6-fs optical pulses in the DUV region. A single 2.6-fs optical pulse could be generated by using a negatively-chirped <8 fs probe pulse, and by compressing the pulse by passing it through optical media with an optimized positive dispersion.
Author Contributions
Planning and supervision of the research: T.I., Performing the experiments: Y.M., Drafting the manuscript: T.I.
Acknowledgments
This research was supported by a Grant-in-Aid for Scientific Research from the Japan Society for the Promotion of Science [JSPS KAKENHI Grant Numbers JP26220806 and JP15K01227].
Conflicts of Interest
The authors declare no conflict of interest in this study.
References
- Imasaka, T. Gas chromatography/multiphoton ionization/time-of-flight mass spectrometry using a femtosecond laser. Anal. Bioanal. Chem. 2013, 405, 6907–6912. [Google Scholar] [CrossRef] [PubMed]
- Kouno, H.; Imasaka, T. The efficiencies of resonant and nonresonant multiphoton ionization in the femtosecond region. Analyst 2016, 141, 5274–5280. [Google Scholar] [CrossRef] [PubMed]
- Durfee, C.G.; Backus, S.; Kapteyn, H.C.; Murnane, M.M. Intense 8-fs pulse generation in the deep ultraviolet. Opt. Lett. 1999, 24, 697–699. [Google Scholar] [CrossRef] [PubMed]
- Trushin, S.A.; Kosma, K.; Fuß, W.; Schmid, W.E. Sub-10-fs supercontinuum radiation generated by filamentation of few-cycle 800 nm pulses in argon. Opt. Lett. 2007, 32, 2432–2434. [Google Scholar] [CrossRef] [PubMed]
- Ghotbi, M.; Trabs, P.; Beutler, M. Generation of high-energy, sub-20-fs pulses in the deep ultraviolet by using spectral broadening during filamentation in argon. Opt. Lett. 2011, 36, 463–465. [Google Scholar] [CrossRef] [PubMed]
- Adachi, S.; Suzuki, T. Self-compression of femtosecond deep-ultraviolet pulses by filamentation in krypton. Opt. Lett. 2017, 42, 1883–1886. [Google Scholar] [CrossRef] [PubMed]
- Noack, F.; Steinkellner, O.; Tzankov, P.; Ritze, H.-H.; Herrmann, J.; Kida, Y. Generation of sub-30 fs ultraviolet pulses by Raman induced phase modulation in nitrogen. Opt. Express 2005, 13, 2467–2474. [Google Scholar] [CrossRef] [PubMed]
- Fuji, T.; Horio, T.; Suzuki, T. Generation of 12 fs deep-ultraviolet pulses by four-wave mixing through filamentation in neon gas. Opt. Lett. 2007, 32, 2481–2483. [Google Scholar] [CrossRef] [PubMed]
- Kida, Y.; Liu, J.; Teramoto, T.; Kobayashi, T. Sub-10 fs deep-ultraviolet pulses generated by chirped-pulse four-wave mixing. Opt. Lett. 2010, 35, 1807–1809. [Google Scholar] [CrossRef] [PubMed]
- Beutler, M.; Ghotbi, M.; Noack, F. Generation of intense sub-20-fs vacuum ultraviolet pulses compressed by material dispersion. Opt. Lett. 2011, 36, 3726–3728. [Google Scholar] [CrossRef] [PubMed]
- Graf, U.; Fieß, M.; Schultze, M.; Kienberger, R.; Krausz, F.; Goulielmakis, E. Intense few-cycle light pulses in the deep ultraviolet. Opt. Express 2008, 16, 18956–18963. [Google Scholar] [CrossRef] [PubMed]
- Reiter, F.; Graf, U.; Schultze, M.; Schweinberger, W.; Schröder, H.; Karpowicz, N.; Azzeer, A.M.; Kienberger, R.; Krausz, F.; Goulielmakis, E. Generation of sub-3 fs pulses in the deep ultraviolet. Opt. Lett. 2010, 35, 2248–2250. [Google Scholar] [CrossRef] [PubMed]
- Belli, F.; Abdolvand, A.; Chang, W.; Travers, J.C.; Russell, P.S.J. Vacuum-ultraviolet to infrared supercontinuum in hydrogen-filled photonic crystal fiber. Optica 2015, 2, 292–300. [Google Scholar] [CrossRef]
- Sollapur, R.; Kartashov, D.; Zürch, M.; Hoffmann, A.; Grigorova, T.; Sauer, G.; Hartung, A.; Schwuchow, A.; Bierlich, J.; Kobelke, J.; et al. Resonance-enhanced multi-octave supercontinuum generation in antiresonant hollow-core fibers. Light Sci. Appl. 2017, 6, e17124. [Google Scholar] [CrossRef]
- Imasaka, T.; Kawasaki, S.; Ishibashi, N. Generation of more than 40 laser emission lines from the ultraviolet to the visible regions by two-color stimulated Raman effect. Appl. Phys. B 1989, 49, 389–392. [Google Scholar] [CrossRef]
- Shverdin, M.; Walker, D.; Yavuz, D.; Yin, G.; Harris, S. Generation of a single-cycle optical pulse. Phys. Rev. Lett. 2005, 94, 033904. [Google Scholar] [CrossRef] [PubMed]
- Chan, H.-S.; Hsieh, Z.-M.; Liang, W.-H.; Kung, A.H.; Lee, C.-K.; Lai, C.-J.; Pan, R.-P.; Peng, L.-H. Synthesis and measurement of ultrafast waveforms from five discrete optical harmonics. Science 2011, 331, 1165–1168. [Google Scholar] [CrossRef] [PubMed]
- Kida, Y.; Sakamoto, K.; Imasaka, T. High-energy multicolor femtosecond pulses in the deep-ultraviolet generated through four-wave mixing induced by three-color pulses. Appl. Phys. B 2016, 122, 214. [Google Scholar] [CrossRef]
- Vu, D.; Nguyen, T.N.; Imasaka, T. Generation of a femtosecond vacuum ultraviolet optical pulse by four-wave Raman mixing. Opt. Laser Technol. 2017, 88, 184–187. [Google Scholar] [CrossRef]
- Nighan, W.L., Jr.; Gong, T.; Liou, L.; Fauchet, P.M. Self-diffraction: A new method for characterization of ultrashort pulses. Opt. Commun. 1989, 69, 339–344. [Google Scholar] [CrossRef]
- Kane, D.J.; Trebino, R. Characterization of arbitrary femtosecond pulses using frequency-resolved optical gating. IEEE J. Quantum Electron. 1993, 29, 571–579. [Google Scholar] [CrossRef]
- Trebino, R. Frequency-Resolved Optical Gating: The Measurement of Ultrashort Laser Pulses; Kluwer Academic Publishers: Dordrecht, The Netherlands, 2002. [Google Scholar]
- Aussenegg, F.R.; Lippitsch, M.E.; Brandmüller, J.; Nitsch, W. Collinear and noncollinear emission of anti-stokes and second order stokes Raman radiation. Opt. Commun. 1981, 37, 59–66. [Google Scholar] [CrossRef]
- Nagy, T.; Simon, P. Single-shot TG FROG for the characterization of ultrashort DUV pulses. Opt. Express 2009, 17, 8144–8151. [Google Scholar] [CrossRef] [PubMed]
Figure 1.
Experimental apparatus for (A) the generation and (B) the evaluation of Raman sidebands.

Figure 2.
Emission spectrum for the Raman sidebands. Red, observed data; black, retrieved spectrum; blue, retrieved phase.
Figure 2.
Emission spectrum for the Raman sidebands. Red, observed data; black, retrieved spectrum; blue, retrieved phase.
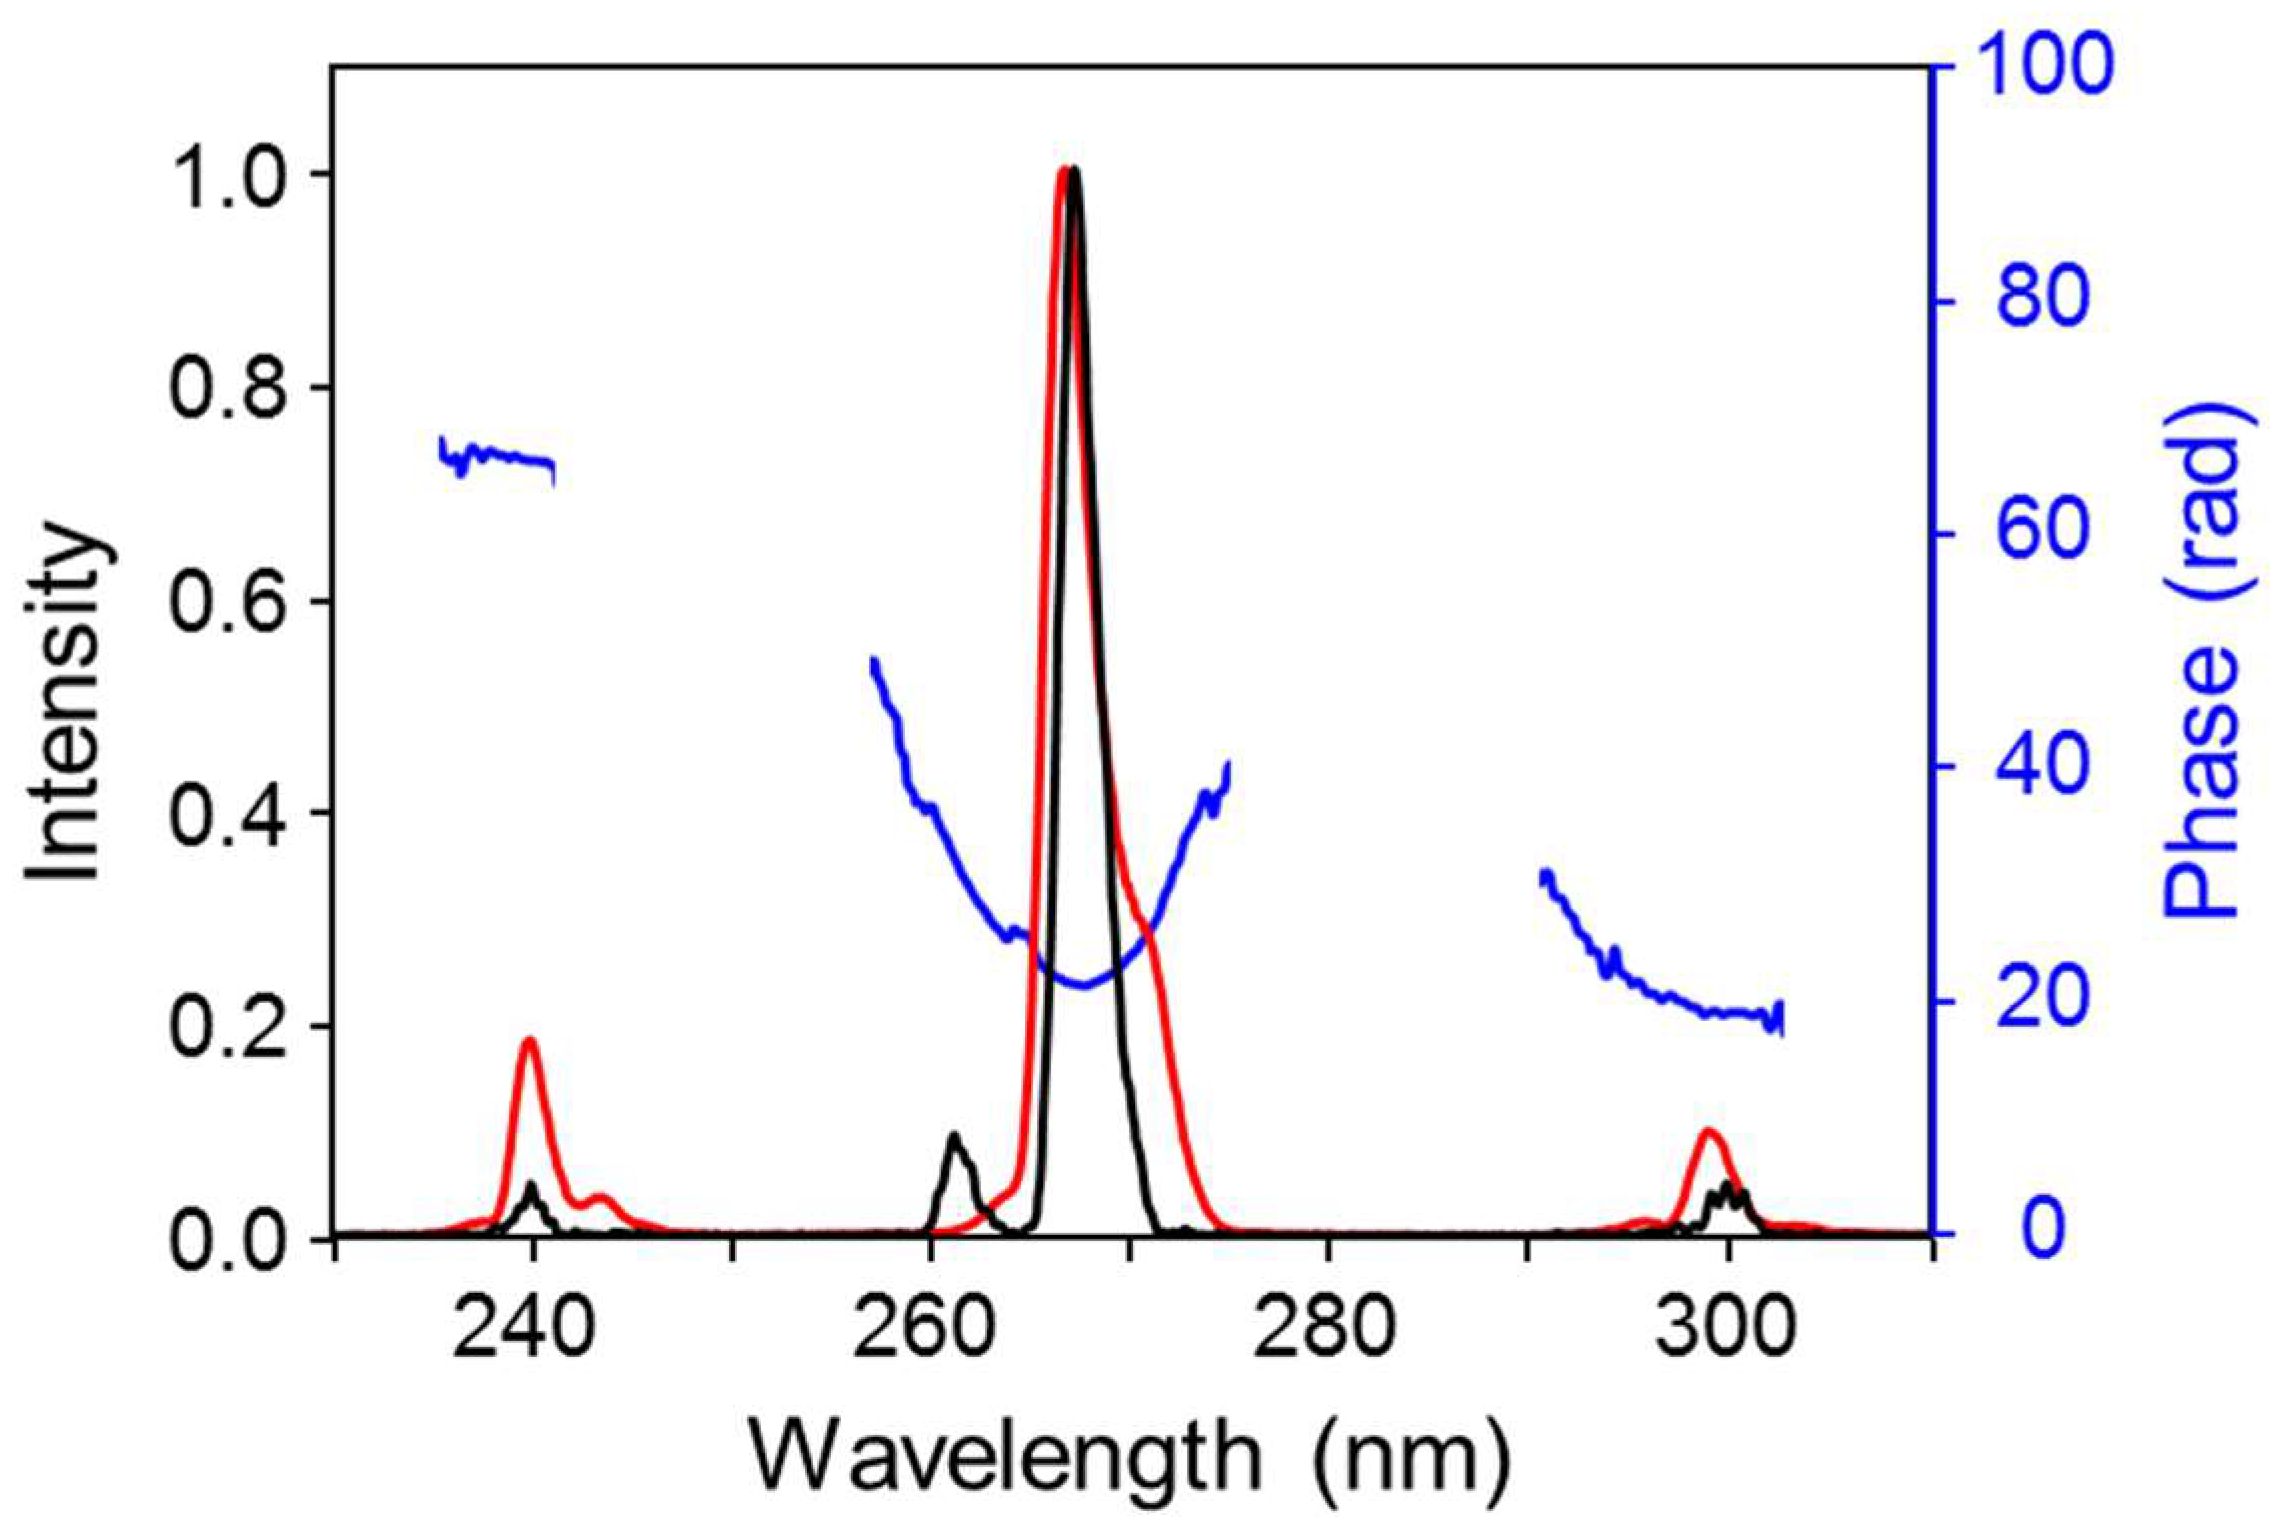
Figure 3.
FROG trace. (A) Original data (B) retrieved data. A fused silica plate (10 μm) was used as the SD material.
Figure 3.
FROG trace. (A) Original data (B) retrieved data. A fused silica plate (10 μm) was used as the SD material.

Figure 4.
Temporal profile of the pulse train (black curve) and the phase of the pulse (blue curve).
Figure 4.
Temporal profile of the pulse train (black curve) and the phase of the pulse (blue curve).

Figure 5.
Temporal profile of the pulse train. (A) No phase shift (B) phase for the anti-Stokes emission is shifted by π at 240 nm.
Figure 5.
Temporal profile of the pulse train. (A) No phase shift (B) phase for the anti-Stokes emission is shifted by π at 240 nm.

Figure 6.
Calculated FROG trace.
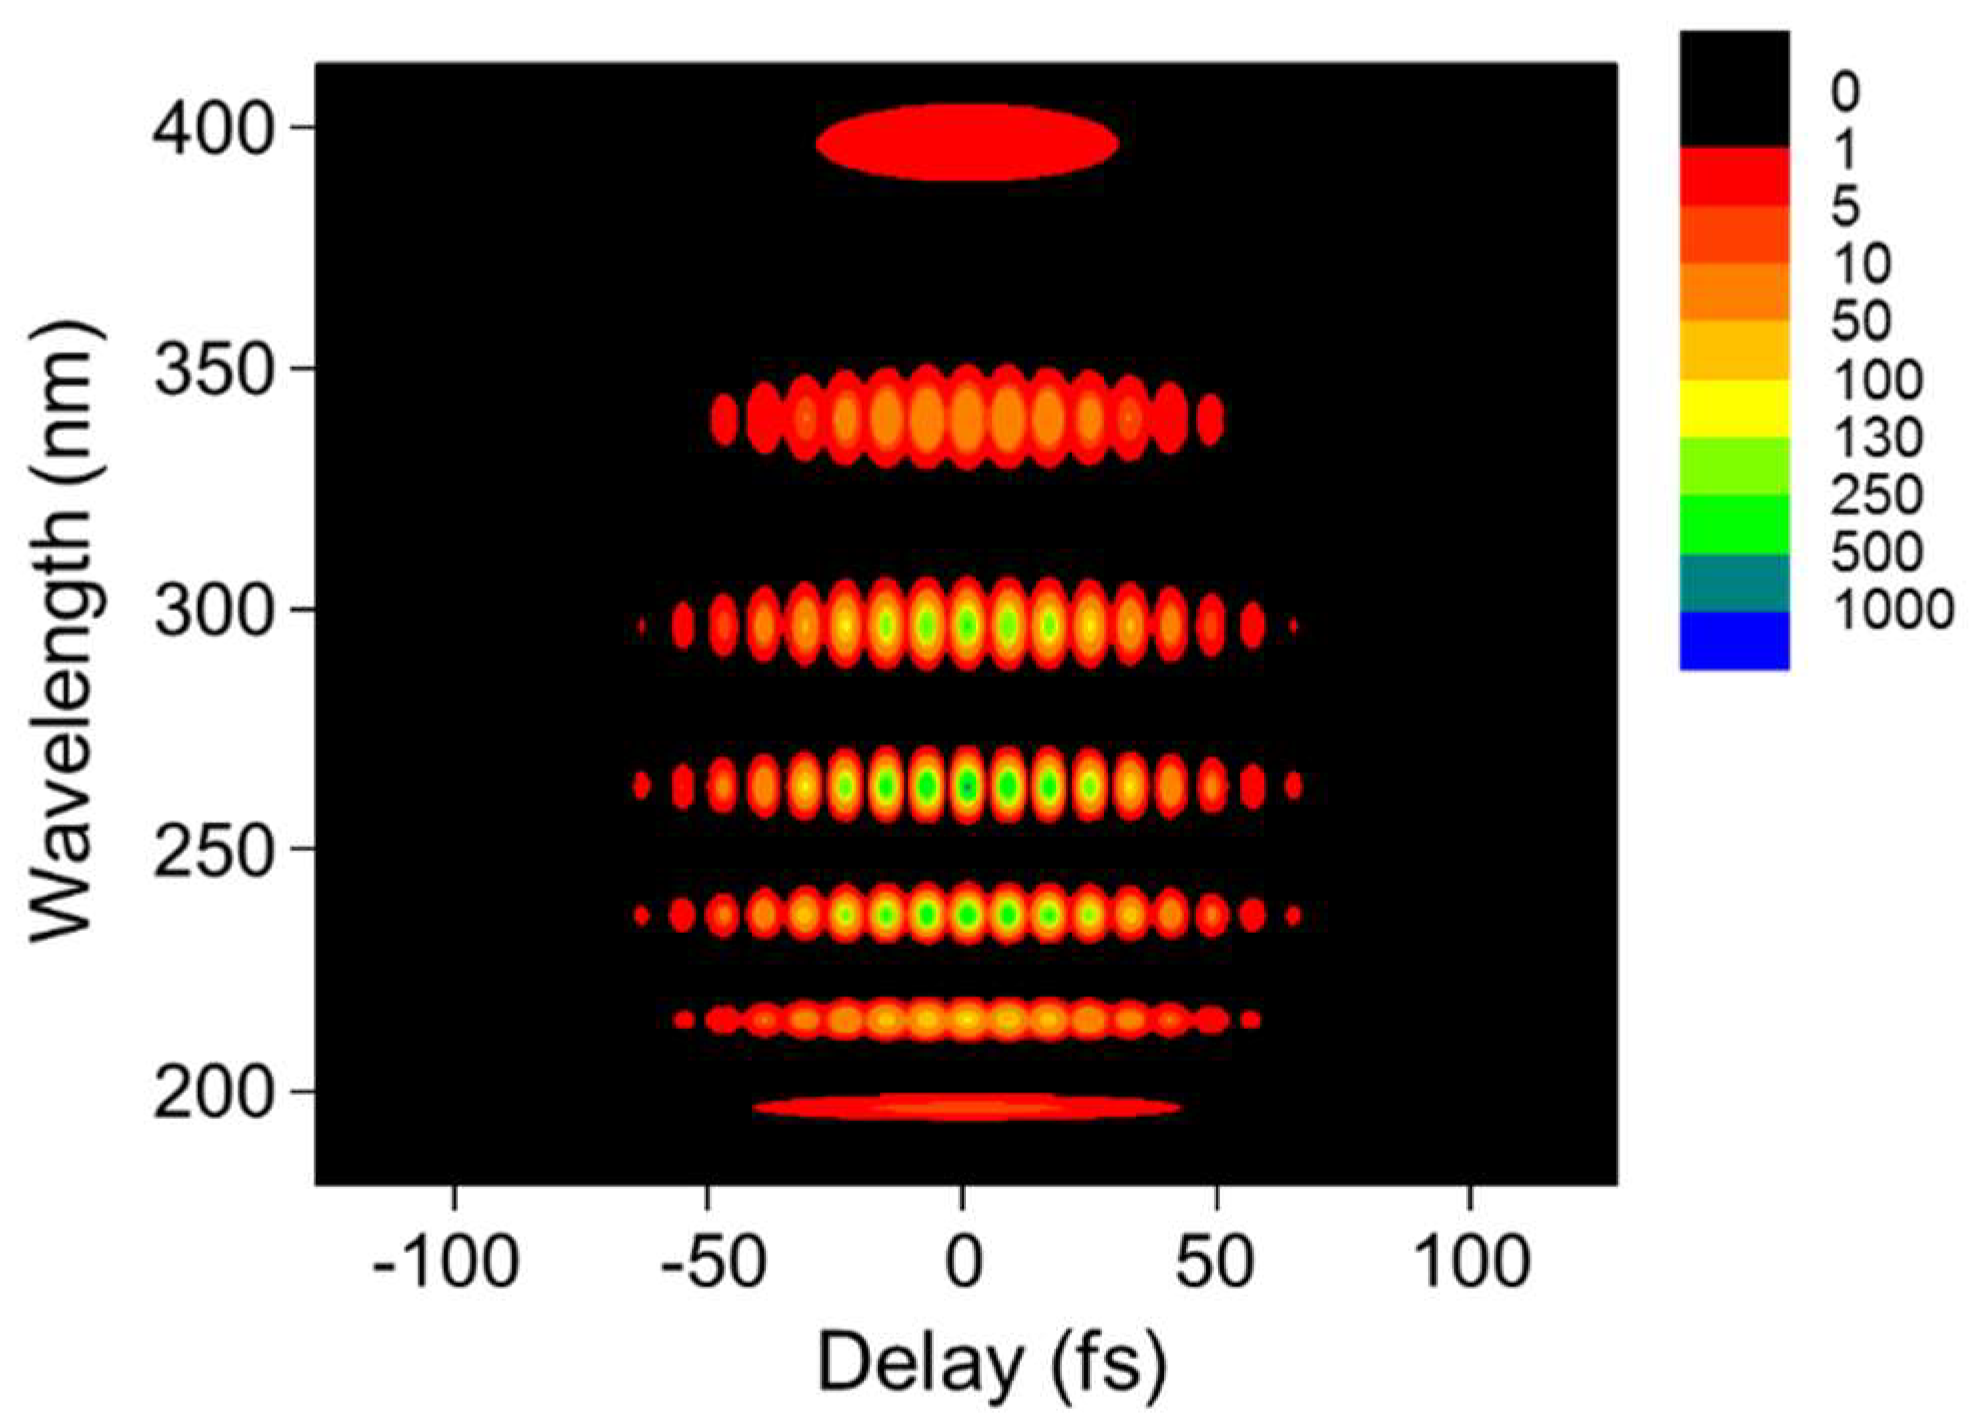
Figure 7.
FROG traces calculated under different relative phase. (A) 0, 0, 0 (B) π/2, 0, 0 (C) π, 0, 0 (D) 3π/2, 0, 0.
Figure 7.
FROG traces calculated under different relative phase. (A) 0, 0, 0 (B) π/2, 0, 0 (C) π, 0, 0 (D) 3π/2, 0, 0.
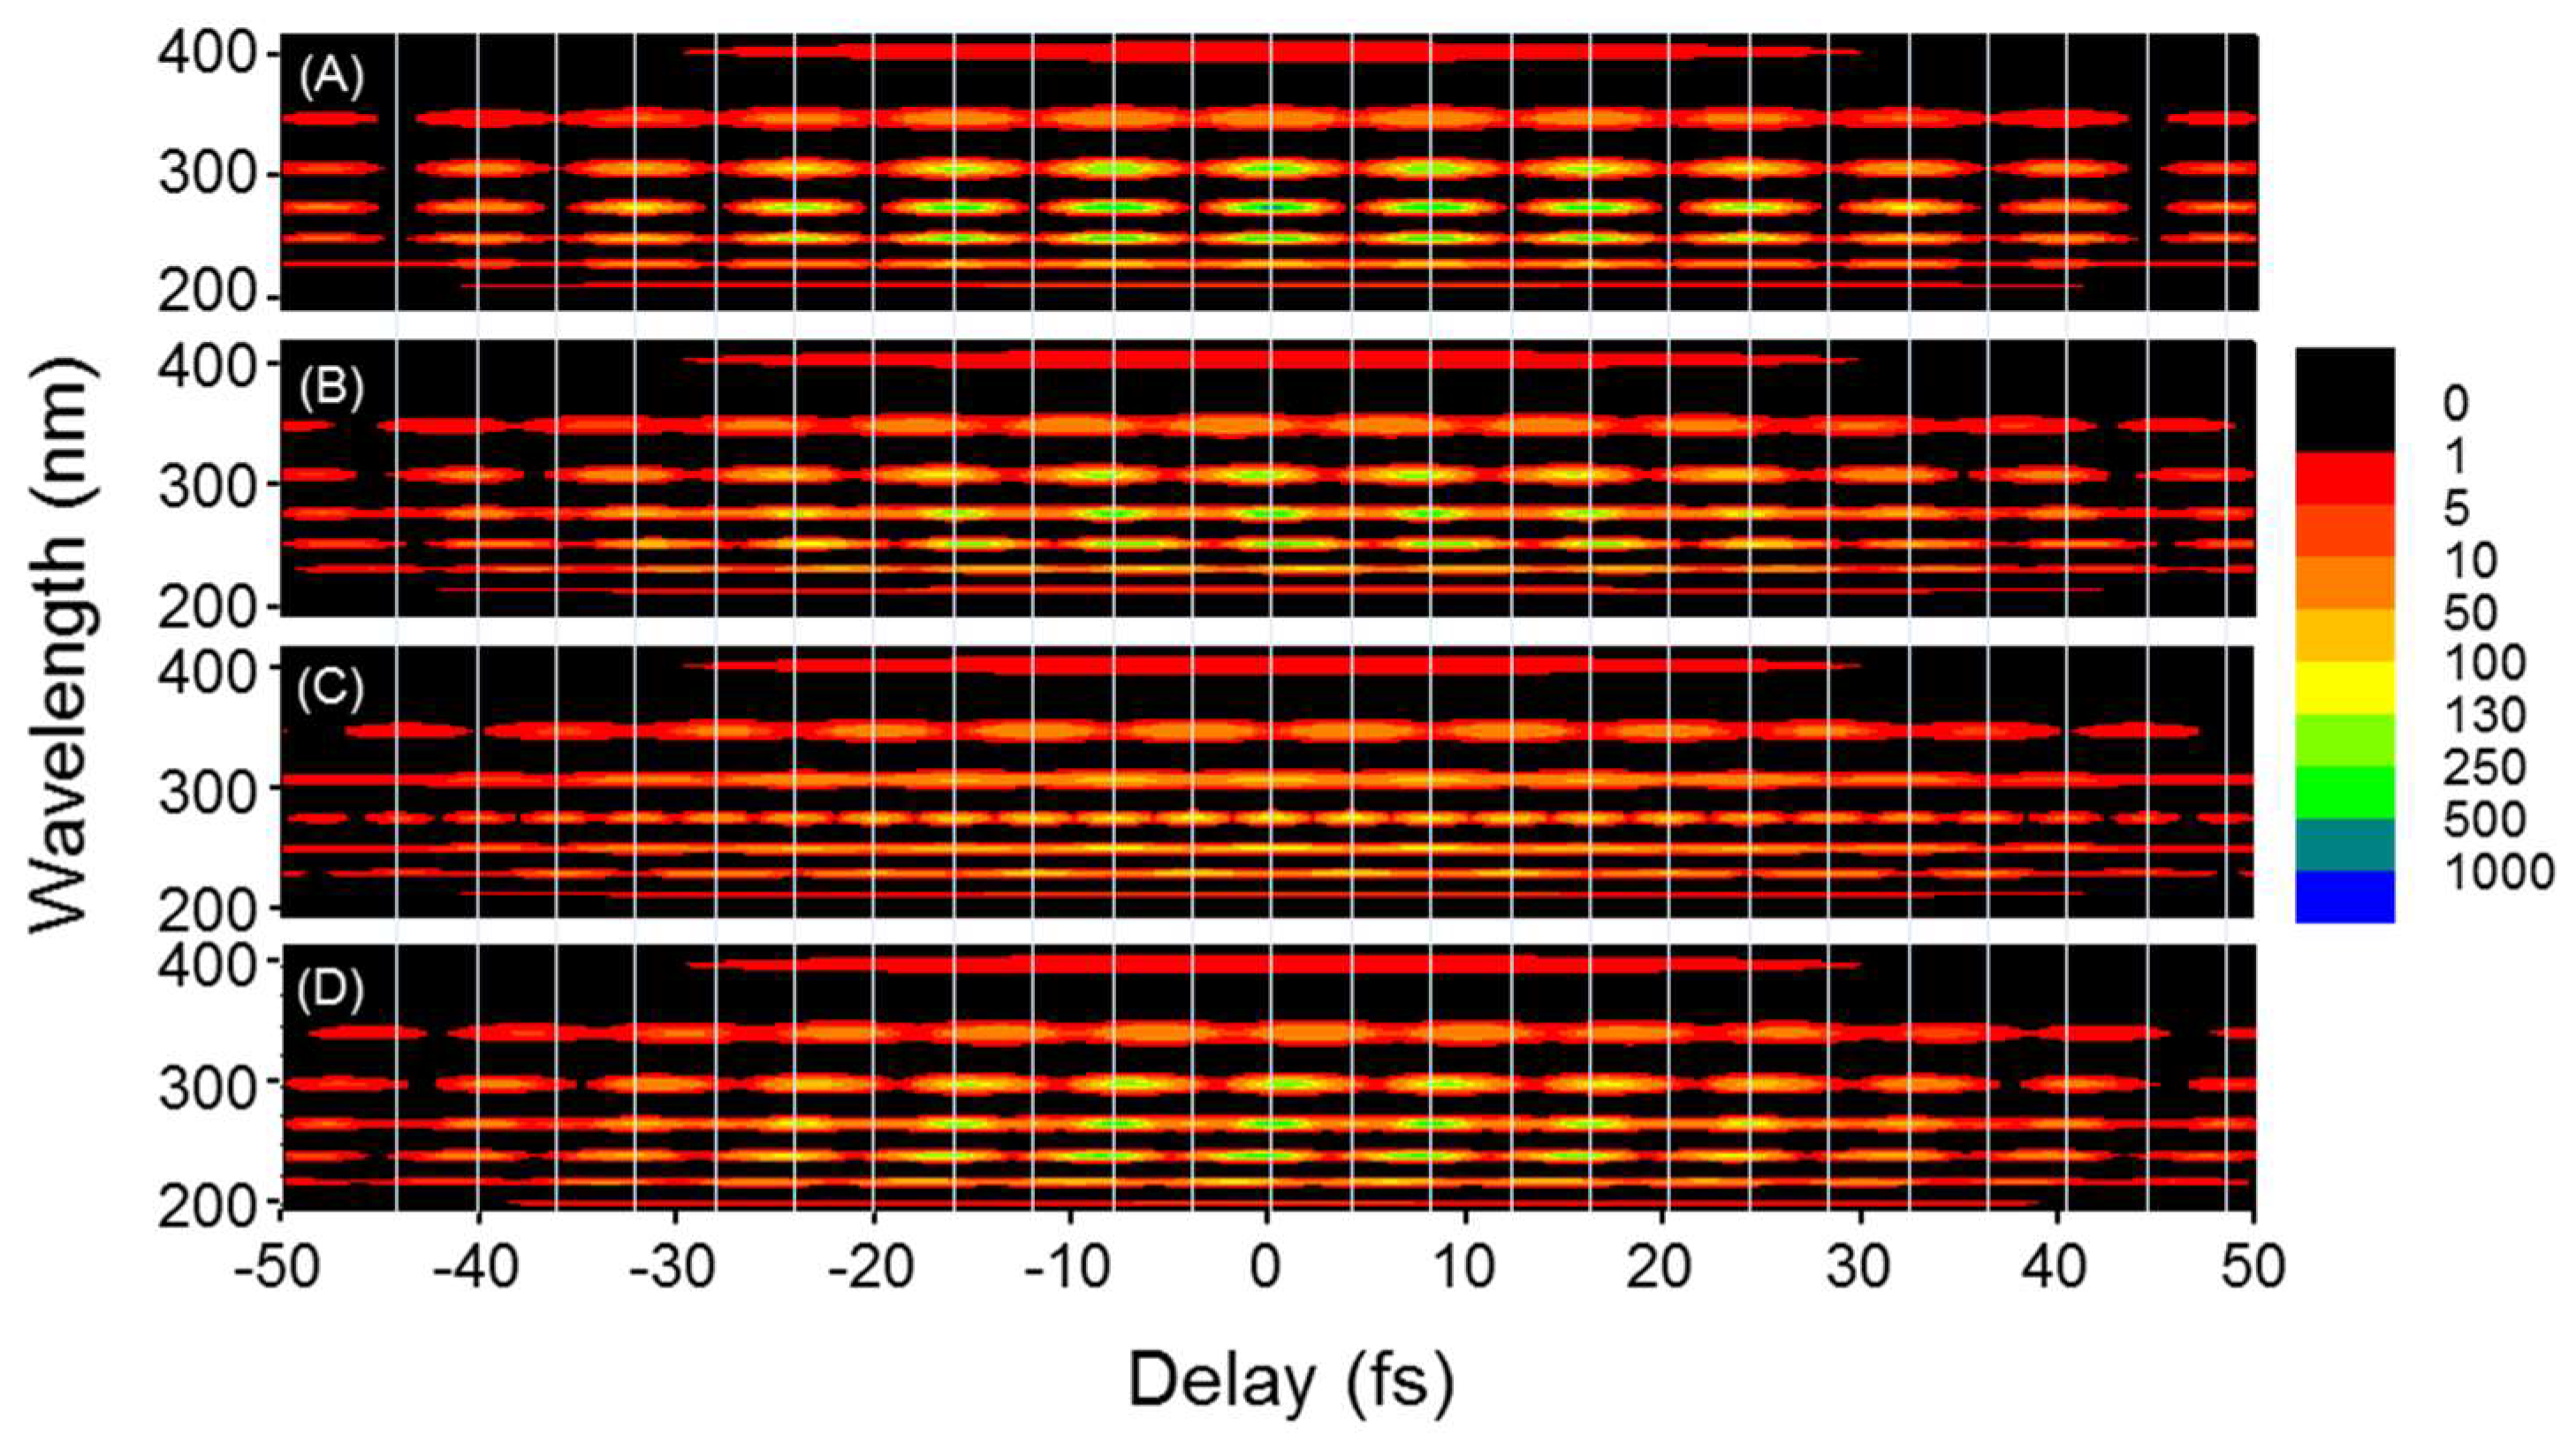
Figure 8.
Dependence of the angle of CaF2 plate on the phase change.

Figure 9.
Expanded views of the FROG trace in (A) Stokes (B) anti-Stokes regions shown in Figure 3A. The interference fringe patterns are more clearly seen by expansion of the picture. A sapphire plate (0.1 mm) was used as the SD material. White lines are drawn to indicate a spacing of 8 fs. A periodic structure suggests a sufficient stability of the relative phases of the Raman sidebands.


Table 1.
Origins for the generation of the components in the FROG trace.
| Component | Origin | Component | Origin |
|---|---|---|---|
| Wavelength (nm) | (Wavelength, nm) | Wavelength (nm) | (Wavelength, nm) |
| 400 | 300 + 300 − 240 | 267 | 267 + 240 − 240 |
| 342 | 300 + 300 − 267 | - | 240 + 300 − 267 |
| - | 300 + 267 − 240 | 240 | 300 + 240 − 300 |
| 300 | 300 + 300 − 300 | - | 267 + 267 − 300 |
| - | 300 + 267 − 267 | - | 267 + 240 − 267 |
| - | 267 + 267 − 240 | - | 240 + 240 − 240 |
| - | 240 + 300 − 240 | 219 | 267 + 240 − 300 |
| 267 | 267 + 300 − 300 | - | 240 + 240 − 267 |
| - | 267 + 267 − 267 | 200 | 240 + 240 − 300 |
© 2018 by the authors. Licensee MDPI, Basel, Switzerland. This article is an open access article distributed under the terms and conditions of the Creative Commons Attribution (CC BY) license (http://creativecommons.org/licenses/by/4.0/).
Share and Cite
MDPI and ACS Style
Mori, Y.; Imasaka, T. Generation of Ultrashort Optical Pulses in the Deep-Ultraviolet Region Based on Four-Wave Raman Mixing. Appl. Sci. 2018, 8, 784. https://doi.org/10.3390/app8050784
AMA Style
Mori Y, Imasaka T. Generation of Ultrashort Optical Pulses in the Deep-Ultraviolet Region Based on Four-Wave Raman Mixing. Applied Sciences. 2018; 8(5):784. https://doi.org/10.3390/app8050784
Chicago/Turabian StyleMori, Yoshifumi, and Totaro Imasaka. 2018. "Generation of Ultrashort Optical Pulses in the Deep-Ultraviolet Region Based on Four-Wave Raman Mixing" Applied Sciences 8, no. 5: 784. https://doi.org/10.3390/app8050784
Note that from the first issue of 2016, this journal uses article numbers instead of page numbers. See further details here.