Empirical Evaluation of Rock Mass Rating and Tunneling Quality Index System for Tunnel Support Design

Department of Civil and Environmental Engineering, Hanyang University, 55 Hanyangdaehak-ro, Sangnok-gu, Ansan 426-791, Korea
*
Author to whom correspondence should be addressed.
Appl. Sci. 2018, 8(5), 782; https://doi.org/10.3390/app8050782
Submission received: 13 April 2018
/
Revised: 10 May 2018
/
Accepted: 10 May 2018
/
Published: 14 May 2018
Abstract
:The primary output of the rock mass rating (RMR) and tunneling quality index (Q) system is a preliminary tunnel support design, as these methods are empirically developed and updated for this purpose. In this study, these internationally accepted design tools are evaluated to improve results for tunnel support design. The rating system is simplified and improved for some parameters through the use of equations to replace the discrete/lump characterization with a continuous rating. Recent developments in characterization and support are used in proposing the back analysis approach of rock mass quality calculation from tunnel span and installed support. This approach is used for two tunnel projects which experience high stresses. Approximately 90% of the tunnel sections show that actual supports have rock bolt spacing and shotcrete thickness which are heavier than those indicated by RMR89, indicating a system limitation. Another assessment using RMR14 indicates that its rating is higher than that of RMR89. A strong correlation exists between them, as supported by the literature and data from analyses of 462 tunnel sections. Despite its new version, RMR89 still preserves its importance. Evaluating the different correlations between RMR and Q through published data indicates that the rock mass fabric index gives comparatively better results.
1. Introduction
The first of the two main aspects in tunnel design that require focusing is a precise estimate of the probable ground condition and excavation behavior. The second aspect is the cost and safety assessment of the tunnel, which defines the support system. Rock mass characterization is used to address the first aspect, whereas the second one can be achieved by the proper classification of the rock mass excavation environment. A number of rock mass classification systems have been developed since Terzaghi pioneered his study on the rock load factor classification for tunnel support design [1]. Among these several rock mass classification systems, rock mass rating (RMR) and tunneling quality index (Q) are internationally accepted systems for support design that are widely used in the field of tunneling [2,3,4].
The RMR classification was proposed in 1973 as a jointed rock classification system [5]. It was refined several times, and major revisions in its characterization and structure were made in 1989 and 2014 [6,7]. The Q system was developed in 1974 [8], and major changes in its characterization and classification were proposed in 1993 and 2002 [9,10]. It was developed based on tunneling cases for hard and jointed rock mass [11]. The main objective of these classifications was preliminary support design. Over time, the two systems have been refined and updated so as to improve their reliability for tunnel support design. The benefits from the use of these empirical design tools in tunneling include simplicity, economy, reliability, and being a time-tested approach [12].
In rock mass classification, rock mass characterization is critical. These classifications are the back-bone of the empirical design methods [13,14]. The characterization of the rock mass deserves adequate attention and should be performed as per defined procedures of each system. The recent developments in tunnel support design in terms of shotcrete thickness and rock bolt spacing eliminate personal judgment in design [11,15], and this is only possible as a result of proper rock mass characterization and classification. In engineering applications, particularly for tunnel support, RMR and Q systems should not be used independently, and at least two different systems should be used for evaluation; further, the correlation between them should be verified [2,16].
In this study, the reliability of RMR and Q classification system for tunnel support design is evaluated. A simple but precise characterization through the use of equations are proposed for the calculation of rock mass quality as per the suggestion of RMR and Q systems. The role of RMR89 in RMR14 is highlighted, and a correlation between them is proposed based on data from 462 sections of two tunnel projects. The back analysis approach is introduced for rock mass quality calculation. Moreover, the use and limitation of these two systems for support design is described and evaluated through published data. The correlation reliability is also assessed.
2. Materials and Methods
2.1. Materials and Description of Projects
In this section, a brief overview of two projects, the Lawari Tunnel (Project 1) and Neelum Jhelum Hydropower project (Project 2), are given. The 8.5-km long Lawari Rail Tunnel (LRT) project, now termed the Modified Road Tunnel (MRT), is the only ultra-long road tunnel in Pakistan. The original plan involved a rail tunnel that was proposed with a small cross-sectional area termed as LRT. After the completion of the excavation work in 2009, the same tunnel was chosen for trade with Central Asia, and the horseshoe tunnel was enlarged for two-way road traffic. This was termed as MRT (11.17 m in span) and was completed at the start of 2016.
The Neelum Jhelum Hydropower project (Project 2) comprises a headrace tunnel with a total length of 28.5 km, which is a combination of single and twin tunnels. These tunnels pass through the Murre formation, which includes alternating beds of sandstone, siltstone, mudstone, and shale. The initial sections of the twin tunnels are excavated in sandstone (9.68 m in span) by the conventional method (drill and blast method).
2.2. Rock Mass Characterization and Classification
By definition, rock mass characterization is the quantifying process of important parameters governing rock mass behavior during tunneling, whereas rock mass classification is the assessment of rock mass quality according to a predefined system [14]. Ground conditions (rock mass, stresses, and water) are responsible for the ground behavior, along with project-related features [17]. The ability of the classification process to characterize ground conditions and the importance of including as many parameters as possible have been argued by Palmstorm and Stille [18]. Empirical design methods in tunneling are used as a result of rock mass characterization and classification. Rock mass classification systems attempt to consider the most important aspects affecting the rock mass in order to rate its quality. These aspects, which become parameters and whose ratings are assigned, are usually assumed to be independent of each other [19].
2.3. Characterization and Classification of Rock Mass Based on RMR89
The geomechanics classification system, also known the rock mass rating classification system, was developed by Z. T. Bieniawski [5]. This classification system has been continuously refined over several years, and its characterization criteria have been revised from its creation onwards [5,6,7,15,20,21,22,23], as summarized in Table 1. Major revisions to the system were proposed in 1989 [6]. These include new charts and tables, which were added for the rating of intact rock strength (σc), rock quality designation (RQD), discontinuities/joint spacing, and the condition of discontinuity parameters. The refined RMR system is termed as the RMR89 version. The basic RMR (RMRb) value is the sum of the ratings of five declared parameters. It includes the rating for intact rock strength (R1), RQD (R2), joint spacing (R3), joint condition (R4), and groundwater condition (R5). The RMR89 system is the result reached after adjusting RMRb for discontinuity orientation with respect to the tunnel orientation and excavation direction rating (R6). These six parameters describe the rock mass rating, RMR89, and the corresponding quality is obtained using Equation (1):
To date, RMR89 continues to be used in the tunneling field even after its latest version, called RMR14, was made effective. Although there are graphical approaches for the precise rating of RQD, intact rock strength and discontinuity spacing [6], most users select the discrete/lump rating values using the RMR89 table [24,25,26,27]. The continuous rating concept through using equations was introduced by Sen and Sadagah using the lump rating system of the RMR73. This reveals that the minimum value of the worst RMR value is 8 [28], but the worst is actually 0 in RMR89 [23].
The rating for intact rock strength (R1) is from 0 to 15. A rock with a uniaxial compressive strength (UCS) greater than 250 MPa is assigned maximum points, and that with less than 1 MPa is assigned minimum points. The continuous rating between them can be determined using Equation (2):
Since its development [29], RQD has been used in RMR and Q systems because of its historical background. Because of several inherent limitations, and ignoring the basic definition [4,30], this parameter is not used in the latest version of RMR. Along with the joint spacing, RQD was replaced by joint frequency [15]. It remains a mandatory parameter in the Q system. According to RMR89, the rating of RQD (R2) is from 3 to 20 based on the average values. For graphical rating, which is a more precise method of characterization, the range of RQD rating for RMR89 is clarified [23], and after this clarification the continuous rating of RQD can be determined from Equation (3):
The discontinuity spacing rating (R3) is applicable for a rock mass having three joint sets. When less than three sets of discontinuities are present, R3 should be increased by 30%. However, without this, a conservative assessment is performed [6]. Like RQD, the range of ratings for joint spacing is from 5 to 20 based on the average value. However, the range of graphical ratings for joint spacing in RMR89 is also clarified as with RQD [23], and after this clarification, the continuous rating of joint spacing (x) in RMR89 can be determined from Equation (4):
A modified criterion, introduced for RMRb calculation, replaced RQD and the discontinuity spacing by the number of joints per meter (frequency) in the excavation face. The joint frequency (λ) parameter, consisting of RQD and joint spacing parameters, is evaluated with the chart provided by Lowson and Bieniawski [15]. The joint spacing and RQD are functions of the fracture frequency and can be determined either directly or indirectly. The first indirect method used for fracture frequency determination is a mathematical equation between the fracture frequency and RQD, as given by Equation (5) [31]:
When data are available, both in terms of the number of joint sets and average spacing between joints of each joint set, the joint frequency is determined using Equation (6):
The continuous rating for joint frequency (R2–3) can be determined using Equation (7) for = 1–50. If the joint frequency is less than 1, the rating will be maximum, i.e., 40.
The joint condition term and its corresponding rating (R4) are the function of the discontinuity length (m), separation (mm), roughness, infilling (mm), and weathering. The rating R4 can be selected for RMR89 using the detail listed in Table 2, but some conditions are mutually exclusive; i.e., in the case of the infilling material, the roughness is overshadowed by the infilling influence [6]. However, this aspect is missing when calculating ratings for joint conditions [24]. The best approach to rating groundwater (R5) is to calculate its inflow rate. However, the general condition is usually used for this purpose. The rating for the joint orientation (R6) is the qualitative term and depends on the orientation of the main joint set with respect to the tunnel orientation and direction of excavation.
The modified criteria, as discussed above, show that RMR89 can be expressed in terms of five parameters and calculated using Equation (8):
The state of stress is barely considered in rock mass rating classification systems for tunneling. The RMR calculation practice [5,22] does not account for stress in tunneling, but an adjustment to the RMR89 rating is suggested for the stress condition (in situ stress and changes of stresses) when it is used for mining applications [6]. The case histories on which RMR89 is based show that tunnels are located at shallow depths and stress is not a major factor involved in the design of a tunnel. A rating adjustment for stresses was suggested based on the strength to stress ratio (σc/σ1) for RMR89 in a high-stress environment [32].
2.4. Characterization and Classification of Rock Mass Based on RMR14
After the use of RMR89 for 25 years, an updated version of RMR known as RMR14 is suggested with a few new parameters, revised rating, and final structure [7]. The structure of RMR14 for determining rock mass quality is represented by Equation (9):
where
- RMRb = Basic RMR (without the influence of excavation),
- F0 = Adjustment factor similar to R6 in RMR89,
- Fe = Adjustment factor for the excavation method,
- Fs = Adjustment factor for the stress-strain behavior at the tunnel face.
The RMR14 structure preserves four parameters with their ratings in the original form as found in RMR89. As per the modification in 2013, these are as follows:
- Intact rock compressive strength
- Groundwater condition
- Orientation of joint with respect to the tunnel axis and excavation direction
- Joint frequency
The discontinuity condition was revised in RMR14 by eliminating the joint aperture parameter because of the overshadowing effect. The revised ratings for the remaining four parameters of the discontinuity condition for RMR14 are summarized in Table 2.
Three new parameters, i.e., intact rock alterability and adjustment parameters Fe, and Fs, were also introduced in RMR14. The intact rock alterability is rated per results of the slake durability test, as defined in the standard [33]. The rating values of the rock alterability parameter were suggested in table form in the RMR14 version. The parameter Fe, which is a function of RMR and related to the mechanical excavation method, can be calculated from Equation (10) [7]:
where RMR = RMR89.
Equation (10) is applicable for mechanical excavation only. When the excavation is performed by the drill and blast method, Fe = 1.
During excavation, RMR at the tunnel face is considerably lower than predicted during the design phase because of the yielding of the tunnel face and walls. To overcome this effect, an adjustment factor (Fs) is introduced. This factor was defined in terms of Índice de Comportamiento Elástico (ICE) (elastic behavior index) by Bieniawski and Celada [34], as expressed in Equation (11). The Kirsch solution for stresses at the perimeter of a circular excavation was used for ICE determination and has been extended to non-circular tunnels using numerical modelling. For the derivation of Equation (11), Equation (12) of Kalamaras and Bieniawski [35] was used for calculating rock mass strength:
where
- σci = intact rock uniaxial compressive strength (UCS) (MPa),
- K0 = virgin stress ratio,
- H = tunnel depth (m), and
- F = shape coefficient (F = 1 for 10 m diameter circular tunnel; F = 1.3 for 6 m diameter circular tunnel and F = 0.75 for 14 m wide conventional oval tunnel [34]).
- RMR = RMR89.
The value of ICE obtained from Equation (11) is used for the calculation of the adjustment factor, Fs, using Equation (13):
2.5. Characterization and Classification of the Rock Mass Based on Tunneling Quality Index (Q) System
The tunneling quality index, also known as the Q system, is a tunneling data-based empirical classification system that was presented in 1974 [8]. The system categorizes the ground into nine rock mass classes. On a logarithmic scale, the quality index ranges from 0.001 to 1000 and is calculated using Equation (14):
where RQD is used at intervals of five in a selected domain, Jn denotes the rating of the number of joint sets, Jr is the rating for the joint surface roughness, Ja denotes the rating for the degree of alteration or clay filling joint set, Jw denotes the ratings for groundwater inflow and pressure effects, and stress reduction factor (SRF) is the rating for faulting, strength – stress ratios in hard rocks, and squeezing or swelling.
Since the introduction of the Q system, major changes in characterization were proposed in terms of intact rock strength and SRF for competent rocks with a rock stress problem [9,10,36]. In rock mass properties, the role of intact rock UCS is significant. Thus, a normalization factor is applied to Equation (14) for a modified Qc [10]:
The ratings for σc are their values in Equation (15). The ratings for RQD are their values with a correction interval of 5, i.e., 90, 85, 80, etc., as suggested by Barton [8]. In the literature, this suggestion related to RQD is usually not included in Q or Qc calculation [24,25]. In the case of massive hard rocks, the rating for Jr is 4, and in cases where the joint fill is thick enough to prevent rock wall contact during shearing, the rating for Jr is always 1 [11]. Although no parameter is directly included in the structure of the tunneling quality index system for joint orientation, the discontinuity filling and roughness, i.e., Ja and Jr, respectively, are calculated for the least favorable joint orientation [10]. The first term in Equations (14) and (15) is the relative block size, which is suitable for distinguishing rocks-burst-prone rock from jointed rock. The rock-burst-prone rock has an RQD/Jn ratio of 25–200, whereas the typical jointed rock has an RQD/Jn of 10 [10]. The SRF rating in the case of competent rock with a rock-stress problem has been modified for massive and jointed rocks [9,36]. The continuous rating of SRF in Equation (15) can be determined for highly stressed jointed rocks using Equation (16):
2.6. Rock Mass Quality and Tunnel Support
2.6.1. Determination of Tunnel Support from Rock Mass Quality
Both RMR and Q systems were designed—and have been specifically updated—for estimating tunnel support [2]. Because the support chart is based on empirical data, it is able to function as a guideline for the design of permanent supports in underground openings.
Based on RMR89, recommended tunnel support guidelines were limited to a 10-m span conventional excavation tunnel and made available in table form, where the support requirement changes with rock mass quality [6]. Because the support technology improves with time, tunnel designers use different supports for various tunnel spans using the RMR89 tunnel support guidelines [37,38,39]. Design engineers predict supports for tunnel stability other than for those with a 10-m span, and the design process involves personal judgment. Personal judgment is also involved for different values of RMR89 in the same class, i.e., RMR89 = 41 and RMR89 = 60. After 24 years of experience, a major update in tunnel support through RMR89 was performed, in which the rock support is a function of the tunnel span and rock mass quality [15]. According to the modification, shotcrete thickness and rock bolt length (Lb) is function of rock mass quality and tunnel span. The length of the rock bolt can be calculated using Equation (17).
Rock bolt spacing (Sb) depends on rock mass quality and can be calculated using Equation (18). Spot bolting is needed for RMR89 > 85. The shotcrete design chart reveals that shotcrete thickness is highly influenced by the tunnel span (Span < 10 m) at low RMR89 values, whereas shotcrete thickness is highly influenced by RMR89 for larger tunnel spans (Span > 10 m). Because of this development in the support design for tunnels using RMR89, the calculation of rock mass quality as per suggestions through continuous rating is a more precise approach than the discrete one to achieve proper design, but with less personal judgment. The rock bolt spacing can be calculated as follows:
In the Q system support chart, the rock bolt spacing is a function of the rock mass quality, whereas shotcrete thickness is a function of the equivalent dimension (De) along with the rock mass quality. Differently to the RMR system, the characterization in the Q system has not been revised considerably. However, the support chart of the Q system has been continuously revised because of the development in the underground support philosophy and technology [9,10,11]. According to the support chart of the tunneling quality index system, the equivalent dimension (De) defines the bolt length. This De depends on the tunnel span and safety demanded excavation support ratio (ESR). The ESR value selection should be based on the safety of the working crew according to a country’s safety standards, because each has its own criteria [40]. Secondly, ESR also depends on the rock mass quality [11]. The relationship between rock bolt length and De for hydropower projects reveals that ESR = 1 is also the appropriate value for hydropower tunnels [36].
The rock mass classification system suggests that the rock bolt (20-mm diameter and fully grouted) length and spacing for a tunnel cross section should be based on the rock mass quality. For the reinforcement and stability of the underground excavation, in the past few decades, several factors related to rock bolts have been studied through pull-out test results to investigate the performance of rock bolts. The suggested spacing of rock bolts is the result of a considerably crude correlation between Q and rock bolt spacing [9], which is usually employed in practice along with a quantitative classification system for supports [40]. The shotcrete thickness for tunnel spans with De < 3 m is simply assumed and is not based on empirical data [11]. The Q system works best for Q values ranging from 0.1 to 40 and De values ranging from 2.5 to 30 m [40]. Although a normalized factor has been included in the Q system, the support chart is not updated for it [36]. Similar to that in RMR, the effects of De and rock mass quality on shotcrete thickness are not equal and constant. Instead, the thickness depends on the value of both.
2.6.2. Back Calculation of Rock Mass Quality Based on Supported Tunnel
Because the two systems have been developed and updated for support design, the installed supports in a tunnel can be used for determining rock mass quality. Equation (18) and the Q-system support chart reveal that rock bolt spacing is a function of rock mass quality only, and this spacing can be directly used for rock mass quality (both RMR and Q value) determination. The use of fiber-reinforced shotcrete, which is a function of the rock mass quality (Q or RMR) and tunnel size (span or De), is a mandatory part of the current tunneling practice. The thickness of this shotcrete along with the tunnel size can also be used to identify the rock mass quality through the back analysis of an already supported tunnel section based on support charts of RMR89 and Q system. The rock mass quality obtained from the rock bolt spacing is an entirely single value (100%). The shotcrete thickness is a function of the rock mass quality and tunnel size, and the contribution of the rock mass quality to the shotcrete thickness depends on the inclination of a tangent in the shotcrete support line as found in the support charts of both Q and RMR systems. The final rock mass quality for both systems can be evaluated from two different rock mass quality values (rock mass quality from rock bolt spacing and rock mass quality from shotcrete thickness) through their weightage. The procedure for the back calculation of the rock mass quality is described in Figure 1 and illustrated in Example 1.
Example 1:
- Tunnel span or De = 11.17 m
- Rock bolt spacing = 1.6 m
- Shotcrete thickness = 9 cm
- RMR1* = 48.6 (contribution of RMR to rock bolt spacing is 100%)
- RMR2* = 55.6 (contribution of RMR to shotcrete thickness is 52.09%)
- RMR* = 51 (RMR* is calculated from RMR1* and RMR2* based on their contribution (%))
- Q1 = 0.7 (contribution of Q to rock bolt spacing is 100%)
- Q2 = 1.7 (contribution of Q to shotcrete thickness is 49.25%)
- Q or Qc = 1.03 (Q or Qc is calculated from Q1 and Q2 based on their contribution (%))
2.7. Correlation between RMR and Q
It is worth emphasizing that the use of at least two rock mass classification systems is advisable in the tunnel support design process [16]. According to Barton and Bienwiaski, when using RMR and Q systems for tunnel support design, they should be checked with correlation [2]. As discussed in previous sections, the RMR and Q systems of rock mass classification use different weighting factors for individual parameters and do not always use the same parameters or consider some of the parameters; the overall rating values cannot be directly compared.
2.7.1. Linear Correlation between RMR and Q
Since the development of the two systems, a correlation based on the linear regression analysis of RMR and Q values was first presented by Bienwiaski [41], as shown in Equation (19), where A = 9 and B = 44. Since then, several researchers have presented other correlations based on regression analysis, but there is no scientific basis to assume a universally applicable regression between RMR and Q, as a result of the differences between the characterizations and rating scales of each empirical design method [42]. Due to this limitation of correlation based on regression analysis, some researchers suggest regional, project or geological based correlation between RMR and Q values [42,43,44,45].
For Q = 1, a 90% confidence interval limit shows that B in Equation (19) changes from 26 to 62, which is considerably a wide range of predictions for RMR from Q values and vice versa [6]. For the evaluation of this linear correlation approach between RMR and Q, the published data, summarized in Table 3, are used.
2.7.2. Correlation between RMR and Q Using Their Truncated Versions
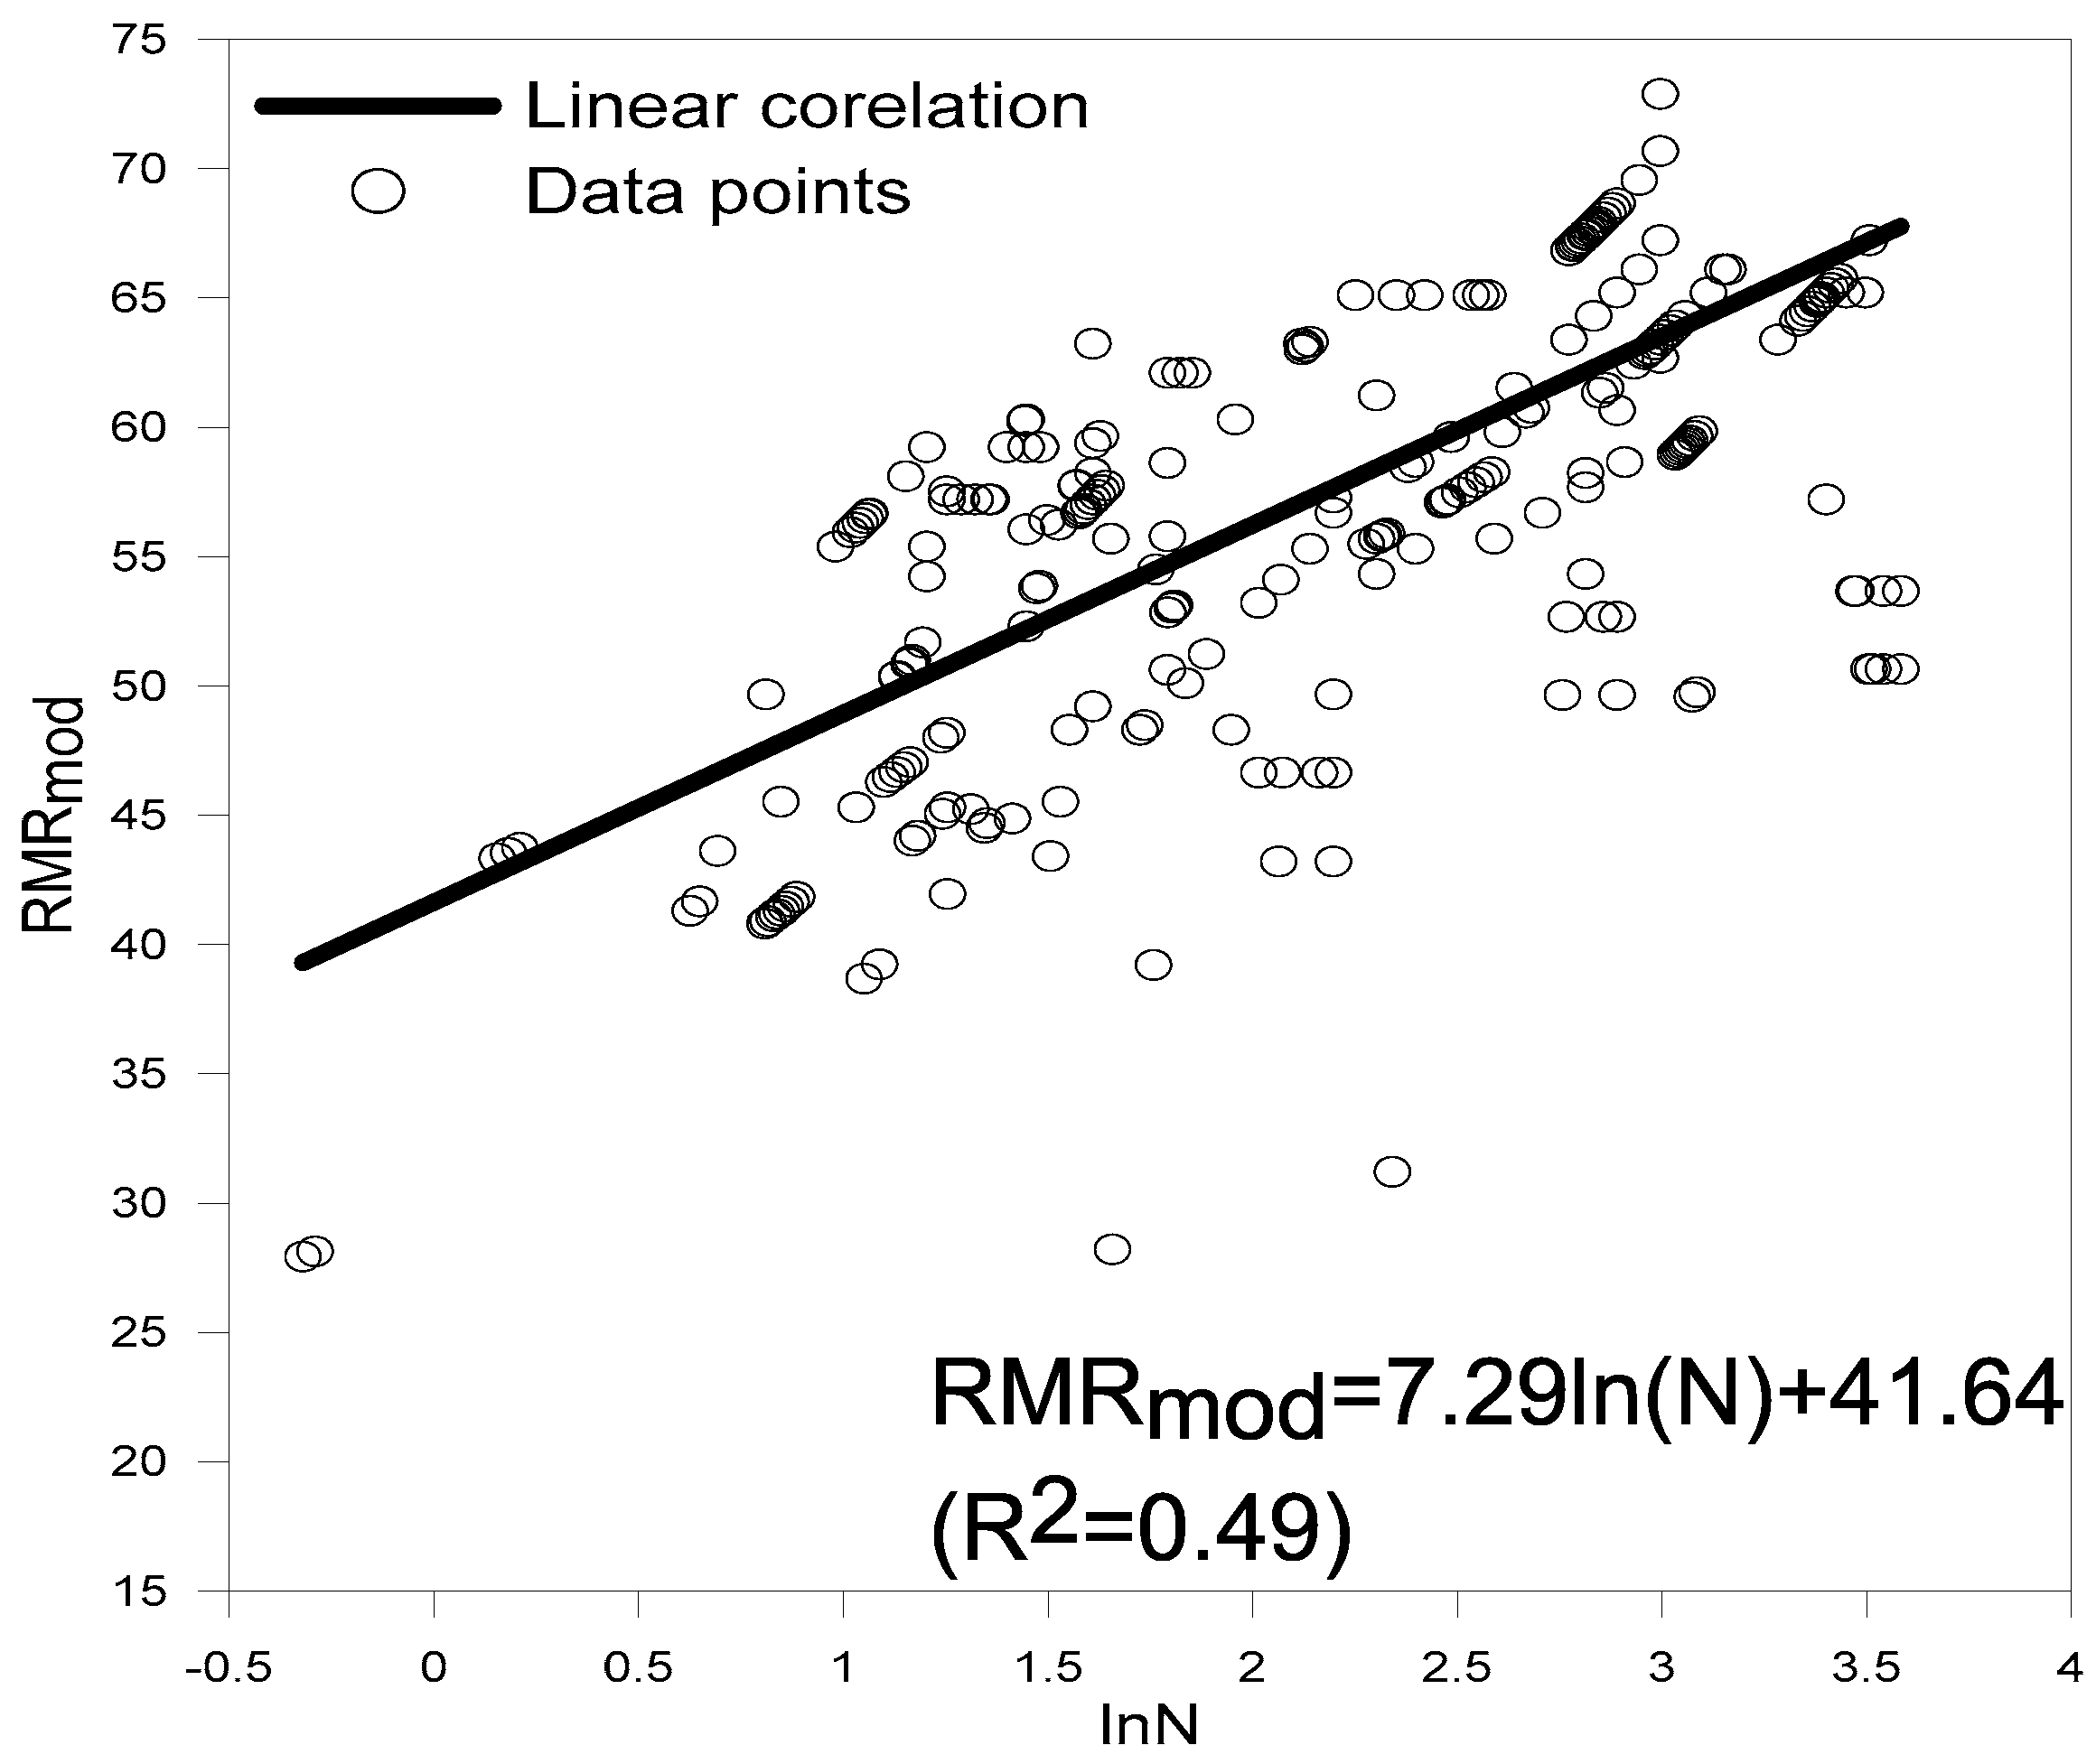
Using truncated versions of RMR and Q, some attempts have been made for a better correlation [19,48] of the two. The modified RMR, i.e., RMRmod, which is a value free from intact rock strength and joint orientation rating, and N (stress free Q, i.e., SRF = 1) were used for the interrelationship between RMR and Q using Equation (20). Through this truncated approach, the correlation between N and RMRmod for the data of Projects 1–2 is also evaluated.
Secondly, a rock mass fabric index, defined as a function of the rock structure and joint condition, eliminates the groundwater factor as well, resulting in a common fabric chart for a better correlation [19]. In this truncated approach, the rock mass fabric index for the RMR system (FRMR) is the sum of the parameter values related to the rock structure (R2 and R3) and discontinuity condition (R4). It can be defined using Equation (21):
The rock mass fabric index for the Q system (FQ) is the product of the relative block size (RQD/Jn) and inter block shear strength (Jr/Ja), as expressed in Equation (22):
A correlation was developed based on the rock mass fabric index chart, as expressed in Equation (23) [19].
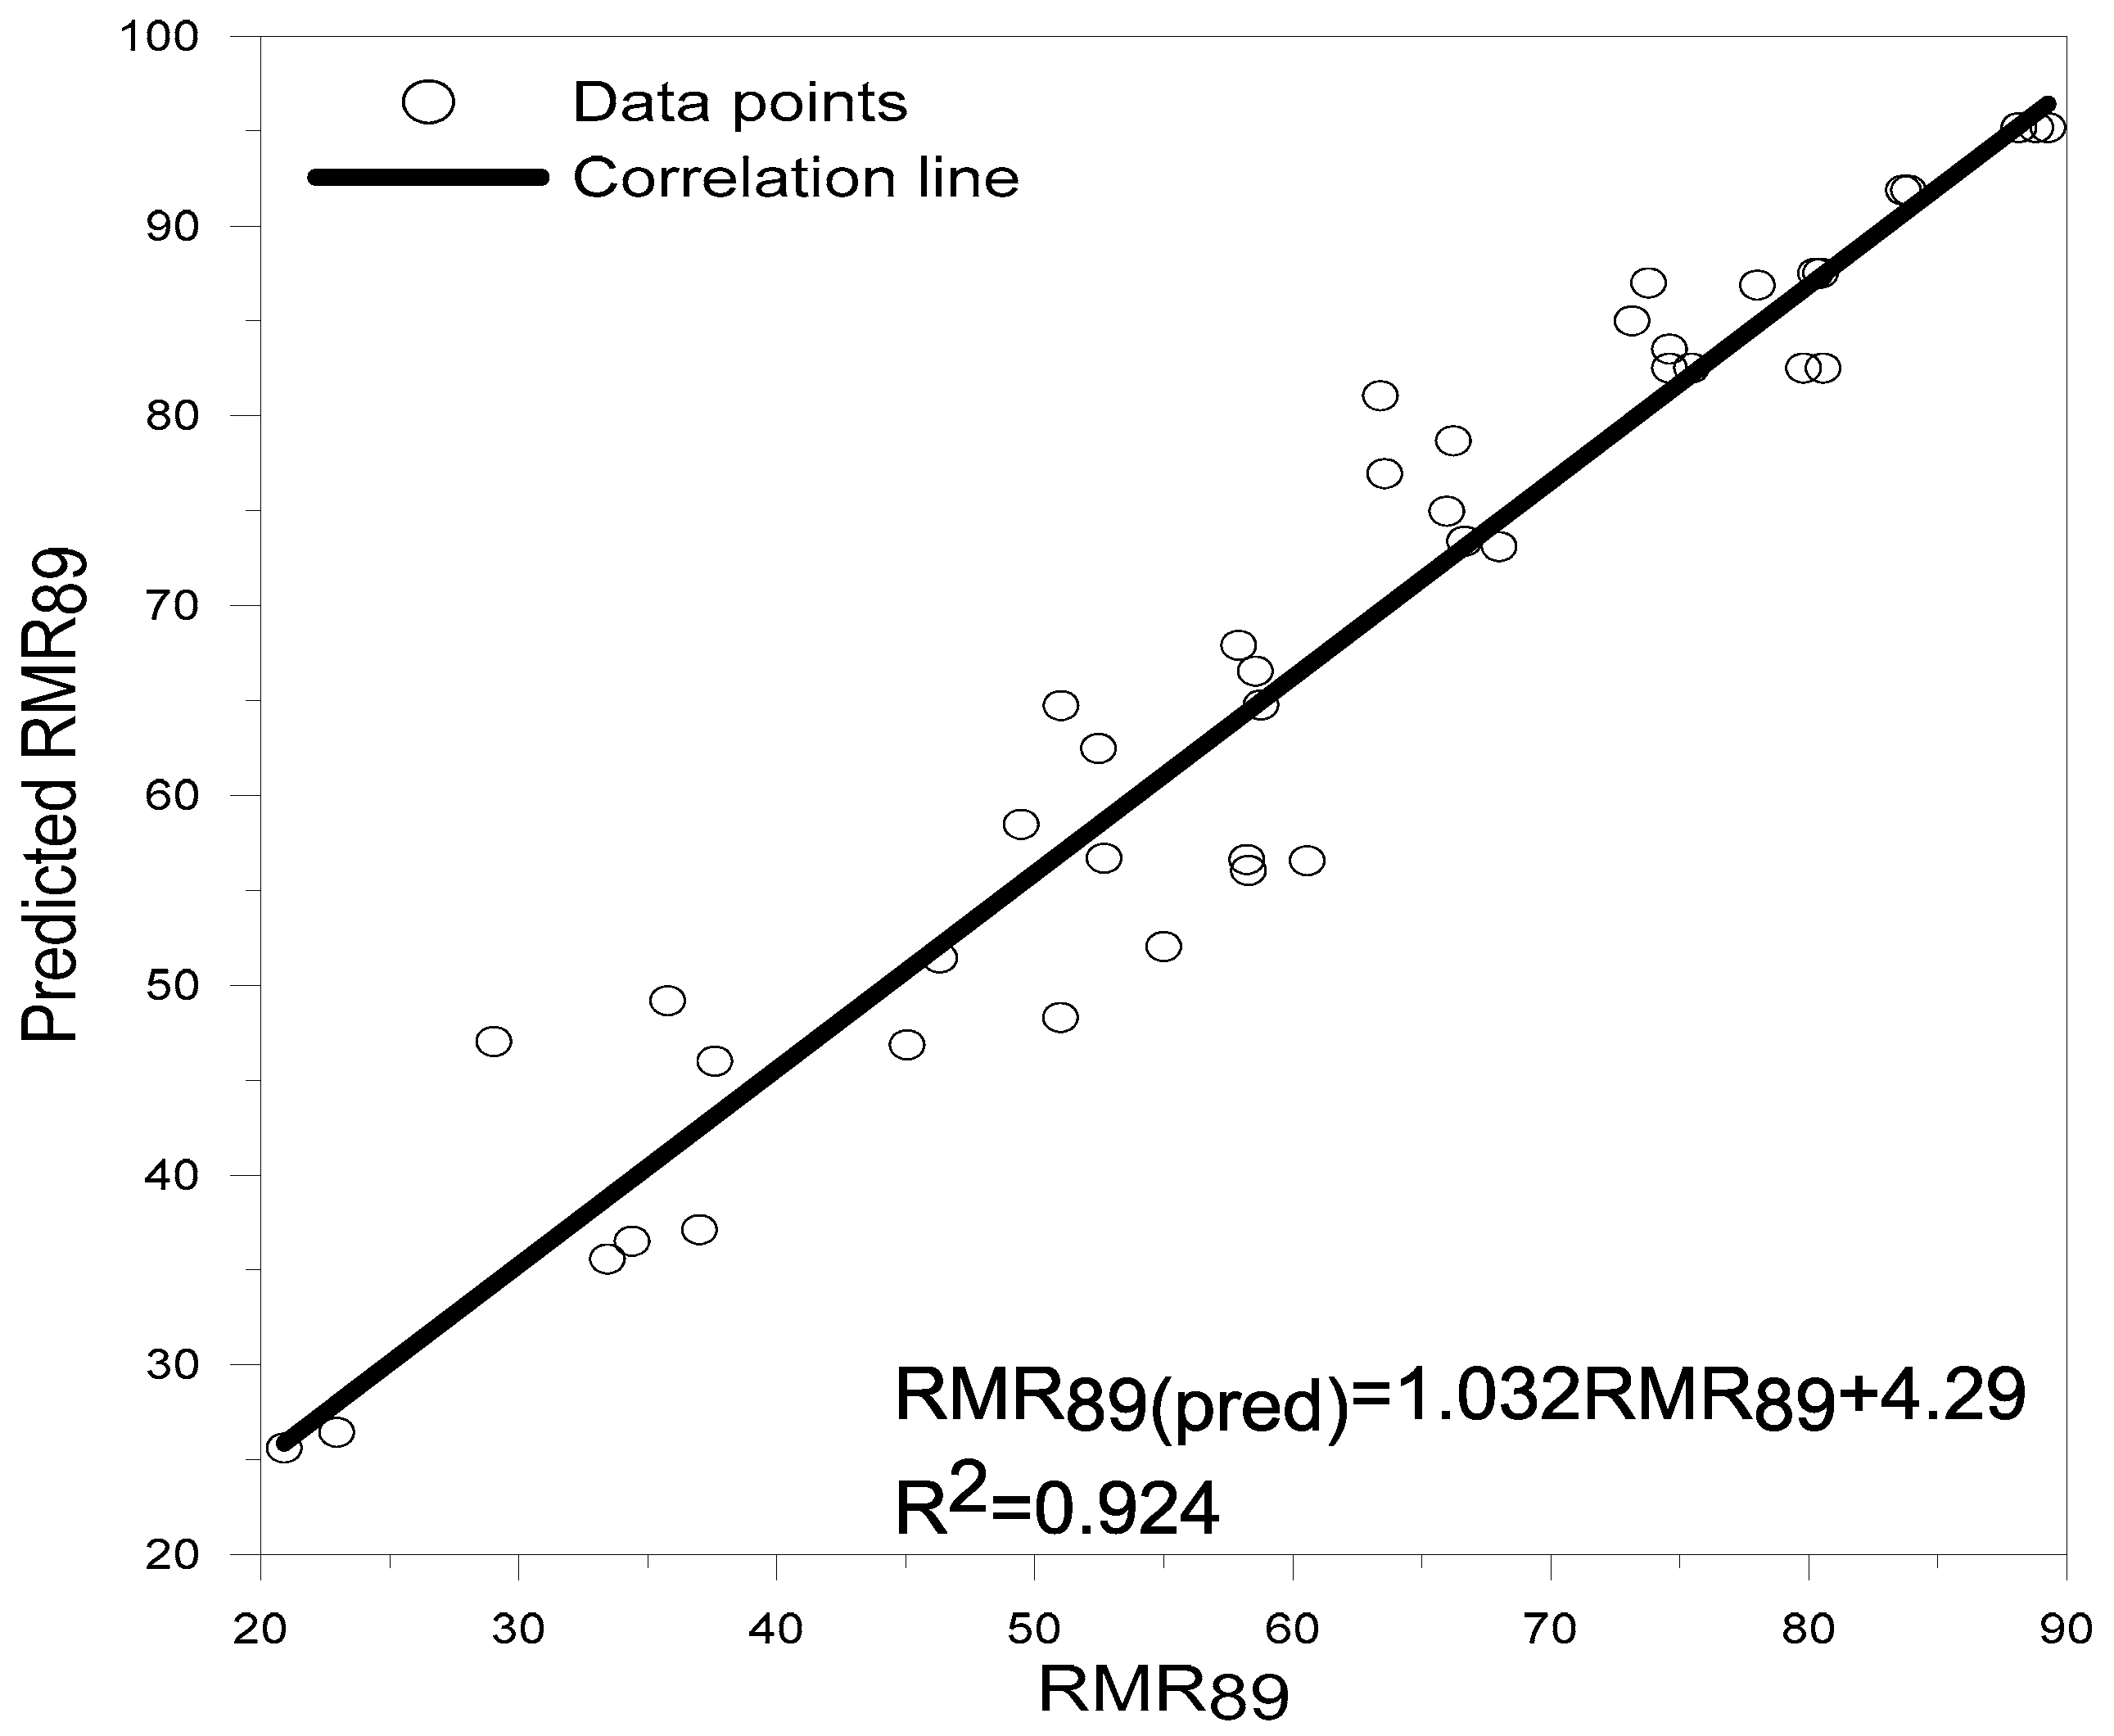
The values of FQ listed in Table 3 were used for predicting FRMR values using the rock mass fabric index chart. Thereafter, the ratings for intact rock strength (R1), groundwater (R5), and joint orientation (R6) were applied, defining the predicted RMR89. Through this truncated approach, the correlation between calculated and predicted RMR89 for the data summarized in Table 3 is also evaluated.
2.7.3. Correlation between RMR and Q Using Preliminary Support Design
The rock bolt spacing and shotcrete thickness are based on the same criteria in the two rock mass classification systems, and this aspect of support is used to correlate RMR and Q. For this purpose, using Table 3 data, RMR89 was used for the preliminary support design of tunnel sections. The resultant support from RMR89 support charts [15] is used for the prediction of the tunneling quality index (in the area where the rock Q system works best [40]) using the back analysis procedure. The results of the possible back calculated Q values are compared with the calculated Q values.
3. Results
For the precise characterization of some parameters of the rock mass rating systems, Equations (2)–(4) and (7) are suggested in this paper. The results of these Equations are compared with the lump/discrete and continuous rating in Figure 2, which shows that these fitted equations are suitable alternatives to achieve correct characterization.
Using the continuous rating approach, the 462 tunnel sections of Projects 1–2 [36] were characterized and classified based on RMR89. The details of characterization and classification are summarized in Table 4 and are shown in Figure 3.
Rock mass rating values were also obtained from different support categories and the supported span of the tunnel at all the sections of the two projects using back calculations and were defined as RMR*. The comparison of the calculated RMR89 and back calculated RMR (RMR*) show that the actual supports installed are much heavier than those suggested by RMR89. Approximately 90% of the data show that RMR* is lower than RMR89. Their differences are shown in Figure 4 in terms of the percentage frequency.
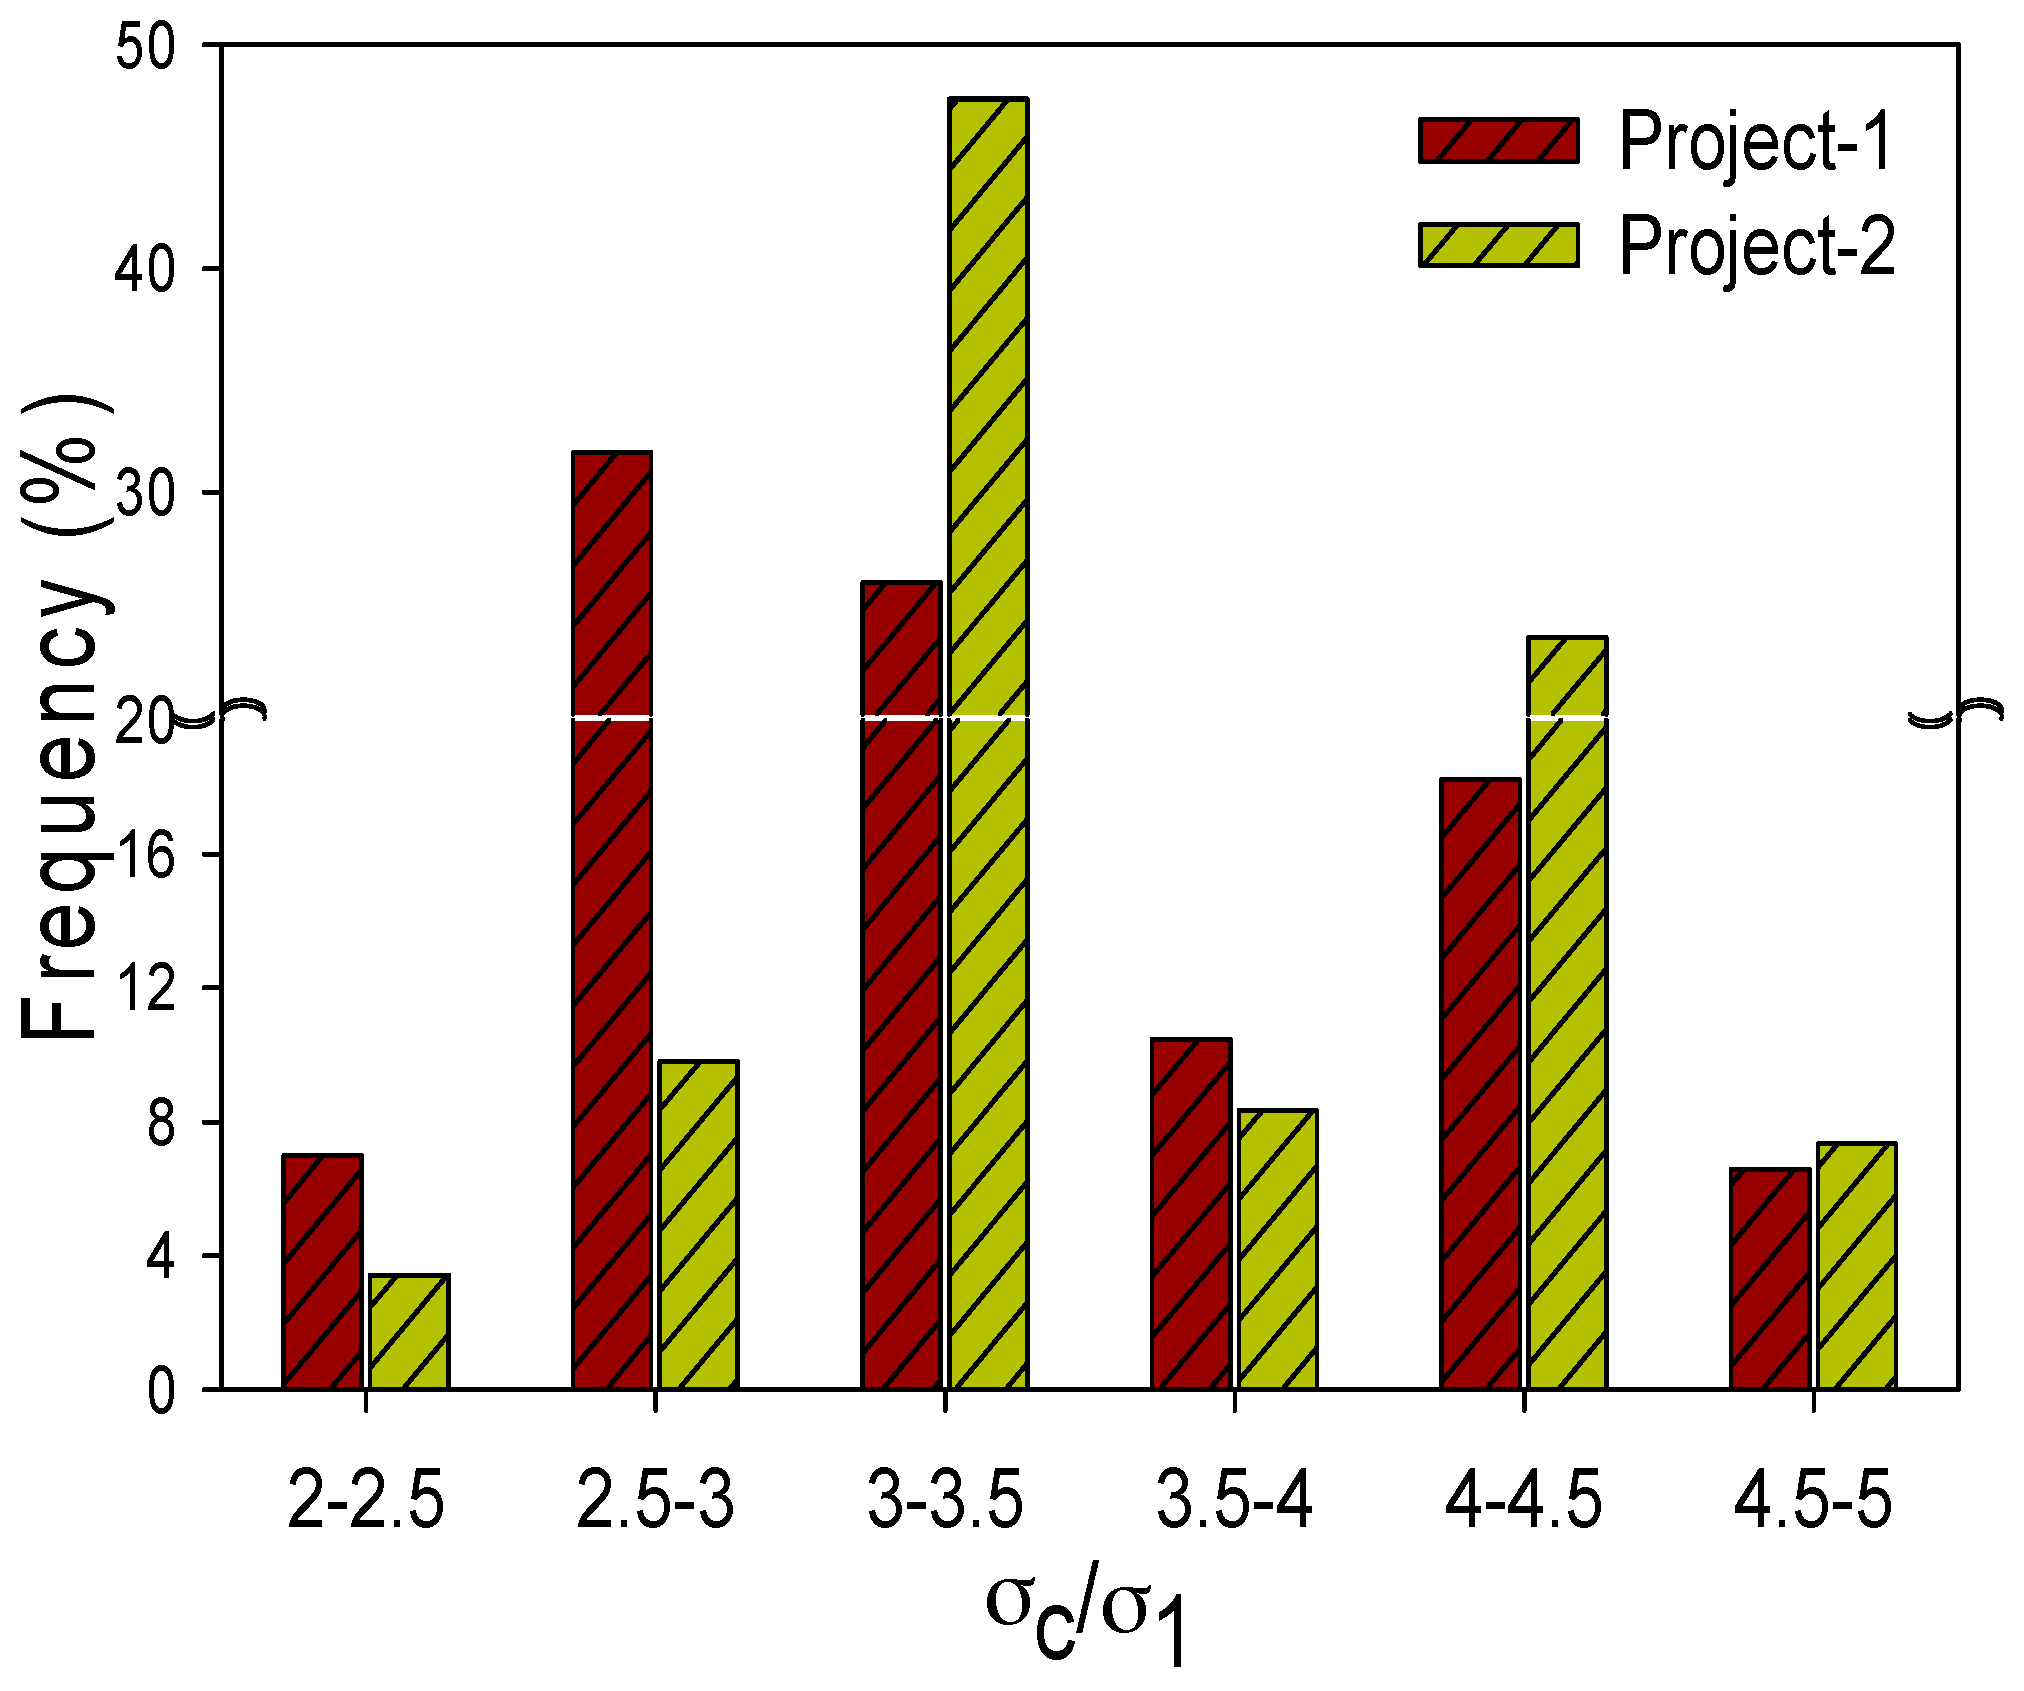
The mean ratio of RMR* to RMR89, i.e., RMR*/RMR89, is 0.855 (Table 5). The stress adjustment factor is applied to RMR89 as suggested based on strength-stress ratio. Details of the strength–stress ratio are shown in Figure 5. After this adjustment, the resultant RMR89 was defined as RMR89*, and data were analyzed. After the application of the stress adjustment factor, the ratio of RMR* to the stress adjusted RMR89 (RMR89*), i.e., RMR*/RMR89*, is 1.002 as shown in Table 5.
Although RMR14 is discussed in this study, as it is the latest version of RMR, Equations (9)–(13) indicate that without calculating RMR89, the determination of RMR14 is not possible. Rock mass ratings based on RMR14 for all selected sections of Projects 1–2 are summarized in Table 6, and details of the joint frequency and rock mass ratings (RMR14) are shown in Figure 6.
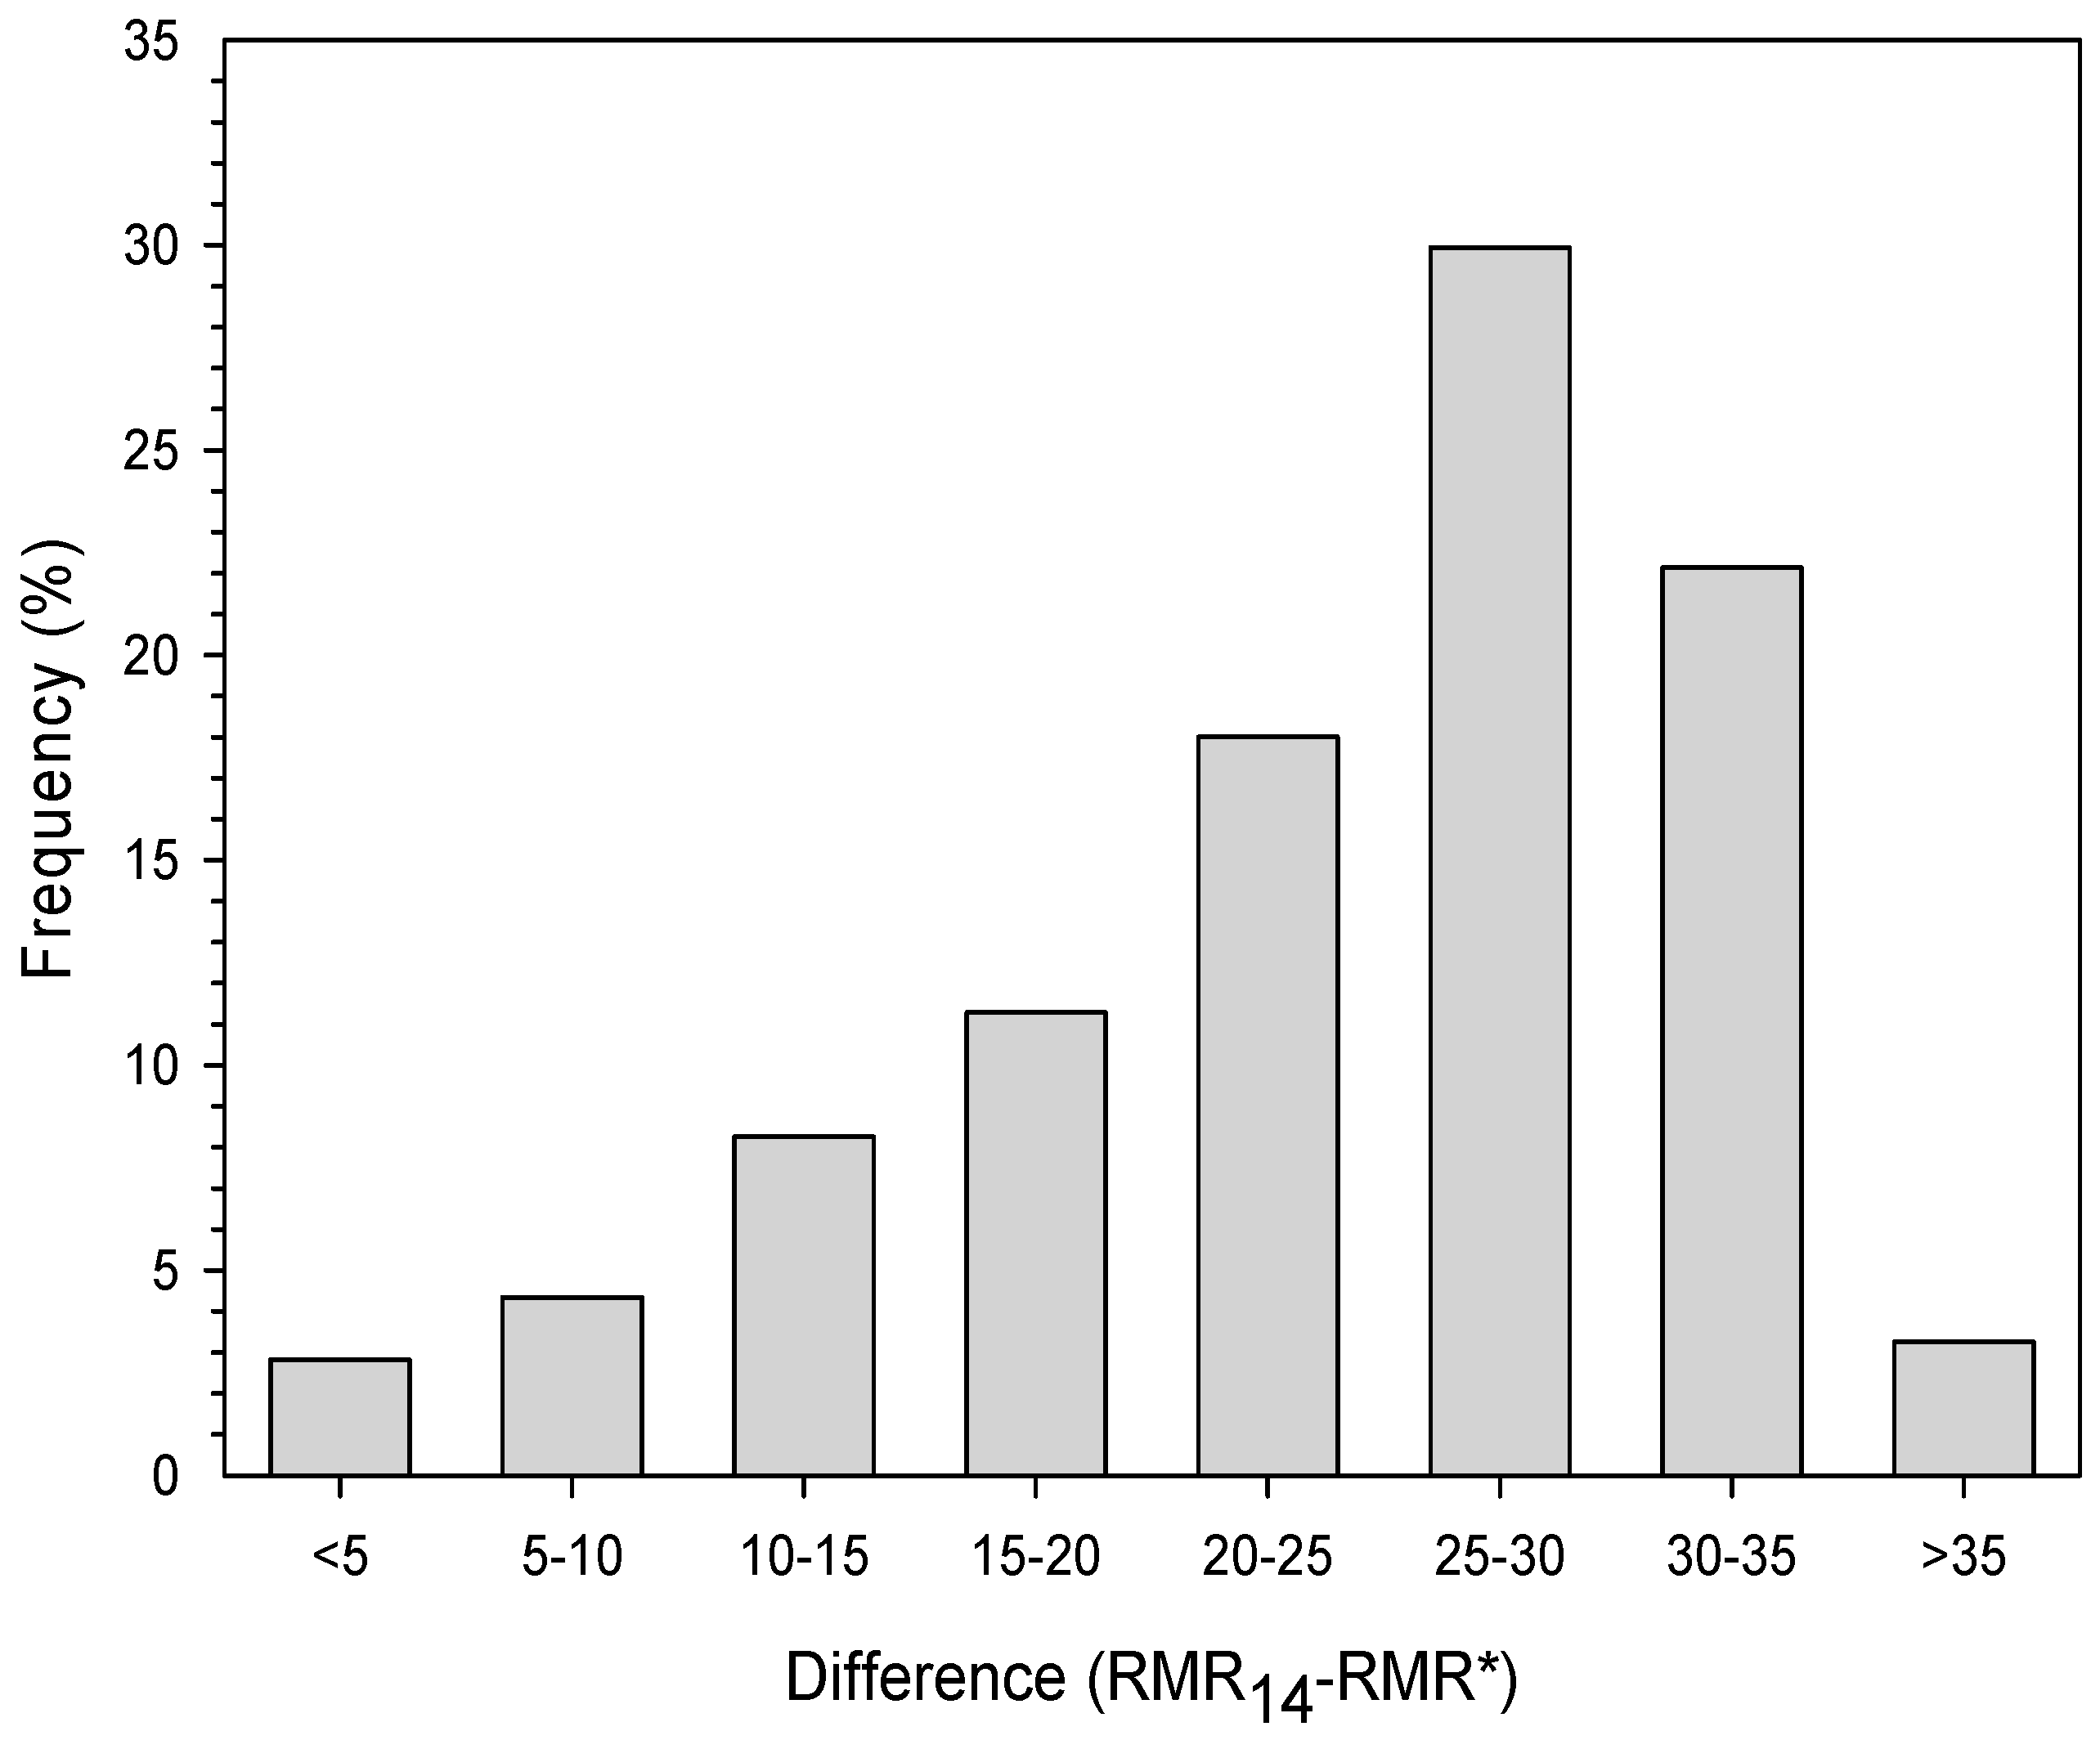
The comparison between RMR* and RMR14 reveals that RMR* < RMR14; details of this difference are shown in Figure 7.
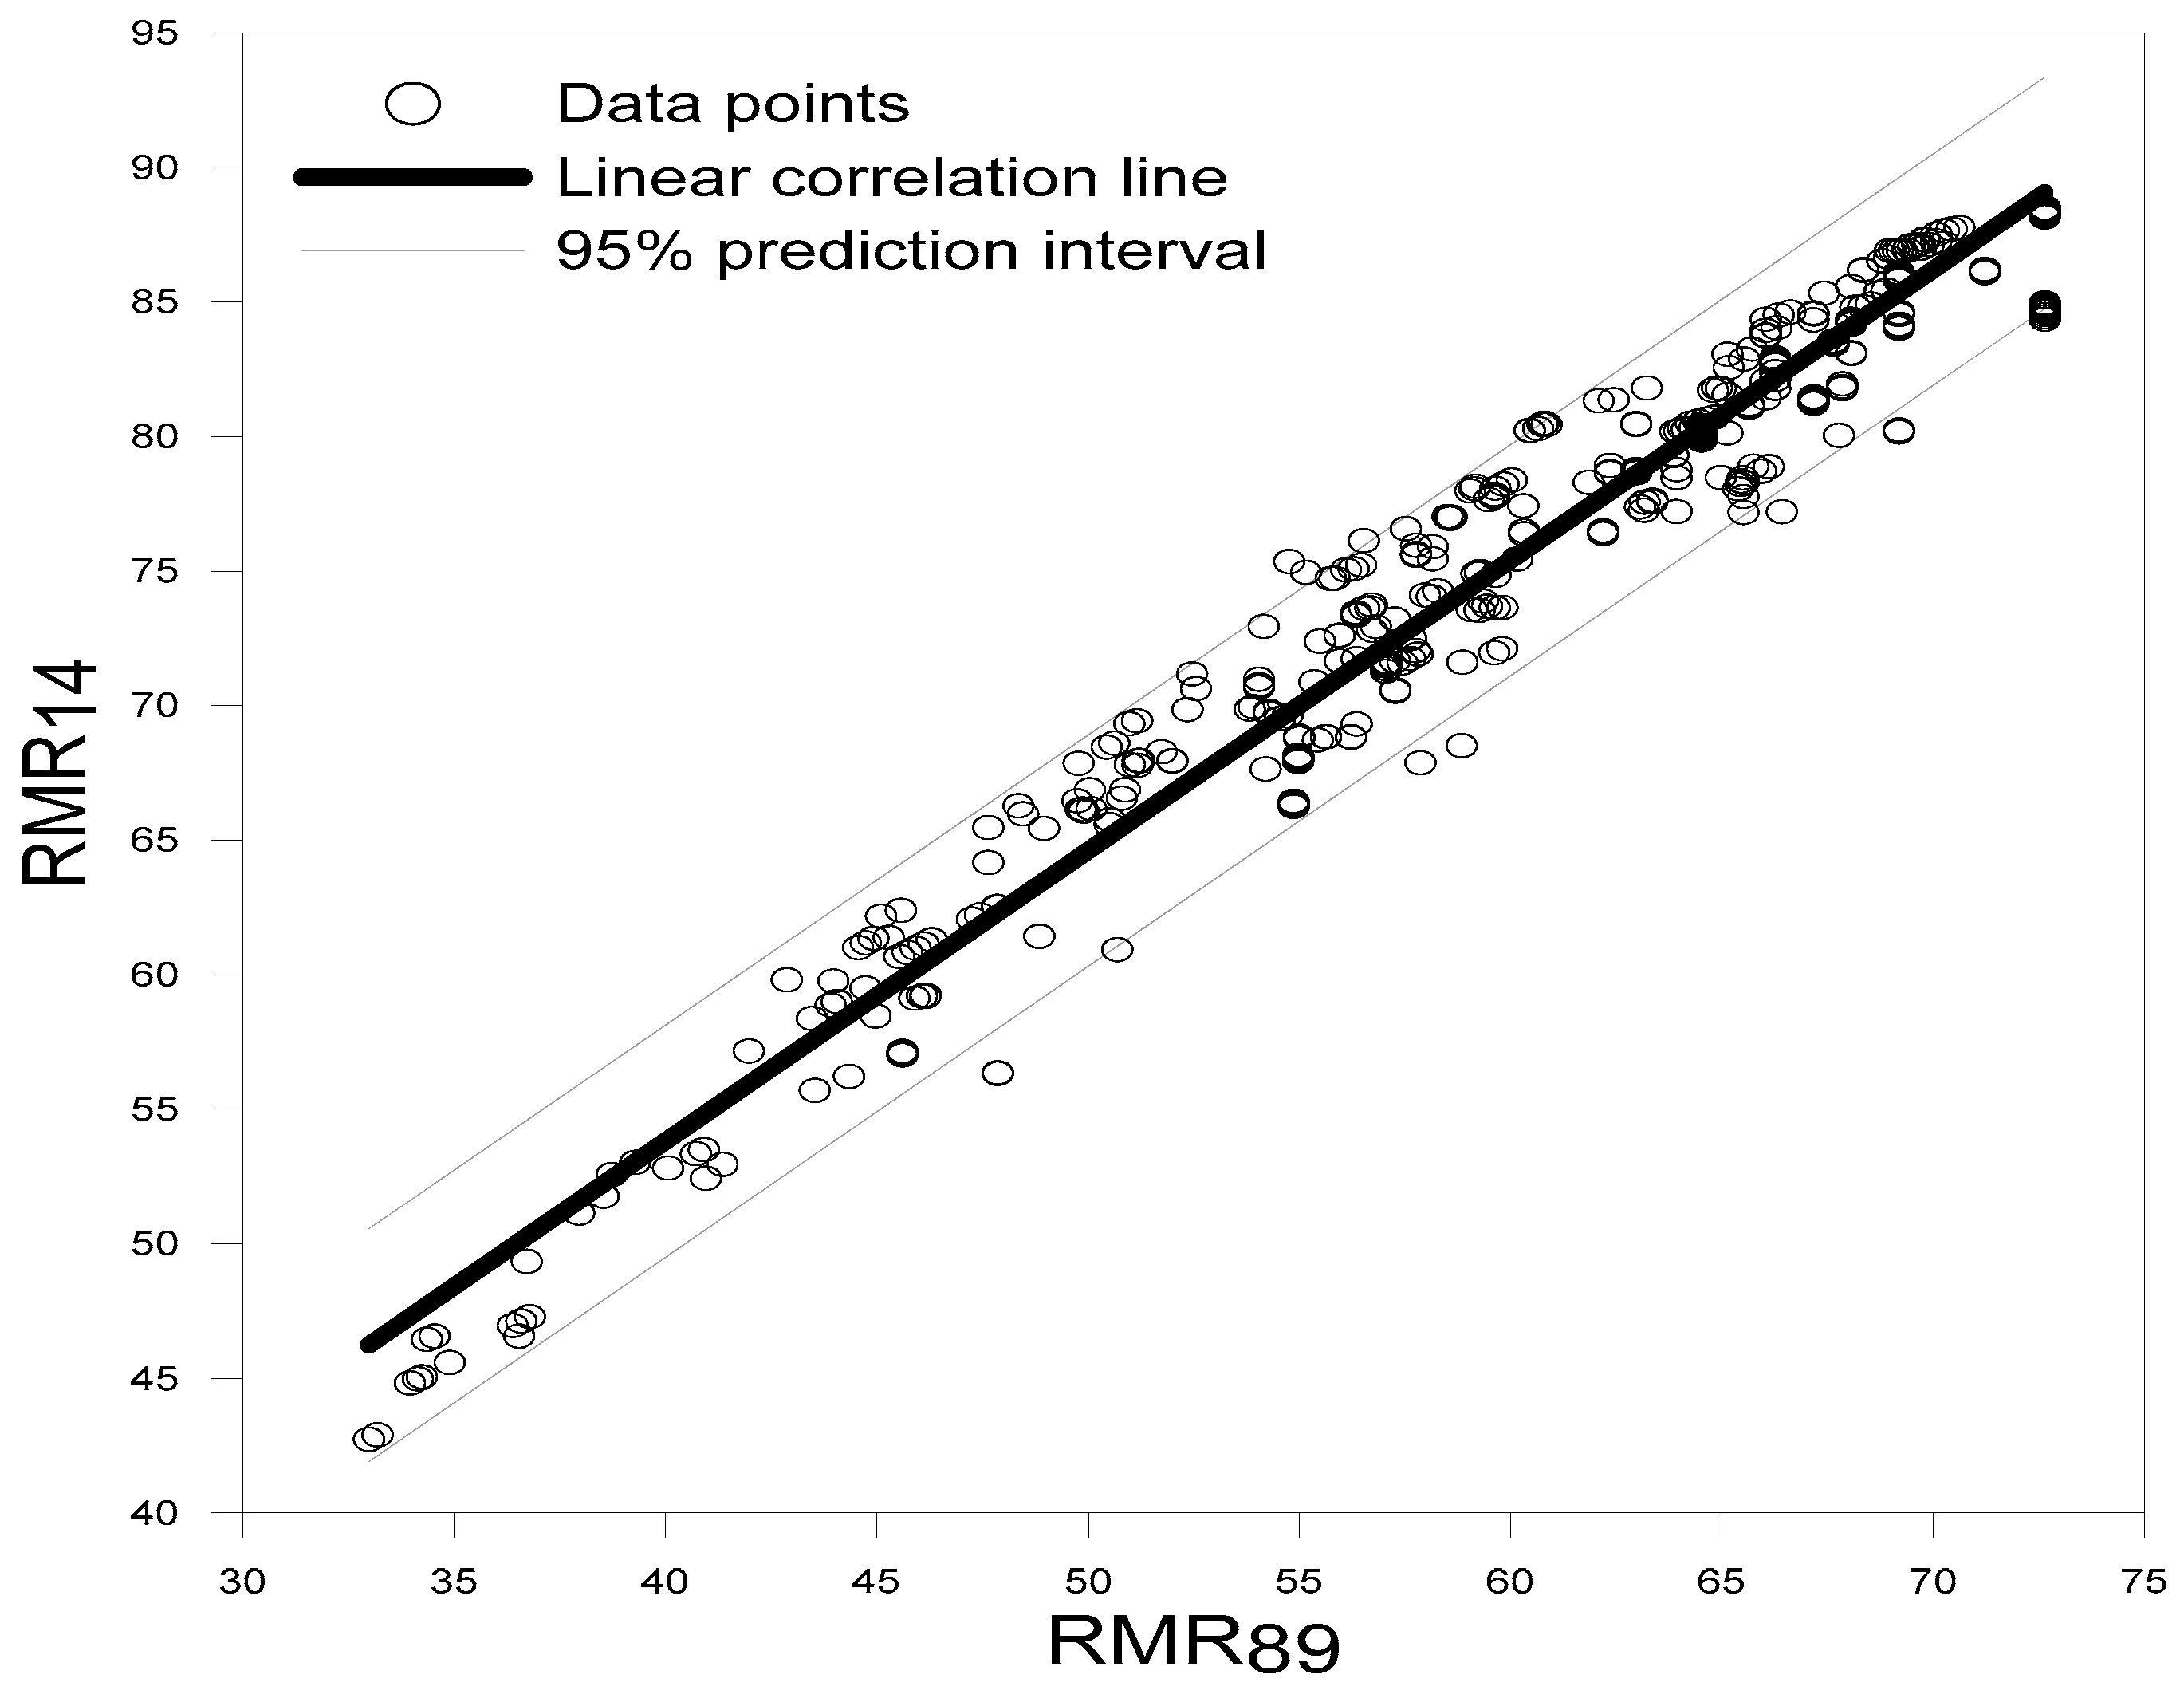
A correlation is established between RMR89 and RMR14, as shown in Figure 8, based on 462 tunnel sections of Projects 1–2. The correlation shows that RMR14 > RMR89. As the RMR89 system is extensively used for different purposes other than support, Figure 8 shows an excellent correlation between RMR89 and RMR14, as shown in Equation (24):
Section 2.5 discussed the assessment of the characterization and classification of the tunneling quality index system. The characterization criteria have remained the same since its development, except for the inclusion of the intact rock strength in the form of a normalized factor in the structure of the Q system equation and the revised rating for SRF in a high stress—strength ratio environment. The basic suggestion of the creators of the system to use an interval of 5 in RQD rating is activated because this suggestion in calculating the value of Q is generally ignored in literature.
Furthermore, for tunnel support design, both RMR and Q systems have been refined and revised, either in the form of characterization, support, or both. Currently, the rock bolt spacing is regarded as a function of the rock mass quality, and the shotcrete thickness, along with rock mass quality, is a function of the tunnel span. A back calculation approach for rock mass quality determination is proposed, as shown in Figure 1 and explained in Example 1.
Also, the results of correlations between RMR and Q systems are shown in Figure 9, Figure 10 and Figure 11. A linear correlation in Figure 9 shows that the data are considerably scattered and predictions from the correlation may lead to erroneous results. Logically, therefore, a good correlation can only emerge if the joint orientation and intact rock strength are ignored in the RMR system or included to the Q system, and the stress condition is ignored in the Q system. After applying this approach on the data of Projects 1–2, results shown in Figure 10 are also scattered and have a low correlation coefficient. The rock mass fabric index approach is also assed. The predicted RMR89 was correlated with the calculated RMR89, as shown in Figure 11. The calculated RMR89 is based on suggested equations of the continuous rating. The results show that the predicted RMR89 is higher than that calculated, which is because of the high value of the predicted FRMR from FQ. However, the rock mass fabric index approach yields comparatively better results than former approaches do and have a high correlation coefficient.
Because the rock bolt spacing and shotcrete thickness are based on the same principal in both systems, a correlating bridge between them has been developed, based on the summarized published data in Table 3. However, this did not yield any satisfactory results, as listed in Table 7, because the development of the two systems are based on different approaches. Moreover, support charts of RMR and Q system indicate that rock mass quality and tunnel span are contributing different contribution for supports.
4. Discussion
The comparison of rock mass rating [5] and tunneling quality index [8] with other classification systems reveal that these two systems are internationally accepted empirical design tools in rock engineering, particularly for tunnel support design. The major reason, out of many, behind their international acceptance is that these two rock mass classification systems are updated continuously either in the form of characterization or support [6,7,9,10,15]. The ability of these systems to characterize and classify rock masses is highly dependent on the use of these systems according to predefined procedures, taking into consideration their limitations. Although charts are available for characterization for the RMR89 [6,23], users prefer to use the discrete/lump table for that purpose, contrary to the very essence of these systems. To facilitate the calculations for the continuous rating of intact rock strength, RQD, joint spacing, and joint frequency, equations are proposed. These proposed equations are the least difficult approaches for characterizing the intact rock strength, RQD, discontinuity spacing, and fracture frequency in RMR89 and RMR14. Similarly, in the Q system, although the use of 5 as an interval of the RQD rating is suggested [8], that suggestion is not taken into account in literature.
An evaluation of the application of RMR and Q systems for tunneling in a high stress environment indicates that the Q-system is preferred because of the stress reduction factor (SRF). Although the RMR system is modified [6,7], it is evident that the application of RMR (RMR89, RMR14) system for tunnel support design in high stress environments is still the limitation of the RMR system. The mean value of RMR* and RMR89* are lower than RMR89 because of the effect of stress. Although the ratio RMR*/RMR89* considerably approaches 1, the standard deviation in RMR89* is 9.44, which reveals that this parameter in RMR89 requires some amount of special attention to extend its application for tunnel supports under high stress environments.
The two versions of RMR [6,7] (RMR89 after modification in 2013 and RMR14) use the same four parameters and their corresponding ratings. The comparison of the joint condition parameters is summarized in Table 2. The additional parameter in the RMRb (for RMR14) calculation is the intact rock alterability parameter, which is related to shales and similar weak rocks [33]. For strong rocks, the rating for intact rock alterability is 10 as per RMR14 suggestions. Minimum values for Fe and Fs are 1 and maximum values are 1.32 and 1.3, respectively [7]. Taking into consideration the structure of the two versions of RMR (RMR89 and RMR14) and characterization criteria leads to the conclusion that RMR14 > RMR89. The literature also supports the notion that RMR14 values are higher than RMR89 [7,49]. A similar trend can be seen in Figure 8.
Currently, in the two systems, rock bolt spacing and shotcrete thickness depend on the same principle. The back analysis approach for rock mass quality determination is introduced and explained through an example in this manuscript. This approach can be a valuable tool for the evaluation the parameters in these systems.
The linear and truncated correlations between RMR and Q systems are assessed based on published data and data of Projects 1 and 2. For the use of an empirical classification system for tunnel support design, at least two systems should be used and they should be checked through correlation as suggested [2]. Because the RMR and Q systems have different structures and are based on different experiences, some of their parameters and rating procedures for each parameter are different, and there is no scientific basis to correlate them directly—a conclusion that has been evaluated through published data. The rock mass fabric index approach [19] is a truncated version of RMR89 and Q systems and shows comparatively better results for correlation. In this correlation approach, only the rock structure and joint condition parameters are taken into account. Moreover, the traditional method of correlation is replaced by introducing a rock mass fabric index chart, which is similar in structure to the geological strength index (GSI) chart [50]. The RMR and Q correlation results using preliminary support design is also unsatisfactory. The difference between the two rock mass qualities (calculated Q and back calculated Q) exists because of their having different parameters and ratings and the crude correlation between the rock mass quality index and rock bolt spacing [9], which was also highlighted by Palmstorm [40]. Another reason for this is that the two systems are based on different experiences and different methods of calculating the rock mass quality. Comparing the ratings for groundwater of the two systems, the suggested rating for groundwater (based on the general condition) in RMR89 is 15 for completely dry, 10 for damp, 7 for wet, 4 for dripping, and 0 for flowing conditions, whereas the Q system suggests Jw = 1 from the dry to minor flow conditions. Different scenarios yield different results. Furthermore, in the suggested shotcrete thickness for a given tunnel span, the contribution of the rock mass quality to shotcrete thickness is not the same in the support charts of the two system. This is explained in Example 2.
Example 2:
- Tunnel span or De (ESR = 1) = 20 m, Shotcrete thickness = 15 cm
- Contribution of rock mass quality for shotcrete thickness in Q system = 50%
- Contribution of rock mass quality for shotcrete thickness in RMR system = 64.4%
5. Conclusions
The following conclusions are obtained from this study:
- The two rock mass classification systems, RMR and Q, are based on jointed rock mass data. They are developed for tunnel support design and updated empirically, either in the form of characterization or support, and extensively used for that purpose. Although there are clear guidelines for the rock mass characterization, generally discrete/lump approaches are used to obtain it because these latter methods are not difficult to use. However, they yield characterizations that are not as exact as those obtained through the use of continuous rating charts. To rate intact rock strength, RQD, discontinuity spacing, and joint frequency correctly and without difficulty through the continuous function, equations that match well with available continuous rating charts are proposed.
- Currently, in both systems, rock bolt spacing is the function of the rock mass quality only, whereas the shotcrete thickness is the function of the tunnel span along with the rock mass quality. However, their contribution to shotcrete thickness is not always the same. This principal of the support has been used for the development of the back analysis for rock mass quality determination.
- The back calculation results from 462 tunnel sections show that significantly heavier supports than those estimated by RMR89 and RMR14 have been installed for the tunnel stability in highly stressed environments. The reason behind the difference in the actual and recommended supports is the absence of the stress parameter in the RMR structure. As the RMR89 system is based on shallow tunnel experiences, this parameter needs attention in the RMR89 structure to extend its application in such an environment.
- The RMR14 system is explained for the purpose of correlating it with RMR89. It was found that a strong correlation exists between them. The explanation also reveals the importance of RMR89 in the structure of RMR14, which leads to the conclusion that RMR14 cannot be determined without RMR89.
- The existing approaches for the correlation between RMR89 and Q were evaluated empirically. When using these systems for tunnel support design, correlating them is suggested. Results show that the rock mass fabric index approach yields comparatively better results than other approaches do. When using rock mass fabric index for correlating RMR and Q, the limitation should be taken into account.
Author Contributions
H.-K.Y. supervised the research. H.R. has developed the proposed research concept. A.M.N. and J.-j.K. helped in writing and re-checking the paper technically as well as grammatically.
Acknowledgments
This study was supported by the Development of Design and Construction Technology for Double Deck Tunnel in Great Depth Underground Space (17SCIP-B089409-04) from Construction Technology Research Program funded by Ministry of Land, Infrastructure and Transport of the Korean government. The authors (Hafeezur Rehman and Abdul Muntaqim Naji) are extremely thankful to the Higher Education Commission (HEC) of Pakistan for HRDI-UESTPs scholarship.
Conflicts of Interest
The authors declare no conflict of interest.
References
- Shen, Y.-j.; Yan, R.-x.; Yang, G.-s.; Xu, G.-l.; Wang, S.-y. Comparisons of evaluation factors and application effects of the new [BQ] gsi system with international rock mass classification systems. Geotech. Geol. Eng. 2017, 35, 2523–2548. [Google Scholar]
- Barton, N.; Bieniawski, Z. RMR and Q-Setting Record Straight; Tunnels & Tunnelling International; Progressive Media Markets, Ltd.: London, UK, 2008. [Google Scholar]
- Barton, N.; Grimstad, E. Forty Years with the Q-System in Norway and Abroad; Fjellsprengningsteknikk, NFF: Olso, Norway, 2014. [Google Scholar]
- Pells, P.; Bieniawski, Z.; Hencher, S.; Pells, S. Rock quality designation (RQD): Time to rest in peace. Can. Geotech. J. 2017, 54, 825–834. [Google Scholar] [CrossRef]
- Bieniawski, Z. Engineering classification of jointed rock masses. Civ. Eng. S. Afr. 1973, 15, 333–343. [Google Scholar]
- Bieniawski, Z.T. Engineering Rock Mass Classifications: A Complete Manual for Engineers and Geologists in Mining, Civil, and Petroleum Engineering; John Wiley & Sons: Hoboken, NJ, USA, 1989. [Google Scholar]
- Celada, B.; Tardáguila, I.; Varona, P.; Rodríguez, A.; Bieniawski, Z. Innovating tunnel design by an improved experience-based RMR system. In Proceedings of the World Tunnel Congress 2014, Foz do Iguaçu, Brazil, 9–15 May 2014; p. 9. [Google Scholar]
- Barton, N.; Lien, R.; Lunde, J. Engineering classification of rock masses for the design of tunnel support. Rock Mech. 1974, 6, 189–236. [Google Scholar] [CrossRef]
- Grimstad, E.; Barton, N. Updating the q-system for NMT. In Proceedings of the International Symposium on Sprayed Concrete-Modern Use of Wet Mix Sprayed Concrete for Underground Support, Fagemes, Norwary, 22–26 October 1993; Norwegian Concrete Association: Olso, Norway, 1993. [Google Scholar]
- Barton, N. Some new q-value correlations to assist in site characterisation and tunnel design. Int. J. Rock Mech. Min. Sci. 2002, 39, 185–216. [Google Scholar] [CrossRef]
- NGI. The Q-System, Rock Mass Classification and Support Design. Available online: https://www.ngi.no/eng/Publications-and-library/Books/Q-system (accessed on 9 April 2018).
- Goel, R.; Singh, B. Engineering Rock Mass Classification: Tunnelling, Foundations and Landslides; Elsevier: New York, NY, USA, 2011. [Google Scholar]
- Stille, H.; Palmström, A. Classification as a tool in rock engineering. Tunn. Undergr. Space Technol. 2003, 18, 331–345. [Google Scholar] [CrossRef]
- Palmstrom, A.; Milne, D.; Peck, W. The reliability of rock mass classification used in underground excavation and support design. ISRM News J. 2001, 6, 40–41. [Google Scholar]
- Lowson, A.; Bieniawski, Z. Critical assessment of rmr based tunnel design practices: A practical engineer’s approach. In Proceedings of the SME, Rapid Excavation and Tunnelling Conference, Washington, DC, USA, 23–26 June 2013; pp. 180–198. [Google Scholar]
- Bieniawski, Z.T. Rock Mechanics Design in Mining and Tunneling; A.A. Balkema: Boston, MA, USA, 1984. [Google Scholar]
- Stille, H.; Palmström, A. Ground behaviour and rock mass composition in underground excavations. Tunn. Undergr. Space Technol. 2008, 23, 46–64. [Google Scholar] [CrossRef]
- Palmstrom, A.; Stille, H. Ground behaviour and rock engineering tools for underground excavations. Tunn. Undergr. Space Technol. 2007, 22, 363–376. [Google Scholar] [CrossRef]
- Tzamos, S.; Sofianos, A. A correlation of four rock mass classification systems through their fabric indices. Int. J. Rock Mech. Min. Sci. 2007, 44, 477–495. [Google Scholar] [CrossRef]
- Bieniawski, Z. Geomechanics classification of rock masses and application in tunneling. In Proceedings of the 3rd International Congress on Rock Mechanics, Denver, CO, USA, 1–7 September 1974; pp. 27–32. [Google Scholar]
- Bieniawski, Z. Case studies: Prediction of rock mass behaviour by the geomechanics classification. In Proceedings of the Second Australia-New Zealand Conference on Geomechanics, Brisbane, Australia, 21–25 July 1975; Institution of Engineers, Australia: Barton, Australia, 1975; p. 36. [Google Scholar]
- Bieniawski, Z. The geomechanics classification in rock engineering applications. In Proceedings of the 4th ISRM Congress, Montreux, Switzerland, 2–8 September 1979. [Google Scholar]
- Bieniawski, Z. Misconceptions in the applications of rock mass classifications and their corrections. In Proceedings of the ADIF Seminar on Advanced Geotechnical Characterization for Tunnel Design, Marid, Spain, 29 June 2011; pp. 4–9. [Google Scholar]
- Gurocak, Z.; Solanki, P.; Zaman, M.M. Empirical and numerical analyses of support requirements for a diversion tunnel at the boztepe dam site, eastern turkey. Eng. Geol. 2007, 91, 194–208. [Google Scholar] [CrossRef]
- Anbalagan, R.; Singh, B.; Bhargava, P. Half tunnels along hill roads of himalaya—An innovative approach. Tunn. Undergr. Space Technol. 2003, 18, 411–419. [Google Scholar] [CrossRef]
- Dalgıç, S. A comparison of predicted and actual tunnel behaviour in the Istanbul metro, turkey. Eng. Geol. 2002, 63, 69–82. [Google Scholar] [CrossRef]
- Polishook, B.; Flexer, A. Assessment of chalk rock mass in excavations. Bull. Eng. Geol. Environ. 1998, 57, 145–150. [Google Scholar] [CrossRef]
- Şen, Z.; Sadagah, B.H. Modified rock mass classification system by continuous rating. Eng. Geol. 2003, 67, 269–280. [Google Scholar] [CrossRef]
- Deere, D.; Hendron, A.; Patton, F.; Cording, E. Design of surface and near-surface construction in rock. In Proceedings of the 8th US Symposium on Rock Mechanics (USRMS), Minneapolis, MN, USA, 15–17 September 1966. [Google Scholar]
- Palmstrom, A. Measurements of and correlations between block size and rock quality designation (RQD). Tunn. Undergr. Space Technol. 2005, 20, 362–377. [Google Scholar] [CrossRef]
- Priest, S.; Hudson, J. Estimation of discontinuity spacing and trace length using scanline surveys. Int. J. Rock Mech. Min. Sci. Geomech. Abstr. 1981, 18, 183–197. [Google Scholar] [CrossRef]
- De Vallejo, L.G. Src rock mass classification of tunnels under high tectonic stress excavated in weak rocks. Eng. Geol. 2003, 69, 273–285. [Google Scholar] [CrossRef]
- ASTM. Standard Test Method for Slake Durability of Shales and Similar Weak Rocks; ASTM: West Conshohocken, PA, USA, 1998. [Google Scholar]
- Bieniawski, Z.T.; Aguado, D.; Celada, B.; Rodriquez, A. Forecasting tunnelling behaviour. Tunn. Tunn. Int. 2011, 39–42. Available online: http://www.geocontrol.es/geocontrol/images/pdf/publicaciones/2011/3_FORECASTING_TBM_GEOCONTROL_BIENIAWSKI_CELADA.pdf (accessed on 14 May 2018).
- Kalamaras, G.S.; Bieniawski, Z. A rock mass strength concept for coal seams incorporating the effect of time. In Proceedings of the 8th ISRM Congress, Tokyo, Japan, 25–29 September 1995. [Google Scholar]
- Rehman, H.; Kim, J.-J.; Yoo, H.-K. Stress reduction factor characterization for highly stressed jointed rock based on tunneling data from Pakistan. In Proceedings of the World Congress on Advances in Structural Engineering and Mechanics (ASEM17), Seoul, Korea, 28 August–1 September 2017. [Google Scholar]
- Basarir, H.; Ozsan, A.; Karakus, M. Analysis of support requirements for a shallow diversion tunnel at guledar dam site, Turkey. Eng. Geol. 2005, 81, 131–145. [Google Scholar] [CrossRef]
- Sari, D.; Pasamehmetoglu, A. Proposed support design, Kaletepe tunnel, Turkey. Eng. Geol. 2004, 72, 201–216. [Google Scholar] [CrossRef]
- Rahimi, B.; Shahriar, K.; Sharifzadeh, M. Evaluation of rock mass engineering geological properties using statistical analysis and selecting proper tunnel design approach in Qazvin–Rasht railway tunnel. Tunn. Undergr. Space Technol. 2014, 41, 206–222. [Google Scholar] [CrossRef]
- Palmstrom, A.; Broch, E. Use and misuse of rock mass classification systems with particular reference to the q-system. Tunn. Undergr. Space Technol. 2006, 21, 575–593. [Google Scholar] [CrossRef]
- Bieniawski, Z.T. Exploration for Rock Engineering: Proceedings of the Symposium on Exploration for Rock Engineering, Johannesburg, 1–5 November 1976; AA Balkema: Johannesburg, South Africa, 1976; Volume 1. [Google Scholar]
- Ranasooriya, J.; Nikraz, H. Reliability of the linear correlation of rock mass rating (RMR) and tunnelling quality index (Q). Aust. Geomech. 2009, 44, 47–54. [Google Scholar]
- Sunwoo, C.; Hwang, S.-H. Correlation of rock mass classification methods in Korean rock mass. In Proceedings of the ISRM International Symposium-2nd Asian Rock Mechanics Symposium, Beijing, China, 11–14 September 2001. [Google Scholar]
- Castro-Fresno, D.; Diego-Carrera, R.; Ballester-Muñoz, F.; Álvarez-García, J. Correlation between Bieniawski’s RMR and Barton’s Q index in low-quality soils. Rev. Constr. 2010, 9, 107–119. [Google Scholar] [CrossRef]
- Fernandez-Gutierrez, J.; Perez-Acebo, H.; Mulone-Andere, D. Correlation between Bieniawski’s RMR Index and Barton’s Q index in fine-grained sedimentary rock formations. Inf. Constr. 2017, 69, e205. [Google Scholar] [CrossRef]
- Pells, P. Developments in the design of tunnels and caverns in the Triassic rocks of the sydney region. Int. J. Rock Mech. Min. Sci. 2002, 39, 569–587. [Google Scholar] [CrossRef]
- Sari, Y.D.; Gunhan Pasamehmetoglu, A.; Cetiner, E.; Donmez, S. Numerical analysis of a tunnel support design in conjunction with empirical methods. Int. J. Geomech. 2008, 8, 74–81. [Google Scholar] [CrossRef]
- Goel, R.; Jethwa, J.; Paithankar, A. Indian experiences with Q and RMR systems. Tunn. Undergr. Space Technol. 1995, 10, 97–109. [Google Scholar] [CrossRef]
- Kanik, M.; Gurocak, Z.; Alemdag, S. A comparison of support systems obtained from the RMR89 and RMR14 by numerical analyses: Macka tunnel project, NE Turkey. J. Afr. Earth Sci. 2015, 109, 224–238. [Google Scholar] [CrossRef]
- Sonmez, H.; Ulusay, R. Modifications to the geological strength index (GSI) and their applicability to stability of slopes. Int. J. Rock Mech. Min. Sci. 1999, 36, 743–760. [Google Scholar] [CrossRef]
Figure 1.
Procedure for the back calculation of RMR (RMR*) and tunneling quality index (Q or Qc).
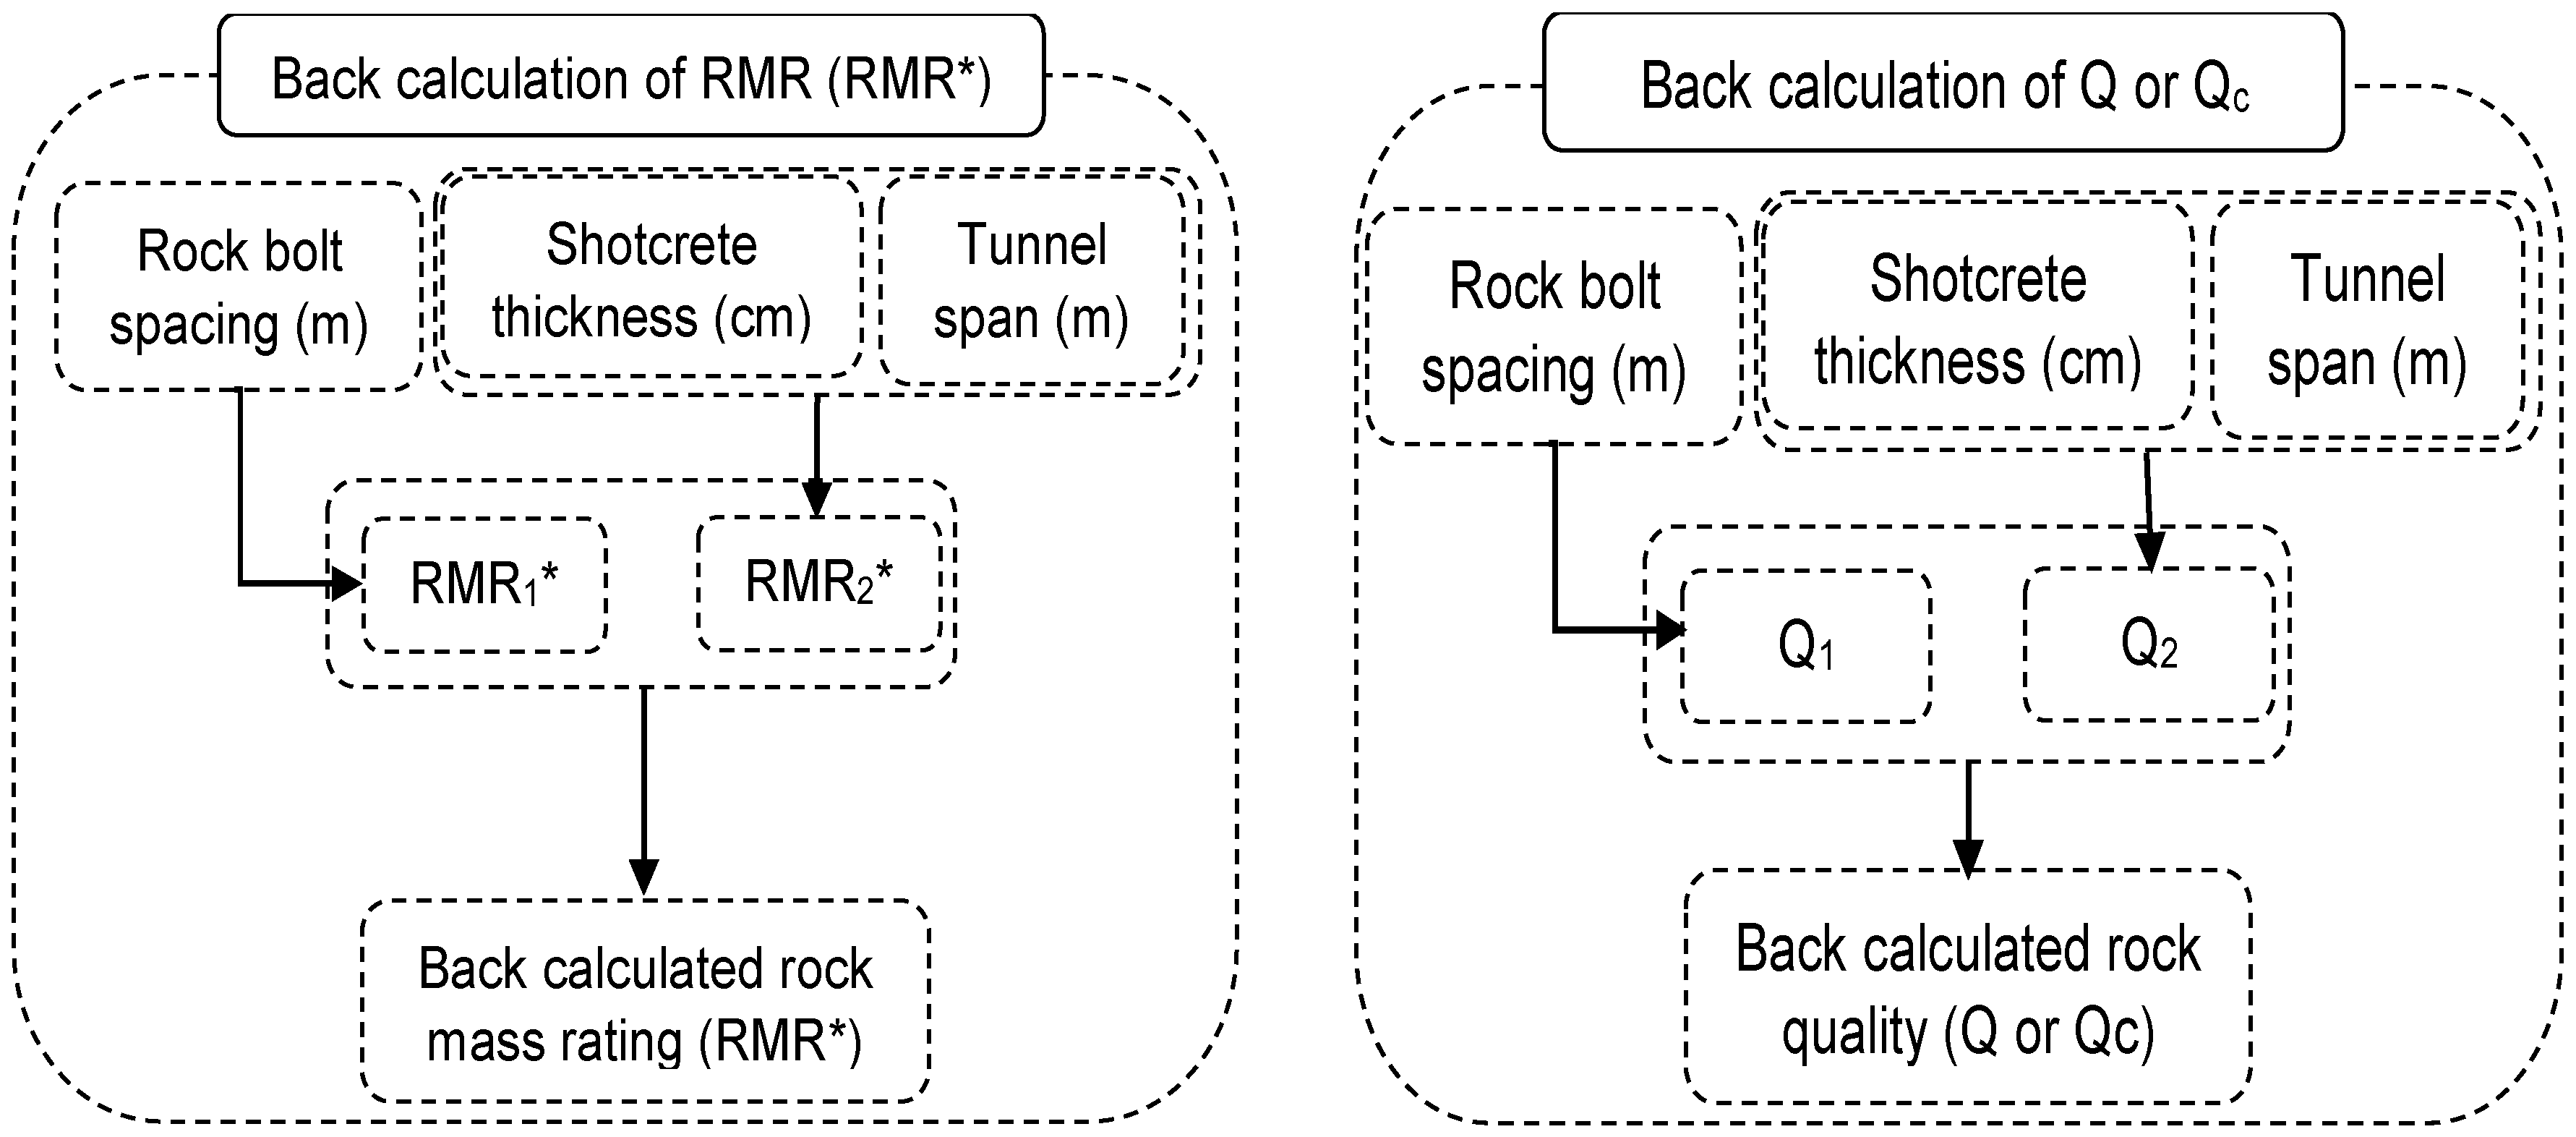
Figure 2.
Comparison of proposed equations results with suggested rating for different parameters. UCS: uniaxial compressive strength.
Figure 2.
Comparison of proposed equations results with suggested rating for different parameters. UCS: uniaxial compressive strength.

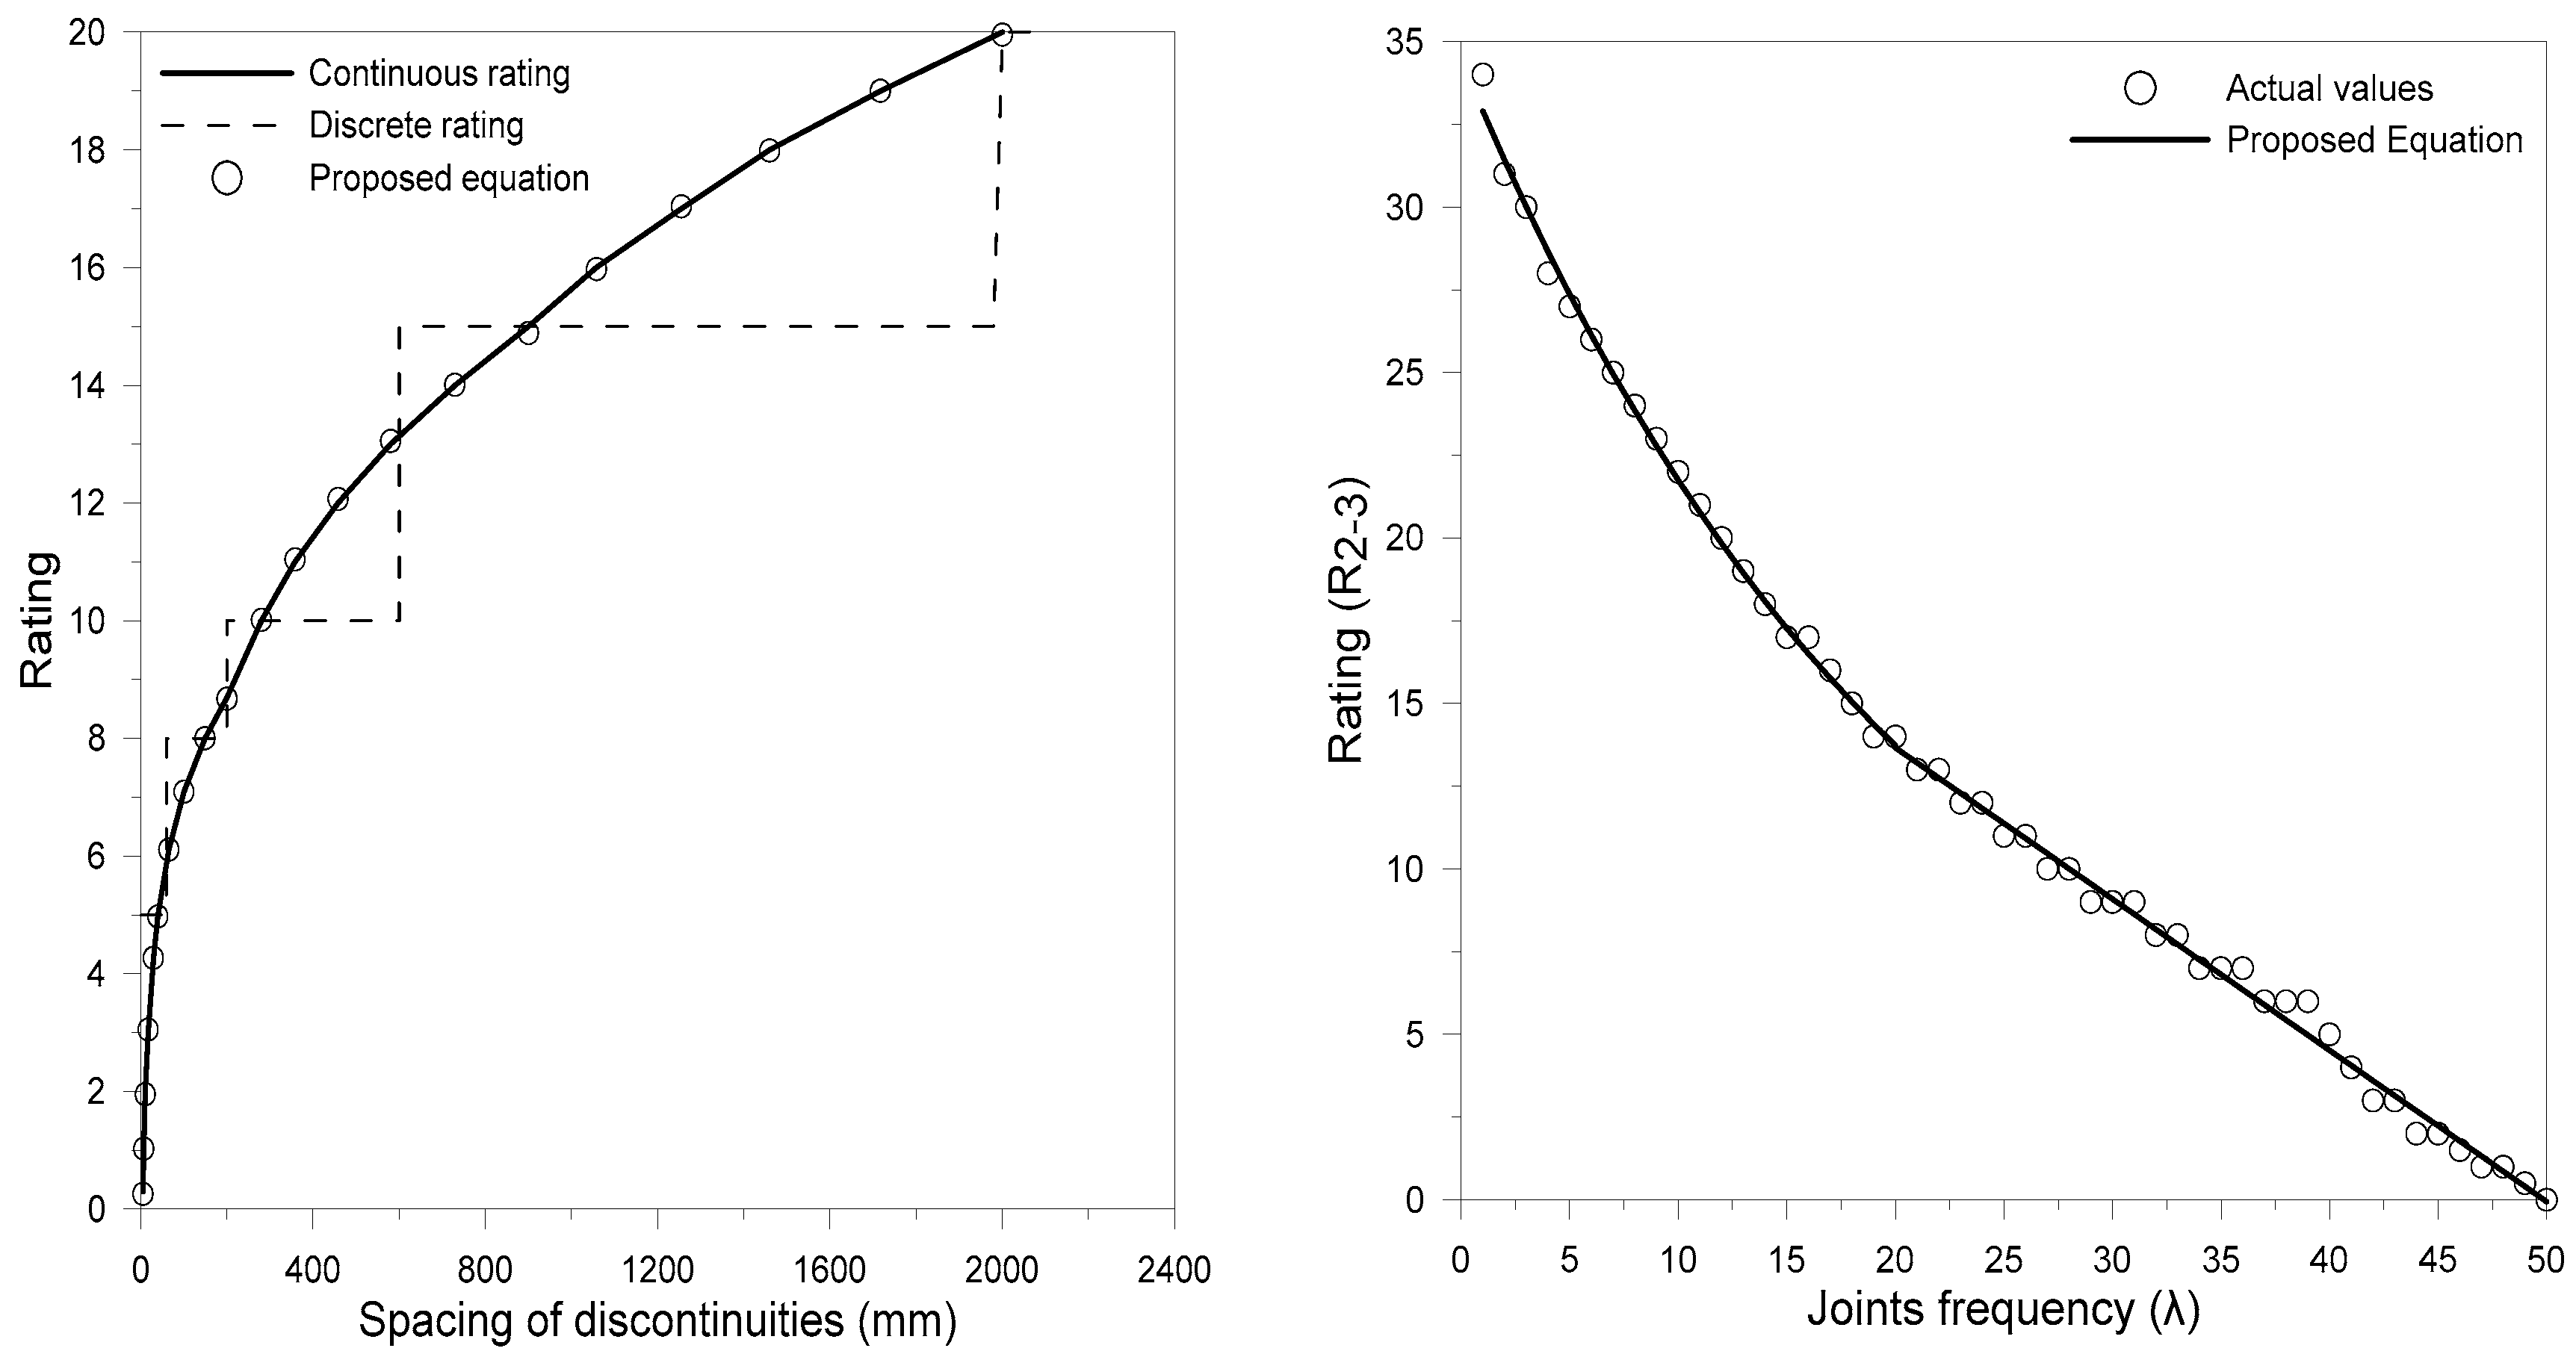
Figure 3.
Percentage frequency of: (a) RQD rating (R2); (b) Joint/fracture spacing rating (R3); (c) rating for groundwater (R5); (d) adjustment rating for the joint orientation with respect to the tunnel axis and excavation direction (R6); (e) RMR89 values for Projects 1–2.
Figure 3.
Percentage frequency of: (a) RQD rating (R2); (b) Joint/fracture spacing rating (R3); (c) rating for groundwater (R5); (d) adjustment rating for the joint orientation with respect to the tunnel axis and excavation direction (R6); (e) RMR89 values for Projects 1–2.
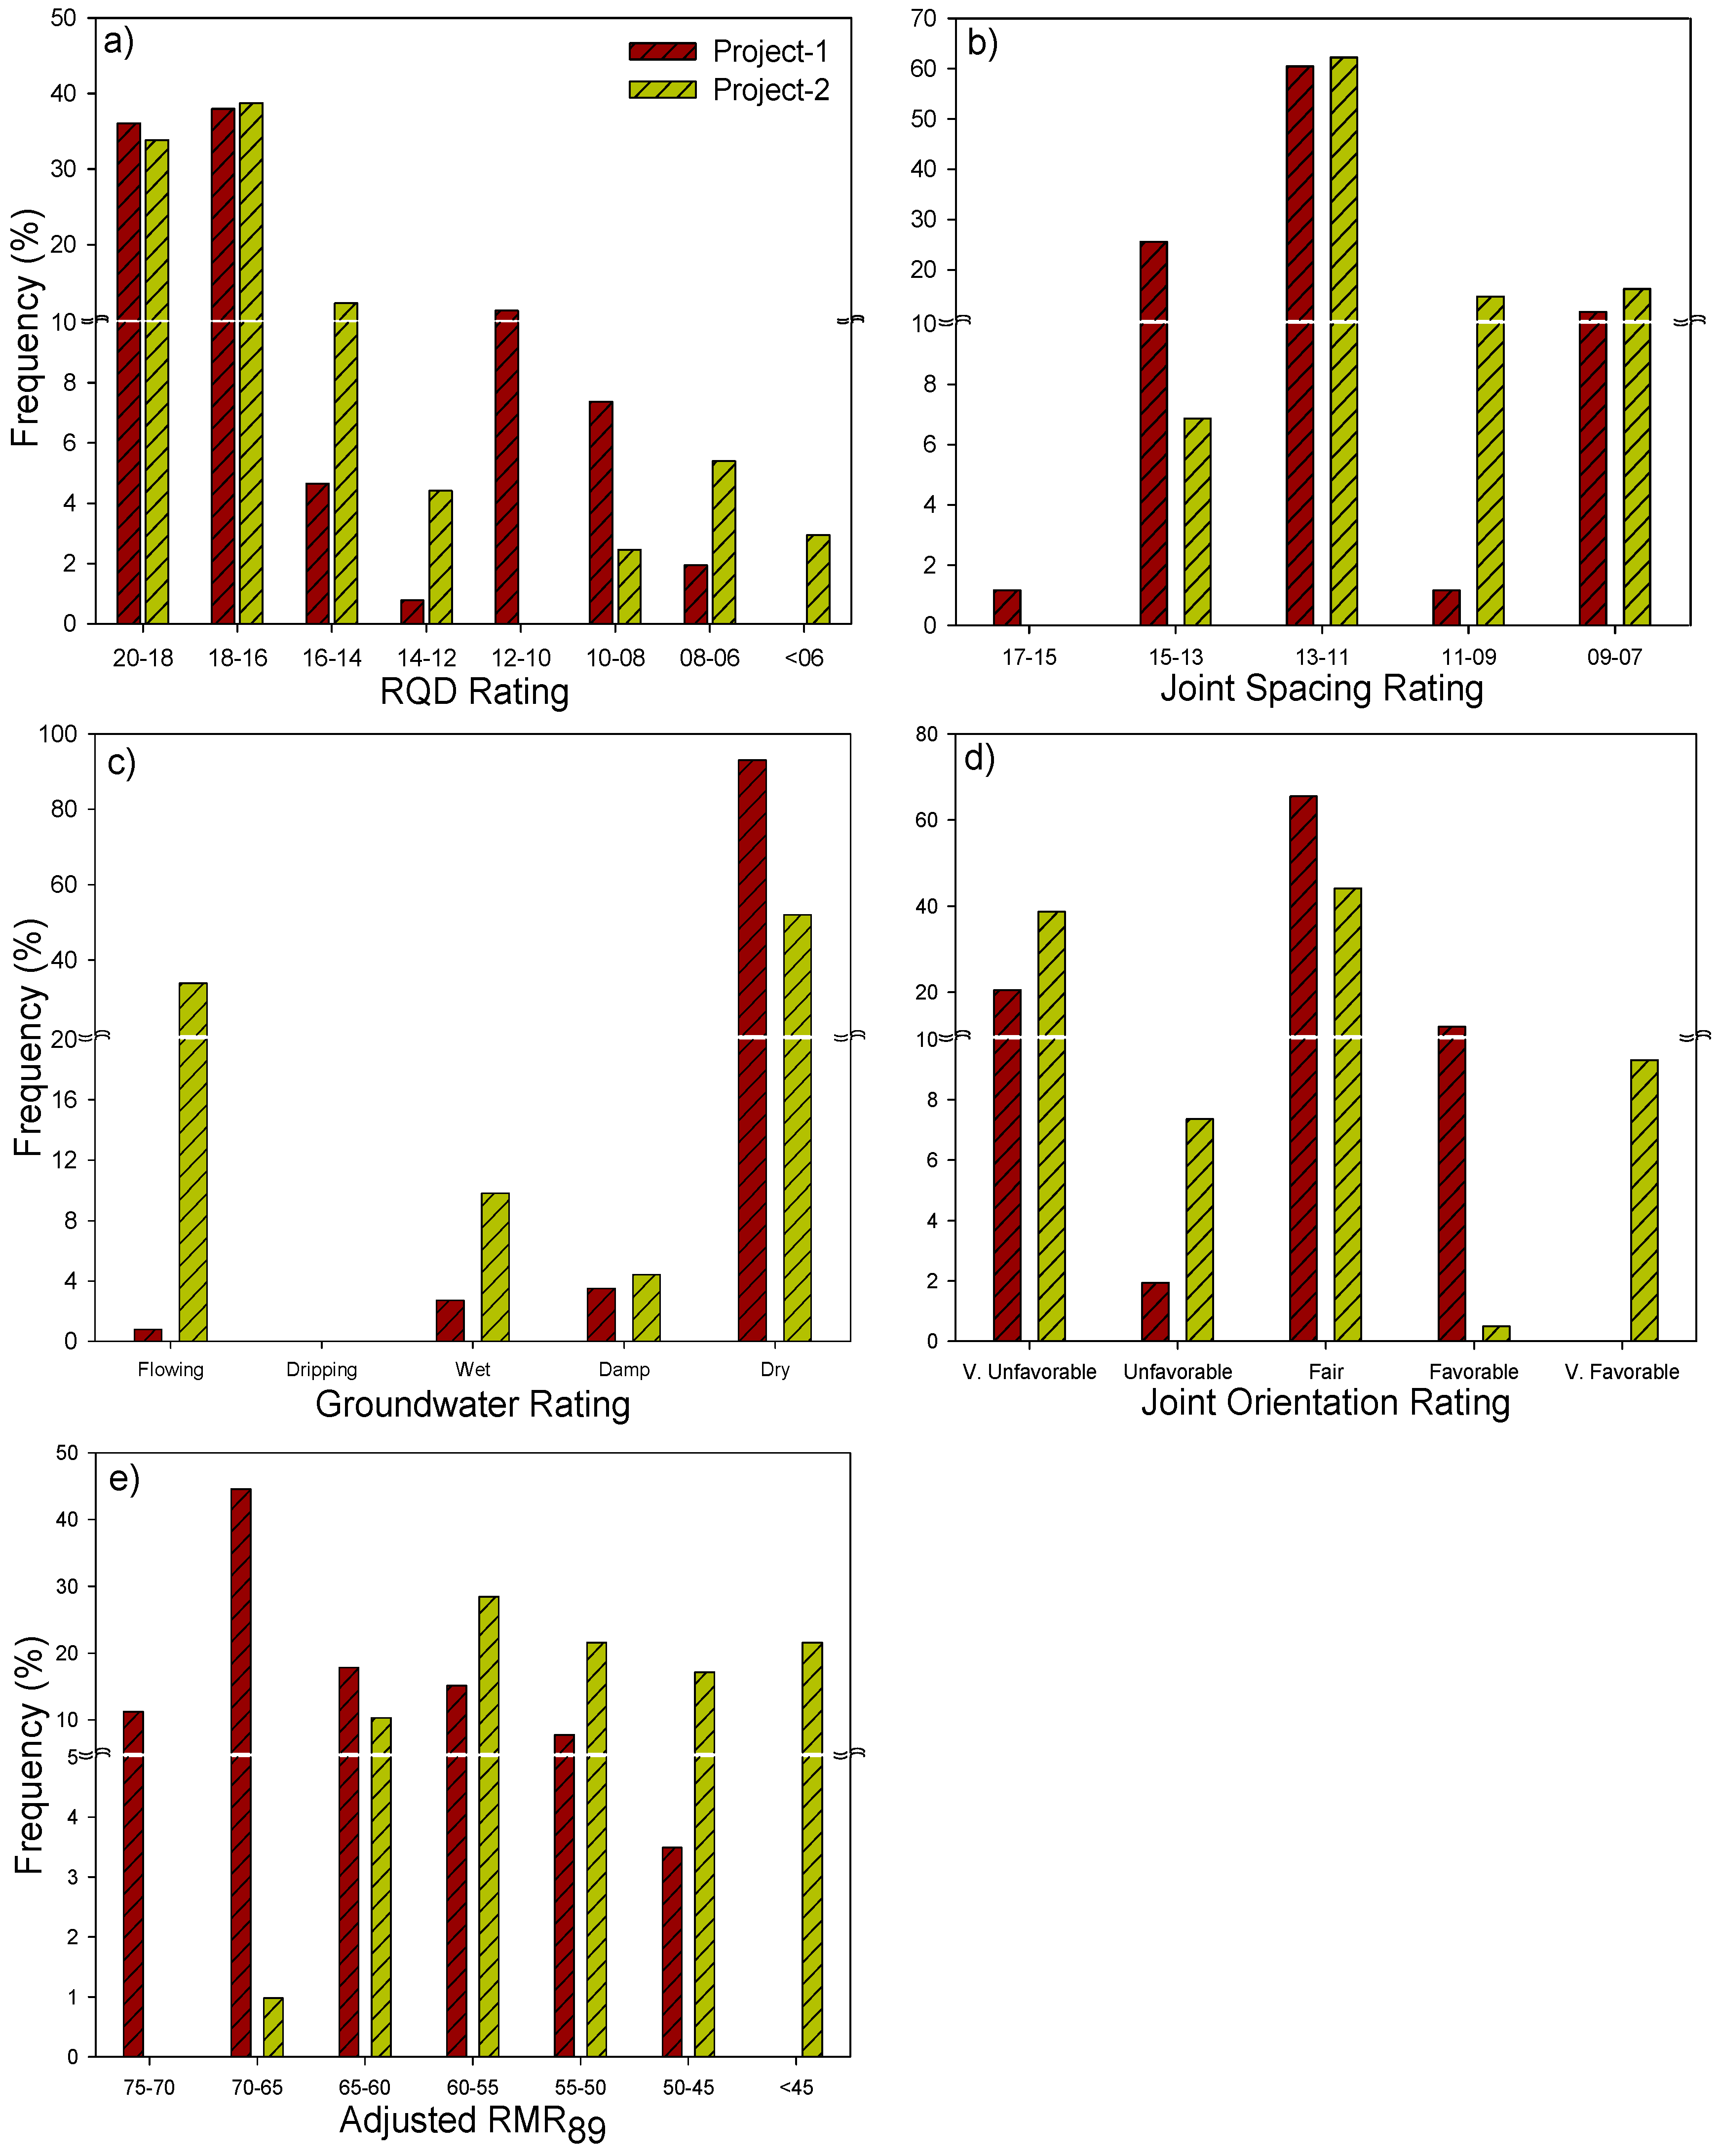
Figure 4.
Difference between RMR89 and RMR* in terms of the percentage frequency for RMR89 > RMR*.
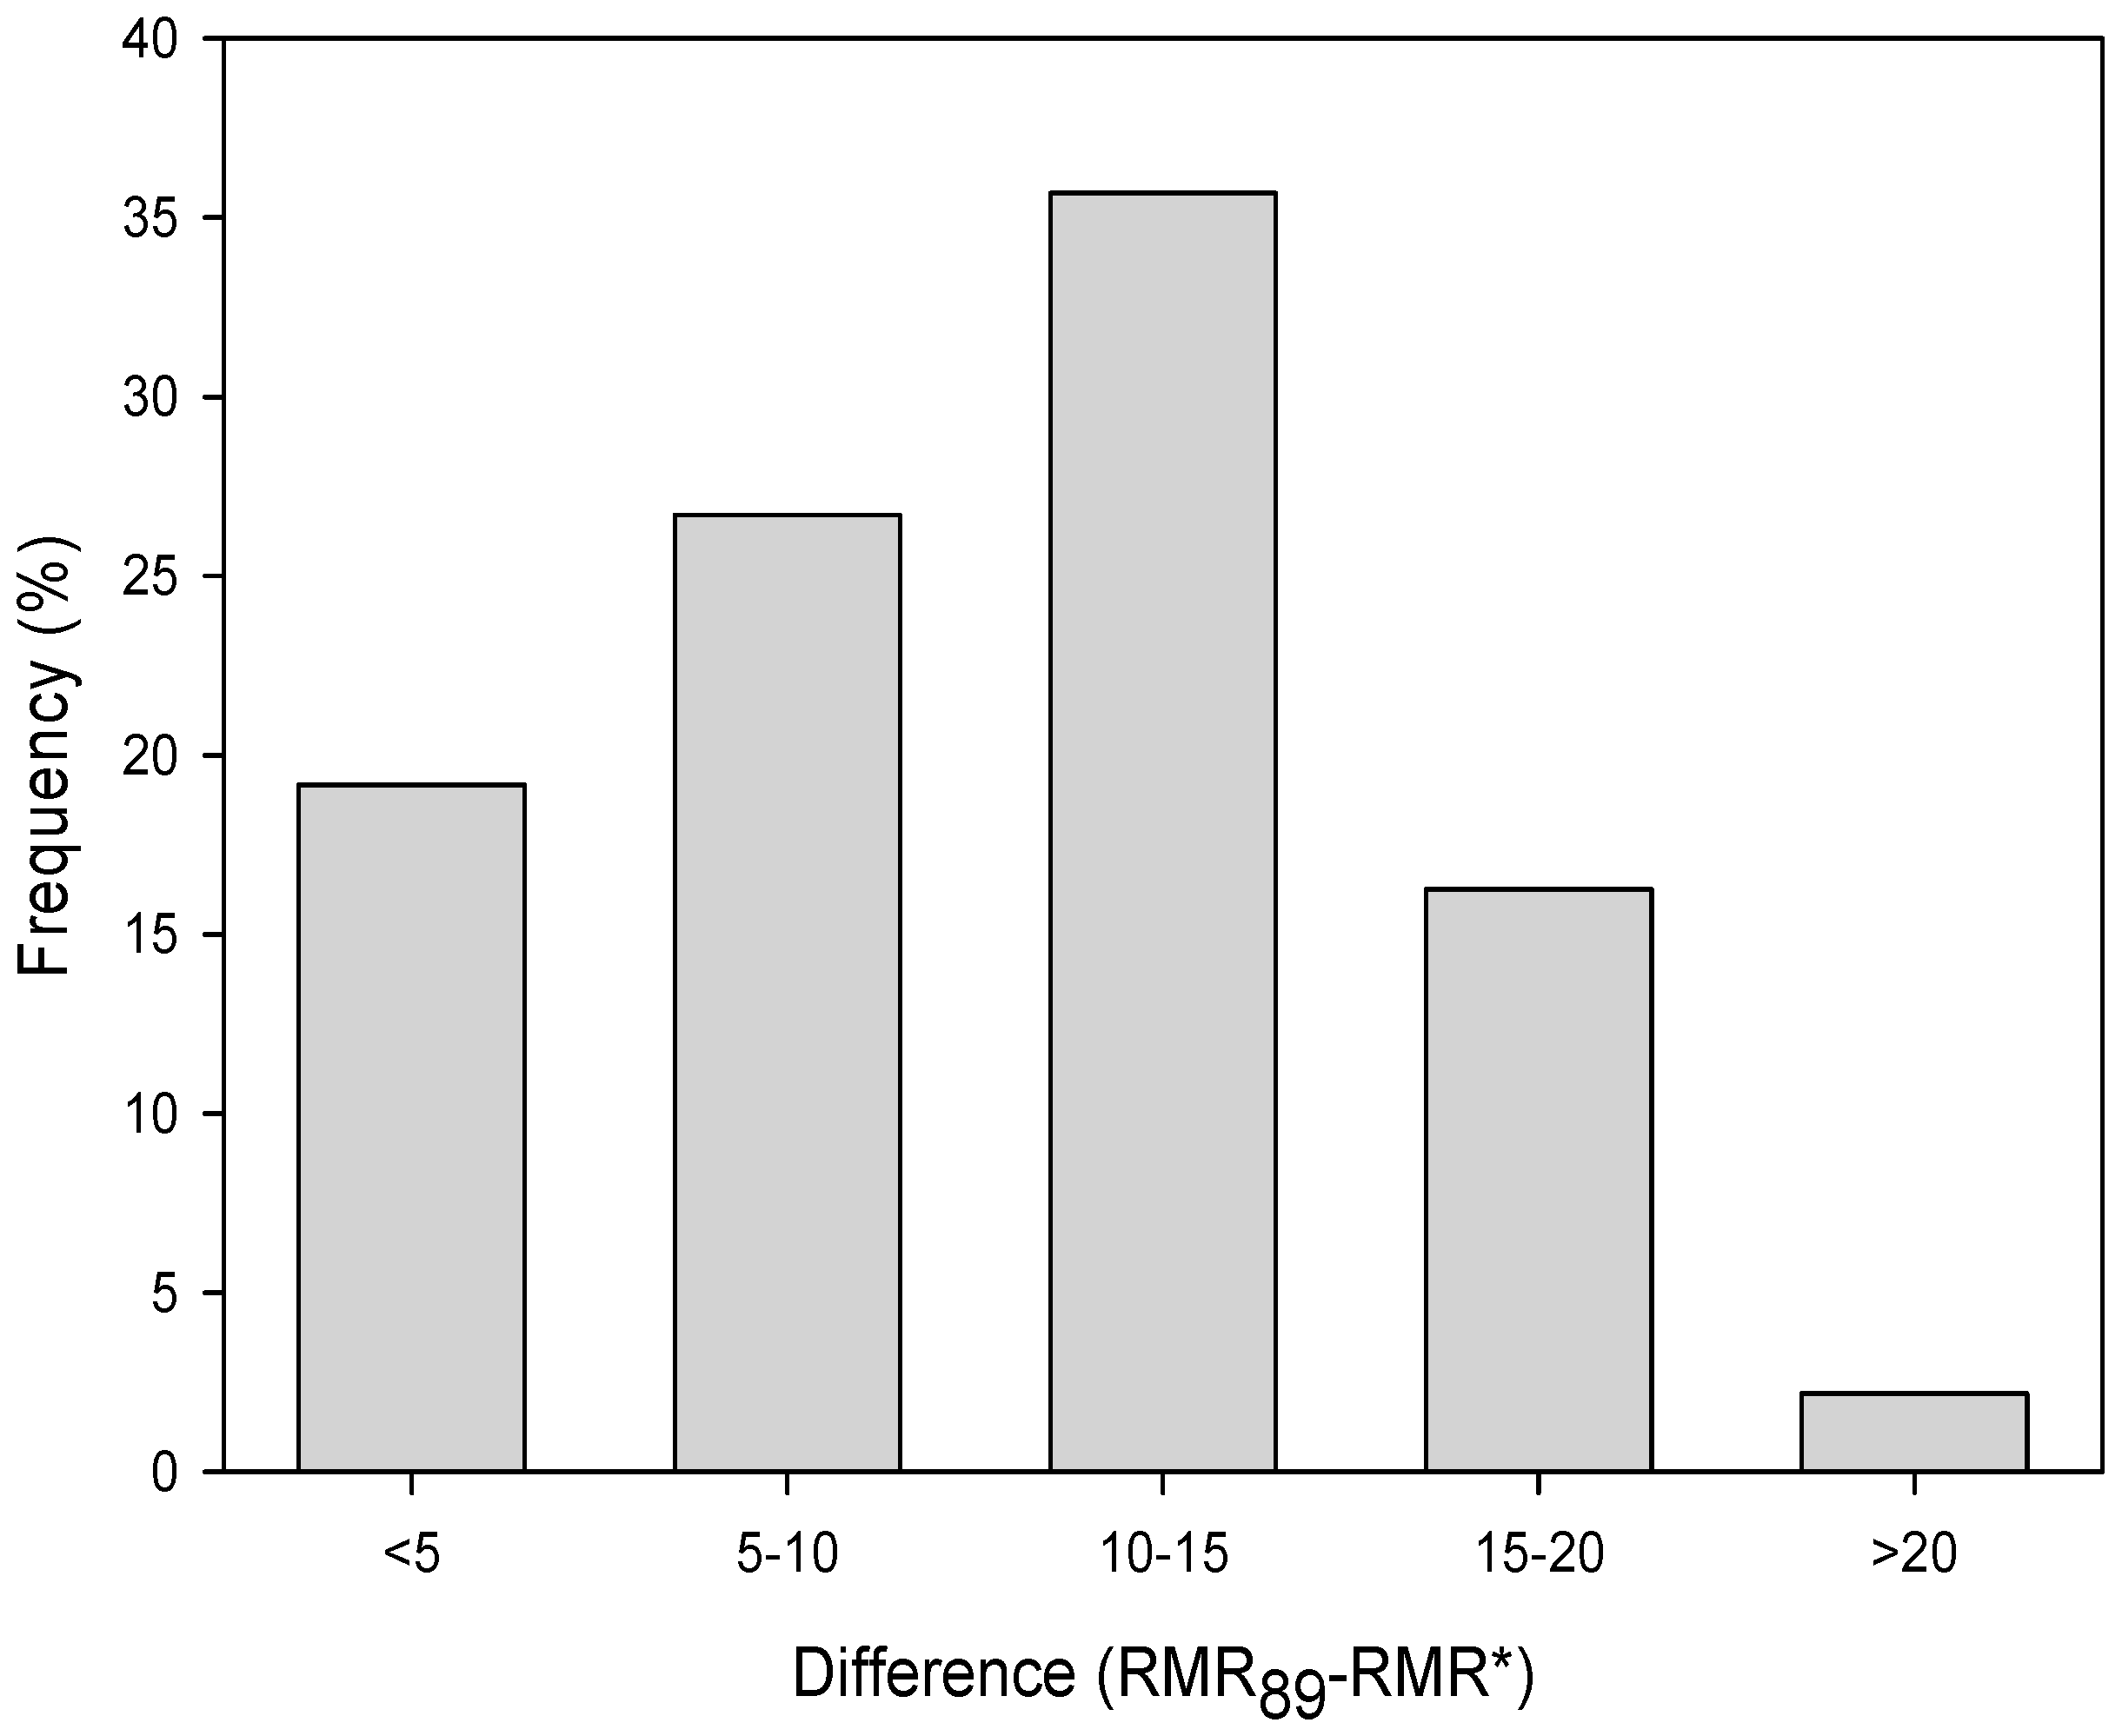
Figure 5.
Strength–stress ratio for Projects 1–2.

Figure 6.
Details of (a) joint frequency rating; (b) RMR14.
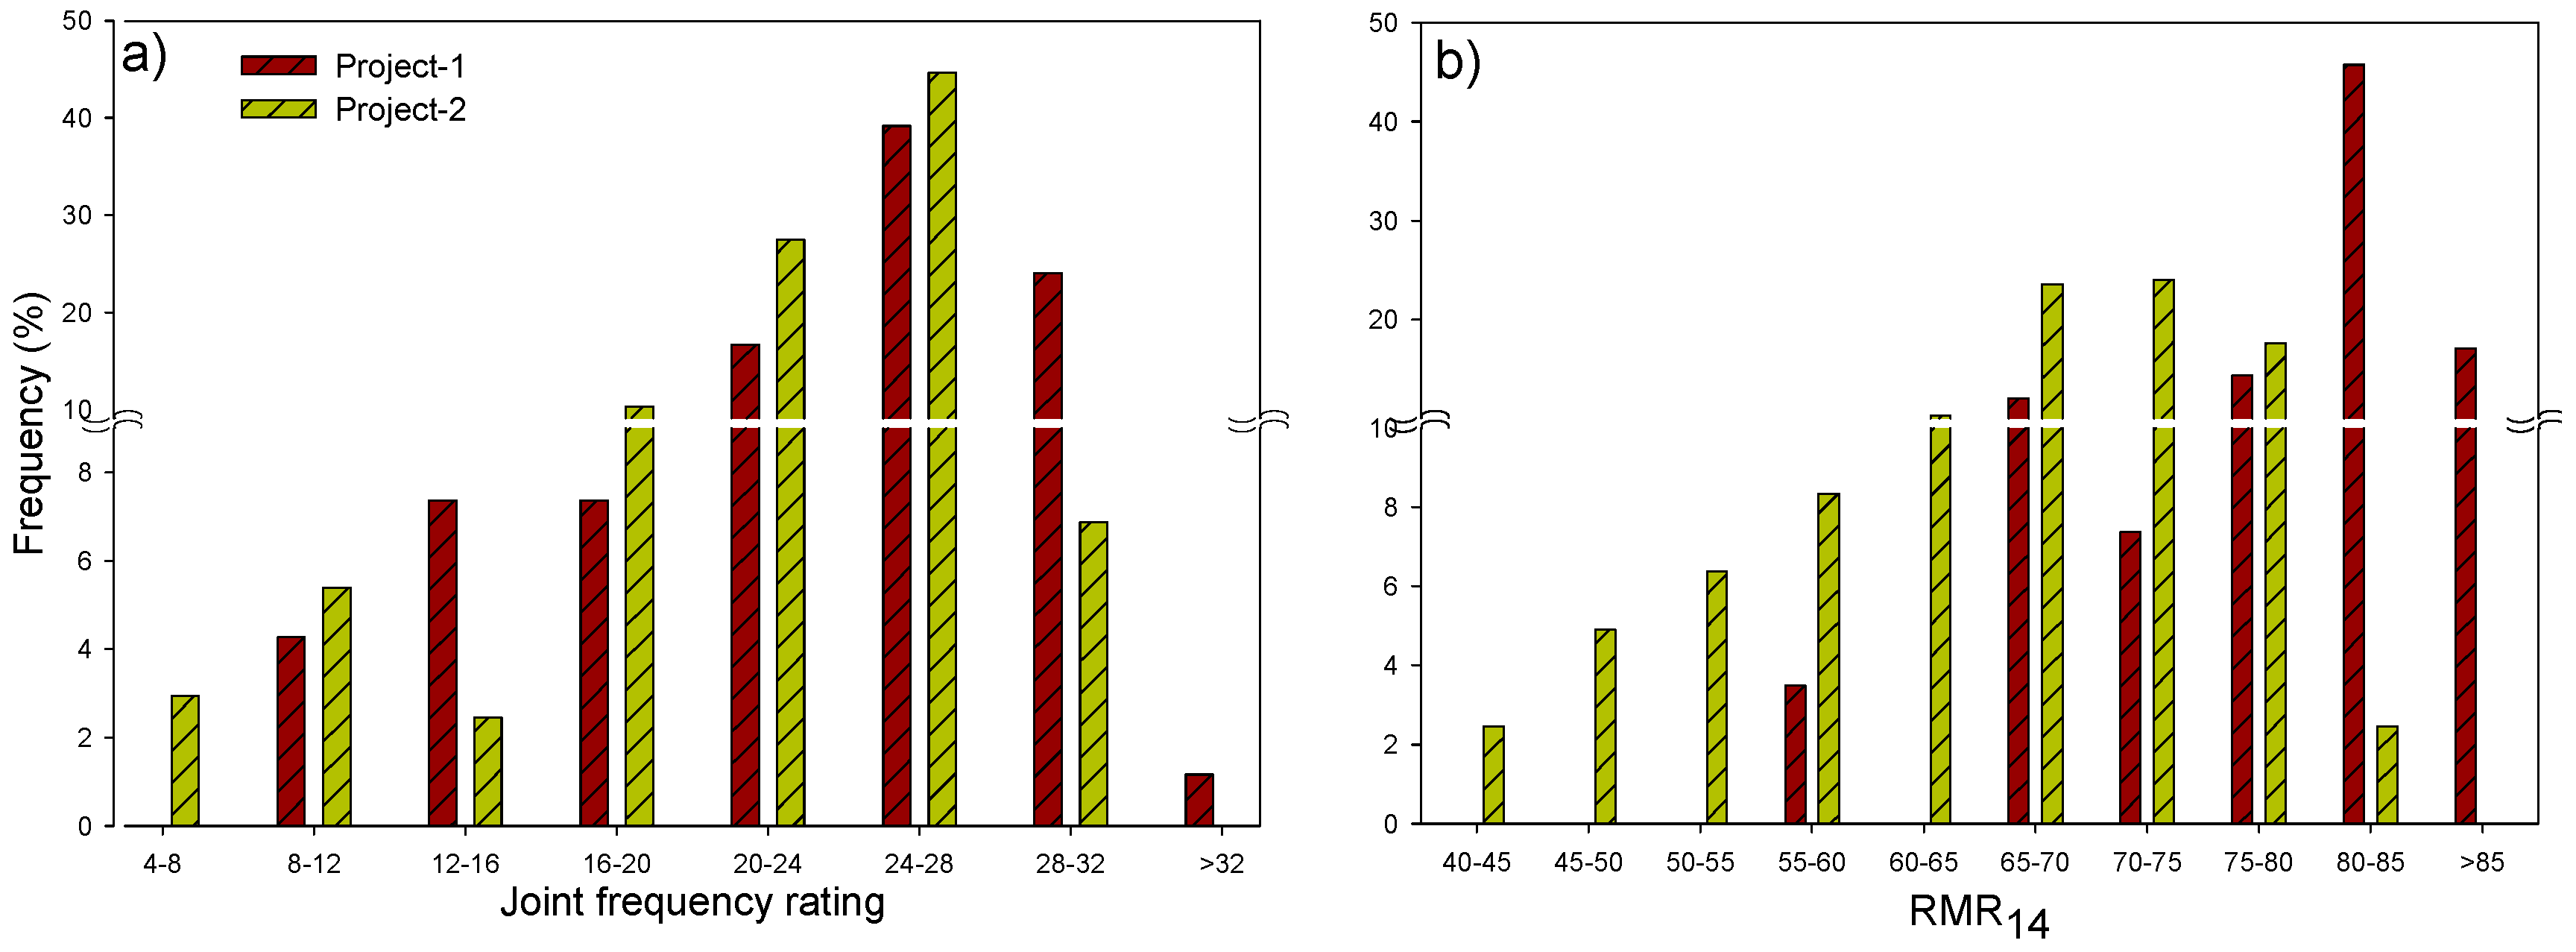
Figure 7.
Difference in RMR14 and RMR* in term of percentage frequency.

Figure 8.
Linear correlation between RMR89 and RMR14.

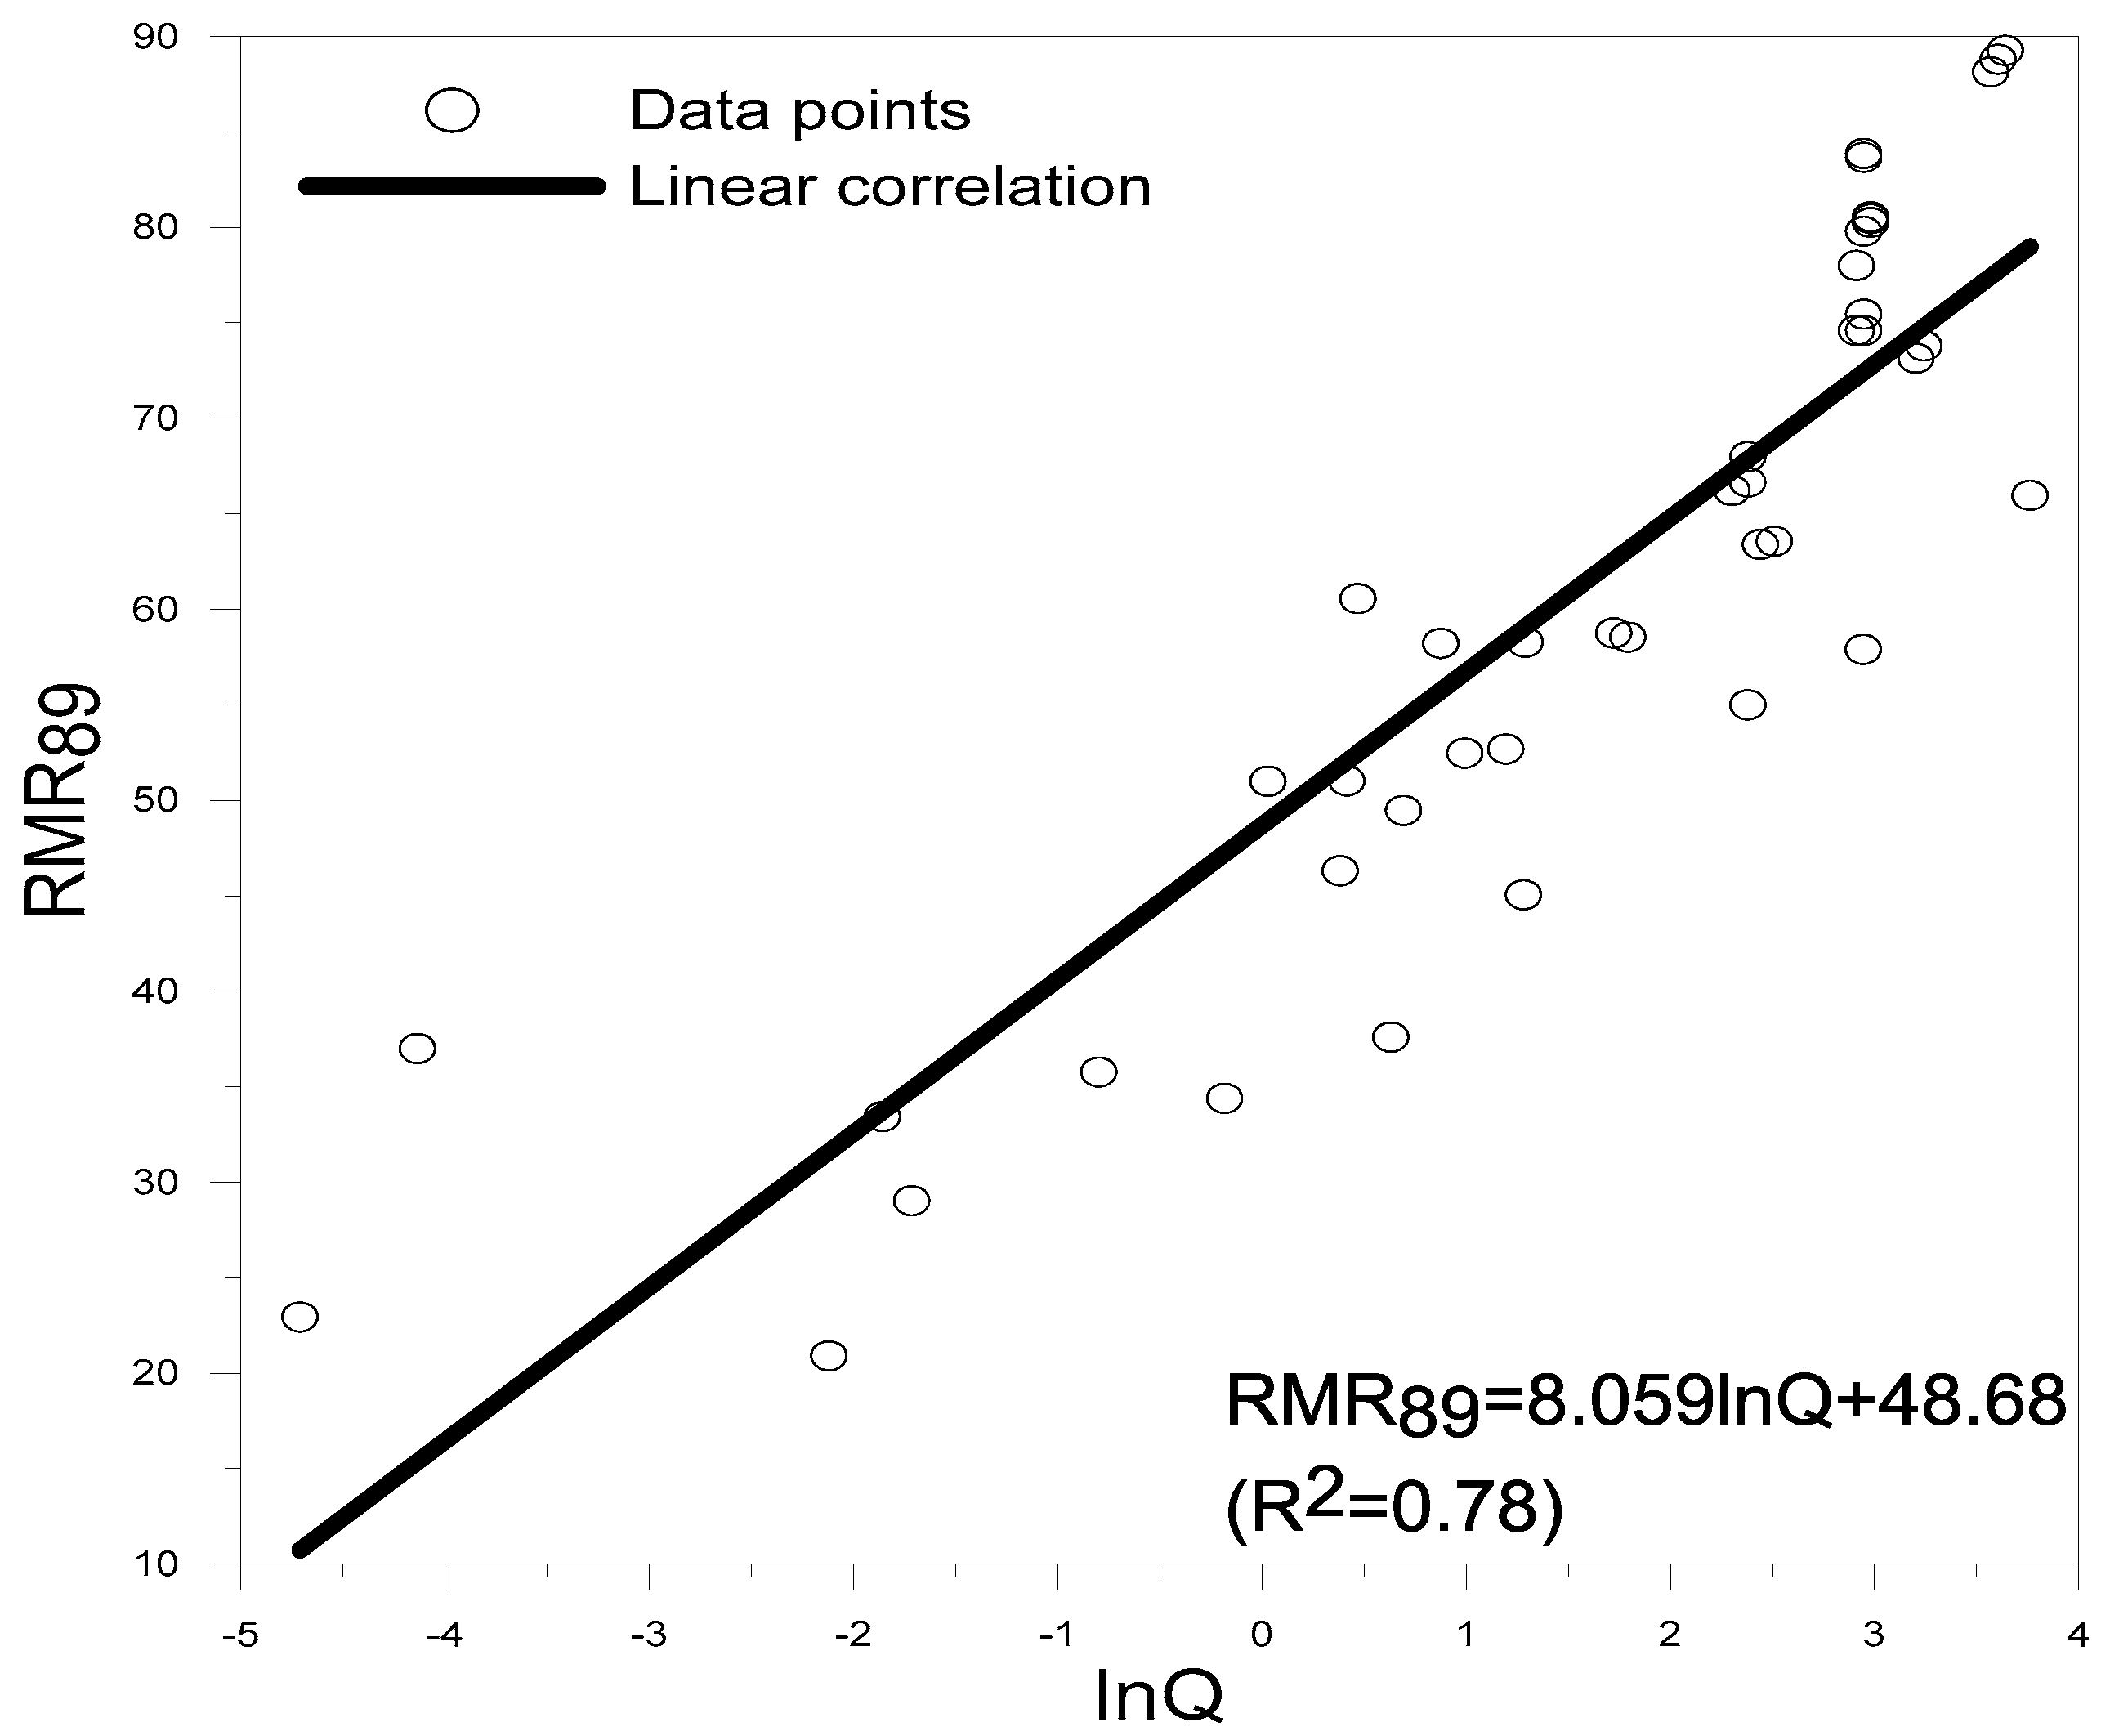
Figure 10.
Linear correlation between N and RMRmod based on the data of Project 1–2.


Table 1.
Rock mass characterization in different versions of the rock mass rating (RMR) classification system. RQD: rock quality designation.
Table 1.
Rock mass characterization in different versions of the rock mass rating (RMR) classification system. RQD: rock quality designation.
| Parameter | RMR | ||||||||
|---|---|---|---|---|---|---|---|---|---|
| 1973 | 1974 | 1975 | 1979 | 1989 | 2011 | 2013 | 2014 | ||
| Intact rock strength (MPa) | 0–10 | 0–10 | 0–15 | 0–15 | 0–15 | 0–15 | 0–15 | 0–15 | |
| RQD (%) | 3–16 | 3–20 | 3–20 | 3–20 | 3–20 | 0–20 | - | - | |
| Joint spacing (mm) | 5–30 | 5–30 | 5–30 | 5–20 | 5–20 | 0–20 | - | - | |
| Discontinuity density (joints/m) | - | - | - | - | - | - | 0–40 | 0–40 | |
| Separation of joints (mm) | 1–5 | - | - | - | - | - | - | - | |
| Continuity of joints (m) | 0–5 | - | - | - | - | - | - | - | |
| Weathering | 1–9 | - | - | - | - | - | - | - | |
| Condition of joints | - | 0–15 | 0–25 | 0–30 | 0–30 | 0–30 | 0–30 | 0–20 | |
| Groundwater | 2–10 | 2–10 | 0–10 | 0–15 | 0–15 | 0–15 | 0–15 | 0–15 | |
| Alterability (%) | - | - | - | - | - | - | - | 0–10 | |
| Adjustment | F0 | 3–15 | 3–15 | 0–(−12) | 0–(−12) | 0–(−12) | 0–(−12) | 0–(−12) | 0–(−12) |
| Fe | - | - | - | - | - | - | - | 1–1.32 | |
| Fs | - | - | - | - | - | - | - | 1–1.3 | |
Table 2.
Comparison of rating for joint condition in RMR89 and RMR14.
| Parameter | Rating | |||||
|---|---|---|---|---|---|---|
| Persistence | Value | <1 m | 1–3 m | 3–10 m | 10–20 m | >20 m |
| RMR89 | 6 | 4 | 2 | 1 | 0 | |
| RMR14 | 5 | 4 | 2 | 0 | 0 | |
| Aperture | Value | None | <0.1 mm | 0.1–1.0 mm | 1–5 mm | >5 mm |
| RMR89 | 6 | 5 | 4 | 1 | 0 | |
| RMR14 | - | - | - | - | - | |
| Roughness | Value | Very rough | rough | Slightly rough | smooth | Slicken-sided |
| RMR89 | 6 | 5 | 3 | 1 | 0 | |
| RMR14 | 5 | 3 | - | 1 | 0 | |
| Infilling | Value | Hard filling | Soft filling | |||
| None | <5 mm | >5 mm | <5 mm | >5 mm | ||
| RMR89 | 6 | 4 | 2 | 2 | 0 | |
| RMR14 | - | 5 | 2 | 2 | 0 | |
| Weathering | Value | Not weathered | Slightly weathered | Moderately weathered | Highly weathered | Decomposed |
| RMR89 | 6 | 5 | 3 | 1 | 0 | |
| RMR14 | 5 | - | 3 | 1 | 0 | |
Table 3.
Data from published papers based on the average values of each site.
| Project | Site | R1 | FRMR | R5 | R6 | RMR89 | FQ | FRMR from FQ | Predicted RMR89 | Tunnel Span (m) | Reference |
|---|---|---|---|---|---|---|---|---|---|---|---|
| Guledar Dam Turkey | Limestone | 6.0 | 34.6 | 7 | −10 | 37.60 | 1.88 | 43 | 46.0 | 3.0 | [37] |
| Sandstone | 6.18 | 22.59 | 7 | 0 | 35.77 | 0.45 | 36 | 49.18 | 3.0 | ||
| Diabase | 3.62 | 13.29 | 4 | 0 | 20.91 | 0.12 | 18 | 25.62 | 3.0 | ||
| Himalaya half tunnel | K1 | 14.88 | 53.13 | 10 | 0 | 78.01 | 46.0 | 62 | 86.88 | 12.0 | [25] |
| K2 | 14.88 | 53.99 | 15 | 0 | 83.87 | 48.0 | 62 | 91.88 | 13.0 | ||
| K3 | 14.88 | 53.79 | 15 | 0 | 83.67 | 48.0 | 62 | 91.88 | 8.0 | ||
| M1 | 15.18 | 57.97 | 15 | 0 | 88.15 | 89.0 | 65 | 95.18 | 9.0 | ||
| M2 | 15.18 | 59.09 | 15 | 0 | 89.27 | 95.0 | 65 | 95.18 | 12.0 | ||
| M3 | 15.18 | 58.63 | 15 | 0 | 88.81 | 92.0 | 65 | 95.18 | 11.0 | ||
| P1 | 12.0 | 51.79 | 10 | 0 | 73.79 | 64.0 | 65 | 87.0 | 10.0 | ||
| P2 | 12.0 | 51.15 | 10 | 0 | 73.15 | 62.0 | 63 | 85.0 | 9.0 | ||
| T1 | 10.51 | 54.09 | 10 | 0 | 74.60 | 48.0 | 63 | 83.51 | 8.0 | ||
| T2 | 10.51 | 59.29 | 10 | 0 | 79.80 | 48.0 | 62 | 82.51 | 8.5 | ||
| T3 | 10.51 | 54.95 | 10 | 0 | 75.46 | 49.0 | 62 | 82.51 | 10.5 | ||
| T4 | 10.51 | 54.75 | 15 | 0 | 80.26 | 49.0 | 62 | 87.51 | 11.0 | ||
| T5 | 10.51 | 60.04 | 10 | 0 | 80.56 | 49.0 | 62 | 82.51 | 11.5 | ||
| T6 | 10.51 | 54.95 | 15 | 0 | 80.46 | 49.0 | 62 | 87.51 | 12.0 | ||
| T7 | 10.51 | 54.09 | 10 | 0 | 74.60 | 48.0 | 62 | 82.51 | 12.0 | ||
| Sydney tunnel | I | 2.97 | 58.0 | 10 | −5 | 65.97 | 135.0 | 67 | 74.97 | 17.0 | [46] |
| II | 1.90 | 53.0 | 8 | −5 | 57.90 | 60.0 | 63 | 67.90 | 17.0 | ||
| III | 1.47 | 45.0 | 8 | −5 | 49.47 | 12.2 | 54 | 58.47 | 17.0 | ||
| IV | 1.03 | 25.0 | 8 | −5 | 29.03 | 2.78 | 43 | 47.03 | 17.0 | ||
| V | 0.94 | 19.0 | 8 | −5 | 22.94 | 0.28 | 22.5 | 26.44 | 17.0 | ||
| Istanbul metro | Sandstone | 11.1 | 49.89 | 7 | 0 | 68.0 | 12.5 | 55 | 73.10 | 6.16 | [26] |
| Sandstone | 5.434 | 35.88 | 10 | −5 | 46.31 | 1.85 | 41 | 51.43 | 6.16 | ||
| Mudstone | 4.04 | 44.24 | 10 | 0 | 58.28 | 2.78 | 42 | 56.04 | 6.16 | ||
| Mudstone | 3.51 | 25.88 | 10 | −5 | 34.39 | 0.52 | 28 | 36.51 | 6.16 | ||
| Excavation in chalk rock | Rosh-haniqa | 1.687 | 48.0 | 15 | −12 | 52.69 | 8.33 | 52 | 56.69 | 6.5 | [27] |
| Beit-she arim | 1.47 | 41.0 | 15 | −5 | 52.47 | 6.67 | 51 | 62.47 | 4.0 | ||
| Mesilat zion | 1.85 | 40.2 | 15 | −12 | 45.05 | 3.6 | 42 | 46.85 | 4.0 | ||
| Maresha | 1.55 | 47.0 | 15 | −5 | 58.55 | 15.0 | 55 | 66.55 | 6.0 | ||
| Avedat | 1.56 | 49.0 | 15 | −5 | 60.56 | 3.89 | 45 | 56.56 | 8.0 | ||
| Ramathovey | 1.77 | 44.0 | 15 | −2 | 58.77 | 5.63 | 50 | 64.77 | 6.3 | ||
| Einziq | 1.62 | 41.60 | 15 | 0 | 58.22 | 2.39 | 40 | 56.62 | 10,8,5 | ||
| Boztepe Dam | Basalt | 4.30 | 36.70 | 15 | −5 | 51.0 | 1.03 | 34 | 48.30 | 5.0 | [24] |
| Tuffite | 1.58 | 21.86 | 15 | −5 | 33.44 | 0.39 | 24 | 35.58 | 5.0 | ||
| Bilecik-Istanbul roadway in Turkey | Section-1 | 1.12 | 25.88 | 15 | −5 | 37.00 | 0.67 | 26 | 37.12 | 12.9 | [47] |
| Section-2 | 6.73 | 34.29 | 15 | −5 | 51.02 | 13.8 | 48 | 64.73 | 12.9 | ||
| Section-3 | 8.04 | 36.96 | 15 | −5 | 55.00 | 46.5 | 34 | 52.03 | 12.9 | ||
| Section-4 | 6.05 | 47.35 | 15 | −5 | 63.40 | 51.8 | 65 | 81.05 | 12.9 | ||
| Section-5 | 7.39 | 49.27 | 15 | −5 | 66.66 | 24.4 | 56 | 73.39 | 12.9 | ||
| Section-6 | 6.95 | 46.61 | 15 | −5 | 63.56 | 27.8 | 60 | 76.95 | 12.9 | ||
| Section-7 | 7.68 | 48.54 | 15 | −5 | 66.22 | 45.0 | 61 | 78.68 | 12.9 |
Table 4.
RMR89 rating for Projects 1–2.
| Parameter | Rating | ||
|---|---|---|---|
| Project 1 | Project 2 | ||
| RQD (%) | 6.44–20 | 3.33–20 | |
| UCS (MPa) | 4.042–6.95 | 4.245–8.73 | |
| Joint Spacing (mm) | 7.88–16.89 | 7.88–14.69 | |
| Joint condition | Persistence (m) | 2 | 2 |
| Aperture (mm) | 3 | 3 | |
| Roughness | 5 | 3 | |
| Infilling (mm) | 6 | 2, 4 and 6 | |
| Weathering | 5 | 3, 5 and 6 | |
| Ground Water | 0–15 | 0–15 | |
| RMRbasic | 56.53–79.84 | 32.98–73.84 | |
| F0 | −12 to −2 | −12 to 0 | |
| RMR89 | 45.6–72.64 | 30.5–66.62 | |
Table 5.
Effect of adjustment rating for strength–stress ratio on RMR89 for 462 tunnel sections of Projects 1–2.
Table 5.
Effect of adjustment rating for strength–stress ratio on RMR89 for 462 tunnel sections of Projects 1–2.
| σc/σ1 | RMR | Min | Max | Mean | Standard Deviation | RMR*/RMR89 | RMR*/RMR89* | ||
|---|---|---|---|---|---|---|---|---|---|
| 5–4 | 4–3 | 3–2 | RMR89 | 32.98 | 72.64 | 58.57 | 9.31 | 0.855 | 1.002 |
| Adjustment rating | RMR* | 40.92 | 54.42 | 50.08 | 4.79 | ||||
| −5 | −10 | −10 | RMR89* | 22.98 | 67.64 | 49.96 | 9.44 | ||
Table 6.
RMR14 rating for Projects 1–2.
| Parameter | Rating | |
|---|---|---|
| Project 1 | Project 2 | |
| Joint frequency (joints/m) | 10.66–32.56 | 6.51–30.33 |
| UCS (MPa) | 4.042–6.95 | 4.245–8.73 |
| Ground Water | 0–15 | 0–15 |
| F0 | −12 to −2 | −12 to 0 |
| Fe | 1 | 1 |
| Fs | 1.186–1.296 | 1.22–1.3 |
| Persistence (m) | 2 | 2 |
| Roughness | 3 | 2 |
| Infilling (mm) | 5 | 2 and 5 |
| Weathering | 4 | 3, 4 and 5 |
| Alterability (%) | 10 | 10 |
| RMRBasic | 55.49–78.51 | 32.88–72.55 |
| RMRAdjusted | 56.33–88.5 | 41.37–84.63 |
Table 7.
Comparison of calculated and back calculated Q.
| Site | Section | RMR89 | Calculated Q | Tunnel Span (m) | Back Calculated Q |
|---|---|---|---|---|---|
| Himalaya half tunnel | K1 | 78.01 | 18.38 | 12 | 43.88 |
| K2 | 83.87 | 19.04 | 13 | 100 | |
| P1 | 73.79 | 25.58 | 10 | 33.88 | |
| T7 | 74.6 | 19.04 | 12 | 51.64 | |
| Sydney Tunnel | I | 65.97 | 43 | 17 | 4.9 |
| II | 57.9 | 19 | 17 | 2.07 | |
| III | 49.67 | 2 | 17 | 0.7 | |
| Istanbul metro | Sandstone | 68 | 10.8 | 6.16 | 7.33 |
| Sandstone | 46.31 | 1.47 | 6.16 | 3.19 | |
| mudstone | 34.39 | 0.83 | 6.16 | 0.36 | |
| Excavation in chalk rock | Avedat | 60.56 | 1.6 | 8 | 11.15 |
| Einziq | 58.22 | 2.4 | 10 | 2.67 | |
| Boztepe Dam | Tuffite | 33.43 | 0.156 | 5 | 0.45 |
| Bilecik-Istanbul roadway in Turkey | Section-1 | 37.0 | 0.016 | 12.9 | 0.47 |
| Section-2 | 64.73 | 1.52 | 12.9 | 0.72 | |
| Section-3 | 52.03 | 10.8 | 12.9 | 1 | |
| Section-4 | 81.05 | 11.48 | 12.9 | 5.39 | |
| Section-5 | 73.39 | 10.79 | 12.9 | 7.75 | |
| Section-6 | 76.95 | 12.29 | 12.9 | 5.39 | |
| Section-7 | 78.67 | 9.99 | 12.9 | 7.75 |
© 2018 by the authors. Licensee MDPI, Basel, Switzerland. This article is an open access article distributed under the terms and conditions of the Creative Commons Attribution (CC BY) license (http://creativecommons.org/licenses/by/4.0/).
Share and Cite
MDPI and ACS Style
Rehman, H.; Naji, A.M.; Kim, J.-j.; Yoo, H.-K. Empirical Evaluation of Rock Mass Rating and Tunneling Quality Index System for Tunnel Support Design. Appl. Sci. 2018, 8, 782. https://doi.org/10.3390/app8050782
AMA Style
Rehman H, Naji AM, Kim J-j, Yoo H-K. Empirical Evaluation of Rock Mass Rating and Tunneling Quality Index System for Tunnel Support Design. Applied Sciences. 2018; 8(5):782. https://doi.org/10.3390/app8050782
Chicago/Turabian StyleRehman, Hafeezur, Abdul Muntaqim Naji, Jung-joo Kim, and Han-Kyu Yoo. 2018. "Empirical Evaluation of Rock Mass Rating and Tunneling Quality Index System for Tunnel Support Design" Applied Sciences 8, no. 5: 782. https://doi.org/10.3390/app8050782
Note that from the first issue of 2016, this journal uses article numbers instead of page numbers. See further details here.