Numerical Analysis of the Forces on the Components of a Direct Diesel Engine

Modelling and Simulation Institute—Viettel Research and Development Institute, 100000 Hanoi, Vietnam
*
Author to whom correspondence should be addressed.
Appl. Sci. 2018, 8(5), 761; https://doi.org/10.3390/app8050761
Submission received: 16 April 2018
/
Revised: 5 May 2018
/
Accepted: 8 May 2018
/
Published: 11 May 2018
(This article belongs to the Special Issue Direct Injection Reciprocating Internal Combustion Engines)
Abstract
:This research introduces a method to model the operation of internal combustion engines in order to analyze the forces on the rod, crankshaft, and piston of the test engine. To complete this research, an experiment was conducted to measure the in-cylinder pressure profile. In addition, this research also modelled the friction forces caused by the piston and piston-ring movements inside the cylinder for calculating the net forces experienced by the test engine. The results showed that the net forces change according to the crank angle and reach a maximum value near the top dead center. Consequently, we needed to concentrate on analyzing the stress of the crankshaft, rod, and piston at these positions. The research results are the foundation for optimizing the design of these components and provide a method for extending the operating lifetime of internal combustion engines in real operating experiments.
1. Introduction
In the operation of internal combustion engines, the rod, crankshaft, and piston play crucial roles as they are considered the heart of engines. However, these components always operate in critical operating conditions, such as under very high thermal and mechanical stresses [1,2,3,4,5]. However, defining these loads is difficult due to complications in the constructive and operating characteristics of these above-mentioned parts. Consequently, classical methods have been used. In most cases, a highly simplified representation of geometric shape and load are used for analysis. As a result, the operating characteristics of the internal combustion engines cannot be correctly obtained. The finite element method (FEA) is a good solution to solve these problems. The biggest advantage of the FEA is the simplicity of its basic concepts. Users must learn and correctly understand these concepts, since they include certain hypotheses, simplifications, and generalizations [6,7]. To calculate objects, users have to model objects so that they align with real subjects. A model includes lines, planes, or curved surfaces and volumes created in a three-dimensional (3D) computer-aided design (CAD) environment. In this stage of development, the model is continuous with an infinite number of points, as the real pieces are analyzed. The main goal of the finite element method is to obtain the finite element mesh, transforming the continuous structure into a discrete model with a finite number of points. Using the finite element method (FEM), users can combine design, simulation, element mesh, and structure analysis. Therefore, users can easily and quickly apply this tool [8,9].
For example, Webster et al. [10] conducted a 3D analysis based on the FEA method to calculate the mechanical stress of a diesel engine connecting rod. They conducted an experiment to measure the maximum compressive load and the load distribution on the piston and crankshaft. However, the connecting rod caps and bolt pretension were modelled based on the FEM method and multi-point constraint equations. In another study [11], the 3D model of a passenger car’s crankshaft was built using CATIA V5 software (Dassault Systèmes, Vélizy-Villacoublay, France) and transferred to ANSYS software (ANSYS, Inc., Cecil Township, PA, USA) for stress analysis to provide a conceptual method for optimizing the design using weight reduction. However, this research did not fully mention the net force on the piston, such as the friction forces or the role of gravity. In addition, this study only analyzed a single crankpin and ignored the interaction between other components. Lucjan et al. also performed a failure analysis of the crankshaft of a diesel engine in the experiment by observing the fatigue failure and determined the operational stress of the crankshaft at maximum engine power. They stated that the maximum tensile stress value reached 112.44 MPa around the fillet area of the crankpin at a crankshaft position of 10° at top dead center (TDC). However, this critical region stress only accounts for about 25% of the yield stress of the crankshaft material [12].
Normally, the maximum stresses on the components are designed to be significantly smaller than the yield stress; however, in real operation, some critical conditions occur, such as the overload of the engine or the failure of the lubricant system resulting in the destruction of engine parts. Notably, some engines may be modified from the original design to adapt to operation demands. For instance, in a previous study [13], an old model diesel engine was modified by retrofitting a turbocharger to enhance its performance. However, as mentioned in prior studies [13,14], the thermal and mechanical stresses of engines after turbocharging dramatically increased. Thus, evaluating the stress increase is necessary to find a solution for the stable and longtime operation of these engines.
In this research, we present a method to calculate the mechanical stress on some major components of the test engine based on the modeling of the test engine combining the FEM method with experimental data. The main objective of this study was to determine the stress state in the crankshaft, rod, and piston during operation. Furthermore, we aimed to explain the reasons for the failure of these components to determine a solution to extend their operating lifetime.
2. Experimental Procedure to Measure In-Cylinder Pressure
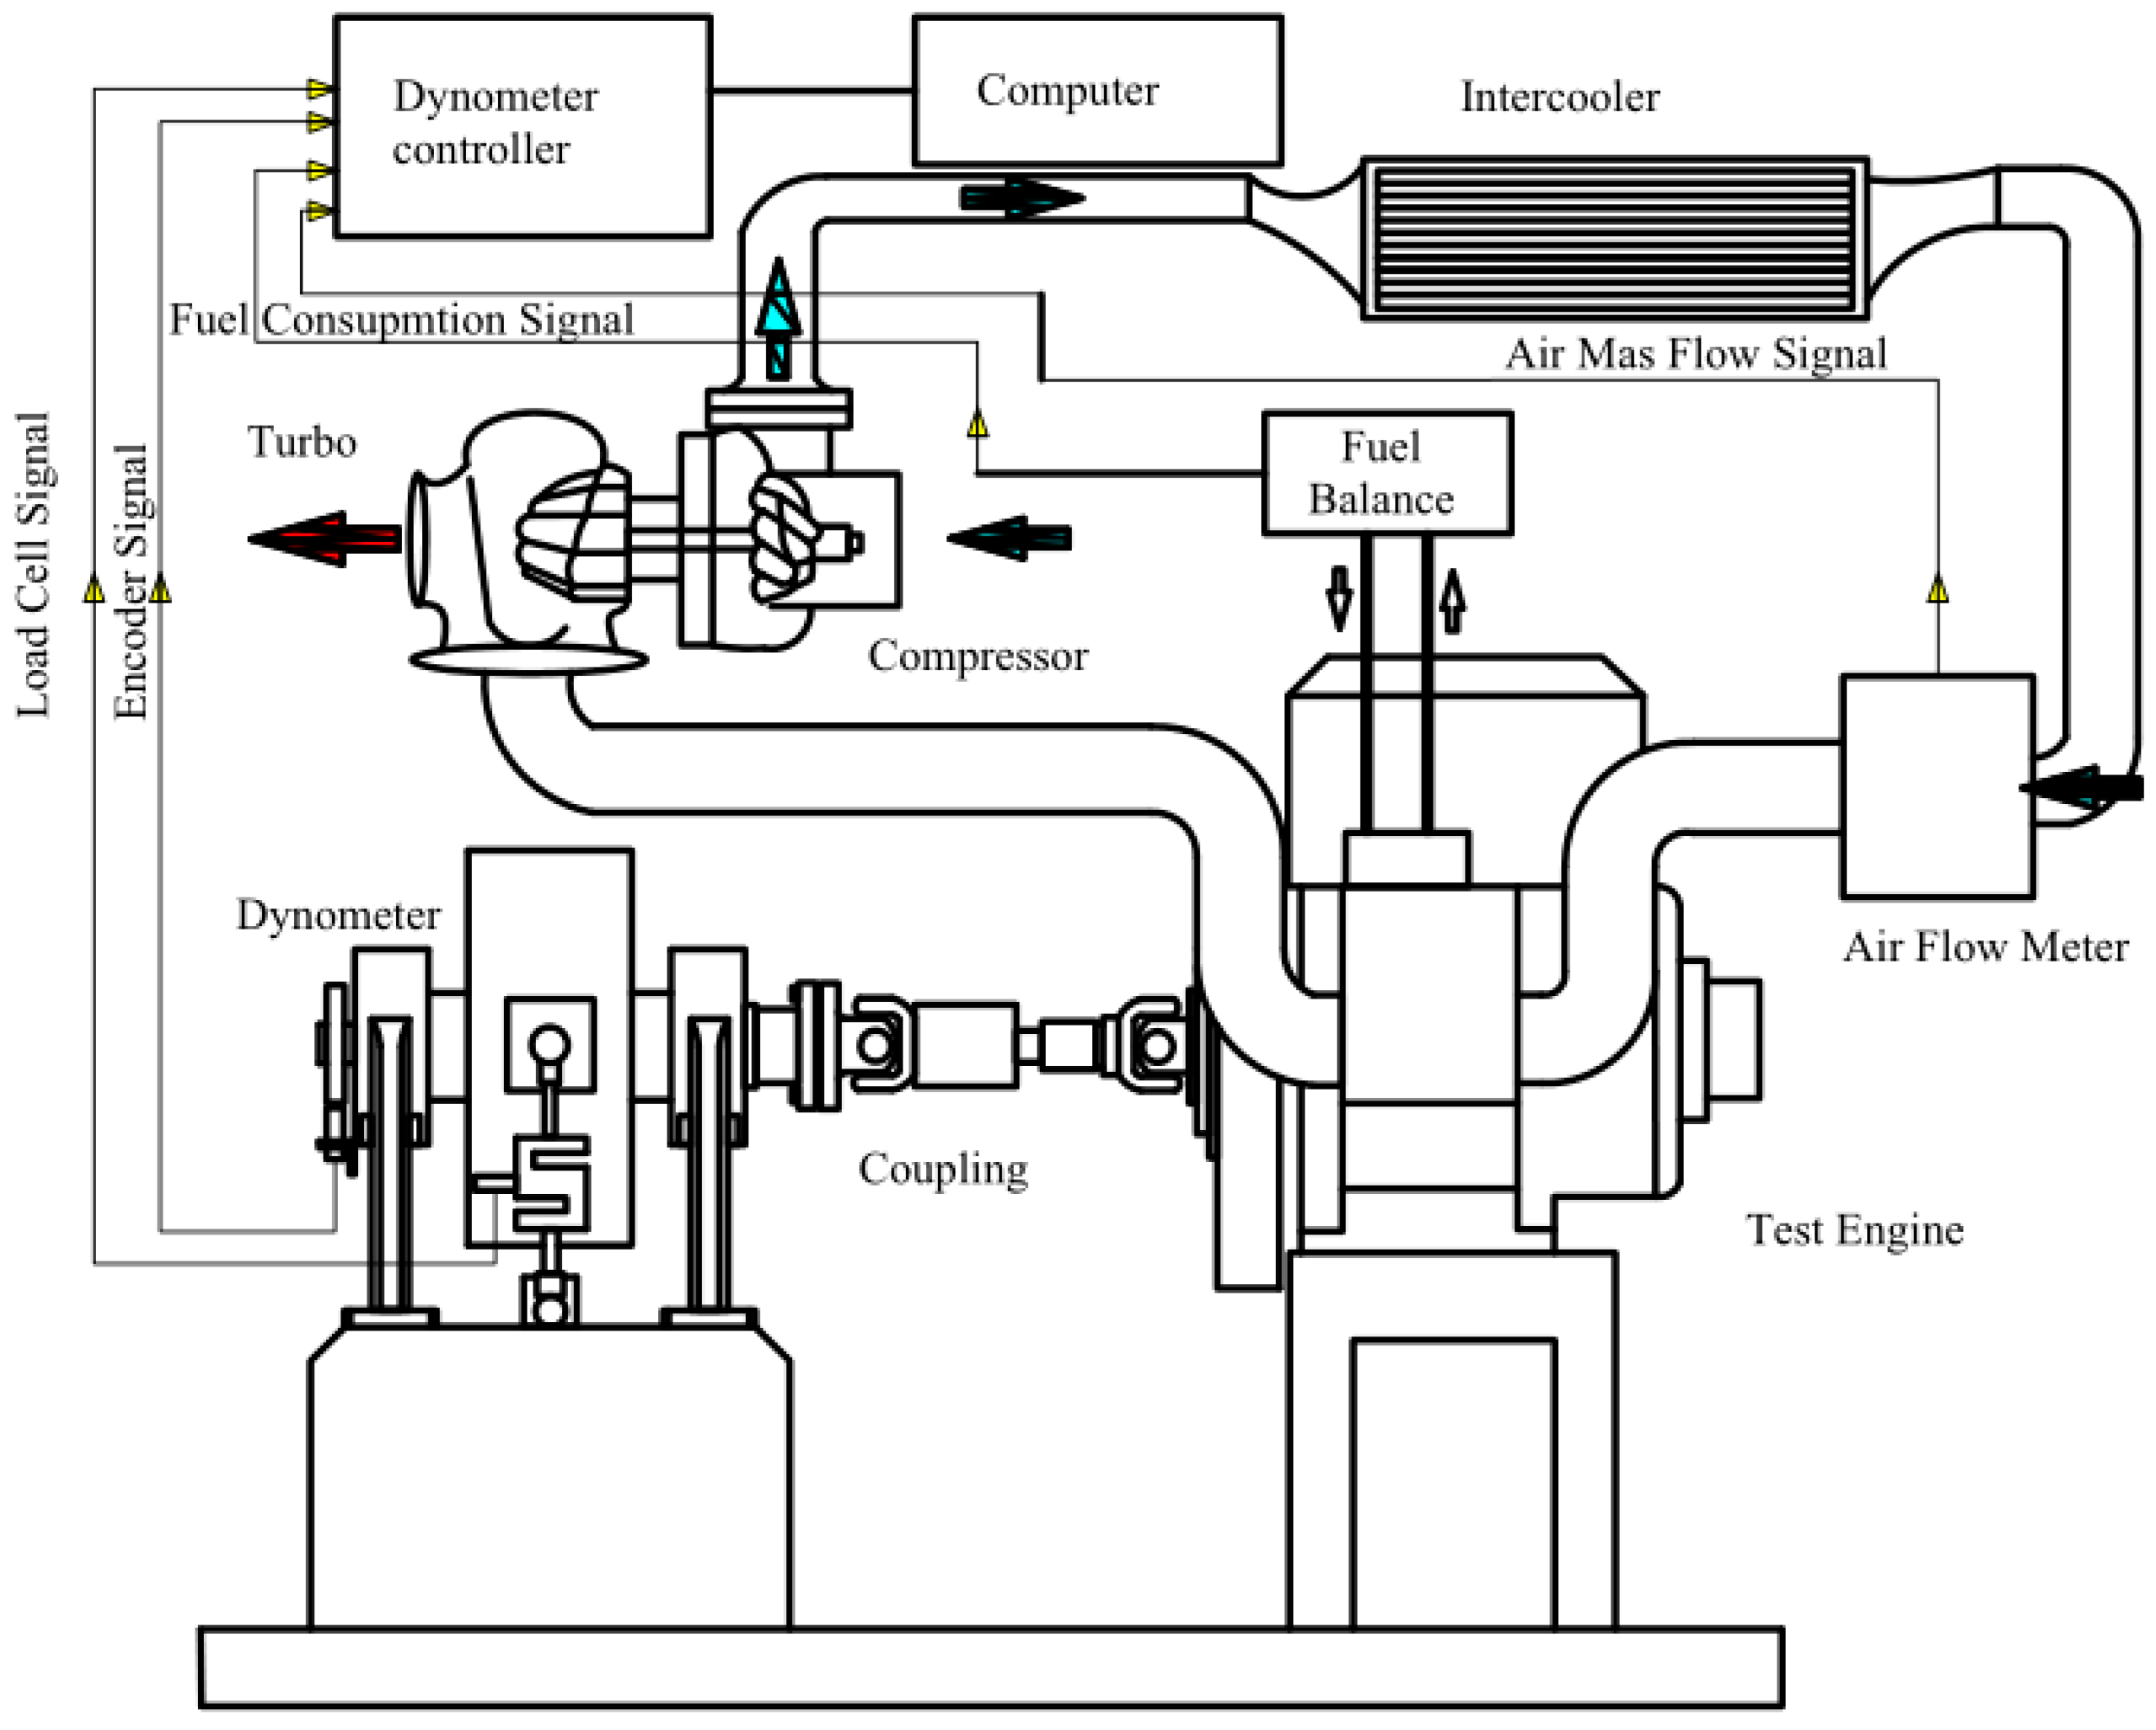
The test engine was a four-cylinder diesel engine with a maximum power of 110 kW after turbocharging. The engine characteristics are described in our previous paper [13]. The testing equipment used for measuring the in-cylinder pressure included a chassis dynamometer, a fuel-consumption measurement device, and a pressure measurement system. All these devices were connected to a server computer using dedicated software. In this research, the in-cylinder pressure was measured at the maximum power conditions. This means that the test engine was controlled to reach maximum power, and thus the in-cylinder was recorded by a pressure sensor installed in the head cylinder. The chassis dynamometer contained an absorption unit to measure the torque and rotational speed. The engine power and engine speed could be varied and measured in the range of 0 to 220 kW and 0 to 4500 rpm, respectively. The dynamometer was controlled using an installed PUMA computer (AVL, Graz, Austria) that receives signals from sensors equipped on the dynamometer and the test engine. In addition, to ensure the accuracy of the experimental test, we used other equipment, such as an external cooling system, named AVL 533 (AVL, Graz, Austria) that permits continuous temperature control. The quantity of fuel consumed by the engine was measured by fuel-consumption measurement equipment, called Fuel Balance AVL 733S (AVL, Graz, Austria), using the gravimetrical method. The AVL Fuel Balance system allows for high-precision fuel-consumption measurement even at low consumption and for a short measurement period. The recommended measuring range of the equipment is up to 150 kg/h with an accuracy of 0.12%. Figure 1 shows the test engine installed in the test room for the experimental process.
3. Kinetics and Dynamics of the Test Engine
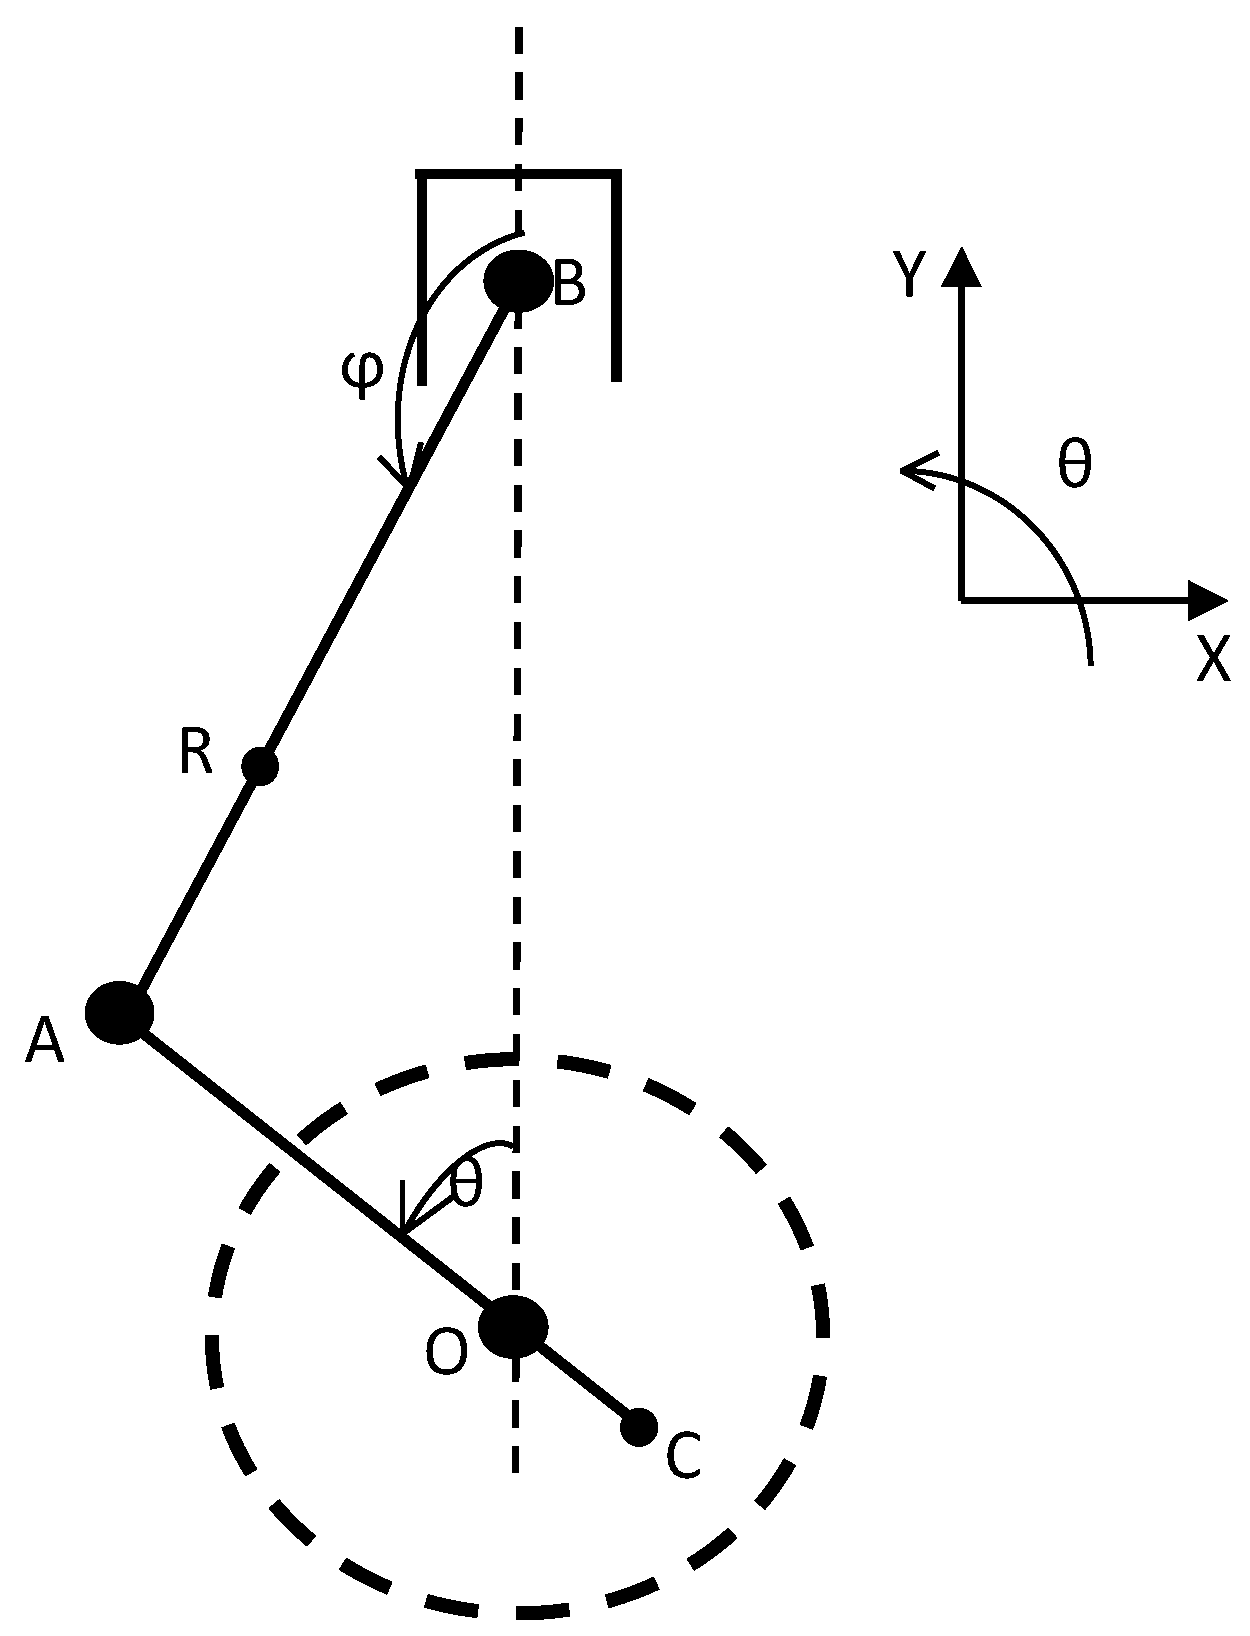
A simple model of an internal combustion engine consisting of a piston located in a cylinder that is connected to the crankshaft via the rod and simplified to move in a plane is shown in Figure 2, with symbols AB = l (rod length), AR = jl (centre gravity of connecting rod from crankpin center), OA = r (crankshaft length), and OC = h (crankshaft mass centre from main bearing centre).
The pressure p exerts a force on the piston m1 to create movement along the axis of the transmission cylinder to the transfer bar m2 of the parallel plane, causing the crankshaft m3 to rotate around the center O. m1 is the mass of the piston, m2 is the mass of the rod, m3 is the mass of the crankshaft, l2 is the length of the rod, l3 is the crankshaft length, p is the pressure on the piston surface, θ is the angle between the crankshaft and the vertical axis, and ϕ is the angle between the rod and the vertical axis (Figure 2).
3.1. In-Cylinder Pressure and Friction Force Calculation
During the operation of internal combustion engines, combustion is an irreversible process that uses the reactions of fuel with an oxidizer to convert chemical energy into sensible energy, which also works to form products. In practice, carbon dioxide (CO2), nitrogen, and water are the main products of the combustion process. However, other species, including nitric oxide, nitrogen oxide, carbon monoxide, hydrocarbon, and particulate matter, are also common products. The liquid state determination at each point in the process requires a detailed understanding of the intermediate reactions that change the original mixture into the final combustion products. However, in all cases, we can use the first law of thermodynamics to determine the correlation between the beginning and end of a combustion process.
The application of this law does not require users to know the development of the intermediate stages of the process. The first law of thermodynamics expresses the relationship between the variation of the internal energy (or enthalpy) and that of heat and work. When applying this law to a system where the chemical composition changes, we need to determine the zero state of the internal energy or enthalpy of all the substances in the system.
In specific cases, the calculation of combustion in internal combustion engines is based on the equation of the first law of thermodynamics:
where is the change in internal energy inside the cylinder, is the work cycle, is the heat input, is the heat loss through the wall, is the enthalpy loss due to gas leakage, is the volume of the liquid inside the cylinder, is the internal energy, is the pressure inside the cylinder, is the cylinder volume, is the heat of the fuel supply, is the heat loss to the wall, α is the angle of the crankshaft rotation, is the enthalpy value, and is the variation in volumetric flow rate.
Equation (1) applies to both internal and external composite engines. However, the changes in the composition of the two cases are different. In the case of the formation of a mixture inside a cylinder, if we assume that the fuel in the cylinder is burned immediately, the combustion mixture is immediately blended with the residual gas in the cylinder. The air-fuel ratio (A/F) decreases continuously from a high value at the starting point to a low value at the end of the combustion. After the transformation, Equation (1) becomes:
where Tc is the cylinder temperature, mc is the volume of the fluid in the cylinder, pc is the pressure in the cylinder, uc is the specific internal energy of the volume of liquid inside the cylinder, Hc is the low calorific value, λ is the air residue ratio (1/Φ), α is the equivalent ratio, and Vc is the cylinder volume.
The solution of the above equation depends on the combustion model, the laws of exothermic reactions, and the heat transfer through the cylinder wall, as well as the pressure, temperature, and composition of the gas mixture together with the equation of the state:
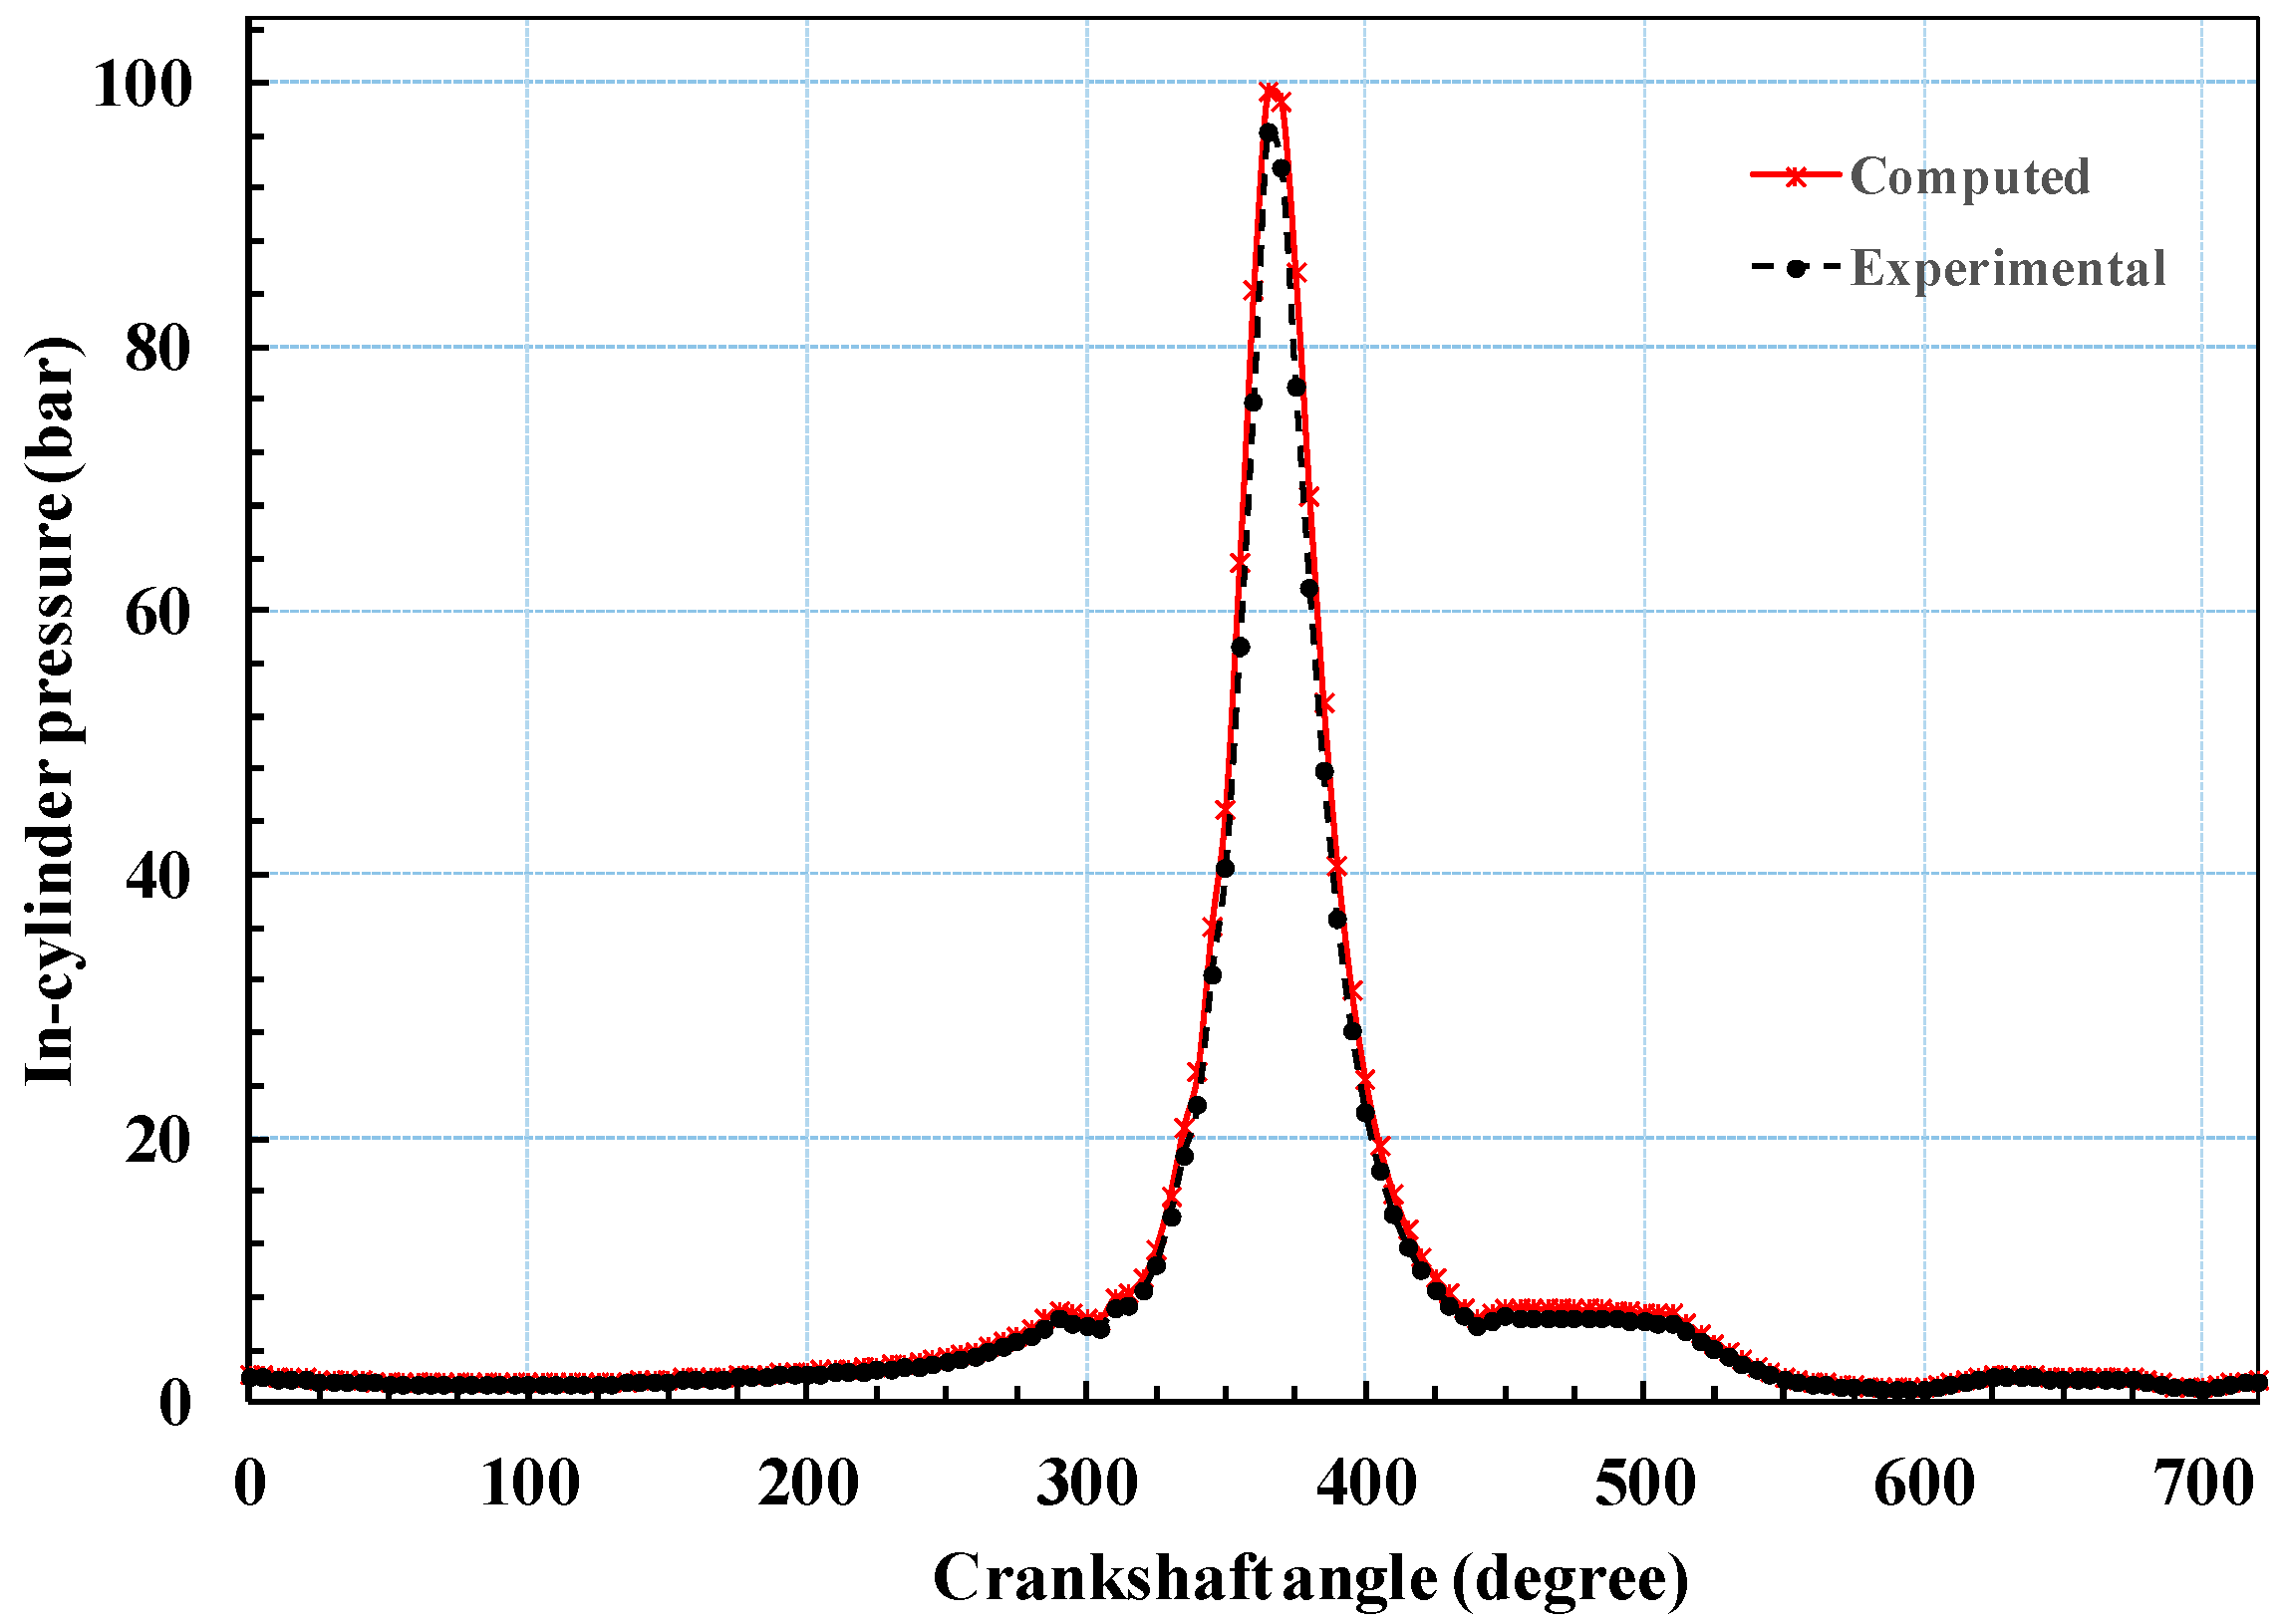
Establishing the relationship between pressure, temperature, and density from Equation (3), we used the Runge–Kutta method to determine the temperature of the cylinder. The pressure will then be determined by the state equation. Figure 3 shows the in-cylinder pressure profile using the experimental and numerical methods. The in-cylinder pressure always changes according to the crankshaft angle. The in-cylinder pressure is nominal at the intake and exhaust strokes; however, it increases dramatically during the compression and power strokes. It reaches a very high value at the position near the top dead center. From there, we determined the force caused by the pressure applied to the top of the piston.
In addition, the crankcase pressure generated by oil pressure on the underside is normally determined in the experiment. This force is very small compared to the total force exerted on the top of the piston. Consequently, it was ignored in this research. Furthermore, the friction force (Ffr) exerted on the piston needed to be determined in this calculated case. Ffr includes the piston-ring friction (Fr) and the friction from the piston surface and cylinder (μpS). The total friction force can be calculated according to Equation (4) [15,16].
where μr is the friction coefficient of the contact surface between the ring and cylinder, D3 is the diameter of the cylinder, d4 is the diameter of the ram, r is the width of the cross-section of the cylinder element, E is the elastic coefficient of the spring materials, S is the force resulting from the contact between the piston and the cylinder, and μp is the corresponding friction coefficient.
The sliding friction is dramatically reduced by adding a lubricant between the contact surfaces. In addition, in the operation of an internal combustion engine, the piston ring operates from the hydrodynamic lubrication to the boundary lubrication depending on the crankshaft angle, viscosity, and load. This phenomenon can be described by Stribeck’s equation [17]. In this research, the friction coefficient µr was determined using Stribeck’s equation as described in Equation (5):
where c is constant, h is the dynamic viscosity, v is the piston speed, p is the pressure exerted on the piston ring, w is the width of the ring, and x is the exponent varying from 0.33 to 0.66. Therefore, we calculated the total friction force based on the number and parameter characteristics of the test engine. The inertia force caused by the movement of the piston and rod was also dramatically affected by the piston; it will be described in the following sections.
3.2. Kinetics and Dynamics of the Piston Mechanism
According to [18], assuming the displacement of the piston in the horizontal direction is trivial, applying the sine theorem in the OAB triangle (Figure 2), we have:
If we derive the above expression, we have:
The z displacement of the piston in the vertical direction is defined by:
We can infer that the velocity of the piston in the vertical direction is determined by Equation (8) and the acceleration of the piston in the vertical direction can be calculated with Equation (9).
The piston moves only along the cylinder, and thus the acceleration in the horizontal and vertical directions across the piston are determined in Equations (10) and (11), respectively.
The cylinder has actually become elliptical due to the rotation of the piston about the wrist pin when the piston moves toward the bottom dead center. In addition, the high temperature during the operation process also affects the deformation of the piston and cylinder. Consequently, the forces exerted on the piston are not symmetric in the x direction. However, in this research, we assumed that the forces exerted on the piston were symmetric in the x direction. Therefore, the forces acting on the piston include Q(t), the total external force acting on the piston, mP.g, the force of gravity, and FBX, FBY, the link reaction forces in the x and y directions, respectively [17,19], as described in Figure 4.
Since the piston does not move in the x direction, the total force acting on x is zero, inferring that:
The total force acting in the y direction is:
where Q(t) is the total external force acting on the piston, including the force acting on the piston (PT), the friction caused by the impacts on the cylinder wall (Fr), friction from the piston surface and cylinder (μpS), the force caused by pressure acting on the piston bottom (PB is crankcase pressure), and the inertia force .
From Equation (13), we infer that the reaction force on the piston in the y direction is:
in which:
Note that the sign of μpS depends on the direction of piston movements. Thus, we obtained a graph illustrating the total force on the pistons of the test engine, as shown in Figure 5.
3.3. Kinetics and Dynamics of the Rod Mechanism
The acceleration of the transmission rod at the center is determined by the acceleration of the head of the rod connected to the piston. In the horizontal and vertical direction, we have:
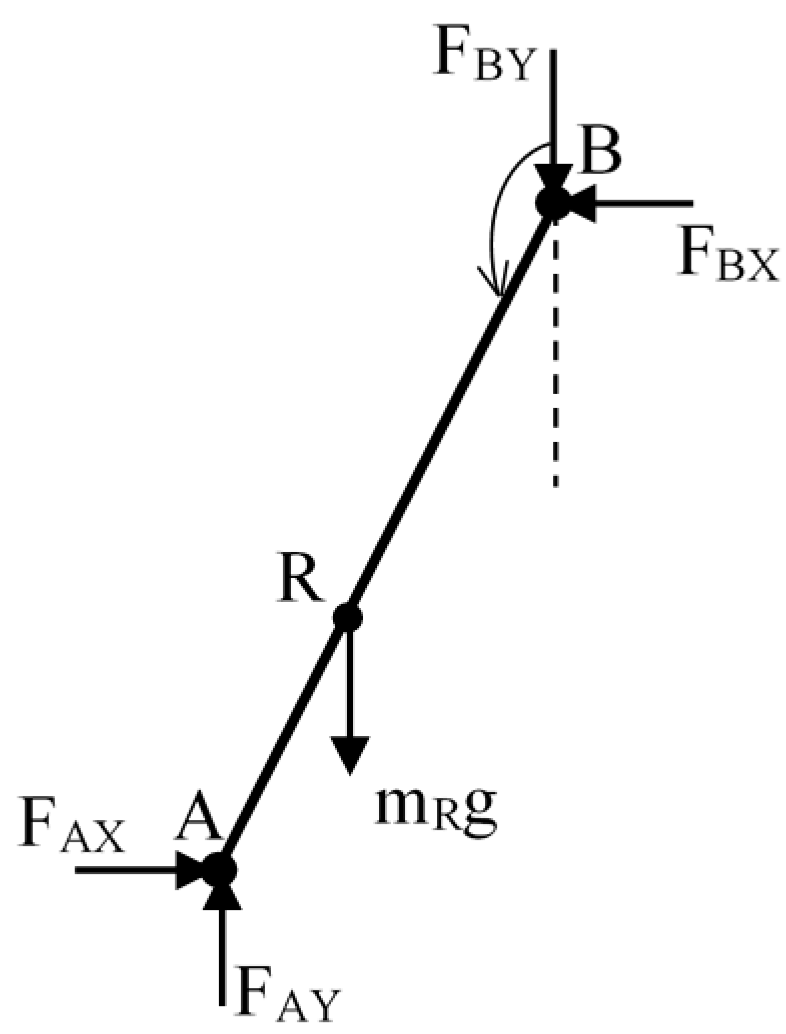
The total forces on the rod are as follows:
The forces acting on the rod include the gravity force at the center of the rod and the link reaction forces at the two ends of the rod as described in Figure 6. From this, we can identify the following.
- (1)
- Total force in the x direction:
- (2)
- Total force in the y direction:
- (3)
- Total torque on the axis passing through the center R:
3.4. Kinetics and Dynamics of the Crankshaft
The crankshaft converts the up and down movements of the pistons into rotary motion and drives the external drive. The crankshaft is connected to the pistons via the transmission rods.
Similar to the determination of the rod acceleration, we can determine the crankshaft acceleration at the center using the acceleration at the common point between the transmission rod and the crankshaft and project it in the horizontal and vertical directions:
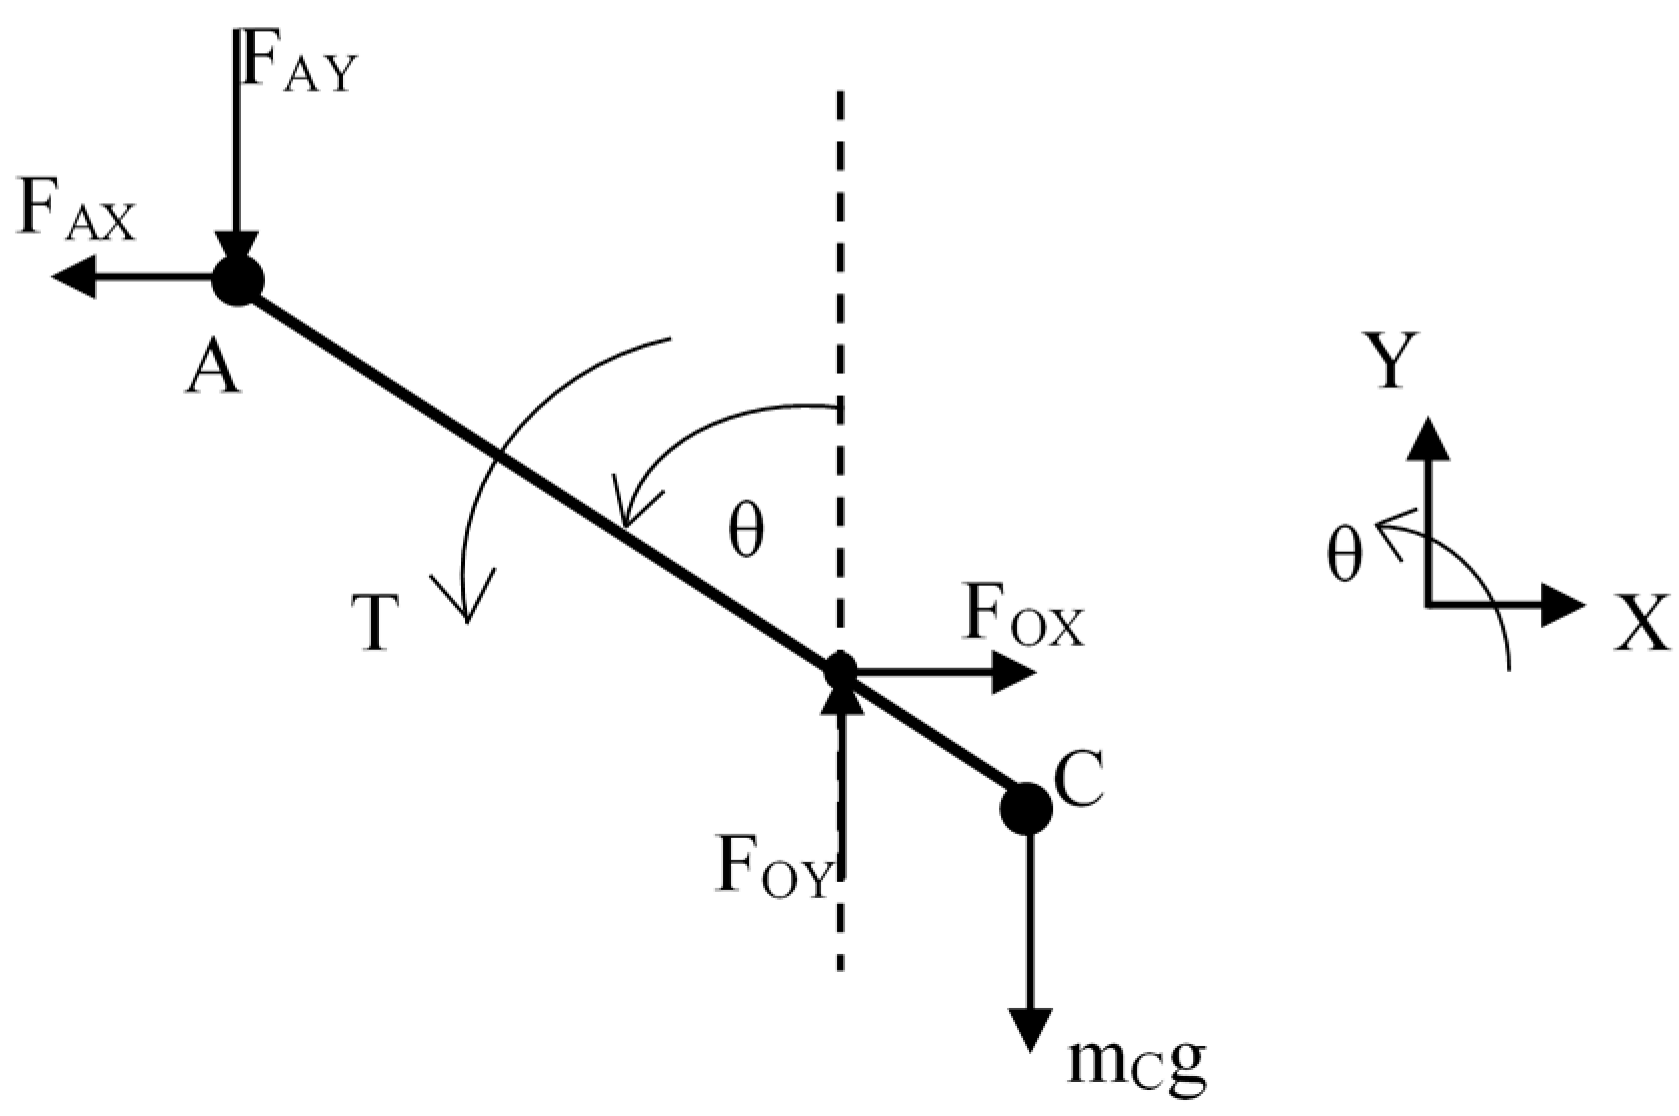
The total force acting on the crankshaft is illustrated in Figure 7.
The total force in x direction is:
The total force acting in the y direction is:
The total torque around crankshaft is:
Combining these above equations, we have:
Substituting the known forces in Equation (8), we can obtain the torque acting on the crankshaft:
Substituting the known accelerations into the above equation, we have:
where I(θ) is the inertia function, defined by:
where I’(θ) is the rate of the inertial variable based on the rotational angle θ of the crankshaft determined by:
where g(θ) is the gravitational torque, determined by:
and Q(t,θ) is the momentum or torque determined by the general load Q(t) acting on the piston, determined by:
With the input pressure as mentioned in Figure 3 acting on the top of the piston, corresponding to the engine speed of 2200 rpm, and using a firing order of 1–3–4–2, we can determine the average load moment on the crankshaft over the entire cycle as follows:
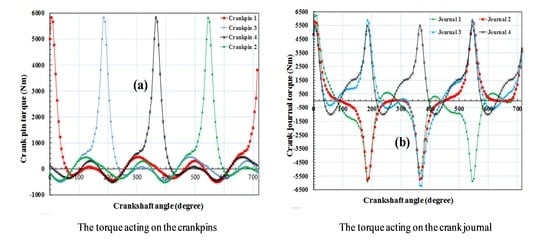
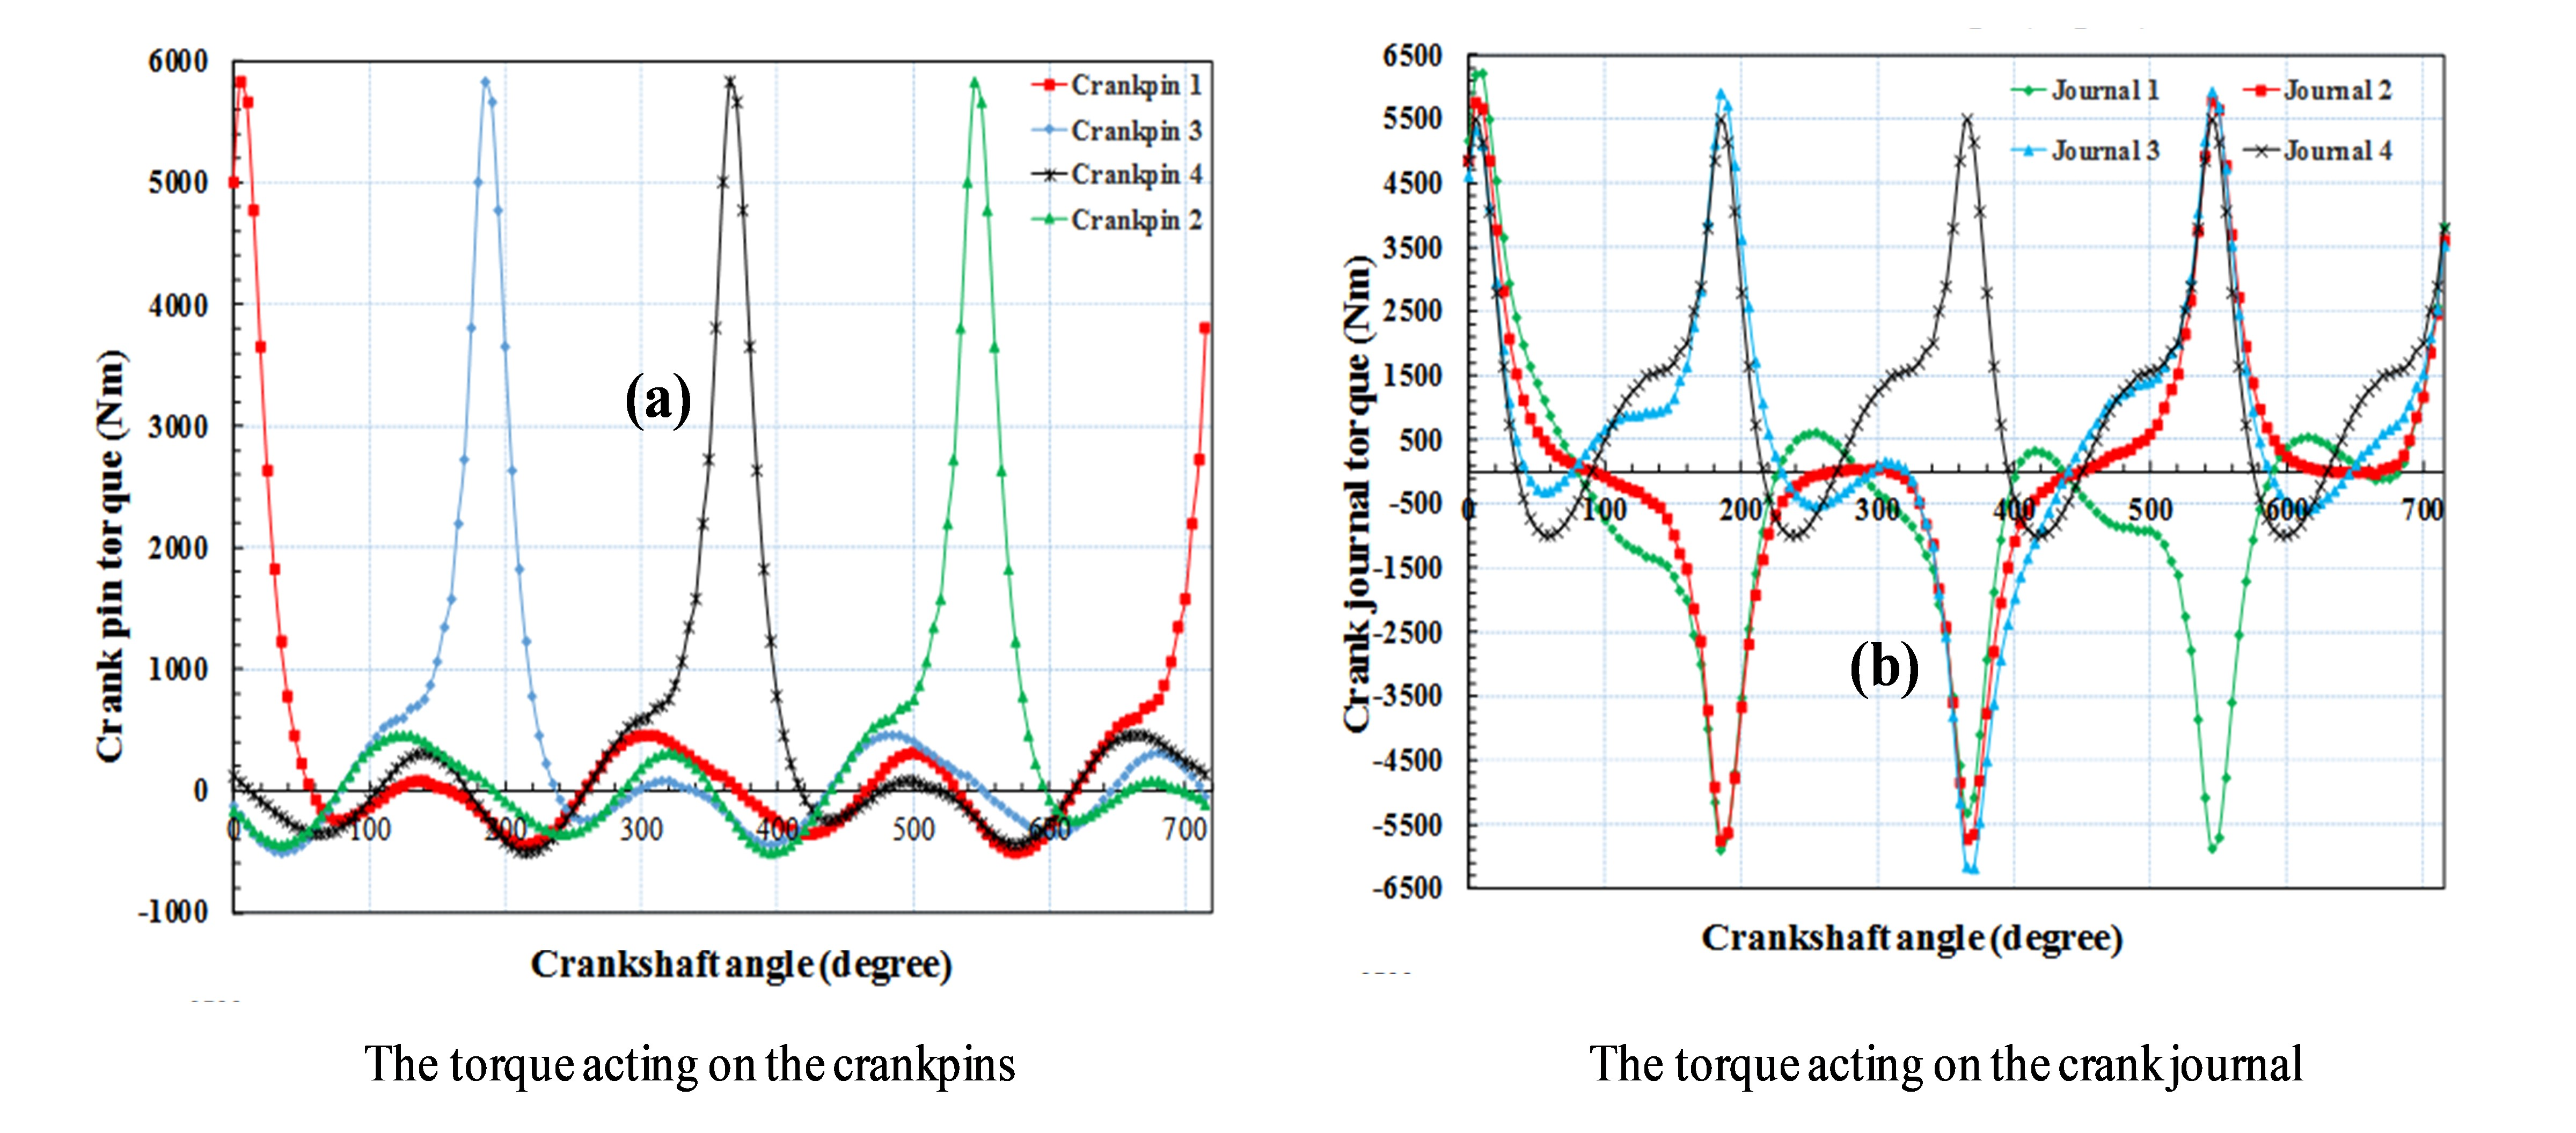
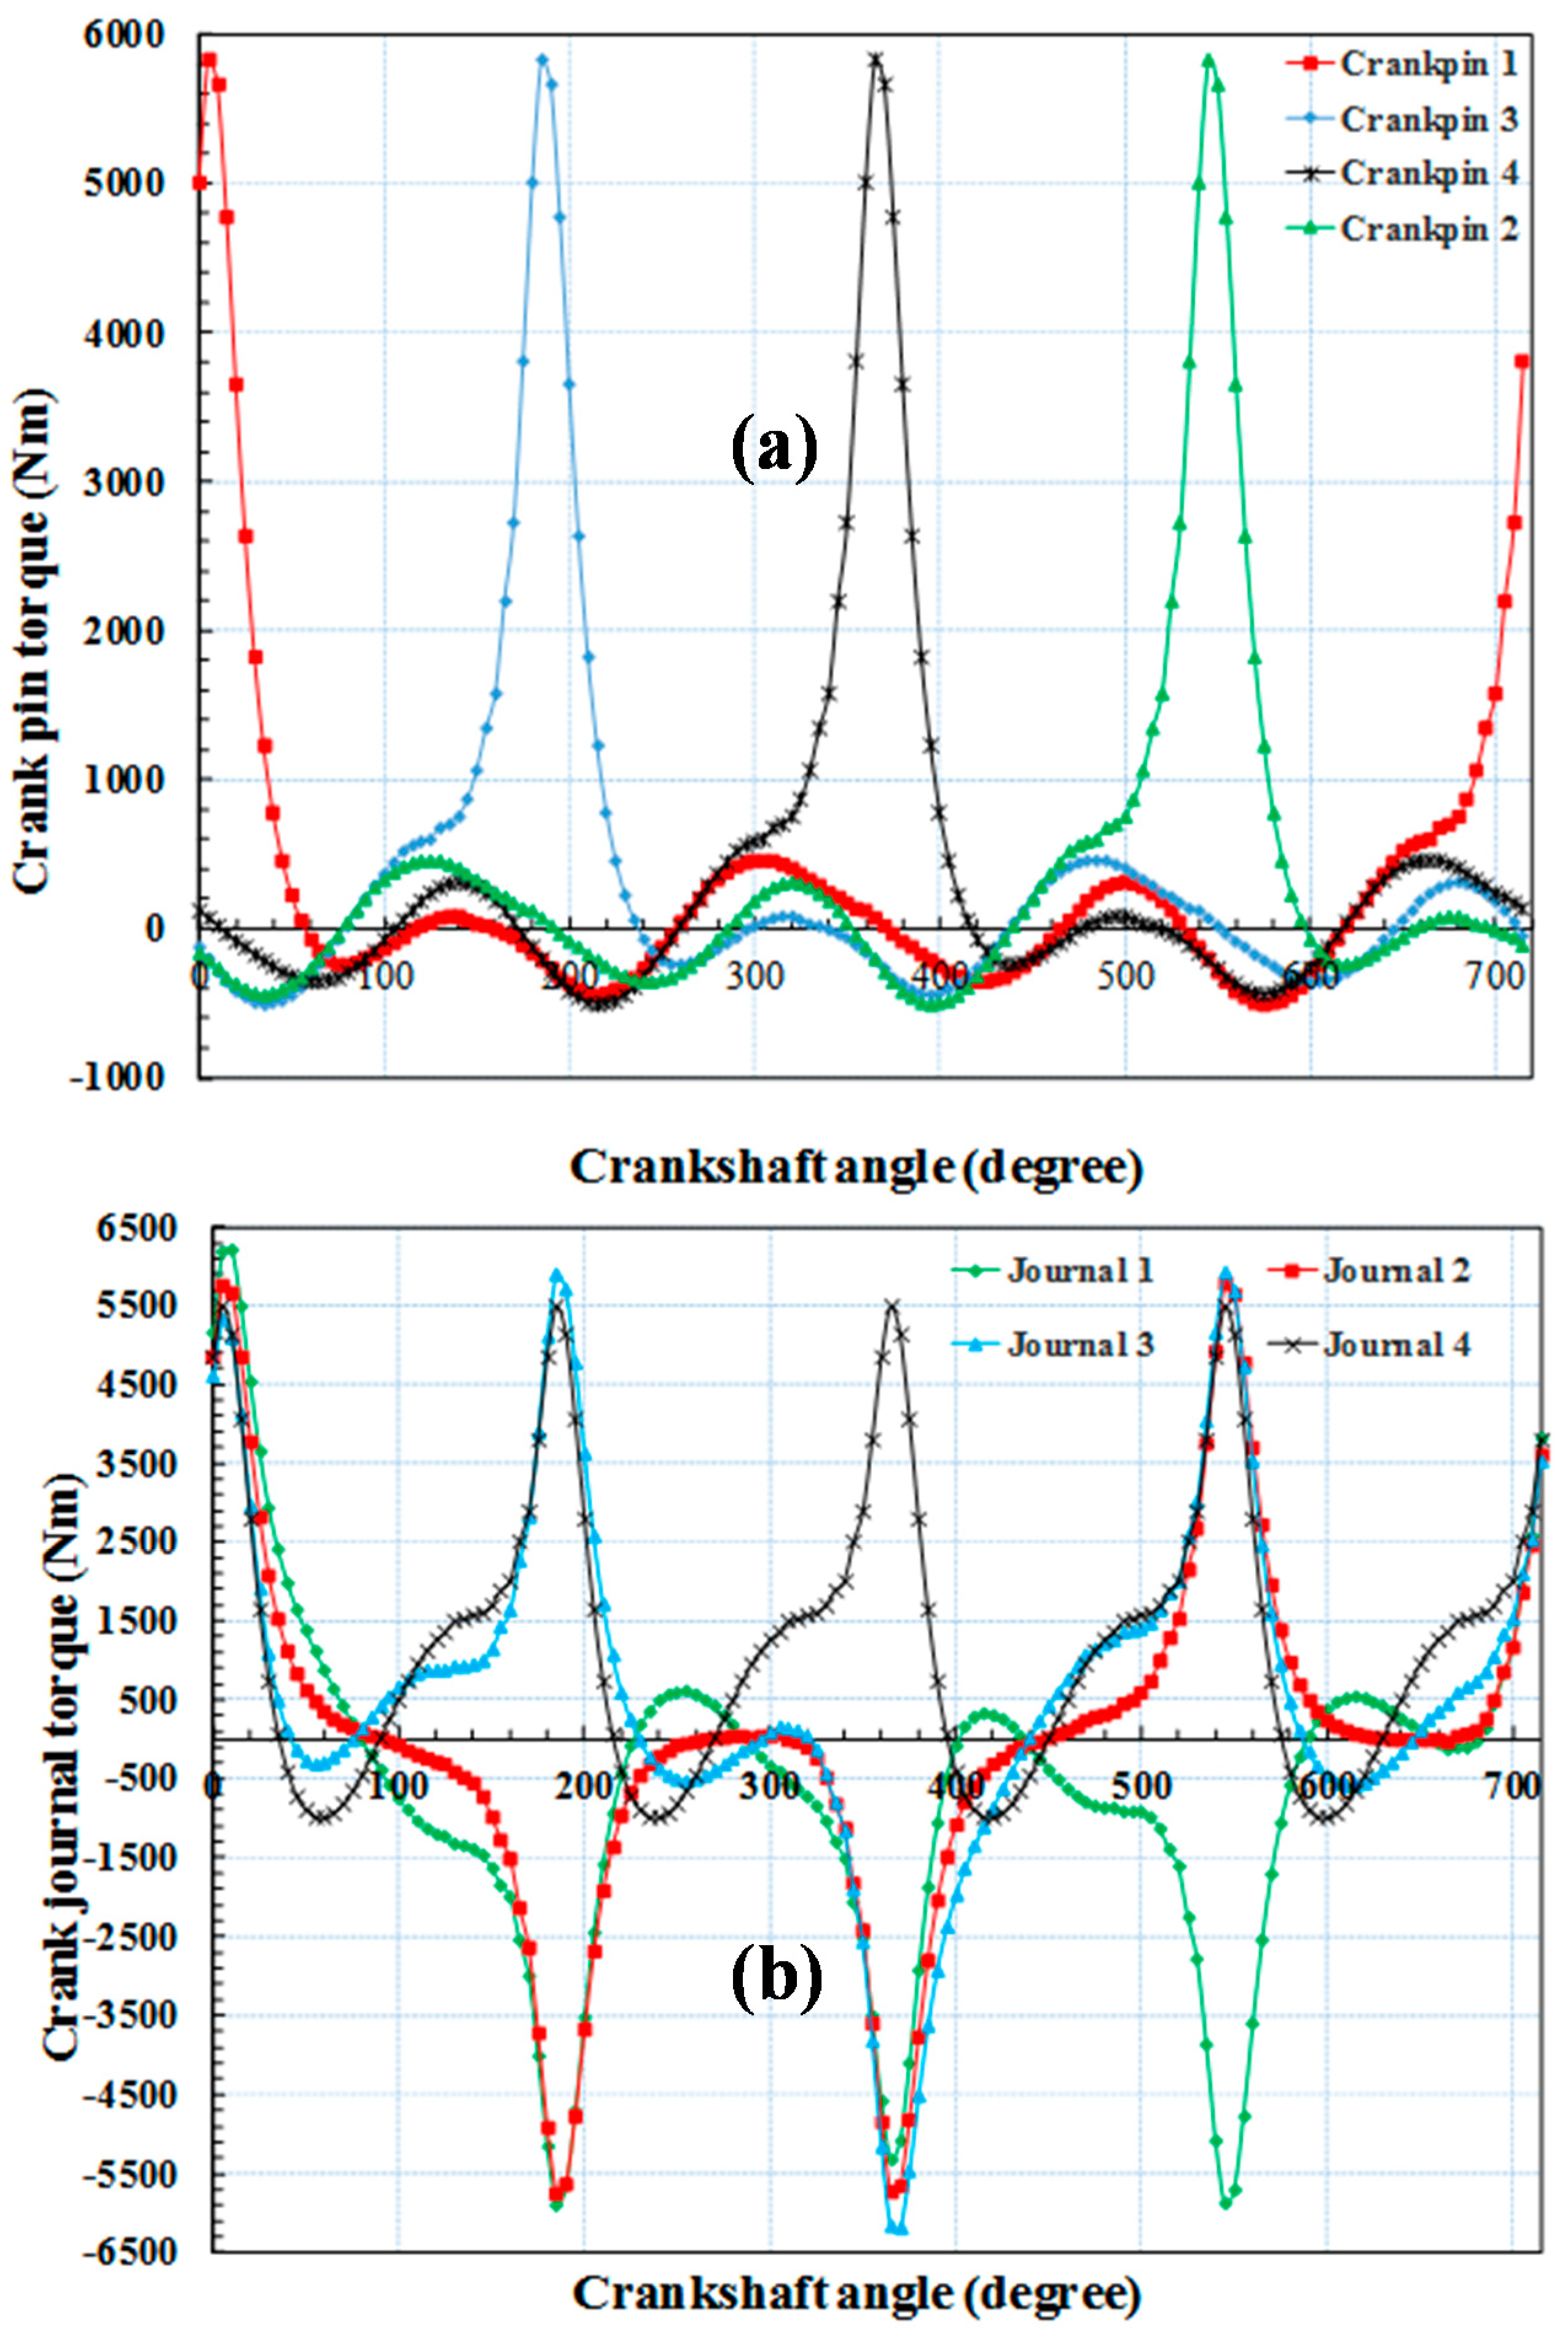
Figure 8a shows the torque acting on the four crankpins of the crankshaft. The maximum torque on each crankpin occurs when the crankshaft is positioned in the range of 360° to 370°, immediately after the top dead center. The main torque exerted on the crankpins is the in-cylinder pressure; however, the friction and inertia force also dramatically contribute to the total force varying according to the crankshaft angle. For instance, at the crankshaft angle of 363°, the total torque exerted on crankpin 1 reaches a maximum value of 6203 Nm. Meanwhile, the inertia force and the friction force contribute to approximately 8.9% and 4.6% of the total torque, respectively. Figure 8b shows the torque acting on the main journals of the crankshaft. They also vary depending on the crankshaft angle. However, the torque of each main journal is dramatically different from one other since it is calculated based on the different torque directions acting on the adjacent crankpins.
4. Conclusions
This research shows an experimental and numerical method to calculate the net forces on the components of an internal combustion engine, including the piston, rod, and crankshaft. The forces reach a maximum value near the top dead center. The force caused by the in-cylinder pressure is the main force affecting the test engine components; however, the friction and inertia also significantly affect these components. These forces strictly depend on the engine speed and the geometrical parameters of these components.
Future research will focus on modeling the thermal dynamic and heat transfer phenomena of the engine to fully evaluate the effect of the deformation of the engine components on the friction forces. In addition, a stress analysis of the piston, rod, and crankshaft will also be conducted to extend the operational lifespan of the engine.
Author Contributions
Experimental design was performed by V.N.D. and D.V.N.; fieldwork was conducted by V.N.D.; statistical analyses were performed by D.V.N. and V.N.D. contributed to the writing of the paper.
Acknowledgments
This work was supported by the Modelling and Simulation Institute, Viettel Research and Development Institute.
Conflicts of Interest
The authors declare no conflict of interest.
References
- Yu, Z.; Xu, X. Failure investigation of a truck diesel engine gear train consisting of crankshaft and camshaft gears. Eng. Fail. Anal. 2010, 17, 537–545. [Google Scholar] [CrossRef]
- Sroka, Z.J.; Dziedzioch, D. ScienceDirect Mechanical load of piston applied in downsized engine. Arch. Civ. Mech. Eng. 2015, 15, 663–667. [Google Scholar] [CrossRef]
- Satyanarayana, K.; Rao, S.V.U.M.; Viswanath, A.K.; Rao, T.V.H. ScienceDirect Quasi-dynamic and thermal analysis of a diesel engine piston under variable compression. Mater. Today Proc. 2018, 5, 5103–5109. [Google Scholar] [CrossRef]
- Rao, S.V.U.M.; Rao, T.V.H.; Satyanarayana, K.; Nagaraju, B. ScienceDirect Fatigue Analysis of Sundry I C Engine Connecting Rods. Mater. Today Proc. 2018, 5, 4958–4964. [Google Scholar] [CrossRef]
- Wang, M.; Pang, J.C.; Zhang, M.X.; Liu, H.Q.; Li, S.X.; Zhang, Z.F. Thermo-mechanical fatigue behavior and life prediction of the Al-Si piston alloy. Mater. Sci. Eng. A 2018, 715, 62–72. [Google Scholar] [CrossRef]
- Romanov, V.A.; Lazarev, E.A.; Khozeniuk, N.A. The evaluation of the stress-strain state for the cylinder heads of high-powered diesel engines using the multiphysics ansys technology. Procedia Eng. 2015, 129, 549–556. [Google Scholar] [CrossRef]
- James Prasad Rao, B.; Srikanth, D.V.; Suresh Kumar, T.; Sreenivasa Rao, L. Design and analysis of automotive composite propeller shaft using fea. Mater. Today Proc. 2016, 3, 3673–3679. [Google Scholar] [CrossRef]
- Gunasegaram, D.R.; Molenaar, D. Towards improved energy efficiency in the electrical connections of Hall-Héroult cells through Finite Element Analysis (FEA) modeling. J. Clean. Prod. 2015, 93, 174–192. [Google Scholar] [CrossRef]
- Reza, M.; Asad, A.; Ranjbarkohan, M.; Dardashti, B.N. Dynamic Load Analysis and Optimization of Connecting Rod of Samand Engine. Aust. J. Basic Appl. Sci. 2011, 5, 1830–1838. [Google Scholar]
- Webster, W.D.; Coffell, R.; Alfaro, D. A three dimensional finite element analysis of a high speed diesel engine connecting rod. SAE Tech. Paper. 1983, 9, 83–96. [Google Scholar]
- Thejasree, P.; Dileep Kumar, G.; Leela Prasanna Lakshmi, S. Modelling and Analysis of Crankshaft for passenger car using ANSYS. Mater. Today Proc. 2017, 4, 11292–11299. [Google Scholar] [CrossRef]
- Witek, L.; Sikora, M.; Stachowicz, F.; Trzepiecinski, T. Stress and failure analysis of the crankshaft of diesel engine. Eng. Fail. Anal. 2017, 82, 703–712. [Google Scholar] [CrossRef]
- Duc, K.N.; Tien, H.N.; Duy, V.N. A Study of Operating Characteristics of Old-Generation Diesel Engines Retrofitted with Turbochargers. Arab. J. Sci. Eng. 2017. [Google Scholar] [CrossRef]
- Mamat, A.M.I.; Romagnoli, A.; Martinez-Botas, R.F. Characterisation of a low pressure turbine for turbocompounding applications in a heavily downsized mild-hybrid gasoline engine. Energy 2014, 64, 3–16. [Google Scholar] [CrossRef]
- Faisal, A.-G.; Faisal, M.M.T.; Muafag, S. Friction Forces in O-ring Sealing. Am. J. Appl. Sci. 2005, 2, 626–632. [Google Scholar] [CrossRef]
- Guzzomi, A.L.; Hesterman, D.C.; Stone, B.J. Variable inertia effects of an engine including piston friction and a crank or gudgeon pin offset. Proc. Inst. Mech. Eng. Part D J. Automob. Eng. 2008, 222, 397–414. [Google Scholar] [CrossRef]
- Richardson, D.E. Review of Power Cylinder Friction for Diesel Engines. J. Eng. Gas Turbines Power 2000, 122, 506–519. [Google Scholar] [CrossRef]
- Guzzomi, A.L.; Hesterman, D.C.; Stone, B.J. The effect of piston friction on engine block dynamics. Proc. Inst. Mech. Eng. Part K J. Multi-Body Dyn. 2007, 221, 277–289. [Google Scholar] [CrossRef]
- Mourelatos, Z.P. A crankshaft system model for structural dynamic analysis of internal combustion engines. Comput. Struct. 2001, 79, 2009–2027. [Google Scholar] [CrossRef]
Figure 1.
Schematic of the experimental procedure.

Figure 2.
The simple model of piston, crankshaft, and transmission rod.

Figure 3.
The in-cylinder pressure profile using the experimental and numerical methods.

Figure 4.
The modelled forces on the piston.
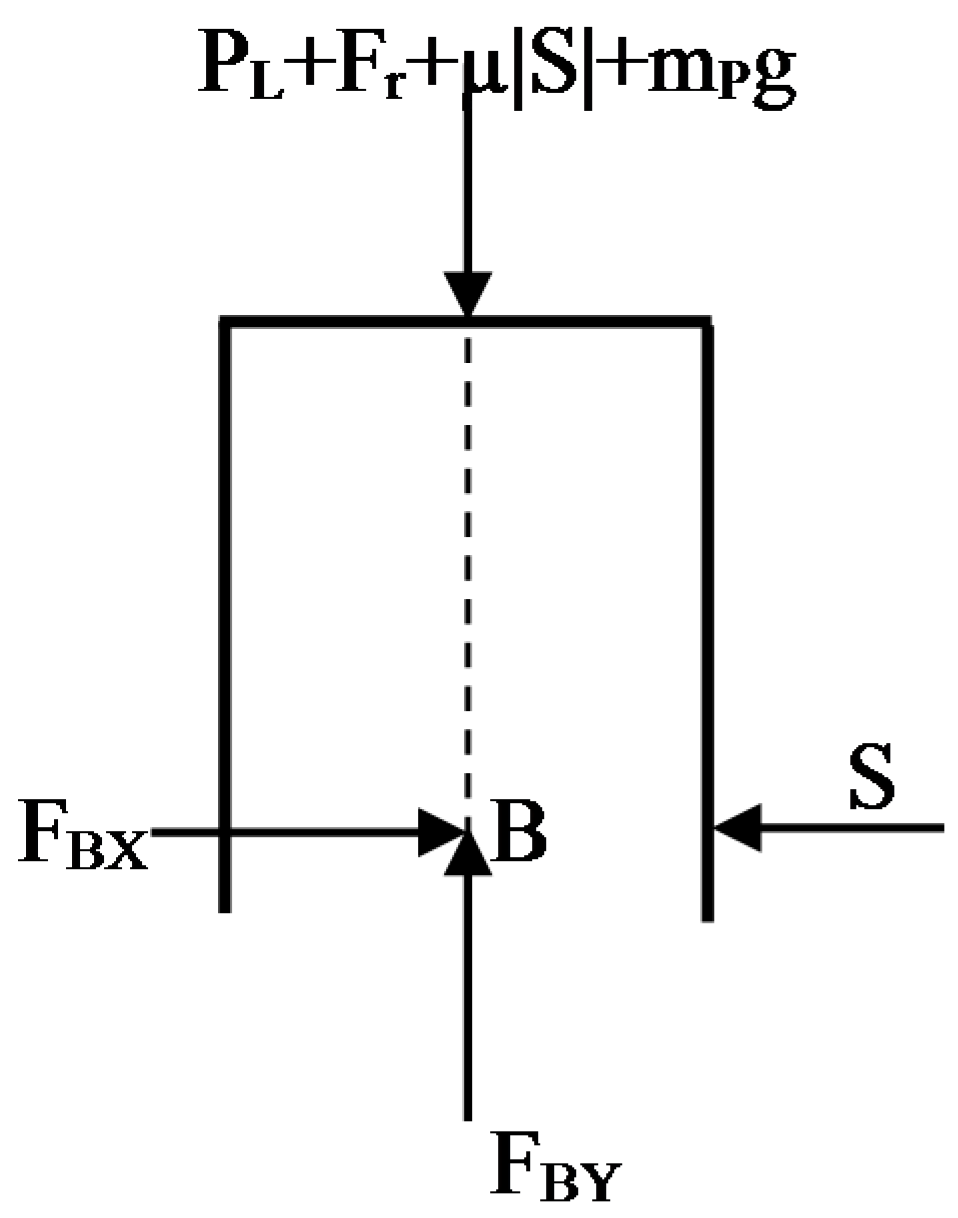
Figure 5.
The total forces on the pistons in the test engine.
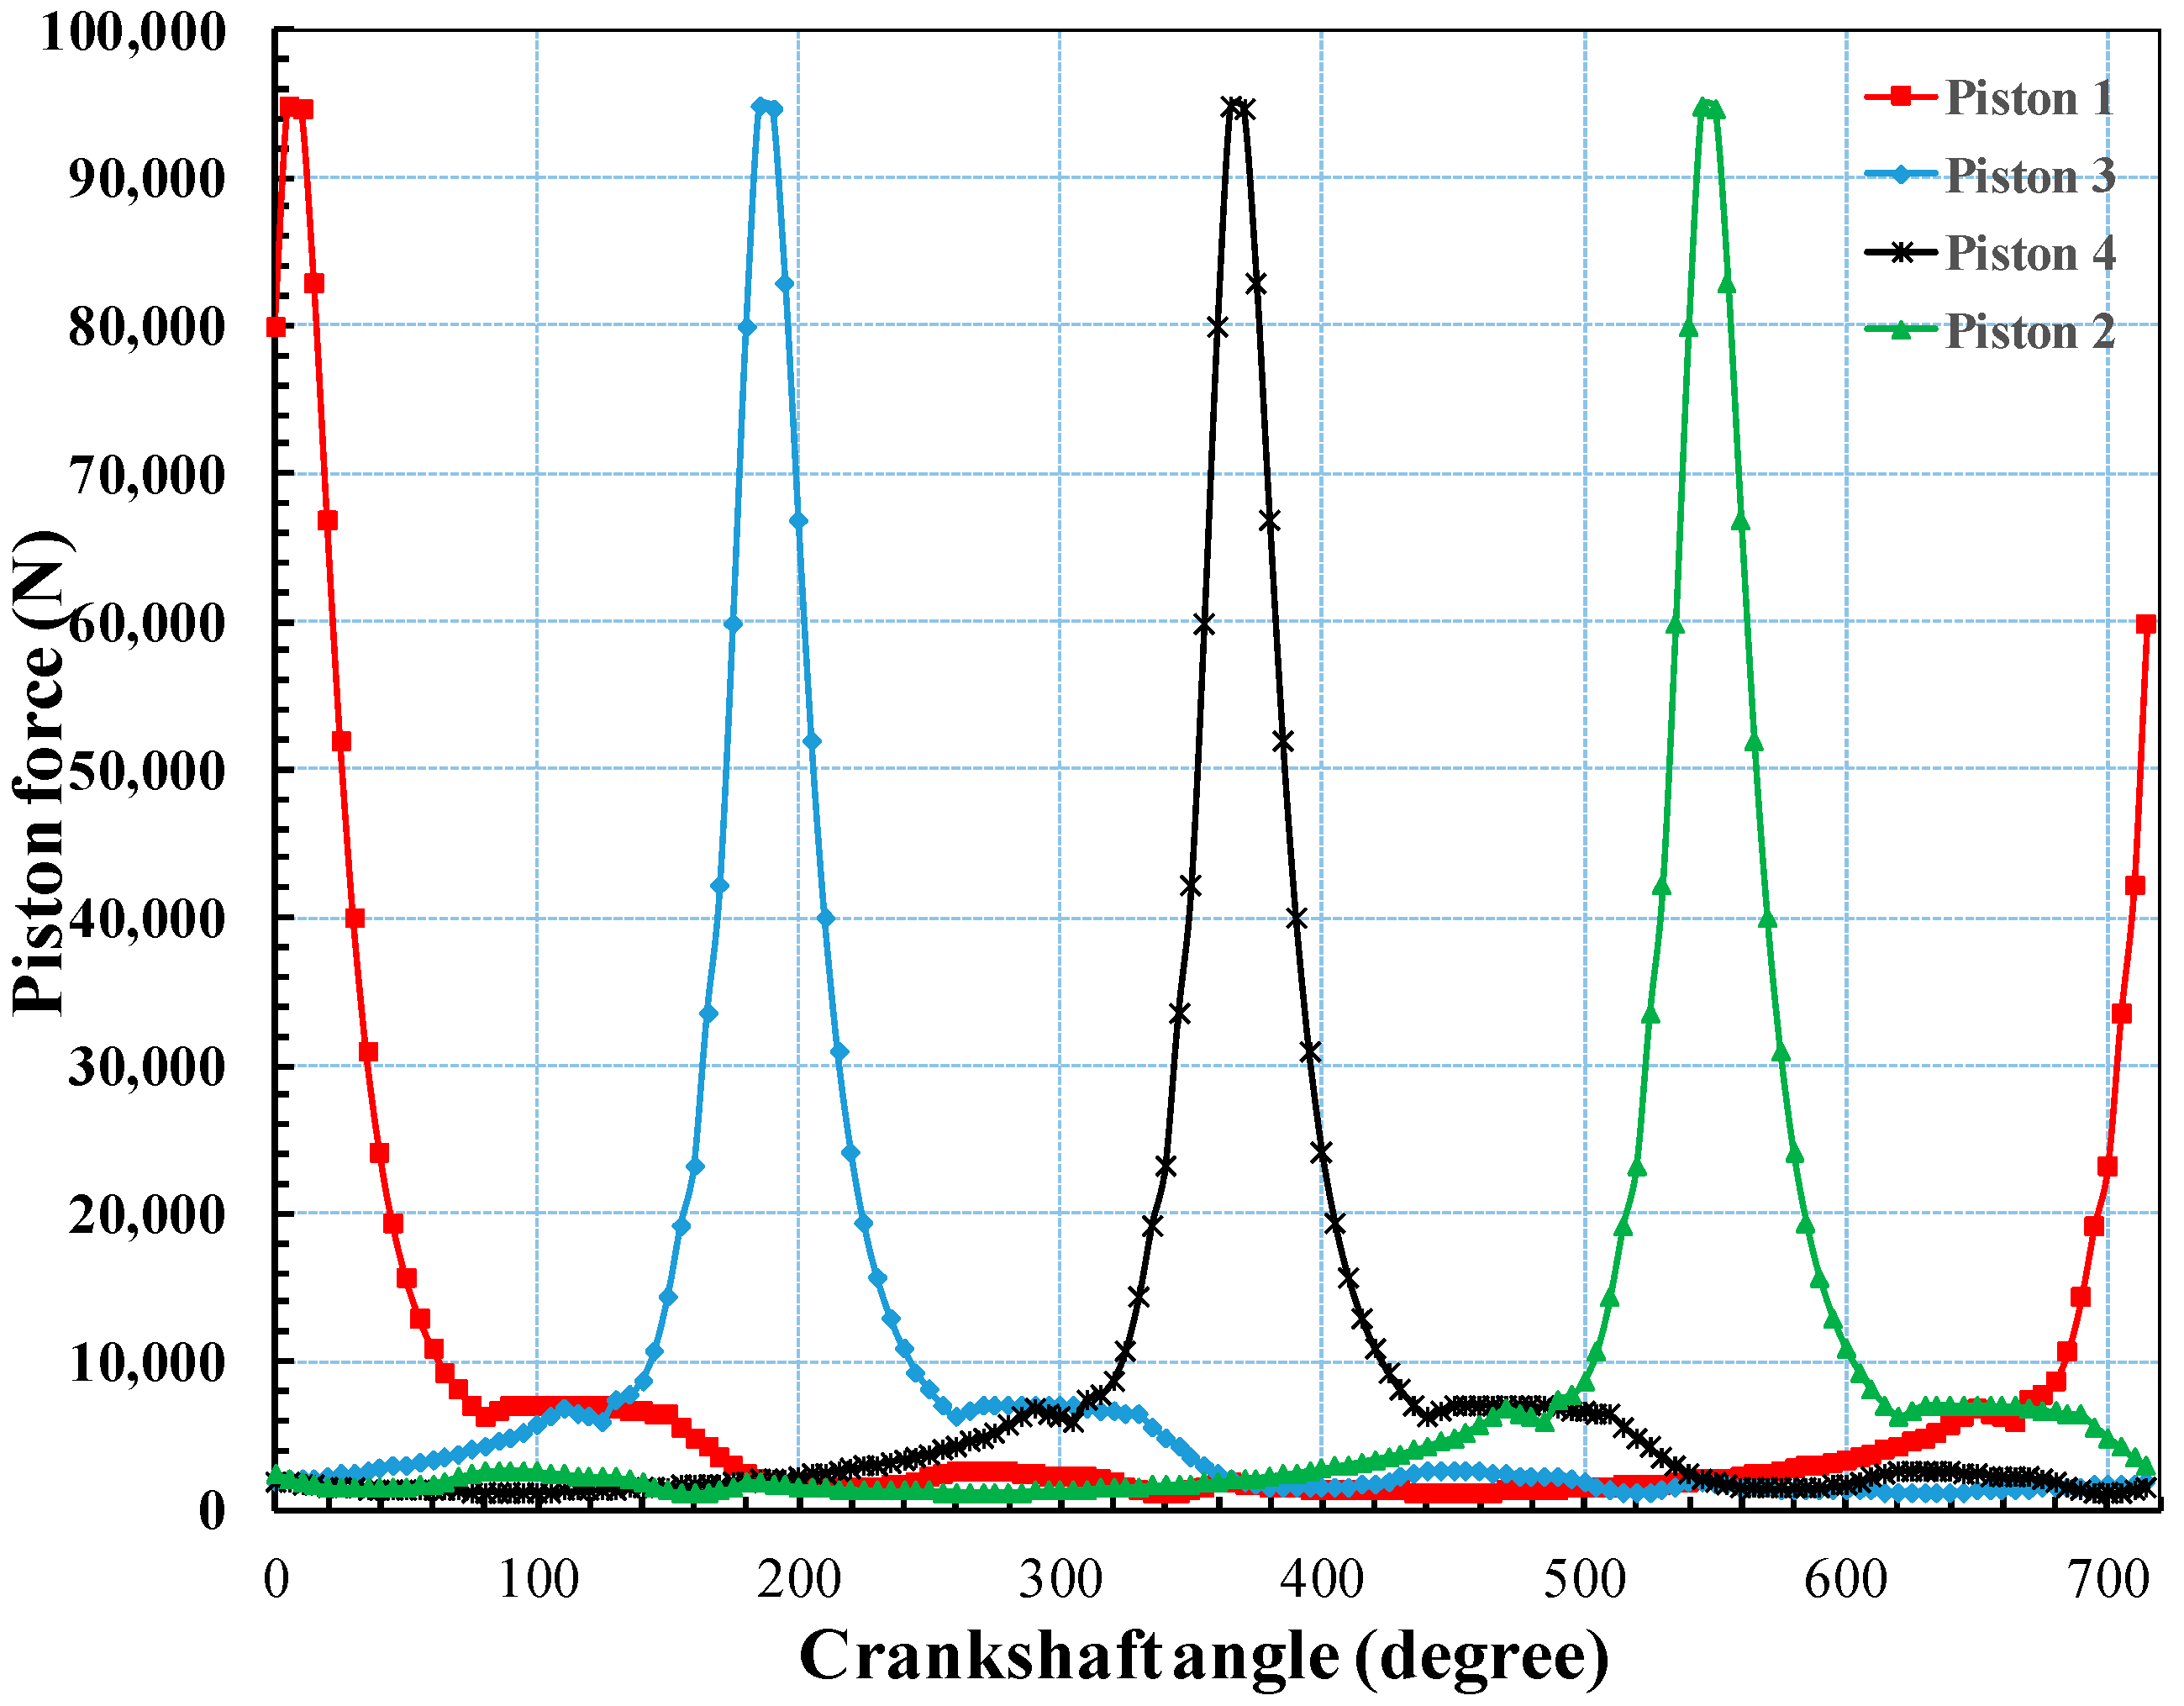
Figure 6.
The model of forces on the rod.

Figure 7.
The forces acting on the crankshaft.

Figure 8.
The forces acting on the crankpins and the crank journal of the crankshaft. (a) the torque acting on the crankpins ; (b) the torque acting on the crank journal.
Figure 8.
The forces acting on the crankpins and the crank journal of the crankshaft. (a) the torque acting on the crankpins ; (b) the torque acting on the crank journal.

© 2018 by the authors. Licensee MDPI, Basel, Switzerland. This article is an open access article distributed under the terms and conditions of the Creative Commons Attribution (CC BY) license (http://creativecommons.org/licenses/by/4.0/).
Share and Cite
MDPI and ACS Style
Viet Nguyen, D.; Nguyen Duy, V. Numerical Analysis of the Forces on the Components of a Direct Diesel Engine. Appl. Sci. 2018, 8, 761. https://doi.org/10.3390/app8050761
AMA Style
Viet Nguyen D, Nguyen Duy V. Numerical Analysis of the Forces on the Components of a Direct Diesel Engine. Applied Sciences. 2018; 8(5):761. https://doi.org/10.3390/app8050761
Chicago/Turabian StyleViet Nguyen, Dung, and Vinh Nguyen Duy. 2018. "Numerical Analysis of the Forces on the Components of a Direct Diesel Engine" Applied Sciences 8, no. 5: 761. https://doi.org/10.3390/app8050761
Note that from the first issue of 2016, this journal uses article numbers instead of page numbers. See further details here.