1. Introduction
Alzheimer’s disease (AD) is the most frequent type of dementia [
1], which includes a variety of diseases such as AD, vascular dementia, dementia with Lewy bodies, Parkinson’s disease, and more. Dementia is caused by the death or malfunction of nerve cells in the brain, which results in a decline in memory and in several cognitive abilities. In AD, the pathological abnormalities are characterized by a gradual loss of axons and neurons, together with the presence of neurofibrillary tangles and amyloid plaques in the brain. According to the new criteria for diagnosing AD [
1], the disease includes three stages: preclinical AD, Mild Cognitive Impairment (MCI) due to AD, and dementia due to AD. During the preclinical AD stage, which may last up to 20 years, no cognitive decline and memory loss symptoms occur. However, the pathogenic process in this stage already induces measurable changes in the brain, in the cerebrospinal fluid (CSF), and in the blood. Therefore, diagnostic tools for early detection of the disease, based on these pathological expressions, may have a significant advantage. Currently, there is no treatment available for preventing, or curing AD, but there are enormous efforts, worldwide, towards developing treatment. In order for treatment to be effective, there is a crucial need for early detection of AD.
One of the promising methods for early detection of AD uses measurements of cerebrospinal fluid (CSF) amyloid-beta and tau protein concentrations. Due to the accumulation of amyloid-beta in the brain, there is a significant reduction in CSF Aβ42 levels. On the other hand, the release of tau and phosphorylated-tau during the neurodegeneration and the neurofibrillary tangles creation, increases the levels of these proteins in the CSF [
2]. As a result, the CSF concentration of the Aβ42, total tau, and p-tau is highly correlated with early diagnosis of AD.
Several groups have shown the possibility of predicting the development of MCI to AD, years before the clinical diagnosis of the disease, based on these biomarkers [
2,
3,
4,
5,
6]. Hannson et al. [
3] showed that a combination of CSF T-tau and Aβ42/P-tau ratio yielded high sensitivity and specificity for detection of incipient AD in patients with MCI who were followed for a period of 4–6 years. The optimum cutoff value was Aβ42:P-tau < 6.5 for the incipient AD patients at baseline. The follow-up of this study was extended [
4] for up to 11.8 years (median = 9.2 years). Using a cutoff value of 6.16 for the Aβ42:P-tau ratio, they predicted the future development of AD dementia with a sensitivity of 88% and a specificity of 90%.
A multi-center research [
6] covering 12 centers in Europe and in the USA and including more than 1500 individuals (with AD, MCI and healthy controls) followed MCI patients for at least two years. A comprehensive statistical analysis was performed in order to determine the possibility to predict incipient AD in MCI patients based on their Aβ42, total tau and P-tau CSF levels. Their results indicated that the combination of Aβ42:P-tau ratio and total tau identified incipient AD with a sensitivity of 83% and specificity of 72%. These results are highly significant but are less accurate than the previously reported results. Possible reasons are large variability between the centers, lack of standardization, and relatively short follow-up.
In order to measure the Aβ42, total tau, and P-tau CSF concentrations, a lumbar puncture process was performed and CSF samples were collected. The lumbar puncture procedure has many risks, side effects, and complications [
7], which limit its potential to be an annual test for early AD diagnosis. This limitation may be resolved by less invasive methods that enable measurements of the CSF protein concentrations using optical techniques.
Many optical techniques were developed for quantifying tissue components, proteins and drugs. Most of the methods are based on transmission or diffused reflection spectroscopy. When quantifying tissue components in vivo, these methods usually use near-infrared (NIR) wavelengths, especially in the 650–900 nm range where the absorption of water and fat is rather low. Therefore, spectroscopy-based methods may not be suitable for quantifications of proteins whose absorption peaks do not fall in this range of wavelengths.
Fluorescence sensing methods may be used for quantifying the concentration of biological molecules, which may bond to extrinsic fluorophores. However, in most presented methods, the concentration estimation required usage of light propagation models combined with a priori knowledge of the tissue optical properties [
8,
9,
10,
11,
12,
13,
14] or the usage of complex tomography systems [
15,
16,
17,
18,
19,
20], which are less suitable for endoscopic applications. In addition, most of these methods usually involve an additional calibration process by normalizing the emission against the excitation [
21], or normalizing multiple emission wavelengths [
22].
Several groups have developed fluorescent probes suitable for the detection of Alzheimer’s disease. Many groups have focused on developing fluorescent probes with high affinity to amyloid-beta protein, which may image the amyloid plaques in the brain. Raymond et al. [
23] have synthesized and tested a family of dyes (NIAD) that emit a characteristic fluorescence signal only when bound to amyloid-beta protein. They have showed changes in the fluorescence quantum yield, lifetime and emission spectra due to the binding of the probe to amyloid-beta. Hintersteiner et al. [
24] have described a high quantum yield NIR probe AOI987, penetrating the blood–brain barrier. They demonstrated the interaction of the probe with amyloid plaques in APP23 transgenic mice in vivo and showed increasing fluorescence intensity with increasing plaque load. Zhang et al. [
25] designed and synthesized curcumin based NIR probes. The CRANAD-58 probe showed significant fluorescence property changes upon mixing with both soluble and insoluble Aβ species in vitro. They tested it in vivo and revealed that CRANAD-58 was capable of differentiating transgenic and wild-type mice as young as four months old. They have also designed the CRANAD-17 probe, which was capable of inhibiting Aβ42 cross-linking induced by copper. This raises a possibility for CRANAD-17 to be considered for AD therapy.
Okamura et al. [
26] report the optical profiles of THK-265, which has high binding affinity to amyloid plaques. They demonstrated that amyloid deposits in AβPP transgenic mice could be detected after intravenous administration of THK-265. They reported significantly higher fluorescence intensity in the brain of AβPP transgenic mice than in those of wild-type mice. Schmidt et al. [
27] have also used THK-265 to develop and test a procedure for cerebral amyloid deposits visualization. They demonstrated in vivo the correlation between the intensity of the THK-265 signal and the plaque burden, indicating its utility for direct monitoring of Aβ aggregation progression. Cui et al. [
28] report the synthesis, characteristics, and biological evaluations of a series of donor–acceptor molecules (DANIRs) as smart NIRF imaging probes for Aβ plaques in AD. These probes were proved to have affinity to Aβ plaques ex vivo, in vitro, and in vivo, with a significant fluorescence intensity increase and a blue-shift in the emission spectra.
Other groups have tried to develop fluorescent probes with affinity to tau proteins. Maruyama et al. [
29] developed a class of tau ligands (PBBs) for optical and PET imaging. These included PBB5, a near-infrared fluorescent probe, which could assess tau accumulation in living mouse models. They demonstrated strong fluorescence of PBB5 in Tg mice expressing a single human four-repeat tau isoform (PS19) relative to non-Tg WT mice in the central nervous system (CNS) suggesting a concentration of this tracer in the PS19 spinal cord. Kim et al. [
30] designed a NIR ratiometric probe, CyDPA2 that targets Tau aggregates. They evaluated it in vitro and ex vivo and reported an enhancements of absorption ratio and fluorescence intensity in a p-Tau concentration-dependent manner. In addition, fluorescence microscopy and gel staining studies demonstrated CyDPA2-labeled Tau aggregates.
In a previous report [
31], we proposed an optical method that enables measurements of the CSF biomarker concentrations utilizing fluorescence probes, without the need to perform a lumbar puncture. This method is less invasive and has minimal risk, pain, and side effects. The method includes several stages. First, fluorescent probes [
23,
24,
25,
26,
27,
28,
29,
30,
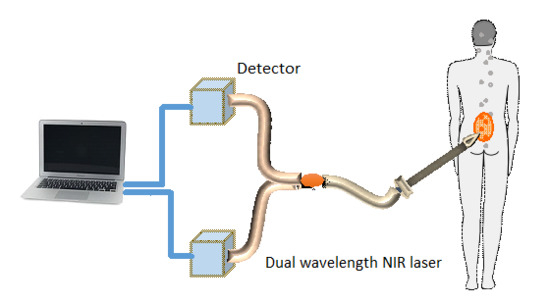
32], which bind specifically to the two biomarkers in the CSF, are injected to the blood. Second, a miniature needle with an optical fiber is inserted into the epidural fat, which is located several millimeters from the CSF, without penetrating the dura matter. The fluorescent biomarkers are then excited by a laser, which reaches the CSF through the optical fiber located inside the needle. Finally, the fluorescence intensities of both biomarkers are measured and used for the estimation of the biomarkers concentration ratio.
Since this optical method does not require CSF collection, the dura matter is not penetrated and a smaller needle may be used. Therefore, the lumbar puncture risks, which include CSF leakage, traumatic taps, spinal cord injuries, and severe headaches, are significantly reduced. In addition, as opposed to other similar optical methods [
12,
13] the concentration ratio estimation using this method does not require a priori information about the tissue optical and anatomical properties.
In our previous report [
31] we introduced a theoretical model that enables to create the relation between the measured fluorescence emission and the biomarkers concentration ratio. The method was validated using Monte Carlo simulations and its accuracy was tested in vitro using multi-layered tissue phantom. Here we further assess the method’s accuracy using mice. Miniature tubes containing two fluorescent probes with several concentration ratios were implanted in the mice. The tubes were inserted into two different locations: subcutaneously, and deeper in the abdomen. The fluorescent probes were excited separately and their fluorescence intensity was measured. Using a simple calibration curve, the concentration ratio of the fluorescent probes in each tube was extracted. The extracted ratios were compared to the true ratios and an error analysis was performed.
2. Materials and Methods
2.1. Fluorescent Probes
Several fluorescent probes with high affinity to amyloid-beta and tau protein were described in the Introduction [
23,
24,
25,
26,
27,
28,
29,
30,
32]. However, these probes are still under development and are not commercially available, off the shelf products, hence could not be obtained. Therefore, we decided to test our method and verify the accuracy of the concentration ratio estimation using two fluorescent probes that may be purchased easily.
The optimal fluorescent probes should have separate absorption spectra, both in the range of 750–850 nm, where the changes in the absorption and scattering properties of the tissue are negligible. According to this requirement, Cy7 azide and Cy7.5 azide (Lumiprobe, Hallandale Beach, FL, USA), with absorption peaks at 750 and 788 nm and emission peaks at 773 and 808 nm, respectively, were chosen. The extinction coefficients of Cy7 and Cy7.5 are 199,000 and 223,000 [M−1cm−1] and the quantum yield of Cy7 is 0.3. The value of the quantum yield of Cy7.5 was not given by the manufacturer.
Fluorescent samples were prepared with different concentrations between 50 and 900 nM, mixed with concentration ratios (Cy7:Cy7.5) between 1:2 and 1:14. These ratios cover the range of expected concentration ratio between amyloid-beta and P-tau proteins, for MCI patients developing AD, other dementia, or stable MCI.
2.2. Animal Studies
In order to verify the method’s accuracy in animal models, miniature tubes containing fluorescent samples were implanted subcutaneously and abdominally in mice. The miniature tubes were 7 mm long, with 1.7 mm outer diameter and 1 mm inner diameter. They were filled with approximately 5 µL of the fluorescent samples. The tubes were then sealed at both ends using adhesive.
Five C57BL/6 mice were anaesthetized using intraperitoneal injection of ketamine (100 mg/kg) and xylazine (10 mg/kg). Two incisions of 3–5 mm were performed on each mouse. One incision was made in the skin near the hind leg of the mouse. A subcutaneous pocket was created and a tube was inserted into the pocket. The pocket was then closed using a 9-mm AutoClip. A second incision was made in the abdomen area of the mouse. This incision was deeper than the subcutaneous one, enabling insertion of the tube a few millimeters deep in the mouse tissue, thus located below skin, muscle and fat tissues. This incision was also closed using a 9-mm AutoClip, which prevented any bleeding. The two fluorescent tubes measured directly after implantation, as will be detailed in the
Section 2.6,
Section 2.7 and
Section 3.2. Anesthetization lasted up to three hours, during which the implantation and fluorescence measurements were performed. When necessary, an additional dose of ketamine (50 mg/kg) was administered to the mouse subcutaneously. All mice were sacrificed by cervical dislocation. All the experimental procedures were approved by the Animal Care Committee of Tel Aviv University (approval number: 034_b8007_26).
2.3. Reference Phantom
A reference phantom required for the calibration process was composed of polyester resin with Titanium Dioxide, according to the protocol described by Firbank and Delpy [
33]. Titanium dioxide was added in order to increase the scattering coefficient of the polyester, with a 0.53% titanium dioxide mass percentage. The reference phantom was squared with 2.7 mm thickness and the length of the side was 35 mm.
2.4. System Setup
The samples were excited with a mode-locked, Ti:Sapphire femtosecond laser (Tsunami, Newport/Spectra-Physics, Santa Clara, CA, USA), with 80 MHz repetition rate, pumped by a 5 W, 532 nm laser (Millennia vs., Newport/Spectra-Physics). The laser was tuned to 750 nm for the cy7 excitation and 800 nm for the cy7.5 excitation. The excitation beam was split to a fast photodiode (PHD-400, Becker & Hickl GmbH, Berlin, Germany) for signal synchronization, and to the center fiber bundle of a fluorescence inspection probe (Oriel 77558, Newport, Santa Clara, CA, USA). The Oriel inspection fiber has a central core with a fiber bundle that carries the excitation radiation to the samples. The core is surrounded by a ring of fibers that collect and deliver the fluorescence from the sample to the output channel. The source detector separation, between the central core (input) and the fiber ring (output), was less than 1 mm. The collected fluorescence is delivered through the distal end of the output channel into a filter wheel switching between a band-pass filter FF01-780/12 (Semrock, Rochester, NY, USA) for the Cy7 and long-pass filters RG830 and RG850 (Newport) for the Cy7.5 collection. The emission was measured using a fast photomultiplier tube (PMT) head (H7422P-50, Hamamatsu, Japan). The PMT was controlled using the DCC-100 detector controller (Becker & Hickl GmbH). Data acquisition was accomplished using the TCSPC module (SPC-730, Becker & Hickl GmbH) synchronizing between the SYNC signal arriving from the photodiode and the constant fraction discriminator (CFD) signal from the PMT.
2.5. Calibration Process
A calibration process was performed prior to the animal fluorescence measurements of the miniature tubes. For the calibration process five fluorescent samples were prepared, covering the range of ratios that were measured during the experiment. The samples were placed in sealed cuvettes and the reference phantom was placed above them. The fluorescence energy emitted by these samples was measured at two excitation wavelengths, one for each fluorophore, with the appropriate emission filter. For each measurement, the total number of photons measured by the TCSPC system was used as the fluorescence energy value. A calibration curve of fluorescence energy ratio versus concentration ratio was created based on these measurements.
2.6. Intensity Ratio Measurements
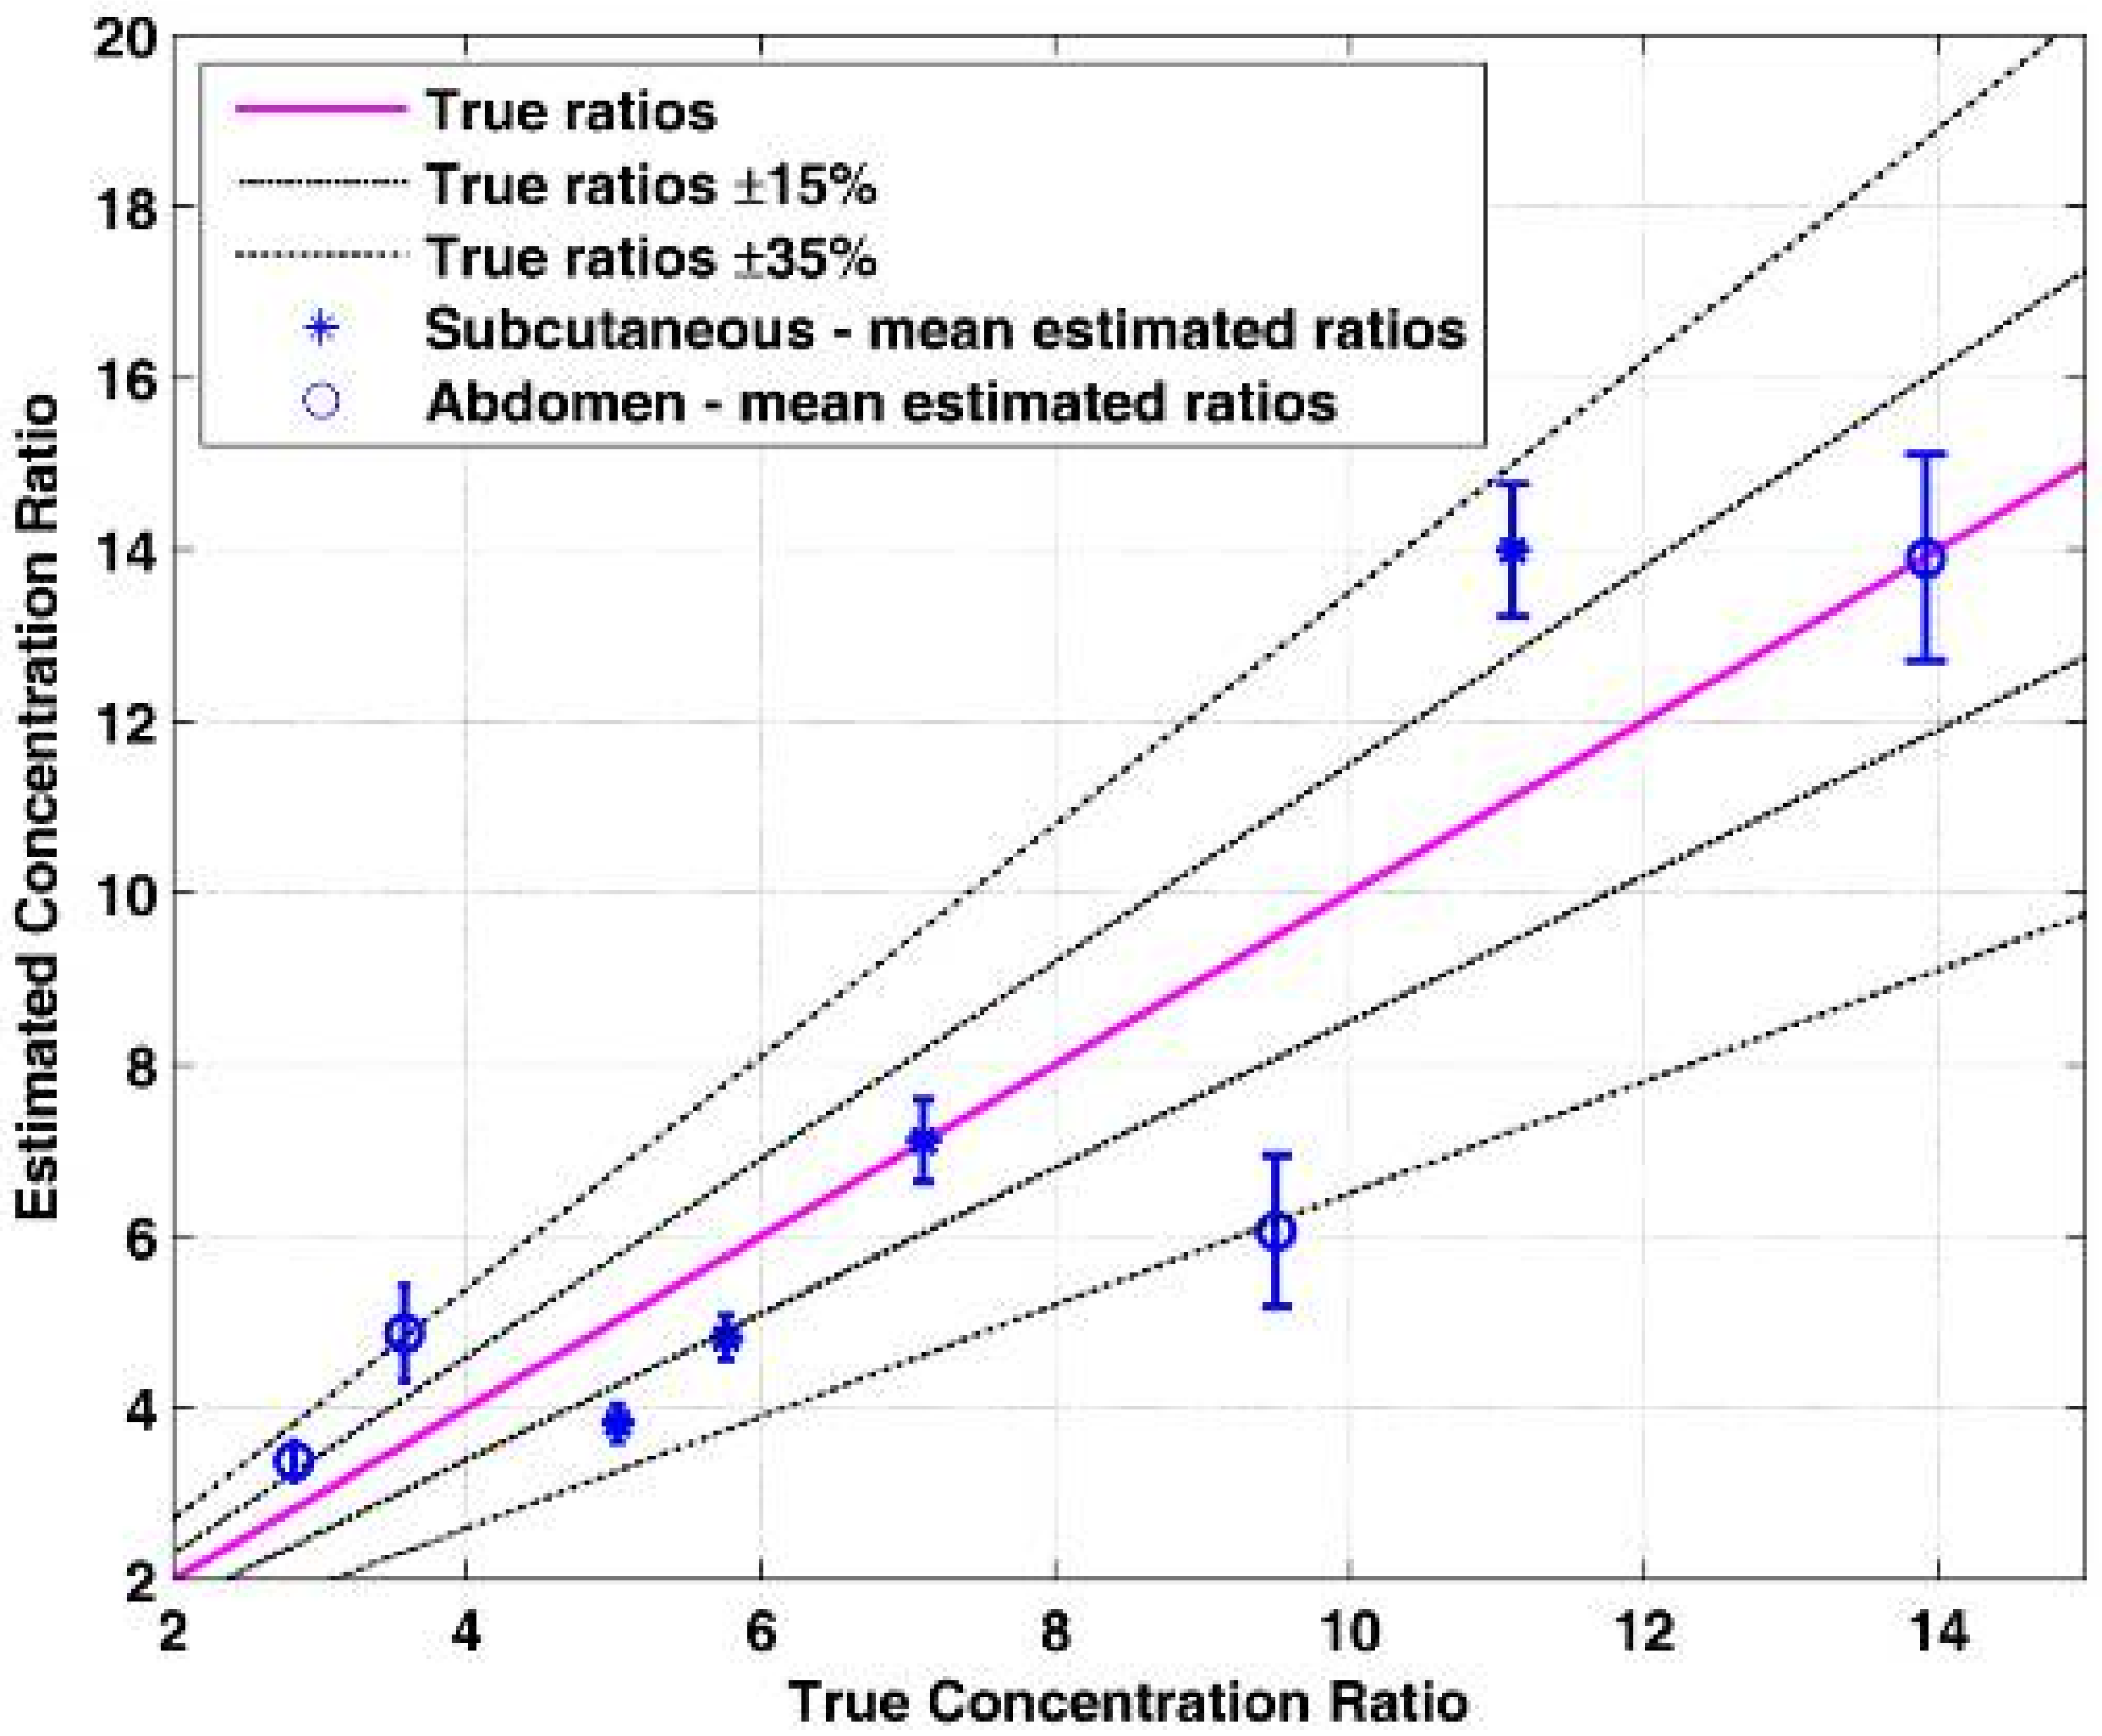
Five mice were anesthetized and implanted each with two fluorescent tubes—subcutaneous and deeper in the abdomen. Two of the tubes were excluded due to problems with the location of the implantation. Eventually the experiment included a total of eight tubes with eight different fluorescent ratios. The fluorescence emission of the probes in the tubes, covering ratios in the range of 1:2 to 1:14, was measured using the fluorescence inspection probe. Four tubes were located subcutaneously and four were located deeper in the abdomen of the mouse. When necessary, the mice were shaved prior to the fluorescence excitation.
The fluorescence measurements were repeated several times for each fluorescent tube. The location of the fiber bundle on the mouse skin surface was changed for each excitation in order to test varying tube depths. After each location change of the fiber bundle, a time-resolved fluorescence intensity was taken in order to ensure that the fluorescent tube is in the imaged photon path. In cases where very low fluorescence intensity was measured the fiber bundle was relocated. In other cases, high intensity was measured but a Gaussian-shaped, time-resolved curve without the expected fluorescence lifetime decay was measured, thus indicating that the collected photons are only resulting from laser reflections, and not from fluorescence. In those cases, the fiber bundle was relocated again until a typical fluorescent lifetime curve was measured. The measured energy ratio was then converted to a concentration ratio value using the calibration curve and compared to the true concentration ratio value.
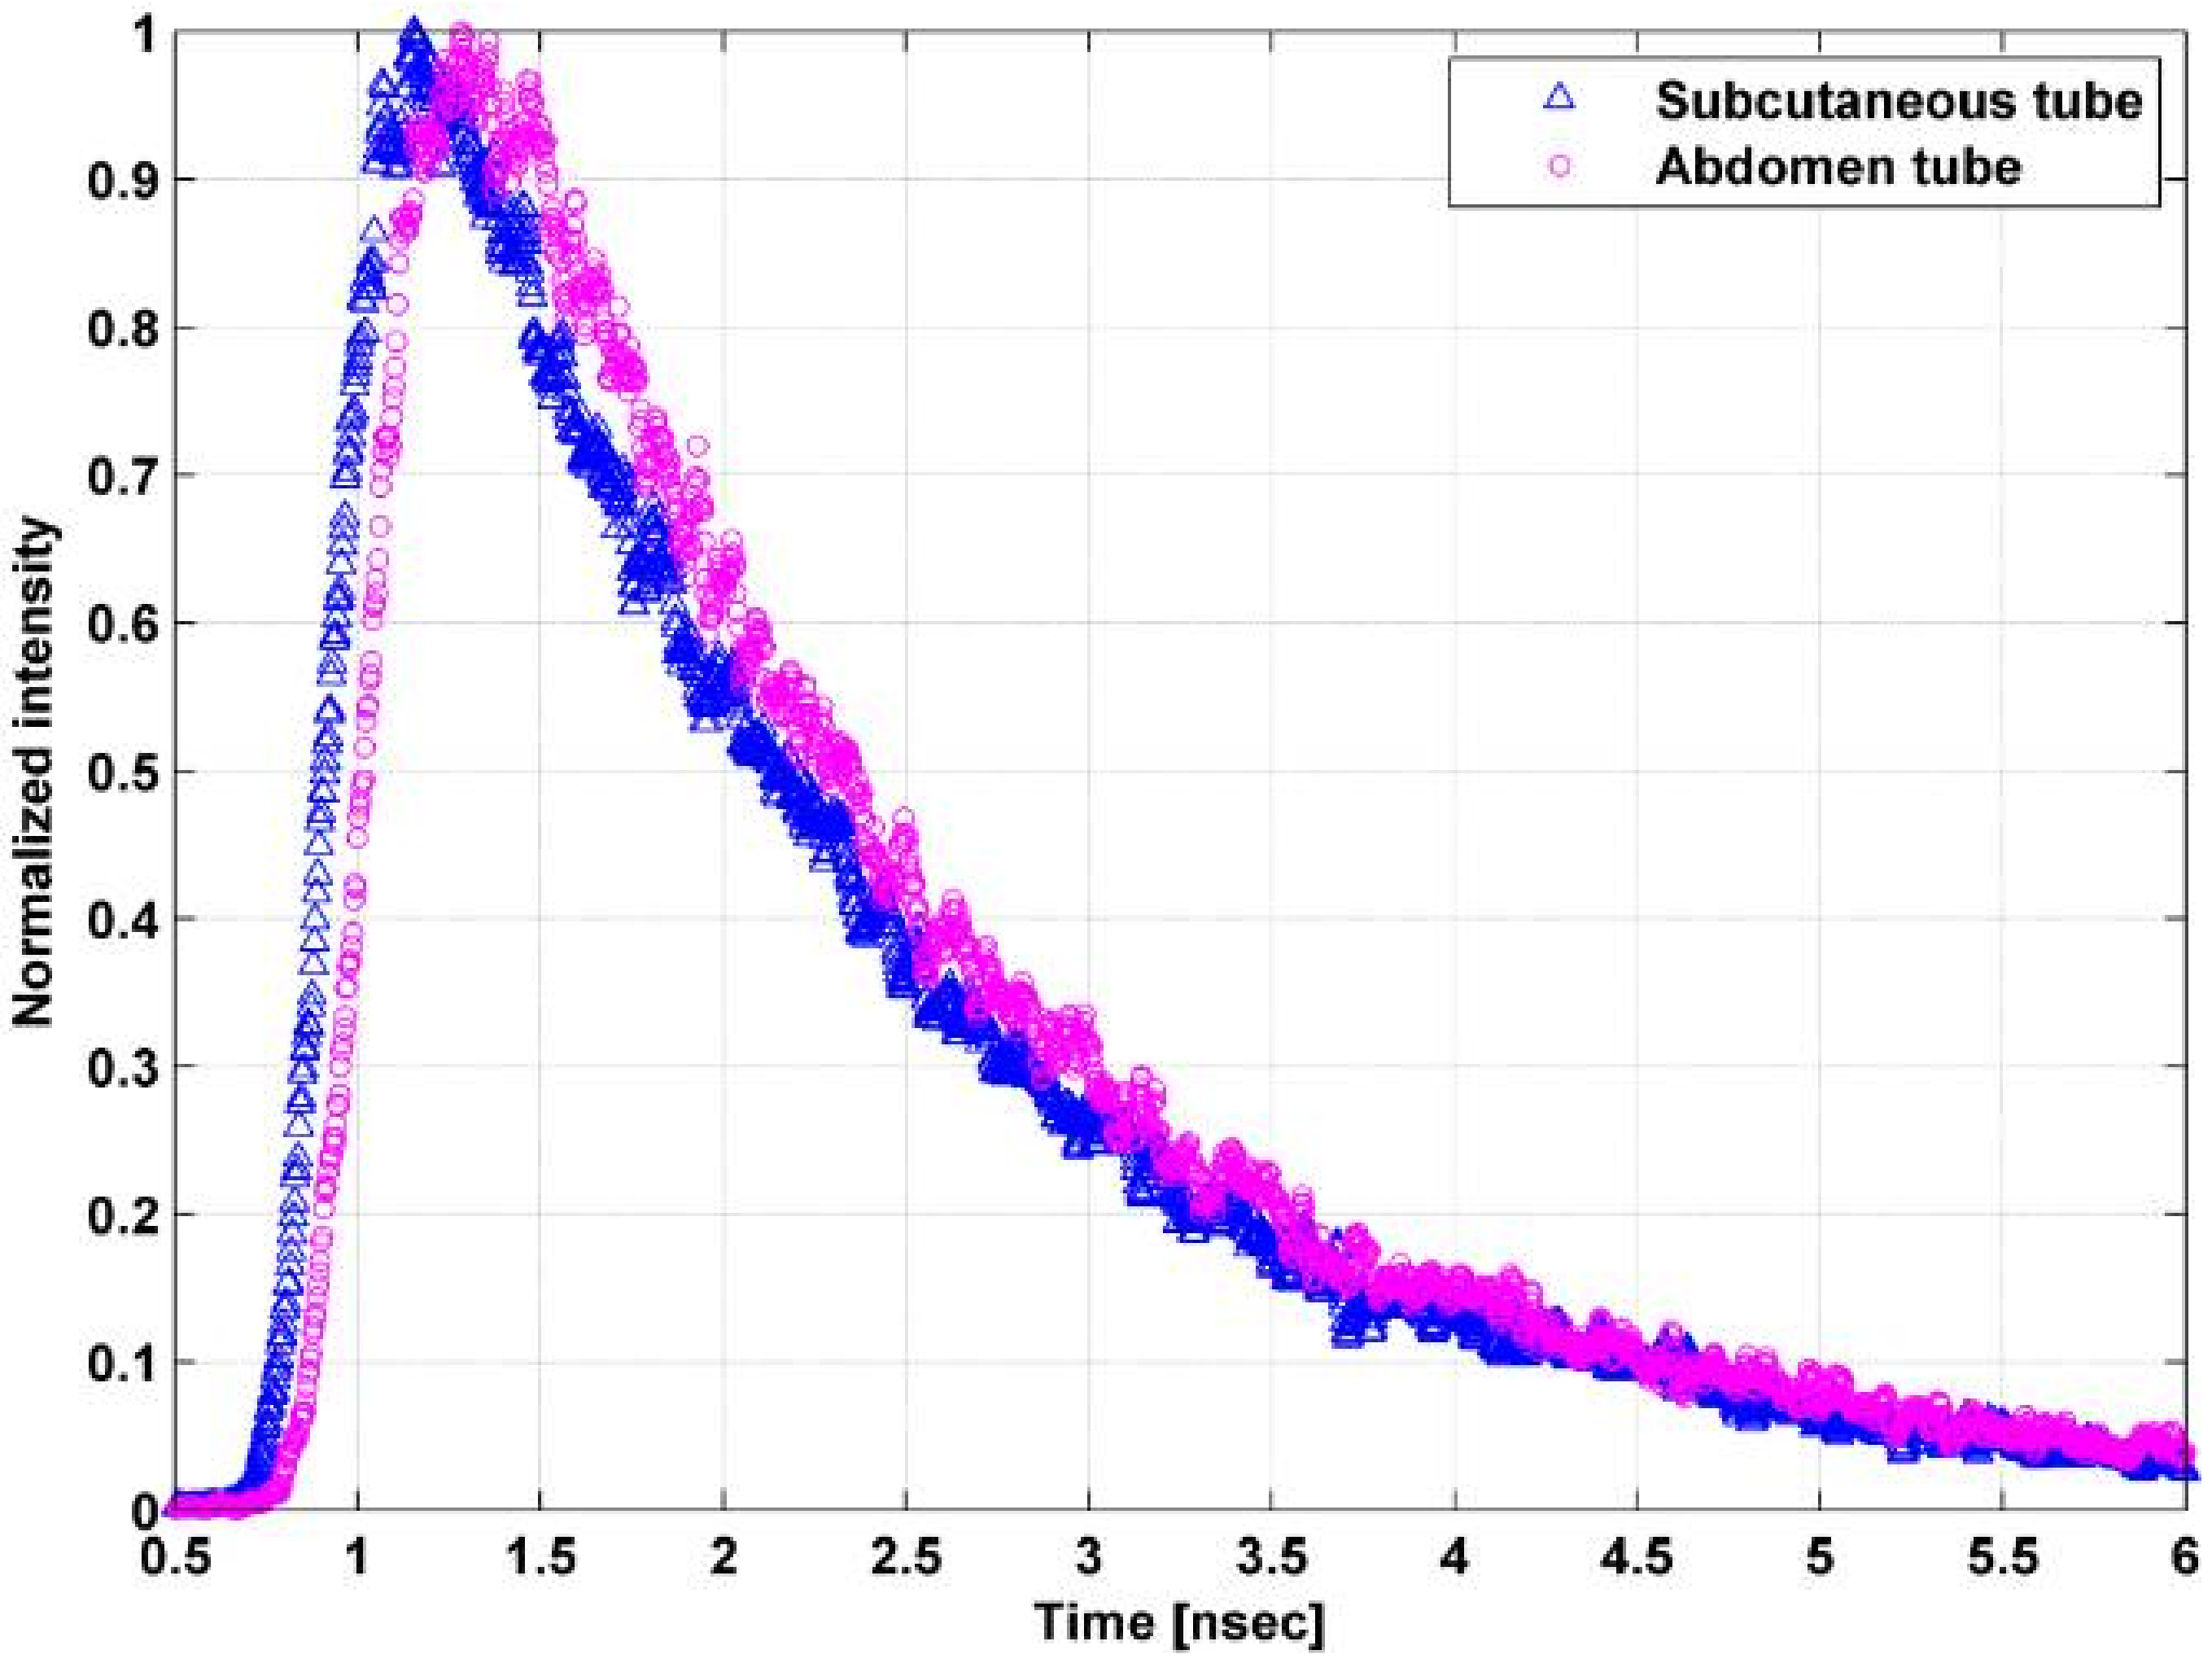
2.7. Intensity Time-Resolved Measurements
Fluorescence intensity time-resolved measurements were taken from tubes implanted both subcutaneously and in the abdomen. The time-resolved curves were measured using the TCSPC system.
4. Discussion
A method for early detection of Alzheimer’s disease using fluorescent probes in the CSF was previously presented by us [
31] and validated in vitro and ex vivo. We have further tested and verified the method’s accuracy and performance in animals, in this paper. Although the fluorescent probes were not injected directly to the blood and measured in the CSF as the method proposes, the experiments in this study were an additional important step towards testing the method in an AD animal model. Here we implanted tubes with fluorescent samples into two locations—subcutaneous and in the abdomen. The tubes with the clear fluorescent sample simulate the clear CSF layer, and the overlying tissue simulates the epidural fat layer. Since the abdomen tissue of the mouse consists mainly of fatty tissue, we can assume that the optical properties of the abdomen are similar to the epidural fat in the lumbar section. The experiments were performed also on a live tissue with blood flow and other vital signs, therefore making this a good model for the next in vivo step.
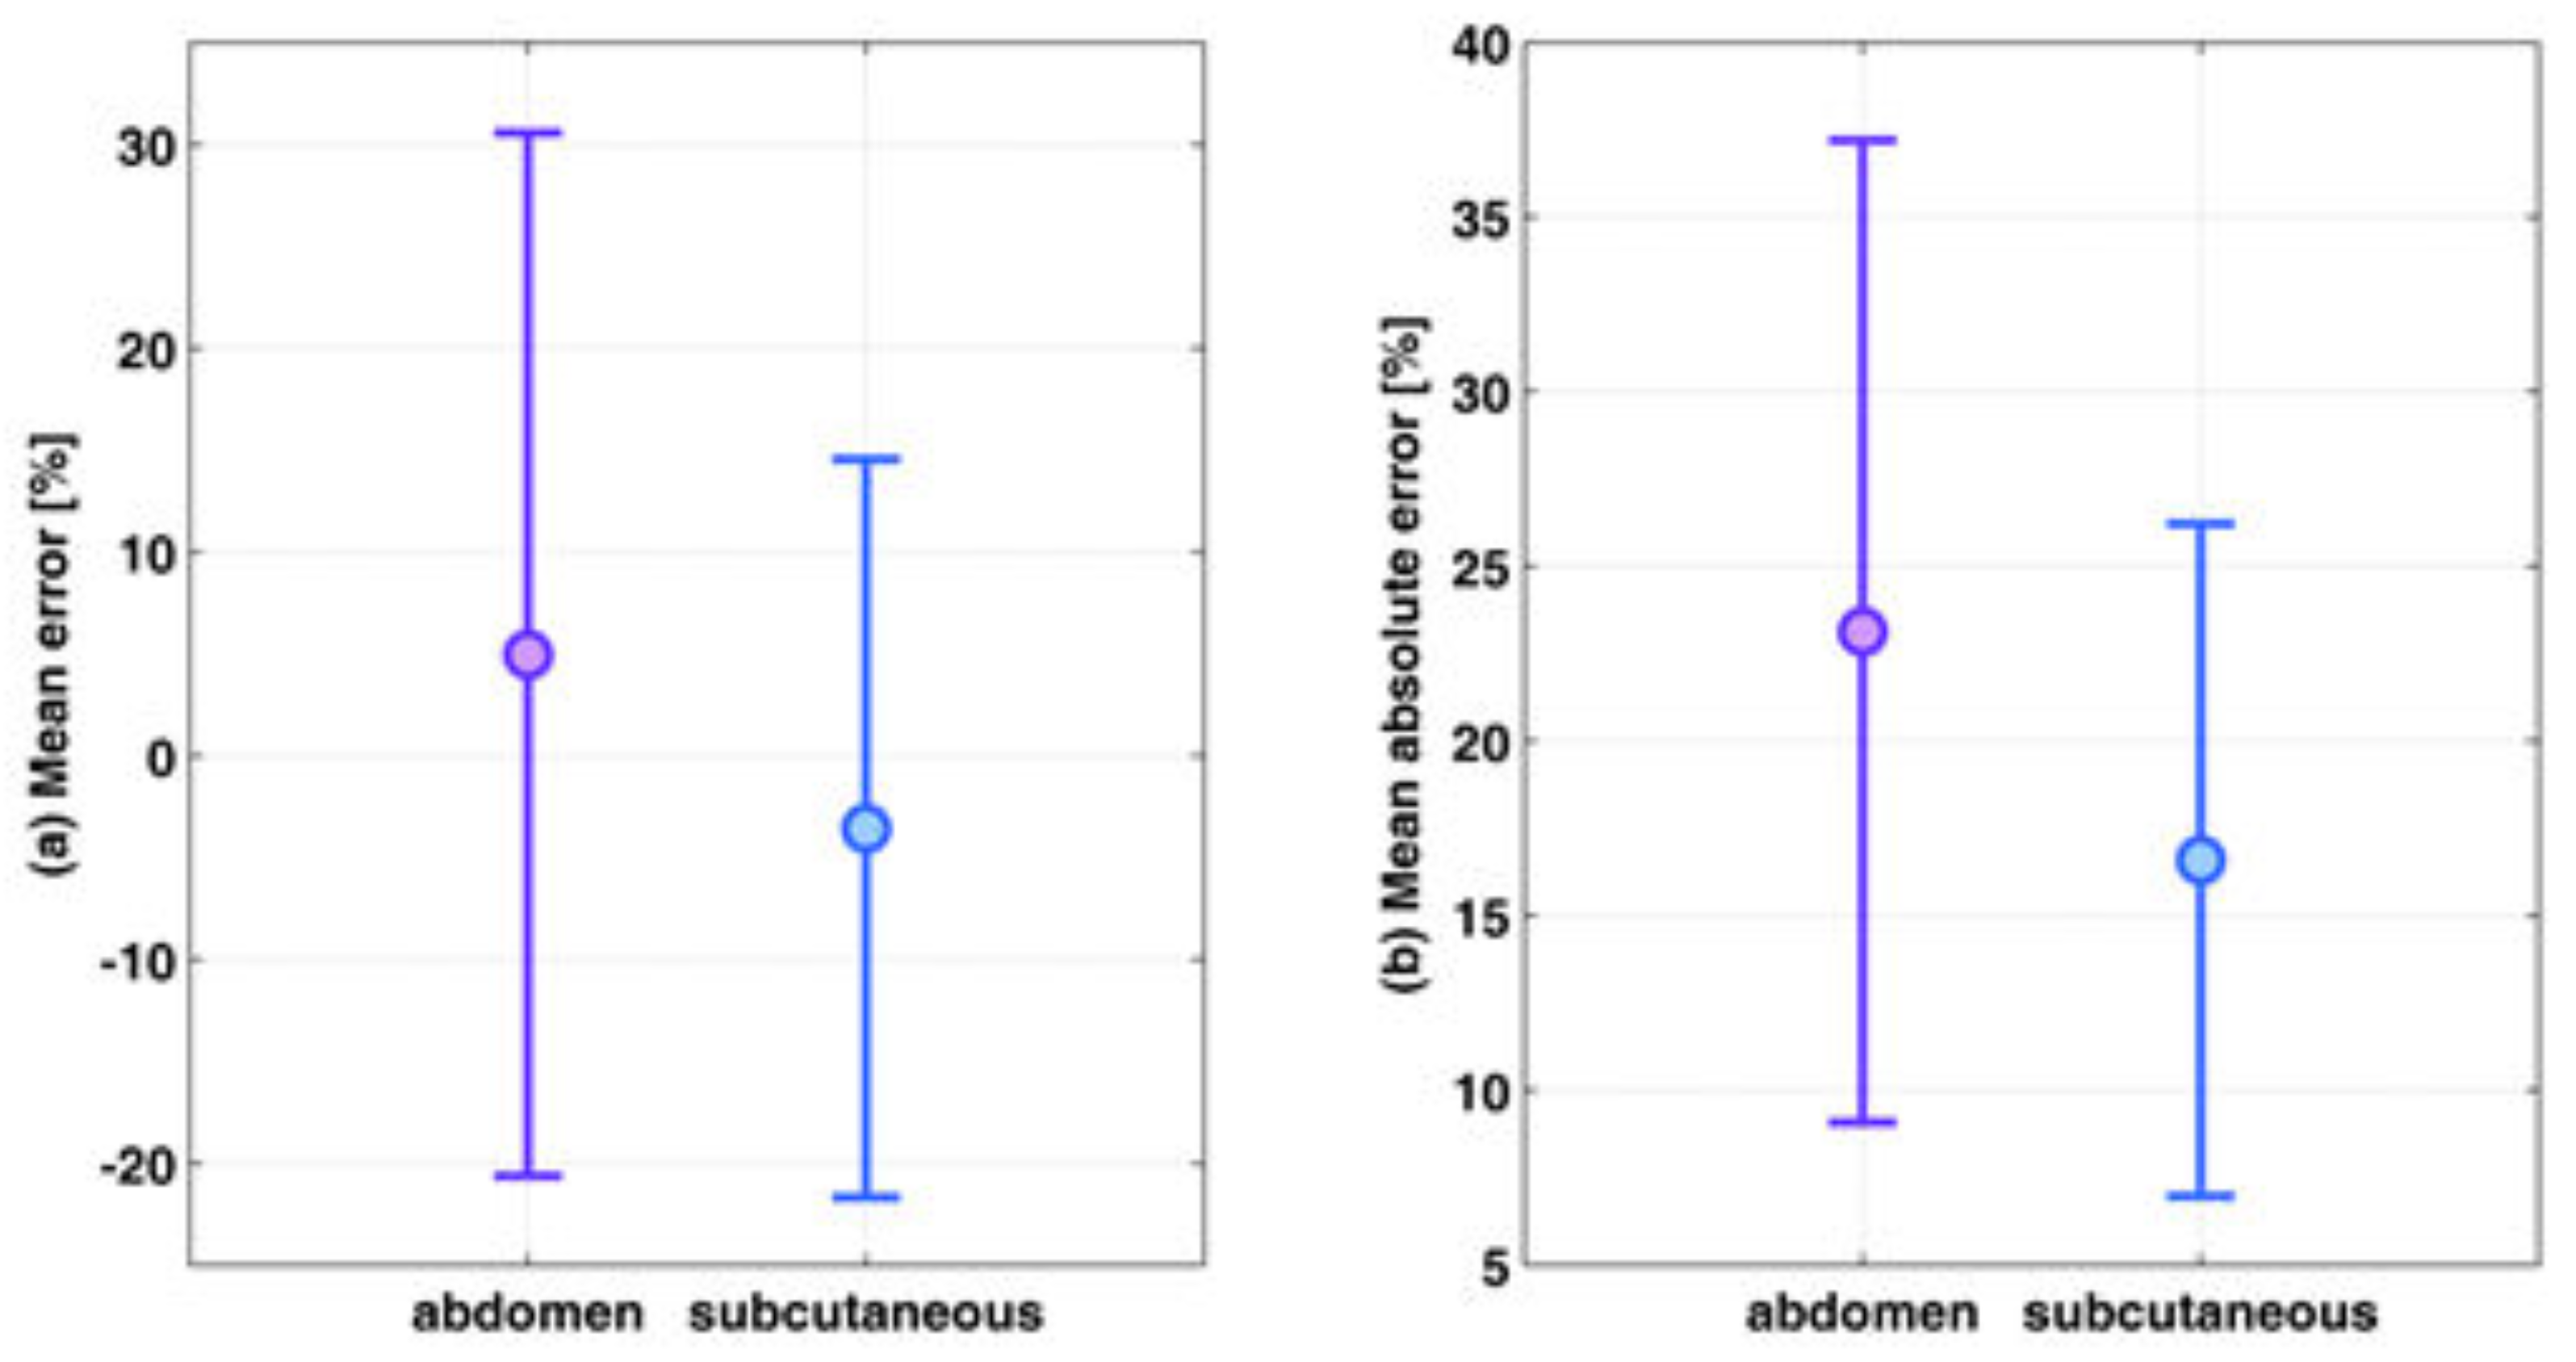
The accuracy of the estimation of the ratio between two fluorescent probes was tested for a large range of ratios using these experiments, with an average estimation error of 19.9%. In our previous experiments [
31], performed in vitro on polyester phantoms and ex vivo on chicken breast tissue, the average estimation error was lower. It was less than 5% for the in vitro and 11% for the ex vivo experiments. One can notice that there is an increase in the mean error with an increase in the complexity of the overlying medium. This result indicates that the optical properties of the reference phantom, which is used for creating the calibration curve, are not sufficiently close to the properties of a live tissue. The reference phantom is made of polyester resin with titanium dioxide, thus its scattering [
33] is similar to the scattering of human tissue, which has a rather flat scattering spectra in the NIR range [
34]. On the other hand, the absorption coefficient of human tissue varies in the NIR range with some peaks in the 700–800 nm range. These absorption peaks do not exist in the polyester absorption spectra, and therefore the polyester reference phantom differs in its absorption spectra from a living tissue, in mice or human. We can assume that chicken tissue has more features in its absorption spectra that are similar to human spectra, and obviously living mice are even more similar. The concentration ratio estimation relies on the fact that the optical properties variation in the 700–800 nm range is negligible, and the energy attenuation due to photon propagation is identical in these wavelengths. Therefore, there may be inaccuracies when calculating the ratio based on a calibration curve, which was created using a medium with a different absorption spectrum than the measured tissue. Nevertheless, the errors are still rather small and reasonable. The system’s accuracy may be improved using a different reference phantom, which better resembles the human tissue optical properties, for instance by adding an absorber, such as blood to the polyester. Such an absorber may assist in creating an absorption spectrum similar to the human tissue spectrum.
The fluorescent probes that were implanted subcutaneously had slightly lower estimation errors compared to those implanted deeper in the abdomen. This was explained by the low fluorescence intensity in the abdomen tubes, caused by a thicker overlying tissue. The decrease in the fluorescence intensity caused a lower signal to noise ratio and bigger errors. In addition, the concentration ratio estimation is based on the assumption that the measured fluorescence intensity ratio is affected mainly by the concentrations of the fluorophores and that the energy attenuation due to photon propagation is identical in both wavelengths. However, there are some differences in the absorption and scattering coefficients between the wavelengths used for the excitation of the two fluorophores, and therefore the errors in the concentration ratio estimation increase with an increase in the tissue thickness. Since the abdomen tubes have thicker overlying tissue than the subcutaneous tubes, the inaccuracy that results from not taking into account photon propagation attenuation has a higher effect, causing bigger errors. There are several actions that may be helpful in avoiding high errors in thick tissue. The first is obviously to avoid performing measurements when there are high distances between the needle and the CSF. This may be done by slow insertion of the needle until a sufficiently high fluorescence signal is measured, with an acceptable signal to noise ratio. In addition, we presented the option to use the fluorescence time-resolved measurements for estimating the distance between the needle and the CSF, and the scattering coefficient. These two estimated values may be used as a correction factor that takes into account the tissue thickness and its optical properties without totally neglecting the photon propagation attenuation.
Although in some cases, the ratios were estimated with an error of 35%, the sensitivity and specificity still remained high. This may be explained by the fact that for low concentration ratios, an error of 35% still resulted in a relatively low difference between the true and estimated ratio. For instance, in one of the cases, the true ratio was 3.57 and the estimated ratio was 4.86, which is equivalent to 36% error. However, the difference between the true and estimated ratio is 1.29, a rather low difference that will not cause false predictions. In the high concentration ratios, the big errors caused a larger difference between the true and estimated ratio values, but the cutoff value was relatively distant from the true ratio. As a result, in those cases, even big errors did not cause too many false predictions. On the other hand, the concentration ratio values that were close to the cutoff value were estimated with a very high accuracy so the sensitivity and specificity remained high. We can assume that our method requires high accuracy in ratios that are close to the cutoff ratio but can afford bigger errors in the extreme cases of low and high concentration ratios since big errors in these values will not result in false predictions.
The fluorescence properties of Cy7 and Cy7.5 probes are not identical to one specific probe developed for AD (presented in
Section 1). Cy7 has absorption/emission peaks at 750/773 nm, an extinction coefficient of 199,000 [M
−1cm
−1] and quantum yield of 0.3. Cy7.5 has absorption/emission peaks at 788/808 nm and an extinction coefficient of 223,000 [M
−1cm
−1]. When comparing the fluorescent properties of the AD probes we see some differences in the absorption/emission peaks but similar orders of magnitudes of the extinction coefficient and quantum yields. For example, AOI987, which was used for imaging Aβ, has an absorption/emission peaks at 650/670 nm, an extinction coefficient of 64,570 [M
−1cm
−1], and a quantum yield of 0.4. THK-265 showed similar properties—absorption/emission peak at 630/650 nm, extinction coefficient of 96,198 [M
−1cm
−1], and quantum yield of 0.38. CRANAD-58 has a similar absorption peak in 630 nm but an emission peak in 750 nm in the presence of Aβ. For tau imaging, CyDPA2 was presented with an absorption/emission peaks at 826/833 nm, extinction coefficient of 113,553 [M
−1cm
−1] and quantum yield of 0.049. The differences in the absorption/emission spectra between the fluorescent probes used in this study and the AD probes may affect the accuracy of the concentration ratio estimation. If the changes between the absorption spectra of the Ab and tau probes are big, the assumption that the optical properties are similar is less accurate. On the other hand, if the two probes have completely separate spectra, the possibility of unwanted excitation of the tau probe when one wants to excite only the Ab probe will be significantly reduced. This phenomenon is one of the problems we had to deal with during our experiments. The absorption spectra of Cy7 and Cy7.5 partly overlapped, causing excitation of both probes together when we needed to measure the fluorescence of each one of them separately. Despite the use of filters for fluorescence emission collection, the combined excitation increased the intensity of the measured fluorescence and possibly contributed to some of the errors.
One of the main advantages of the proposed method, compared to other methods, which measure concentrations in vivo, is that it does not require a priori knowledge regarding the tissue anatomical and optical properties. It is true that measuring the concentrations of amyloid beta and α- tau directly from a collected CSF sample will probably result in a better accuracy. However, this will require performing a lumbar puncture procedure. In our method, as opposed to the lumbar puncture, there is no need to penetrate the dura and collect CSF samples, and the risks and side effects are significantly reduced.
These risks may be further reduced by adding a feedback system to our method, which will provide real-time information regarding the location of the needle and its distance from the dura matter and the CSF. This feedback system, as we have shown, is based on the time-resolved intensity curves, by extracting the values of tmax and the slope, thus enabling accurate estimation of the absolute value of the needle distance from the CSF. The accuracy of the estimation may be increased by taking multiple time-resolved intensity measurements during the insertion of the needle into the lumbar section. The needle distance may then be estimated without a priori knowledge of the tissue’s optical properties.
In addition, once a fluorescence signal is detected, with a sufficient intensity that ensures a good signal to noise ratio, further insertion of the needle may be stopped. The system will evaluate the concentration ratio and the needle distance from the CSF and may indicate to the physician how to continue. If the distance is big enough and the signal to noise ratio is still poor, the system will indicate to the user to continue to push in the needle. In case that the estimated distance between the needle and the CSF is too small the system will indicate the physician to stop additional insertion in order to reduce the risk of dura penetration. We demonstrated the ability to accurately estimate the concentration ration of two fluorescent probes underlying a tissue with a thickness of up to 5 mm. Therefore, we assume that the system may alert the user of being close to the dura in an estimated distance of 3 mm, thus avoiding penetration of the dura even with distance estimation errors of several hundreds of percent but with estimating the concertation ratio with a rather high accuracy.


