Compressive Behaviors of Prisms Made of Demolished Concrete Lumps and Fresh Concrete

1
State Key Laboratory of Subtropical Building Science, South China University of Technology, Guangzhou 510640, China
2
College of Civil Engineering and Architecture, Guangxi University, Nanning 530004, China
*
Author to whom correspondence should be addressed.
Appl. Sci. 2018, 8(5), 743; https://doi.org/10.3390/app8050743
Submission received: 20 March 2018
/
Revised: 30 April 2018
/
Accepted: 3 May 2018
/
Published: 8 May 2018
(This article belongs to the Special Issue Emerging Construction Materials and Sustainable Infrastructure)
Abstract
:Directly adopting coarsely crushed demolished concrete lumps (DCLs) with pouring concrete (referred to as fresh concrete, FC) in new structural members has been demonstrated to be more efficient and environmental than the traditional approach of recycling waste concrete as coarse aggregate particles. In this study, 45 prisms made of FC and DCLs were tested under axial compressive loading up to failure. The varied parameters included the dimensions of the prisms, the replacement ratio of DCLs, and the characteristic size of the lumps. The compressive performance of 36 cubes and cylinders was also experimentally examined for comparison. A formula was developed to predict the strength of compound concrete prisms filled with DCLs. Empirical formulas were also established relating a prism’s strength with its elastic modulus and peak strain. It was found that: (a) when the replacement ratio is between 20% and 40%, the strength of a prism is about 1.13 that of a cylinder, due to the casting direction of the prism being different from that of the cylinder; (b) as the size of filler lumps increases relative to the size of the specimen, the strength of prisms decreases faster than that of cylinders, which weaken faster than cubes; and (c) due to the coupling effect of the aggregate size of FC and the specimen size, the compressive strength of prisms first increases with their size and then declines gradually.
1. Introduction
The construction industry has developed strongly all over the world in recent decades, especially in the developing countries like China and India. More and more raw materials and energy have been consumed in this economic activity. In turn, wastes produced by the industry account for a majority of the overall amount of waste generated [1,2,3,4]. It is estimated that the annual production of waste concrete in China has reached 239 million tons and that it accounts for about one-third of the total construction and demolition waste [5]. As conflicts between the desire to realize sustainable economic development and a shortage of natural resources get more serious, it is of great importance to reutilize waste concrete wherever possible. This can both reduce landfill utilization and provide inexpensive construction materials [6].
Recycled aggregate is widely regarded as a promising solution to the problem of waste concrete. Research on this subject started with basic observations of the effects of using recycled aggregate fill on the compressive strength of concrete, as well as its economic feasibility [7,8]. Since then, research on recycled aggregate concrete (RAC) has become progressively more systematic. Mechanical properties, durability, and micro-characteristics of RAC have been experimentally investigated by many scholars [6,9,10,11,12,13,14,15,16,17,18]. New technologies have also been proposed to improve the quality of concrete filled with recycled aggregates in recent years [19,20,21]. Positive results from such research support and encourage the application of RAC in buildings and structures [22]. However, even though the use of recycled aggregates in place of natural aggregates has now received considerable attention as a sustainable method, it should be noted that RAC has not yet been widely adopted in practice. One reason is that technologies such as smart dismantling, demolition, crushing, and autogenous milling are needed to manufacture high-quality aggregate suitable for recycling [21,23]. These processes obviously consume a lot of energy.
In order to lessen that difficulty, a group led by Wu has explored a more efficient approach to recycling waste concrete [24]. The innovation of their technique is to directly reuse large pieces of coarsely broken concrete from demolition (referred to as demolished concrete lumps, DCLs) with fresh concrete (FC) in new structural members. This recycling process is obviously superior to the traditional method of recycling concrete as aggregates in at least the following aspects [25]: (1) producing DCLs is much simpler than crushing concrete to small pieces and sieving; (2) an increased recycling ratio can be realized, because both the stones and the mortar of waste concrete are reused simultaneously in the new structural members; and (3) less hydration heat is generated in compound concrete consisting of DCLs and FC, due to the reduced amount of fresh cement employed.
A series of experimental studies on structural members (beams, columns, slabs, and walls) containing DCLs have now been carried out to examine the feasibility of such recycling [26,27,28,29,30,31,32]. Test results show that the mechanical properties and seismic performance of structural members containing DCLs are similar to or only slightly lower than those of such members containing FC alone. In the past several years, structural members containing DCLs have been successfully employed in some real constructions, as depicted in Figure 1.
It should be mentioned that before this recycling technique can be widely used, more research is still needed to comprehensively understand the behavior of compound concrete made with DCLs and FC. For instance, in order to reasonably design structural components containing DCLs, the compressive behavior of the compound concrete should be investigated carefully. In the past several years, uniaxial compressive properties of such compound concrete have been investigated. The combined compressive strength of 300 mm cubes made of DCLs and FC was first examined by Zhang [27], who found that the strength can be estimated using a linear formula based on the compressive strengths of the demolished concrete and the fresh concrete weighed by their mass fractions. Wu’s group has investigated the effects of the specimen size and characteristic size of the lumps on the compressive behavior of cubes and cylinders [27,29]. Their test results show that the larger the lumps, the lower the combined compressive strength of the compound concrete, but the range of the effect is generally within about 10%. Meanwhile, the combined elastic modulus and combined peak strain of the compound concrete are not affected by the size of the lumps in most cases. The same group has conducted experimental research on cubes and cylinders made with normal-strength demolished concrete and high-strength fresh concrete [30], which revealed that the combined compressive strength of the cubes and cylinders is more influenced by the demolished concrete. They demonstrated a nonlinear relationship between the combined compressive strength of the compound concrete, the strength of the demolished concrete, and the strength of the fresh concrete.
So the compressive performance of cubic and cylindrical specimens made of DCLs and FC has been studied to some extent, but no information has yet been published on prisms made of DCLs and FC. The mechanical properties of concrete are influenced by the shape of the sample [33,34], and prismatic samples are specified in Chinese design codes for determining compressive strength, elastic modulus, and peak strain. So this study was designed to experimentally investigate the compressive performance of prisms made of normal-strength DCLs and FC. The results were compared with the performance of cubes and cylinders of the same material. The influence of the prism’s dimensions and the size of the lumps was also examined.
2. Materials and Methods
2.1. Specimen Design
Demolished concrete used in this study was obtained from waste support beams from a deep foundation pit. Eighteen cylindrical cores (Φ100 × 100 mm) were drilled from these support beams, and their compressive strength was measured. The average compressive strength of all the cores was 40.8 MPa. According to European standard BS EN 13791 [35] and research conducted by Mansur and Islam [36], the compressive strength of a concrete cylinder with a diameter of 100 mm and a height of 100 mm is almost the same as that of a concrete cube with an edge-length of 150 mm. On that assumption, the cubic compressive strength of the demolished concrete adopted in this study was taken to be 40.8 MPa.
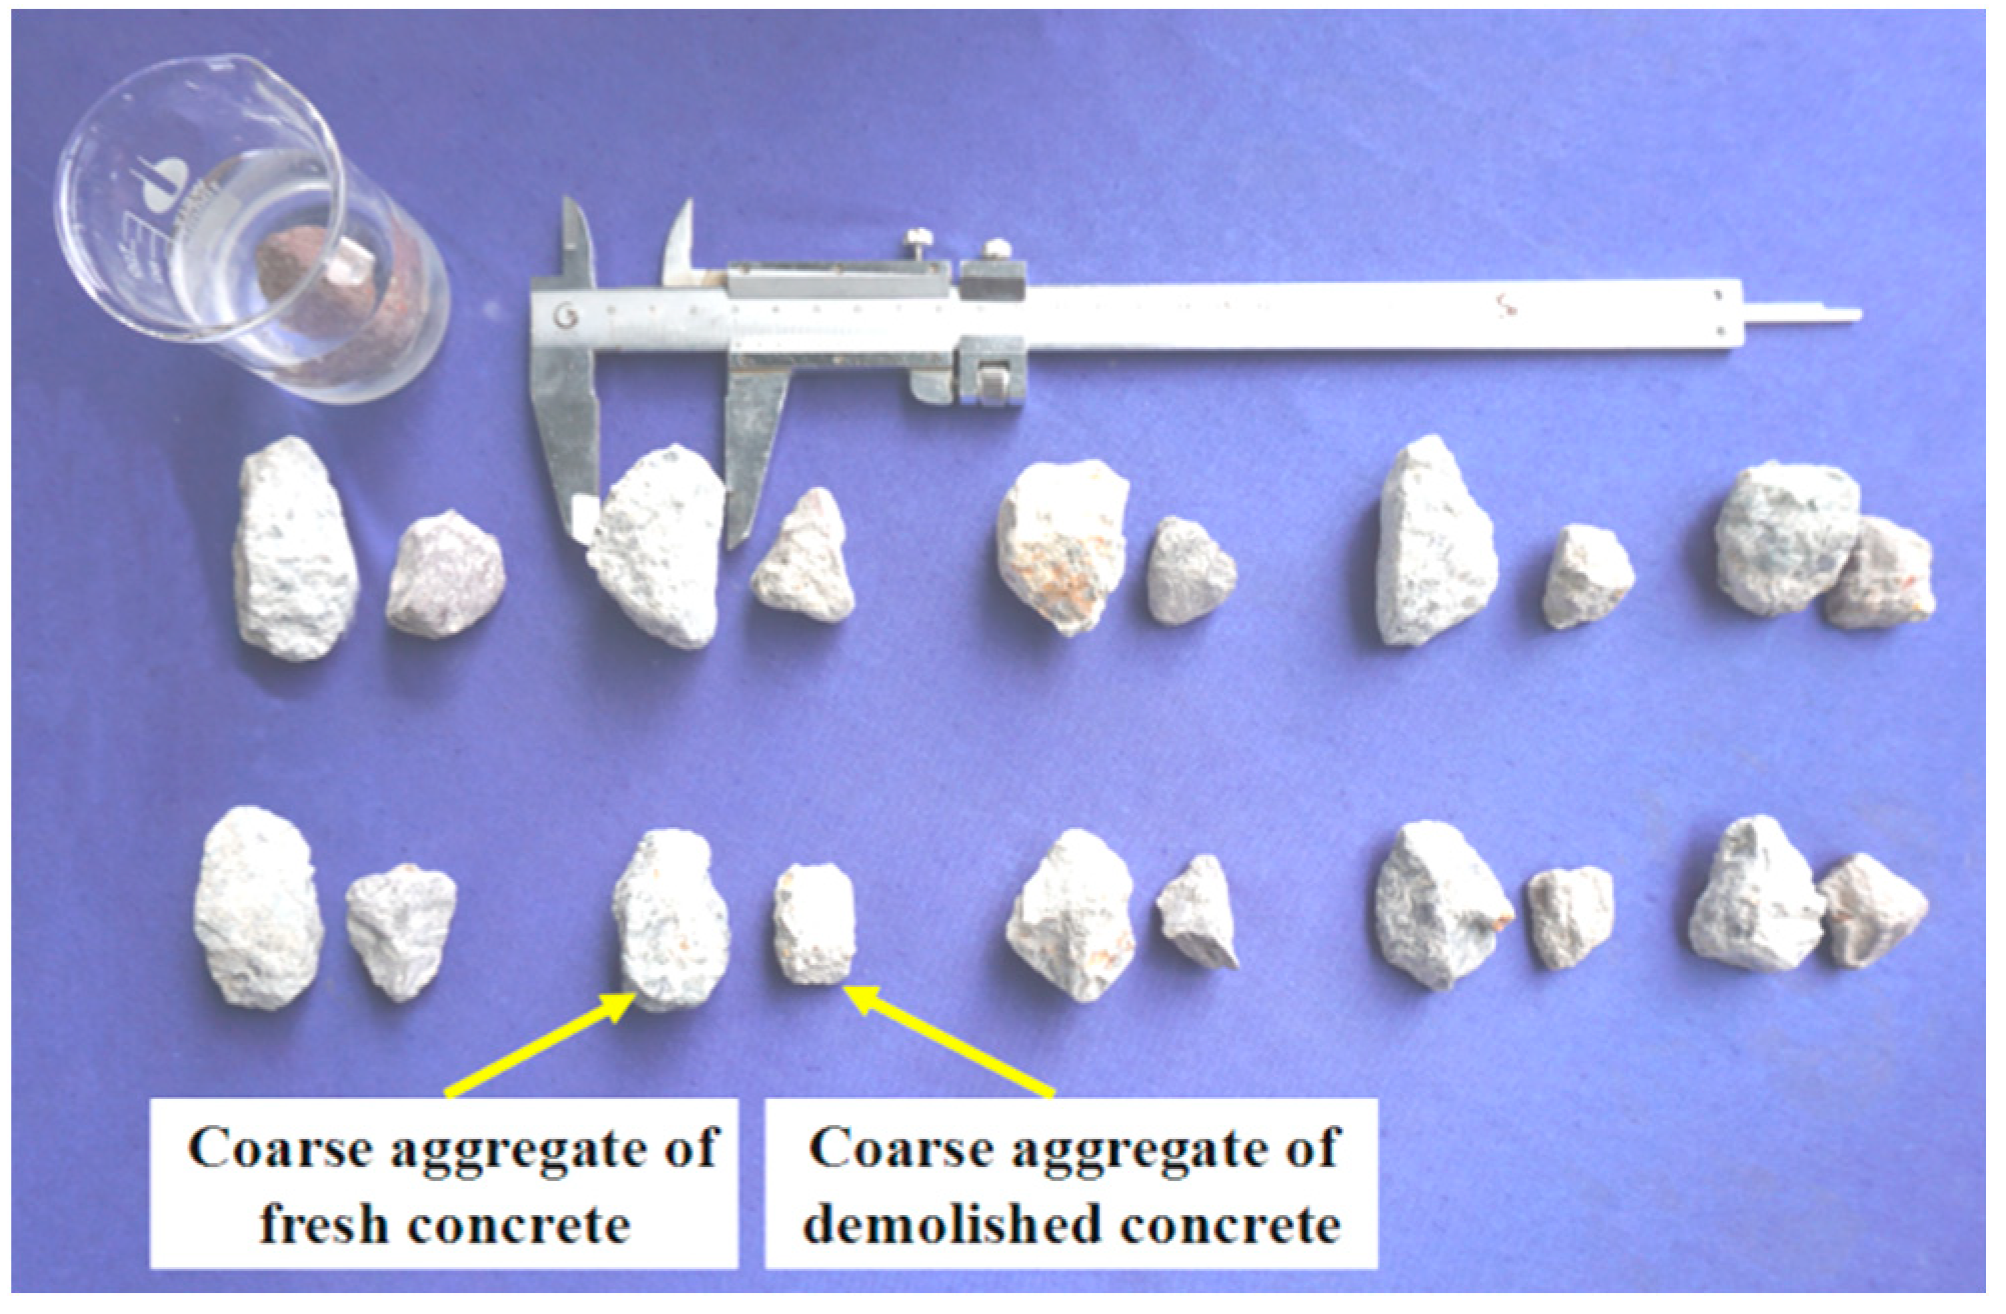
The fresh concrete used for all the specimens came from the same batch of ready-mix concrete. The mix proportions of the fresh concrete are listed in Table 1. Both the fresh concrete and the demolished concrete were made from ordinary Portland cement, water, river sand (fine aggregate), natural crushed basalt (coarse aggregate), and fly ash. As shown in Figure 2, the maximum aggregate size for the demolished concrete was about 25 mm, and for the fresh concrete was about 35 mm. The measured test-day cubic compressive strength and density of the fresh concrete were 53.0 MPa and 2314 kg/m3, respectively.
The waste support beams’ concrete sheathing and steel reinforcements were removed using a high-frequency impact breaker. The waste beams were then broken into lumps using both the impact breaker and simple pneumatic picks and hammers. The demolished concrete lumps thus prepared were divided into five piles according their characteristic sizes (about 50 mm, 67 mm, 100 mm, 133 mm, and 167 mm), as shown in Figure 3.
All of the specimens tested in this study were fabricated at the same time in the laboratory of the South China University of Technology, and were classified into six groups, labelled Group 1 to Group 6. Table 2 summarizes the specimens’ details. In the table, each specimen is identified using the notation SHD-d-η, where SH denotes the shape of the specimen (SH = CU for a cube, SH = CY for a cylinder, and SH = PR for a prism), D means the lateral dimension of the specimen (i.e., the edge-length of a cube, the diameter of a cylinder, or the length of a prism’s shortest edge), d indicates the characteristic size of the DCLs, and η gives the replacement ratio of DCLs (i.e., the ratio of the weight of DCLs in the specimen to its total weight). For both the cylindrical and prismatic specimens tested, the ratio of the specimen’s height to D was 2.0. For instance, “PR400-133-0.3” means that the specimen was a 400 × 400 × 800 mm prism with a characteristic DCL size of 133 mm and a replacement ratio of 30%.
In Group 1, the specimens with different shapes and sizes were made of FC alone, and these acted as control specimens. The specimens in Groups 2, 3, and 4 had the same lateral dimensions and lump size, but the replacement ratio varied. We tested the effect of the replacement ratio on the specimens’ compressive strength, strain at peak stress, and modulus of elasticity. Comparing the test results of the specimens in Group 2 with those of the specimens in Groups 3 and 4, the shape effect on the specimens’ mechanical behavior was highlighted. The lateral dimensions of the prisms in Group 5 were the same, but the characteristic size of the DCLs varied, highlighting any effect of the characteristic ratio (i.e., the ratio of the characteristic size of the DCLs to the specimen’s lateral dimension). Although the lateral dimensions of the prisms in Group 6 varied from 150 mm to 500 mm, the characteristic ratio was almost unchanged at about 1:3. This highlighted the effect of size on the prisms’ mechanical properties.
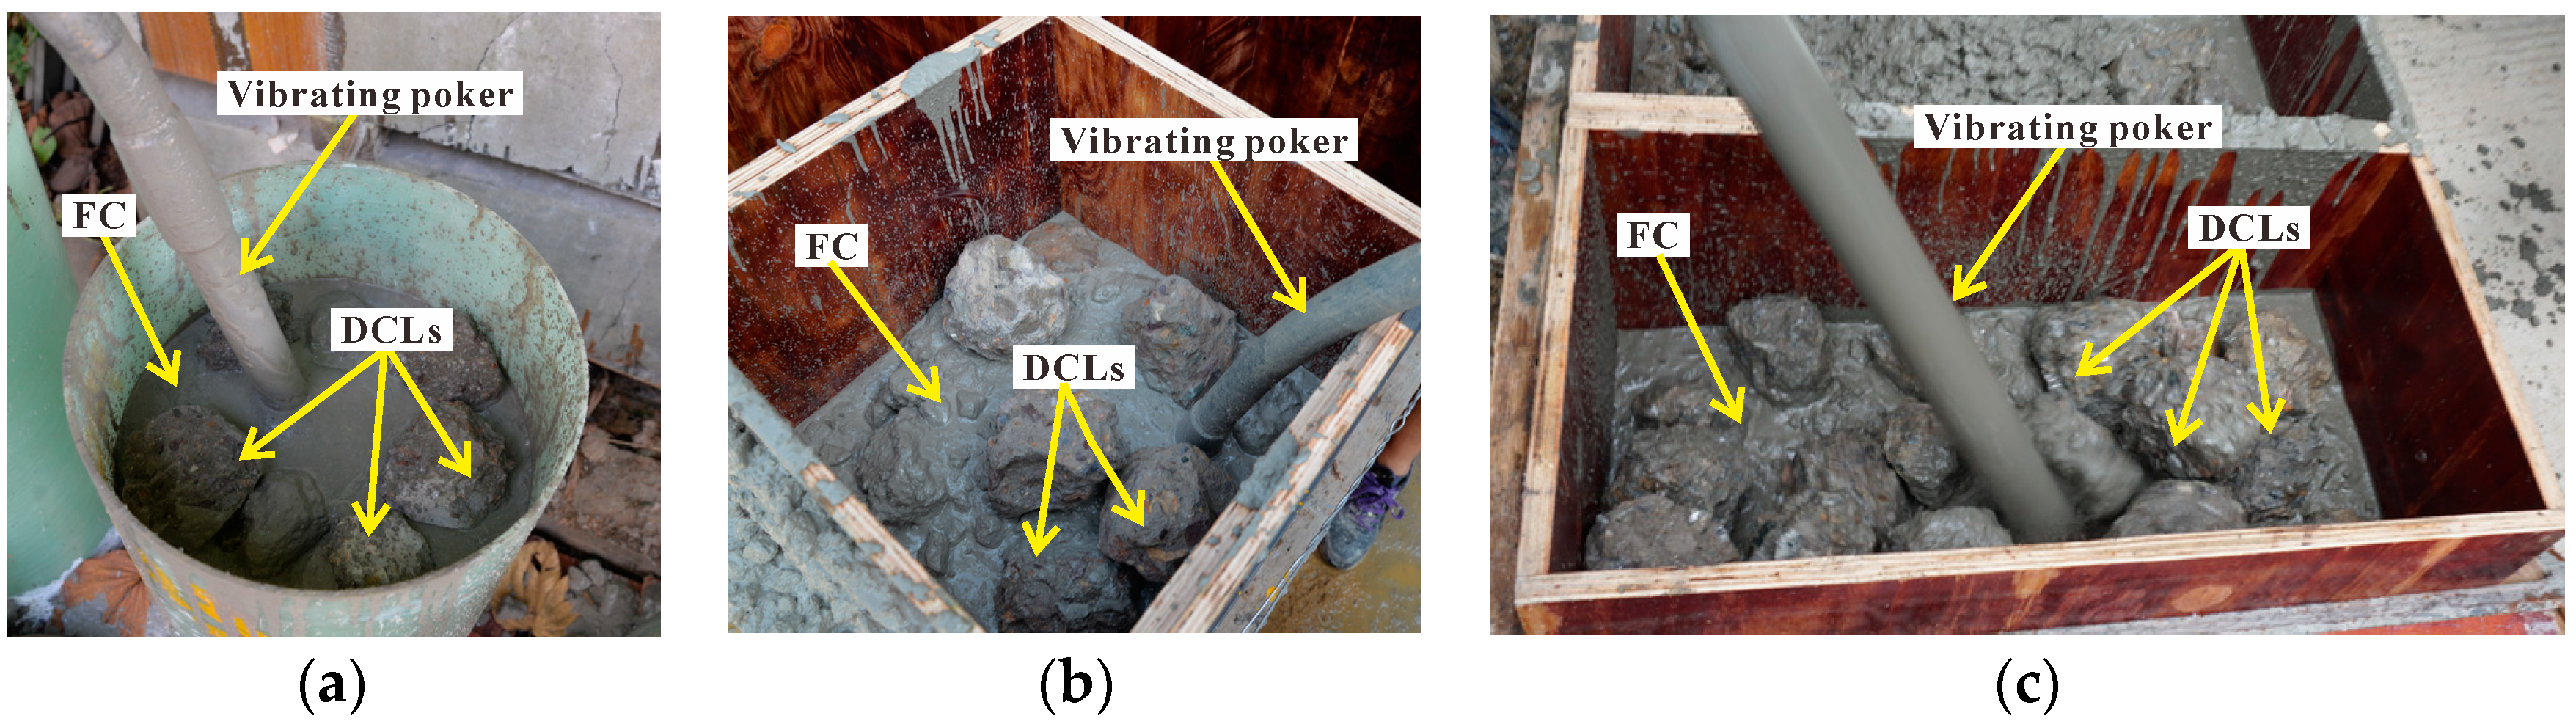
Due to the slightly higher water absorption of DCLs (nearly 3.67% in this study), the prepared DCLs were wetted by sprinkling tap water intermittently on the surface of the lumps just before casting the test specimens. During the casting of the specimens made of DCLs and FC, a layer of fresh concrete about 20 mm thick was poured into the mold first, then the DCLs and FC were alternately added while vibrating the concrete mix continuously to ensure proper filling and compactness (see Figure 4). All of the specimens were cured in air until testing. Figure 4a,c show that the cylinders and prisms were, respectively, vertically and horizontally cast.
2.2. Testing Procedure
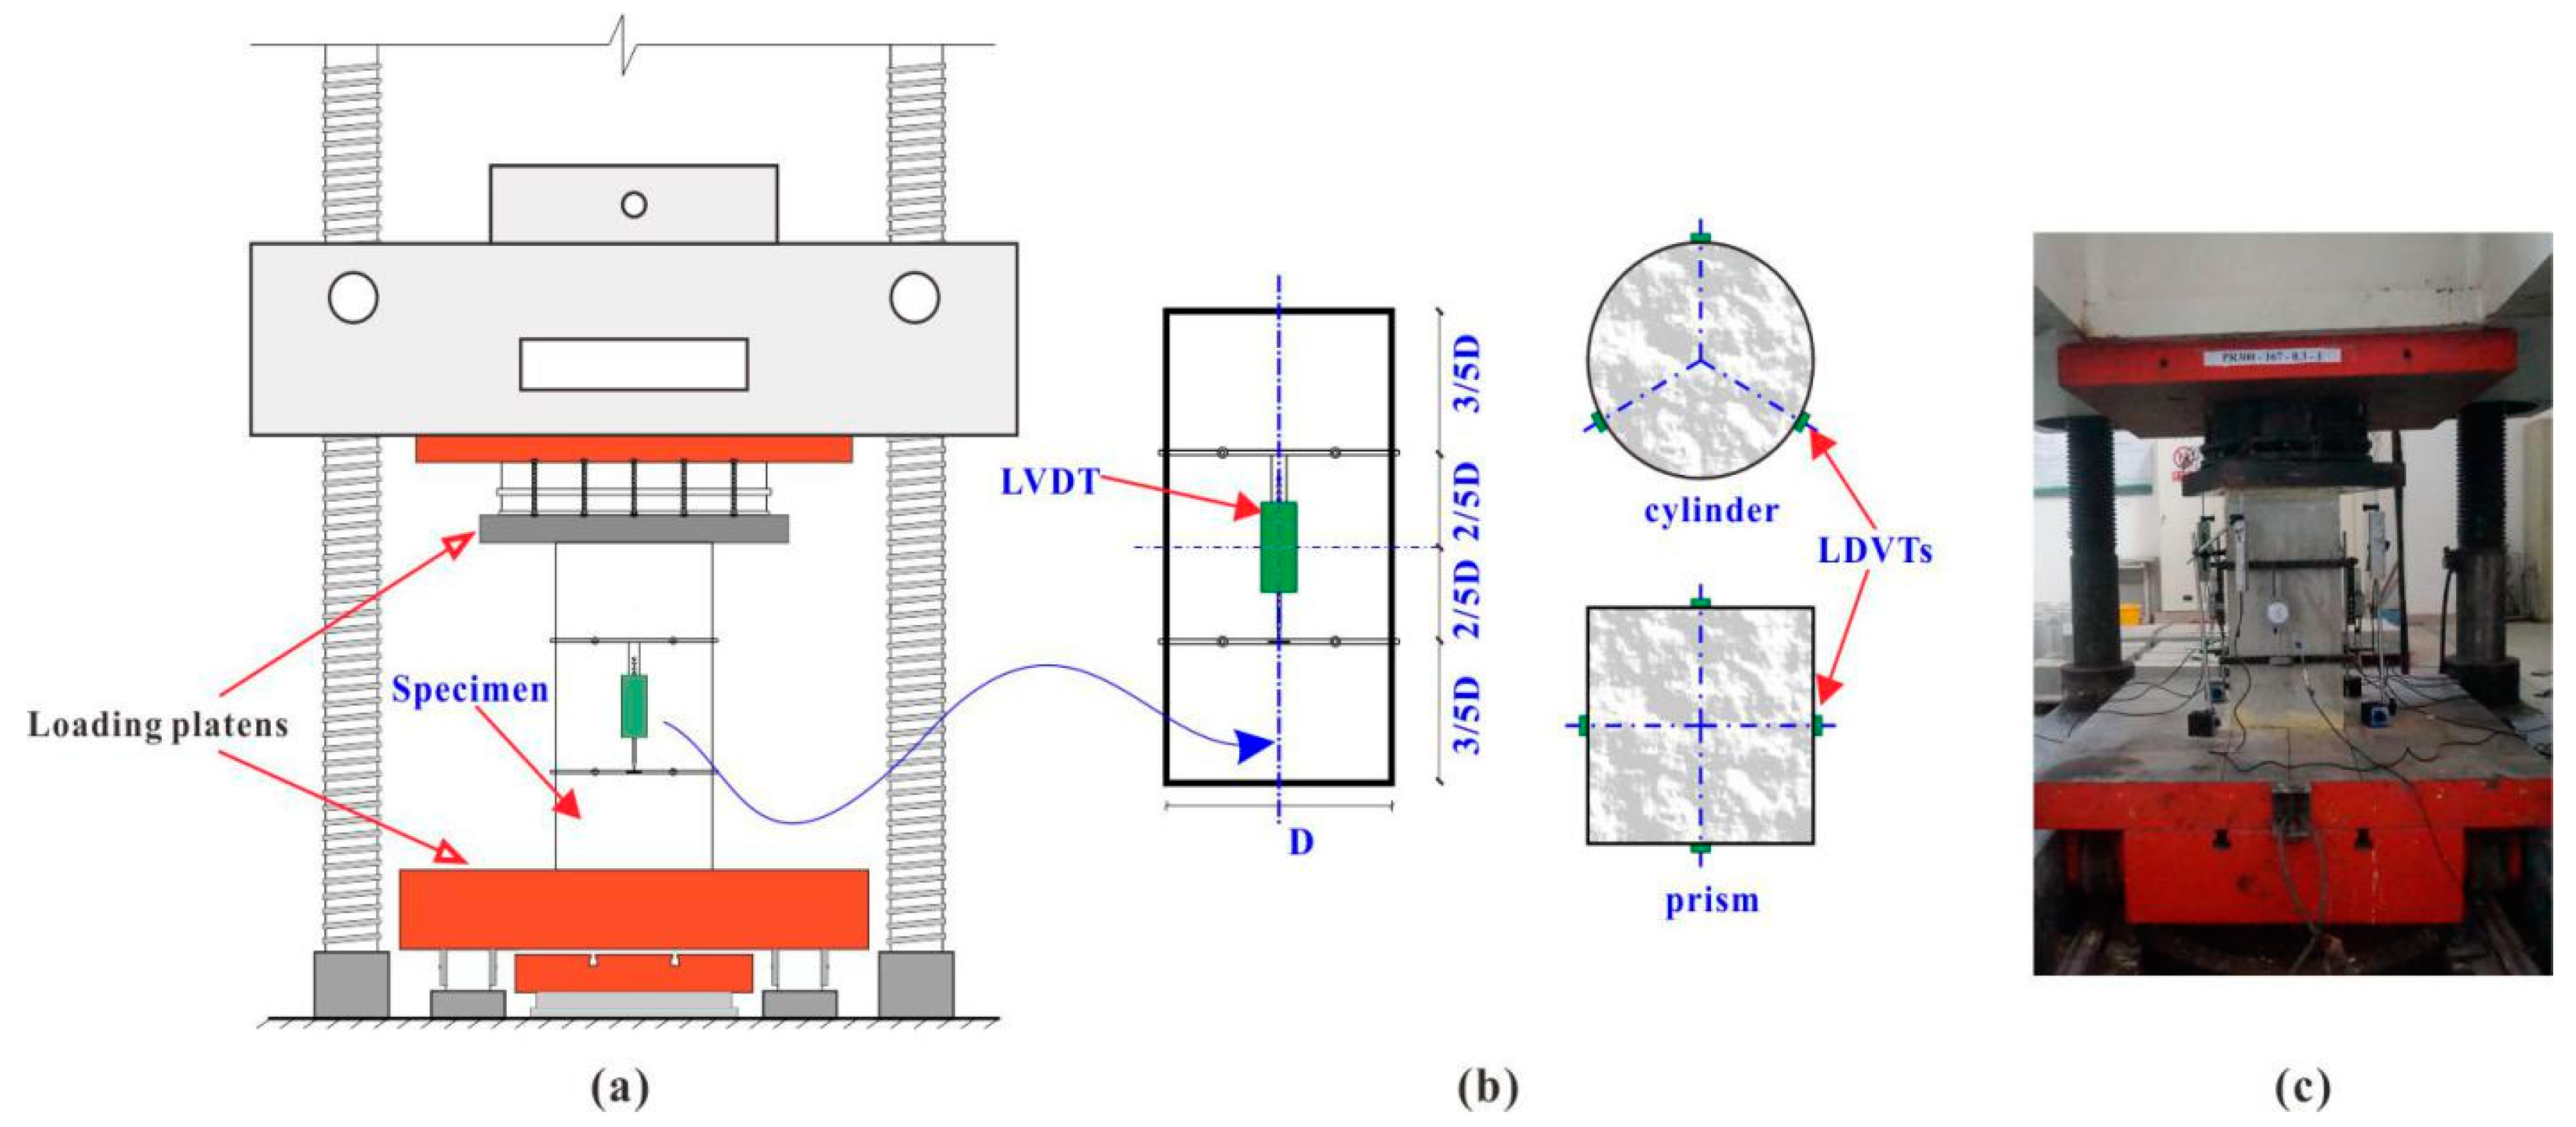
To ensure that the top and bottom loading surfaces of the concrete specimen are parallel, the two surfaces should be smoothed with high-strength gypsum, cement, or sulphur [37]. In this study, all of the specimens were end-capped with high-strength gypsum, due to its properties of high strength and rapid hardening, and tested under axial compressive loading. In accordance with the standard test procedure specified in the ASTM C39 standard [38], the axial load was applied with a strain rate of 10 × 10−6/s. An electro-hydraulic loading machine with a capacity of 10,000 kN (see Figure 5) was used in the compressive tests of the specimens with lateral dimensions of 200–500 mm. Another electro-hydraulic loading machine with a capacity of 5000 kN was used for the other specimens.
Each cube was axially loaded to gain its compressive strength, and each cylinder or prism was axially loaded to obtain its compressive strength, elastic modulus, and strain at peak stress.
To measure the axial deformations at two-fifths of the height of the cylinders and prisms, three (or four) linear variable differential transducers (LVDTs) with a calibrated range of ±50 mm were installed on the side faces of the cylinders and prisms with lateral dimensions of 300–500 mm (see Figure 5b). Two LVDTs with a calibrated range of ±5 mm were mounted on the other cylinders and prisms.
To determine the specimens’ elastic moduli, each specimen was first loaded three times to 40% of its estimated load-carrying capacity, and the average of the elastic moduli measured on the second and third loading cycles was taken as the specimen’s elastic modulus. The elastic modulus related to the ith (i = 2, 3) loading cycle was determined as (σ2 − σ1)/(ε2 − 0.00005), where σ2 is the stress corresponding to 40% of the estimated compressive strength, σ1 is the stress corresponding to a strain of 0.005%, and ε2 is the compressive strain at the stress level σ2 [39,40] After that, the specimen was loaded to failure to ascertain its compressive strength and peak strain.
The measured axial loads and deformations were recorded simultaneously by a data logger. Before the actual loading, each specimen was preloaded in order to lessen the impact on the test results of any looseness at the specimen’s ends.
3. Results and Discussion
3.1. Failure Patterns
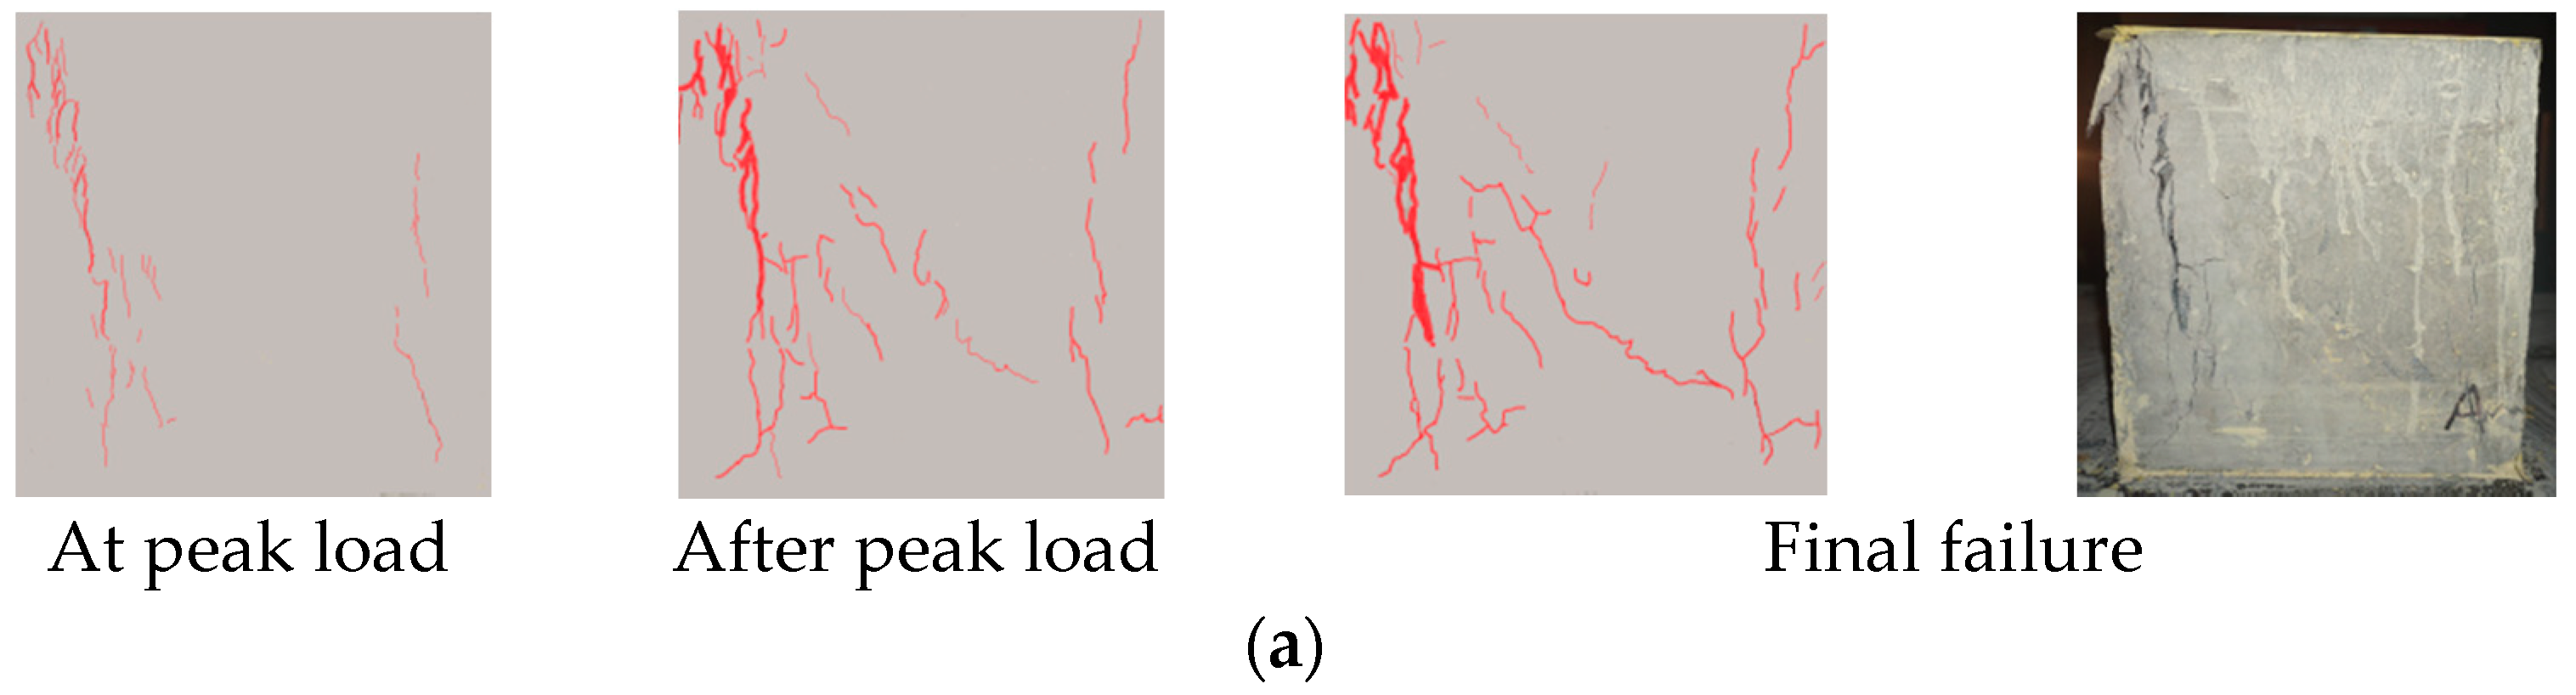
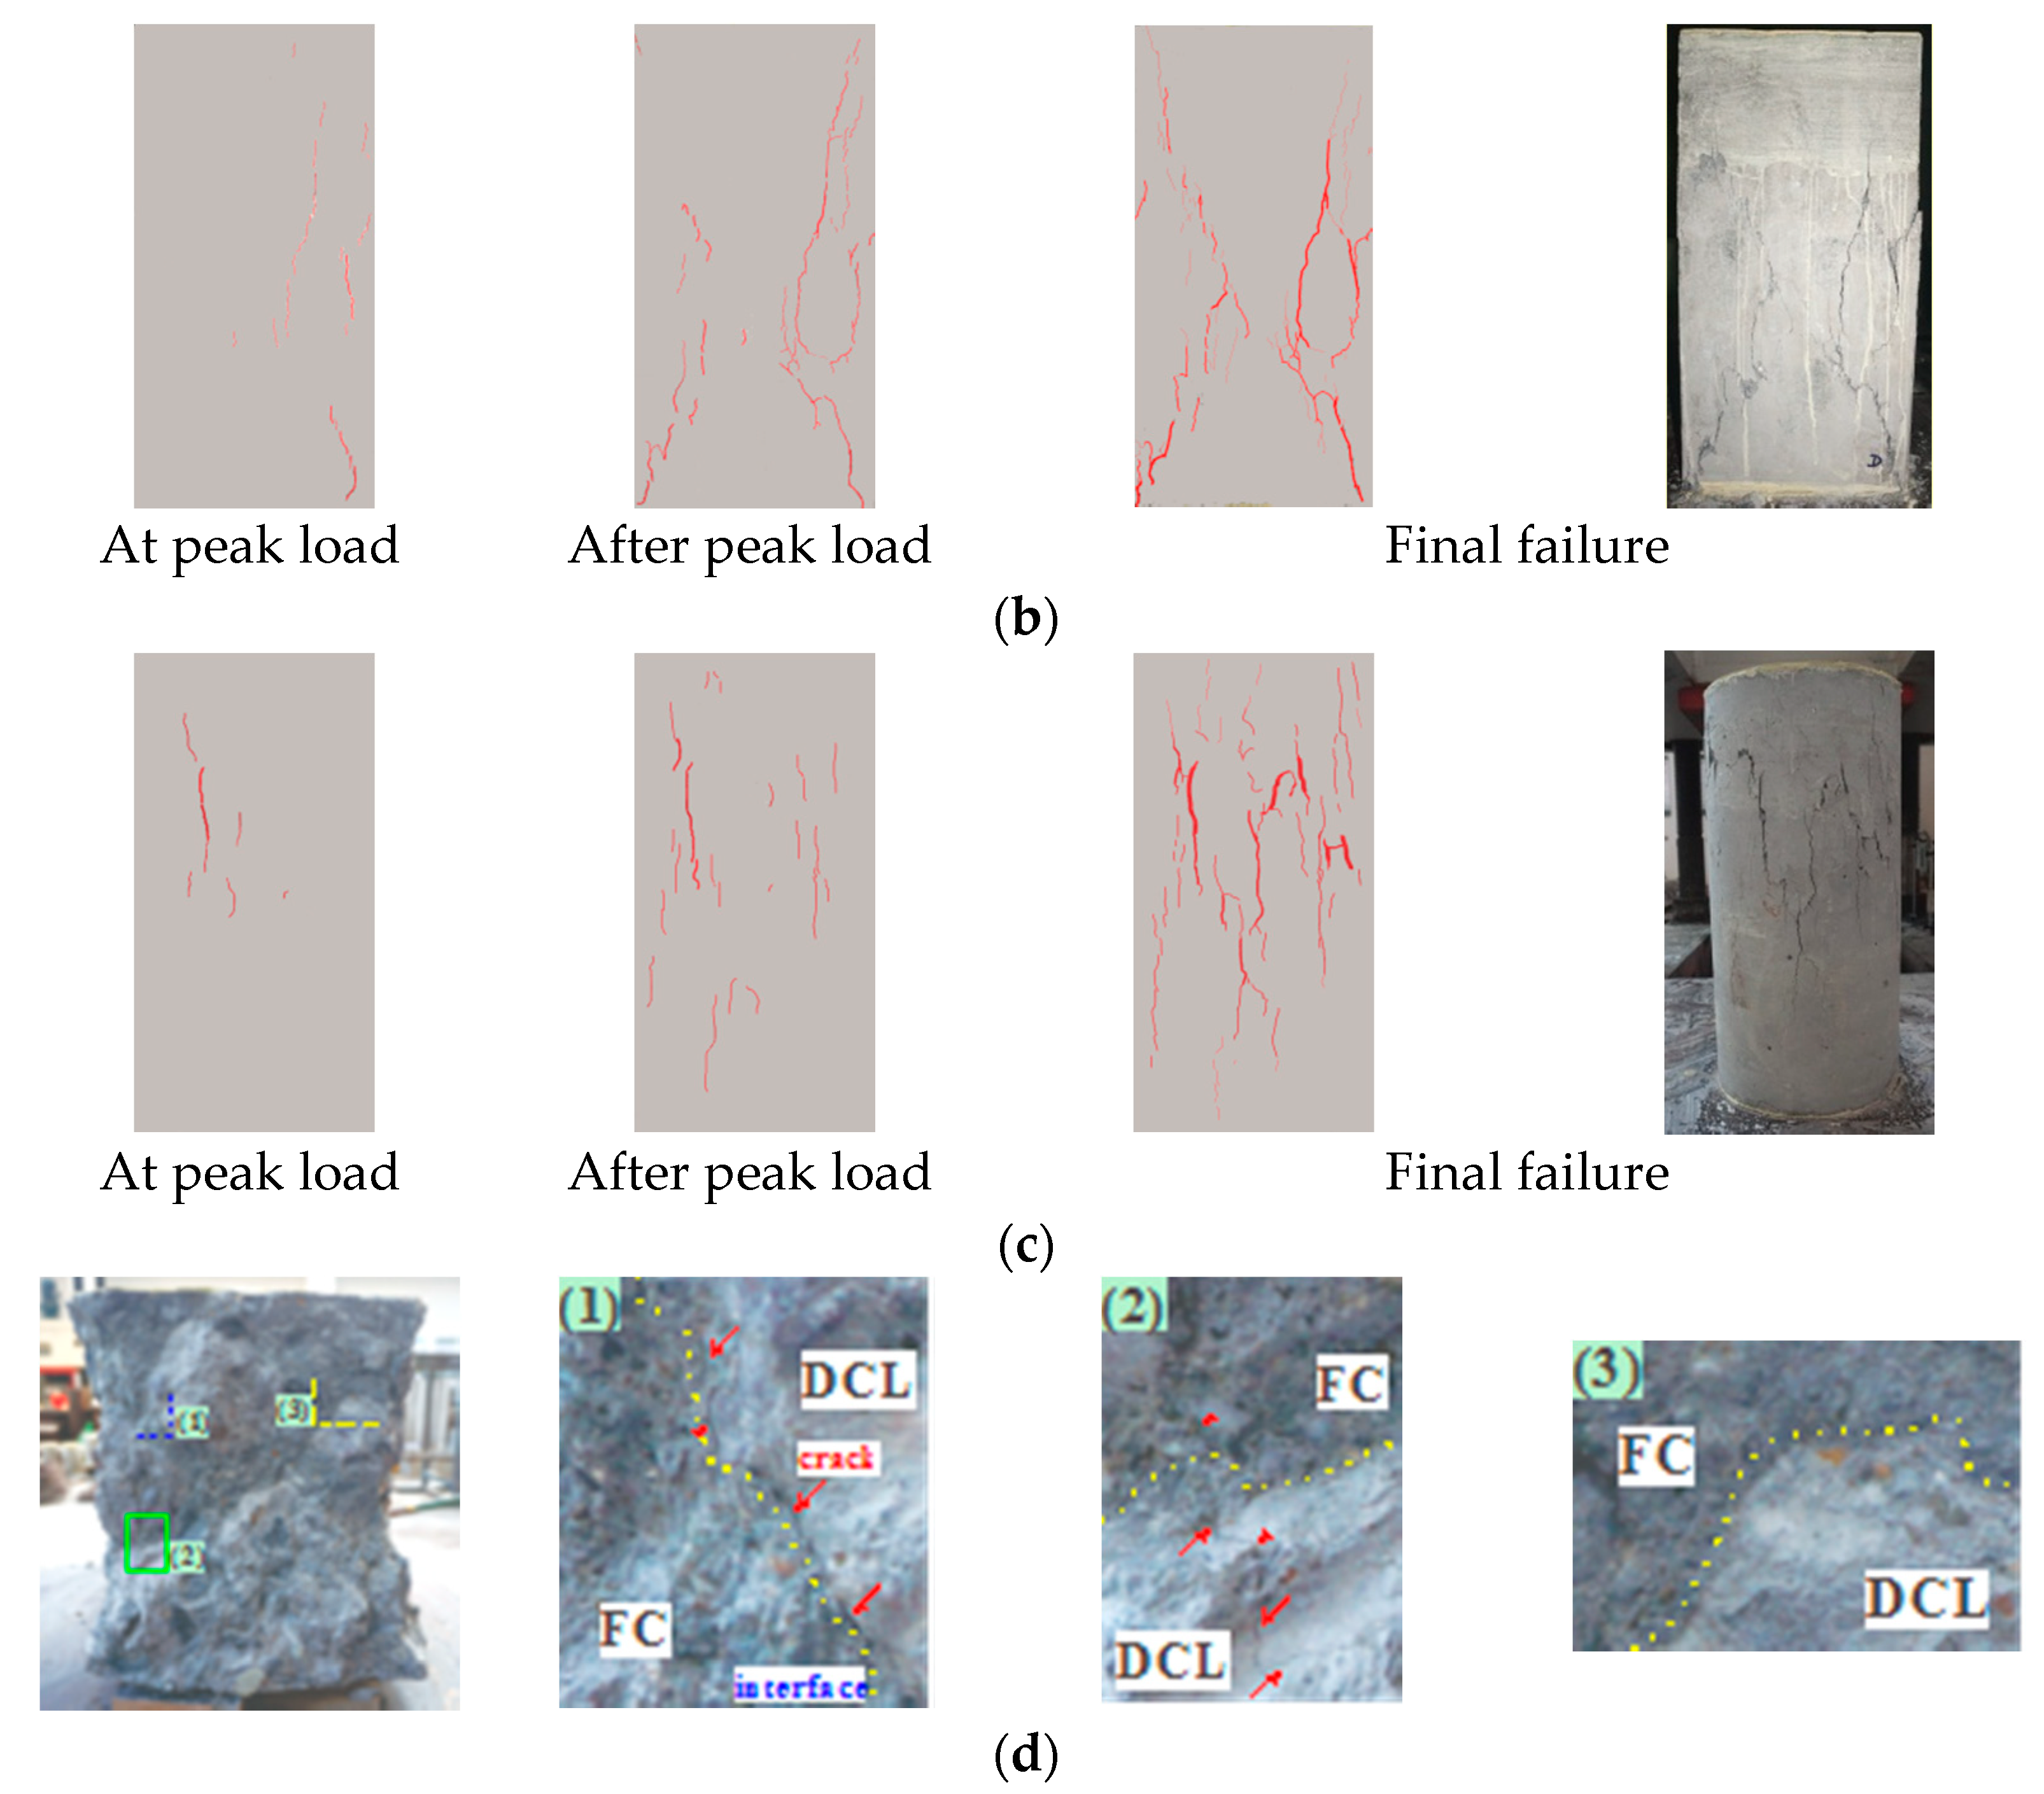
Figure 6 shows cracks at different loading stages and the final failure patterns for specimens CU300-100-0.3, PR300-100-0.3, and CY300-100-0.3. Throughout the testing, the crack development and failure patterns for specimens made of DCLs and FC were observed to be very similar to those for specimens made of FC alone.
In the early stage of loading, no visible cracks were observed on the side surfaces of the cubic, cylindrical, or prismatic specimens. For the cubes and prisms, when the applied load reached 70% to 80% of the peak load, cracks appeared on the specimens’ side surfaces. As the applied load increased further, the initial cracks propagated and some new cracks developed. After the peak load, the cracks of the cubes and prisms generally formed an hourglass shape and a cone shape, respectively, as shown in Figure 6a,b. Such failure patterns have also been reported in the literature [41]. For the cylinders, when the applied load reached 70% to 90% of the peak load, cracks appeared at about the mid-height of the specimens’ side surfaces. With further loading, the initial cracks propagated upwards or/and downwards, and some new cracks developed. After the peak load, the distribution of cracks on the specimens’ side surfaces was relatively uniform, and a columnar type of failure was commonly observed, as shown in Figure 6c.
Figure 6d shows that the compactness of the compound concrete was good. There were no obvious voids, holes, or pores at the interface between the DCLs and FC, implying that the DCLs and FC bonded well before testing. Of course, under axial load, cracks might develop and grow at the interface, but at the same time, the cracks were also observed to form and propagate within the DCLs and the FC. The interfaces were not obvious weak points in the compound concrete.
3.2. Mechanical Properties of the Specimens Made of Fresh Concrete Alone
The measured compressive strength (f*,D,FC), peak strain (*,D,FC), and elastic modulus (E*,D,FC) of the specimens in Group 1 are listed in Table 3. Here the asterisk (*) refers to the shape (* = cu for a cube, cy for a cylinder, and pr for a prism), D denotes the specimen’s lateral dimension, and FC represents the fresh concrete type (the subscript FC was omitted in the following discussion, since all specimens in Group 1 were made of fresh alone). It is clear from Table 3 that:
- (a)
- (b)
- (For the specimens made of FC alone, the strength ratios of fcu,150/fcu,300, fpr,150/fpr,300, and fcy,150/fcy,300 were 1.22, 1.12, and 1.13, respectively. Based on the experimental results reported for normal-strength concrete [44,45,46,47,48,49], the variation of these ratios with the maximum aggregate size is shown in Figure 7. For comparison, the strength ratios for the cubic, prismatic, and cylindrical specimens with a maximum aggregate size of 35 mm are also presented in the figure. It shows that as the maximum aggregate size increased from 20 mm to 35 mm, the changes in fcu,150/fcu,300, fpr,150/fpr,300, and fcy,150/fcy,300 were limited on the whole. This confirms that the strength ratios can be approximately applied to the demolished concrete with a maximum aggregate size of 25 mm used in this study.
- (c)
- For the specimens made of FC alone with a lateral dimension of 150 mm, the shape conversion factors (i.e., the ratio of fcu,150 to fcy,150 and the ratio of fpr,150 to fcy,150) were 1.25 and 0.99, respectively. Similar values of 1.13 and 0.97 were recommended by Yi and colleagues [50], implying that the compressive strength of prisms and cylinders is almost the same. And for the FC specimens with a lateral dimension of 300 mm, the ratios of fcu,300 to fcy,300 and fpr,300 to fcy,300 were, respectively, 1.16 and 1.00. This indicates that the range of 150 to 300 mm of lateral dimension has only a limited effect on the shape conversion factor.
- (d)
Based on extensive test data, Noguchi et al. [52] developed a quantitative relationship between cylindrical compressive strength (fcy,150, in MPa) and elastic modulus (Ecy,150, in MPa) for conventional concrete as:
where k1 and k2 are, respectively, modification factors related to the type of coarse aggregates and mineral admixtures; α is a constant with a value of 1.486 × 10⁻³; and γ (in kg/m3) denotes the density of concrete. In this study, the measured density of the fresh concrete was 2314 kg/m3, and the values of k1 and k2 recommended by Noguchi were 0.922 and 1.087, respectively. For specimen CY150 listed in Table 3, the elastic modulus predicted using Equation (1) would be 27.8 GPa, which agrees well with the measured result of 26.4 GPa.
Since the influences of a specimen’s size and shape on its elastic modulus are limited, Ecy,150 in Equation (1) may be extended to E*,D; here the subscript D is within the range of 150 to 300 mm, and the subscript * only refers to a prism or a cylinder. On the other hand, the prismatic and cylindrical compressive strengths were almost the same (fcy,150 ≈ fpr,150), so fcy,150 in Equation (1) can be extended to f*,150. In this way, Equation (1) is rewritten as the following:
where the constant 1.04 = (1.13)1/3; here 1.13 is an approximate value of the ratio of fpr,150 to fpr,300 or fcy,150 to fcy,300, as has been discussed.
3.3. Mechanical Properties of Specimens Made of DCLs and FC
3.3.1. Combined Compressive Strength
The measured mechanical properties of the specimens in Groups 2, 3, and 4 are summarized in Table 4. In that table, the subscripts CC and FC identify the specimens made with compound concrete and fresh concrete, respectively. So f*,300,CC, *,300,CC, and E*,300,CC are, respectively, the combined compressive strength, combined peak strain, and combined elastic modulus of the 300 mm compound concrete specimens; and f*,300,FC, *,300,FC, and E*,300,FC are, respectively, the compressive strength, peak strain, and elastic modulus of the 300 mm control fresh concrete specimens. The table shows that the cubic, prismatic, or cylindrical compressive strength of the compound concrete made of DCLs and FC decreased gradually with increased replacement ratio. This is presumably due to the 150 mm cubic compressive strength of the demolished concrete (40.8 MPa) being lower than that of the fresh concrete (53.0 MPa on the test day).
The strength ratios of fcu,300,CC/fcy,300,CC and fpr,300,CC/fcy,300,CC listed in Table 4 are also presented in Figure 8. It is evident from this figure that:
- (a)
- With increased replacement ratio of DCLs, the fcu,300,CC/fcy,300,CC strength ratio generally increased. The strength ratio for the specimens with a replacement ratio of 20% was almost the same as that for the specimens with a ratio of 30%, and about 4.7% higher than that for the control specimens made of FC alone. But when the replacement ratio was 40%, the strength ratio was 14.7% higher than that for the control specimens. This implies that although both the cubic and cylindrical compressive strengths of the compound concrete decreased with increasing replacement ratio, the cubic strength declined more slowly than the cylindrical strength, probably due to the end restraint of the machine’s platens on the lateral expansion of the cubic specimens being much more significant than for the cylindrical specimens. The negative effect of the DCLs is thus more prominent with cylinders.
- (b)
- The fpr,300,CC/fcy,300,CC strength ratio did not change very much with increasing replacement ratio. This is because for cylinders and prisms with the same height, the same lateral dimension, and the constraint caused by the loading platens, the rate of decrease in fpr,300,CC with increasing replacement ratio should be similar to that of fcy,300,CC. For the prismatic and cylindrical specimens with replacement ratios of 20%, 30%, and 40%, the average value of that strength ratio was about 1.13, which is 13% higher than the fpr,300,FC/fcy,300,FC strength ratio of the control specimens made of fresh concrete alone. The prisms’ compressive strength apparently decreased more slowly than that of the cylinders. It should be noted that the cylindrical and prismatic specimens were cast in different placement directions: the cylinders were cast parallel to loading direction, while the prisms were cast perpendicular. Considering that the compressive strength of a vertically cast specimen is normally less than that of a horizontally cast one [50,51], it may be surmised that if prisms and cylinders made of DCLs and FC were cast in the same placement direction, the fpr,300,CC/fcy,300,CC strength ratio should be significantly smaller than the observed 1.13.
Based on the experimental results published in recent years, a linear formula Equation (3) has been suggested for predicting the cubic compressive strength of compound concrete made of normal-strength DCLs and FC [27,30]. Taking the observed shape effect into account, Equation (3) can be extended to Equations (4) and (5), which may approximately predict the combined compressive strength of prisms and cylinders:
Here the subscript asterisk (*) = cu for a cube, cy for a cylinder, and pr for a prism; f*,300,CC is the predicted compressive strength of compound concrete with a lateral dimension of 300 mm; f*,300,DC and f*,300,FC are, respectively, the compressive strength of demolished concrete and fresh concrete with a lateral dimension of 300 mm; η represents the replacement ratio; and a* and b* are coefficients related to the shape effect. The values of acu, acy, and apr can be taken, respectively, as 0, 0.04, and 1.12, and bcu, bcy, and bpr can be taken, respectively, as 0, 0.85, and 2.87, according to the test results listed in Table 4. It should be noted that during the calculation, the subscript asterisk (*) on the left- and right-hand sides of Equations (4) and (5) must be assigned with the same meaning.
The combined compressive strengths of the cubic, prismatic, and cylindrical specimens in Groups 2, 3, and 4 predicted using Equation (4) were compared with the measured results presented in Table 5. During the calculations, in order to determine the value of f*,300,DC, it was assumed that the size and shape effects on demolished concrete’s strength are approximately the same as those on fresh concrete’s strength (i.e., f*,150,DC/fcu,150,DC = f*,150,FC/fcu,150,FC, and f*,300,DC/f*,150,DC = f*,300,FC/f*,150,FC). If so, f*,300,DC can be determined as:
Except for fcu,150,DC, all the other strengths on the right-hand side of Equations (6) and (7) can be obtained from Table 3. The measured 150 mm cubic compressive strength of demolished concrete, fcu,150,DC, was 40.8 MPa, as described in Section 2.1.
Table 5 shows that:
- (a)
- The combined compressive strength (f*,300,CC) predicted using Equation (4) is generally higher than the measured one. This is mainly because Equation (4) is based on data from previous experiments in which the maximum aggregate size of fresh concrete did not exceed 25 mm. Spaces between the mold and the DCLs and gaps between adjacent DCLs may have been better filled with fresh concrete in that work. The fresh concrete’s aggregate size in this study ranged up to 35 mm. This may have allowed some spaces between the mold and the DCLs and some gaps between the adjacent lumps to be filled only with mortar without coarse aggregates. If the homogeneity of the compound concrete was poorer, that could explain the lower measured compressive strength.
- (b)
- The larger the replacement ratio, generally the greater the discrepancy between the predicted and measured strengths. This might be explained in the same way. With increasing replacement ratio, the number of spaces between the mold and the DCLs and the number of gaps between adjacent lumps increased. But the spaces and gaps generally became narrower, so the heterogeneity of the compound concrete would increase if the aggregate was coarse.
With the test results listed in Table 4 as a reference, a modified Equation (8) can be proposed for predicting the compressive strength of compound concrete made with normal-strength DCLs and FC with a maximum aggregate size not larger than 35 mm:
where λ is a reduction coefficient not larger than 1.0, α = 0.68 for a specimen with a lateral dimension of 300 mm, and smax (in mm) denotes the maximum aggregate size of the fresh concrete; λ = 1.0 when smax ≤ 25 mm. In that case, Equation (8) reduces to Equation (4). The combined compressive strengths of the specimens in Groups 2, 3, and 4 predicted using Equations (8) and (9) are listed in Table 5. The predicted results clearly agree well with the measured data on the whole.
3.3.2. Combined Elastic Modulus
For the prisms and cylinders listed in Table 4, the behavior of the relative elastic modulus (i.e., E*,300,CC/E*,300,FC) with increased replacement ratio is depicted in Figure 9. The figure shows that:
- (a)
- The combined elastic modulus of the prisms or cylinders made with DCLs decreased gradually with increasing replacement ratio. This is presumably due to the low compressive strength of demolished concrete (40.8 MPa for a 150 mm cube) compared with fresh concrete (53.0 MPa on the test day). The modulus of elasticity of demolished concrete should also be less than that of fresh concrete.
- (b)
- For any given replacement ratio, the relative elastic modulus of the prisms is very close to that of the cylinders. An approximately linear relationship between the relative elastic modulus and the replacement ratio holds for both.
Figure 10 shows that for a given replacement ratio, the combined elastic modulus of a prism is always larger than that of a cylinder, though the difference is generally small. For the prismatic and cylindrical specimens with replacement ratios of 20%, 30%, and 40%, the average value of Epr,300,CC/Ecy,300,CC is only about 1.05.
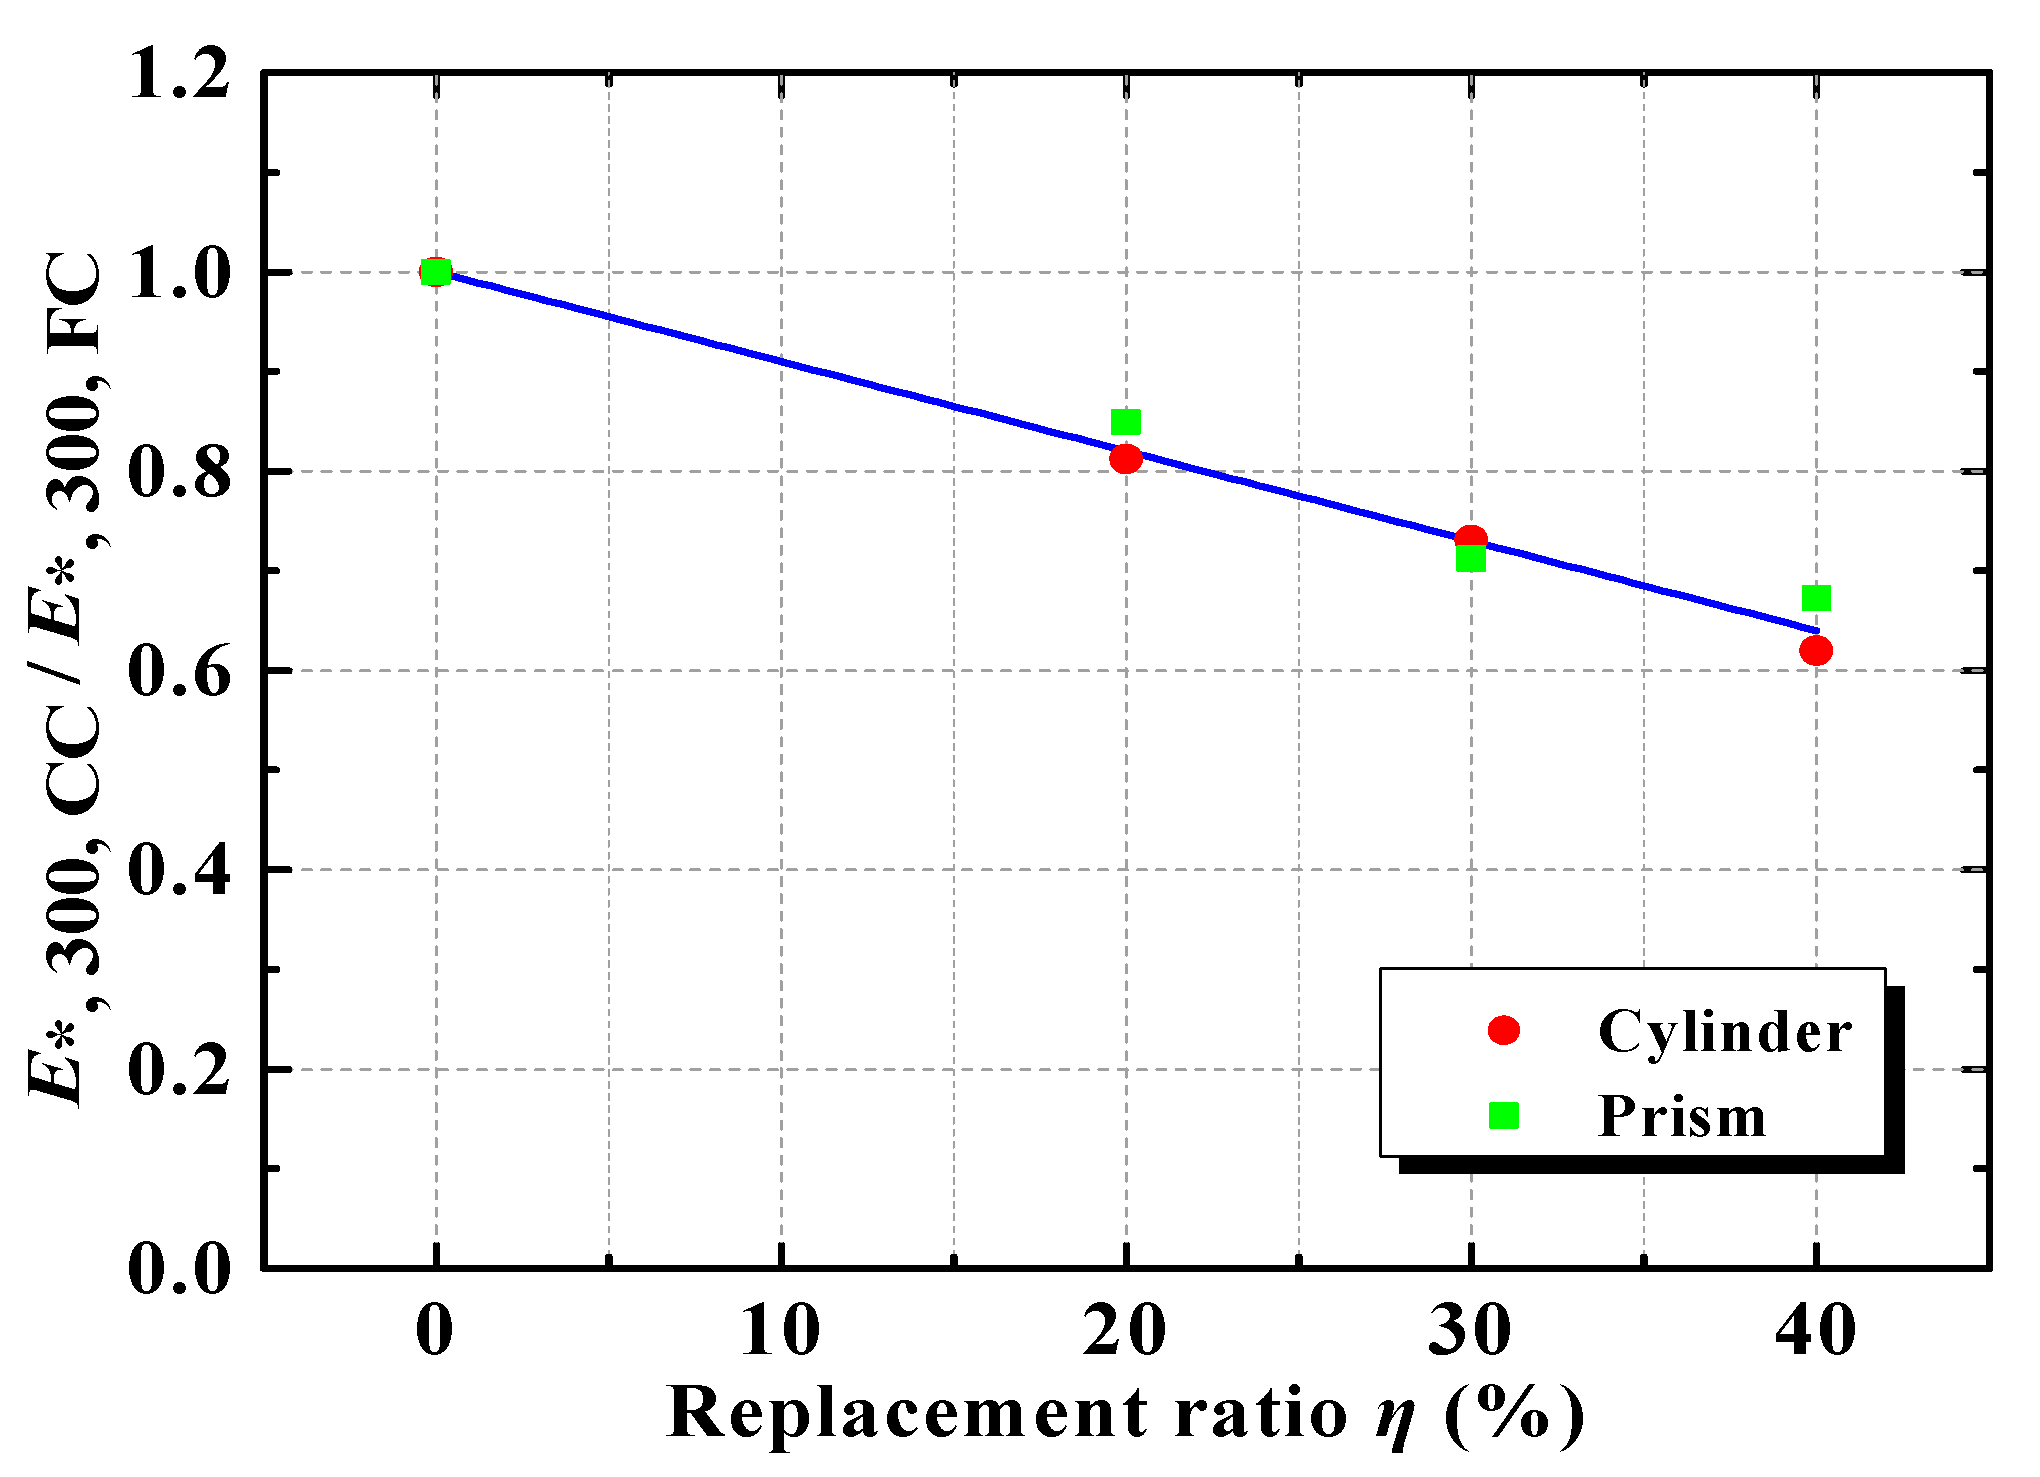
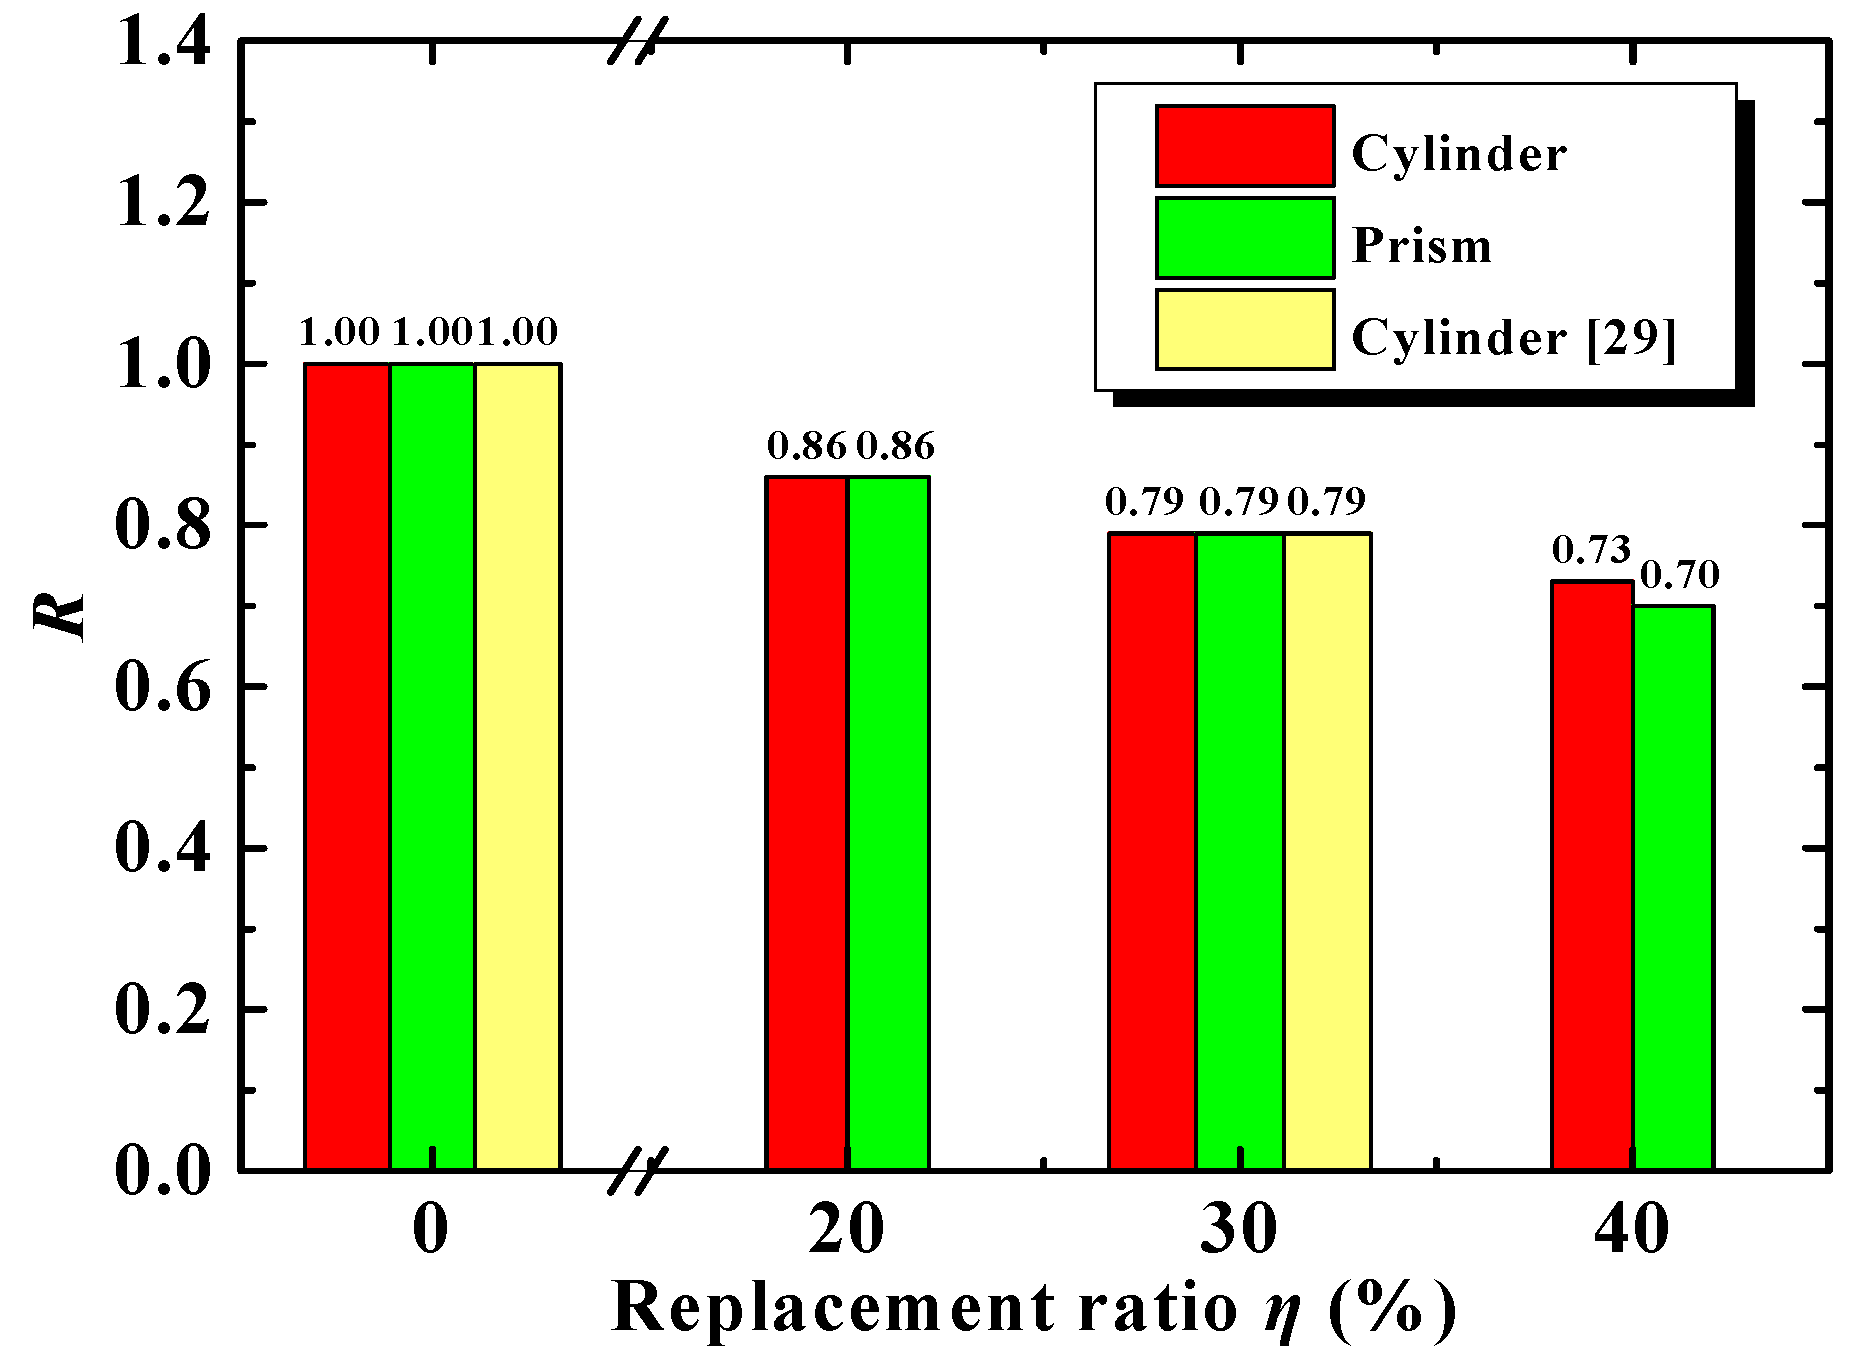
Equation (2) shows that is in proportion to for the specimens made of FC alone. To examine the relationship between and for DCL-filled specimens, a dimensionless parameter R was defined:
Figure 11 presents a plot of R versus the replacement ratio. It is evident that:
- (a)
- R is always less than 1.0. This implies that even when the compressive strength of compound concrete is equal to that of fresh concrete, the elastic modulus will be lower. A similar relationship can also be observed using published test data from previous research [29]. This indicates that the negative effect of DCLs on the combined elastic modulus is more significant than that on the combined compressive strength.
- (b)
- The maximum aggregate size of the fresh concrete in study [29] was 25 mm, which is smaller than that of the fresh concrete in this study (35 mm); at the same time, replacement ratio (e.g., 30% in Figure 9), the value of R calculated from the published test data [29], is almost the same as that based on the test results in this study. So the influence of maximum aggregate size on the value of R is apparently limited.
- (c)
- The value of R decreases gradually with increasing replacement ratio. This is presumably due to the greater heterogeneity of compound concrete.
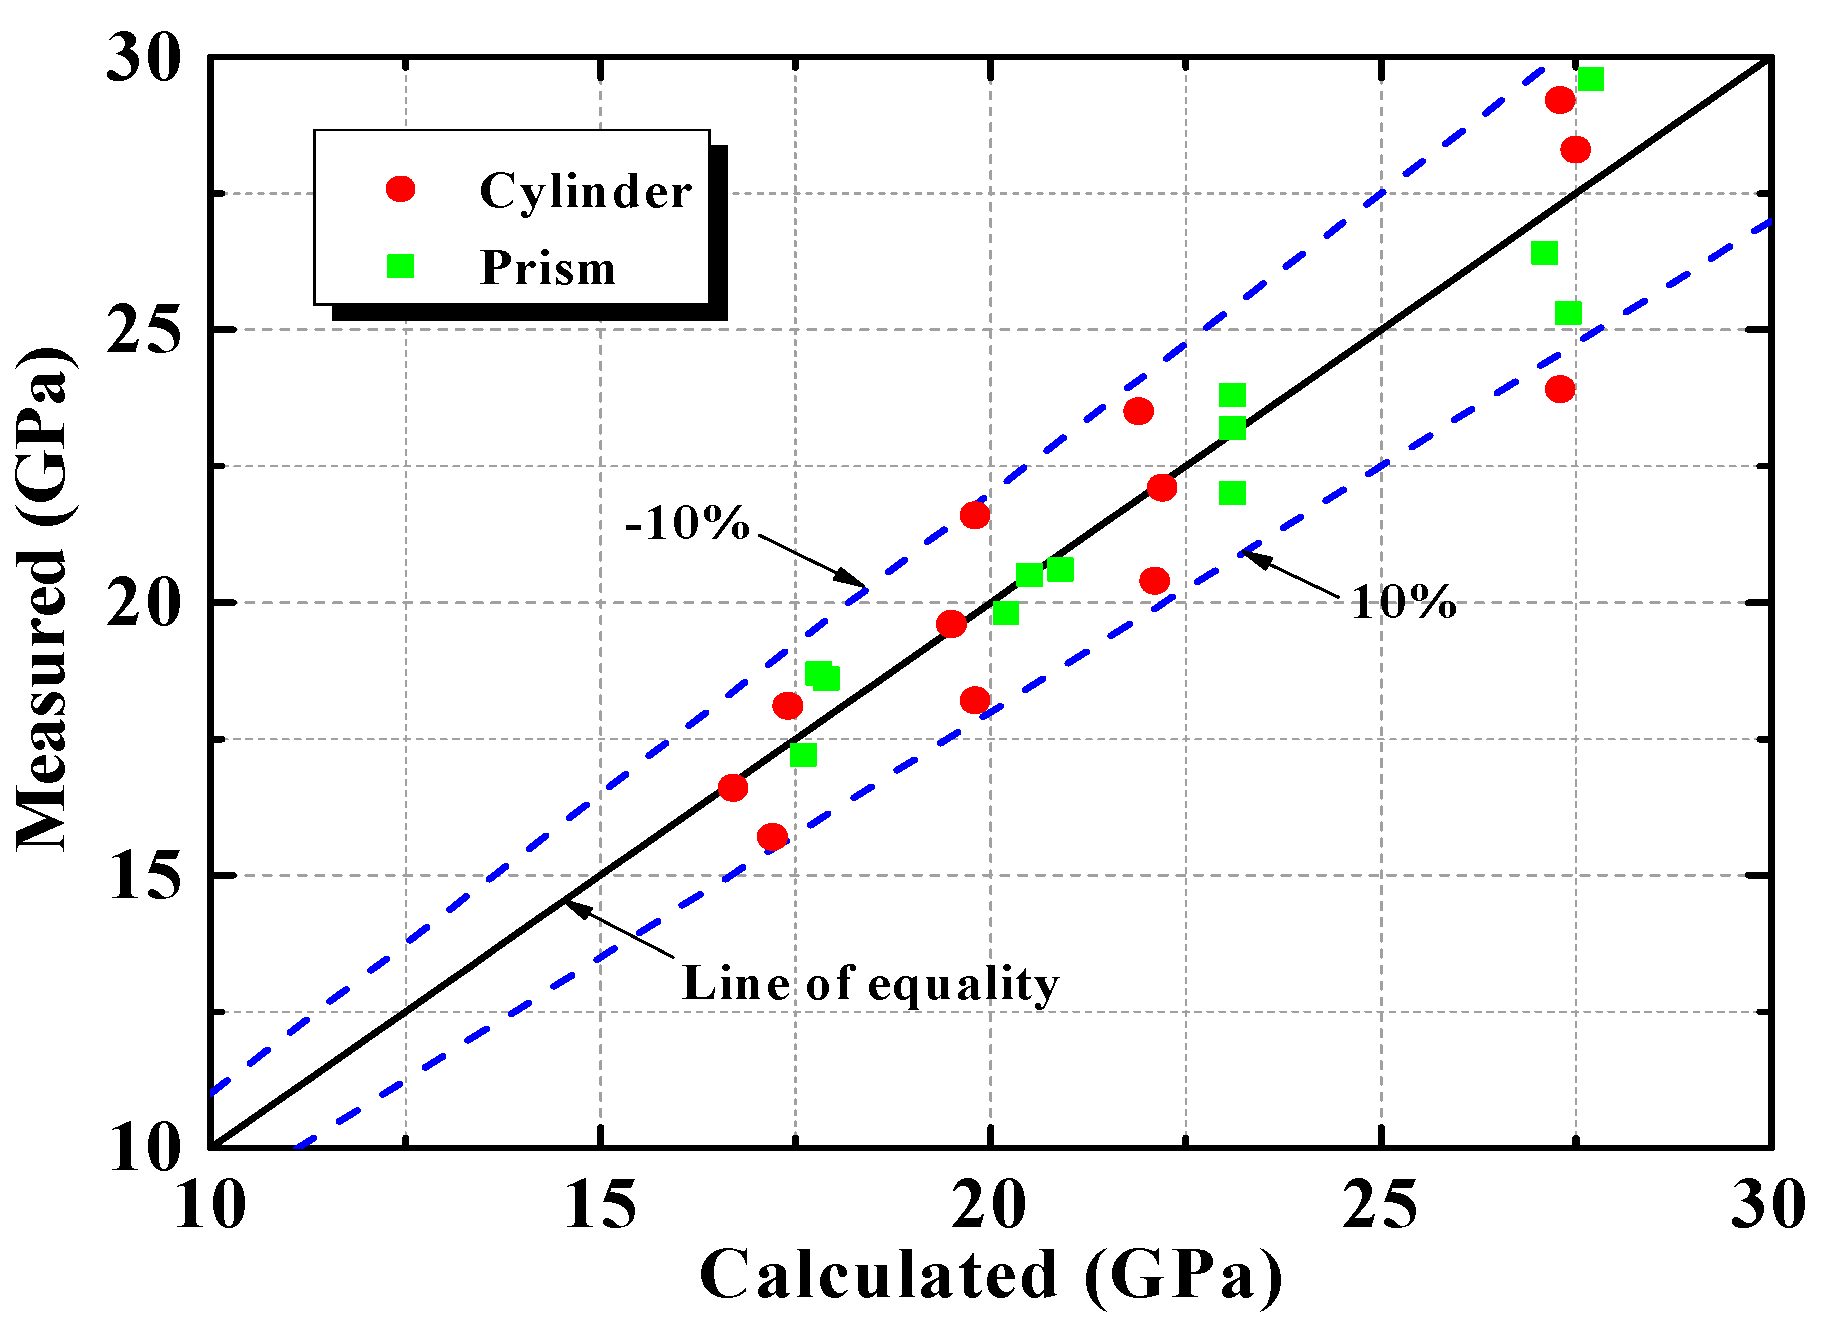
Based on the test data listed in Table 4, an empirical expression can be proposed for the relationship between the combined elastic modulus and the combined compressive strength applying to both horizontally cast prism and vertically cast cylinder.
The subscript asterisk (*) refers to the shape of the specimen (* = pr for a prism and cy for a cylinder). Figure 12 compares the calculated and measured elastic moduli. It shows that the measured results generally agree well with results calculated using Equation (11).
3.3.3. Combined Peak Strain
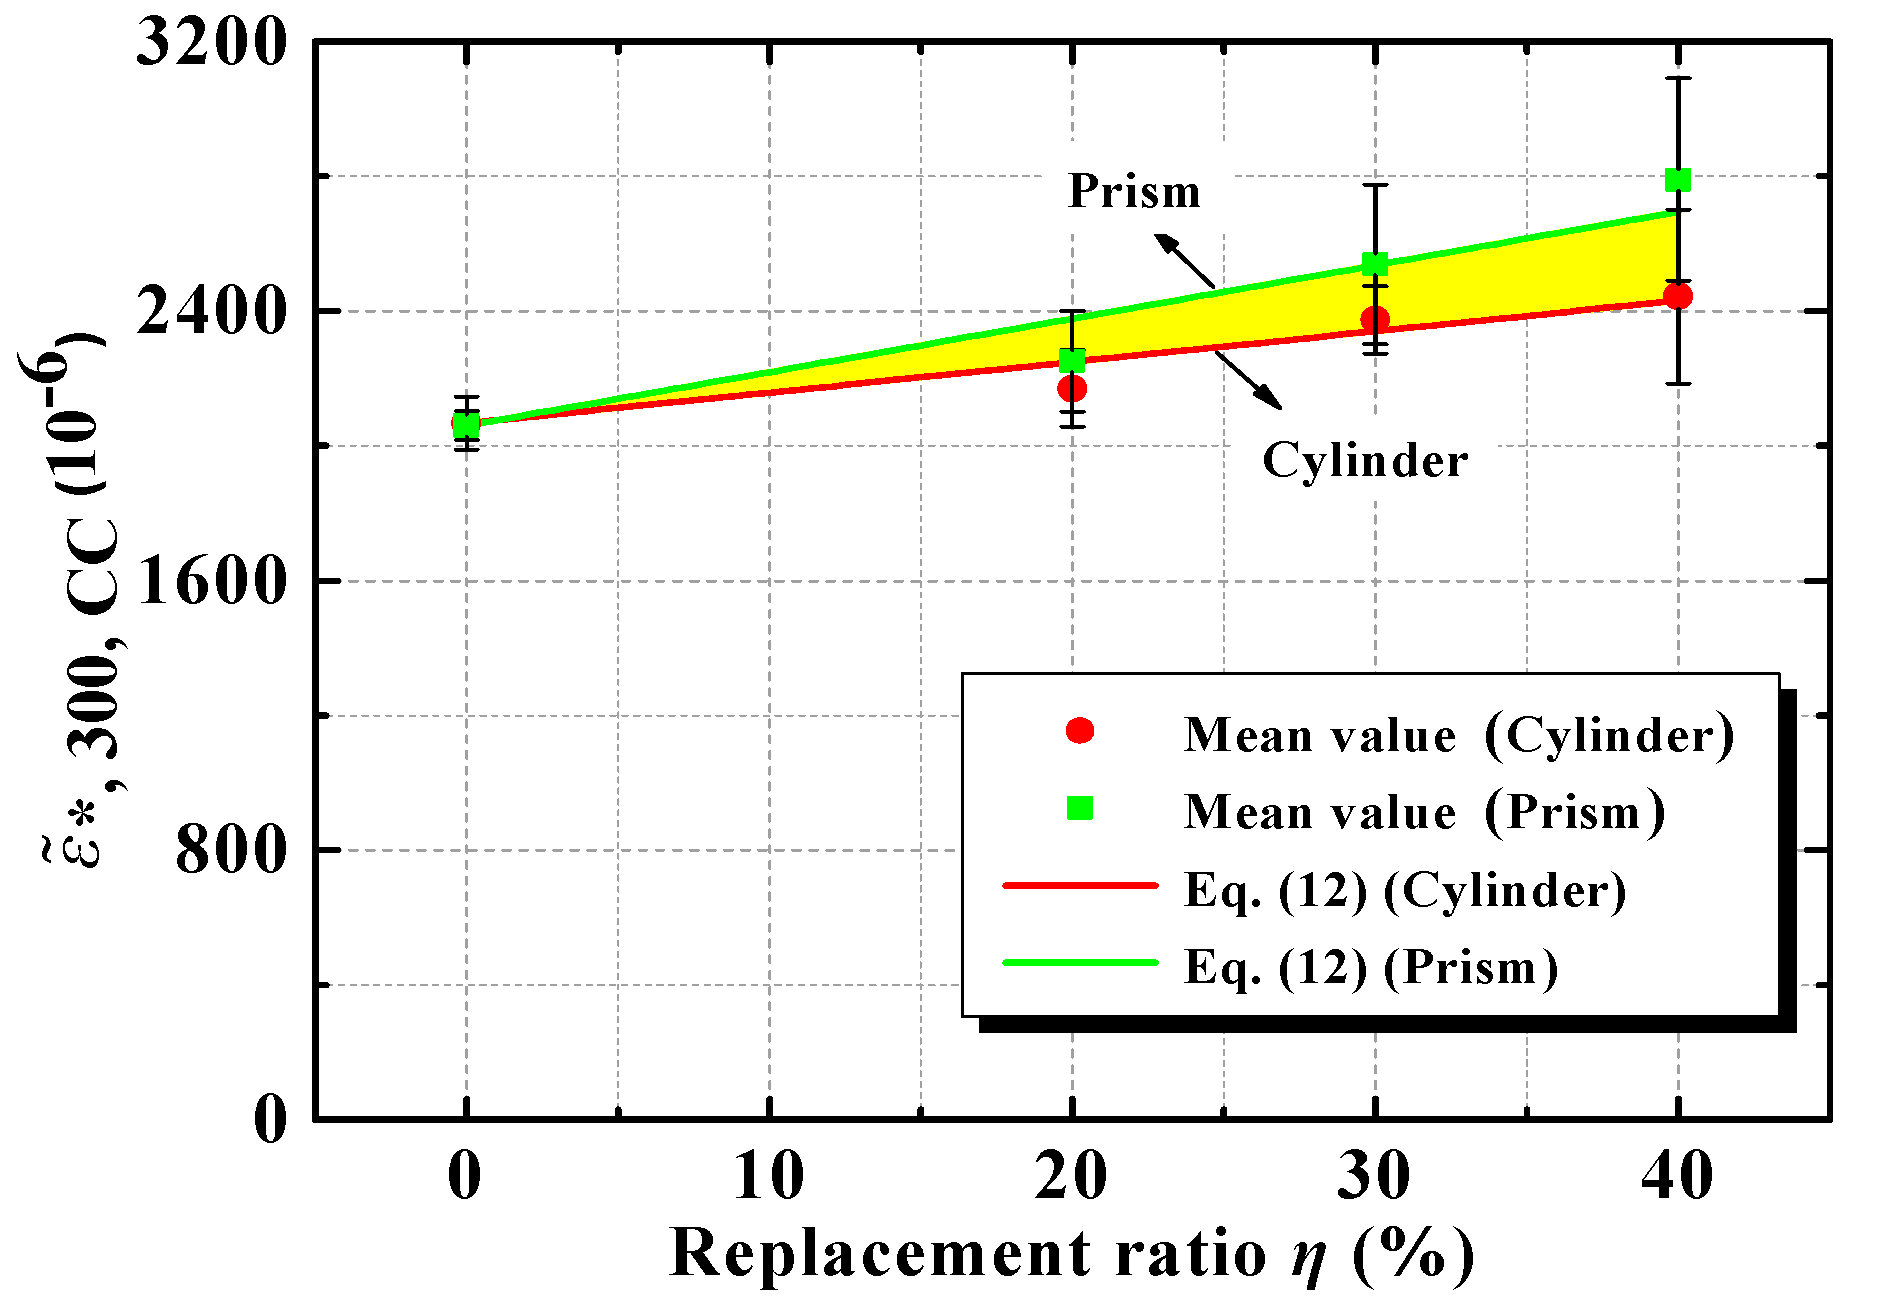
Figure 13 illustrates variation in combined peak strain with the replacement ratio for the prisms and cylinders listed in Table 4. It can be seen from the figure that:
- (a)
- With increased replacement ratio, both the average and the coefficient of variation of the combined peak strain generally increased. The peak strains of the prisms and cylinders with a replacement ratio of 40% were, respectively, 35.4% and 18.2% larger than the peak strains of the prisms and cylinders made of FC alone. It has been suggested that the strain at peak stress reflects the amount of micro-cracking that has occurred, and that increased strain at peak stress indicates more micro-cracks [53,54]. If so, it can be deduced that micro-cracking in compound concrete increases with the replacement ratio.
- (b)
- For a given replacement ratio, the peak strain for a prism is always higher than that of a cylinder, and the difference between them increases with the replacement ratio. This is presumably because with a prism, the stress is concentrated at the edges in the early loading [50]. With degradation of the edge concrete, the stress gradually shifts to the core concrete. More micro-cracks form during the process of stress transfer than with a cylinder, leading to greater peak strain for the prism.
Based on the test data listed in Table 4, a quantitative relationship between the combined peak strain and the replacement ratio can be formulated as:
The subscript asterisk (*) again refers to the shape of the specimen (* = pr for a prism and cy for a cylinder). The value of θ (0.79 for a prism and 0.44 for a cylinder) is determined through linear fitting of the test data. Figure 13 shows that Equation (12) agrees well with the test results on the whole.
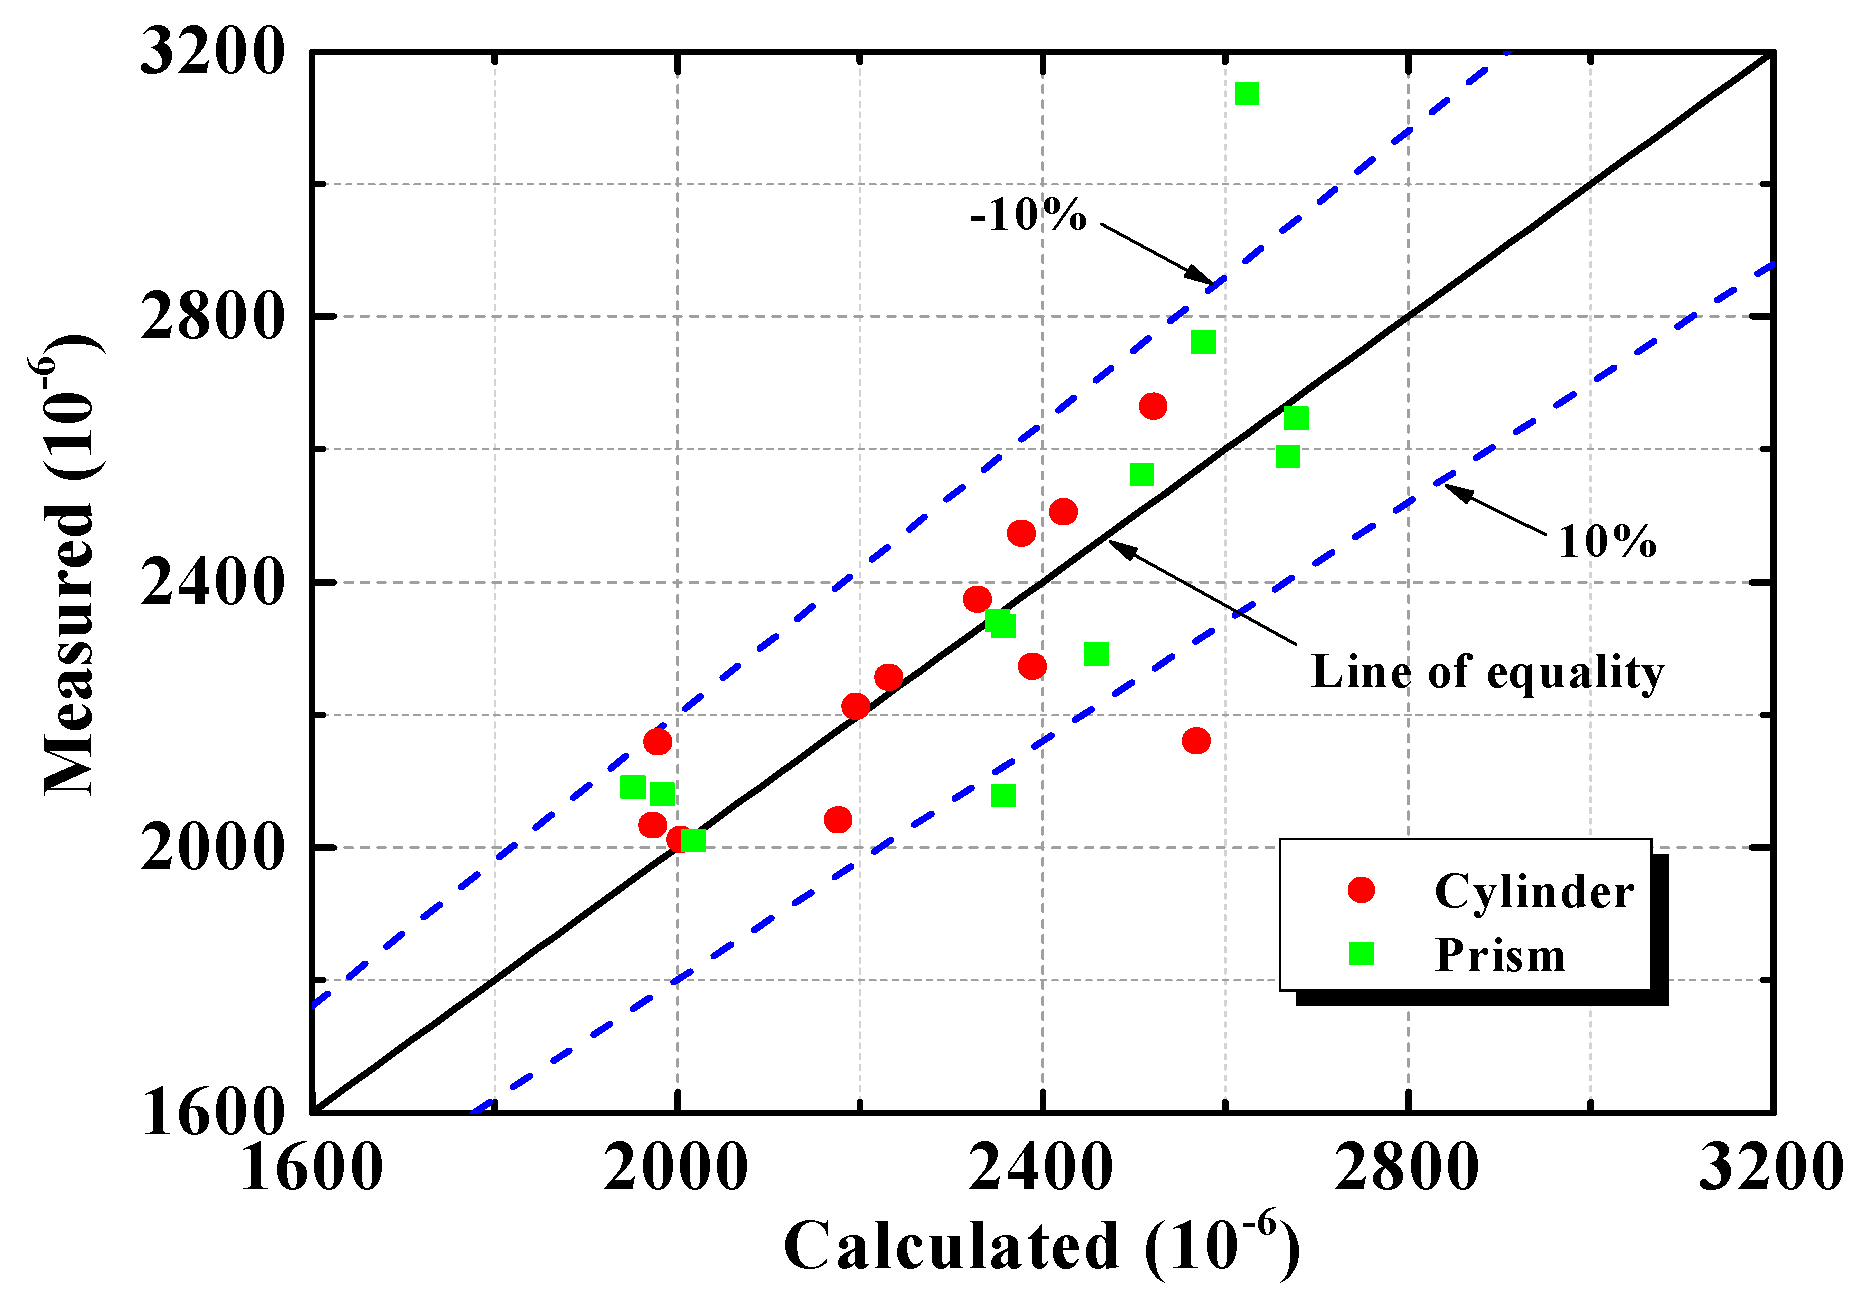
Based on the test results presented in Table 4, an empirical expression can be proposed to determine the relationship between the combined peak strain and the combined compressive strength for both the horizontally cast prism and vertically cast cylinder.
Here, too, the subscript asterisk (*) denotes the shape of the specimen (* = pr for a prism and cy for a cylinder). Figure 14 shows a comparison between the calculated and measured combined peak strains, and it is clear that the measured data generally agree well with the values calculated using Equation (13).
3.3.4. The Effect of the Characteristic Ratio for Prisms
The measured mechanical properties of the specimens in Group 5 are summarized in Table 6.
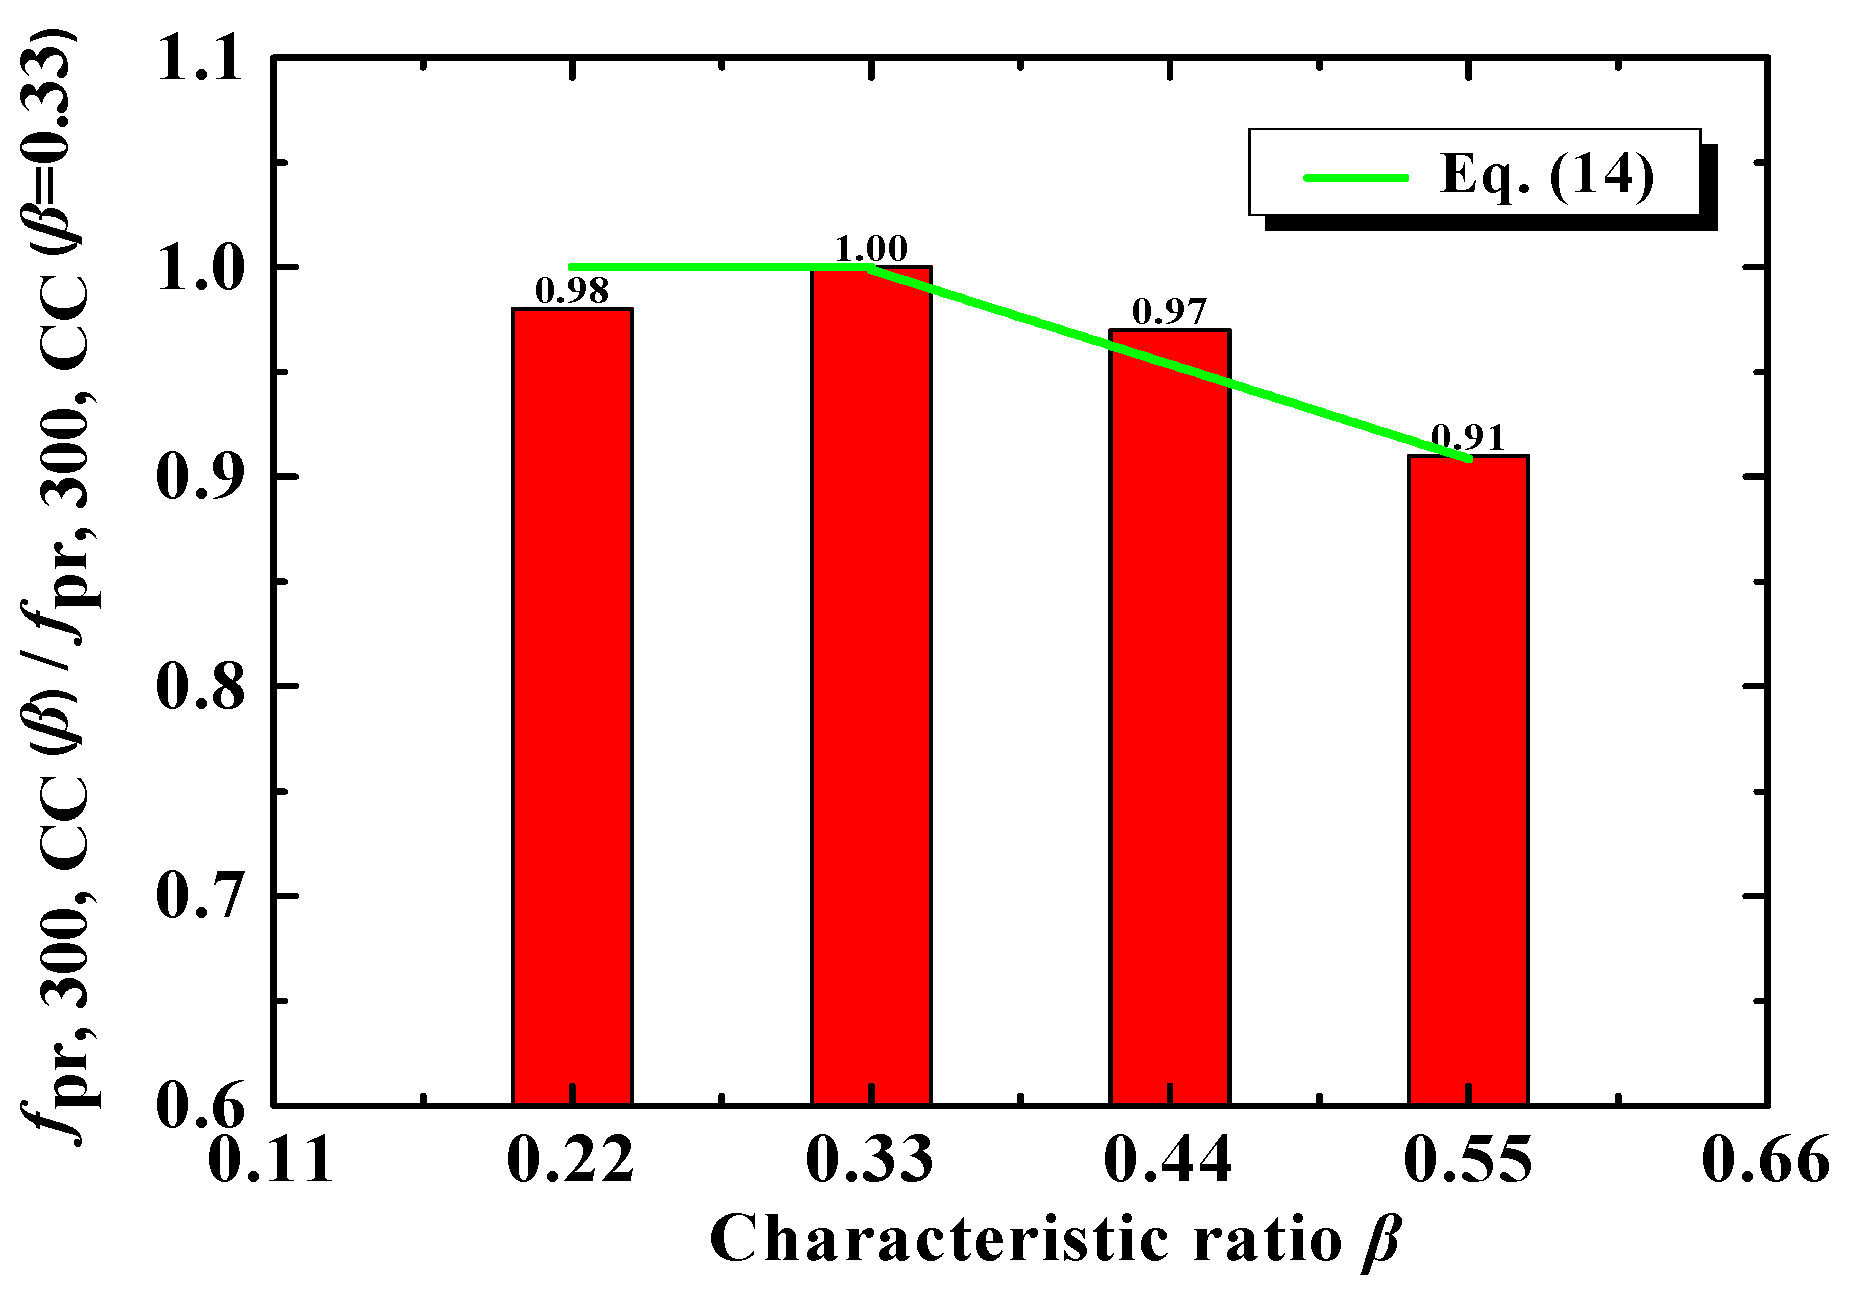
The variation of the combined compressive strength with the ratio of the characteristic size of the lumps to the specimen’s lateral dimension (designated as β) is shown in Figure 15. The ratio ranges from 0.22 to 0.44, and its relationship with the prismatic compressive strength is weak. But when this ratio reaches 0.55, about a 10% decrease in compressive strength is observed. A similar reduction has been reported in previous studies [27,29] using cubic and cylindrical specimens with different characteristic ratios. The observed relationship probably arises because larger lumps have less bonded surfaces with the FC, which is where micro-cracks tend to occur and develop during the loading process. So the occurrence and development of internal cracks and then the energy dissipation of a loaded prism with a larger characteristic ratio are less dispersive, leading to less energy being dissipated before failure and lower compressive strength.
Based on the test results listed in Table 6, a bilinear empirical relationship between the combined compressive strength and the characteristic ratio can be established for prisms as:
Comparing Equation (14) with Equations (15) and (16), it can be seen that with increasing β, the rate of decreasing compressive strength is in the order prism > cylinder > cube. The effect of the characteristic size of the lumps on compressive strength is greatest for prisms and least for cubes. This is probably an effect of the end restraints caused by the machine platens on lateral expansion. This would be more significant for cubes than for the lateral expansion of cylinders and prisms. For prisms, the non-uniform stress distribution caused by the presence of sharp edges would be expected to amplify the impact of characteristic lump size on compressive strength.
It can be seen from Table 6 that as the characteristic ratio increases, the combined elastic modulus and combined peak strain for prisms varies within a relatively narrow range, and no monotonic trend is apparent. For simplicity, the influences of the characteristic ratio on the combined elastic modulus and combined peak strain can normally be neglected. Similar behavior has been observed for cubes and cylinders made of normal-strength DCLs and FC [27,29].
3.3.5. Size Effect on Prisms
The measured mechanical properties of the specimens in Group 6 with the same characteristic ratio are summarized in Table 7. It is easy to see that:
- (a)
- As the prism’s dimensions increased, the combined compressive strength increased at first, then declined gradually. This is probably the result of two factors. The first is that at a given characteristic ratio, the gaps between adjacent lumps generally become wider as the prism’s dimensions increase. That should lead to those gaps being better filled with fresh concrete and larger aggregate particles. The concrete’s greater homogeneity would be expected to result in higher compressive strength. The second factor is the traditional size effect on compressive strength with brittle materials. As the size of the prism increases, the probability of its having structural defects also increases, hence compressive strength declines. These two factors working together could explain the phenomenon shown in Table 7.
It should be noted that increasing the dimensions of cubes and cylinders of DCLs and FC has been reported [27,29] to result in lower combined compressive strength, through no initial increase was observed in that earlier work. That may be because the maximum aggregate size of the fresh concrete was only 25 mm in those tests, much smaller than the 35 mm of this study.
- (b)
- Combined peak strain generally decreased with larger prisms, but any change in the combined elastic modulus was very limited.
4. Conclusions
In the scope of this experimental study, the following conclusions can be drawn:
- (1)
- The crack development and failure patterns of axially loaded prisms made of DCLs and FC are similar to those of prisms made of FC alone.
- (2)
- For the specimens made of FC alone, as the maximum aggregate particle size increases from 20 to 35 mm, there is little change in the fcu,150/fcu,300, fpr,150/fpr,300, and fcy,150/fcy,300 ratios.
- (3)
- A modified formula predicting the compressive strength of compound concrete made of DCLs and FC agrees well with the measured values for prisms, cylinders, and cubes.
- (4)
- With increasing DCL fractions, the fcu,300,CC/fcy,300,CC strength ratio generally increases. At replacement ratios from 20% to 40%, the strength ratio of fpr,300,CC/fcy,300,CC related to horizontally cast prisms and vertically cast cylinders is about 1.13.
- (5)
- The relative elastic modulus of a prism is very close to that of a comparable cylinder at any given replacement ratio, and there is a linear relationship between the relative elastic modulus and the replacement ratio.
- (6)
- The negative effect of including DCLs on the combined elastic modulus is more significant than on the combined compressive strength, and this trend becomes more and more distinct as the replacement ratio increases.
- (7)
- The combined peak strain generally increases with the replacement ratio. For a given replacement ratio, the peak strain of a prism is higher than that of the cylinder, and the difference increases with the replacement ratio.
- (8)
- When the characteristic ratio of the filler lumps is between 0.22 and 0.44, its effect on a prism’s compressive strength is limited, but when the ratio reaches 0.55, an approximately 10% decrease in compressive strength is observed.
- (9)
- Larger lumps decrease the combined compressive strength of prisms more than cylinders, and of cylinders more than cubes. Any influence of the characteristic ratio on the combined elastic modulus and combined peak strain of prisms can normally be neglected.
- (10)
- As prism size increases, the combined compressive strength increases at first and then declines gradually. The combined peak strain generally decreases, but the change in the combined elastic modulus is very limited.
Author Contributions
B.W. and Y.Y. conceived and designed the experiments; Y.Y. performed the experiments; B.W., Y.Y., and Z.C. analyzed the data and wrote the paper.
Acknowledgments
The authors would like to gratefully acknowledge research grants from the National Key R&D Program of China (grant 2017YFC0703303), the National Natural Science Foundation of China (grants 51438007 and 51778240), the Key Project of Science (Technology) Research of Guangzhou (grant 201607020005), and the State Key Laboratory of Subtropical Building Science (grants 2015ZB21 and 2017KC17).
Conflict of Interest
The authors declare that there is no conflict of interest regarding the publication of this paper.
Nomenclature
The following symbols are used in this paper:
| D | lateral dimension of specimen |
| d | characteristic size of DCLs |
| E | elastic modulus |
| f | compressive strength |
| smax | maximum aggregate size of fresh concrete |
| β | characteristic ratio of DCLs |
| ε | longitudinal strain |
| strain at peak stress | |
| η | replacement ratio of DCLs |
| σ | longitudinal stress |
| * | specimen shape (* = cu for a cube, cy for a cylinder, and pr for a prism) |
| (…)*,D,FC | any quantity of fresh concrete |
| (…)*,D,DC | any quantity of demolished concrete |
| (…)*,D,CC | any quantity of compound concrete |
References
- Tahmoorian, F.; Samali, B.; Tam, V.; Yeaman, J. Evaluation of mechanical properties of recycled material for utilization in asphalt mixtures. Appl. Sci. 2017, 7, 763. [Google Scholar] [CrossRef]
- Kim, H.S.; Lee, S.H.; Kim, B. Properties of extrusion concrete panel using waste concrete powder. Appl. Sci. 2017, 7, 910. [Google Scholar] [CrossRef]
- Liu, W.C.; Cao, W.L.; Zong, N.N.; Wang, R.W.; Ren, L.L. Experimental study on punching performance of recycled aggregate concrete thin wallboard with single-layer reinforcement. Appl. Sci. 2018, 8, 188. [Google Scholar] [CrossRef]
- Mazurek, G.; Iwanski, M. Multidimensional analysis of the effects of waste materials on physical and mechanical properties of recycled mixtures with foamed bitumen. Appl. Sci. 2018, 8, 282. [Google Scholar] [CrossRef]
- Shi, J.; Xu, Y. Estimation and forecasting of concrete debris amount in China. Resour. Conserv. Recycl. 2006, 49, 147–158. [Google Scholar] [CrossRef]
- Huda, S.; Shahria, A.M. Mechanical and freeze-thaw durability properties of recycled aggregate concrete made with recycled coarse aggregate. J. Mater. Civ. Eng. 2015, 27, 04015003. [Google Scholar] [CrossRef]
- Frondistou, Y.S.; Itoh, T. Economic feasibility of concrete recycling. J. Struct. Div. 1977, 103, 885–899. [Google Scholar]
- Frondistou, Y.S. Waste concrete as aggregate for new concrete. J. Proc. 1977, 74, 373–376. [Google Scholar]
- Xiao, J.Z.; Li, J.; Zhang, C. Mechanical properties of recycled aggregate concrete under uniaxial loading. Cem. Concr. Res. 2005, 35, 1187–1194. [Google Scholar] [CrossRef]
- Li, X. Recycling and reuse of waste concrete in China: Part I. Material behavior of recycled aggregate concrete. Resour. Conserv. Recycl. 2008, 53, 36–44. [Google Scholar] [CrossRef]
- Richardson, A.; Coventry, K.; Bacon, J. Freeze/thaw durability of concrete with recycled demolition aggregate compared to virgin aggregate concrete. J. Clean. Prod. 2011, 19, 272–277. [Google Scholar] [CrossRef]
- Chen, G.M.; He, Y.H.; Jiang, T.; Lin, C.J. Behavior of CFRP-confined recycled aggregate concrete under axial compression. Constr. Build. Mater. 2016, 111, 85–97. [Google Scholar] [CrossRef]
- Nuaklong, P.; Sata, V.; Chindaprasirt, P. Influence of recycled aggregate on fly ash geopolymer concrete properties. J. Clean. Prod. 2016, 112, 2300–2307. [Google Scholar] [CrossRef]
- Li, W.G.; Xiao, J.Z.; Sun, Z.; Shah, S.P. Failure processes of modeled recycled aggregate concrete under uniaxial compression. Cem. Concr. Compos. 2012, 34, 1149–1158. [Google Scholar] [CrossRef]
- Li, W.G.; Xiao, J.Z.; Sun, Z.; Kawashima, S.; Shah, S.P. Interfacial transition zones in recycled aggregate concrete with different mixing approaches. Constr. Build. Mater. 2012, 35, 1045–1055. [Google Scholar] [CrossRef]
- Shi, C.; Li, Y.; Zhang, J.; Li, W.G.; Chong, L.; Xie, Z. Performance enhancement of recycled concrete aggregate—A review. J. Clean. Prod. 2016, 112, 466–472. [Google Scholar] [CrossRef]
- Li, W.G.; Luo, Z.; Long, C.; Wu, C.; Duan, W.H.; Shah, S.P. Effects of nanoparticle on the dynamic behaviors of recycled aggregate concrete under impact loading. Mater. Des. 2016, 112, 58–66. [Google Scholar] [CrossRef]
- Li, W.G.; Long, C.; Tam, V.W.Y.; Poon, C.S.; Duan, W.H. Effects of nano-particles on failure process and microstructural properties of recycled aggregate concrete. Constr. Build. Mater. 2017, 142, 42–50. [Google Scholar] [CrossRef]
- Senaratne, S.; Gerace, D.; Mirza, O.; Tam, V.W.; Kang, W.H. The costs and benefits of combining recycled aggregate with steel fibers as a sustainable, structural material. J. Clean. Prod. 2016, 112, 2318–2327. [Google Scholar] [CrossRef]
- Shima, H.; Tateyashiki, H.; Nakato, T.; Okamoto, M.; Asano, T. New technology for recovering high quality aggregate from demolished concrete. In Proceedings of the 5th International Symposium on East Asian Recycling Technology, Tsukuba, Japan, 15–17 June 1999; pp. 106–109. [Google Scholar]
- Shima, H.; Tateyashiki, H.; Matsuhashi, R.; Yoshida, Y. An advanced concrete recycling technology and its applicability assessment through input-output analysis. J. Adv. Concr. Technol. 2005, 3, 53–67. [Google Scholar] [CrossRef]
- Li, W.G.; Luo, Z.; Wu, C.; Duan, W.H. Impact performances of steel tube-confined recycled aggregate concrete (STCRAC) after exposure to elevated temperatures. Cem. Concr. Compos. 2018, 86, 87–97. [Google Scholar] [CrossRef]
- Lotfi, S.; Eggimann, M.; Wagner, E.; Mroz, R.; Deja, J. Performance of recycled aggregate concrete based on a new concrete recycling technology. Constr. Build. Mater. 2015, 95, 243–256. [Google Scholar] [CrossRef]
- Wu, B.; Xu, Z.; Ma, Z.J.; Liu, Q.; Liu, W. Behavior of reinforced concrete beams filled with demolished concrete lumps. Struct. Eng. Mech. 2011, 40, 411–429. [Google Scholar] [CrossRef]
- Teng, J.G.; Zhao, J.L.; Yu, T.; Li, L.J.; Guo, Y.C. Behavior of FRP-confined compound concrete containing recycled concrete lumps. J. Compos. Constr. 2015, 20, 04015038. [Google Scholar] [CrossRef]
- Wu, B.; Zhao, X.Y.; Zhang, J.S. Cyclic behaviour of thin-walled square steel tubular columns filled with demolished concrete lumps and fresh concrete. J. Constr. Steel Res. 2012, 77, 69–81. [Google Scholar] [CrossRef]
- Wu, B.; Liu, C.H.; Yang, Y. Size effect on compressive behaviors of normal-strength concrete cubes made from demolished concrete blocks. Mag. Concr. Res. 2013, 65, 1155–1167. [Google Scholar] [CrossRef]
- Wu, B.; Zhao, X.Y.; Zhang, J.S.; Yang, Y. Cyclic testing of thin-walled circular steel tubular columns filled with demolished concrete blocks and fresh concrete. Thin Walled Struct. 2013, 66, 50–61. [Google Scholar] [CrossRef]
- Wu, B.; Liu, C.H.; Wu, Y.P. Compressive behaviors of cylindrical concrete specimens made of demolished concrete blocks and fresh concrete. Constr. Build. Mater. 2014, 53, 118–130. [Google Scholar] [CrossRef]
- Wu, B.; Zhang, S.Y.; Yang, Y. Compressive behaviors of cubes and cylinders made of normal-strength demolished concrete blocks and high-strength fresh concrete. Constr. Build. Mater. 2015, 78, 342–353. [Google Scholar] [CrossRef]
- Zhao, X.Y.; Wu, B.; Wang, L. Structural response of thin-walled circular steel tubular columns filled with demolished concrete lumps and fresh concrete. Constr. Build. Mater. 2016, 129, 216–242. [Google Scholar] [CrossRef]
- Wu, B.; Li, Z. Mechanical properties of compound concrete containing demolished concrete lumps after freeze-thaw cycles. Constr. Build. Mater. 2017, 155, 187–199. [Google Scholar] [CrossRef]
- Van Mier, J.G.M. Strain-Softening of Concrete Under Multiaxial Loading Conditions; Technische Hogeschool Eindhoven: Eindhoven, The Netherlands, 1984. [Google Scholar]
- Van Mier, J.G.M.; Shah, S.P.; Arnaud, M.; Balayssac, J.P.; Bascoul, A.; Choi, S.; Dasenbrock, D.; Ferrara, G.; French, C.; Gobbi, M.E.; et al. Strain-softening of concrete in uniaxial compression. Mater. Struct. 1997, 30, 195–209. [Google Scholar] [CrossRef]
- European Standard. Assessment of In Situ Compressive Strength in Structures and Precast Concrete Components; BS EN 13791; Building and Construction Standards Committee: London, UK, 2007. [Google Scholar]
- Mansur, M.; Islam, M. Interpretation of concrete strength for nonstandard specimens. J. Mater. Civ. Eng. 2002, 14, 151–155. [Google Scholar] [CrossRef]
- Semsi, Y.; Sezer, G.I. The effect of cylindrical specimen size on the compressive strength of concrete. Build. Environ. 2007, 42, 2417–2420. [Google Scholar]
- American Society for Testing and Materials. Standard Test Method for Compressive Strength of Cylindrical Concrete Specimens; C39-86; ASTM International: West Conshohocken, PA, USA, 2001. [Google Scholar]
- Neville, A.M. Properties of Concrete; Longman Ltd.: London, UK, 1997. [Google Scholar]
- Lamond, J.F. Significance of Tests and Properties of Concrete and Concrete-Making Materials; ASTM International: West Conshohocken, PA, USA, 2006. [Google Scholar]
- Che, Y.; Ban, S.L.; Cui, J.Y.; Chen, G.; Song, Y.P. Effect of specimen shape and size on compressive strength of concrete. Adv. Mater. 2011, 163–167, 1375–1379. [Google Scholar] [CrossRef]
- Bazant, Z.P.; Oh, B.H. Crack band theory for fracture of concrete. Mater. Struct. 1983, 16, 155–177. [Google Scholar]
- Bazant, Z.P.; Planas, J. Fracture and Size Effect in Concrete and other Quasi-Brittle Materials; CRC Press: Boca Raton, FL, USA, 1998. [Google Scholar]
- Blanks, R.F.; McNamara, C.C. Mass concrete tests in large cylinders. J. Proc. 1935, 31, 280–303. [Google Scholar]
- Xu, J.; He, X. Size effect on the strength of a concrete member. Eng. Fract. Mech. 1990, 35, 687–695. [Google Scholar] [CrossRef]
- Sim, J.I.; Yang, K.H.; Kim, H.Y.; Choi, B.J. Size and shape effects on compressive strength of lightweight concrete. Constr. Build. Mater. 2013, 38, 854–864. [Google Scholar] [CrossRef]
- Sim, J.I.; Yang, K.H.; Jeon, J.K. Influence of aggregate size on the compressive size effect according to different concrete types. Constr. Build. Mater. 2013, 44, 716–725. [Google Scholar] [CrossRef]
- Elfahal, M.M.; Krauthammer, T. Dynamic size effect in normal-and high-strength concrete cylinders. ACI Mater. J. 2005, 102, 77–85. [Google Scholar]
- Van Der Vurst, F.; Desnerck, P.; Peirs, J.; De Schutter, G. Shape factors of self-compacting concrete specimens subjected to uniaxial loading. Cem. Concr. Compos. 2014, 54, 62–69. [Google Scholar] [CrossRef]
- Yi, S.T.; Yang, E.I.; Choi, J.C. Effect of specimen sizes, specimen shapes, and placement directions on compressive strength of concrete. Nucl. Eng. Des. 2006, 236, 115–127. [Google Scholar] [CrossRef]
- Chin, M.S.; Mansur, M.A.; Wee, T.H. Effects of shape, size, and casting direction of specimens on stress-strain curves of high-strength concrete. ACI Mater. J. 1997, 94, 209–219. [Google Scholar]
- Noguchi, T.; Tomosawa, F.; Nemati, K.M.; Chiaia, B.M.; Fantilli, A.P. A practical equation for elastic modulus of concrete. ACI Struct. J. 2009, 106, 690–696. [Google Scholar]
- Popovics, S. A review of stress-strain curves of concrete. Cem. Concr. Res. 1973, 3, 583–599. [Google Scholar] [CrossRef]
- Ray, K.L.S.; Bei, C. The effect of coarse aggregate size on the stress-strain curves of concrete under uniaxial compression. HKIE Trans. 2008, 15, 33–39. [Google Scholar]
Figure 1.
Applications of structural members incorporating demolished concrete lumps (DCLs).
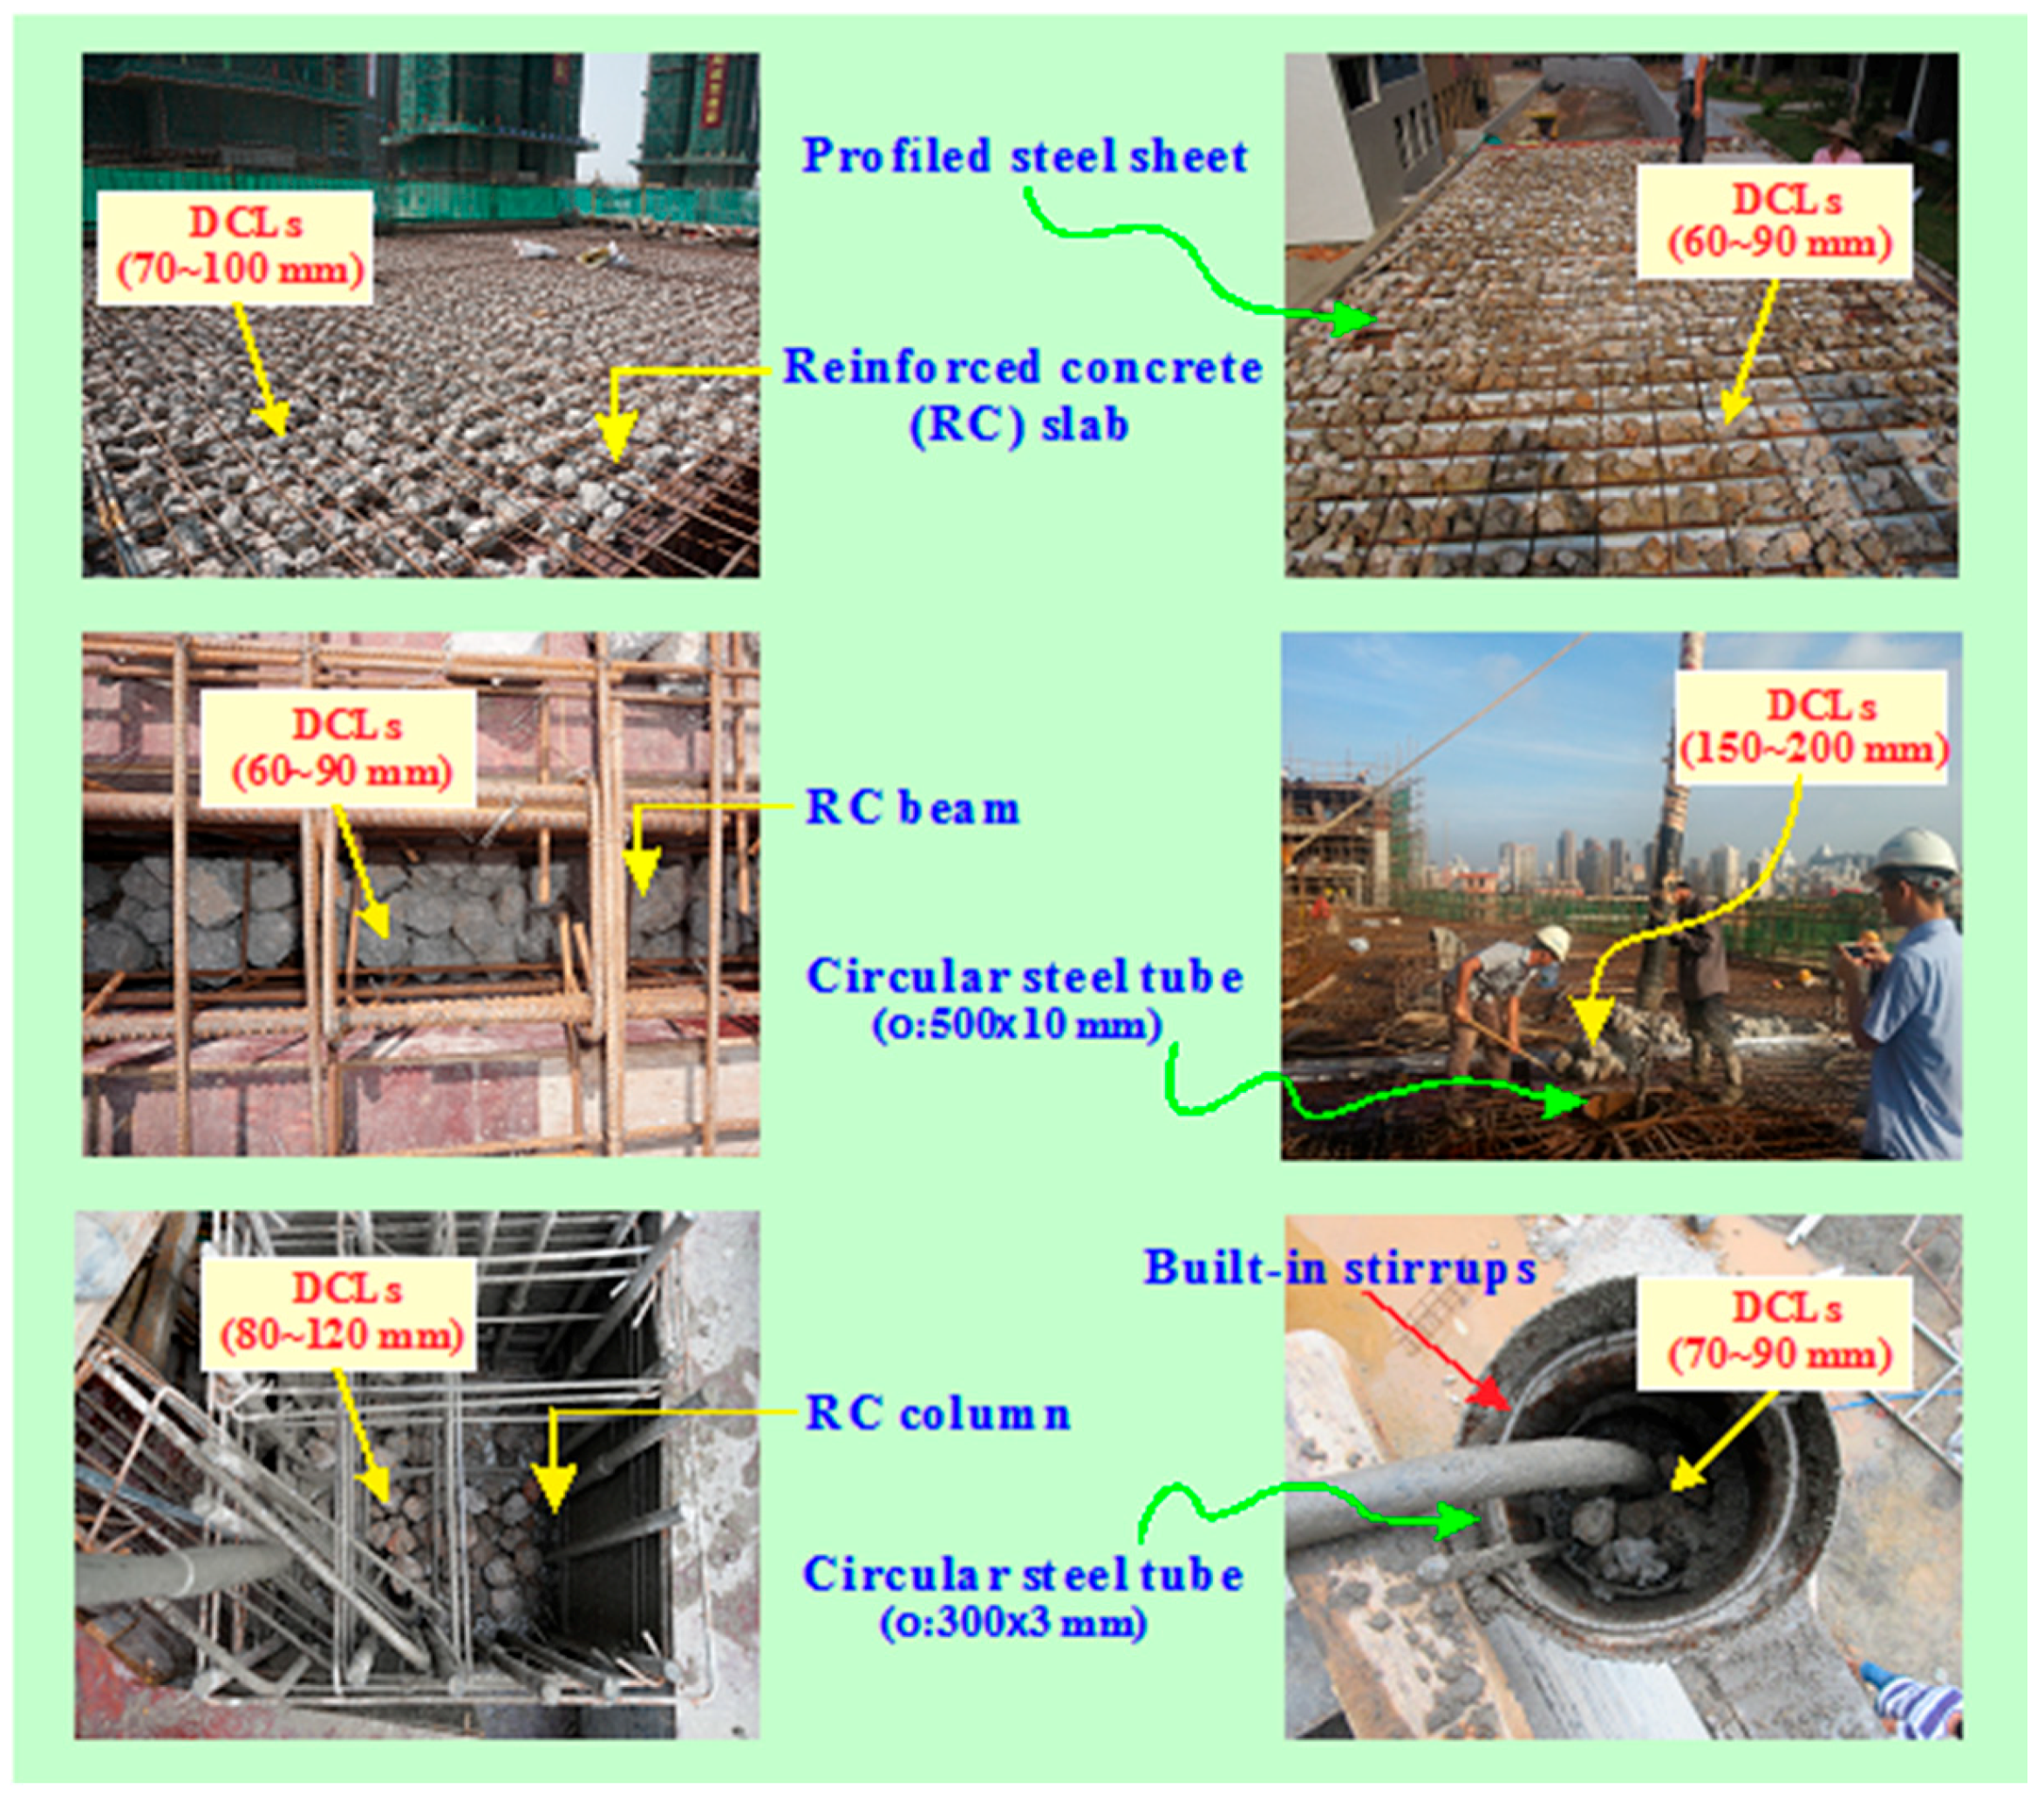
Figure 2.
Maximum aggregate sizes for fresh concrete and demolished concrete.

Figure 3.
Five piles of demolished concrete lumps (DCLs).
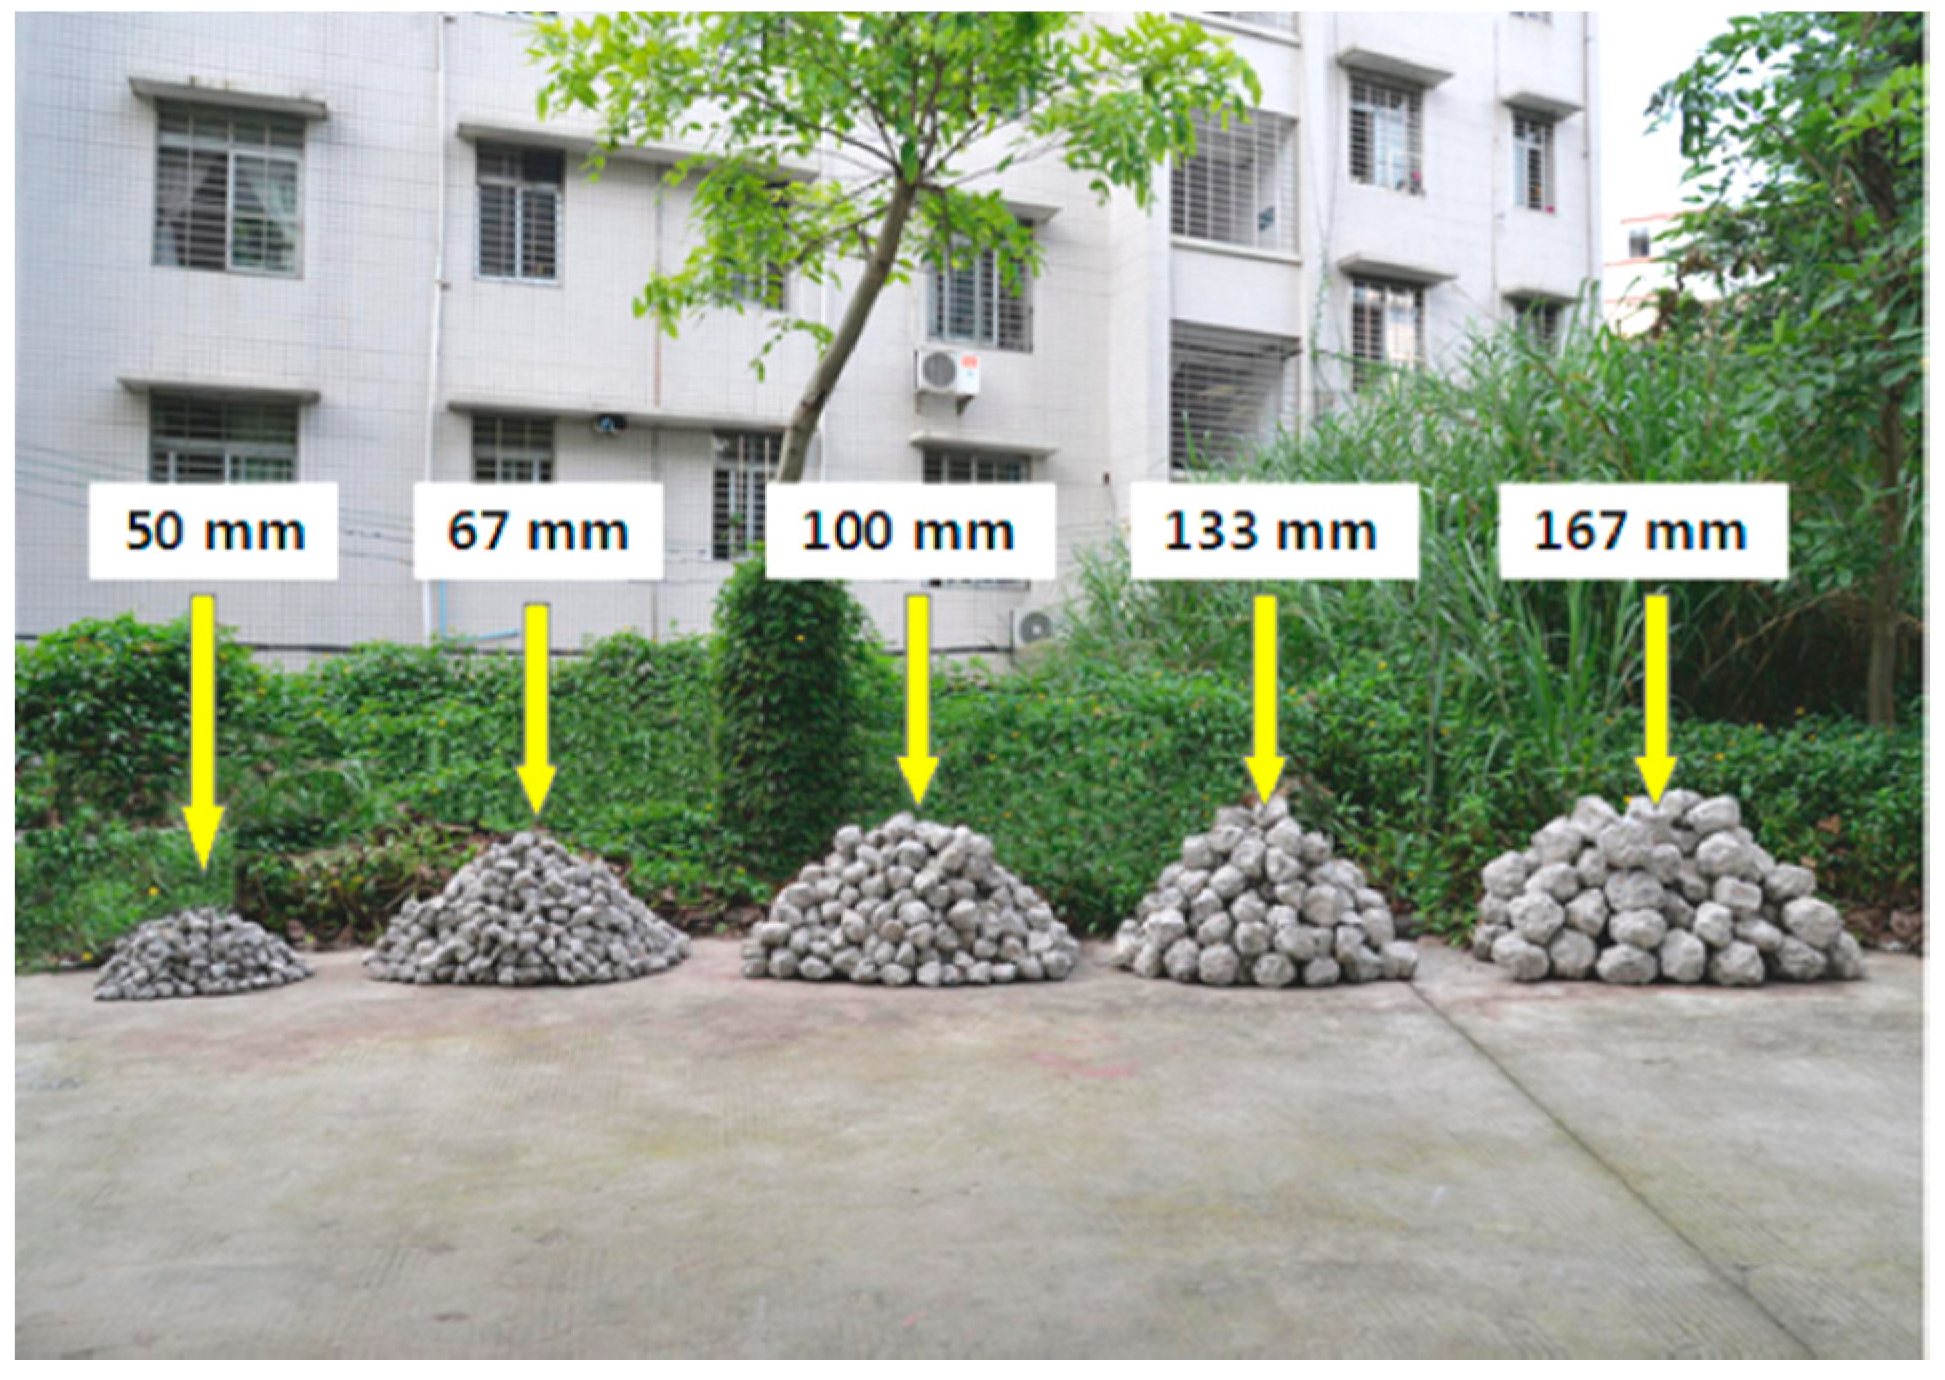
Figure 4.
Concrete casting of specimens: (a) cylinders; (b) cubes; (c) prisms.

Figure 5.
Experimental setup and arrangement of measuring instruments: (a) test machine; (b) arrangement of linear variable differential transducers (LVDTs); (c) specimen photo.
Figure 5.
Experimental setup and arrangement of measuring instruments: (a) test machine; (b) arrangement of linear variable differential transducers (LVDTs); (c) specimen photo.

Figure 6.
Concrete cracks and final failure patterns for three typical specimens: (a) specimen CU300-100-0.3; (b) specimen PR300-100-0.3; (c) specimen CY300-100-0.3; (d) bonding between DCLs and FC in specimen CU300-100-0.3.
Figure 6.
Concrete cracks and final failure patterns for three typical specimens: (a) specimen CU300-100-0.3; (b) specimen PR300-100-0.3; (c) specimen CY300-100-0.3; (d) bonding between DCLs and FC in specimen CU300-100-0.3.


Figure 7.
Variation of f*,150/f*,300 with maximum aggregate size smax.
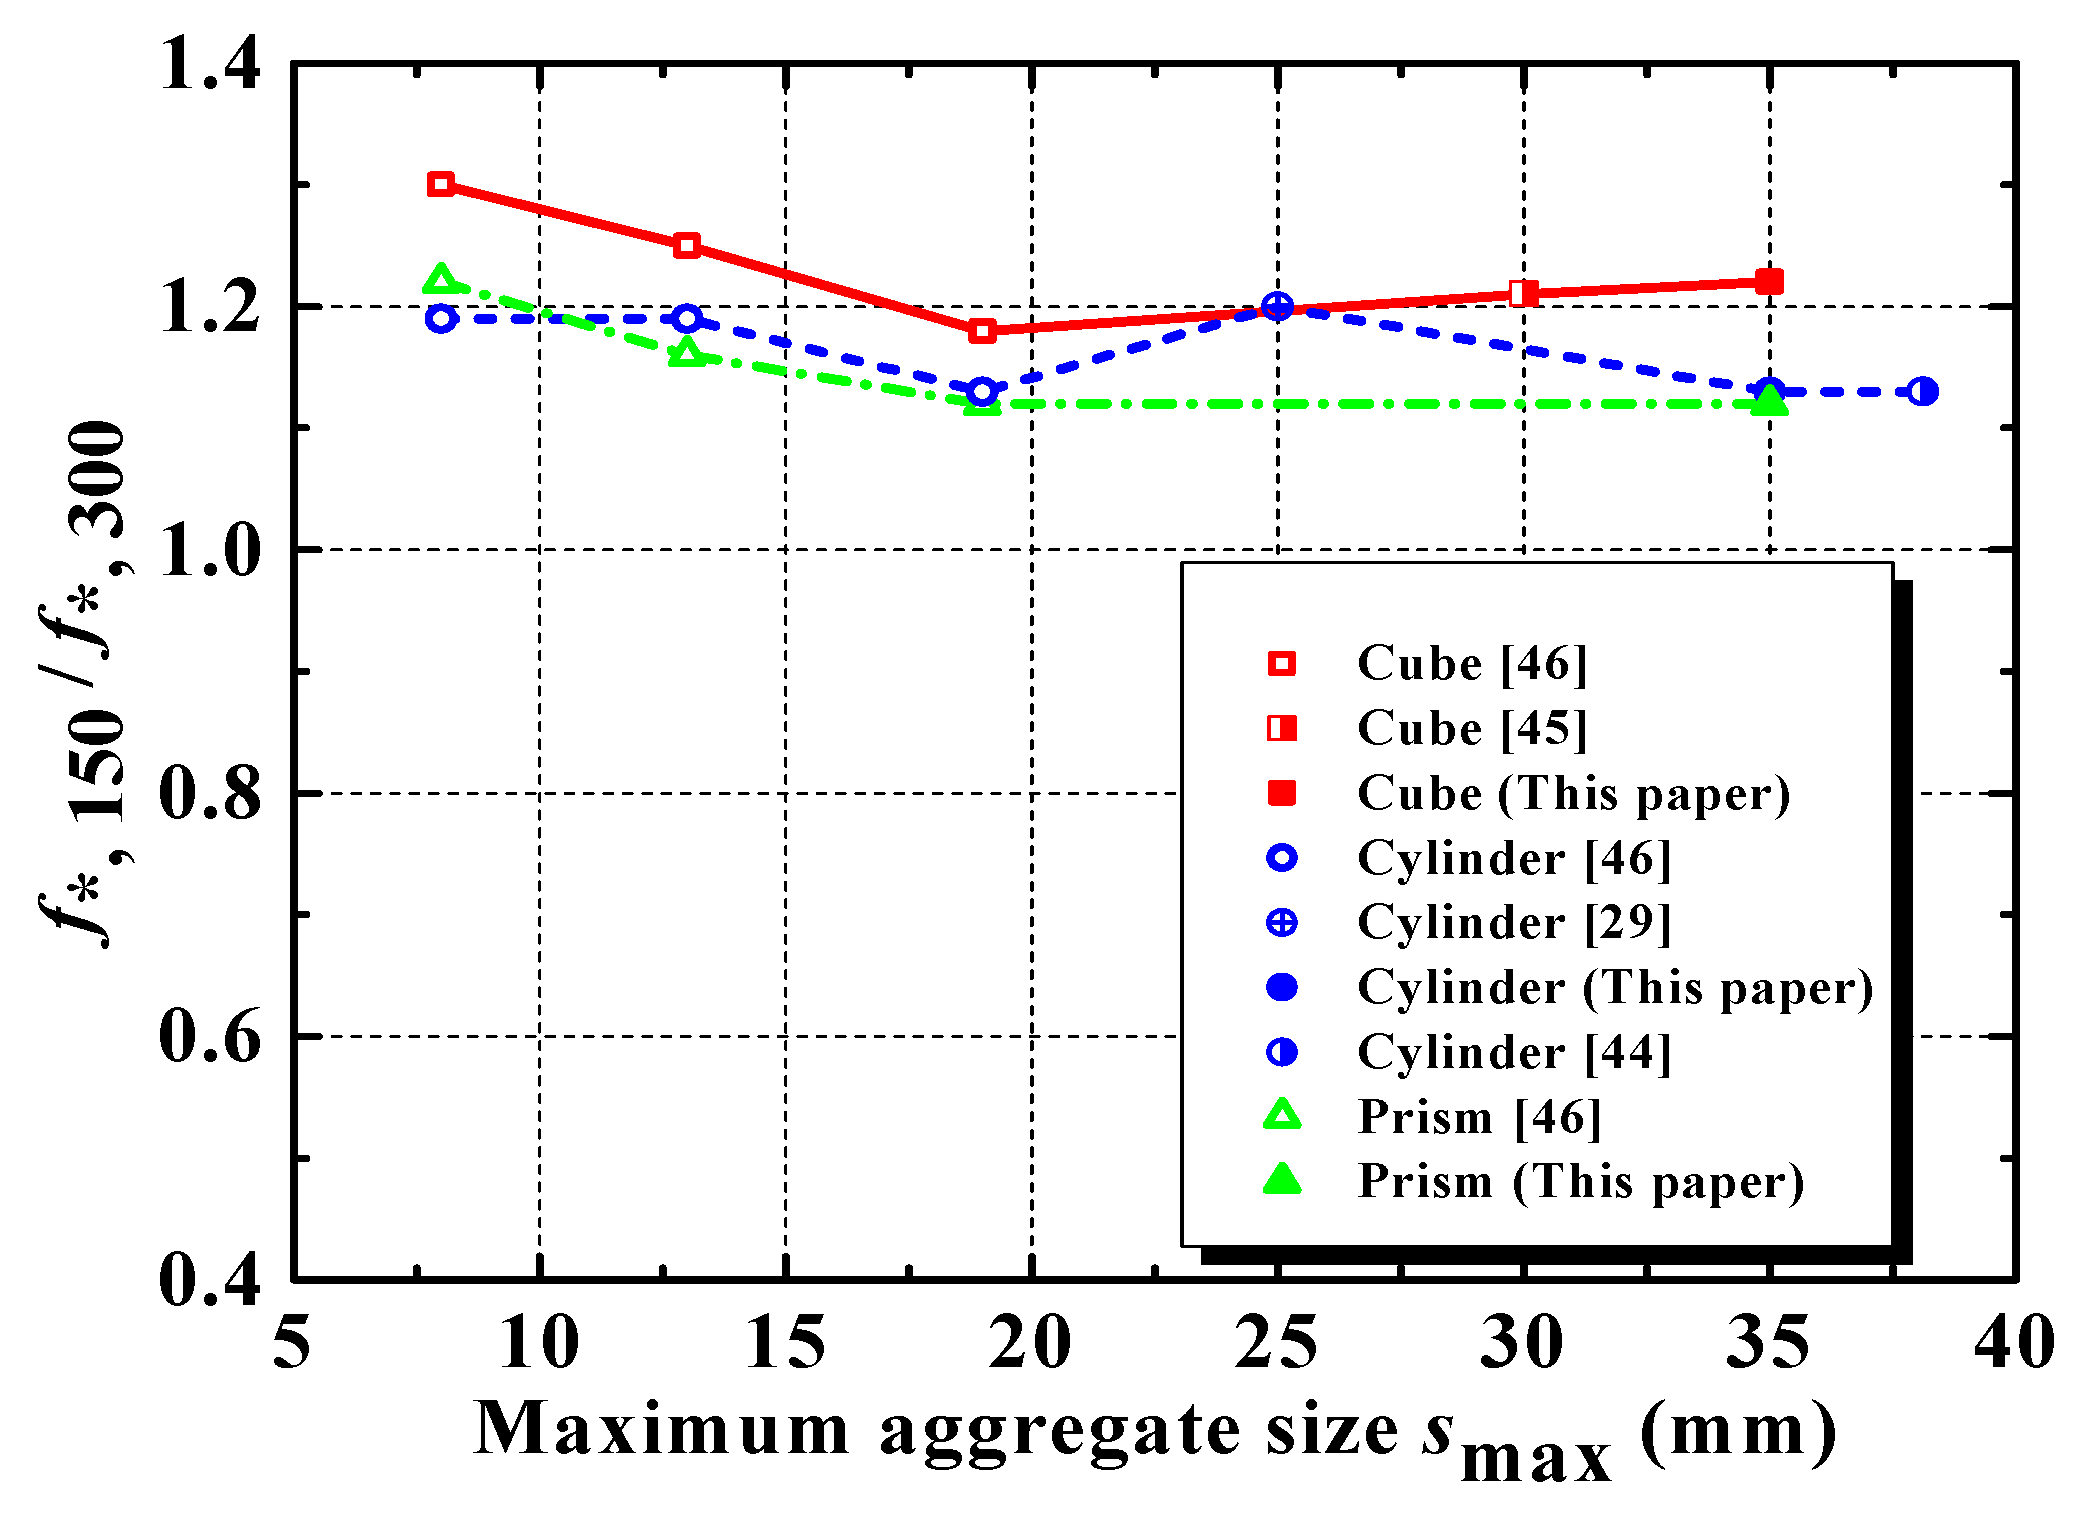
Figure 8.
Variation of strength ratio with replacement ratio of DCLs.
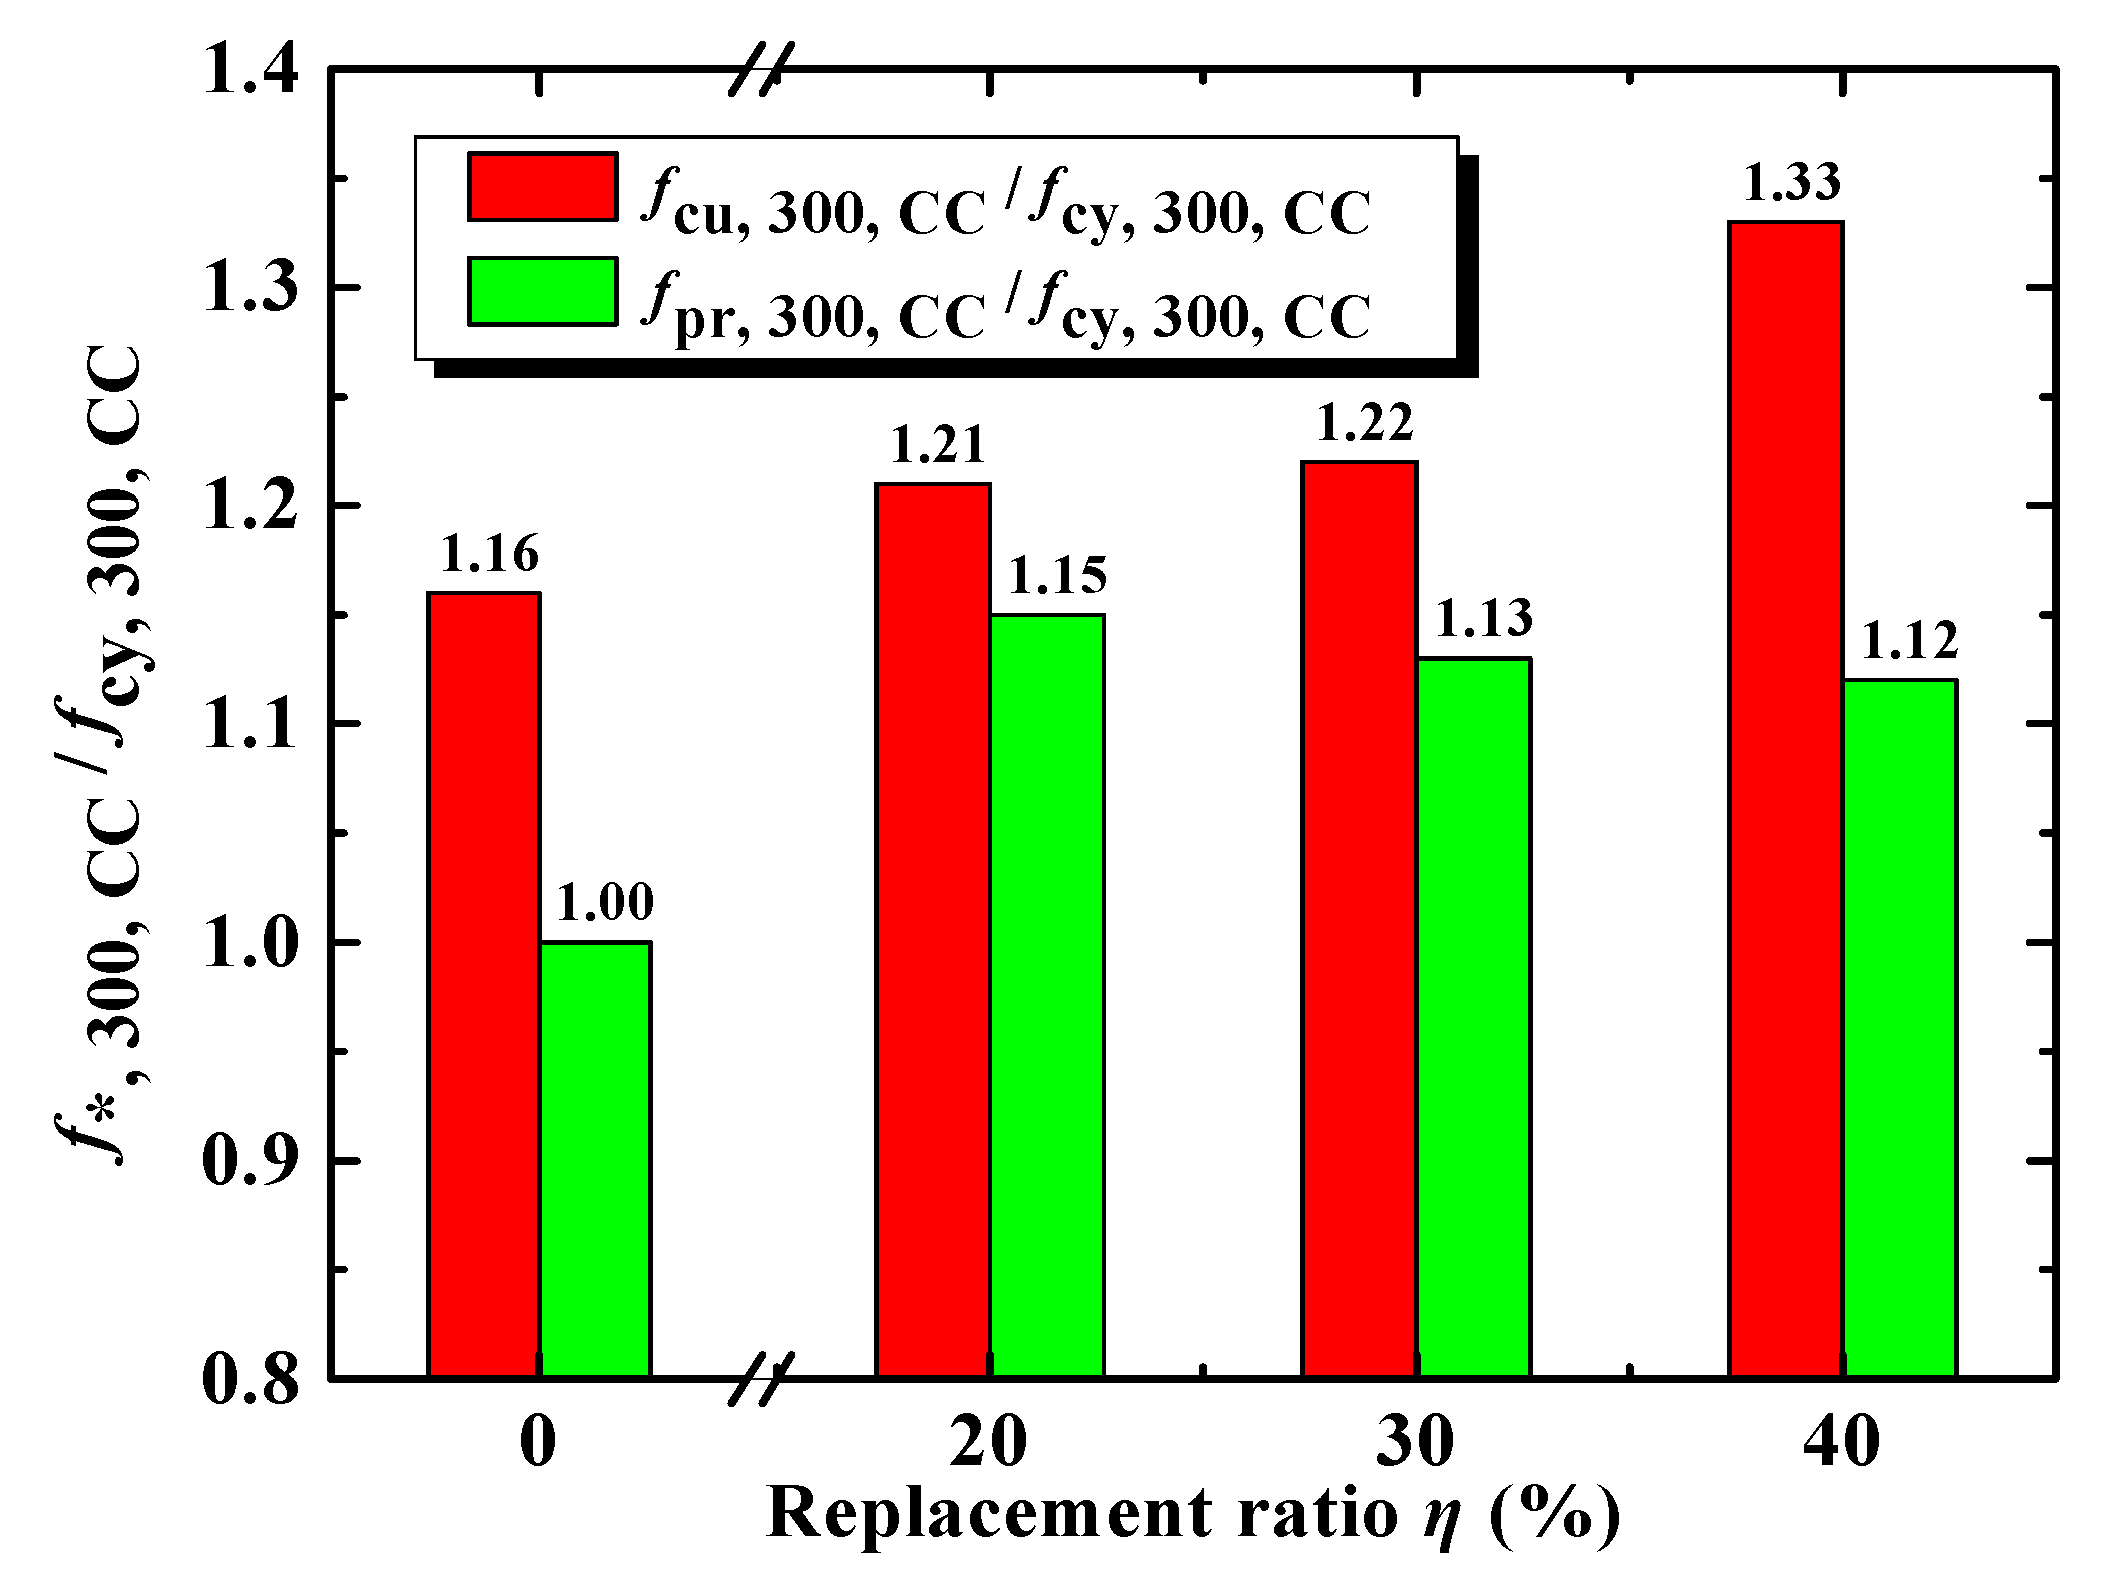
Figure 9.
Variation of relative elastic modulus with replacement ratio of DCLs.

Figure 10.
Shape effect on combined elastic modulus of prisms and cylinders made of DCLs and FC.
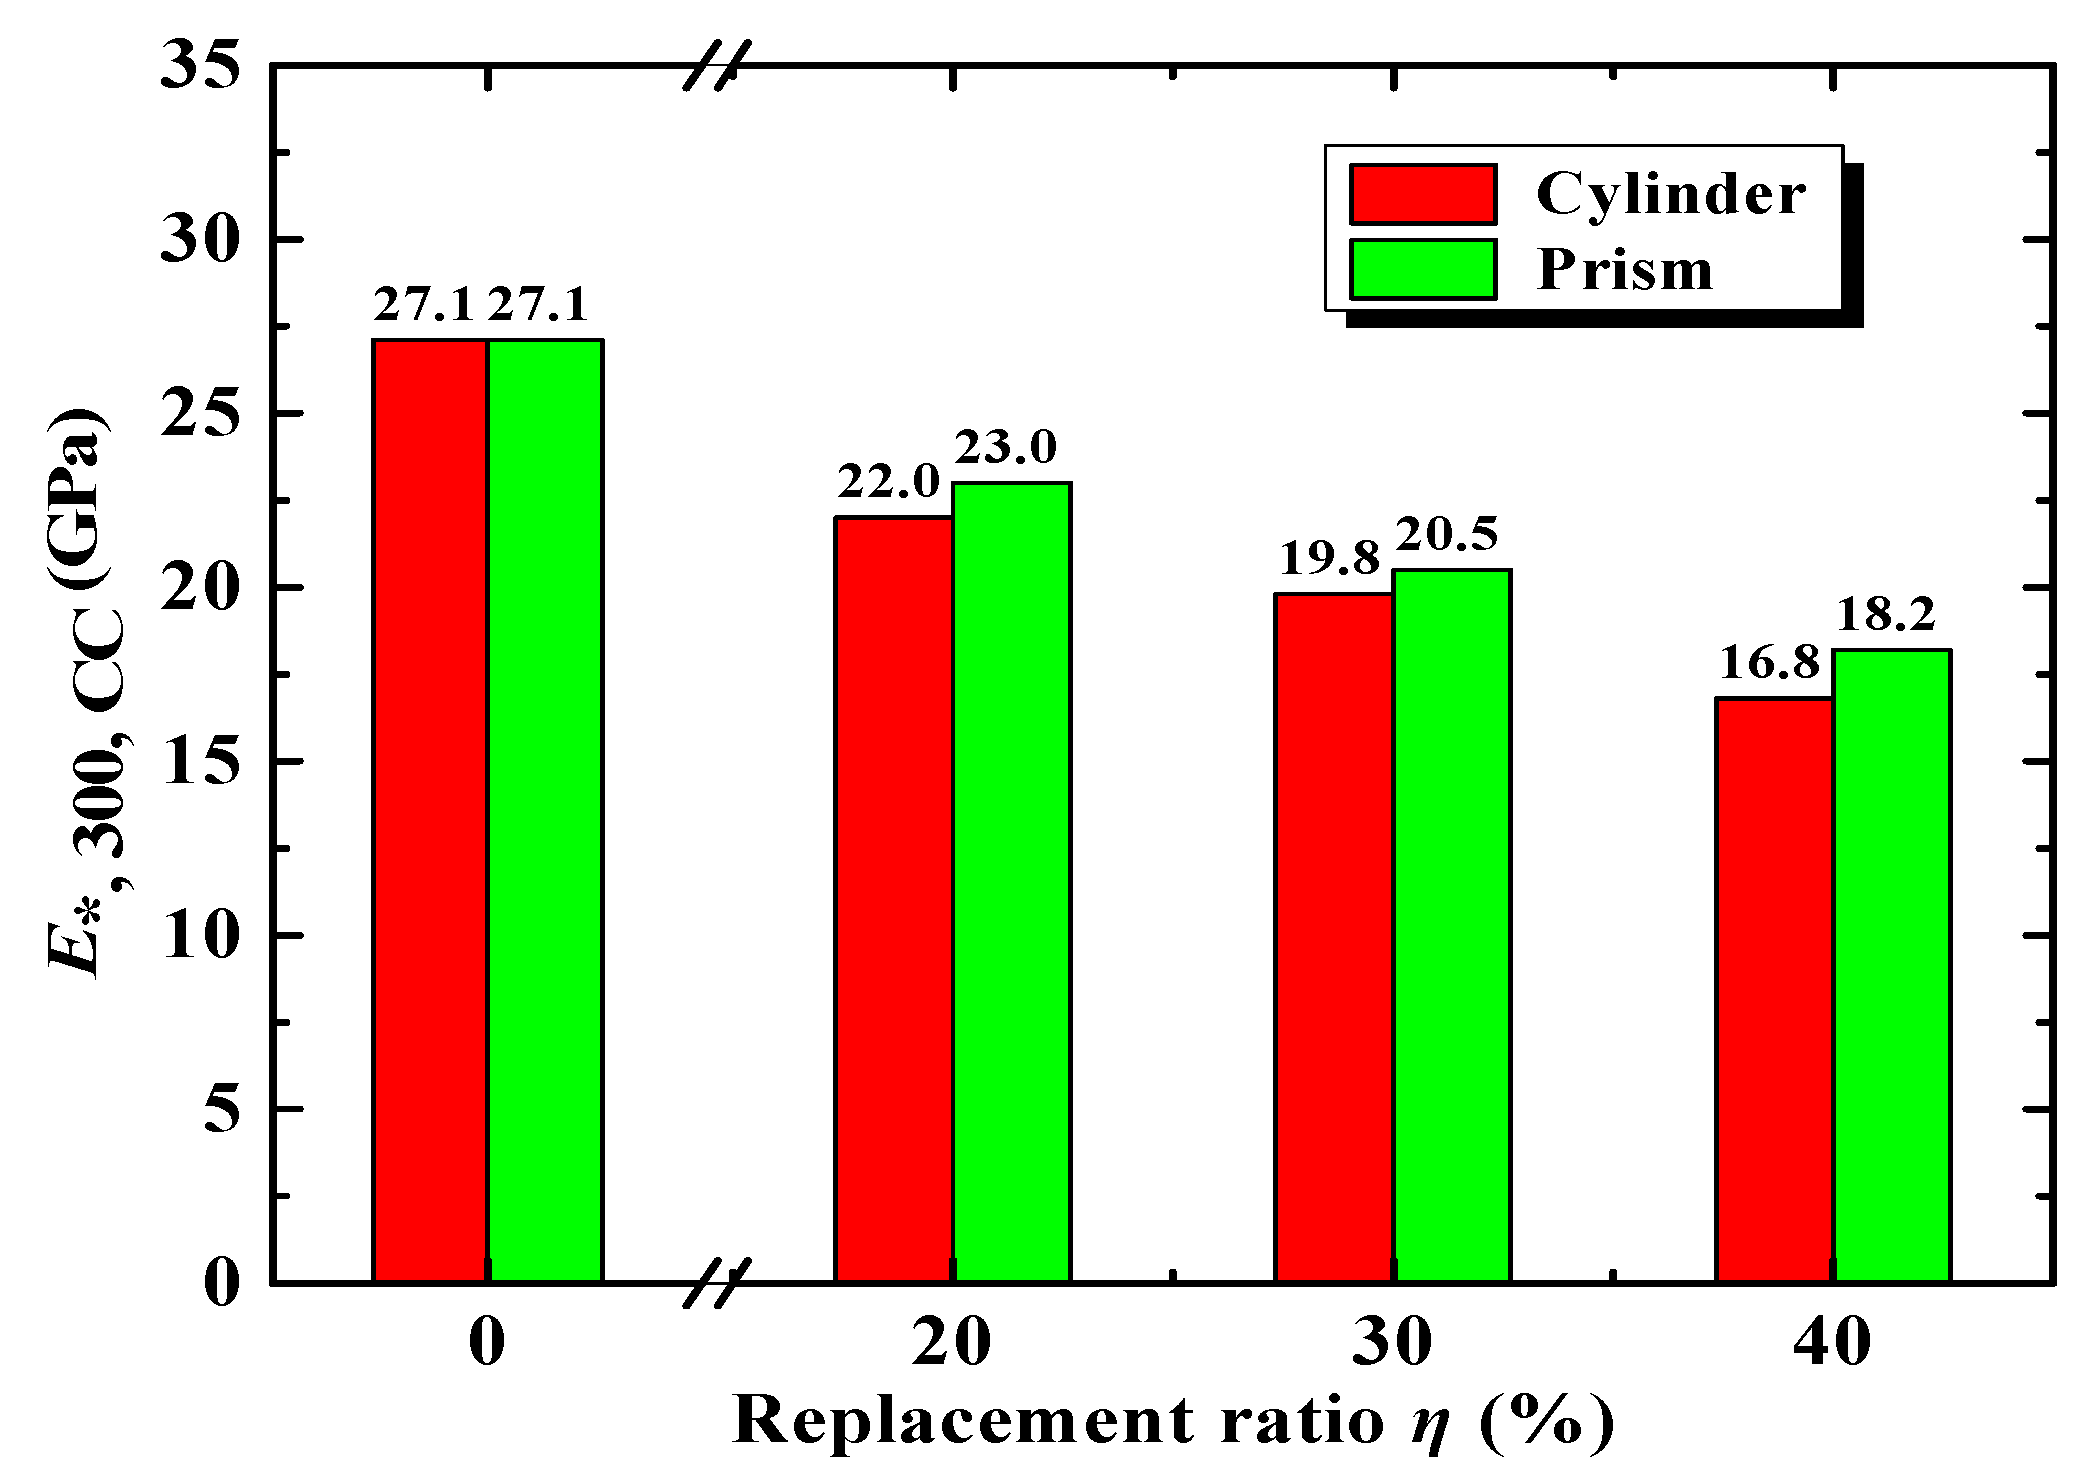
Figure 11.
R and replacement ratio of DCLs.

Figure 12.
Calculated and measured E*,300,CC.

Figure 13.
Variation of combined peak strain with replacement ratio of DCLs.

Figure 14.
Calculated and measured *,300,CC.

Figure 15.
Variation of combined compressive strength of prisms with characteristic ratio.


Table 1.
Mix proportion of fresh concrete (kg/m3).
| Water | Cement | Coarse Aggregate | Sand | Fly Ash | Water Reducer |
|---|---|---|---|---|---|
| 173 | 307 | 1052 | 672 | 86 | 7.06 |
Note: The slump of the used fresh concrete was about 182 mm.
Table 2.
Details of specimens.
| Group | Specimen | Lateral Dimension D (mm) | Replacement Ratio η (%) | Characteristic Size of DCLs d (mm) | Characteristic Ratio β (= d/D) | Number of Specimens |
|---|---|---|---|---|---|---|
| Group 1 | CU150 | 150 | — | — | — | 3 |
| CY150 | 150 | — | — | — | 3 | |
| PR150 | 150 | — | — | — | 3 | |
| CU300 | 300 | — | — | — | 3 | |
| CY300 | 300 | — | — | — | 3 | |
| PR300 | 300 | — | — | — | 3 | |
| Group 2 | CU300 | 300 | 0 | — | — | 3 |
| CU300-100-0.2 | 300 | 20 | 100 | 0.33 | 3 | |
| CU300-100-0.3 | 300 | 30 | 100 | 0.33 | 3 | |
| CU300-100-0.4 | 300 | 40 | 100 | 0.33 | 3 | |
| Group 3 | CY300 | 300 | 0 | — | — | 3 |
| CY300-100-0.2 | 300 | 20 | 100 | 0.33 | 3 | |
| CY300-100-0.3 | 300 | 30 | 100 | 0.33 | 3 | |
| CY300-100-0.4 | 300 | 40 | 100 | 0.33 | 3 | |
| Group 4 | PR300 | 300 | 0 | — | — | 3 |
| PR300-100-0.2 | 300 | 20 | 100 | 0.33 | 3 | |
| PR300-100-0.3 | 300 | 30 | 100 | 0.33 | 3 | |
| PR300-100-0.4 | 300 | 40 | 100 | 0.33 | 3 | |
| Group 5 | PR300-67-0.3 | 300 | 30 | 67 | 0.22 | 3 |
| PR300-100-0.3 | 300 | 30 | 100 | 0.33 | 3 | |
| PR300-133-0.3 | 300 | 30 | 133 | 0.44 | 3 | |
| PR300-167-0.3 | 300 | 30 | 167 | 0.55 | 3 | |
| Group 6 | PR150-50-0.3 | 100 | 30 | 50 | 0.33 | 3 |
| PR200-67-0.3 | 200 | 30 | 67 | 0.33 | 3 | |
| PR300-100-0.3 | 300 | 30 | 100 | 0.33 | 3 | |
| PR400-133-0.3 | 400 | 30 | 133 | 0.33 | 3 | |
| PR500-167-0.3 | 500 | 30 | 167 | 0.33 | 3 |
Table 3.
Experimental results of specimens in Group 1.
| Notation | Serial No. | f*,D,FC (MPa) | *,D,FC (×10−6) | E*,D,FC (GPa) | ||||||
|---|---|---|---|---|---|---|---|---|---|---|
| Mea. | Avg. | Std. | Mea. | Avg. | Std. | Mea. | Avg. | Std. | ||
| 1 | 53.2 | — | — | |||||||
| CU150 | 2 | 54.0 | 53.0 | 0.9 | — | — | — | — | — | — |
| 3 | 51.8 | — | — | |||||||
| 1 | 43.7 | 2487 | 26.9 | |||||||
| CY150 | 2 | 43.3 | 42.4 | 1.6 | 2637 | 2605 | 86 | 27.3 | 26.4 | 1.0 |
| 3 | 40.2 | 2691 | 25.1 | |||||||
| 1 | 41.9 | 2377 | 27.9 | |||||||
| PR150 | 2 | 44.8 | 41.9 | 2.4 | 2266 | 2220 | 150 | 27.4 | 28.8 | 1.6 |
| 3 | 39.0 | 2018 | 31.1 | |||||||
| 1 | 45.2 | — | — | |||||||
| CU300 | 2 | 43.1 | 43.6 | 1.2 | — | — | — | — | — | — |
| 3 | 42.5 | — | — | |||||||
| 1 | 38.2 | 2011 | 28.3 | |||||||
| CY300 | 2 | 37.0 | 37.5 | 0.5 | 2033 | 2067 | 65 | 23.9 | 27.1 | 2.3 |
| 3 | 37.2 | 2158 | 29.2 | |||||||
| 1 | 36.2 | 2090 | 26.4 | |||||||
| PR300 | 2 | 38.7 | 37.4 | 1.0 | 2010 | 2060 | 36 | 29.6 | 27.1 | 1.8 |
| 3 | 37.4 | 2080 | 25.3 | |||||||
Note: Mea., measured value; Avg., average value; Std., standard deviation.
Table 4.
Experimental results of specimens in Group 2, Group 3, and Group 4.
| Group | Notation | Serial No. | f*,300,CC (f*,300,FC) (MPa) | *,300,CC (*,300,FC) (×10−6) | E*,300,CC (E*,300,FC) (GPa) | ||||||
|---|---|---|---|---|---|---|---|---|---|---|---|
| Mea. | Avg. | Std. | Mea. | Avg. | Std. | Mea. | Avg. | Std. | |||
| Group 2 | 1 | 45.2 | — | — | |||||||
| CU300 | 2 | 43.1 | 43.6 | 1.2 | — | — | — | — | — | — | |
| 3 | 42.5 | — | — | ||||||||
| 1 | 38.7 | — | — | ||||||||
| CU300-100-0.2 | 2 | 37.6 | 38.4 | 0.5 | — | — | — | — | — | — | |
| 3 | 38.8 | — | — | ||||||||
| 1 | 35.8 | — | — | ||||||||
| CU300-100-0.3 | 2 | 34.8 | 35.8 | 0.8 | — | — | — | — | — | — | |
| 3 | 36.8 | — | — | ||||||||
| 1 | 36.3 | — | — | ||||||||
| CU300-100-0.4 | 2 | 31.7 | 34.5 | 2.0 | — | — | — | — | — | — | |
| 3 | 35.4 | — | — | ||||||||
| Group 3 | 1 | 38.2 | 2011 | 28.3 | |||||||
| CY300 | 2 | 37.0 | 37.5 | 0.5 | 2033 | 2067 | 65 | 23.9 | 27.1 | 2.3 | |
| 3 | 37.2 | 2158 | 29.2 | ||||||||
| 1 | 31.6 | 2212 | 20.4 | ||||||||
| CY300-100-0.2 | 2 | 31.0 | 31.7 | 0.7 | 2041 | 2170 | 93 | 23.5 | 22.0 | 1.3 | |
| 3 | 32.6 | 2256 | 22.1 | ||||||||
| 1 | 29.8 | 2473 | 18.2 | ||||||||
| CY300-100-0.3 | 2 | 30.1 | 29.5 | 0.5 | 2272 | 2373 | 82 | 21.6 | 19.8 | 1.4 | |
| 3 | 28.6 | 2374 | 19.6 | ||||||||
| 1 | 27.3 | 2160 | 18.1 | ||||||||
| CY300-100-0.4 | 2 | 26.3 | 26.0 | 1.2 | 2665 | 2443 | 211 | 15.7 | 16.8 | 1.0 | |
| 3 | 24.3 | 2505 | 16.6 | ||||||||
| Group 4 | 1 | 36.2 | 2090 | 26.4 | |||||||
| PR300 | 2 | 38.7 | 37.4 | 1.0 | 2010 | 2060 | 36 | 29.6 | 27.1 | 1.8 | |
| 3 | 37.4 | 2080 | 25.3 | ||||||||
| 1 | 36.4 | 2078 | 23.8 | ||||||||
| PR300-100-0.2 | 2 | 36.4 | 36.3 | 0.1 | 2333 | 2251 | 122 | 22.0 | 23.0 | 0.7 | |
| 3 | 36.2 | 2341 | 23.2 | ||||||||
| 1 | 31.9 | 2291 | 19.8 | ||||||||
| PR300-100-0.3 | 2 | 35.0 | 33.4 | 1.3 | 2762 | 2538 | 193 | 20.6 | 20.5 | 0.5 | |
| 3 | 33.2 | 2562 | 21.0 | ||||||||
| 1 | 29.5 | 2589 | 18.7 | ||||||||
| PR300-100-0.4 | 2 | 28.5 | 29.2 | 0.5 | 3136 | 2790 | 246 | 17.2 | 18.2 | 0.7 | |
| 3 | 29.7 | 2646 | 18.6 | ||||||||
Note: Mea., measured value; Avg., average value; Std., standard deviation.
Table 5.
Comparison between predicted and measured combined compressive strengths for specimens in Groups 2, 3, and 4.
Table 5.
Comparison between predicted and measured combined compressive strengths for specimens in Groups 2, 3, and 4.
| Group | Notation | f*,300,DC (MPa) | f*,300,FC (MPa) | f*,300,CC | ||||
|---|---|---|---|---|---|---|---|---|
| Mea. (MPa) | Equation (4) | Equation (8) | ||||||
| Cal. (MPa) | Error (%) | Cal. (MPa) | Error (%) | |||||
| Group 2 | CU300-100-0.2 | 33.6 | 43.6 | 38.4 | 41.6 | 8.3 | 38.6 | 0.5 |
| CU300-100-0.3 | 35.8 | 40.6 | 13.4 | 36.2 | 1.1 | |||
| CU300-100-0.4 | 34.5 | 39.6 | 14.8 | 33.9 | –1.4 | |||
| Group 3 | CY300-100-0.2 | 28.8 | 37.5 | 31.7 | 34.9 | 10.0 | 32.3 | 1.8 |
| CY300-100-0.3 | 29.5 | 32.7 | 10.9 | 29.2 | –1.2 | |||
| CY300-100-0.4 | 26.0 | 30.0 | 15.5 | 25.7 | –1.0 | |||
| Group 4 | PR300-100-0.2 | 28.8 | 37.4 | 36.3 | 39.6 | 9.0 | 36.6 | 0.9 |
| PR300-100-0.3 | 33.4 | 37.5 | 12.4 | 33.4 | 0.1 | |||
| PR300-100-0.4 | 29.2 | 33.6 | 15.1 | 28.8 | –1.3 | |||
Note: Mea., measured value; Cal., calculated value.
Table 6.
Experimental results of specimens in Group 5.
| Group | Notation | Serial No. | fpr,300,CC (MPa) | pr,300,CC (×10−6) | Epr,300,CC (GPa) | ||||||
|---|---|---|---|---|---|---|---|---|---|---|---|
| Mea. | Avg. | Std. | Mea. | Avg. | Std. | Mea. | Avg. | Std. | |||
| Group 5 | 1 | 34.0 | 2483 | 19.9 | |||||||
| PR300-67-0.3 | 2 | 33.6 | 32.8 | 1.4 | 2765 | 2756 | 220 | 19.5 | 18.6 | 1.5 | |
| 3 | 30.8 | 3021 | 16.5 | ||||||||
| 1 | 31.9 | 2291 | 19.8 | ||||||||
| PR300-100-0.3 | 2 | 35.0 | 33.4 | 1.3 | 2762 | 2538 | 193 | 20.6 | 20.5 | 0.5 | |
| 3 | 33.2 | 2562 | 21.0 | ||||||||
| 1 | 31.8 | 2533 | 18.9 | ||||||||
| PR300-133-0.3 | 2 | 33.9 | 32.5 | 1.0 | 2660 | 2624 | 65 | 18.1 | 18.2 | 0.6 | |
| 3 | 31.9 | 2678 | 17.5 | ||||||||
| 1 | 31.7 | 2362 | 20.2 | ||||||||
| PR300-167-0.3 | 2 | 28.4 | 30.3 | 1.4 | 2881 | 2495 | 277 | 20.6 | 20.6 | 0.3 | |
| 3 | 30.8 | 2242 | 20.9 | ||||||||
Note: Mea., measured value; Avg., average value; Std., standard deviation.
Table 7.
Experimental results of specimens in Group 6.
| Group | Notation | Serial No. | fpr,com,D (MPa) | εp,pr,com,D (10−6) | Ec,pr,com,D (GPa) | ||||||
|---|---|---|---|---|---|---|---|---|---|---|---|
| Mea. | Avg. | Std. | Mea. | Avg. | Std. | Mea. | Avg. | Std. | |||
| Group 6 | 1 | 27.5 | 3425 | 19.9 | |||||||
| PR150-30-0.3 | 2 | 27.1 | 27.4 | 0.2 | 3802 | 3588 | 158 | 20.9 | 20.5 | 0.4 | |
| 3 | 27.6 | 3537 | 20.8 | ||||||||
| 1 | 29.1 | 3423 | 19.5 | ||||||||
| PR200-67-0.3 | 2 | 32.1 | 30.6 | 1.2 | 3579 | 3425 | 125 | 20.6 | 20.7 | 1.1 | |
| 3 | 30.6 | 3274 | 22.1 | ||||||||
| 1 | 31.9 | 2291 | 19.8 | ||||||||
| PR300-100-0.3 | 2 | 35.0 | 33.4 | 1.3 | 2762 | 2538 | 193 | 20.6 | 20.5 | 0.5 | |
| 3 | 33.2 | 2562 | 21.0 | ||||||||
| 1 | 31.5 | 2326 | 22.0 | ||||||||
| PR400-133-0.3 | 2 | 32.2 | 31.5 | 0.6 | 2357 | 2383 | 60 | 20.3 | 21.2 | 0.7 | |
| 3 | 30.8 | 2467 | 21.4 | ||||||||
| 1 | 27.1 | 1960 | 22.4 | ||||||||
| PR500-167-0.3 | 2 | 30.6 | 29.3 | 1.6 | 2248 | 2102 | 118 | 22.1 | 21.9 | 0.6 | |
| 3 | 30.2 | 2099 | 21.1 | ||||||||
Note: Mea., measured value; Avg., average value; Std., standard deviation.
© 2018 by the authors. Licensee MDPI, Basel, Switzerland. This article is an open access article distributed under the terms and conditions of the Creative Commons Attribution (CC BY) license (http://creativecommons.org/licenses/by/4.0/).
Share and Cite
MDPI and ACS Style
Wu, B.; Yu, Y.; Chen, Z. Compressive Behaviors of Prisms Made of Demolished Concrete Lumps and Fresh Concrete. Appl. Sci. 2018, 8, 743. https://doi.org/10.3390/app8050743
AMA Style
Wu B, Yu Y, Chen Z. Compressive Behaviors of Prisms Made of Demolished Concrete Lumps and Fresh Concrete. Applied Sciences. 2018; 8(5):743. https://doi.org/10.3390/app8050743
Chicago/Turabian StyleWu, Bo, Yong Yu, and Zongping Chen. 2018. "Compressive Behaviors of Prisms Made of Demolished Concrete Lumps and Fresh Concrete" Applied Sciences 8, no. 5: 743. https://doi.org/10.3390/app8050743
Note that from the first issue of 2016, this journal uses article numbers instead of page numbers. See further details here.