Control of Carrier Concentration by Ag Doping in N-Type Bi2Te3 Based Compounds
by
 ,
,
Jae Ki Lee
1, 
Ji Hui Son
1,
Yong-Il Kim
2,
Byungki Ryu
1,
Byung Jin Cho
3,
Sookyung Kim
4,
Su-Dong Park
1 and
Min-Wook Oh
5,* 1
Thermoelectric Conversion Research Center, Korea Electrotechnology Research Institute, Changwon 51543, Korea
2
Center for Convergence Property Measurement, Korea Research Institute of Standards and Science (KRISS), Daejeon 34113, Korea
3
Department of Electrical Engineering, KAIST, Daejeon 34141, Korea
4
Mineral Resources Division, Korea Institute of Geoscience and Mineral Resources, Daejeon 34132, Korea
5
Department of Materials Science and Engineering, Hanbat National University, Daejeon 31458, Korea
*
Author to whom correspondence should be addressed.
Appl. Sci. 2018, 8(5), 735; https://doi.org/10.3390/app8050735
Submission received: 30 March 2018
/
Revised: 23 April 2018
/
Accepted: 3 May 2018
/
Published: 6 May 2018
(This article belongs to the Special Issue Development and Application of Thermoelectric Power Generators, Energy Harvesters and Refrigerators)
Abstract
:Many elements have been used as dopants to enhance the thermoelectric performance of Bi2Te3-related materials. Among them, Ag’s effect on thermoelectric properties, where Ag acts as a donor or acceptor, remains unclear. To elucidate the role of Ag in n-type Bi2Te3 based compounds, Ag was added to n-type (Bi0.9Sb0.1)2(Te0.85Se0.15)3. As the amount of Ag was increased, the electron concentration decreased, which means Ag acted as an acceptor. The added Ag atoms were found to occupy interstitial sites in the hexagonal lattices, as confirmed by X-ray analysis and first principles calculations. The reduction in electron concentration was attributed to the interaction between the interstitial Ag and intrinsic defects.
1. Introduction
Thermoelectric materials have excellent potential to improve levels of global energy consumption by using recovered waste heat to generate power, and enabling all solid-state refrigeration technology [1,2]. To realize this potential, thermoelectric materials are needed which have a large value of the dimensionless figure of merit, ZT = (α2/ρκ) T, where α, ρ, κ, and T are the Seebeck coefficient, electrical resistivity, thermal conductivity, and absolute temperature, respectively [1]. Bi2Te3-based compounds have been widely used for room temperature applications, and many studies have been performed in efforts to improve their ZT [3,4,5,6,7,8,9,10,11]. Strategies to achieve large ZT have mainly focused on two schemes: (a) enhancing the power factor (PF = α2/ρ); and (b) reducing phonon thermal conductivity (κρ). However, before attempting to enhance PF with novel technologies such as nanostructures and band structure engineering, the carrier concentration should be optimized. Appropriate control of carrier concentration is one of the prerequisites for achieving enhanced ZT.
Doping is one of the routes that can be used to control carrier concentration. The full or partial ionization of donor and acceptor dopants creates electrons and holes, respectively. As examples, Fe was substituted for Bi as a donor type dopant [9,12], while Pb has been substituted for Bi as an acceptor [13]. Interstitial Cu acted as the donors in Bi2Te3 [14,15].
Among the many studies on dopants in Bi2Te3, the effects of Ag on the transport properties of Bi2Te3-based materials have been frequently reported. Park et al. reported that the addition of Ag (0.01–0.2 wt %) decreased electrical resistivity and the Seebeck coefficient, an effect which they attributed to the Ag particles, which did not substitute for Bi or Sb [16]. Lee et al. reported that ρ and α decreased with Ag, which substituted for Bi or Sb in p-type (Bi,Sb)2Te3 [17]. The substitution of Ag for Bi or Sb was also reported by Klichová et al. [18]. All of these results said that the Ag acted as an acceptor in the p-type (Bi,Sb)2Te3 compounds.
For n-type Bi2Te3, a different Ag behavior has been reported. Navrátil et al. found that interstitial Ag was formed in n-type Bi2Te3 and behaved as a donor, while Ag behaved as an acceptor in Sb2Te3 [19]. Yang et al. reported that interstitial Ag formed in n-type Bi2(Te,Se)3 and acted as an n-type donor when Ag content was less than 0.2 wt %, and like a p-type acceptor at higher Ag content (> 0.2 wt %) [20]. However, both studies deduced the existence of interstitial Ag by investigating electrical transport properties, and there was no direct evidence to confirm that interstitial Ag formed in the Bi2Te3 unit cell. They noted that electrical conductivity and electron concentration increased after the addition of Ag to n-type Bi2Te3 and then they argued that the electrons were donated by the interstitial Ag. Lu et al. reported that even though interstitial Ag was formed in the n-type Bi2(Te,Se)3, the electron concentration was reduced when Ag content was less than 0.5 wt %., while the concentration increased with higher Ag content (>0.5 wt %) [21]. Controversy about the effect of Ag in n-type Bi2(Te,Se)3 has arisen; low Ag content has been reported to reduce electron concentration [21] and to increase electron concentration [20]. Accordingly, we think that the location of Ag in the Bi2Te3 unit cell, and the effect of Ag on the electrical transport properties, have not been clearly demonstrated.
In this study, Ag was added to n-type Bi2(Te,Se)3 and the effect of the Ag addition on the carrier concentration was investigated. With both experimental and theoretical investigations, we tried to establish whether Ag occupies a position in the Bi2Te3 unit cell and acts as an acceptor or donor. We also focused on new findings, that the dopant can control the concentration of native defects in Bi2Te3, and that the dopant can donate carriers through ionization.
2. Materials and Methods
Commercial 99.999% high purity elements of Bi, Sb, Te, Se, and 99.99% Ag were weighed according to the stoichiometry of (Bi0.9Sb0.1)2(Te0.85Se0.15)3 + Ag. The amounts of added Ag were chosen to be 0, 0.005, 0.01, 0.03, 0.05 wt %. Sb and Se were added to Bi2Te3, because we wished to investigate the effect of Ag on the transport properties of compounds that were close to the conventionally used composition [22]. The mixed elements were loaded into quartz tubes and sealed under Ar atmosphere. Using a rocking furnace, the mixtures were heated to 1073 K for 10 h. After water quenching, the ingots were crushed by ball milling for 2 h under Ar atmosphere to prevent oxidation. The powders were sintered at 693 K for 30 min at a pressure of 200 MPa using a hot press, and obtained n-type Bi2Te3 bulk materials. These bulk materials were analyzed by X-ray diffraction (X’pert, Malvern Panalytical, Almero, the Netherlands) using Cu Kα radiation (λ = 0.15406 nm) to determine their crystal structure. Their electrical conductivity and Seebeck coefficient were measured using ZEM-3 (Ulvac-Riko, Yokohama, Japan). The carrier concentration was measured by the Hall effect at room temperature under 0.55T (HMS-3000, ECOPIA, Anyang, Korea). The first-principles calculations were performed using the Vienna ab initio simulation package (VASP) code [23,24]. A supercell containing 60 atoms in a hexagonal cell was used to evaluate the formation energy of defects and Ag occupation. A plane wave cutoff of 350 eV and a k-point mesh grid of 7 × 7 × 2 were used to ensure energy convergence [7]. The van der Waals interaction set out by Tkatchenko and Scheffler within GGA was used in the structural optimization [25,26].
3. Results and Discussions
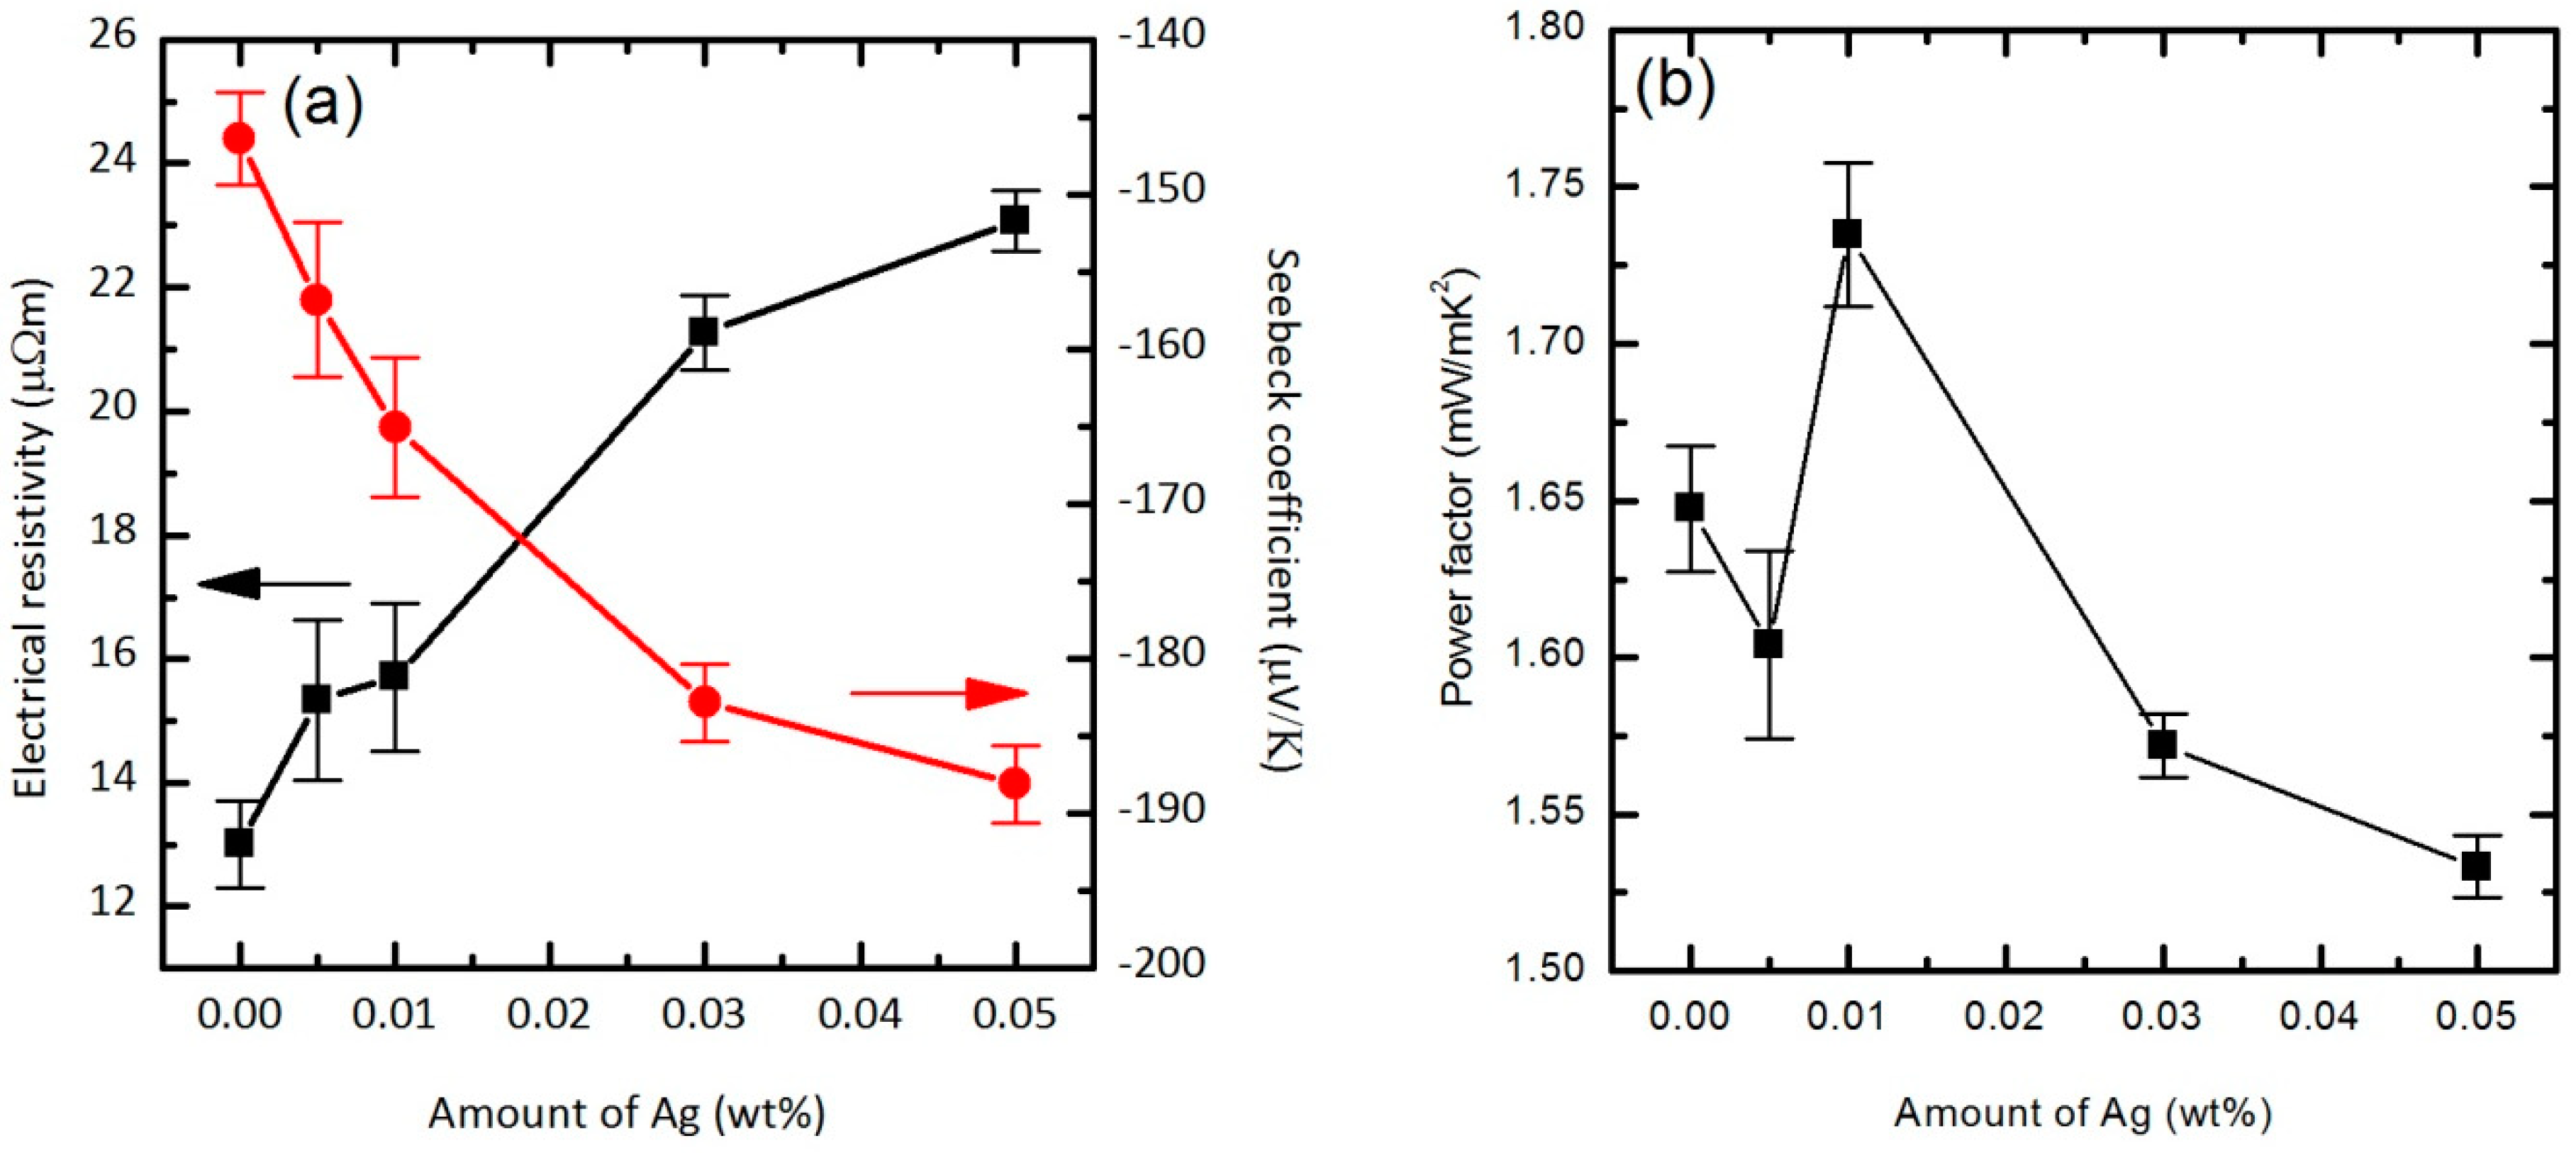
Figure 1a shows the temperature dependence of the electrical resistivity and the Seebeck coefficient. The negative Seebeck coefficient indicates that the major carriers are electrons. As the amount of Ag is increased, the value of the electrical resistivity is increased. The absolute value of the Seebeck coefficient increased with Ag content. Both the increases in electrical resistivity and Seebeck coefficient with Ag may be attributed to a reduction in carrier concentration, because the electrical resistivity and the Seebeck coefficient are approximately proportional to n−1 and n−2/3, respectively [1]; this will be also supported by the measurement of the Hall coefficient.
A reduction in electron concentration is responsible for an increase in electrical resistivity and Seebeck coefficient, which is generally acceptable for the transport properties within the considered carrier concentration in the Bi2Te3-related compounds [27].
The power factor (α2/σ) is shown in Figure 1b. It is well known that the values are dependent on the carrier concentration and show maximum values at the optimized concentration [1]. The maximum value of 1.73 mW/mK2 was achieved in the 0.01 wt % Ag sample.
Figure 2 shows the carrier concentration of samples as determined from the Hall coefficient (RH) measurement. All of the Hall coefficient values were negative, which means electrons were the dominant carriers. The electron concentrations were evaluated using RH = 1/ne, where n is the electron concentration and e is the charge of the electrons. As the amount of Ag increased, the electron concentrations decreased. Thus, the increases in electrical resistivity and Seebeck coefficient are due to the reduction in carrier concentration with Ag.
In order to understand the origin of this reduction in electron concentrations, changes in the crystal structure that occurred with Ag doping were analyzed. Figure 3 shows the observed XRD and Rietveld refinement patterns of Bi2Te3, and the refined structural parameters are shown in Table 1 [28]. Even though Bi, Sb, Te, and Se atoms exist at the lattice sites, a refinement was performed for the hexagonal R-3m structure with Bi in the 6c (0, 0, z(Bi)) sites, Te(1) in the 3a (0, 0, 0) sites, and Te(2) in the 6c (0, 0, z(Te)) sites. The refined lattice parameters of both the a and c axes were smaller than those of Bi2Te3, and this was attributed to the small amounts of Sb and Se substituted for Bi and Te, respectively. Because the covalent radius of Sb (139 pm) and Se (120 pm) is smaller than that of Bi (148 pm) and Te (138 pm), respectively, the lattice parameters will be decreased with Se [29].
The lattice parameters of the Ag-doped samples were also obtained with a Rietveld refinement and the results are shown in Table 2. The lattice parameters of the c-axis significantly increased with Ag, while the values of the a-axis were nearly the same. It should be noted that the covalent radius of Bi is significantly larger than that of Ag, resulting in a reduction of the lattice parameter if Ag is substituted for Bi. Thus, this anisotropic change and the increase in the lattice parameters indicate that Ag was not substituted for Bi. It is believed that Ag is located at the interstitial sites (0, 0, 0.5 in fractional coordinates) which are also known as van der Waals gaps, due to van der Waals bonding character between Te(2) and Te(2) atoms.
In order to elucidate the Ag interstitial occupation, the formation energy of Ag in Bi2Te3 and its structural properties were evaluated using first-principles calculations. The lattice parameters and the formation energy obtained from the first-principles calculations are shown in Table 3. The only increase in the lattice parameter of the c-axis was for Ag-interstitial (Agi), while this value decreased for the other models. It is fairly difficult to compare the absolute value of the differences in the lattice parameters with the experimental calculations, because the amount of Ag in the modeled alloys is much larger than that in the experiment. The results of the formation energy also support Agi in Bi2Te3. The lowest energy of formation was obtained for Agi.
From the results of the lattice parameters and the first-principles calculations, it may be thought that the reduction in electron concentrations is due to the Ag-interstitial. However, it can be expected that metal atoms at the interstitial site will donate electrons, following the reaction equation
where Ags means solid and nonactivated Ag atoms. Accordingly, if Ag is interstitial, electron concentrations should increase with Ag, which is contrary to the results of the transport properties.
To understand the mechanism for the change in carrier concentration with Ag addition, we then considered the intrinsic defects, because the carrier concentrations in Bi2Te3 related compounds are mainly determined by such defects. For n-type transport properties, it is known that the n-type TeBi antisite defects (Te at Bi sites) are the first major defects, and the second major defects are the n-type vacancies of Te (VTe) [7,30,31,32]. Because the concentration of antisite defects is highly dependent on the average difference in electronegativity between cations and anions [7,9], in Bi2Te3 dopants such as In and Pb interact with the native defects, and this changes the concentration of the defects [9,13,33].
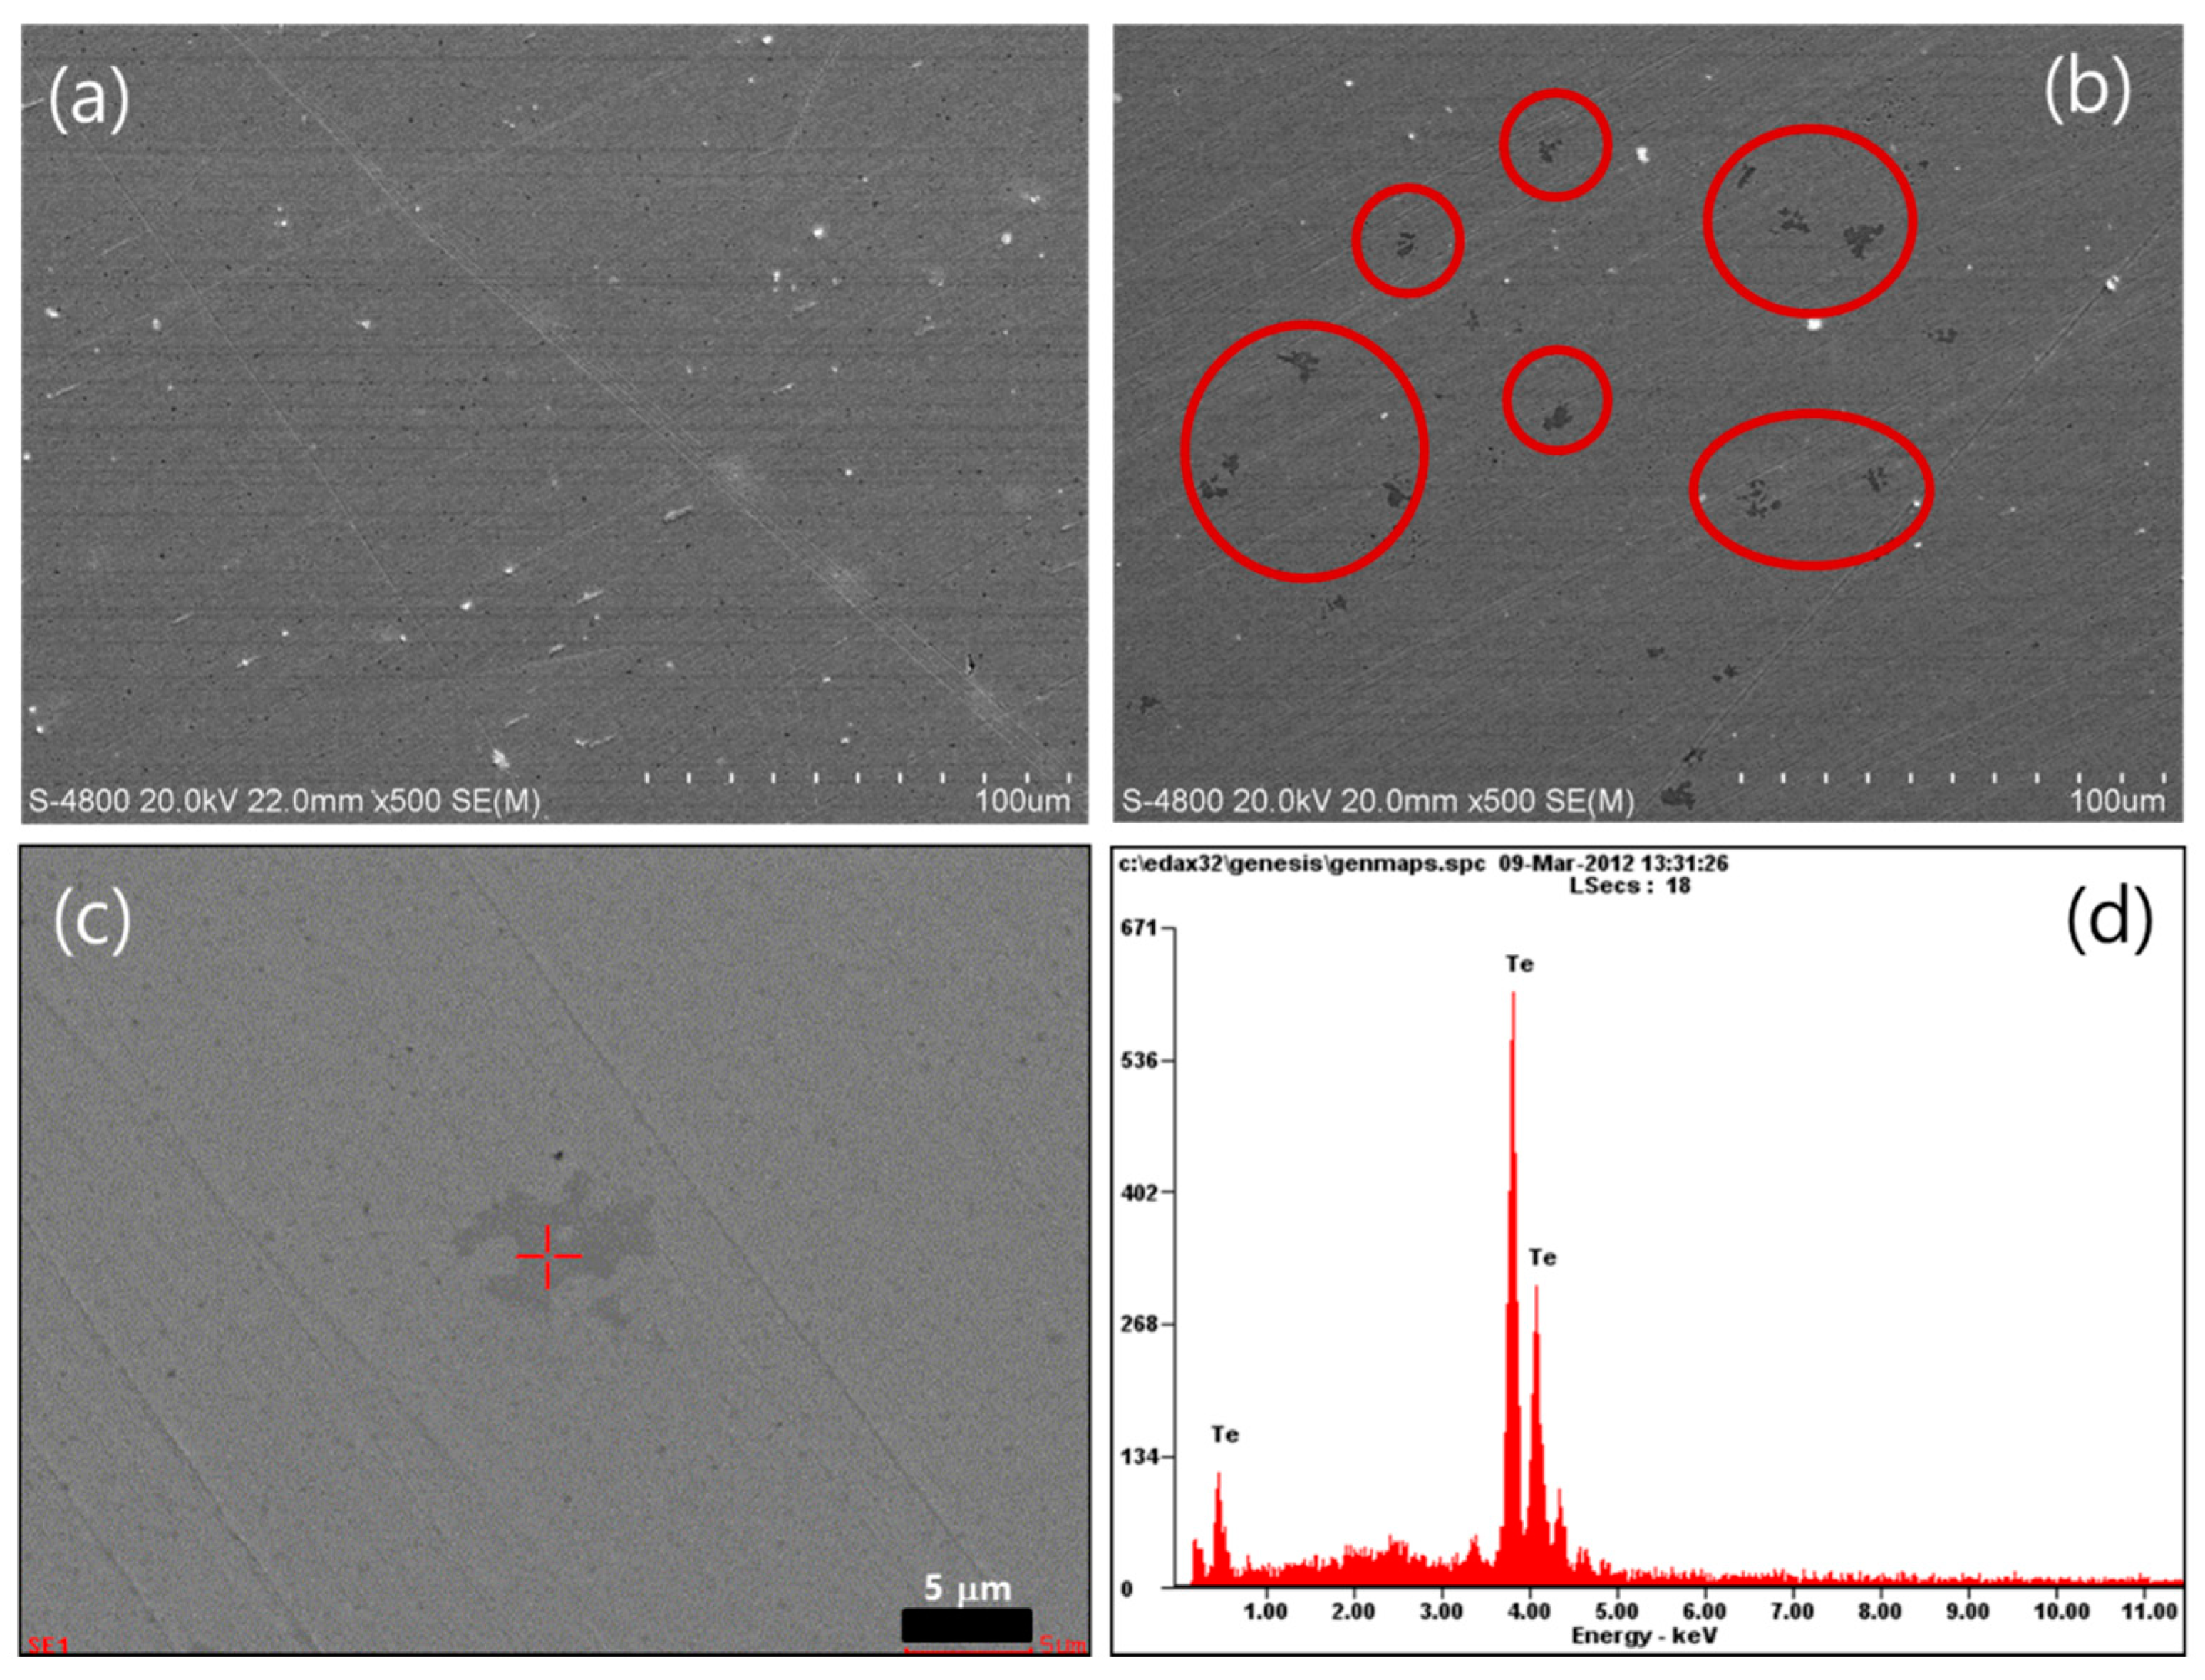
It was thought that the addition of Ag might also interact with the antisite defects or vacancies, resulting in a reduction in electron concentration. We subsequently confirmed the interaction of Ag with the defects. The Te metal phase in the samples with Ag was clearly observed in SEM images, as shown in Figure 4. The interaction of Ag with TeBi decreased the concentration of TeBi so that the remaining Te, which could not be included in the lattice, was then expelled as a metal phase.
However, it is also important to consider the possibility of interaction between the Ag interstitials and VTe. Lu et al. reported that interstitial Ag might increase the formation energy of VTe and suppress the formation of VTe and in turn electron concentration was decreased [21]. The reactions between Agi and the defects are proposed below
The coefficients of x and y indicate how efficiently the formation of TeBi and VTe was suppressed by Agi [21].
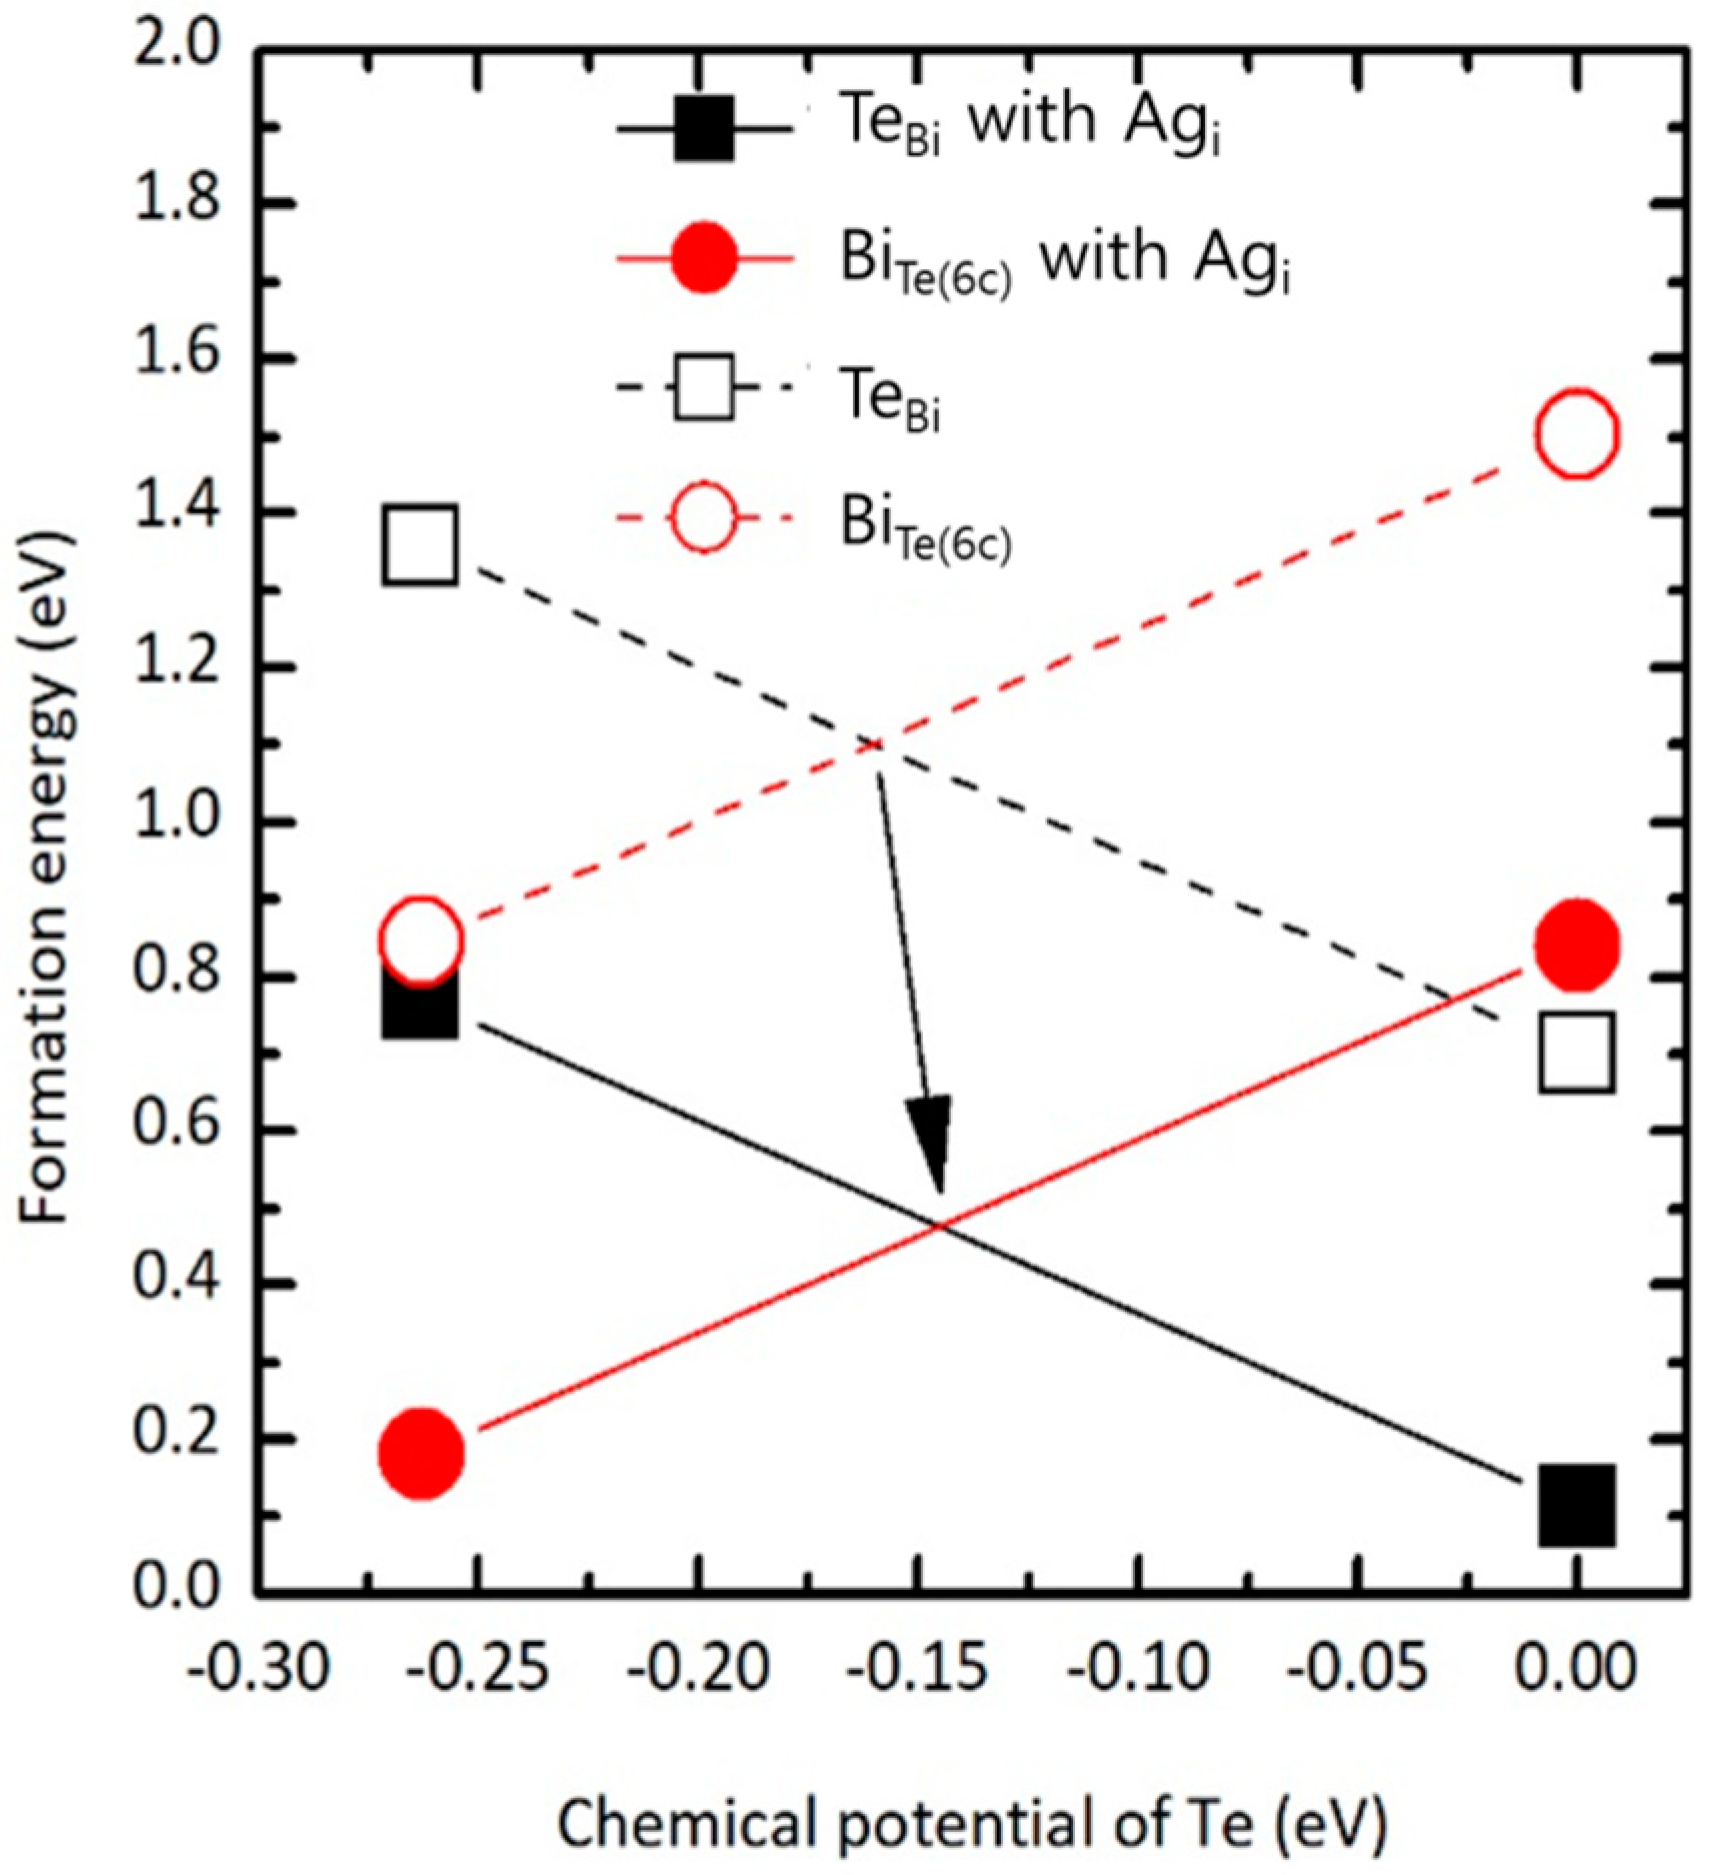
The interaction of Ag and antisite defects was investigated using the formation energy obtained from the first-principles calculations in Figure 5. In the formation energy calculations, we only considered antisite defects because the calculations always confirmed that antisite defects were the major defects. The absolute values of TeBi and BiTe decreased with Ag. The relative reduction in energy after the incorporation of Agi was larger in BiTe than that in TeBi: the reduction was 0.71 and 0.59 eV for BiTe and TeBi, respectively, which means that Agi stabilized BiTe as compared with TeBi. The major defect in the Te-rich condition was TeBi, regardless of Agi. However, the chemical potential of Te (µTe) varied with dopants such as Sb and Se, and fabrication condition. The µTe region between 0 eV (Te metal) and the cross point of the two lines of TeBi and BiTe means that TeBi is more preferred than BiTe. It should be noted that the region decreased with Agi. Therefore, we also confirmed that Agi acts as a stabilizer of BiTe.
In p-type Bi2Te3, it was reported that Ag was substituted for Bi or Sb, which is contrary to the results in this study. The difference in the position occupied by Ag between p- and n-type Bi2Te3 is possibly due to the lattice parameters. The c-axis lattice parameters of the p-type are significantly smaller than that of the n-type, because the covalent radius of Sb is smaller than that of Bi, and 75% Sb2Te3 is added to Bi2Te3 for p-type transport. Thus, Ag needs more energy to enlarge the unit cell to occupy the interstitial position in the smaller unit cell. We confirmed that the formation energy of AgBi ranged from 1.09 to 1.07 eV as the c-axis varied from 30.468 to 30.497 Å, whereas the energy of Agi ranged from 1.48 to 1.45 eV. Even though Agi is more stable in the enlarged cell, AgBi is more preferred than Agi in the reduced cell.
4. Conclusions
In summary, the variation in carrier concentration with Ag addition in n-type Bi2Te3 was examined by various measurements including electrical resistivity, the Seebeck coefficient, and the Hall coefficient. The electron concentrations in n-type Bi2Te3 decreased with Ag addition. The Ag atoms occupied interstitial positions in the Bi2Te3 unit cell. It was confirmed that Ag did not directly induce the change in carrier concentration by its ionization, but by affecting the formation of defects. The carrier concentration was determined by the interaction between Ag and the defects.
Author Contributions
M.W.O., B.R., S.K.K., and S.D.P. conceived and designed the experiments; J.H.S. performed the transport properties measurement and preparation of materials; B.R. contributed to calculations; J.K.L., M.W.O., and B.J.C. analyzed the data; Y.I.K performed X-ray analysis; J.K.L. and M.W.O. contributed to the paper writing.
Acknowledgments
This research was supported by the research fund of a National Research Foundation of Korea (NRF) grant funded by the Korean Government (NRF-2015R1A5A1036133).
Conflicts of Interest
The authors declare no conflict of interest.
References
- Snyder, G.J.; Toberer, E.S. Complex thermoelectric materials. Nat. Mater. 2008, 7, 105–114. [Google Scholar] [CrossRef] [PubMed]
- Sales, B.C. Smaller Is Cooler. Science 2002, 295, 1248–1249. [Google Scholar] [CrossRef] [PubMed]
- Poudel, B.; Hao, Q.; Ma, Y.; Lan, Y.; Minnich, A.; Yu, B.; Yan, X.; Wang, D.; Muto, A.; Vashaee, D.; et al. High-Thermoelectric Performance of Nanostructured Bismuth Antimony Telluride Bulk Alloys. Science 2008, 320, 634–638. [Google Scholar] [CrossRef] [PubMed]
- Seo, S.; Jeong, Y.; Oh, M.W.; Yoo, B. Effect of hydrogen annealing of ball-milled Bi0.5Sb1.5Te3 powders on thermoelectric properties. J. Alloys Compd. 2017, 706, 576–583. [Google Scholar] [CrossRef]
- Seo, S.; Oh, M.W.; Jeong, Y.; Yoo, B. A hybrid method for the synthesis of small Bi0.5Sb1.5Te3 alloy particles. J. Alloys Compd. 2017, 696, 1151–1158. [Google Scholar] [CrossRef]
- Kim, S.J.; Choi, H.; Kim, Y.; We, J.H.; Shin, J.S.; Lee, H.E.; Oh, M.W.; Lee, K.J.; Cho, B.J. Post ionized defect engineering of the screen-printed Bi2Te2.7Se0.3 thick film for high performance flexible thermoelectric generator. Nano Energy 2017, 31, 258–263. [Google Scholar] [CrossRef]
- Oh, M.W.; Son, J.H.; Kim, B.S.; Park, S.D.; Min, B.K.; Lee, H.W. Antisite defects in n-type Bi2(Te, Se)3: Experimental and theoretical studies. J. Appl. Phys. 2014, 115, 133706. [Google Scholar] [CrossRef]
- Seo, S.; Lee, K.; Jeong, Y.; Oh, M.W.; Yoo, B. Method of efficient Ag doping for Fermi level tuning of thermoelectric Bi0.5Sb1.5Te3 alloys using a chemical displacement reaction. J. Phys. Chem. C 2015, 119, 18038–18045. [Google Scholar] [CrossRef]
- Son, J.H.; Oh, M.W.; Kim, B.S.; Park, S.D.; Min, B.K.; Kim, M.H.; Lee, H.W. Effect of ball milling time on the thermoelectric properties of p-type (Bi,Sb)2Te3. J. Alloys Compd. 2013, 566, 168–174. [Google Scholar] [CrossRef]
- Ryu, B.; Oh, M.W. Computational Simulations of Thermoelectric Transport Properties. J. Korean Ceram. Soc. 2016, 53, 273–281. [Google Scholar] [CrossRef]
- Lee, K.H.; Kim, S.W. Design and Preparation of High-Performance Bulk Thermoelectric Materials with Defect Structures. J. Korean Ceram. Soc. 2017, 54, 75–85. [Google Scholar] [CrossRef]
- Kulbachinskii, V.A.; Kaminskii, A.Y.; Kindo, K.; Narumi, Y.; Suga, K.; Lostak, P.; Svanda, P. Ferromagnetism in new diluted magnetic semiconductor Bi2−xFexTe3. Physica B 2002 311, 292–297. [CrossRef]
- Plecháček, T.; Navrátil, J.; Horák, J.; Lošťák, P. Defect structure of Pb-doped Bi2Te3 single crystals. Philos. Mag. 2004, 84, 2217–2228. [Google Scholar] [CrossRef]
- Han, M.K.; Ahn, K.; Kim, H.J.; Rhyee, J.S.; Kim, S.J. Formation of Cu nanoparticles in layered Bi2Te3 and their effect on ZT enhancement. J. Mater. Chem. 2011, 21, 11365–11370. [Google Scholar] [CrossRef]
- Liu, W.S.; Zhang, Q.; Lan, Y.; Chen, S.; Yan, X.; Zhang, Q.; Wang, H.; Wang, D.; Chen, G.; Ren, Z. Thermoelectric property studies on Cu-doped n-type CuxBi2Te2.7Se0.3 nanocomposites. Adv. Energy Mater. 2011, 1, 577–587. [Google Scholar] [CrossRef]
- Park, Y.H.; Liu, X.D. Thermoelectric Properties of Bi-Sb-Te-X Compounds Prepared by MA-PDS Method. Mater. Res. Soc. Symp. Proc. 2002, 691. [Google Scholar] [CrossRef]
- Lee, J.K.; Park, S.D.; Kim, B.S.; Oh, M.W.; Cho, S.H.; Min, B.K.; Lee, H.W.; Kim, M.H. Control of thermoelectric properties through the addition of Ag in the Bi0.5Sb1.5Te3 alloy. Electron. Mater. Lett. 2010, 6, 201–207. [Google Scholar] [CrossRef]
- Klichová, I.; Loš;ťák, P.; Drašar, Č.; Navrátil, J.; BeneŠ, L.; Šrámková, J. Characterization of Ag-doped Sb1.5Bi0.5Te3 single crystals. Radiat. Eff. Defects Solids 1998, 145, 245–262. [Google Scholar] [CrossRef]
- Navrátil, J.; Klichová, I.; Karamazov, S.; Šrámková, J.; Horák, J. Behavior of Ag Admixtures in Sb2Te3and Bi2Te3 Single Crystals. J. Solid State Chem. 1998, 140, 29–37. [Google Scholar] [CrossRef]
- Yang, J.; Chen, R.; Fan, X.; Bao, S.; Zhu, W. Thermoelectric properties of silver-doped n-type Bi2Te3-based material prepared by mechanical alloying and subsequent hot pressing. J. Alloys Compd. 2006, 407, 330–333. [Google Scholar] [CrossRef]
- Lu, M.P.; Liao, C.N.; Huang, J.Y.; Hsu, H.C. Thermoelectric Properties of Ag-Doped Bi2(Se,Te)3 Compounds: Dual Electronic Nature of Ag-Related Lattice Defects. Inorg. Chem. 2015, 54, 7438–7444. [Google Scholar] [CrossRef] [PubMed]
- Nolas, G.S.; Sharp, J.; Goldsmid, J. Thermoelectrics: Basic Principles and New Materials Developments, 1st ed.; Springer: Heidelberg, Germany, 2001; pp. 111–131. ISBN 3-540-41245-X. [Google Scholar]
- Kresse, G.; Hafner, J. Ab initio molecular dynamics for liquid metals. Phys. Rev. B 1993, 47, R558. [Google Scholar] [CrossRef]
- Kresse, G.; Hafner, J. Ab initio molecular-dynamics simulation of the liquid-metal–amorphous-semiconductor transition in germanium. Phys. Rev. B 1994, 49, 14251. [Google Scholar] [CrossRef]
- Tkatchenko, A.; Scheffler, M. Accurate Molecular Van Der Waals Interactions from Ground-State Electron Density and Free-Atom Reference Data. Phys. Rev. Lett. 2009, 102, 073005. [Google Scholar] [CrossRef] [PubMed]
- Perdew, J.P.; Burke, K.; Ernzerhof, M. Generalized Gradient Approximation Made Simple. Phys. Rev. Lett. 1996, 77, 3865. [Google Scholar] [CrossRef] [PubMed]
- Scherrer, H.; Scherrer, S. CRC Handbook of Thermoelectrics, 1st ed.; Rowe, D.M., Ed.; CRC Press: Boca Raton, FL, USA, 1995; pp. 211–237. ISBN 0-8493-0146-7. [Google Scholar]
- Toby, B.H. EXPGUI, a graphical user interface for GSAS. J. Appl. Crystallogr. 2001, 34, 210–213. [Google Scholar] [CrossRef]
- Cordero, B.; Gómez, V.; Platero-Prats, A.E.; Revés, M.; Echeverria, J.; Cremades, E.; Barragán, F.; Alvarez, S. Covalent radii revisited. Dalton Trans. 2008, 21, 2832. [Google Scholar] [CrossRef] [PubMed]
- Hashibon, A.; Elsässer, C. First-principles density functional theory study of native point defects in Bi2Te3. Phys. Rev. B 2011, 84, 144117. [Google Scholar] [CrossRef]
- West, D.; Sun, Y.Y.; Wang, H.; Bang, J.; Zhang, S.B. Native defects in second-generation topological insulators: Effect of spin-orbit interaction on Bi2Se3. Phys. Rev. B 2012, 86, 121201(R). [Google Scholar] [CrossRef]
- Wang, L.L.; Huang, M.; Thimmaiah, S.; Alam, A.; Bud’ko, S.L.; Kaminski, A.; Lograsso, T.A.; Canfield, P.; Johnson, D.D. Native defects in tetradymite Bi2(TexSe3−x) topological insulators. Phys. Rev. B 2013, 87, 125303. [Google Scholar] [CrossRef]
- Horák, J.; Čermák, K.; Koudelka, L. Energy formation of antisite defects in doped Sb2Te3 and Bi2Te3 crystals. J. Phys. Chem. Solids 1986, 47, 805. [Google Scholar] [CrossRef]
Figure 1.
The variation in electrical resistivity, Seebeck coefficient and power factor at room temperature with respect to the amount of Ag: (a) the electrical resistivity and Seebeck coefficient and (b) the power factor.
Figure 1.
The variation in electrical resistivity, Seebeck coefficient and power factor at room temperature with respect to the amount of Ag: (a) the electrical resistivity and Seebeck coefficient and (b) the power factor.

Figure 2.
Electron concentrations estimated from Hall coefficient as a function of Ag amount.
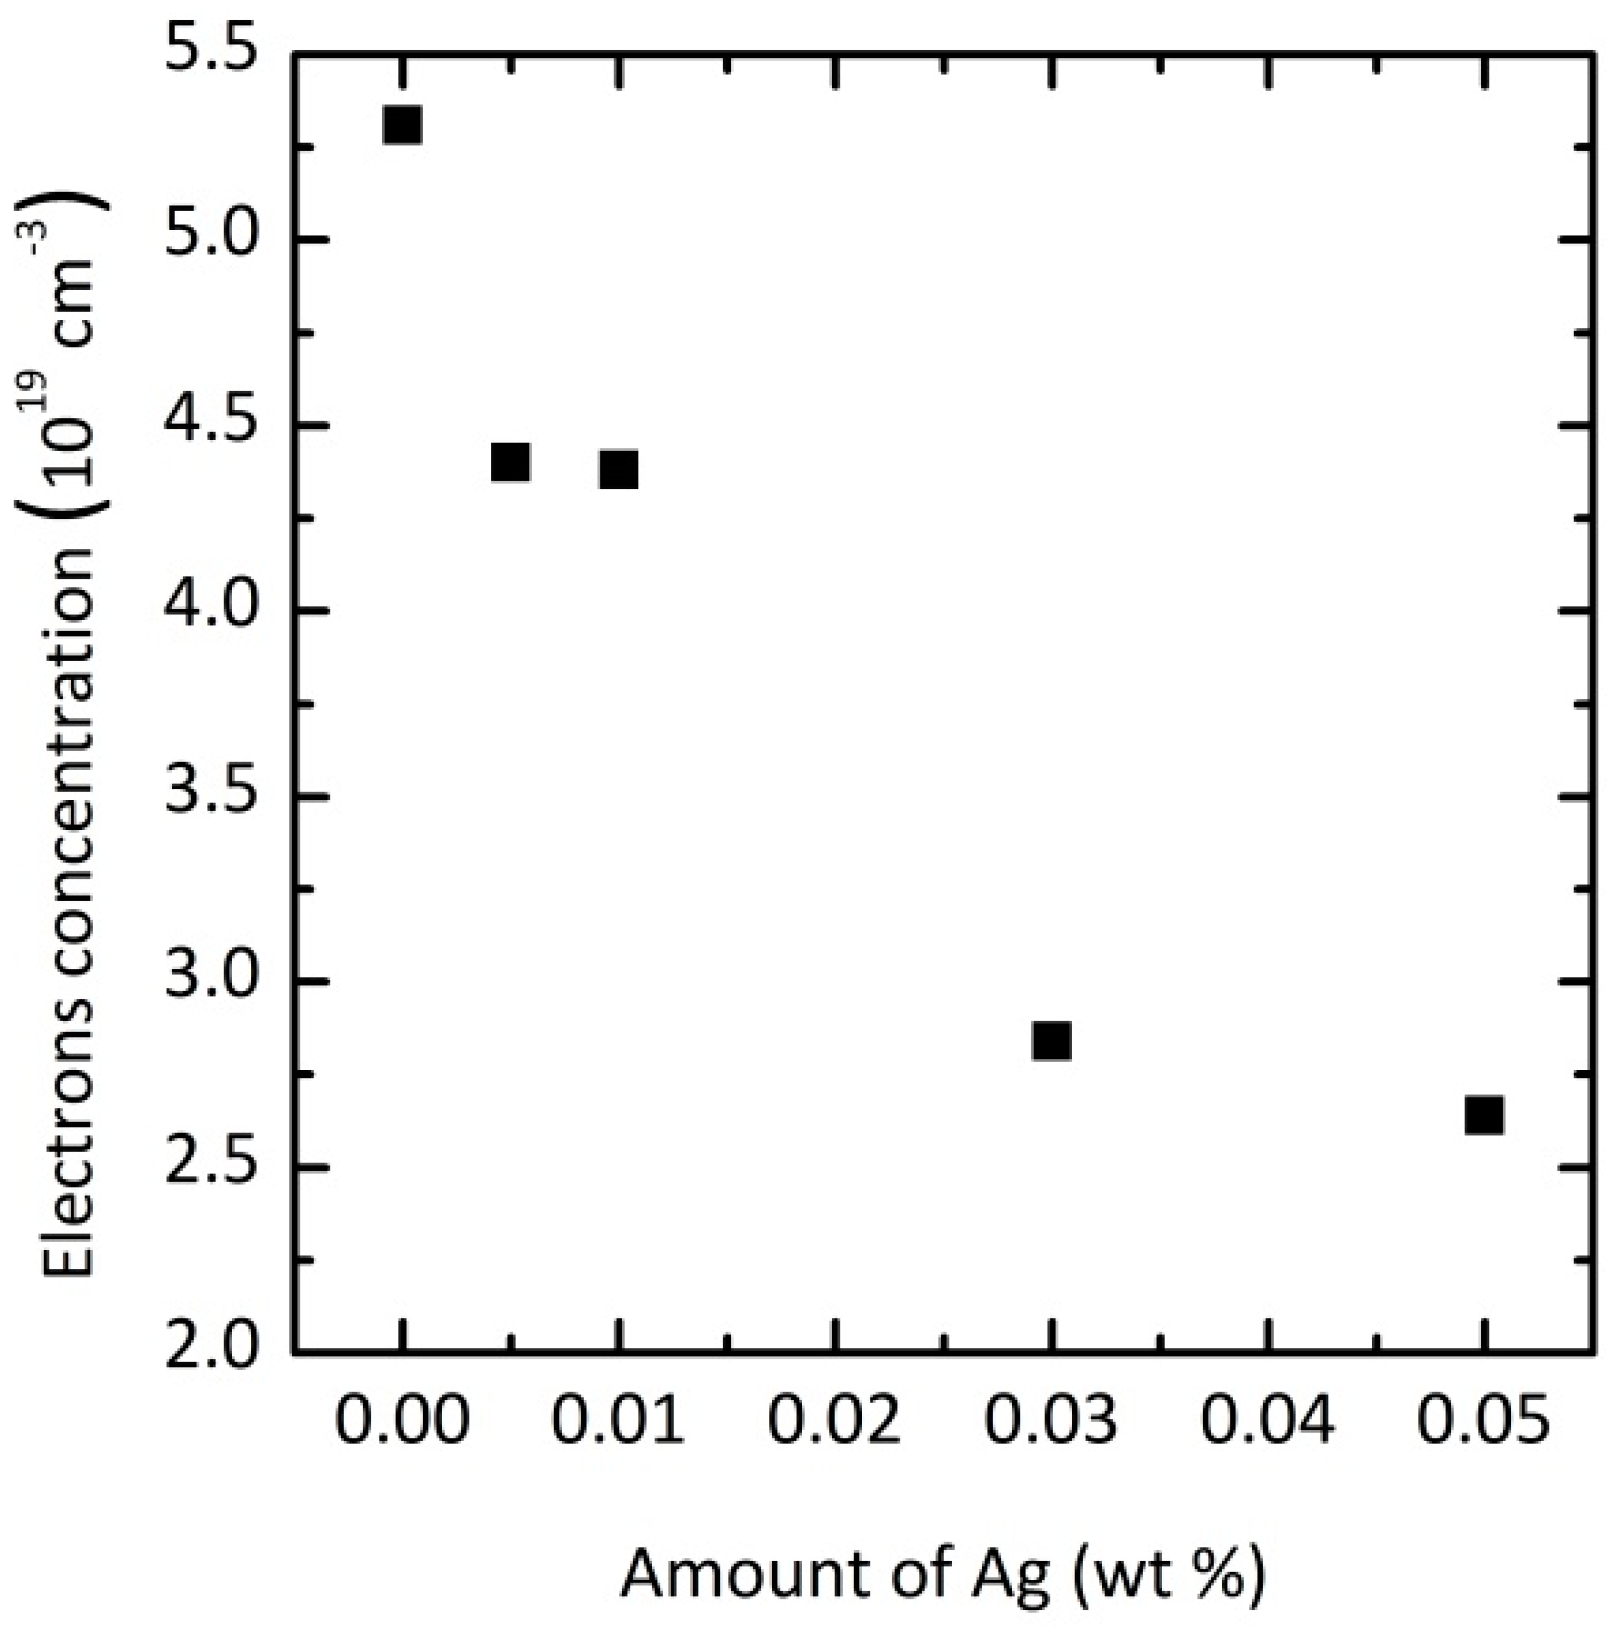
Figure 3.
Rietveld refinement patterns of heat-treated Bi2Te3 sample using X-ray powder diffraction data. Plus marks (+) represent the observed intensities, and the red solid line is the calculated result. The difference plot (blue) is shown at the bottom. Tick marks above the difference plot indicate the reflection positions.
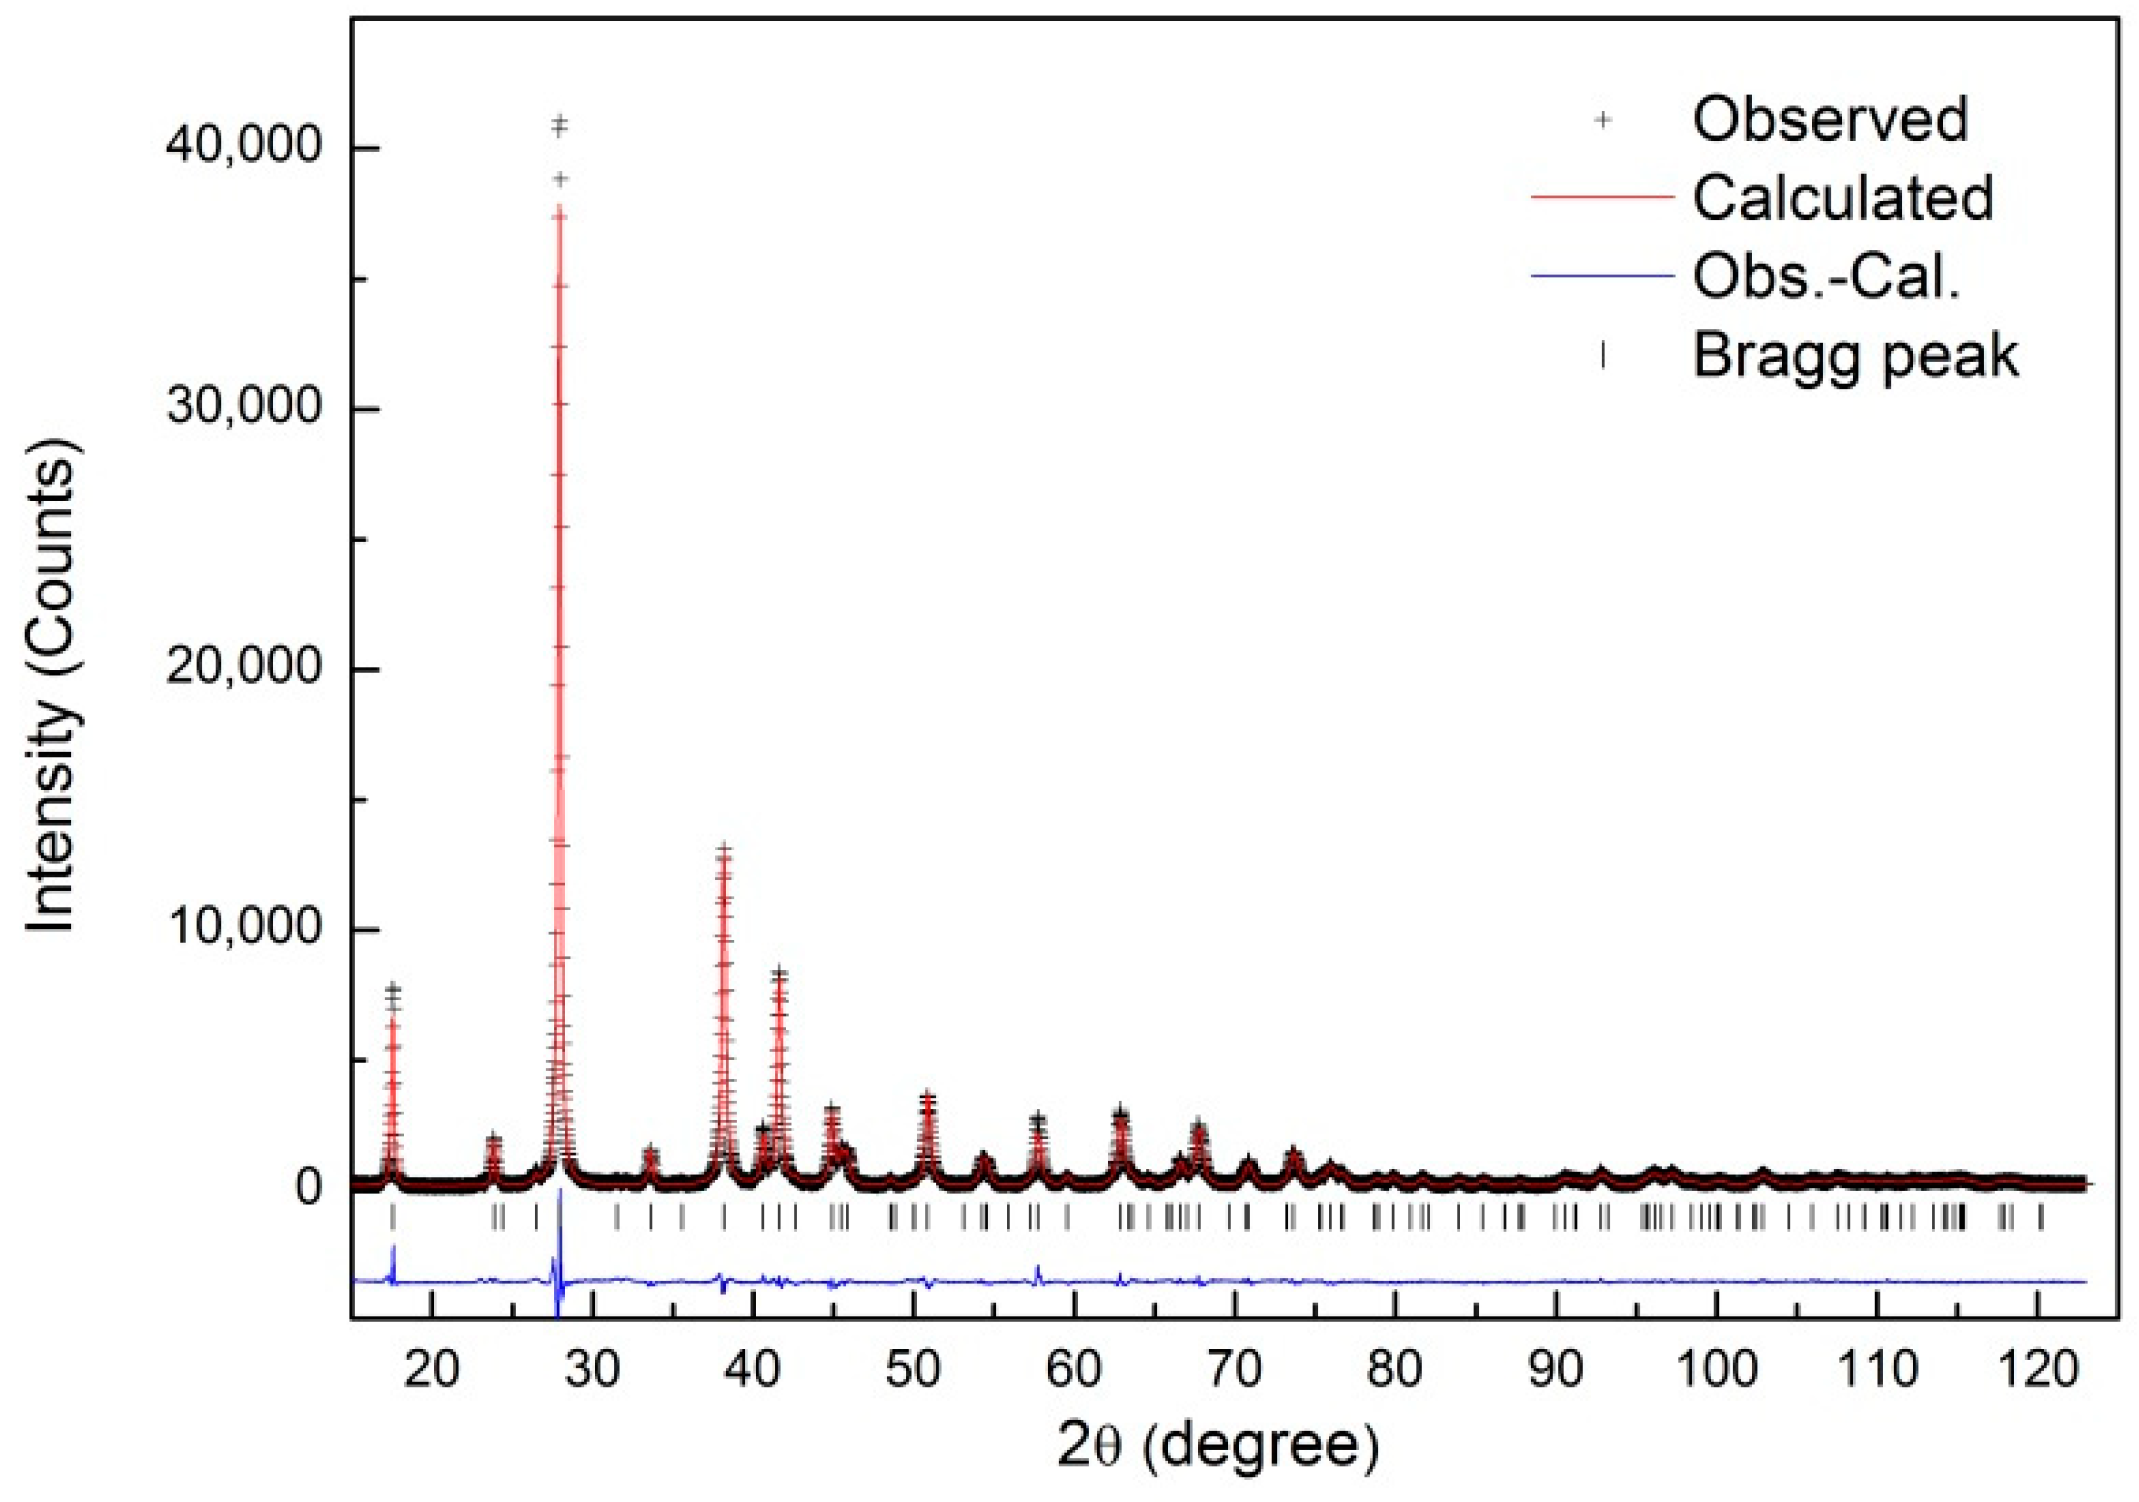
Figure 4.
SEM images of the n-type samples (a) without Ag; (b) with 0.05 wt % Ag; (c) and (d) are the SEM image used in the EDS composition analysis, and the spectrum obtained from the spot in (c), respectively.
Figure 4.
SEM images of the n-type samples (a) without Ag; (b) with 0.05 wt % Ag; (c) and (d) are the SEM image used in the EDS composition analysis, and the spectrum obtained from the spot in (c), respectively.

Figure 5.
Formation energy of the defects in Bi2Te3 as a function of the Te chemical potential. The antisite defects with Agi (interstitial Ag) and without Agi were considered. The chemical potential of metal Te was set to be 0 eV.
Figure 5.
Formation energy of the defects in Bi2Te3 as a function of the Te chemical potential. The antisite defects with Agi (interstitial Ag) and without Agi were considered. The chemical potential of metal Te was set to be 0 eV.


Table 1.
Refined structural parameters of heat-treated Bi2Te3 sample obtained from the Rietveld refinement using X-ray powder diffraction data at 297 K. The symbol, g, is the occupation factor. The numbers in parentheses are the estimated standard deviations of the last significant figure.
Table 1.
Refined structural parameters of heat-treated Bi2Te3 sample obtained from the Rietveld refinement using X-ray powder diffraction data at 297 K. The symbol, g, is the occupation factor. The numbers in parentheses are the estimated standard deviations of the last significant figure.
| Atom | site | x/a | y/b | z/c | g | Beq/Å2 |
|---|---|---|---|---|---|---|
| Te(1) | 3a | 0 | 0 | 0 | 1.0 | 1.86(1) |
| Te(2) | 6c | 0 | 0 | 0.7885(1) | 1.0 | 1.36(7) |
| Bi(1) | 6c | 0 | 0 | 0.3984(1) | 1.0 | 1.37(5) |
Space group: R-3 m (no. 166) and Z = 3; a (= b) = 4.3377(1) Å, c = 30.2611(1) Å; α = β = 90°, γ = 120°; R-factor: Rwp = 8.44, Rp = 6.49, Re = 3. 95 and S(= Rwp/Re) = 2.14.
Table 2.
Refined lattice parameters and R-weighted factors (Rwp) for the heat-treated Bi2Te3 and heat-treated Ag doped Bi2Te3 samples obtained from the Rietveld refinement using X-ray powder diffraction data at 297 K.
Table 2.
Refined lattice parameters and R-weighted factors (Rwp) for the heat-treated Bi2Te3 and heat-treated Ag doped Bi2Te3 samples obtained from the Rietveld refinement using X-ray powder diffraction data at 297 K.
| Sample | Rwp (%) | a (Å) | c (Å) |
|---|---|---|---|
| Ag = 0.0 | 8.44 | 4.3377(1) | 30.2611(1) |
| Ag = 0.01 | 8.61 | 4.3375(1) | 30.2641(1) |
| Ag = 0.03 | 7.82 | 4.3380(1) | 30.2768(1) |
| Ag = 0.05 | 7.97 | 4.3387(1) | 30.2774(1) |
Table 3.
The optimized lattice parameters and formation energy from the first-principles calculation. The values of pristine Bi2Te3, Ag interstitial (Agi)-doped Bi2Te3, Bi2Te3 with Ag substituted for Bi (AgBi), and Bi2Te3 with Ag substituted for Te sites (6c and 3a) are listed.
Table 3.
The optimized lattice parameters and formation energy from the first-principles calculation. The values of pristine Bi2Te3, Ag interstitial (Agi)-doped Bi2Te3, Bi2Te3 with Ag substituted for Bi (AgBi), and Bi2Te3 with Ag substituted for Te sites (6c and 3a) are listed.
| Sample | Lattice Parameters (Å) | Formation Energy (eV) | ||
|---|---|---|---|---|
| a | c | Te-Rich | Bi-Rich | |
| Bi2Te3 | 4.421 | 30.478 | - | - |
| Agi | 4.443 | 30.660 | 0.68 | 0.68 |
| AgBi | 4.408 | 30.211 | 1.07 | 1.47 |
| AgTe(6c) | 4.422 | 30.046 | 1.83 | 1.57 |
| AgTe(3a) | 4.415 | 30.323 | 1.89 | 1.63 |
© 2018 by the authors. Licensee MDPI, Basel, Switzerland. This article is an open access article distributed under the terms and conditions of the Creative Commons Attribution (CC BY) license (http://creativecommons.org/licenses/by/4.0/).
Share and Cite
MDPI and ACS Style
Lee, J.K.; Son, J.H.; Kim, Y.-I.; Ryu, B.; Cho, B.J.; Kim, S.; Park, S.-D.; Oh, M.-W. Control of Carrier Concentration by Ag Doping in N-Type Bi2Te3 Based Compounds. Appl. Sci. 2018, 8, 735. https://doi.org/10.3390/app8050735
AMA Style
Lee JK, Son JH, Kim Y-I, Ryu B, Cho BJ, Kim S, Park S-D, Oh M-W. Control of Carrier Concentration by Ag Doping in N-Type Bi2Te3 Based Compounds. Applied Sciences. 2018; 8(5):735. https://doi.org/10.3390/app8050735
Chicago/Turabian StyleLee, Jae Ki, Ji Hui Son, Yong-Il Kim, Byungki Ryu, Byung Jin Cho, Sookyung Kim, Su-Dong Park, and Min-Wook Oh. 2018. "Control of Carrier Concentration by Ag Doping in N-Type Bi2Te3 Based Compounds" Applied Sciences 8, no. 5: 735. https://doi.org/10.3390/app8050735
Note that from the first issue of 2016, this journal uses article numbers instead of page numbers. See further details here.