Article

Applying Acoustical and Musicological Analysis to Detect Brain Responses to Realistic Music: A Case Study

1
Center for Music in the Brain, Department of Clinical Medicine, Aarhus University and Royal Academy of Music, Aarhus/Aalborg, Nørrebrogade 44, Building 10G, 4th and 5th floor, 8000 Aarhus C, Denmark
2
BioMag Laboratory, HUS Medical Imaging Center, University of Helsinki and Helsinki University Hospital, 00100 Helsinki, Finland
*
Author to whom correspondence should be addressed.
Appl. Sci. 2018, 8(5), 716; https://doi.org/10.3390/app8050716
Submission received: 19 March 2018 / Revised: 24 April 2018 / Accepted: 30 April 2018 / Published: 4 May 2018
(This article belongs to the Special Issue Digital Audio and Image Processing with Focus on Music Research)

Abstract

:
Music information retrieval (MIR) methods offer interesting possibilities for automatically identifying time points in music recordings that relate to specific brain responses. However, how the acoustical features and the novelty of the music structure affect the brain response is not yet clear. In the present study, we tested a new method for automatically identifying time points of brain responses based on MIR analysis. We utilized an existing database including brain recordings of 48 healthy listeners measured with electroencephalography (EEG) and magnetoencephalography (MEG). While we succeeded in capturing brain responses related to acoustical changes in the modern tango piece Adios Nonino, we obtained less reliable brain responses with a metal rock piece and a modern symphony orchestra musical composition. However, brain responses might also relate to the novelty of the music structure. Hence, we added a manual musicological analysis of novelty in the musical structure to the computational acoustic analysis, obtaining strong brain responses even to the rock and modern pieces. Although no standardized method yet exists, these preliminary results suggest that analysis of novelty in music is an important aid to MIR analysis for investigating brain responses to realistic music.

Graphical Abstract

1. Introduction

Measuring brain responses to music provides important insights into the auditory, non-verbal brain functions of functional hearing and hearing disabilities. The brain response is measured by identifying each time point in the music that evokes the brain response. Typically, the experimenter uses a set of predefined time points and designs artificial music stimuli adapted to the time points. However, this approach limits the opportunities for measuring brain responses to realistic music and restricts the generalization of the findings to ecological listening conditions. Since the artificially designed music differs from real music heard outside the laboratory, there is a growing interest in developing music information retrieval (MIR) methods [1,2] to identify the time points for measuring brain responses to real music [3,4,5,6,7]. We have tested a new method, which combines acoustical MIR analysis with modeling of brain mechanisms to automatically extract time points when the brain responds to real music pieces [8].
Brain responses to acoustical changes in music measured with neurophysiological methods, such as electroencephalography (EEG) and magnetoencephalography (MEG), originate from synchronous post-synaptic electric potentials in coherently oriented groups of pyramidal neurons in the cortical layers of the brain [9]. These are measured with EEG electrodes placed on the scalp, while the magnetic counterpart of the potentials is measured with MEG sensors positioned around the head. While basic brain responses originating from the auditory cortex in reaction to acoustical changes in music can be measured, novel events in music also evoke novelty-related brain responses originating from higher-order cortical structures such as the inferior frontal cortex [10,11,12,13,14].
A relevant source of novel events in music is the change of level in acoustical feature parameters. With respect to loudness, the metal subgenre of rock music is in particular attempting to maximize perceived loudness [15]. This is achieved by applying loud bass drums, distortion and brightness increase filters on the bass and guitar, as well as dynamic range compression [15]. The perceived loudness can be further increased by habituating the listener to low levels of loudness and brightness, while subsequently increasing the level for these parameters (e.g., see Figure 1, top). A novelty-related brain response is typically evoked after briefly learning to expect a certain parametric level in acoustical features followed by a change in the acoustical parameter [16]. In addition, the novelty-related brain response can be evoked by novel events, which are infrequent in relation to the listener’s prior developed understanding of which events are frequent and infrequent in the music style before hearing the current music piece [13,14,17,18,19,20,21,22,23]. To measure such novelty-related brain responses, it would be relevant to analyze the novelty of the musical events.
In the present study, we investigate whether automatic extraction of acoustical feature increases, based on MIR analysis, can be applied to isolate brain responses to real pieces of different musical genres, such as metal rock music, tango music and modern symphony orchestra music. We also consider whether it is relevant to include an analysis of the novelty in the musical structure to extract brain responses to novel events in the music.

2. Materials and Methods

2.1. EEG and MEG Dataset

The study did not involve any new data collection but instead utilized a subset of an existing dataset of combined electroencephalography (EEG) and magnetoencephalography (MEG) recordings called Tunteet, collected at the Biomag laboratory at Helsinki University Hospital (VectorviewTM 306-channel MEG scanner (Elekta Neuromag®, Elekta Oy, Helsinki, Finland; sample rate: 600 Hz)) in the years 2012–2013 and already extensively published or under publication [19,24,25,26,27,28,29,30,31,32,33,34,35,36] (ethical approval by the Coordinating Ethics Committee of the Hospital District of Helsinki and Uusimaa; approval number: 315/13/03/00/11, obtained on March the 11th, 2012). The subset here included EEG and MEG data from 48 healthy participants with self-reported normal hearing and no past cases of neurological or psychiatric disorder (28.3 years; st.dev. 8.6 years; 23 females; 2 left-handed). During the measurement subjects were instructed to remain still, listen to the music through pneumatic headphones, and keep their eyes open. Further details about stimulus presentation and data acquisition are found e.g., in Reference [29]. Preprocessing of MEG data was done applying Elekta NeuromagTM MaxFilter 2.2 Temporal Signal Space Separation (tSSS), and the EEG and MEG data was further processed with ICA decomposition using FieldTrip version r9093 [37] and Matlab R2013b (MathWorks, Natick, MA, USA). Further details are found in Reference [8]. Since the planar gradiometer sensors of the MEG measure the difference in the magnetic field across two orthogonal directions, the measures from each couple of longitudinal and latitudinal gradiometer sensor were combined by applying the Pythagorean distance formula, as implemented in FieldTrip, d = l o n g i t u d i n a l 2 + l a t i t u d i n a l 2 .

2.2. Stimuli

Three real music pieces were applied as stimuli, which were a subset of the larger “Tunteet” experiment. The song presentation order was counterbalanced between subjects. Participants heard a shortened version of the progressive metal/rock piece Stream of Consciousness by Dream Theater (abbreviation: SC) (7 min and 51 s) (Train of thought album, Elektra Records, 2003). Another piece was an excerpt of the first part of the modern orchestral ballet music Rite of Spring by Igor Stravinsky (abbreviation: RS) (7 min and 47 s) (Kirov Orchestra, St. Petersburg, conducted by Valery Gergiev, Decca Music Group Ltd., ℗© 2001 Universal International Music B.V). In addition, the participants heard a tango piece Adios Nonino by Astor Piazzolla (abbreviation: AN) (The Lausanne Concert album, BMG Music, 1993).

2.3. Feature Extraction with MIR Toolbox

The musical features were extracted with the MIR Toolbox (version 1.6.1) for Matlab [1]. A measurement time frame size of 25 ms and a hop size of 50% were applied, resulting in a sample rate of 80 Hz (1/(0.025 s. × 0.5)) [8]. Five acoustical features related to loudness and timbre were extracted [8]. The Loudness was measured in root-mean-squared (RMS) values, approximating the perceived loudness across time. The Brightness was estimated by calculating the proportion of energy above and below 1500 Hz [1]. Spectral flux was derived as the difference in spectral power between each successive time frame. Noisiness, or zero-crossing rate, measured the number of times the audio signal changed per second causing a shift in sign. Finally, a measure of Roughness was derived to describe the sensory dissonance experienced when two or more tones with narrow pitch intervals occur, e.g., in dissonant chords or inharmonic musical scales [38,39].

2.4. Automatic Capture of Acoustical Changes Evoking Cortical Responses

We applied an automatic method for extracting the time points with MIR feature increases assumed to evoke brain responses, which is described in further detail in Reference [8], and is developed based on a similar semi-automatic method [5,6]. For extracting the time points with MIR feature increases assumed to evoke brain responses the following three criteria should be satisfied (for further details see Reference [8]):
  • The time points exceed a perceptual threshold by which their magnitude of rapid increase (MoRI) [5,6] is among the 30% highest MoRI values.
  • The time points show minimal effects of neural habituation [5,6]. This is implemented by only including time points with at least 1 s preceding low increase phase (PLIP) with MoRI below the 30% highest threshold.
  • In order to keep the number of extracted time points constant for comparable signal-to-noise ratios when averaging across more brain responses, no more than 10 time points in the music piece satisfying the above criteria and which are maximally distributed across time are extracted.
The number of time points for the five MIR features that meet these criteria is shown in Table 1, which includes statistics on the number of total MoRI peaks satisfying criteria 1, and the PLIP and time distribution after criteria 1–3 have been applied to extract assumed relevant time points. As visible from the Table 1, only few events were meeting the defined criteria, especially for the metal rock piece SC compared with the tango piece AN.

2.5. Musicological Analysis of Novel Events

Due to relatively high MIR feature levels and change rates in the metal rock and modern symphony orchestra music pieces, the automatic MIR approach identified too few acoustical feature-peak events satisfying the second criteria (the PLIP criteria), which might compromise the possibility of obtaining neural correlates of the acoustical feature processing. Hence, we also decided to introduce a musicological analysis of the pieces, which was conducted by the first author, to investigate the possible effects of novelty in the music structure.
The metal rock piece SC begins with a repetitive and quiet guitar solo consisting of an 8-note figure repeated 8 times. Every second 8-note figure is played on a C-minor-6 and Bb-major-7 chord. A quiet C pitch is played on the bas and fades out during the first 4 repetitions of the guitar figure. This is followed by drums, bas, guitar and keyboard playing an expected C-minor chord, but with a novel high loudness level and distortion effects added (Figure 1, top).
The excerpt of the modern symphony orchestra piece RS starts with an introduction part for woodwind instruments, consisting of phrases alternating between major-minor mode tonalities and harmonic progressions of unclear tonality (music score measures 1–75). The following ‘Augurs of Spring’ part begins with the novel ‘Augurs’ chord, which is commonly defined as atonal or as a polychord consisting of an E-major superposed on an Eb-major seventh chord (music score measure 76, at rehearsal number 13) [40]. Although the chord is consistent with the chromatic tuning system of contemporary Western music, it is novel and presumably evokes a measurable novelty related brain response [17,20], since it neither belongs to a typical harmonic progression in major or minor mode, nor adheres to a common major or minor mode pitch class [40] (e.g., see Figure 1, bottom).
These two cases of novel events in the music structure were found among the full set of automatically detected MoRI peaks for both the loudness (RMS) and the spectral flux increases (see Section 2.4 and Table 1). After applying processing steps 2 and 3 (see Section 2.4), the highly novel loudness increase in the metal rock piece SC was coincidentally among the final subset of maximally distant time points with increases in the spectral flux feature, even though the novelty of the music structure was not taken into consideration. However, the novel chord in the symphonic piece RS was not present in the final subset of maximally distant time points for either feature. Thus, the novel chord was identified only when the automatic detection of MoRI peaks was combined with the manual analysis of novelty in the music structure.

2.6. Statistical Analysis of Brain Responses

Since EEG is more commonly available than MEG systems, we focused here on the EEG data, while we apply the MEG for showing projections of the obtained brain response on the scalp with higher spatial accuracy than achievable with the EEG. The study aimed at identifying whether brain responses could be obtained by automatic MIR extraction or aided by musicological identification. Brain responses measured to automatically detected MIR time points were averaged for each song and listener, whereas the response to a novel event was identified with music structure analysis as a single event. The EEG baseline was identified as the mean EEG signal from −100 to 0 ms before the time point where the MIR feature increase begins. For testing the significance of the obtained brain responses for the two approaches, a one-sample t-test across participants was used to compare the brain responses and the signal measured at baseline.

3. Results

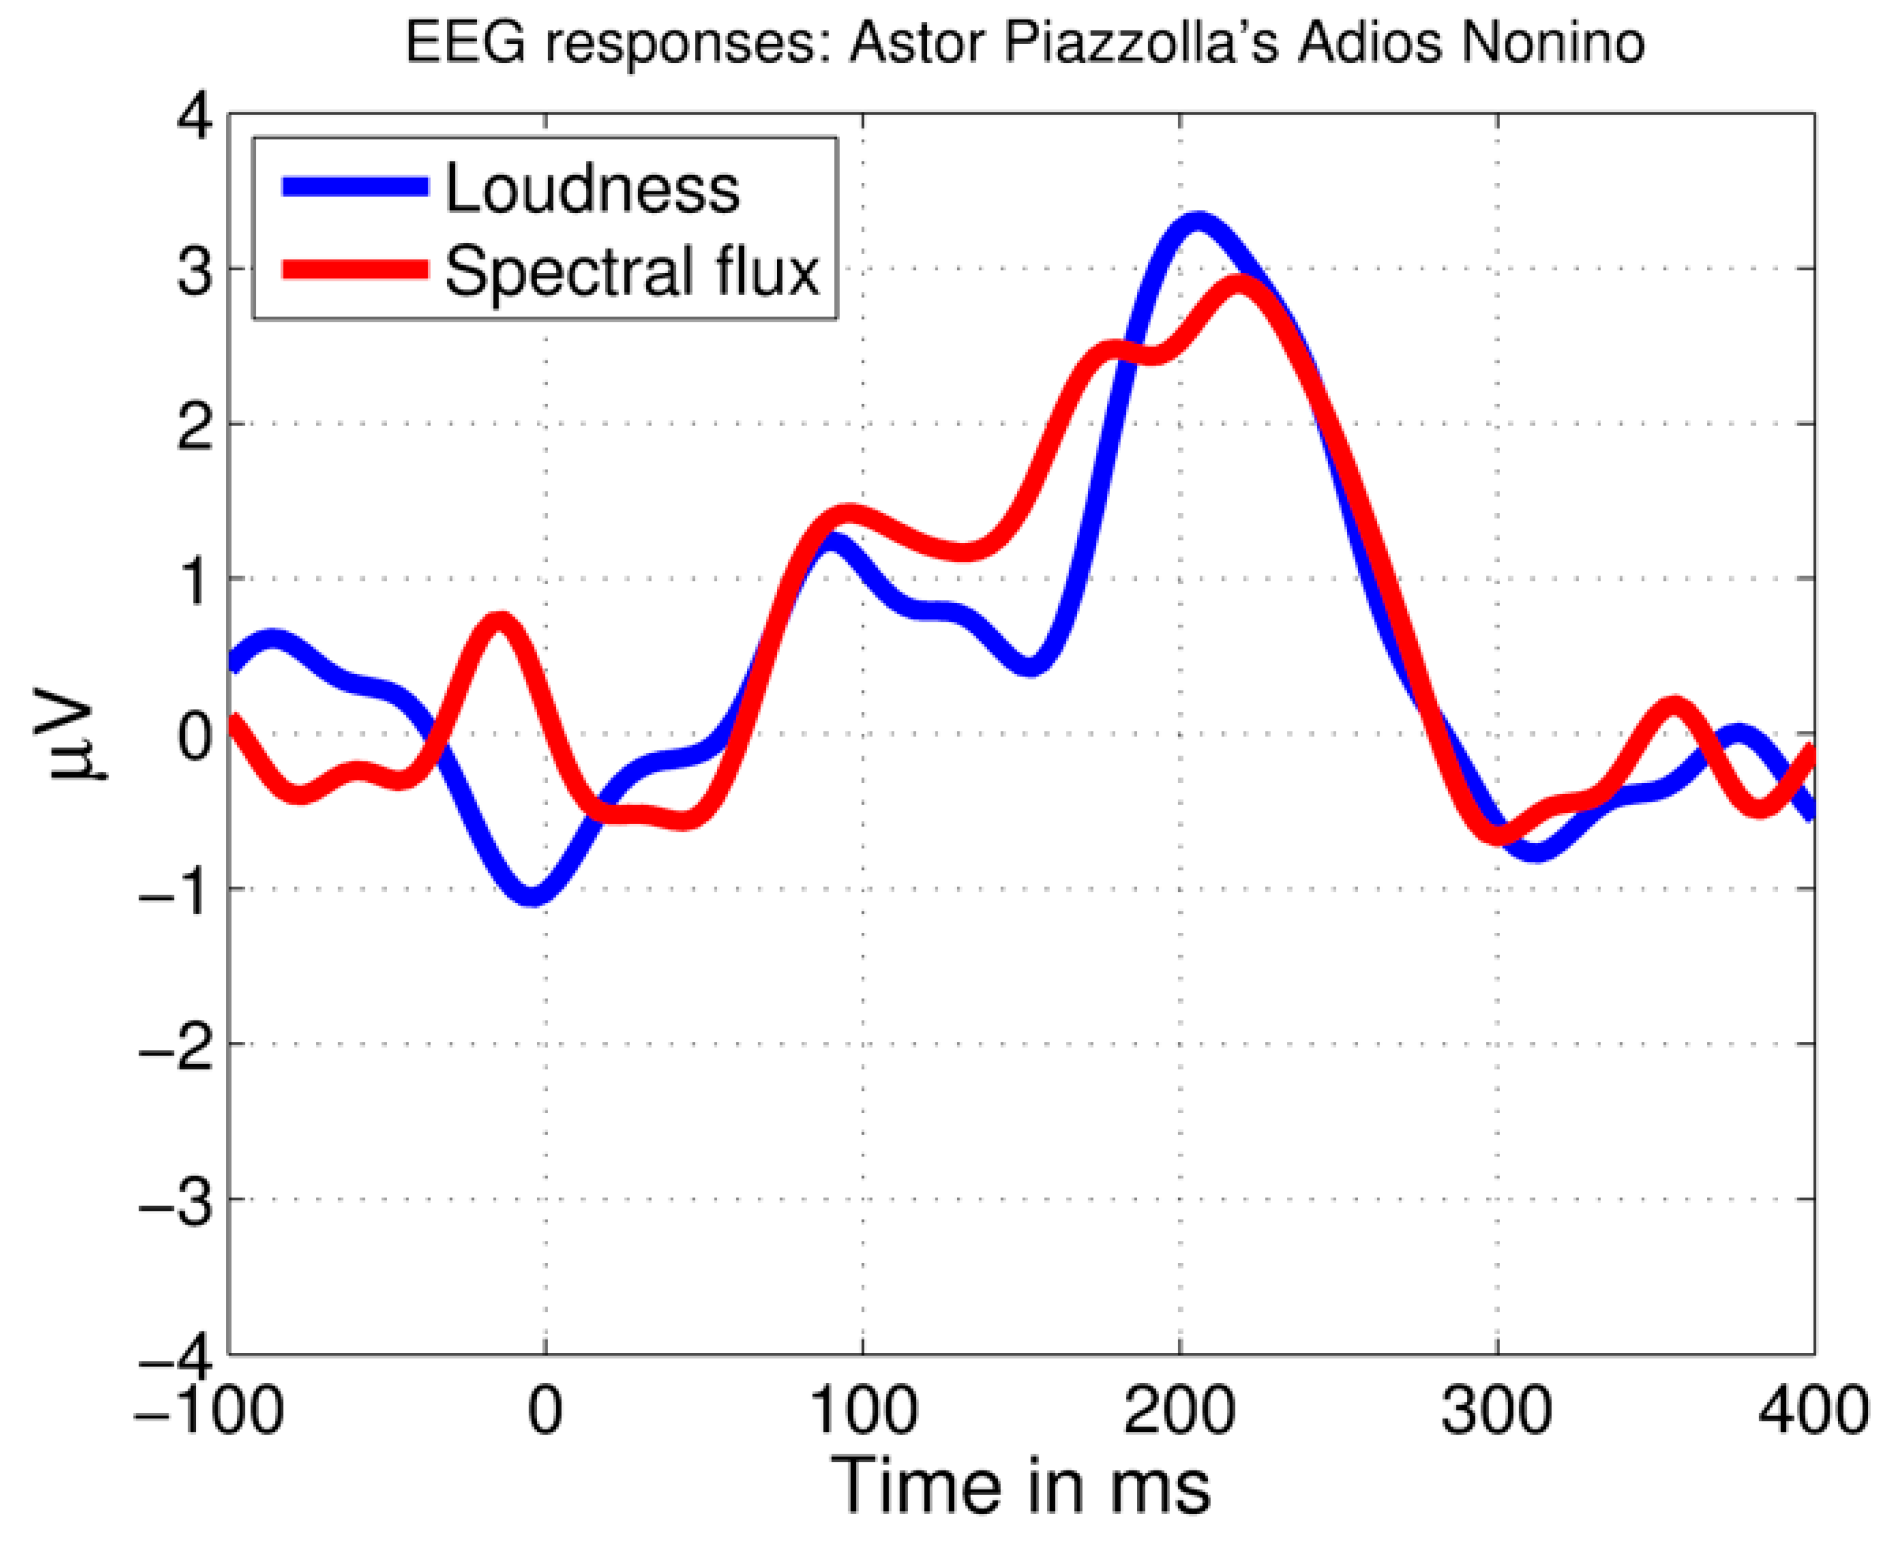
The automatic MIR analysis procedure resulted in successful identification of brain responses peaking ~200 ms after acoustical increases in the tango piece AN by Astor Piazzolla (more details are provided in Reference [8]) (Figure 2).
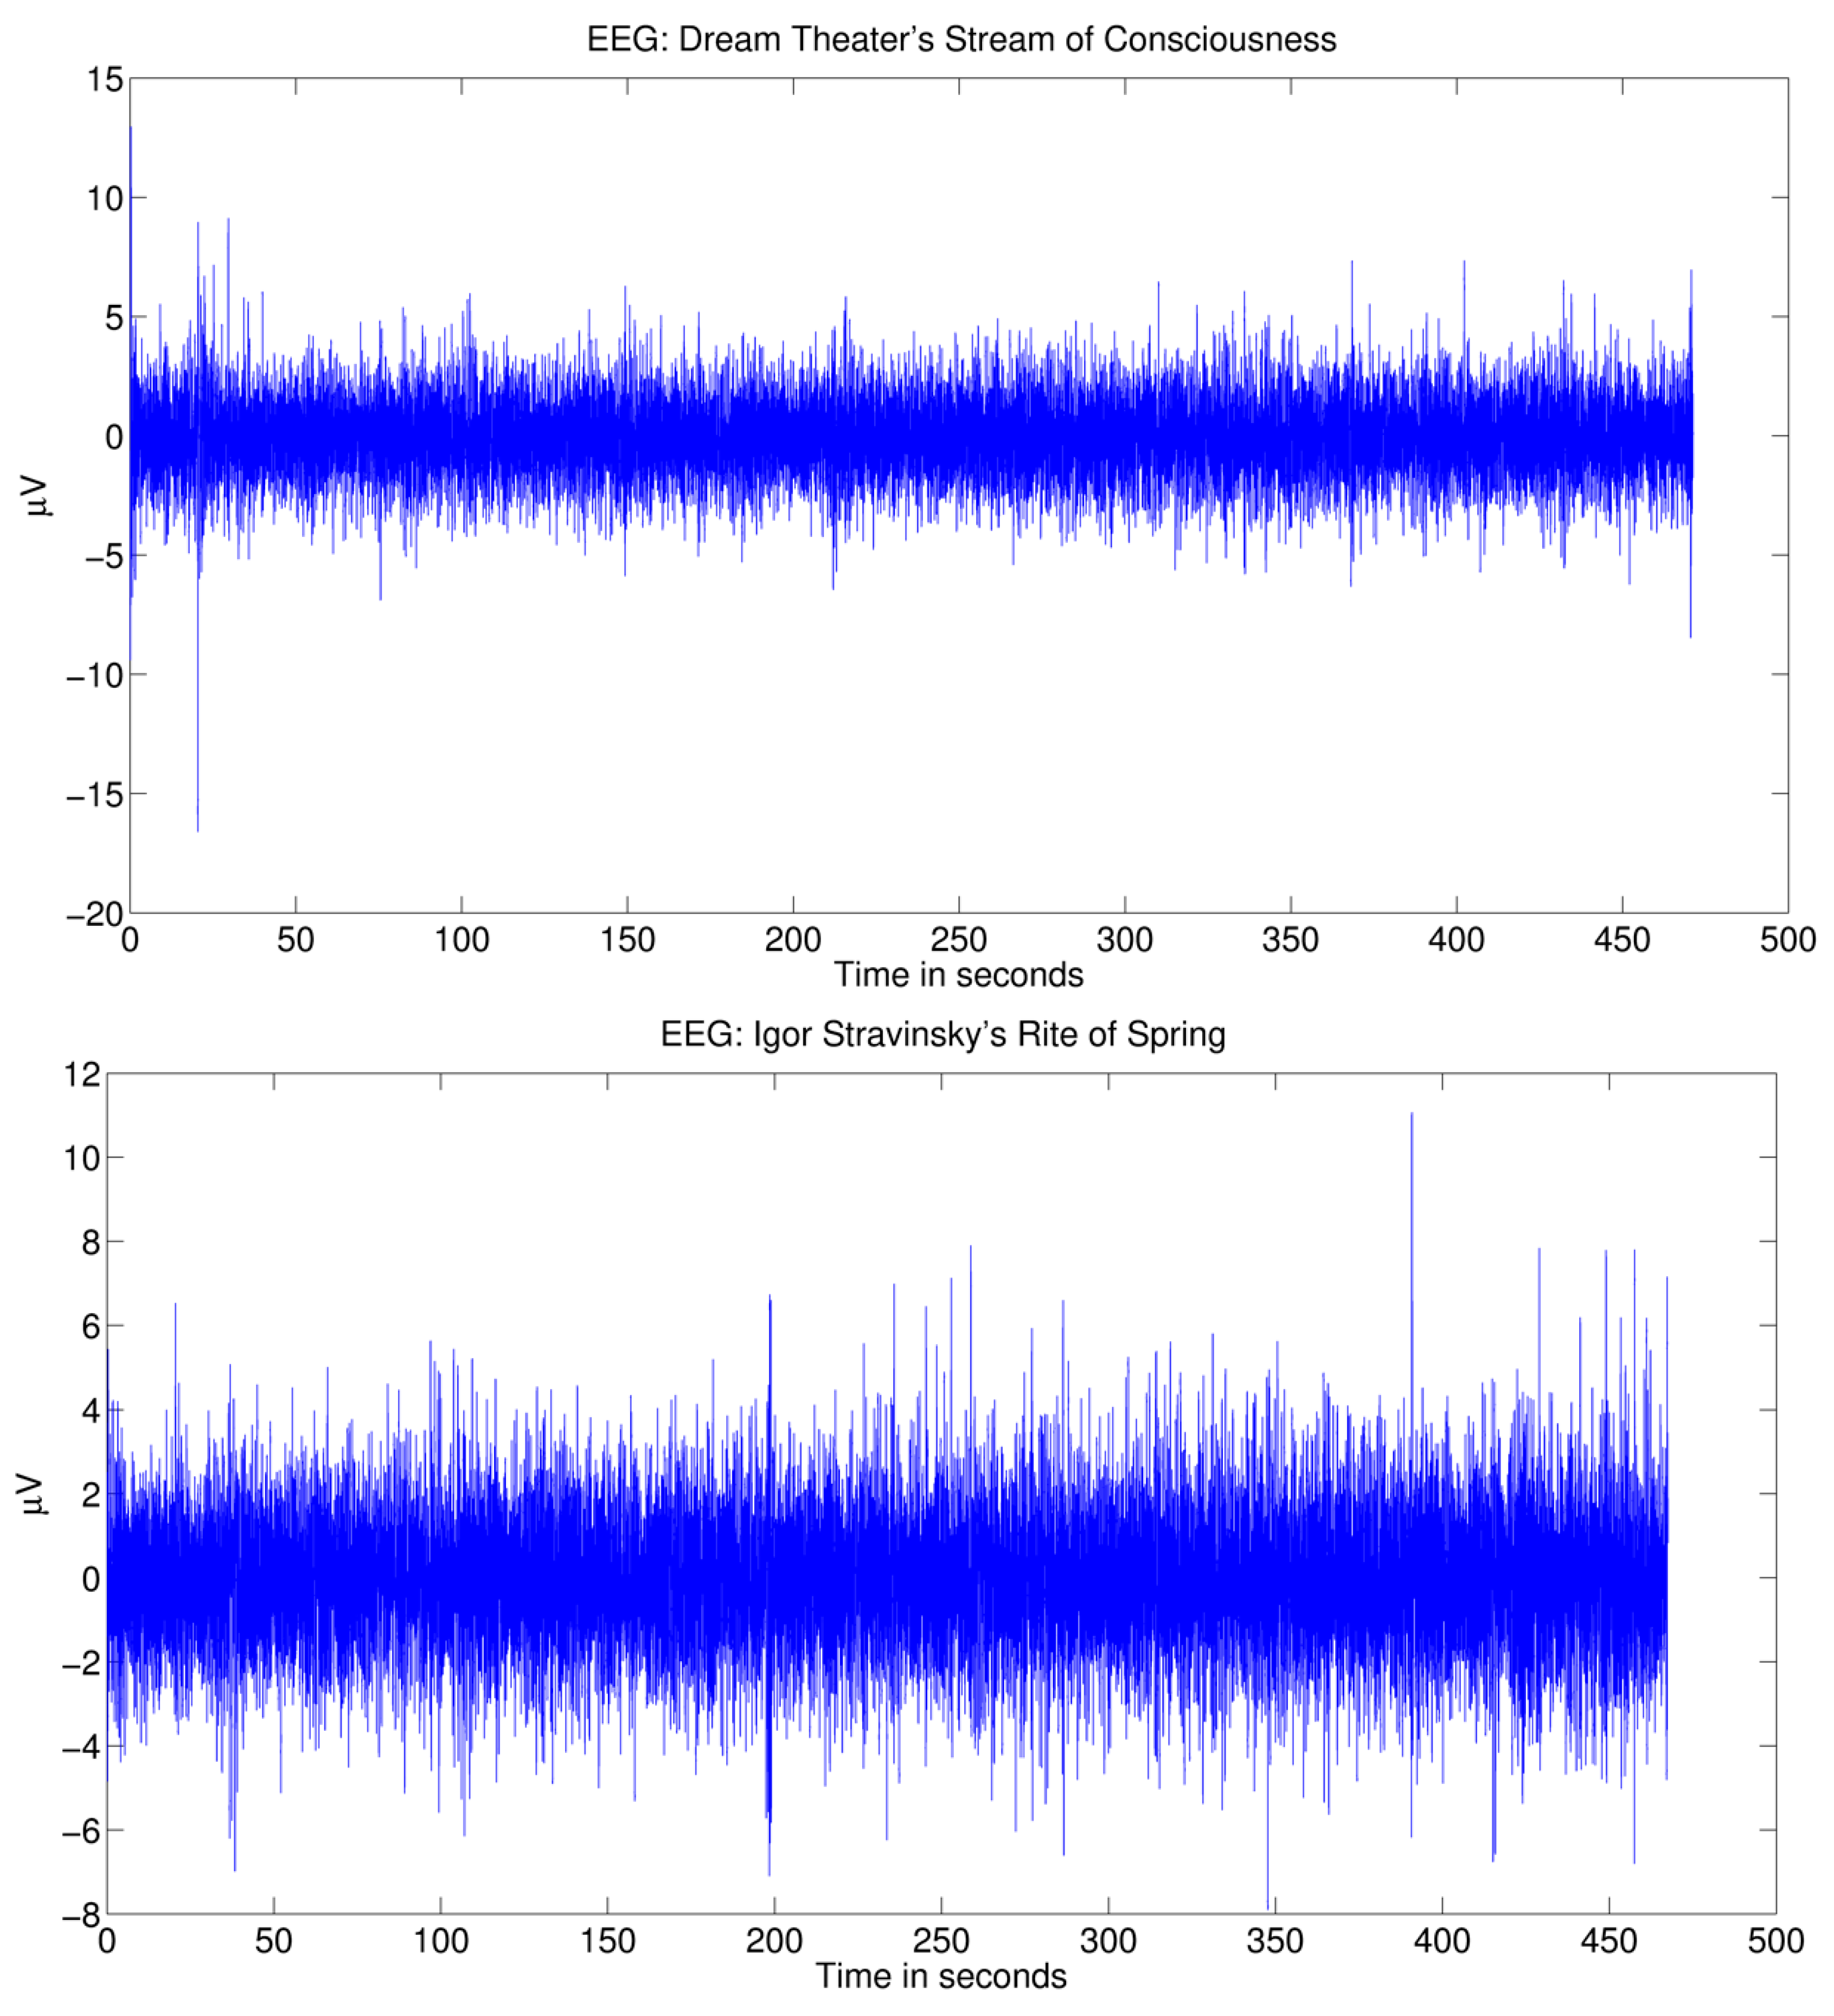
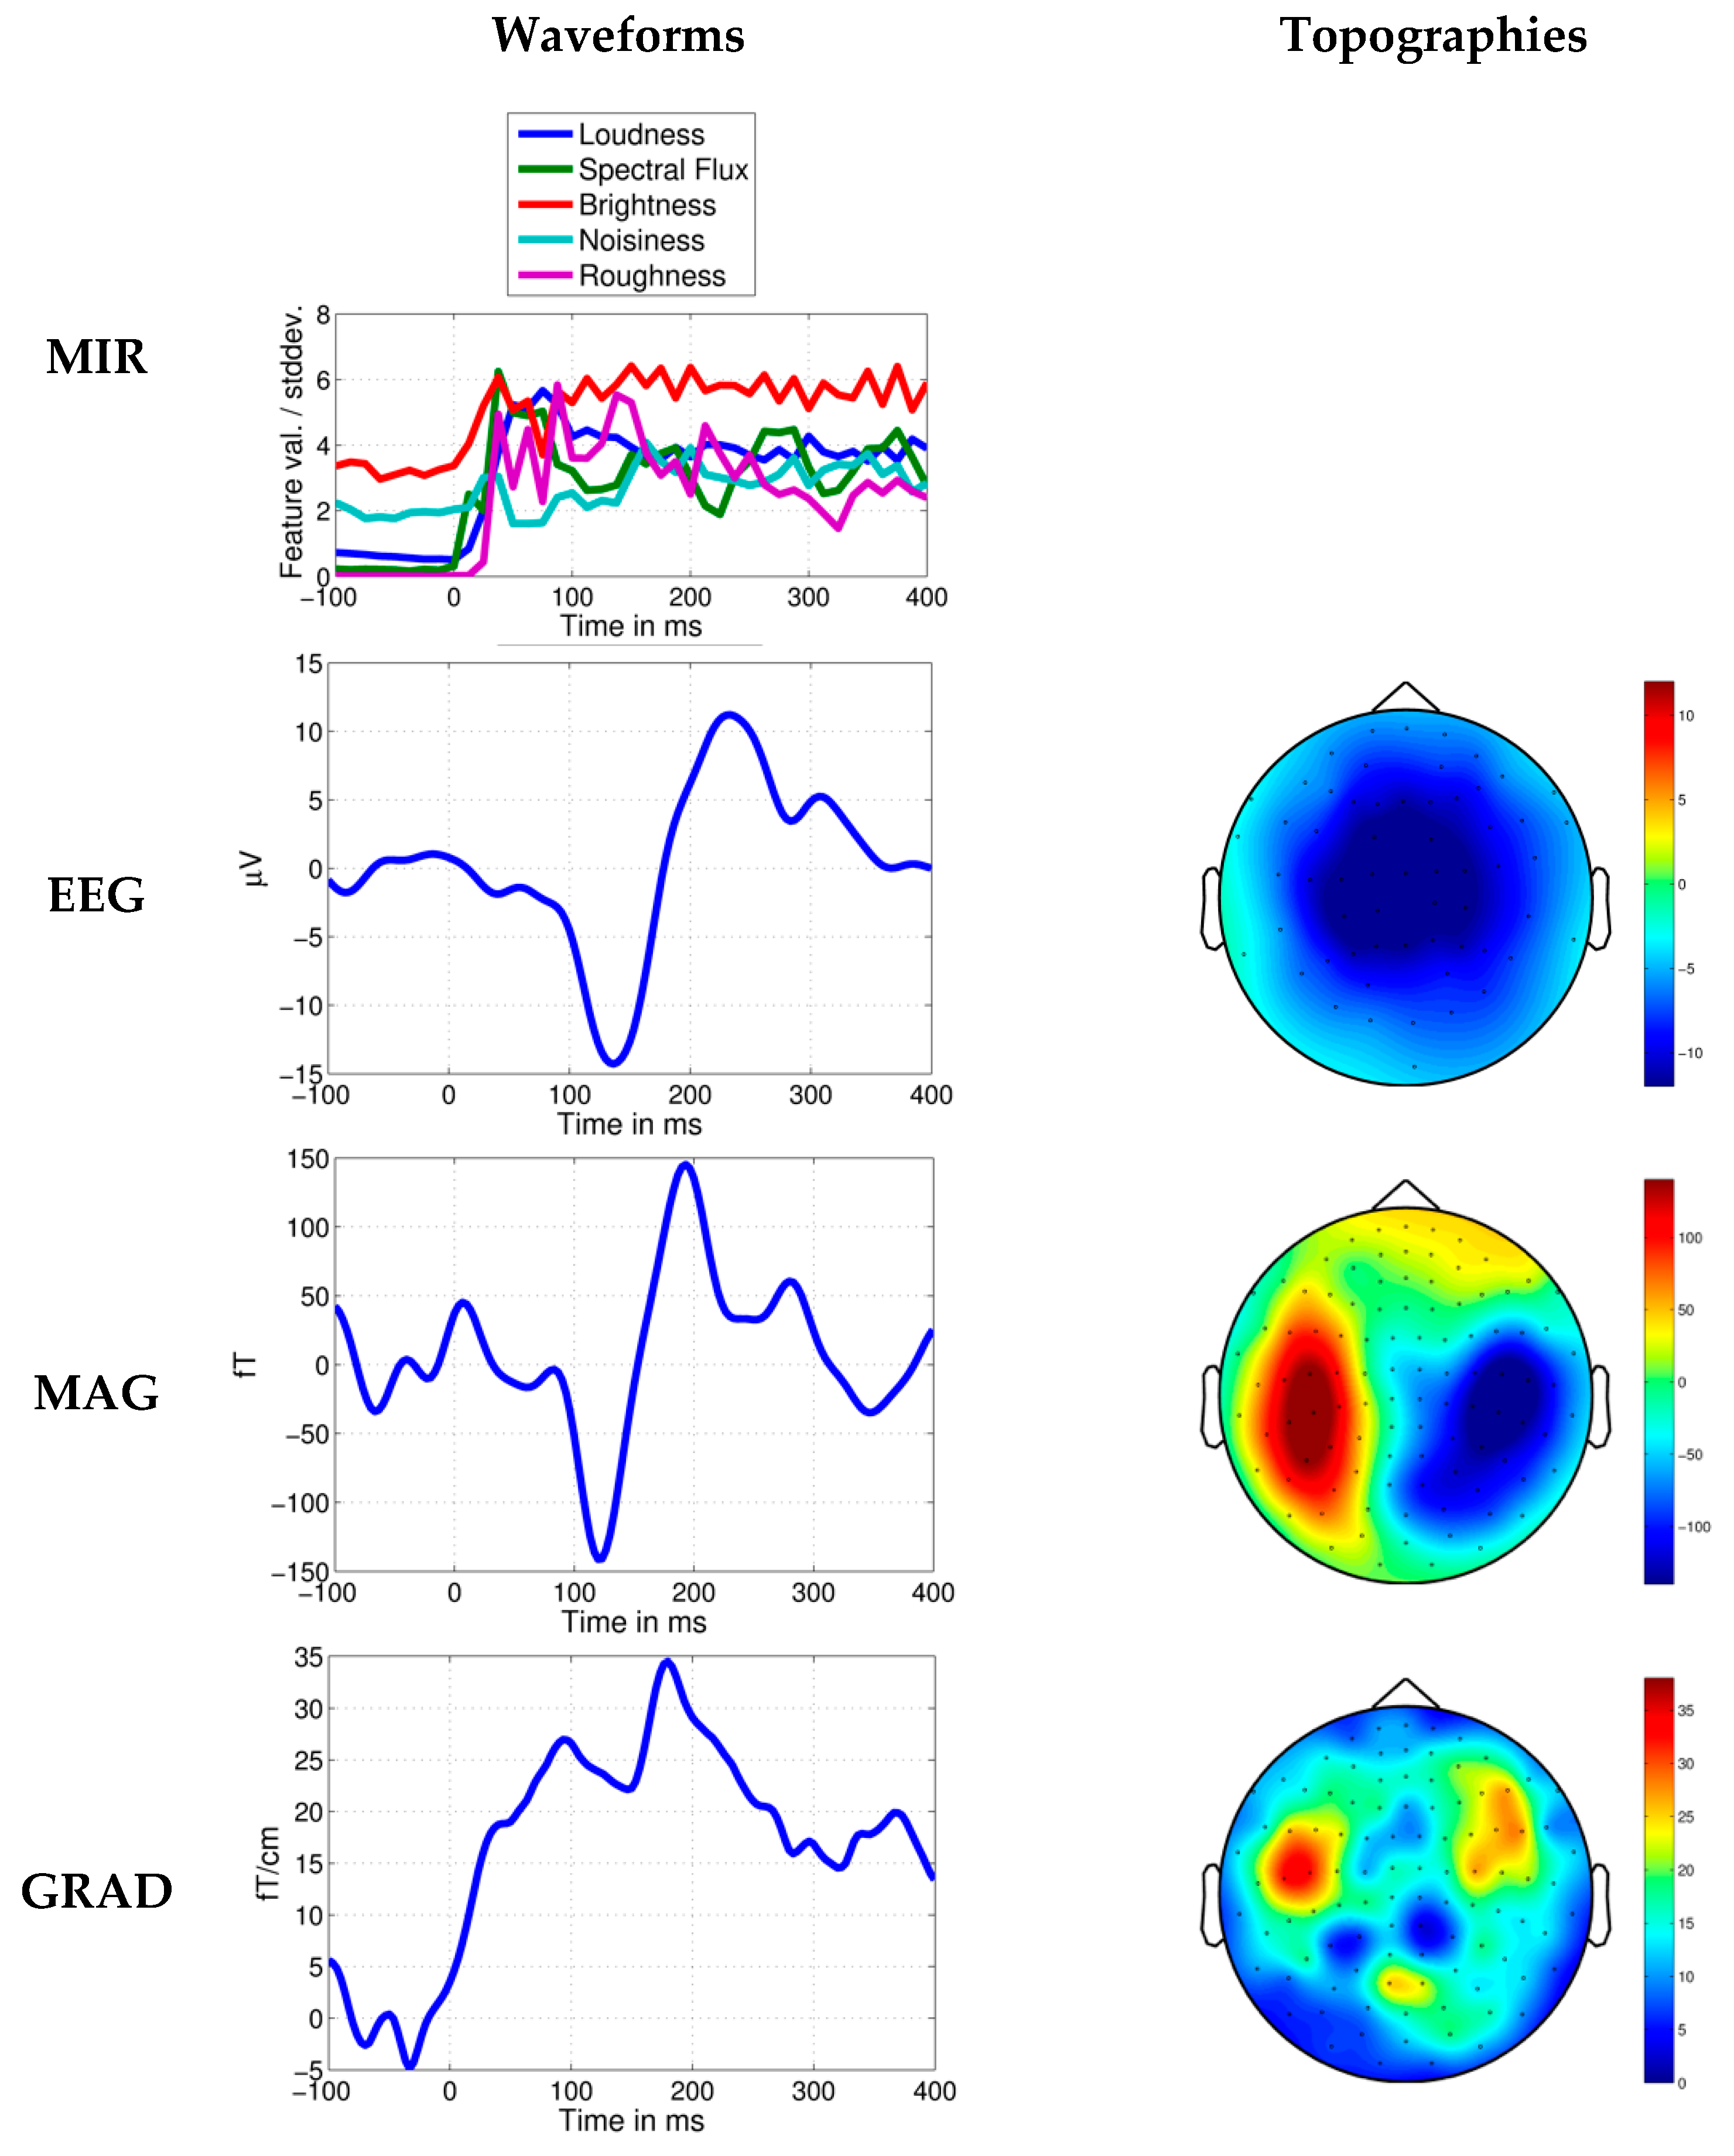
The average brain response across listeners to Dream Theater’s alternative rock piece SC is shown in Figure 3 (top). The extraction of maximally distant trigger time points did not isolate any clear responses, except for the influence from a trial in the spectral flux feature aligning with the novel musical event at 20.316 s (Figure 4, left). When taking into consideration the role of novelty in the music structure, a central-temporal N1-like response with high amplitude can be observed across the listeners at the time point with the novel increase in loudness (Figure 3, top, and Figure 5).
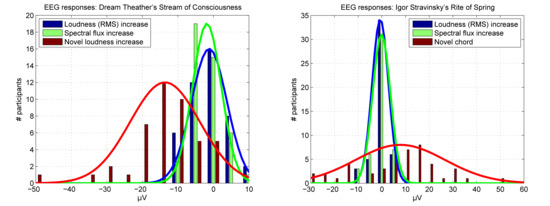
The one-sample t-test across listeners shows that the mean brain response after the onset of the novel loudness increase, measured around the peak amplitude at 137 ± 15 ms, differs significantly from the baseline, t(43) = −9.2, p < 10−6, mean = –13.6 μV (Figure 6, left). Though brain responses to the maximally distant loudness (RMS) increases do not exceed the baseline, t(43) = −1.6, p = 0.125, mean = −1.2 μV, while responses to the maximally distant spectral flux increases deviated slightly from the baseline, t(43) = −3.0, p = 0.005, mean = −1.8 μV, suggesting an effect of the time point successfully correlating with the novel loudness increase (for comparison, see Figure 4, left, and Figure 5).
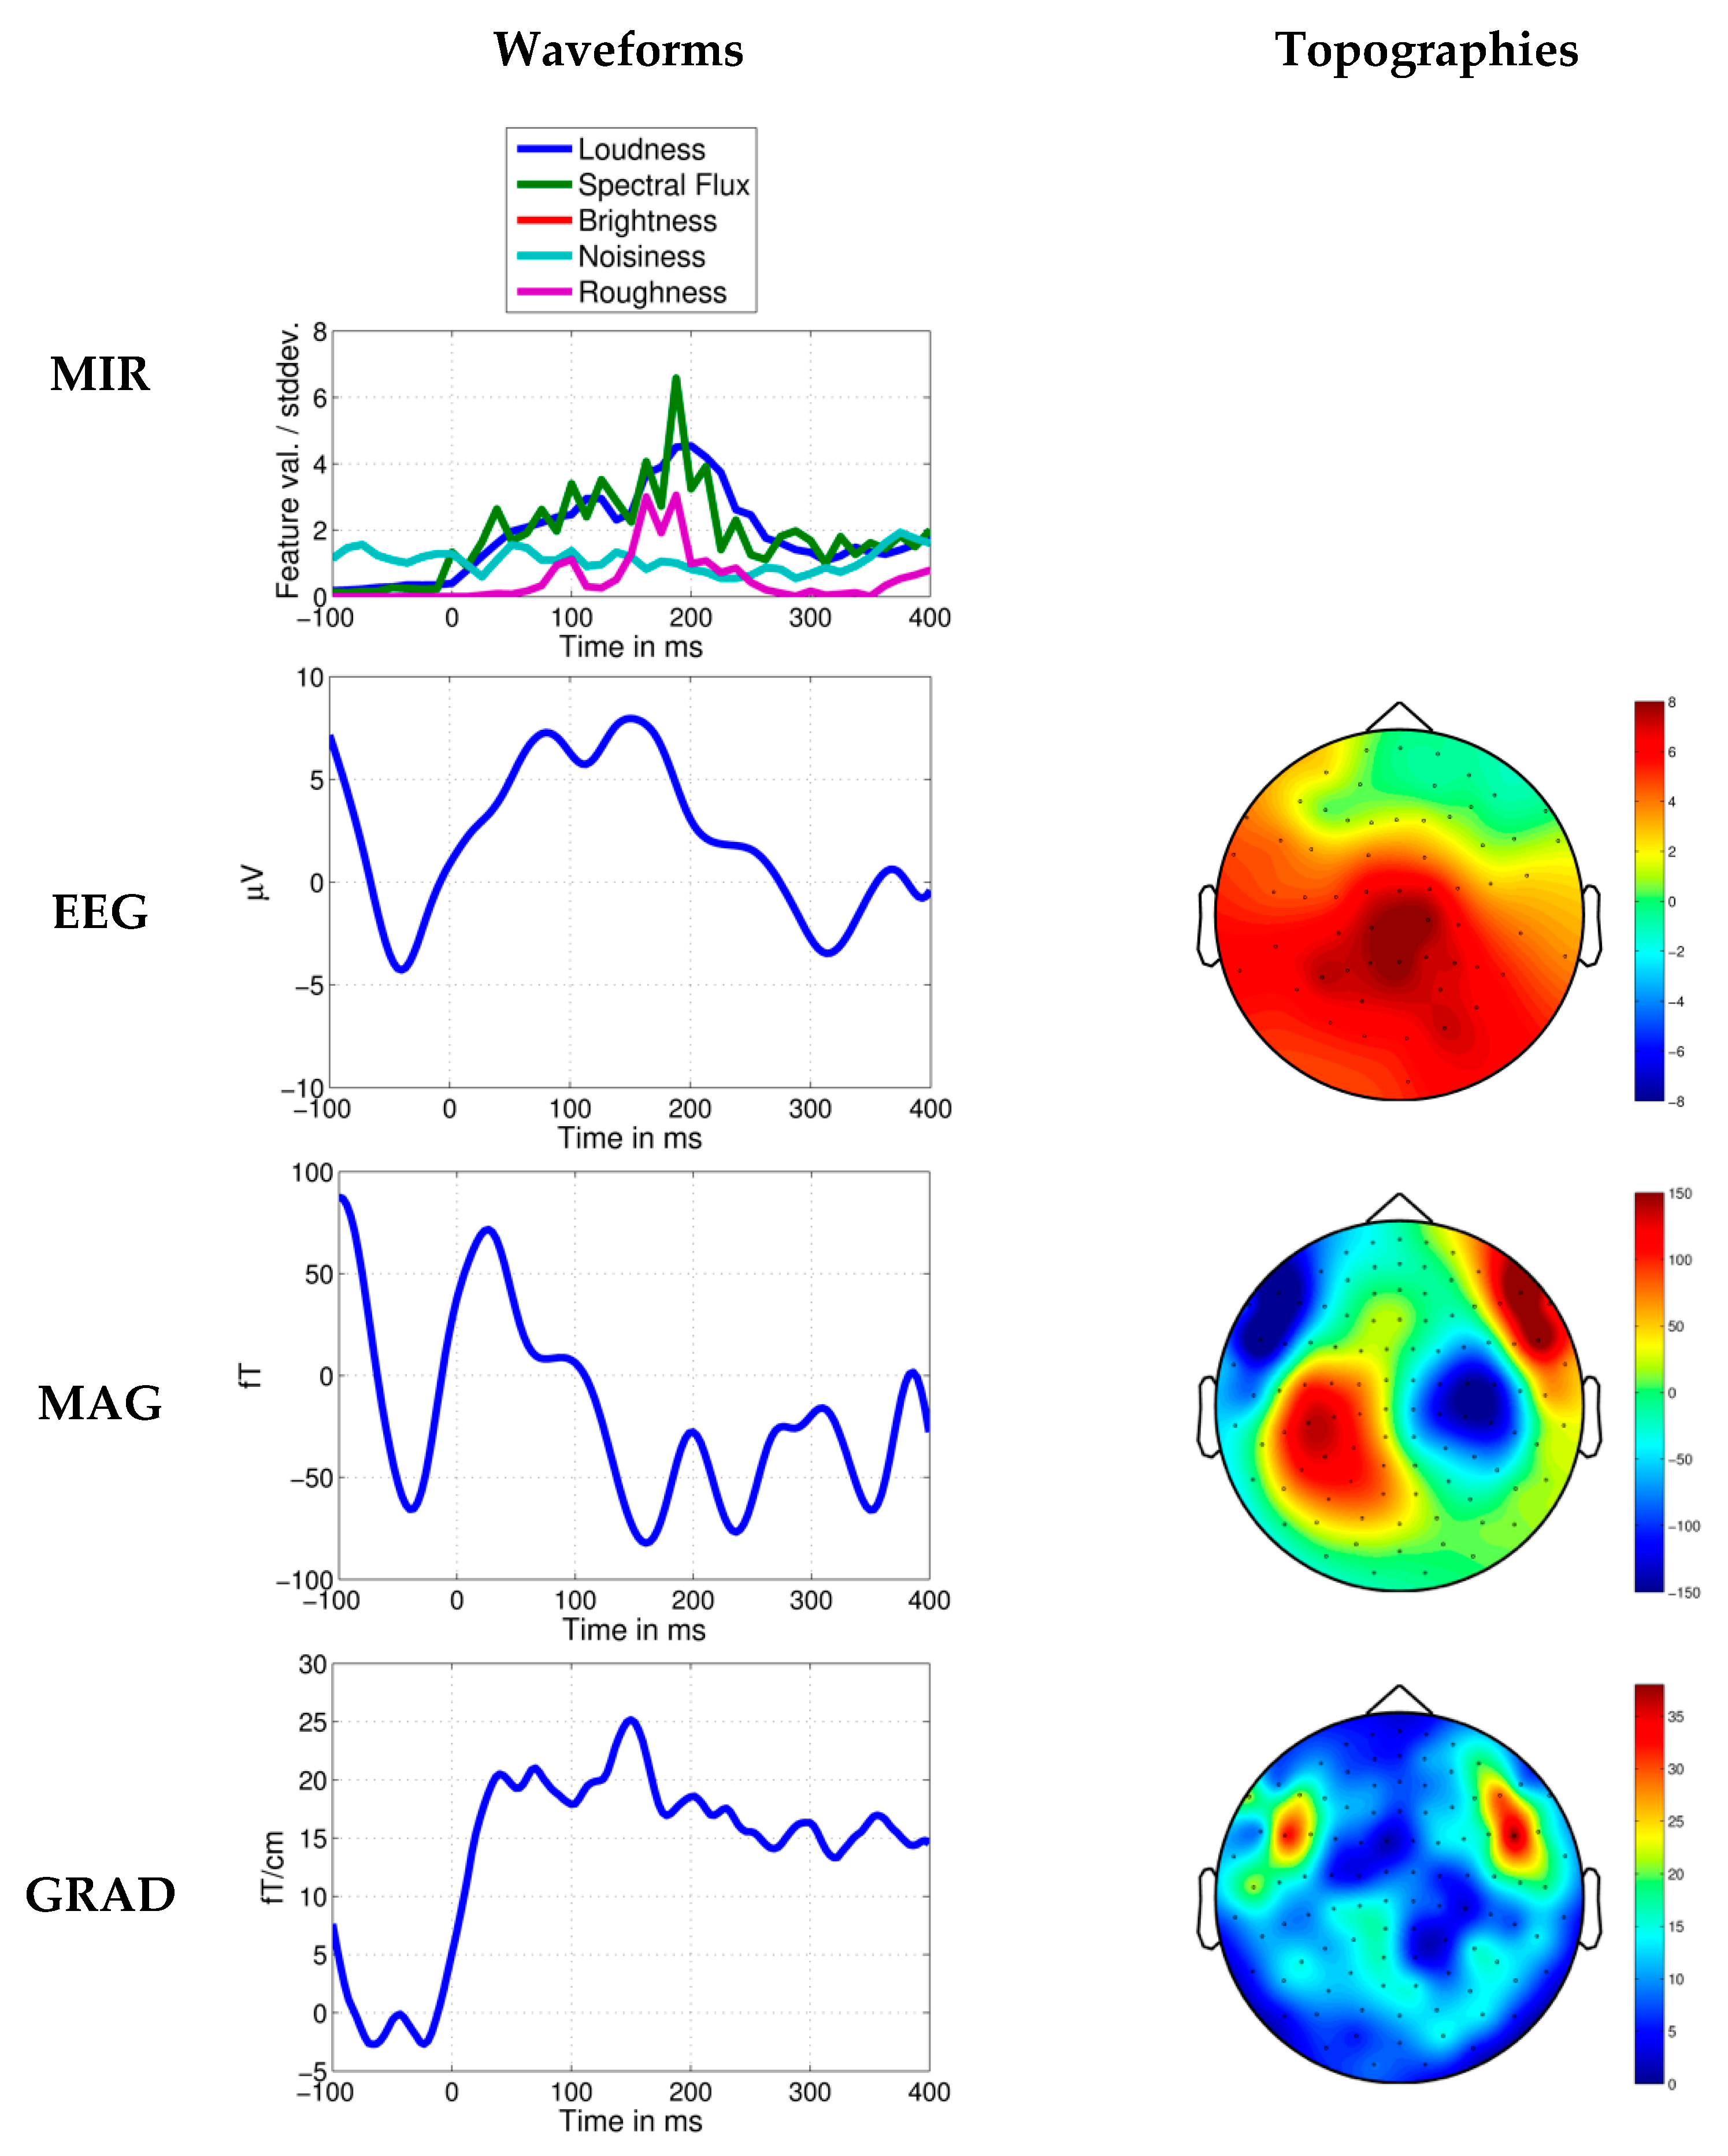
The average brain response across listeners to the excerpt of Igor Stravinsky’s Rite of Spring is shown in Figure 3 (bottom). Similarly, no clear evoked responses are observed for the maximally distant time points extracted randomly in relation to the predictability of the music structure (Figure 4, right). Despite this, the onset of the novel chord in the string group after 198.646 s introduction is identified among the loudness (RMS) and spectral flux increases detected by the automatic method. This chord appears to evoke a novelty related frontal-central negative brain response across the listeners, peaking 150 ms after the stimulus onset (Figure 3, bottom, and Figure 7).
Across listeners, the mean brain response after the onset of the novel chord, measured around the peak amplitude at 150 ± 15 ms, differs significantly from the baseline, t(47) = 2.9, p = 0.006, mean = 7.8 μV (Figure 6, right). However, no responses are significantly exceeding the baseline for the maximally distant loudness (RMS) increases, t(47) = −1.3, p = 0.204, mean = −0.6 μV, or spectral flux increases, t(47) = −0.2, p = 0.834, mean = −0.1 μV.

4. Discussion

We have recently shown that time points in a tango music piece with increases in loudness and timbre-related features eliciting brain responses can be extracted automatically using MIR analysis when the rate of these feature changes is relatively slow [8]. The results currently presented here suggest that for music with relatively fast rates of acoustical feature change (i.e., faster than the 1 s PLIP criteria defined above) it is important to combine the MIR estimates with analysis of the novelty of the music structure to identify measurable brain responses. Two types of brain responses to novel events in music are here investigated. First, it is shown that no clear brain responses are observed for the acoustical increases in the metal rock piece Stream of Consciousness by Dream Theater when the novelty of the musical structure is disregarded. However, a central N1 brain response is elicited for a novel increase in loudness and timbre features. Second, the time points not selected according to the novelty of the music structure in the modern ballet symphony orchestra music Rite of Spring by Igor Stravinsky did not lead to successful extraction of brain responses. However, a frontal-central brain response is observed following the time point of the novel event of the ‘Augurs’ chord. Due to the few cases investigated here, it remains to be concluded in future studies whether the brain responses as those observed here are in fact related to the novelty or to other aspects of the music structure.
It is likely that the relatively fast rate of feature change in the metal rock and modern symphony orchestra pieces investigated in the current study has resulted in the lack of clearly observable brain responses to these music pieces [41,42,43]. Previously applied MIR methods have been able to identify brain responses to slow rates of feature change for musical sounds preceded by silent breaks by combining semi-automatic and manual adjustments [5,6]. Moreover, here we apply a new development of this MIR method, which in addition allows for automatically identify time points with acoustical feature increases evoking brain responses in music, and for slow as well as fast rates of acoustical feature change (i.e., also for music with shorter durations between the acoustical feature increases) (cf. Reference [8]). While the preliminary cases observed in the current study suggest that to identify brain responses in the context of fast rates of acoustical feature changes, it is additionally necessary to identify novel events in the music structure. Earlier studies have attempted to combine analysis of acoustical features in recorded music with analysis of the novelty of music structure based on self-similarity matrices [44,45,46,47]. Though, recent perceptual validation suggests that the events found with the kernel-based self-similarity matrix approach relates mainly to the perception of musical phrase boundaries, and not necessarily to the novelty of the music structure [48]. Therefore, it is relevant in future studies to investigate more possibilities for relating acoustical change detection with analysis of novel events.
A basic property of the brain responses to novel events is the creation of expectations based on a memory model for previously heard acoustical and musical structure [10,11,13,22]. Here we investigated the novel events by means of manual musicological analysis of the music structure. For automatic music analysis, Kohonen neural network models are popular for recognizing chords and tonality in music recordings [1,49,50,51,52], however they have been lacking the temporal information necessary for modeling novelty in music. Therefore, the recent applications of nearby contextual information in time [53], Hidden Markov Models (HMM) and the Viterbi algorithms [54] seem relevant, as these models are able to integrate the transitions from preceding musical chords in the chord recognition. Also, algorithms including memory in modeling of dissonance perception have been developed, showing improved performance in predicting dissonance perceived by listeners when including a memory for the preceding sound material [55]. Such approaches could be useful for automatically identifying time points with novel events in music. Future studies might in addition continue investigating the usage of biologically-inspired neural network models with time integration and memory mechanisms, such as simple recurrent short-term memory models [56], hippocampus-inspired memory models facilitating temporary storage and retrieval for new stimulus patterns [57], or frontal cortex inspired working-memory neural network models enabling selective update-maintenance-retrieval procedures [58] (e.g., which are all freely available in the open source software Emergent [59]).
An additional topic worth to consider with respect to the measurement of brain responses is the attack of the acoustical events in the musical pieces, i.e., the rise in sound amplitude after the initial onset of a sound. The attack is dependent on the instruments involved; for example, a bass drum has a rapid attack shorter than 10 ms, while violins and flutes have relatively slower attacks in the range of 100 ms [60], whereas the MoRI measure was here optimized to measure magnitudes of increases fixed in relation to 50 ms attack curves. The attack can also be modified with music production, altering the acceleration of the rapid increase in acoustical features without modifying the composition. A complication resulting from this issue is that the perception of the rhythmic onset of a sound event in relation to other sound events (called the ‘perceived attack time’) is modulated by the acoustical characteristics of the attack [60]. For example, the slow attack of string instruments, and the initial inharmonic noise and delayed high spectral energy in certain wind or brass instruments, causes a delayed perception of the rhythmic onset in relation to the initial rise in sound amplitude (e.g., strings or saxophones are perceived as rhythmically delayed in relation to a bass drum, even though their attack curves show identical onset times) [60]. For instance, the Spectral Flux measure applied in the current study, which in the MIR Toolbox measures changes in loudness, timbre and pitch simultaneously (by summarizing the level of energy change across all spectral frequency bands), might be relevant for capturing the perceived rhythmic onsets in recordings with low dynamic range or containing wind instruments with delayed high spectral energy [2]. As an example of this, the bass drum, keyboard, guitar and bass with distortion at the novel loudness increase at 20.316 s. in the metal rock piece appears to have a faster attack compared to the strings playing the novel chord at 198.646 s. in the Rite of Spring piece. However, it remains to be investigated in future studies whether the latencies of early cortical responses are related to the perceived sound onset, or they relate to a delayed perception of the rhythmic onset influenced by the attack characteristics of recorded music (e.g., see Reference [16]).

5. Conclusions

We tested a new method, which uses MIR to automatically and accurately extract time points with acoustic-feature changes in music and from those time points obtain measurable brain responses. Preliminary results of the present study however suggest that the method is less effective for music with fast rates of acoustical feature change, unless analysis of novel events in the music structure is also taken into consideration.

Author Contributions

N.T.H. contributed to the development of the methods, preprocessed and analyzed the data and wrote the paper. M.K. collected the data and took part in the writing of the paper. P.V. contributed to the design of the experiment and writing of the paper. E.B. contributed to the design of the experiment, development of the methods, the data preprocessing and analysis and the writing of the paper.

Acknowledgments

Center for Music in the Brain is funded by the Danish National Research Foundation (DNRF117).

Conflicts of Interest

The authors declare that there is no conflict of interests regarding the publication of this paper.

References

  1. Lartillot, O.; Toiviainen, P. A matlab toolbox for musical feature extraction from audio. In Proceedings of the International Conference on Digital Audio Effects, Bordeaux, France, 10–15 September 2007. [Google Scholar]
  2. Alías, F.; Socoró, J.; Sevillano, X. A review of physical and perceptual feature extraction techniques for speech, music and environmental sounds. Appl. Sci. 2016, 6, 143. [Google Scholar] [CrossRef]
  3. Alluri, V.; Toiviainen, P.; Jaaskelainen, I.P.; Glerean, E.; Sams, M.; Brattico, E. Large-scale brain networks emerge from dynamic processing of musical timbre, key and rhythm. Neuroimage 2012, 59, 3677–3689. [Google Scholar] [CrossRef] [PubMed]
  4. Burunat, I.; Toiviainen, P.; Alluri, V.; Bogert, B.; Ristaniemi, T.; Sams, M.; Brattico, E. The reliability of continuous brain responses during naturalistic listening to music. Neuroimage 2016, 124, 224–231. [Google Scholar] [CrossRef] [PubMed]
  5. Poikonen, H.; Alluri, V.; Brattico, E.; Lartillot, O.; Tervaniemi, M.; Huotilainen, M. Event-related brain responses while listening to entire pieces of music. Neuroscience 2016, 312, 58–73. [Google Scholar] [CrossRef] [PubMed]
  6. Poikonen, H.; Toiviainen, P.; Tervaniemi, M. Early auditory processing in musicians and dancers during a contemporary dance piece. Sci. Rep. 2016, 6, 33056. [Google Scholar] [CrossRef] [PubMed]
  7. Sturm, I.; Dahne, S.; Blankertz, B.; Curio, G. Multi-variate eeg analysis as a novel tool to examine brain responses to naturalistic music stimuli. PLoS ONE 2015, 10, e0141281. [Google Scholar] [CrossRef] [PubMed]
  8. Haumann, N.T.; Santacruz, J.L.; Kliuchko, M.; Vuust, P.; Brattico, E. Automatic capture of acoustic changes in real pieces of music: Transient and non-transient brain responses. 2018; in preparation. [Google Scholar]
  9. Hamalainen, M.; Hari, R.; Ilmoniemi, R.J.; Knuutila, J.; Lounasmaa, O.V. Magnetoencephalography—Theory, instrumentation, and applications to noninvasive studies of the working human brain. Rev. Mod. Phys. 1993, 65, 413–497. [Google Scholar] [CrossRef]
  10. Vuust, P.; Ostergaard, L.; Pallesen, K.J.; Bailey, C.; Roepstorff, A. Predictive coding of music—Brain responses to rhythmic incongruity. Cortex 2009, 45, 80–92. [Google Scholar] [CrossRef] [PubMed]
  11. Gebauer, L.; Kringelbach, M.L.; Vuust, P. Ever-changing cycles of musical pleasure: The role of dopamine and anticipation. Psychomusicol. Music Mind Brain 2012, 22, 152–167. [Google Scholar] [CrossRef]
  12. Rohrmeier, M.A.; Koelsch, S. Predictive information processing in music cognition. A critical review. Int. J. Psychophysiol. 2012, 83, 164–175. [Google Scholar] [CrossRef] [PubMed]
  13. Brattico, E.; Bogert, B.; Jacobsen, T. Toward a neural chronometry for the aesthetic experience of music. Front. Psychol. 2013, 4, 206. [Google Scholar] [CrossRef] [PubMed]
  14. Tillmann, B.; Poulin-Charronnat, B.; Bigand, E. The role of expectation in music: From the score to emotions and the brain. Wires Cogn. Sci. 2014, 5, 105–113. [Google Scholar] [CrossRef] [PubMed]
  15. Williams, D. Tracking timbral changes in metal productions from 1990 to 2013. Met. Music Stud. 2014, 1, 39–68. [Google Scholar] [CrossRef]
  16. Naatanen, R.; Picton, T. The N1 wave of the human electric and magnetic response to sound—A review and an analysis of the component structure. Psychophysiology 1987, 24, 375–425. [Google Scholar] [CrossRef] [PubMed]
  17. Garza-Villarreal, E.A.; Brattico, E.; Leino, S.; Ostergaard, L.; Vuust, P. Distinct neural responses to chord violations: A multiple source analysis study. Brain Res. 2011, 1389, 103–114. [Google Scholar] [CrossRef] [PubMed]
  18. Haumann, N.T.; Vuust, P.; Bertelsen, F.; Garza-Villarreal, E.A. Influence of musical enculturation on brain responses to metric deviants. Front. Neurosci. 2018, 12, 218. [Google Scholar] [CrossRef]
  19. Kliuchko, M.; Vuust, P.; Tervaniemi, M.; Bogert, B.; Sams, M.; Toiviainen, P.; Brattico, E. Fractionating music-derived neuroplasticity: Neural correlates of active versus passive musical style preference. 2018; in preparation. [Google Scholar]
  20. Koelsch, S.; Kilches, S.; Steinbeis, N.; Schelinski, S. Effects of unexpected chords and of performer’s expression on brain responses and electrodermal activity. PLoS ONE 2008, 3, e2631. [Google Scholar] [CrossRef] [PubMed] [Green Version]
  21. Neuhaus, C. Perceiving musical scale structures—A cross-cultural event-related brain potentials study. Ann. N. Y. Acad. Sci. 2003, 999, 184–188. [Google Scholar] [CrossRef] [PubMed]
  22. Pearce, M.T.; Ruiz, M.H.; Kapasi, S.; Wiggins, G.A.; Bhattacharya, J. Unsupervised statistical learning underpins computational, behavioural, and neural manifestations of musical expectation. Neuroimage 2010, 50, 302–313. [Google Scholar] [CrossRef] [PubMed]
  23. Vuust, P.; Brattico, E.; Seppanen, M.; Naatanen, R.; Tervaniemi, M. Practiced musical style shapes auditory skills. Neurosci. Music IV Learn. Mem. 2012, 1252, 139–146. [Google Scholar] [CrossRef] [PubMed]
  24. Alluri, V. Musical expertise modulates functional connectivity of limbic regions during continuous music listening. Psychomusicology 2015, 25, 443–454. [Google Scholar] [CrossRef]
  25. Burunat, I.; Brattico, E.; Puolivali, T.; Ristaniemi, T.; Sams, M.; Toiviainen, P. Action in perception: Prominent visuo-motor functional symmetry in musicians during music listening. PLoS ONE 2015, 10, e0138238. [Google Scholar] [CrossRef] [PubMed]
  26. Carlson, E.; Saarikallio, S.; Toiviainen, P.; Bogert, B.; Kliuchko, M.; Brattico, E. Maladaptive and adaptive emotion regulation through music: A behavioral and neuroimaging study of males and females. Front. Hum. Neurosci. 2015, 9, 466. [Google Scholar] [CrossRef] [PubMed]
  27. Kliuchko, M.; Heinonen-Guzejev, M.; Monacis, L.; Gold, B.P.; Heikkila, K.V.; Spinosa, V.; Tervaniemi, M.; Brattico, E. The association of noise sensitivity with music listening, training, and aptitude. Noise Health 2015, 17, 350–357. [Google Scholar] [CrossRef] [PubMed]
  28. Haumann, N.T.; Parkkonen, L.; Kliuchko, M.; Vuust, P.; Brattico, E. Comparing the performance of popular MEG/EEG artifact correction methods in an evoked-response study. Comput. Intell. Neurosci. 2016, 2016, 3. [Google Scholar] [CrossRef] [PubMed]
  29. Kliuchko, M.; Heinonen-Guzejev, M.; Vuust, P.; Tervaniemi, M.; Brattico, E. A window into the brain mechanisms associated with noise sensitivity. Sci. Rep. 2016, 6, 39236. [Google Scholar] [CrossRef] [PubMed]
  30. Alluri, V.; Toiviainen, P.; Burunat, I.; Kliuchko, M.; Vuust, P.; Brattico, E. Connectivity patterns during music listening: Evidence for action-based processing in musicians. Hum. Brain Mapp. 2017, 38, 2955–2970. [Google Scholar] [CrossRef] [PubMed]
  31. Bonetti, L.; Haumann, N.T.; Vuust, P.; Kliuchko, M.; Brattico, E. Risk of depression enhances auditory pitch discrimination in the brain as indexed by the mismatch negativity. Clin. Neurophysiol. 2017, 128, 1923–1936. [Google Scholar] [CrossRef] [PubMed]
  32. Burunat, I.; Tsatsishvili, V.; Brattico, E.; Toiviainen, P. Coupling of action-perception brain networks during musical pulse processing: Evidence from region-of-interest-based independent component analysis. Front. Hum. Neurosci. 2017, 11, 230. [Google Scholar] [CrossRef] [PubMed]
  33. Kliuchko, M.; Puolivali, T.; Heinonen-Guzejev, M.; Tervaniemi, M.; Toiviainen, P.; Sams, M.; Brattico, E. Neuroanatomical substrate of noise sensitivity. Neuroimage 2017, 167, 309–315. [Google Scholar] [CrossRef] [PubMed]
  34. Saari, P.; Burunat, I.; Brattico, E.; Toiviainen, P. Decoding musical training from dynamic processing of musical features in the brain. Sci. Rep. 2018, 8, 708. [Google Scholar] [CrossRef] [PubMed]
  35. Thiede, A.; Suppanen, E.; Brattico, E.; Sams, M.; Parkkonen, L. Magnetoencephalographic inter-subject correlation using continuous music stimuli. 2018; in preparation. [Google Scholar]
  36. Bonetti, L.; Haumann, N.T.; Brattico, E.; Kliuchko, M.; Vuust, P.; Näätänen, R. Working memory modulates frontal mismatch negativity responses to sound intensity and slide deviants. Brain Res. 2018. submitted. [Google Scholar]
  37. Oostenveld, R.; Fries, P.; Maris, E.; Schoffelen, J.M. Fieldtrip: Open source software for advanced analysis of MEG, EEG, and invasive electrophysiological data. Comput. Intell. Neurosci. 2011, 2011, 1. [Google Scholar] [CrossRef] [PubMed]
  38. Plomp, R.; Levelt, W.J.M. Tonal consonance and critical bandwidth. J. Acoust. Soc. Am. 1965, 38, 548–560. [Google Scholar] [CrossRef] [PubMed]
  39. Sethares, W.A. Consonance-based spectral mappings. Comput. Music J. 1998, 22, 56–72. [Google Scholar] [CrossRef]
  40. Chua, D.K.L. Rioting with stravinsky: A particular analysis of the “rite of spring”. Music Anal. 2007, 26, 59–109. [Google Scholar] [CrossRef]
  41. Picton, T.W.; Woods, D.L.; Baribeaubraun, J.; Healey, T.M.G. Evoked-potential audiometry. J. Otolaryngol. 1977, 6, 90–119. [Google Scholar]
  42. Picton, T.W.; Woods, D.L.; Proulx, G.B. Human auditory sustained potentials. 2. Stimulus relationships. Electroencephalogr. Clin. Neurophysiol. 1978, 45, 198–210. [Google Scholar] [CrossRef]
  43. Polich, J.; Aung, M.; Dalessio, D.J. Long latency auditory evoked potentials: Intensity, inter-stimulus interval, and habituation. Pavlov. J. Biol. Sci. 1988, 23, 35–40. [Google Scholar] [PubMed]
  44. Müller, M.; Prätzlich, T.; Driedger, J. A cross-version approach for stabilizing tempo-based novelty detection. In Proceedings of the ISMIR, Porto, Portugal, 8–12 October 2012. [Google Scholar]
  45. Flexer, A.; Pampalk, E.; Widmer, G. Novelty detection based on spectral similarity of songs. In Proceedings of the ISMIR, London, UK, 11–15 September 2005. [Google Scholar]
  46. Dubnov, S.; McAdams, S.; Reynolds, R. Structural and affective aspects of music from statistical audio signal analysis. J. Assoc. Inf. Sci. Technol. 2006, 57, 1526–1536. [Google Scholar] [CrossRef]
  47. Jun, S.; Rho, S.; Hwang, E. Music structure analysis using self-similarity matrix and two-stage categorization. Multimed. Tools Appl. 2015, 74, 287–302. [Google Scholar] [CrossRef]
  48. Hartmann, M.; Lartillot, O.; Toiviainen, P. Musical Feature and Novelty Curve Characterizations as Predictors of Segmentation Accuracy. In Proceedings of the Smc 2017: Proceedings of the 14th Sound and Music Computing Conference, Espoo, Finland, 5–8 July 2017; Lokki, T., Pätynen, J., Välimäki, V., Eds.; pp. 365–372. [Google Scholar]
  49. Kallinen, K. Emotional ratings of music excerpts in the western art music repertoire and their self-organization in the kohonen neural network. Psychol. Music 2005, 33, 373–393. [Google Scholar] [CrossRef]
  50. Tillmann, B.; Bharucha, J.J.; Bigand, E. Implicit learning of tonality: A self-organizing approach. Psychol. Rev. 2000, 107, 885–913. [Google Scholar] [CrossRef] [PubMed]
  51. Toiviainen, P.; Krumhansl, C.L. Measuring and modeling real-time responses to music: The dynamics of tonality induction. Perception 2003, 32, 741–766. [Google Scholar] [CrossRef] [PubMed]
  52. Toiviainen, P. Visualization of tonal content with self-organizing maps and self-similarity matrices. Comput. Entertain. CIE 2005, 3, 3. [Google Scholar] [CrossRef]
  53. Collins, T.; Tillmann, B.; Barrett, F.S.; Delbe, C.; Janata, P. A combined model of sensory and cognitive representations underlying tonal expectations in music: From audio signals to behavior. Psychol. Rev. 2014, 121, 33–65. [Google Scholar] [CrossRef] [PubMed]
  54. Rao, Z.; Guan, X.; Teng, J. Chord recognition based on temporal correlation support vector machine. Appl. Sci. 2016, 6, 157. [Google Scholar] [CrossRef]
  55. Jensen, K. Sensory dissonance using memory model. Dan. Musicol. Online Spec. Ed. 2015, 59–68. http://www.danishmusicologyonline.dk/arkiv/arkiv_dmo/dmo_saernummer_2015/dmo_saernummer_2015_musik_hjerneforskning_03.pdf.
  56. Sak, H.; Senior, A.; Beaufays, F. Long short-term memory recurrent neural network architectures for large scale acoustic modeling. In Proceedings of the INTERSPEECH, Singapore, 14–18 September 2014; pp. 338–342. [Google Scholar]
  57. Mcclelland, J.L.; Mcnaughton, B.L.; Oreilly, R.C. Why there are complementary learning-systems in the hippocampus and neocortex—Insights from the successes and failures of connectionist models of learning and memory. Psychol. Rev. 1995, 102, 419–457. [Google Scholar] [CrossRef] [PubMed]
  58. Frank, M.J.; Loughry, B.; O’Reilly, R.C. Interactions between frontal cortex and basal ganglia in working memory: A computational model. Cogn. Affect. Behav. Neurosci. 2001, 1, 137–160. [Google Scholar] [CrossRef] [PubMed]
  59. O’Reilly, R.C.; Munakata, Y.; Frank, M.J.; Hazy, T.E. Computational Cognitive Neuroscience, 1st ed.; Wiki Book: Boulder, CO, USA, 2012. [Google Scholar]
  60. Gordon, J.W. The perceptual attack time of musical tones. J. Acoust. Soc. Am. 1987, 82, 88–105. [Google Scholar] [CrossRef] [PubMed]
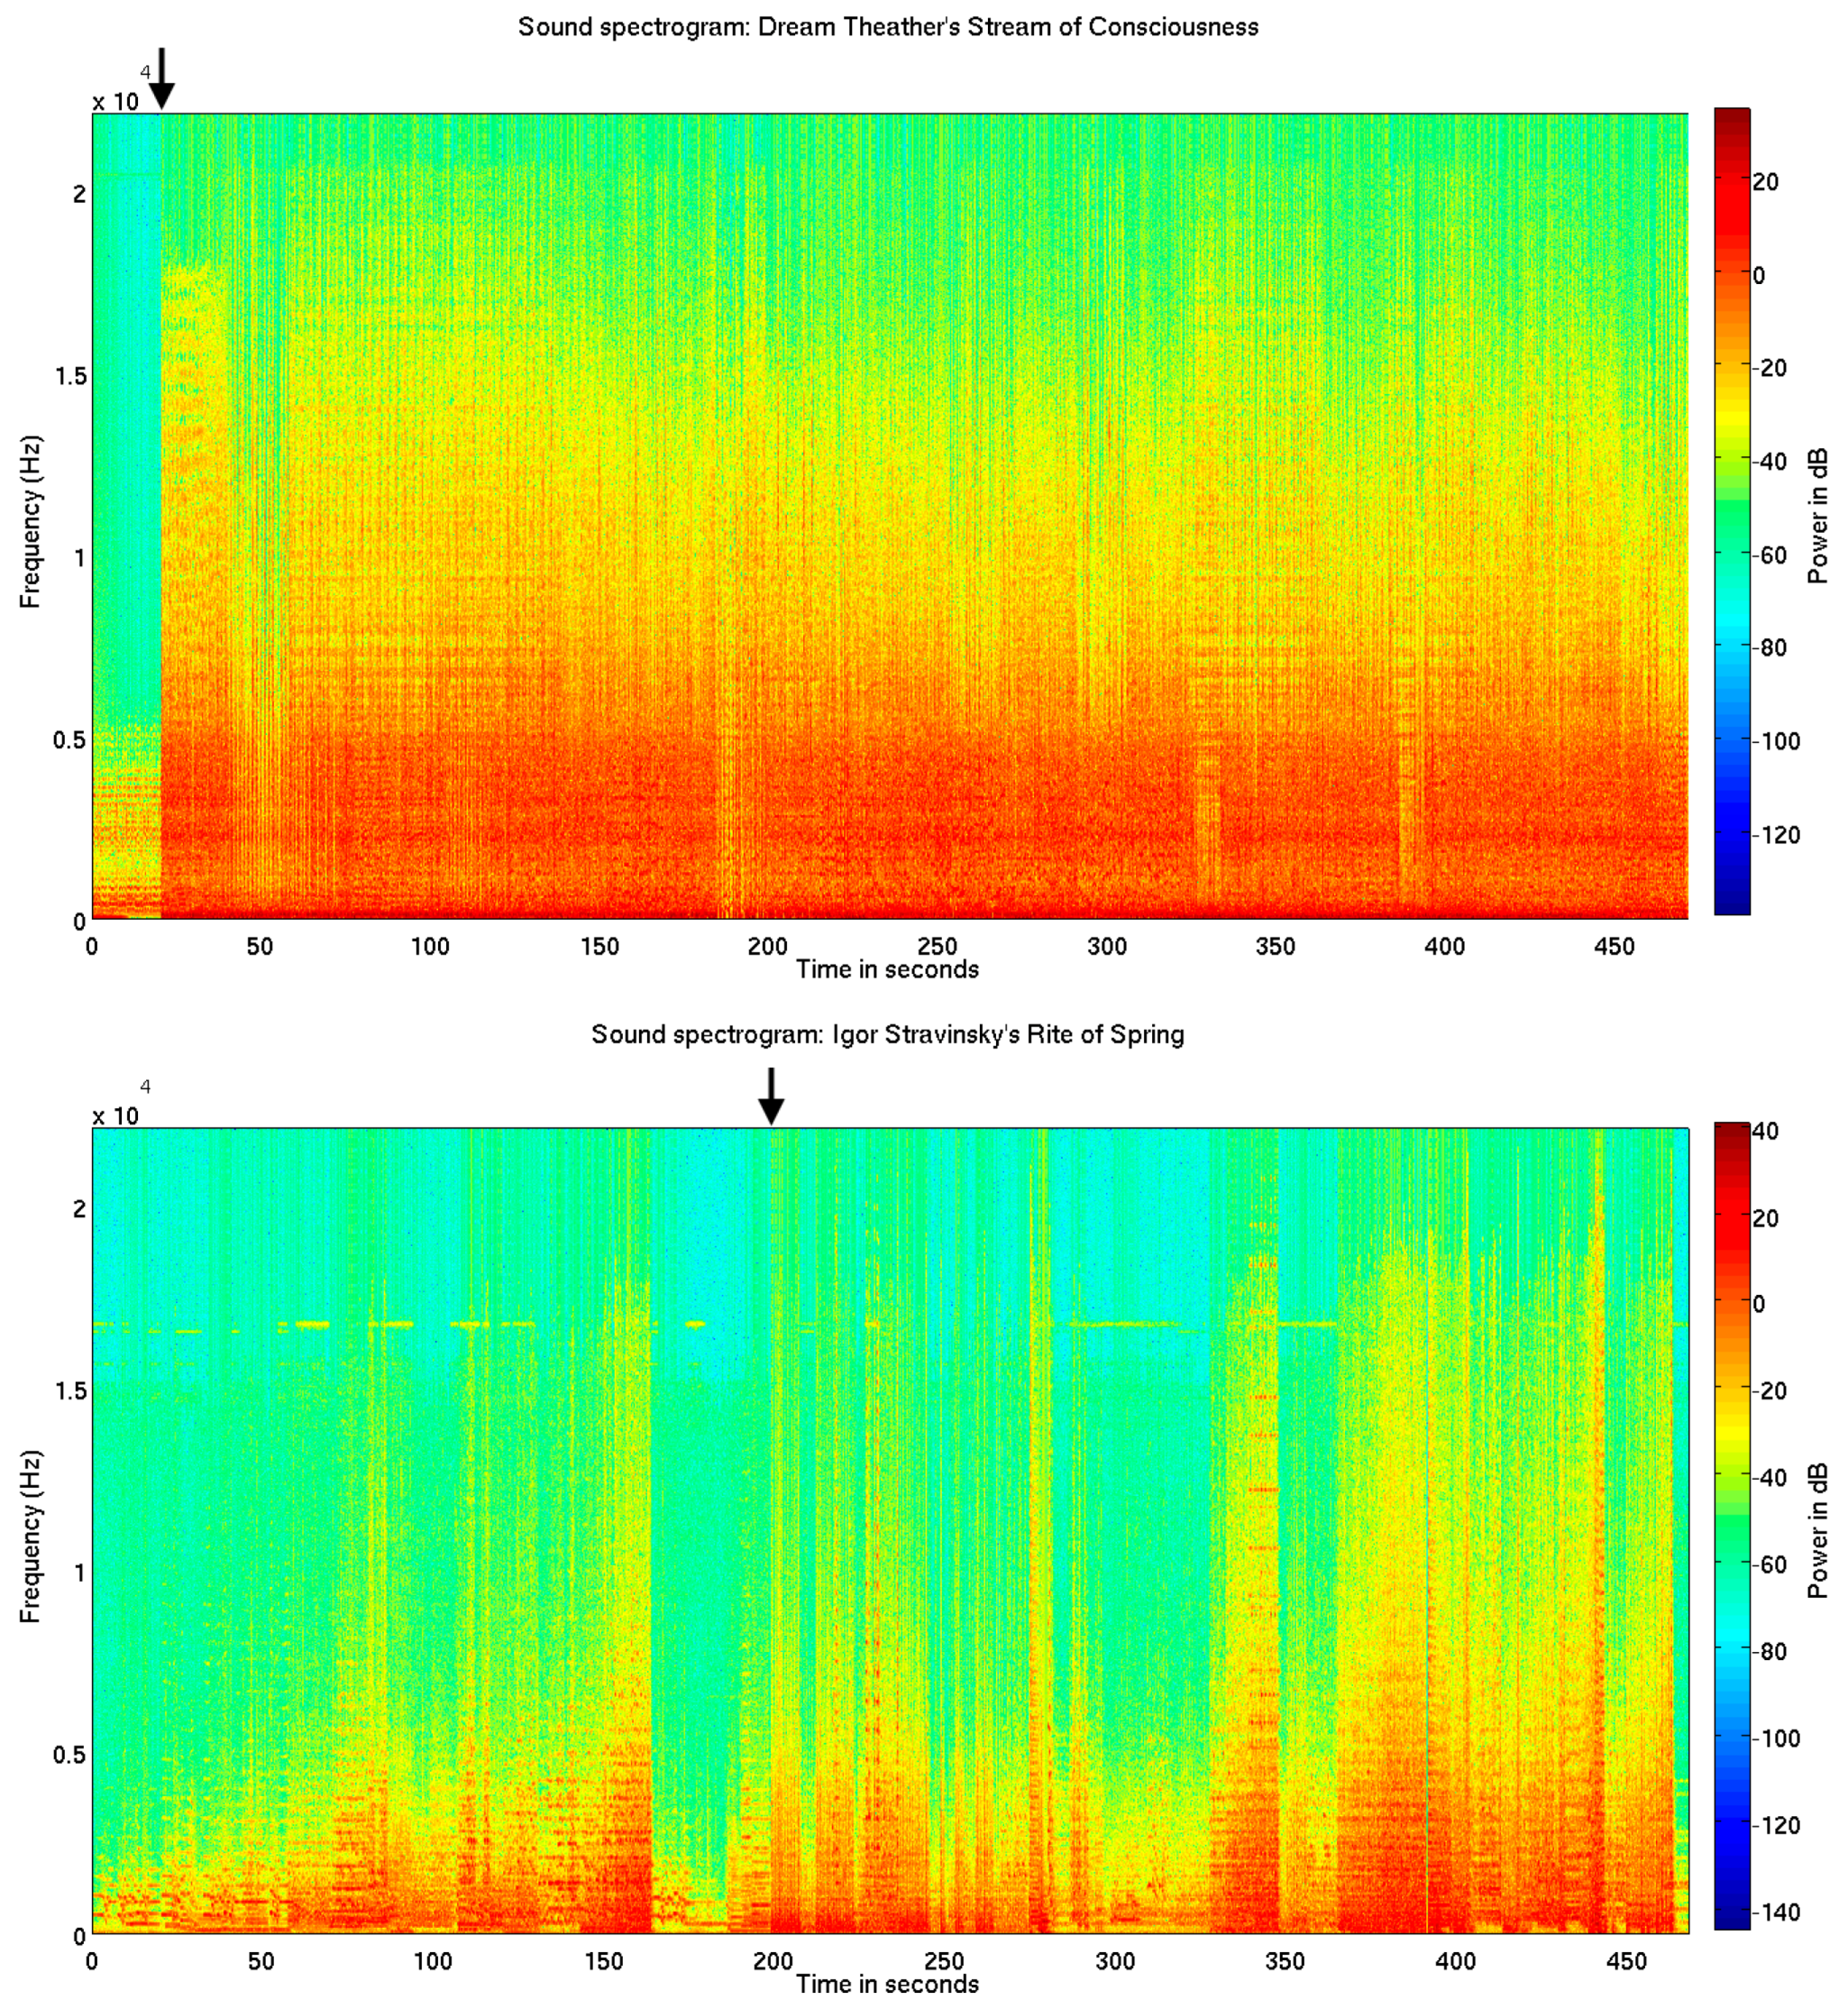
Figure 1. Sound spectrograms. Above is shown sound spectrograms for the metal/rock piece Stream of Consciousness (SC) (top) and the modern orchestral ballet music Rite of Spring (RS) (bottom). The novel loudness and brightness increase can be seen at 20.316 s (top), and the inharmonic frequency distribution of the unconventional polychord can be seen at 198.646 s (bottom).
Applsci 08 00716 g001
Figure 2. Brain responses to the tango piece measured with electroencephalography (EEG). Showing average brain responses to 10 loudness (RMS) and 10 spectral flux increases using the same method as applied in the current study. The time scale begins 100 ms before the feature increases (at −100 ms) and the feature increases start at 0 ms.
Applsci 08 00716 g002
Figure 3. EEG waveforms. Showing grand average EEG across listeners measured at the Cz electrode. Responses to the novel loudness increase at 20.316 s (top) and the novel chord at 198.646 s (bottom) are visible.
Applsci 08 00716 g003
Figure 4. EEG responses to maximally distant acoustical feature increases. Average EEG responses are shown for Dream Theater’s Stream of Consciousness (left) and Igor Stravinsky’s Rite of Spring (right).
Applsci 08 00716 g004
Figure 5. Response to novel loudness increase in Dream Theater’s Stream of Consciousness. Average MIR feature values per standard deviation, EEG, MEG axial magnetometer (MAG) and MEG planar gradiometer (GRAD) waveforms shown 100 ms before and 400 ms after the time point at 20.316 s. Topographies in relation to the head are shown for the negative N1-like brain response measured in a time window of ±15 ms around the peak. In the MEG topographies it can be seen that the brain response is strongest in sensors located approximately above brain regions involved in sound processing.
Applsci 08 00716 g005
Figure 6. Brain responses to a novel event compared to maximally distant feature increases. Histograms showing amplitudes of brain response in μV and number of participants responding within each voltage bin differing by steps of 5 μV. The brain responses are shown for the maximally distant loudness (RMS) (blue) and spectral flux increases (green) and for the novel loudness increase (red, left) and novel chord (red, right). The fit of normal distributions is indicated by solid lines.
Applsci 08 00716 g006
Figure 7. Response to the ‘Augurs’ chord in Stravinsky’s Rite of Spring. Average MIR feature values per standard deviation, EEG, MEG axial magnetometer (MAG) and MEG planar gradiometer (GRAD) waveforms shown 100 ms before and 400 ms after the time point at 198.646 s. Topographies in relation to the head are shown for the anterior MMN/ERAN-like brain response measured in a time window of ±15 ms around the peak. The MEG topographies suggest that frontal-central brain regions are involved in the response.
Applsci 08 00716 g007
Table 1. Automatically extracted time points. The number of peaks in the music information retrieval (MIR) feature increases, n magnitude of rapid increase (MoRI) peaks, corresponds to the MIR feature increase peaks among the 30% highest of the MoRI values. The assumed best time points, n time points, are the number of automatically extracted time points. For the assumed best time points with feature increase evoking brain responses the median PLIP in seconds and distance to previous time points in seconds are shown with ranges in parenthesis.
PieceFeaturen MoRI Peaksn Time PointsPLIP (s.)Distance to Prev. (s.)
AN
(tango)
RMS amplitude1773101.502
(1.009–5.604)
14.710
(9.574–94.563)
Spectral flux3009102.010
(1.27–5.601)
13.355
(7.932–130.003)
Brightness2737101.392
(1.069–4.635)
9.961
(5.917–41.248)
Zero-crossing rate2628101.810
(1.262–3.723)
11.219
(6.950–50.958)
Roughness2649104.747
(1.056–32.270)
25.715
(10.576–93.774)
SC
(metal rock)
RMS amplitude250951.139
(1.009–14.782)
7.869
(5.105–91.639)
Spectral flux319851.239
(1.176–1.881)
68.7329
(20.286–198.027)
Brightness31720--
Zero-crossing rate26511--
Roughness35411--
RS
(symphonic)
RMS amplitude2235103.823
(1.049–13.246)
17.882
(9.084–66.265)
Spectral flux3193102.681
(1.182–6.720)
10.208
(7.512–53.475)
Brightness3078101.425
(1.079–2.814)
13.961
(4.675–84.237)
Zero-crossing rate2884101.313
(1.016–1.945)
22.206
(5.131–61.517)
Roughness2820104.494
(1.062–30.552)
24.102
(12.947–54.451)