Vacuum Ultraviolet Single-Photon Postionization of Amino Acids

Institute of Atomic and Molecular Sciences, Academia Sinica, P.O. Box 23-166, Taipei 10617, Taiwan
*
Author to whom correspondence should be addressed.
Appl. Sci. 2018, 8(5), 699; https://doi.org/10.3390/app8050699
Submission received: 29 March 2018
/
Revised: 25 April 2018
/
Accepted: 27 April 2018
/
Published: 2 May 2018
(This article belongs to the Special Issue Photoionization Mass Spectrometry)
Abstract
:In this study, ultraviolet (UV) laser desorption and vacuum UV single-photon (VUV SP) postionization were performed to ionize and successfully analyze 20 common amino acids. The analytical merit and efficiency of the ionization was compared with those of conventional UV matrix-assisted laser desorption ionization (UV-MALDI). A VUV light source (118 nm) was generated from the ninth harmonic of a Q-switched Nd:YAG laser, and the photon number was determined to be larger than 1012 for each laser pulse in the ionization region. In general, the detection sensitivity of VUV-SP-postionization was 10–100 times higher than that of conventional UV-MALDI. In particular, the ion signal from VUV-SP-postionization was considerably larger than that from UV-MALDI for analytes with low proton affinity such as glycine. However, some fragmentation of intact ions was observed in VUV-SP-postionization. Quantitative analysis performed using a glycine/histidine mixture and tryptophan/phenylalanine mixture revealed that the dynamic range of VUV-SP-postionization was one order of magnitude larger than that of UV-MALDI, indicating that VUV-SP-postionization is suitable for the quantitative analysis of amino acids.
1. Introduction
Matrix-assisted laser desorption/ionization (MALDI) mass spectrometry, introduced in the late 1980s by Hillenkamp et al. [1,2], has been widely used in the characterization of biomolecules. Various small matrix molecules can be used to desorb and ionize biomolecules, such as peptides, proteins, saccharides, and DNA, as intact ions. MALDI is one of the most crucial ionization methods for the mass spectrometry of biomolecules because of its soft ionization and high sensitivity.
The quality of MALDI-MS spectra is strongly dependent on numerous factors, such as the photophysical and photochemical properties of the matrix and analytes [3,4,5,6,7,8,9,10,11,12] and laser irradiation conditions [13,14,15,16,17,18]. Moreover, selecting a suitable matrix for the target analyte is crucial. The selection of matrices for various analytes has been investigated. For example, 2,5-dihydroxybenzoic acid (2,5-DHB), α-cyano-4-hydroxycinnamic acid (CHCA), and sinapic acid (SA) are suitable for the analysis of peptides and proteins [19,20,21]. 2,5-DHB is suitable for the analysis of carbohydrates and lipids [22,23]. The matrix of 2,4,6-trihydroxyacetophenone (THAP) is used for polar lipids [24], carbohydrates [25,26,27,28], and functional peptides [29,30]. For DNA analysis, 3-hydroxypicolinic acid (3-HPA) is suitable [31,32], and 4-chloro-α-cyanocinnamic acid (Cl-CCA) is appropriate for proteomic analyses [33,34,35].
Studies have indicated that the amount of desorbed analyte neutrals in a MALDI plume is 2 to 8 orders of magnitude higher than that of desorbed analyte ions [36,37], depending on the analyte’s properties. Similar orders of magnitudes were found in MALDI and surface-assisted laser desorption/ionization-mass spectrometry [38]. This large amount of desorbed neutrals has received attention and been investigated. Desorbed neutrals can be ionized by postionization and detected by the same mass spectrometer. The optimal conditions for the postionization of analytes are not as difficult to achieve as those required for MALDI. If postionization efficiency is high, the number of ions produced during postionization can be comparable or even higher than the number produced during conventional UV-MALDI. Postionization provides an alternative approach to obtaining the mass spectra of analytes.
The infrared (IR) laser desorption of a matrix-free sample followed by UV laser multiphoton ionization was previously used to examine the composition of different exogenous materials [39]. Kinsel demonstrated the desorption of pure peptides by using a 266-nm laser pulse followed by 255-nm resonance-enhanced multiphoton ionization (REMPI) [40,41]. Reilly et al. observed parent and fragment ions of tryptophan through postionization using 266-nm REMPI, following the desorption from a rhodamine B/glycerol matrix by using a 532-nm laser pulse [42]. Leisner et al. employed an IR laser for desorption and another IR laser with a different wavelength for REMPI [43].
Single-photon (SP) ionization using vacuum ultraviolet (VUV) irradiation provides an alternative soft ionization method for mass spectrometry [44,45,46,47]. SP ionization induces little or no fragmentation, unlike REMPI. Resonance excitation through an intermediate state, which is essential in REMPI and strongly dependent on the target molecule, is not required in SP ionization. Therefore, VUV SP ionization is a universal ionization method. A molecular fluorine excimer laser that emits approximately pulses of 10-ns pulse width at 157 nm (7.87 eV) is an intensive, convenient VUV source. SP postionization with VUV radiation from a molecular fluorine laser was used to detect antibiotics within intact bacterial colony biofilms [46]. However, most molecules with ionization energy (IE) in the range of 8–10 eV cannot be ionized by photons from a molecular fluorine laser. Chemical derivatization with low-IE tags, such as anthracene, fluorescein, and tryptophan, is required to detect peptides using a 7.87-eV photon source [44,48,49]. Alternatively, a VUV light source with a short wavelength can be used. VUV photon energy tunable from 8.0 to 12.5 eV generated from synchrotron radiation was employed in the SP ionization of antibiotics and extracellular neutrals that were laser desorbed from bacterial biofilms [44]. The VUV light source from synchrotron radiation is a semi-continuous wave source, which is unsuitable for use in pulsed laser desorption and time-of-flight mass spectrometry (TOF-MS).
A VUV source with a short wavelength (118 nm, 10.5 eV) can be obtained using the ninth harmonic generation by focusing the third harmonic (355 nm) of Nd:YAG into a xenon cell [50,51]. This source is used extensively because of its suitable photon energy and short pulse duration (~5 ns), which is appropriate for TOF-MS. Compared with other nonlinear optical generation schemes, which have complicated experimental configurations, ninth harmonic generation from a Nd:YAG laser provides a convenient, low-cost, and compact VUV source for SP ionization in a mass spectrometer. Several SP ionization methods using the ninth harmonic of a Nd:YAG laser coupled with TOF-MS have been demonstrated [52,53,54,55,56].
In this study, the ion signals of 20 common amino acids obtained using UV-MALDI and VUV-SP-postionization were compared. The detection sensitivity of VUV-SP-postionization is generally 100 times higher than that of conventional UV-MALDI. In particular, the ion signal from VUV-SP-postionization is considerably larger than that from UV-MALDI for analytes with low proton affinity, such as glycine [57]. Quantitative measurement was performed using glycine/histidine and tryptophan/phenylalanine mixtures. The measurement indicated that the dynamic range of VUV-SP-postionization is larger than that of UV-MALDI by one order of magnitude. This technique provides a powerful ionization platform for further applications.
2. Experiment
In this study, homemade VUV light source and MALDI/VUV-SP-postionization time-of-flight mass spectrometer (TOF-MS) instruments were used. Figure 1 illustrates part of the experimental setup. Similar homemade instruments have been reported in previous studies [58,59,60,61]. Desorbed ions and neutrals were generated by irradiating a UV-pulsed laser beam from the third harmonic of a Nd:YAG laser (355 nm, 5-ns pulse duration, Minlite II, Continuum, San Jose, CA, USA) on a solid sample surface. The laser beam was focused onto an elliptical spot with an area of on the sample surface. Ions generated through MALDI were analyzed using TOF-MS. Desorbed neutrals from the same UV laser pulse were ionized using a VUV (118-nm) laser pulse, and the ions produced through VUV photoionization were analyzed using the same TOF-MS system. The VUV beam was parallel to the sample surface and overlapped with the plume of desorbed neutrals at a distance of 1–2 mm above the sample surface, where photoionization occurred. The delay between the UV and VUV laser pulses was controlled by a digital delay generator (DG 535, Stanford Research Systems, Inc., Sunnyvale, CA, USA.). The delay was adjusted to 3 μs to achieve optimal temporal overlap between the MALDI plume and VUV photons. The spectra presented herein were obtained by averaging five spectra (20 laser shots for each spectrum). The mass calibration and resolution of UV-MALDI TOF-MS were performed using CsI clusters. The mass calibration and resolution of a VUV-SP-postionization mass spectrometer were performed using 2,5-DHB, THAP, CHCA, SA, and FA matrices. The mass resolution of UV-MALDI and VUV SP was 523 at m/z 393 (, where FWHM stands for the full width at half maximum) and 200 at m/z 168, respectively. The mass resolution was optimized for UV-MALDI; therefore, the resolution of VUV SP was not as good as that of UV-MALDI.
Figure 2 presents a schematic of the VUV laser generation. The 118-nm VUV laser beam was generated through frequency tripling of the UV (355-nm) laser beam in xenon gas. The UV laser beam from the third harmonic of the Nd:YAG laser (355 nm, 5-ns pulse duration, 680 mW, 10 Hz, LS-2137U, LOTIS Tii, Minsk, Belarus) was focused into a Xe cell to generate VUV radiation at the focal point in the Xe cell. Coaxial and expanding UV and VUV laser beams were directed off-axis into a LiF-VUV lens (biconvex, f = 103 mm, diameter = 38.1 mm, Crystran Ltd. Poole, Dorset, UK). The VUV and UV laser beams were separated by the lens because of their different refractive indices. The UV laser beam was blocked by a graphite-coated stainless-steel baffle, whereas the VUV laser beam passed through the stainless-steel baffle and was refocused on the ionization region. The VUV beam size was estimated to be less than 1 mm in diameter at the ionization region.
The VUV photon number of each laser pulse was detected using a homemade Pd detector. There are many materials suitable for detecting VUV; however, to measure the absolute number of VUV photon, the quantum efficiency at the given VUV wavelength has to be known. It just happens that we have a piece of Pd, and Pd is one of the materials suitable for detecting VUV, and the quantum efficiency at 118 nm is known [62]. A metal mesh (transmission efficiency, 88.6%; BM-0117-01; Industrial Netting, Minneapolis, MN, USA), which was floated to 700 V, was placed at a distance of 5 mm in front of the Pd plate. The VUV laser beam passed through the metal mesh and reached the Pd plate. Photoelectrons generated through irradiation by VUV photons on the Pd plate were accelerated by the electric field toward the metal mesh, and the positive pulsed voltage generated in the Pd plate was directly measured using a fast oscilloscope (Infiniium DSO8104A, Agilent, Santa Clara, CA, USA). The Xe pressure was optimized to obtain the maximum number of VUV photons, as measured using the detector.
All amino acids (≥98%) were purchased from Aldrich (St. Louis, MO, USA), whereas 2,5-DHB (98%) and THAP (99%) were purchased from Acros (Waltham, MA, USA). All chemicals were directly used without additional purification. A matrix solution (100 μmol/mL) was prepared in 75% acetonitrile and 25% deionized water, whereas an amino acid stock solution was prepared by dissolving 10 μmol of dried analyte in 1 mL of deionized water. In an experiment detecting amino acids, the matrix and analyte solution were premixed in a 20:1 ratio in a vortex for several minutes to facilitate mixing. In quantitative analysis experiments, glycine/histidine or tryptophan/phenylalanine were premixed with different molar ratios, which were then mixed with matrix solution in a matrix-to-total-analyte ratio of 100:1. Each sample was dried in vacuum after pipetting 4 μL of a mixture onto a stainless-steel plate, which was then analyzed using the homemade MALDI/VUV postionization and TOF-MS system.
3. Results
(a) VUV photon number
The VUV photon number of each laser pulse was determined using the homemade VUV detector. The VUV photon number increased with an increase in laser energy from 43 to 60 mJ/pulse. However, the photon number did not considerably increase when the laser energy was increased from 70 to 100 mJ/pulse. The VUV photon number of each laser pulse was calculated from the measurement using Ohm’s law:
where 16 V was the measured pulse height from the VUV detector with an oscilloscope impedance set at 50 Ω, and 7 ns was the measured pulse width (full width at a half maximum). The transmission efficiency of the metal mesh and photoelectron quantum efficiency of Pd at 118 nm are 0.886 and approximately 0.01, respectively [62].
(b) Mass spectra obtained using UV-MALDI and VUV-SP-postionization
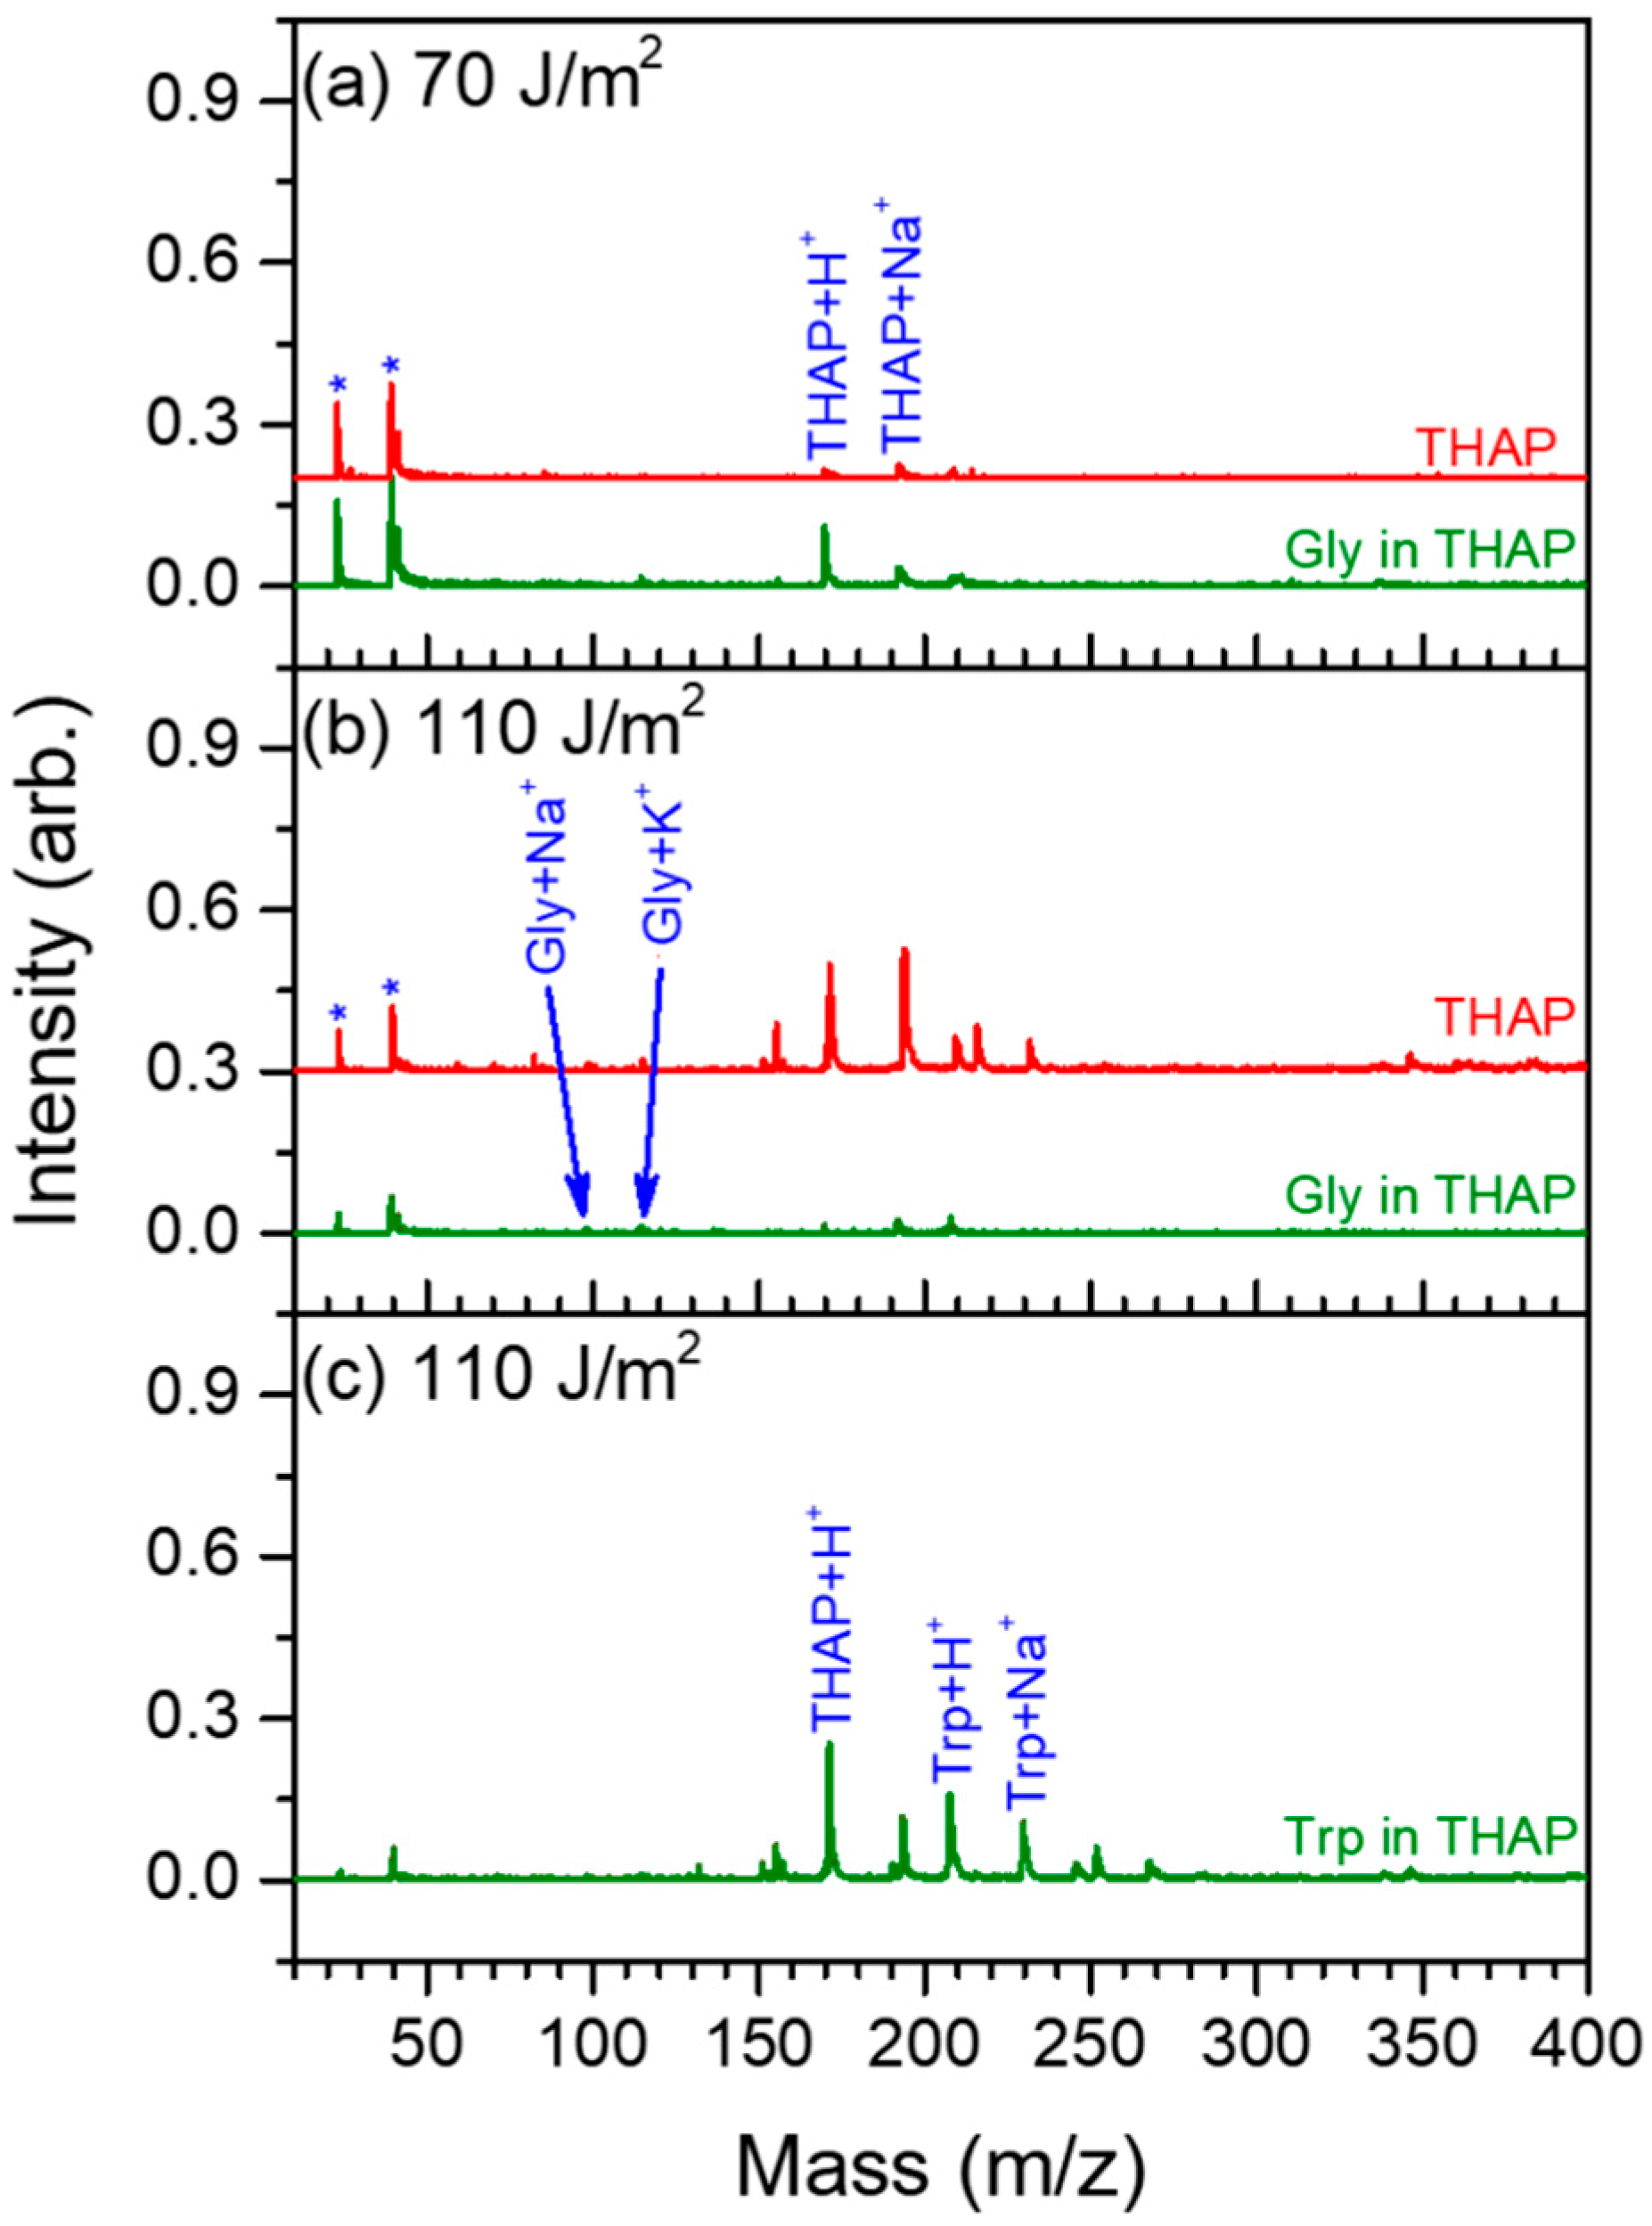
Figure 3a,b shows the UV-MALDI mass spectra of 5% glycine in a THAP matrix. At a low laser fluence (70 J/m2), only a small amount of protonated and sodiated THAP was observed. When the UV laser fluence was increased to 110 J/m2, signals of the protonated and sodiated THAP matrix significantly increased; however, no glycine ions or protonated glycine were found. Only sodiated glycine with a very small intensity was observed, as shown in Figure 3b. Glycine ions and protonated glycine were not observed even at higher laser fluence. Figure 3c shows the UV-MALDI mass spectra of 5% tryptophan in THAP matrix. A protonated tryptophan signal was clearly observed.
When both UV and VUV lasers were employed, the ions generated from VUV-SP-postionization were recorded in the same spectrum along with the ions directly generated through UV-MALDI. Because of different ion formation times and positions, the flight times of the ions produced through these two ionization methods were substantially different. The ions produced through VUV-SP-postionization were formed after those produced by UV-MALDI because of the delay between the UV and VUV laser pulses. Moreover, the ions produced through VUV SP were generated at a position 1–2 mm above the sample surface, where the electric potential was less than that of the ions produced through UV-MALDI. Therefore, the flight time of the ions generated through VUV-SP-postionization was longer than that of the ions generated through UV-MALDI. The ions produced using these two ionization methods are easily distinguished.
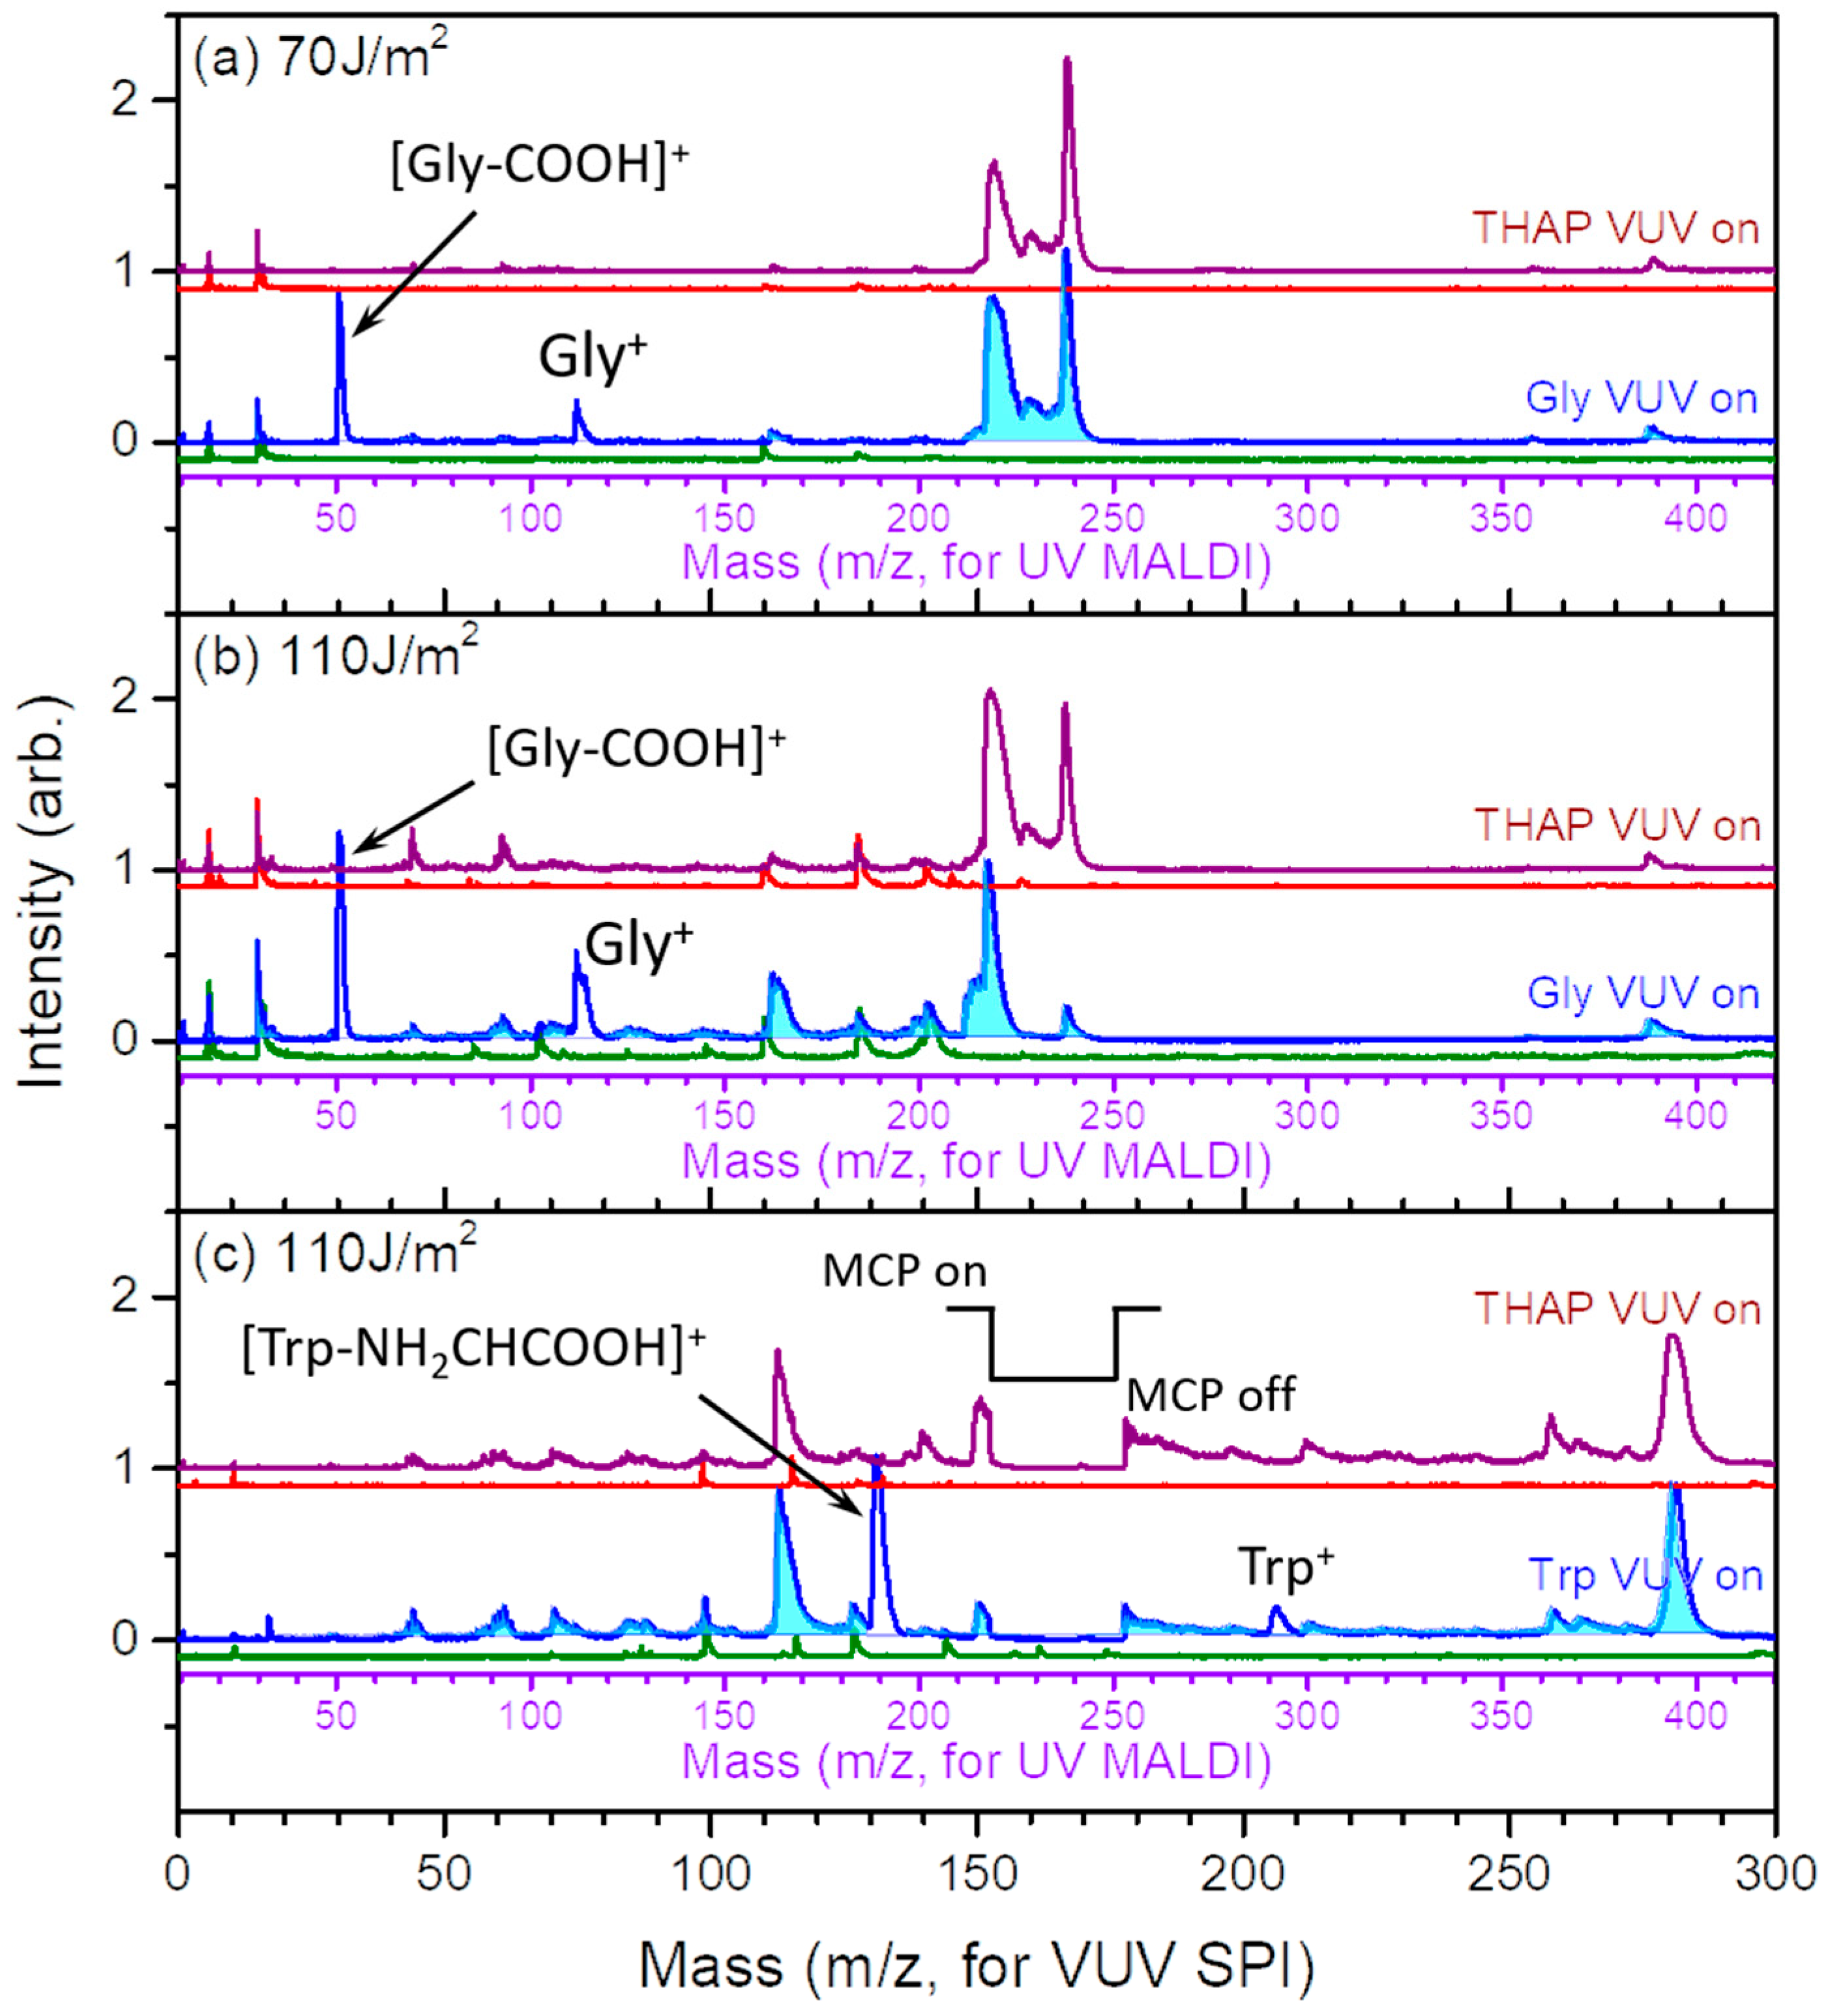
Figure 4 displays the mass spectra of UV-MALDI and VUV-SP-postionization for a pure THAP matrix sample and when 5% analyte was placed in the THAP sample. For the pure THAP matrix sample at low laser fluence (70 J/m2), only a few THAP ions generated through UV-MALDI were observed (red line in Figure 4a). When both UV and VUV lasers were employed, numerous ions were observed (purple line in Figure 4a). The signals at m/z = 168 and 153 represent the parent and fragment ions of the desorbed neutral THAP molecules (m = 168) ionized by VUV photons. The high ion intensity obtained from VUV-SP-postionization indicates the high sensitivity of VUV-SP-postionization compared with that of UV-MALDI. For 5% glycine in THAP, almost no ions related to glycine were observed in UV-MALDI (green line in Figure 4a). However, high ion intensities were discovered at m/z = 75 and 30, corresponding to the glycine parent ion Gly+ and fragment ion [Gly-COOH]+, respectively, when VUV-SP-postionization was employed (blue line in Figure 4a). These signals represent desorbed neutral glycine molecules generated through UV laser desorption and ionized through VUV-SP-postionization. Ion signals from VUV-SP-postionization increased with an increase in the UV laser fluence (to 110 J/m2) because numerous neutrals were desorbed by the UV laser (Figure 4b).
The mass spectra obtained when tryptophan was used as an analyte in THAP are presented in Figure 4c. Similar to Figure 4a,b, large THAP ion signals were generated through VUV-SP-postionization. Numerous THAP ions were generated, which could suppress the detection efficiency of a microchannel plate (MCP) detector for the ions arriving subsequently. Because tryptophan ions have a large molecular weight and arrive at the detector after THAP ions, a gated MCP was used to overcome suppression effects. The voltage applied to the MCP detector was lowered during the time period in which THAP ions were arriving. The voltage was then increased to its initial setting rapidly after this period to detect the ions that arrived after the THAP ions. Figure 4c shows the VUV-SP-postionization spectrum of tryptophan when the gated MCP was employed. The major signals related to tryptophan ions are those at m/z = 204 and 130, corresponding to the tryptophan parent ion, Trp+, and fragment ion, [Trp-NH2CHCOOH]+, respectively.
The mass spectra of 20 common amino acids were obtained using the same technique. Table 1 presents the fragmentation of each amino acid observed in the VUV-SP-postionization spectra. The fragmentations of all the amino acids, apart from arginine, were generally similar to those that would by obtained using electron impact (EI) ionization at 70 eV [63]. The dominant fragmentations of the amino acids were cleavages of the R–COOH bond and bond between Cα and Cβ. However, the degree of fragmentation observed from VUV-SP-postionization was considerably less than that after EI ionization.
The relative ion abundance obtained using UV-MALDI and VUV-SP-postionization was defined as follows:
The relative ion abundances are listed in Table 1 for a laser fluence of 110 J/m2. For example, the ion intensity of the tryptophan fragment corresponding to m/z = 130 obtained through VUV-SP-postionization was approximately 3600 times larger than that of the protonated tryptophan ions obtained through UV-MALDI, and the tryptophan parent ion intensity obtained through VUV-SP-postionization was 27 times larger than the protonated tryptophan intensity obtained through UV-MALDI. Protonated glycine was not observed in UV-MALDI. Relative ion abundance is the ratio of the ion intensity from VUV-SP-postionization to the noise level of UV-MALDI. The parent and fragment ions of aspartic acid and asparagine were not observed when THAP was used as a matrix; however, they were detected when the matrix was 2,5-DHB. The relative ion abundances of these 20 common amino acids indicate that the detection sensitivity of VUV-SP-postionization is generally 10–1000 times higher than that of conventional UV-MALDI. In particular, the ion intensity in VUV-SP-postionization is considerably higher than that in UV-MALDI for amino acids with low proton affinities, such as glycine.
(c) Applications in relative quantitative measurement of analytes
One drawback of UV-MALDI is the difficulty in the application of quantitative analysis. Shot-to-shot fluctuation, sweet spot effects, large differences in the ionization efficiency of various analytes because of different proton affinities, and suppression effects cause difficulties in the application of UV-MALDI in quantitative analysis. Because the ion signals obtained through VUV-SP-postionization were larger than those obtained through UV-MALDI and no suppression effects were expected in postionization, quantitative analysis performed using the VUV-SP-postionization data was a suitable approach.
Quantitative analysis of UV-MALDI data for glycine is impossible because of the low ion signal of glycine from conventional UV-MALDI MS. However, quantitative analysis can be straightforwardly performed using VUV-SP-postionization. Figure 5 shows the relative VUV-SP-postionization signals of glycine and histidine from glycine/histidine mixtures with various molar ratios. Glycine parent (m/z 75), glycine fragment (m/z 30), and histidine fragment (m/z 82) ions were considered for the quantitative analysis. The relative ion intensities of both m/z 82 to 30 and m/z 82 to 75 were linearly related to the molar ratio of glycine and histidine, as illustrated in Figure 5a,b, respectively. The result indicated that VUV-SP-postionization can be used for the quantitative analysis of glycine/histidine mixtures.
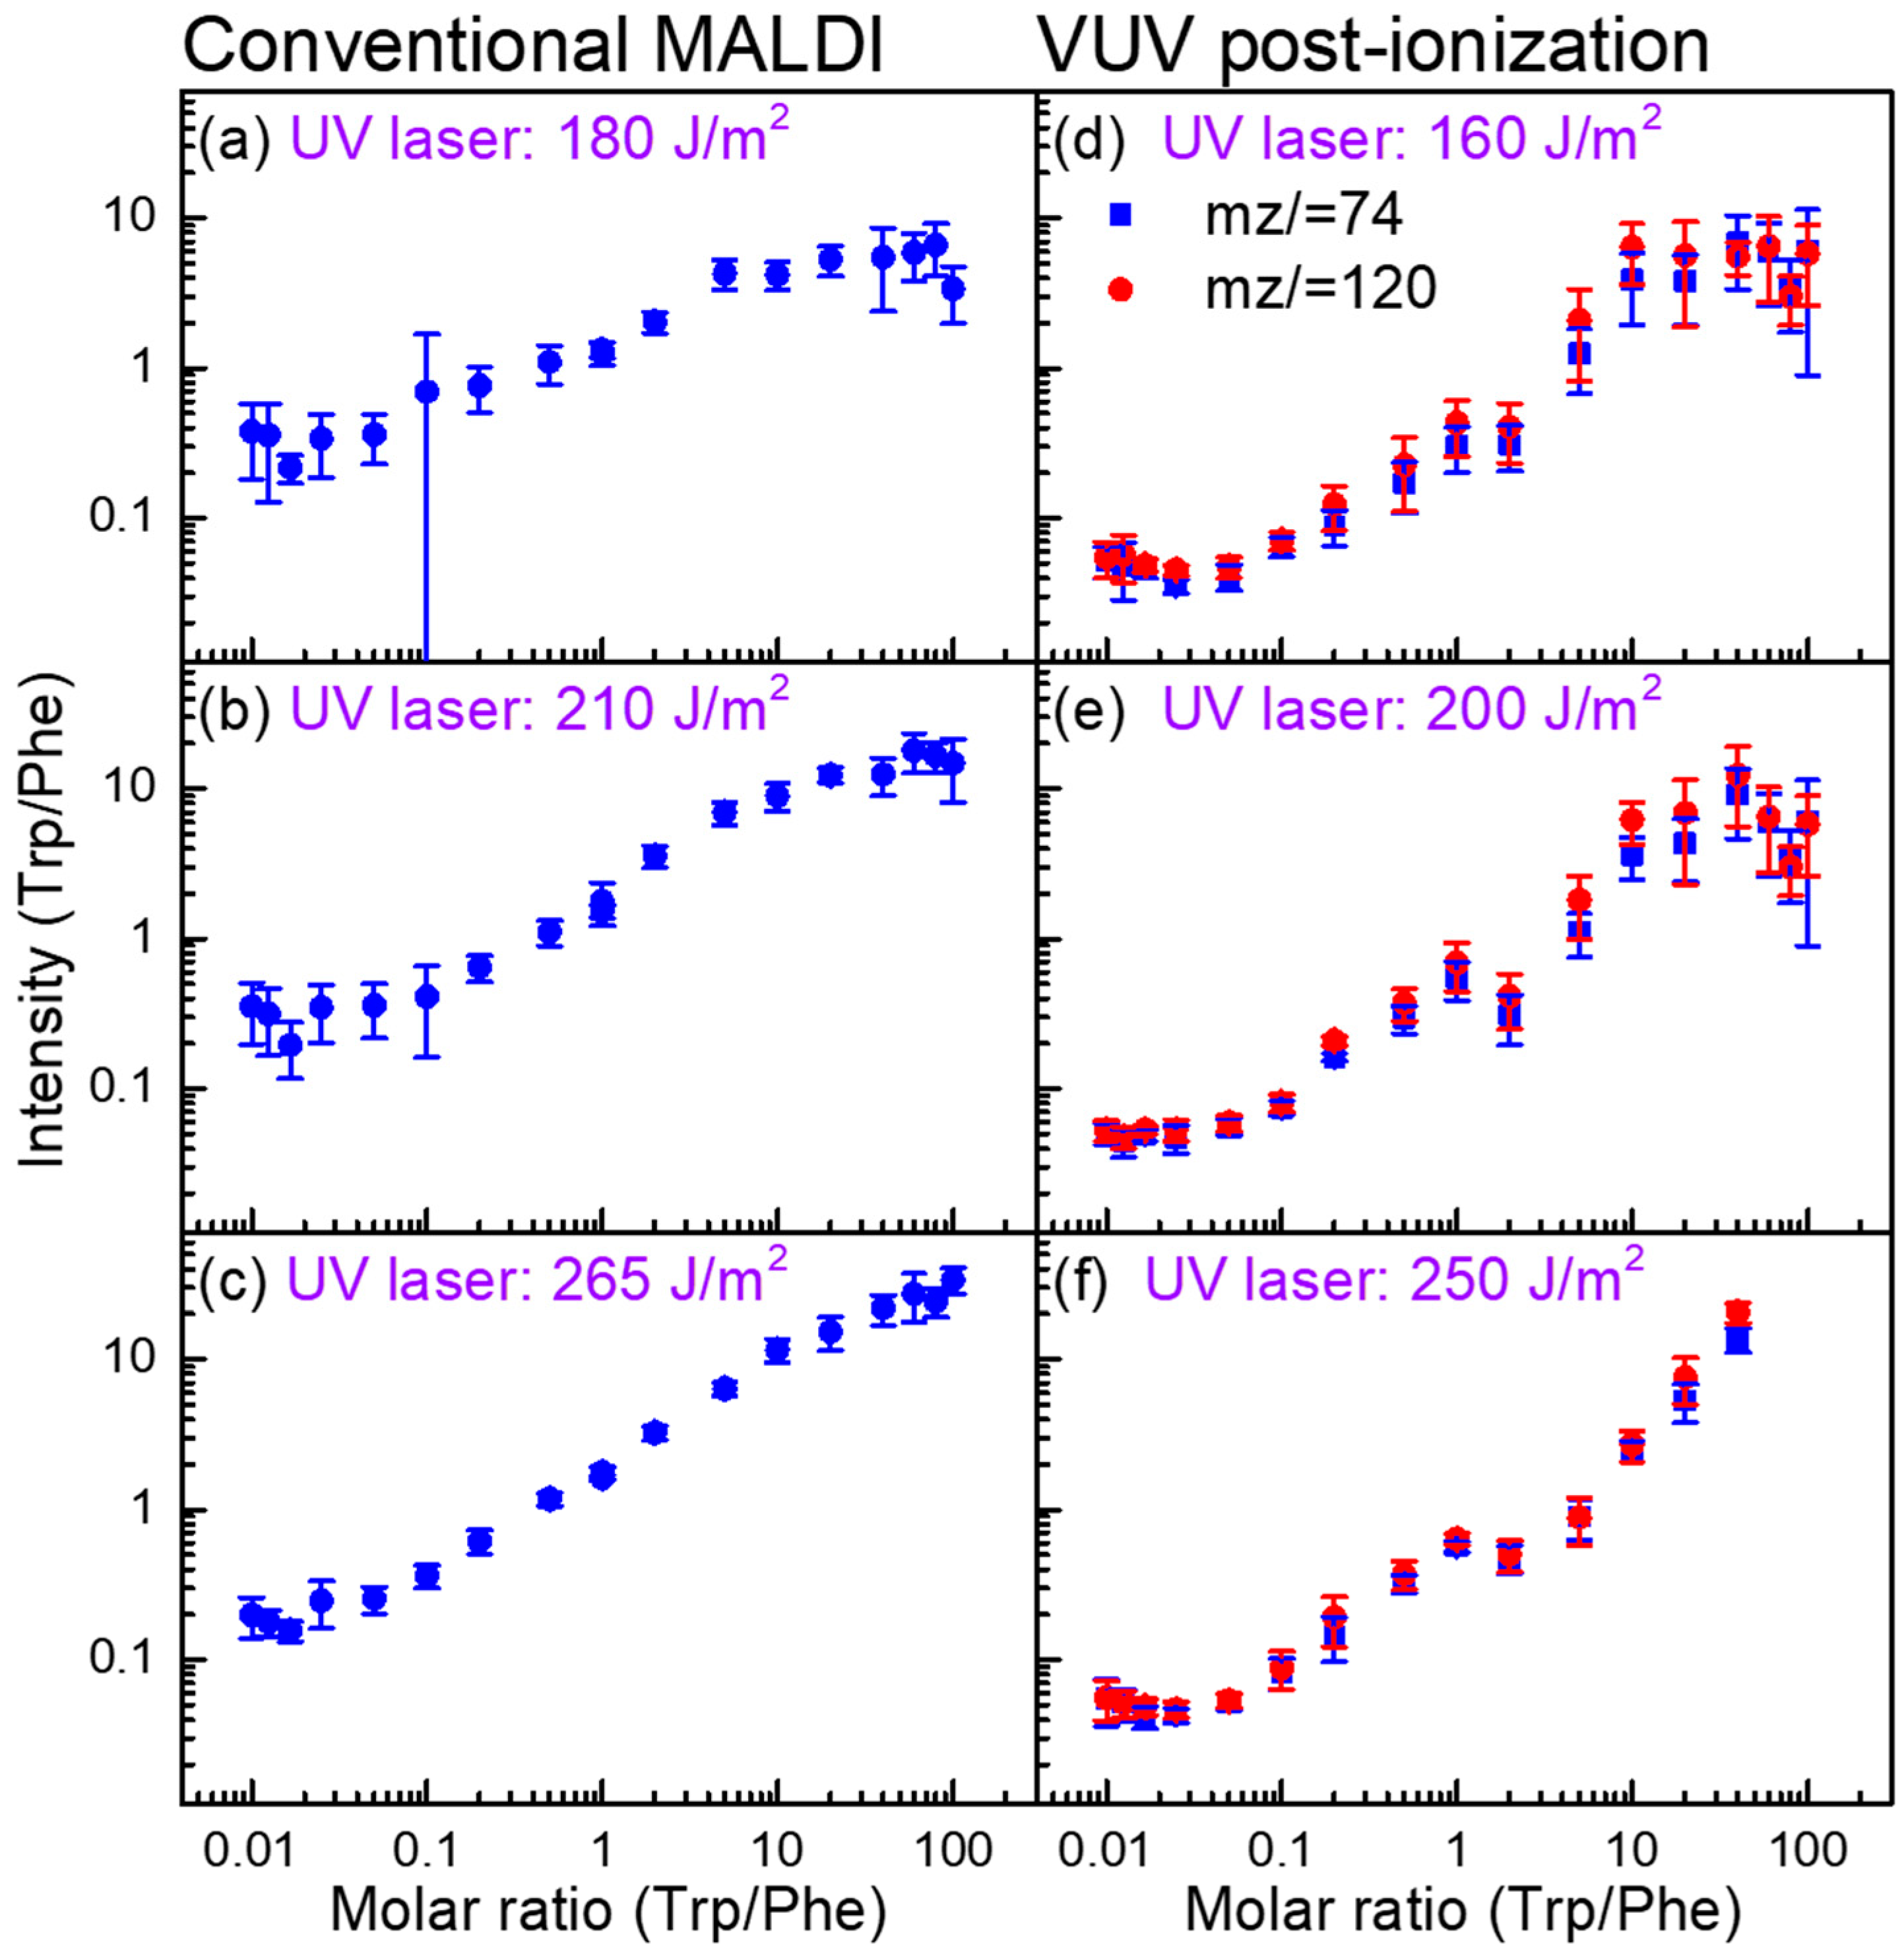
The quantitative analysis of tryptophan and phenylalanine was also performed. Both tryptophan and phenylalanine can be detected using conventional UV-MALDI and VUV-SP-postionization. Figure 6 illustrates the relative ion signals (obtained through UV-MALDI or VUV-SP-postionization) of tryptophan and phenylalanine mixtures with various molar ratios. Protonated tryptophan and phenylalanine ion signals were used to analyze the UV-MALDI data. Fragment ions corresponding to m/z 74 and 120 were used for identifying phenylalanine, whereas one fragment ion corresponding to m/z 130 was used for tryptophan. Because the sensitivity of VUV-SP-postionization is higher than that of UV-MALDI, the dynamic range of VUV-SP-postionization for quantitative analysis is approximately one order of magnitude larger than that of UV-MALDI (Figure 6).
4. Discussion
The degree of success of VUV-SP-postionization is strongly dependent on the properties of the VUV photons, including their wavelength, pulse duration, and intensity. The IE of most organic molecules is generally less than 10 eV [64], whereas the IE of amino acids and several biomolecules is approximately 8–10 eV [65,66,67,68]. The ninth harmonic of a Q-switched Nd:YAG laser provides suitable photon energy of 10.49 eV, which is higher than the IE of most molecules and is not sufficiently large to induce severe fragmentation. The VUV pulse generated from a typical Q-switched nanosecond-pulse Nd:YAG laser has duration of less than 10 ns. Pulse duration appropriately matches the TOF-MS and neutral desorption duration of laser desorption.
When a suitable VUV wavelength and pulse duration are used, the ion intensity from VUV-SP-postionization is primarily dependent on the VUV intensity. The ion signal () of cations produced by VUV-SP-postionization depends on the ionization cross-section (), VUV intensity (), and density of gaseous molecules (). The ion signal can be calculated as [69,70]. In general, the ionization cross-section is approximately 2–20 megabarns (1 Mb = cm2) [71]. Aromatic species and alkynes, dienes, and alkenes exhibit ionization cross-sections of approximately 20 Mb, 15 Mb, and 8 Mb, respectively, whereas aldehydes/ketones and alkanes have lower ionization cross-sections of approximately 3–4 Mb [69,70,71,72]. A typical ion-to-neutral ratio of analytes in UV-MALDI is 10−8–10−3, depending on the properties (e.g., proton affinity) of the analyte. The overlap of the VUV laser beam with the desorbed neutral plume is estimated to be approximately one tenth. To yield higher ion intensity from VUV-SP-postionization than that from UV-MALDI, the VUV photon number in each laser pulse must be large. For analytes with an ion-to-neutral ratio of 10−5 in UV-MALDI, the VUV photon number of each laser pulse must be larger than 1012, assuming that the ionization cross-section is 10 Mb. The VUV photon number generated from a midsize commercial Nd:YAG pulse laser is as high as . The ionization efficiency of VUV-SP-postionization using such a Nd:YAG pulse laser is comparable with that of conventional MALDI-MS. Compared with the MALDI technique, in which the ionization efficiency can vary by several orders of magnitude depending on the proton affinity analyte and selected matrix [67], VUV-SP-postionization enables more readily quantifiable analysis.
Author Contributions
Conceptualization, C.-K.N.; Methodology, C.-K.N. and H.C.H.; Formal Analysis, H.C.H.; Data Curation, H.C.H.; Writing-Original Draft Preparation, H.C.H.; Writing-Review & Editing, C.-K.N.; Project Administration, C.-K.N.; Funding Acquisition, C.-K.N.
Acknowledgments
We acknowledge support from the Ministry of Science and Technology, Taiwan (NSC 106-2113-M-001-023-MY3).
Conflicts of Interest
The authors declare no conflict of interest.
References
- Karas, M.; Bachmann, D.; Bahr, U.; Hillenkamp, F. Matrix-assisted ultraviolet-laser desorption of nonvolatile compounds. Int. J. Mass Spectrom. 1987, 78, 53–68. [Google Scholar] [CrossRef]
- Karas, M.; Hillenkamp, F. Laser desorption ionization of proteins with molecular masses exceeding 10000 daltons. Anal. Chem. 1988, 60, 2299–2301. [Google Scholar] [CrossRef] [PubMed]
- Chang, W.C.; Huang, L.C.L.; Wang, Y.S.; Peng, W.P.; Chang, H.C.; Hsu, N.Y.; Yang, W.B.; Chen, C.H. Matrix-assisted laser desorption/ionization (MALDI) mechanism revisited. Anal. Chim. Acta 2007, 582, 1–9. [Google Scholar] [CrossRef] [PubMed]
- Taranenko, N.I.; Golovlev, V.V.; Puretzky, A.A.; Allman, S.L.; Chen, C.H. Direct monitoring of laser-absorption of maldi matrices by fast piezoelectric transducer. Chem. Phys. Lett. 1995, 234, 165–171. [Google Scholar] [CrossRef]
- Gluckmann, M.; Pfenninger, A.; Kruger, R.; Thierolf, M.; Karas, M.; Horneffer, V.; Hillenkamp, F.; Strupat, K. Mechanisms in MALDI analysis: Surface interaction or incorporation of analytes? Int. J. Mass Spectrom. 2001, 210, 121–132. [Google Scholar] [CrossRef]
- Horneffer, V.; Dreisewerd, K.; Ludemann, H.C.; Hillenkamp, F.; Lage, M.; Strupat, K. Is the incorporation of analytes into matrix crystals a prerequisite for matrix-assisted laser desorption/ionization mass spectrometry? A study of five positional isomers of dihydroxybenzoic acid. Int. J. Mass Spectrom. 1999, 185, 859–870. [Google Scholar] [CrossRef]
- Horneffer, V.; Reichelt, R.; Strupat, K. Protein incorporation into MALDI-matrix crystals investigated by high resolution field emission scanning electron microscopy. Int. J. Mass Spectrom. 2003, 226, 117–131. [Google Scholar] [CrossRef]
- Strupat, K.; Kampmeier, J.; Horneffer, V. Investigations of 2,5-DHB and succinic acid as matrices for UV and IR MALDI. Part II: Crystallographic and mass spectrometric analysis. Int. J. Mass Spectrom. 1997, 169, 43–50. [Google Scholar] [CrossRef]
- Trimpin, S.; Rader, H.J.; Mullen, K. Investigations of theoretical principles for MALDI-MS derived from solvent-free sample preparation—Part I. Preorganization. Int. J. Mass Spectrom. 2006, 253, 13–21. [Google Scholar] [CrossRef]
- Jessome, L.; Hsu, N.Y.; Wang, Y.S.; Chen, C.H. Matrix-assisted laser desorption/ionization mechanism study with dihydroxybenzoic acid isomers as matrices. Rapid Commun. Mass Spectrom. 2008, 22, 130–134. [Google Scholar] [CrossRef] [PubMed]
- Price, D.M.; Bashir, S.; Derrick, P.R. Sublimation properties of x,y-dihydroxybenzoic acid isomers as model matrix assisted laser desorption ionisation (MALDI) matrices. Thermochim. Acta 1999, 327, 167–171. [Google Scholar] [CrossRef]
- Liang, C.W.; Lee, C.H.; Lin, Y.J.; Lee, Y.T.; Ni, C.K. MALDI mechanism of dihydroxybenzoic acid isomers: Desorption of neutral matrix and analyte. J. Phys. Chem. B 2013, 117, 5058–5064. [Google Scholar] [CrossRef] [PubMed]
- Wiegelmann, M.; Soltwisch, J.; Jaskolla, T.W.; Dreisewerd, K. Matching the laser wavelength to the absorption properties of matrices increases the ion yield in UV-MALDI mass spectrometry. Anal. Bioanal. Chem. 2013, 405, 6925–6932. [Google Scholar] [CrossRef] [PubMed]
- Dreisewerd, K.; Schurenberg, M.; Karas, M.; Hillenkamp, F. Influence of the laser intensity and spot size on the desorption of molecules and ions in matrix-assisted laser-desorption ionization with a uniform beam profile. Int. J. Mass Spectrom. 1995, 141, 127–148. [Google Scholar] [CrossRef]
- Westmacott, G.; Ens, W.; Hillenkamp, F.; Dreisewerd, K.; Schurenberg, M. The influence of laser fluence on ion yield in matrix-assisted laser desorption ionization mass spectrometry. Int. J. Mass Spectrom. 2002, 221, 67–81. [Google Scholar] [CrossRef]
- Dreisewerd, K.; Schurenberg, M.; Karas, M.; Hillenkamp, F. Matrix-assisted laser desorption/ionization with nitrogen lasers of different pulse widths. Int. J. Mass Spectrom. 1996, 154, 171–178. [Google Scholar] [CrossRef]
- Menzel, C.; Dreisewerd, K.; Berkenkamp, S.; Hillenkamp, F. The role of the laser pulse duration in infrared matrix-assisted laser desorption/ionization mass spectrometry. J. Am. Soc. Mass Spectrom. 2002, 13, 975–984. [Google Scholar] [CrossRef]
- Soltwisch, J.; Dreisewerd, K. An ultraviolet/infrared matrix-assisted laser desorption ionization sample stage integrating scanning knife-edge and slit devices for laser beam analysis. Rapid Commun. Mass Spectrom. 2011, 25, 1266–1270. [Google Scholar] [CrossRef] [PubMed]
- Beavis, R.C.; Chaudhary, T.; Chait, B.T. Alpha-cyano-4-hydroxycinnamic acid as a matrix for matrix-assisted laser desorption mass-spectrometry. Org. Mass Spectrom. 1992, 27, 156–158. [Google Scholar] [CrossRef]
- Strupat, K.; Karas, M.; Hillenkamp, F. 2,5-dihydroxybenzoic acid—A new matrix for laser desorption ionization mass-spectrometry. Int. J. Mass Spectrom. 1991, 111, 89–102. [Google Scholar] [CrossRef]
- Salum, M.L.; Itovich, L.M.; Erra-Balsells, R. Z-sinapinic acid: The change of the stereochemistry of cinnamic acids as rational synthesis of a new matrix for carbohydrate MALDI-MS analysis. J. Mass Spectrom. 2013, 48, 1160–1169. [Google Scholar] [CrossRef] [PubMed]
- Jaskolla, T.W.; Onischke, K.; Schiller, J. 2,5-dihydroxybenzoic acid salts for matrix-assisted laser desorption/ionization time-of-flight mass spectrometric lipid analysis: Simplified spectra interpretation and insights into gasphase fragmentation. Rapid Commun. Mass Spectrom. 2014, 28, 1353–1363. [Google Scholar] [CrossRef] [PubMed]
- Stahl, B.; Steup, M.; Karas, M.; Hillenkamp, F. Analysis of neutral oligosaccharides by matrix-assisted laser desorption—Ionization mass-spectrometry. Anal. Chem. 1991, 63, 1463–1466. [Google Scholar] [CrossRef]
- Stubiger, G.; Belgacem, O. Analysis of lipids using 2,4,6-trihydroxyacetophenone as a matrix for MALDI mass spectrometry. Anal. Chem. 2007, 79, 3206–3213. [Google Scholar] [CrossRef] [PubMed]
- Stikarovska, M.; Chmelik, J. Determination of neutral oligosaccharides in vegetables by matrix-assisted laser desorption/ionization mass spectrometry. Anal. Chim. Acta 2004, 520, 47–55. [Google Scholar] [CrossRef]
- Papac, D.I.; Wong, A.; Jones, A.J.S. Analysis of acidic oligosaccharides and glycopeptides by matrix assisted laser desorption ionization time-of-flight mass spectrometry. Anal. Chem. 1996, 68, 3215–3223. [Google Scholar] [CrossRef] [PubMed]
- Harvey, D.J. Matrix-assisted laser desorption/ionization mass spectrometry of carbohydrates. Mass Spectrom. Rev. 1999, 18, 349–450. [Google Scholar] [CrossRef]
- Hsu, N.Y.; Yang, W.B.; Wong, C.H.; Lee, Y.C.; Lee, R.T.; Wang, Y.S.; Chen, C.H. Matrix-assisted laser desorption/ionization mass spectrometry of polysaccharides with 2′,4′,6′-trihydroxyacetophenone as matrix. Rapid Commun. Mass Spectrom. 2007, 21, 2137–2146. [Google Scholar] [CrossRef] [PubMed]
- Yang, X.F.; Wu, H.P.; Kobayashi, T.; Solaro, R.J.; van Breemen, R.B. Enhanced ionization of phosphorylated peptides during MALDI TOF mass spectrometry. Anal. Chem. 2004, 76, 1532–1536. [Google Scholar] [CrossRef] [PubMed]
- Ueki, M.; Yamaguchi, M. Enhanced detection of sulfo-peptides as onium salts in matrix-assisted laser desorption/ionization time-of-flight mass spectrometry. Rapid Commun. Mass Spectrom. 2006, 20, 1615–1620. [Google Scholar] [CrossRef] [PubMed]
- Wu, K.J.; Shaler, T.A.; Becker, C.H. Time-of-flight mass-spectrometry of underivatized single-stranded-DNA oligomers by matrix-assisted laser-desorption. Anal. Chem. 1994, 66, 1637–1645. [Google Scholar] [CrossRef] [PubMed]
- Wu, K.J.; Steding, A.; Becker, C.H. Matrix-assisted laser desorption time-of-flight mass-spectrometry of oligonucleotides using 3-hydroxypicolinic acid as an ultraviolet-sensitive matrix. Rapid Commun. Mass Spectrom. 1993, 7, 142–146. [Google Scholar] [CrossRef] [PubMed]
- Jaskolla, T.W.; Papasotiriou, D.G.; Karas, M. Comparison between the matrices alpha-cyano-4-hydroxycinnamic acid and 4-chloro-alpha-cyanocinnamic acid for trypsin, chymotrypsin, and pepsin digestions by MALDI-TOF mass spectrometry. J. Proteome Res. 2009, 8, 3588–3597. [Google Scholar] [CrossRef] [PubMed]
- Jaskolla, T.; Fuchs, B.; Karas, M.; Schiller, J. The new matrix 4-chloro-alpha-cyanocinnamic acid allows the detection of phosphatidylethanolamine chloramines by MALDI-TOF mass spectrometry. J. Am. Soc. Mass Spectrom. 2009, 20, 867–874. [Google Scholar] [CrossRef] [PubMed]
- Jaskolla, T.W.; Lehmann, W.D.; Karas, M. 4-chloro-alpha-cyanocinnamic acid is an advanced, rationally designed maldi matrix. Proc. Natl. Acad. Sci. USA 2008, 105, 12200–12205. [Google Scholar] [CrossRef] [PubMed]
- Tsai, M.T.; Lee, S.; Lu, I.C.; Chu, K.Y.; Liang, C.W.; Lee, C.H.; Lee, Y.T.; Ni, C.K. Ion-to-neutral ratio of 2,5-dihydroxybenzoic acid in matrix-assisted laser desorption/ionization. Rapid Commun. Mass Spectrom. 2013, 27, 955–963. [Google Scholar] [CrossRef] [PubMed]
- Lu, I.C.; Lee, C.; Lee, Y.T.; Ni, C.K. Ionization mechanism of matrix-assisted laser desorption/ionization. Annu. Rev. Anal. Chem. 2015, 8, 21–39. [Google Scholar] [CrossRef] [PubMed]
- Silina, Y.E.; Kochb, M.; Volmer, D.A. Impact of analyte ablation and surface acidity of Pd nanoparticles onefficiency of surface-assisted laser desorption/ionization-mass spectrometry. Int. J. Mass Spectrom. 2015, 387, 24–30. [Google Scholar] [CrossRef]
- Spencer, M.K.; Hammond, M.R.; Zare, R.N. Laser mass spectrometric detection of extraterrestrial aromatic molecules: Mini-review and examination of pulsed heating effects. Proc. Natl. Acad. Sci. USA 2008, 105, 18096–18101. [Google Scholar] [CrossRef] [PubMed]
- Kinsel, G.R.; Lindner, J.; Grotemeyer, J. Peptide sequence ions produced by postionization of neutral molecules formed during resonant 266-nm laser desorption. J. Phys. Chem. 1992, 96, 3157–3162. [Google Scholar] [CrossRef]
- Kinsel, G.R.; Lindner, J.; Grotemeyer, J. Investigations of neutral fragment formation during resonant 266-nm laser desorption. J. Phys. Chem. 1992, 96, 3162–3166. [Google Scholar] [CrossRef]
- Reilly, P.T.A.; Reilly, J.P. Laser-desorption gas-phase ionization of the amino-acid tryptophan. Rapid Commun. Mass Spectrom. 1994, 8, 731–734. [Google Scholar] [CrossRef]
- Leisner, A.; Rohlfing, A.; Berkenkamp, S.; Hillenkamp, F.; Dreisewerd, K. Infrared laser post-ionization of large biomolecules from an IR-MALDI(I) plume. J. Am. Soc. Mass Spectrom. 2004, 15, 934–941. [Google Scholar] [CrossRef] [PubMed]
- Edirisinghe, P.D.; Moore, J.F.; Calaway, W.F.; Veryovkin, I.V.; Pellin, M.J.; Hanley, L. Vacuum ultraviolet postionization of aromatic groups covalently bound to peptides. Anal. Chem. 2006, 78, 5876–5883. [Google Scholar] [CrossRef] [PubMed]
- Gasper, G.L.; Takahashi, L.K.; Zhou, J.; Ahmed, M.; Moore, J.F.; Hanley, L. Laser desorption postionization mass spectrometry of antibiotic-treated bacterial biofilms using tunable vacuum ultraviolet radiation. Anal. Chem. 2010, 82, 7472–7478. [Google Scholar] [CrossRef] [PubMed]
- Gasper, G.L.; Carlson, R.; Akhmetov, A.; Moore, J.F.; Hanley, L. Laser desorption 7.87 EV postionization mass spectrometry of antibiotics in staphylococcus epidermidis bacterial biofilms. Proteomics 2008, 8, 3816–3821. [Google Scholar] [CrossRef] [PubMed]
- Vanbramer, S.E.; Johnston, M.V. Tunable, coherent vacuum ultraviolet-radiation for photoionization mass-spectrometry. Appl. Spectrosc. 1992, 46, 255–261. [Google Scholar] [CrossRef]
- Edirisinghe, P.D.; Lateef, S.S.; Crot, C.A.; Hanley, L.; Pellin, M.J.; Calaway, W.F.; Moore, J.F. Derivatization of surface-bound peptides for mass spectrometric detection via threshold single photon ionization. Anal. Chem. 2004, 76, 4267–4270. [Google Scholar] [CrossRef] [PubMed]
- Zhou, M.S.; Wu, C.P.; Akhmetov, A.; Edirisinghe, P.D.; Drummond, J.L.; Hanley, L. 7.87 EV laser desorption postionization mass spectrometry of adsorbed and covalently bound bisphenol a diglycidyl methacrylate. J. Am. Soc. Mass Spectrom. 2007, 18, 1097–1108. [Google Scholar] [CrossRef] [PubMed]
- Kung, A.H. 3rd-harmonic generation in a pulsed supersonic jet of xenon. Opt. Lett. 1983, 8, 24–26. [Google Scholar] [CrossRef] [PubMed]
- Kung, A.H.; Young, J.F.; Harris, S.E. Generation of 1182-Å radiation in phase-matched mixtures of inert-gases. Appl. Phys. Lett. 1973, 22, 301–302. [Google Scholar] [CrossRef]
- Ni, C.K.; Lee, Y.T. Photodissociation of simple aromatic molecules in a molecular beam. Int. Rev. Phys. Chem. 2004, 23, 187–218. [Google Scholar] [CrossRef]
- Ni, C.K.; Tseng, C.M.; Lin, M.F.; Dyakov, Y. Photodissociation dynamics of small aromatic molecules studied by multimass ion imaging. J. Phys. Chem. B 2007, 111, 12631–12642. [Google Scholar] [CrossRef] [PubMed]
- Hu, Y.J.; Guan, J.W.; Bernstein, E.R. Mass-selected IR-VUV (118 nm) spectroscopic studies of radicals, aliphatic molecules, and their clusters. Mass Spectrom. Rev. 2013, 32, 484–501. [Google Scholar] [CrossRef] [PubMed]
- Lockyer, N.P.; Vickerman, J.C. Single photon ionisation mass spectrometry using laser-generated vacuum ultraviolet photons. Laser Chem. 1997, 17, 139–159. [Google Scholar] [CrossRef]
- Shin, J.-W.; Bernstein, E.R. Vacuum ultraviolet photoionization of carbohydrates and nucleotides. J. Chem. Phys. 2014, 140, 044330. [Google Scholar] [CrossRef] [PubMed]
- Hunter, E.P.L.; Lias, S.G. Evaluated gas phase basicities and proton affinities of molecules: An update. J. Phys. Chem. Ref. Data 1998, 27, 413–656. [Google Scholar] [CrossRef]
- Ni, C.K.; Huang, J.D.; Chen, Y.T.; Kung, A.H.; Jackson, W.M. Photodissociation of propyne and allene at 193 nm with VUV detection of the products. J. Chem. Phys. 1999, 110, 3320–3325. [Google Scholar] [CrossRef]
- Tsai, S.T.; Lin, C.K.; Lee, Y.T.; Ni, C.K. Multimass Ion Imaging Detection: Application to Photodissociation. Rev. Sci. Instrum. 2001, 72, 1963–1969. [Google Scholar] [CrossRef]
- Hsu, H.C.; Tsai, M.T.; Dyakov, Y.D.; Ni, C.K. Energy transfer of highly vibrationally excited molecules studied by crossed molecular beam/time-sliced velocity map ion imaging. Int. Rev. Phys. Chem. 2012, 31, 201–233. [Google Scholar] [CrossRef]
- Liang, S.P.; Lu, I.C.; Tsai, S.T.; Chen, J.L.; Lee, Y.T.; Ni, C.K. Laser pulse width dependence and ionization mechanism of matrix-assisted laser desorption/ionization. J. Am. Soc. Mass. Spectrom. 2017, 28, 2235–2245. [Google Scholar] [CrossRef] [PubMed]
- Yu, A.Y.C.; Spicer, W.E. Photoemission and optical studies of the electronic structure of palladium. Phys. Rev. 1968, 169, 497–507. [Google Scholar] [CrossRef]
- NIST. Available online: http://webbook.nist.gov/chemistry (accessed on 1 July 2017).
- King, B.V.; Pellin, M.J.; Moore, J.F.; Veryovkin, I.V.; Savina, M.R.; Tripa, C.E. Estimation of useful yield in surface analysis using single photon ionisation. Appl. Surf. Sci. 2003, 203, 244–247. [Google Scholar] [CrossRef]
- Wilson, K.R.; Jimenez-Cruz, M.; Nicolas, C.; Belau, L.; Leone, S.R.; Ahmed, M. Thermal vaporization of biological nanoparticles: Fragment-free vacuum ultraviolet photoionization mass spectra of tryptophan, phenylalanine-glycine-glycine, and, beta-carotene. J. Phys. Chem. A 2006, 110, 2106–2113. [Google Scholar] [CrossRef] [PubMed]
- Close, D.M. Calculated vertical ionization energies of the common alpha-amino acids in the gas phase and in solution. J. Phys. Chem. A 2011, 115, 2900–2912. [Google Scholar] [CrossRef] [PubMed]
- Close, D.M.; Ohman, K.T. Ionization energies of the nucleotides. J. Phys. Chem. A 2008, 112, 11207–11212. [Google Scholar] [CrossRef] [PubMed]
- Crespo-Hernandez, C.E.; Arce, R.; Ishikawa, Y.; Gorb, L.; Leszczynski, J.; Close, D.M. Ab initio ionization energy thresholds of DNA and RNA bases in gas phase and in aqueous solution. J. Phys. Chem. A 2004, 108, 6373–6377. [Google Scholar] [CrossRef]
- Hanley, L.; Kornienko, O.; Ada, E.T.; Fuoco, E.; Trevor, J.L. Surface mass spectrometry of molecular species. J. Mass Spectrom. 1999, 34, 705–723. [Google Scholar] [CrossRef]
- Boesl, U. Multiphoton excitation and mass-selective ion detection for neutral and ion spectroscopy. J. Phys. Chem. 1991, 95, 2949–2962. [Google Scholar] [CrossRef]
- Adam, T.; Zimmermann, R. Determination of single photon ionization cross sections for quantitative analysis of complex organic mixtures. Anal. Bioanal. Chem. 2007, 389, 1941–1951. [Google Scholar] [CrossRef] [PubMed]
- Hanley, L.; Zimmermann, R. Light and molecular ions: The emergence of vacuum UV single-photon ionization in MS. Anal. Chem. 2009, 81, 4174–4182. [Google Scholar] [CrossRef] [PubMed]
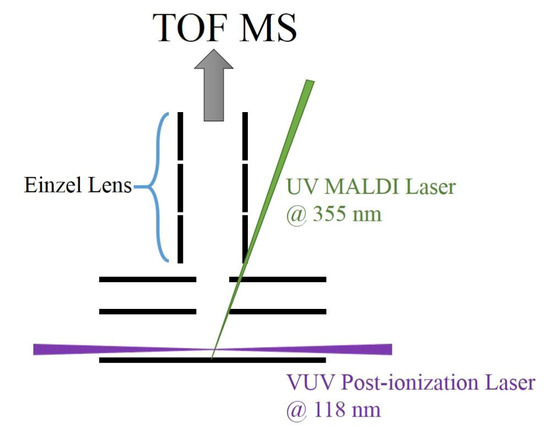
Figure 1.
Schematic of experimental setup. The relative dimensions of each component are not drawn in scale. A UV-MALDI laser (355 nm) struck on the sample surface to generate MALDI ions and desorbed neutrals. Ions were accelerated by an electronic field, focused using an Einzel lens, and analyzed using TOF-MS. Desorbed neutrals were postionized by a VUV pulse (118 nm). Ions generated through VUV-SP-postionization were accelerated and focused by the same ion optics and analyzed using the same TOF-MS system.

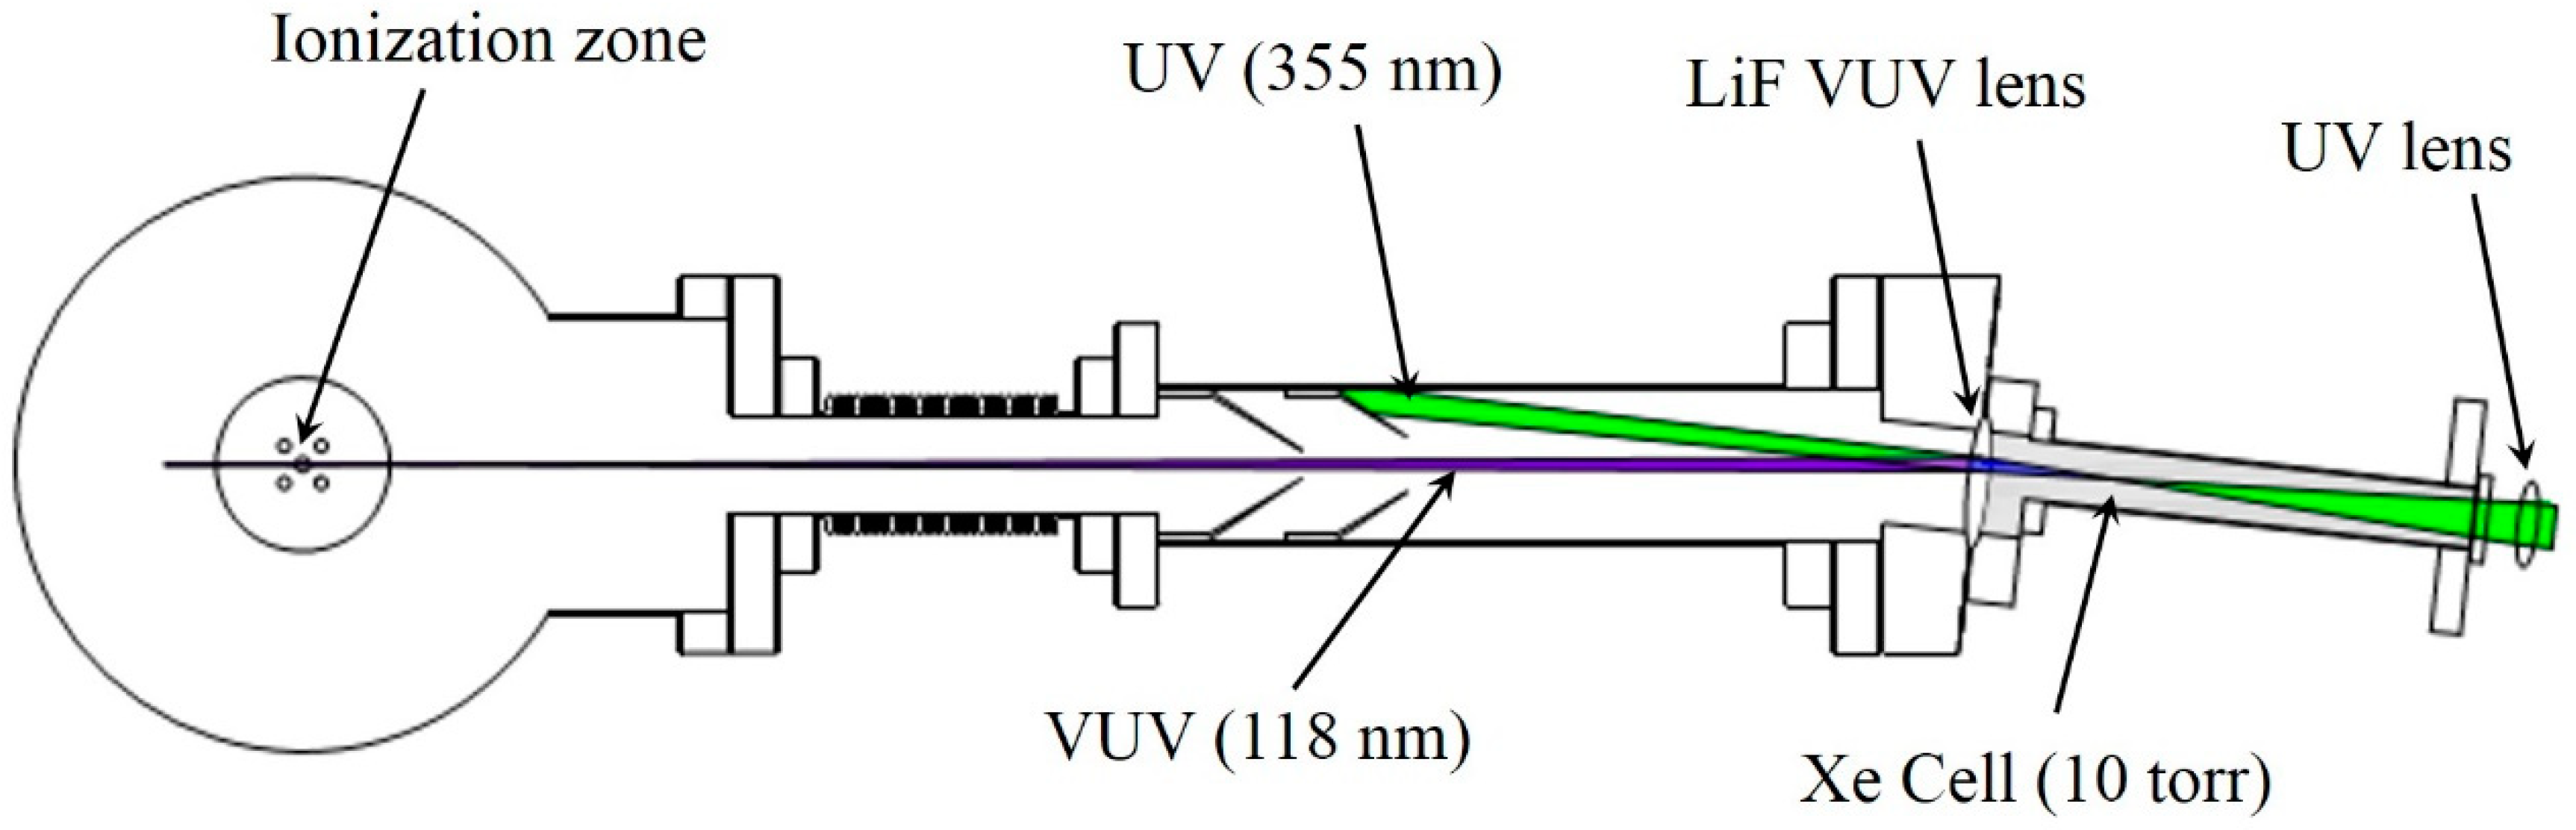
Figure 2.
Schematic of VUV light source and part of the TOF-MS system. A UV laser (355 nm) was focused into a Xe cell by using UV lens (f = 25 cm). After VUV radiation was generated, the coaxial and expanding UV and VUV laser beams were separated and focused using an off-axis LiF-VUV lens. The UV laser beam was blocked by graphite-coated stainless-steel baffles, whereas the VUV laser beam passed through stainless steel baffles and refocused on the ionization region. Ions from UV-MALDI and VUV photoionization were analyzed and detected using TOF-MS, in which the flight axis is perpendicular to the paper.

Figure 3.
UV-MALDI full scan mass spectrum. Red and green lines represent the sample of the pure 2,4,6-trihydroxyacetophenone (THAP) matrix and sample containing 5% analyte in THAP matrix, respectively. The analyte used in (a) and (b) is glycine and that used in (c) is tryptophan.
Figure 3.
UV-MALDI full scan mass spectrum. Red and green lines represent the sample of the pure 2,4,6-trihydroxyacetophenone (THAP) matrix and sample containing 5% analyte in THAP matrix, respectively. The analyte used in (a) and (b) is glycine and that used in (c) is tryptophan.

Figure 4.
UV-MALDI full scan mass spectrum of a pure THAP matrix sample (red) and UV-MALDI full scan along with VUV-SP-postionization (purple), and UV-MALDI full scan of a sample containing 5% analyte in THAP matrix (green) and UV-MALDI full scan with VUV-SP-postionization (blue). Cyan-colored peaks represent the background signal contributed by the THAP matrix. The analyte used in (a) and (b) is glycine and that used in (c) is tryptophan. The m/z values of the peaks in the red and green curves must be read from the X axis for UV-MALDI. If the peaks in the purple and blue curves coincide with peaks in the red and green curves, they represent ions generated through UV-MALDI. Therefore, the m/z values of these peaks must be read from the X axis for UV-MALDI. If the peaks in the purple and blue curves do not appear in the red and green curves, they represent ions generated through VUV-SP-postionization and the m/z values of these peaks must be read from the X axis for VUV-SPI.

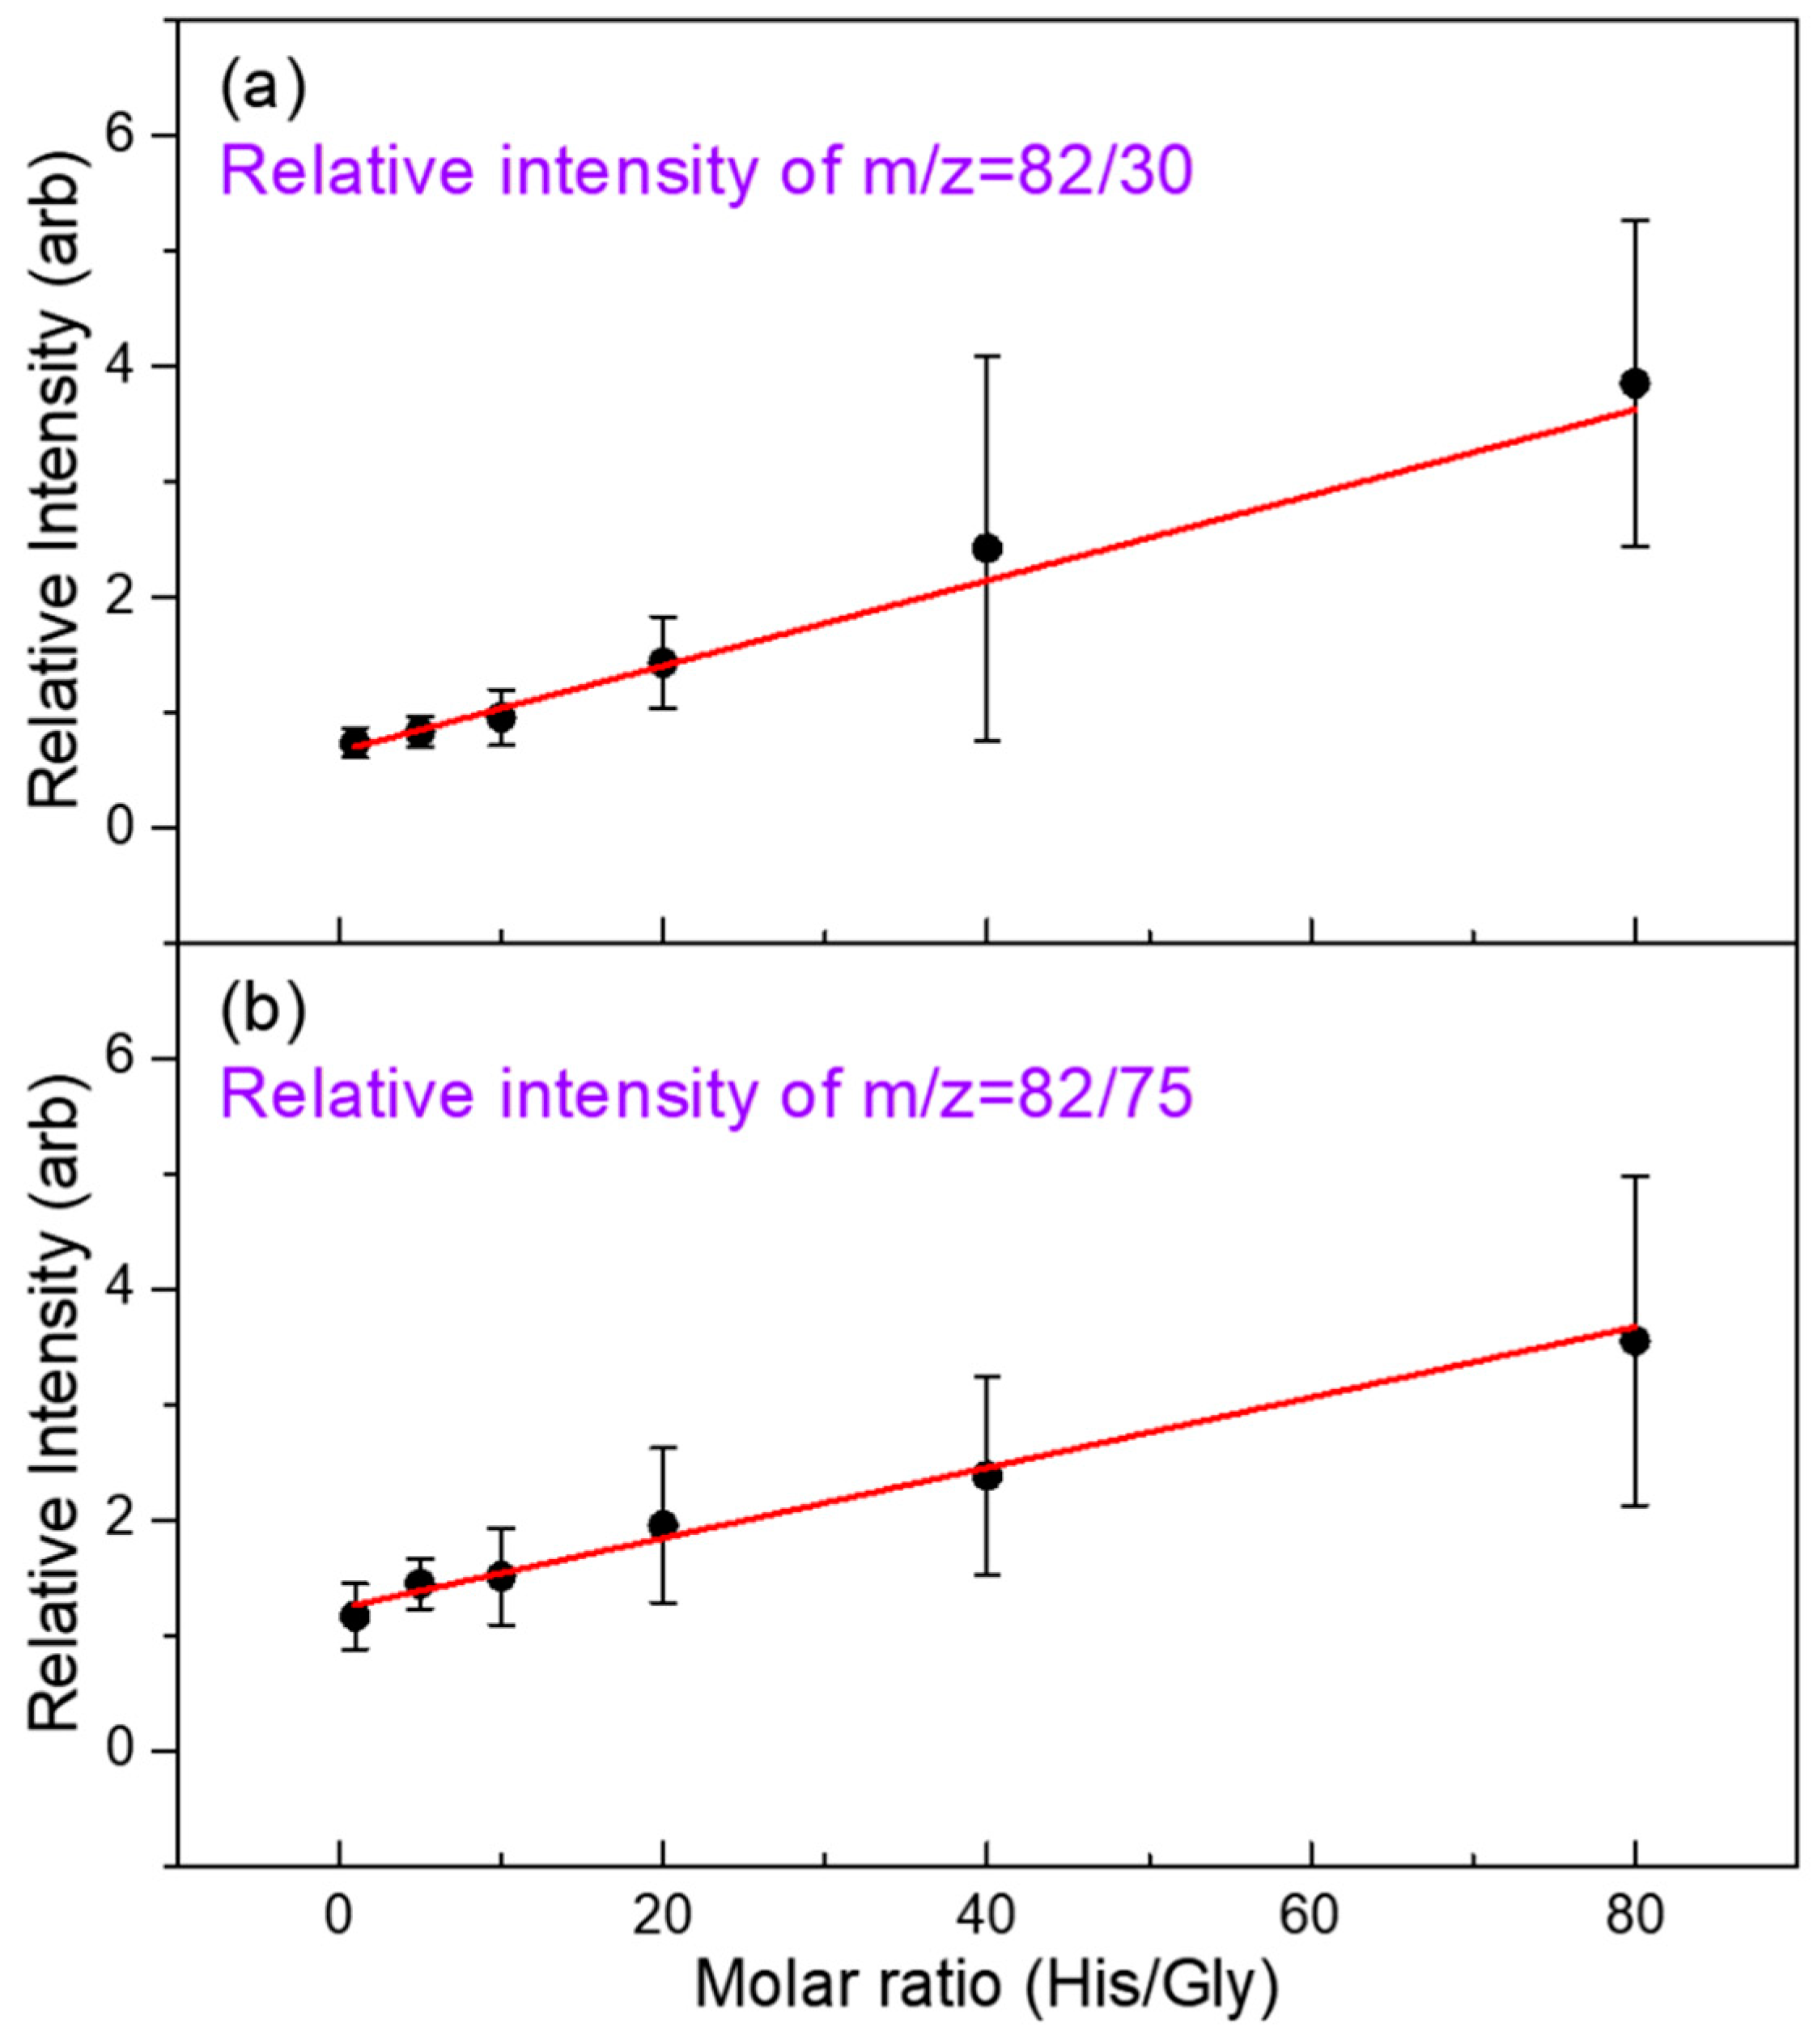
Figure 5.
Relative VUV SPI ion signals of glycine and histidine from the glycine/histidine mixtures with various molar ratios. The glycine parent ion at m/z 75, glycine fragment ion at m/z 30, and histidine fragment ion at m/z 82 were used for the quantitative analysis.
Figure 5.
Relative VUV SPI ion signals of glycine and histidine from the glycine/histidine mixtures with various molar ratios. The glycine parent ion at m/z 75, glycine fragment ion at m/z 30, and histidine fragment ion at m/z 82 were used for the quantitative analysis.

Figure 6.
Left: Relative UV-MALDI ion signals of protonated tryptophan and phenylalanine as a function of molar ratio. Right: Relative VUV-SP-postionization ion signals of tryptophan and phenylalanine as a function of molar ratio. The fragment ions at m/z 74 and 120 for phenylalanine and fragment ion at m/z 130 for tryptophan were used in analysis of VUV-SP-postionization data. The dynamic range of VUV-SP-postionization for quantitative analysis is demonstrated one order of magnitude larger than that of UV-MALDI.


Table 1.
Relative ion abundance of 20 common amino acids, obtained using VUV-SP-postionization and UV-MALDI data. The parent and dominant fragment ions are listed.
Table 1.
Relative ion abundance of 20 common amino acids, obtained using VUV-SP-postionization and UV-MALDI data. The parent and dominant fragment ions are listed.
| Amino Acids | Parent Ion (Relative Ion Abundance) a,b | Fragment Ion (Relative Ion Abundance) a,b | Amino Acids | Parent Ion (Relative Ion Abundance) | Fragment Ion (Relative Ion Abundance) |
|---|---|---|---|---|---|
| Glycine | 75 (300) | 30 (1370) | Serine | 105 d | 43, 60 (4), 74/75 (2) |
| Alanine | 89 (7) | 44 (800) | Threonine | 119 e | 57 (445), 74/75 (4200) |
| Valine | 117 (15) | 72 (160) | Phenylalanine | 165 e | 74 (1750), 91 (500), 120 (1640) |
| Proline | 115 e | 70 (2000) | Tryptophan | 204 (27) | 130 (3600) |
| Leucine | 131 (15) | 86 (530) | Glutamic acid | 147 (5) | 102 (25) |
| Isoleucine | 131 (0.4) | 75 (13), 86 (10) | Aspartic acid c | 133 e | 88 (3) |
| Tyrosine | 181 e | 107 (10) | Glutamine | 146 (0.7) | 84, 101 (30) |
| Histidine | 155 e | 82 (10) | Asparagine c | 132 e | 74, 87 (13) |
| Arginine | 174 e | 60, 74 (6) | Cysteine | 121 (23) | 74/75/76 (110) |
| Lysine | 146 (5) | 30, 44 (50), 56, 72 (180), 84, 101 (75) | Methionine | 149 (18) | 75 (155), 83, 88, 101, 104 (90), 116, 131 (100) |
a The values in front of parentheses represent m/z values. The values in parentheses show the relative abundance; b Relative ion abundance = ion signal intensity from VUV ionization/protonated amino acid from MALDI; c THAP was used as the matrix for all amino acids, except aspartic acid and asparagine, for which 2,5-DHB was employed; d The signal of the parent ion was not observed in the VUV-SP-postionization MS spectrum; therefore, the relative ion abundance was not calculated; e The signal of the parent ion overlaps with the background signal generated from THAP in the VUV-SP-postionization MS spectrum.
© 2018 by the authors. Licensee MDPI, Basel, Switzerland. This article is an open access article distributed under the terms and conditions of the Creative Commons Attribution (CC BY) license (http://creativecommons.org/licenses/by/4.0/).
Share and Cite
MDPI and ACS Style
Hsu, H.C.; Ni, C.-K. Vacuum Ultraviolet Single-Photon Postionization of Amino Acids. Appl. Sci. 2018, 8, 699. https://doi.org/10.3390/app8050699
AMA Style
Hsu HC, Ni C-K. Vacuum Ultraviolet Single-Photon Postionization of Amino Acids. Applied Sciences. 2018; 8(5):699. https://doi.org/10.3390/app8050699
Chicago/Turabian StyleHsu, Hsu Chen, and Chi-Kung Ni. 2018. "Vacuum Ultraviolet Single-Photon Postionization of Amino Acids" Applied Sciences 8, no. 5: 699. https://doi.org/10.3390/app8050699
Note that from the first issue of 2016, this journal uses article numbers instead of page numbers. See further details here.