Article

Quantitative Analysis of Patellar Tendon Abnormality in Asymptomatic Professional “Pallapugno” Players: A Texture-Based Ultrasound Approach

by
Kristen M. Meiburger
1,*,
Massimo Salvi
1,
Maurizio Giacchino
2,
U. Rajendra Acharya
3,4,5,
Marco A. Minetto
6,
Cristina Caresio
7 and
Filippo Molinari
1
1
Biolab, Department of Electronics and Telecomunications, Politecnico di Torino, 10129 Turin, Italy
2
Medical Lab, 14100 Asti, Italy
3
Department of Electronics and Computer Engineering, Ngee Ann Polytechnic, Singapore 599489, Singapore
4
Department of Biomedical Engineering, School of Science and Technology, Singapore University of Social Sciences, Singapore 599484, Singapore
5
Department of Biomedical Engineering, Faculty of Engineering, University of Malaya, Kuala Lumpur 50603, Malaysia
6
Division of Physical Medicine and Rehabilitation, Department of Surgical Sciences, University of Turin, 10126 Turin, Italy
7
Cardiovascular Biomechanics, Department of Biomedical Engineering, Eindhoven University of Technology, 5600 MB Eindhoven, The Netherlands
*
Author to whom correspondence should be addressed.
Appl. Sci. 2018, 8(5), 660; https://doi.org/10.3390/app8050660
Submission received: 30 March 2018 / Revised: 20 April 2018 / Accepted: 23 April 2018 / Published: 25 April 2018
(This article belongs to the Special Issue Ultrasound Elastography)

Abstract

:

Featured Application

Quantitative texture analysis of tendon ultrasound images for determination of subclinical tendinopathy.

Abstract

Abnormalities in B-mode ultrasound images of the patellar tendon often take place in asymptomatic athletes but it is still not clear if these modifications forego or can predict the development of tendinopathy. Subclinical tendinopathy can be arbitrarily defined as either (1) the presence of light structural changes in B-mode ultrasound images in association with mild neovascularization (determined with Power Doppler images) or (2) the presence of moderate/severe structural changes with or without neovascularization. Up to now, the structural changes and neovascularization of the tendon are evaluated qualitatively by visual inspection of ultrasound images. The aim of this study is to investigate the capability of a quantitative texture-based approach to determine tendon abnormality of “pallapugno” players. B-mode ultrasound images of the patellar tendon were acquired in 14 players and quantitative texture parameters were calculated within a Region of Interest (ROI) of both the non-dominant and the dominant tendon. A total of 90 features were calculated for each ROI, including 6 first-order descriptors, 24 Haralick features, and 60 higher-order spectra and entropy features. These features on the dominant and non-dominant side were used to perform a multivariate linear regression analysis (MANOVA) and our results show that the descriptors can be effectively used to determine tendon abnormality and, more importantly, the occurrence of subclinical tendinopathy.

1. Introduction

Ultrasonography is an effective non-invasive imaging technique used in musculoskeletal medicine both for (1) investigating the skeletal muscle structure and calculating quantitative muscle parameters [1,2,3,4] and for (2) qualitative and quantitative assessment of tendon structure (echo-intensity) and size (thickness, length, and cross-sectional area) [5,6,7,8]. Ultrasound imaging presents many advantages, including the fact that it is portable, has low associated costs, is non-invasive, and does not use any ionizing radiation for imaging, but rather innocuous high frequency sound waves. On the other hand, however, it is a very operator-dependent technique and presents a high intra- and inter-reader variability [9].
Ultrasound imaging of the patellar tendon is commonly employed to study tendon abnormalities that could occur because of repetitive overload, which is a common happening in professional athletes of various disciplines [10,11,12,13]. Patellar tendinopathy (PT) is especially common in athletes that play sports that require jumping, such as basketball and volleyball, giving it its common-term name of “jumper’s knee” [14,15]. Recent studies focused on the analysis of changes in elastic properties of the patellar tendon using shear wave imaging [16,17,18,19,20,21]. Zhang et al. [18] showed that athletes with unilateral PT had a stiffer tendon (i.e., higher shear elastic modulus) on the non-painful side when compared to the painful side (25.8 ± 10.6 kPa vs. 43.6 ± 17.9 kPa, respectively), whereas healthy controls showed no difference of stiffness between sides (27.5 ± 11.3 kPa vs. 27.9 ± 8.4 kPa). In their study, they also conducted a morphological analysis and found that the athletes with PT had a larger painful tendon compared with the contralateral non-painful side (thickness: 6.9 ± 1.8 mm vs. 4.6 ± 0.6 mm, respectively), whereas the controls had no difference between sides (5.6 ± 1.2 mm vs. 5.3 ± 1.0 mm). Morphological abnormalities in the tendon ultrasound image, such as increased tendon thickness, neovascularization, and presence of hypoechoic areas, have also been found in a large percentage of asymptomatic athletes [9,11,13,22]. Recently, Giacchino et al. [23] also conducted a study of patellar tendon size and structure in throwers and found that the prevalence of subclinical tendinopathy was high in the non-dominant patellar tendon as a possible result of the repeated non-dominant lower limb overload. To do so, the authors arbitrarily defined subclinical tendinopathy as “the presence of either light structural changes in association with at least mild neovascularization or moderate/severe structural changes with/without neovascularization” [23]. In the study, however, the determination of structural changes was done by quantitative assessments of tendon echo intensity and size and by qualitative analysis of the B-mode ultrasound images of both the dominant and non-dominant side, which is a very subjective technique and can depend greatly on the ultrasound scanner settings [24]. On the contrary, texture features that can be calculated on the B-mode ultrasound image are intensity-invariant and have proven to be informative in the characterization of various tissues, such as breast [25], ovarian tumors [26], thyroid lesions [27], liver [28], and recently also in musculoskeletal images [29].
In this study, we aim to quantitatively analyze the presence of patellar tendon abnormality and subclinical tendinopathy in professional asymptomatic players using a texture-based morphological approach and the same image database as presented in [23]. In particular, the study provides quantitative texture features calculated on the images initially used for the determination of a qualitative structure score [23], and analyzes the capability of this approach to discriminate between the dominant and non-dominant side of the player, and to determine the presence of subclinical tendinopathy as defined previously.

2. Materials and Methods

2.1. Subject Database

Fourteen elite players of “pallapugno” who did not present any neuromuscular or skeletal impairment volunteered to participate in the study. This sport is similar to Frisian handball and implies that throwers repeatedly overload the non-dominant lower limb. The mean age was 21.8 ± 4.2 years and all participants were male. Side dominance was determined using the “Waterloo Handedness and Footedness Questionnaires—Revised” [30], according to which, all subjects were right side dominant. The study conformed to the guidelines of the Declaration of Helsinki and was approved by the local ethics committee of the University of Turin. A detailed explanation of the protocol was given to the participants who then gave written informed consent before participating.

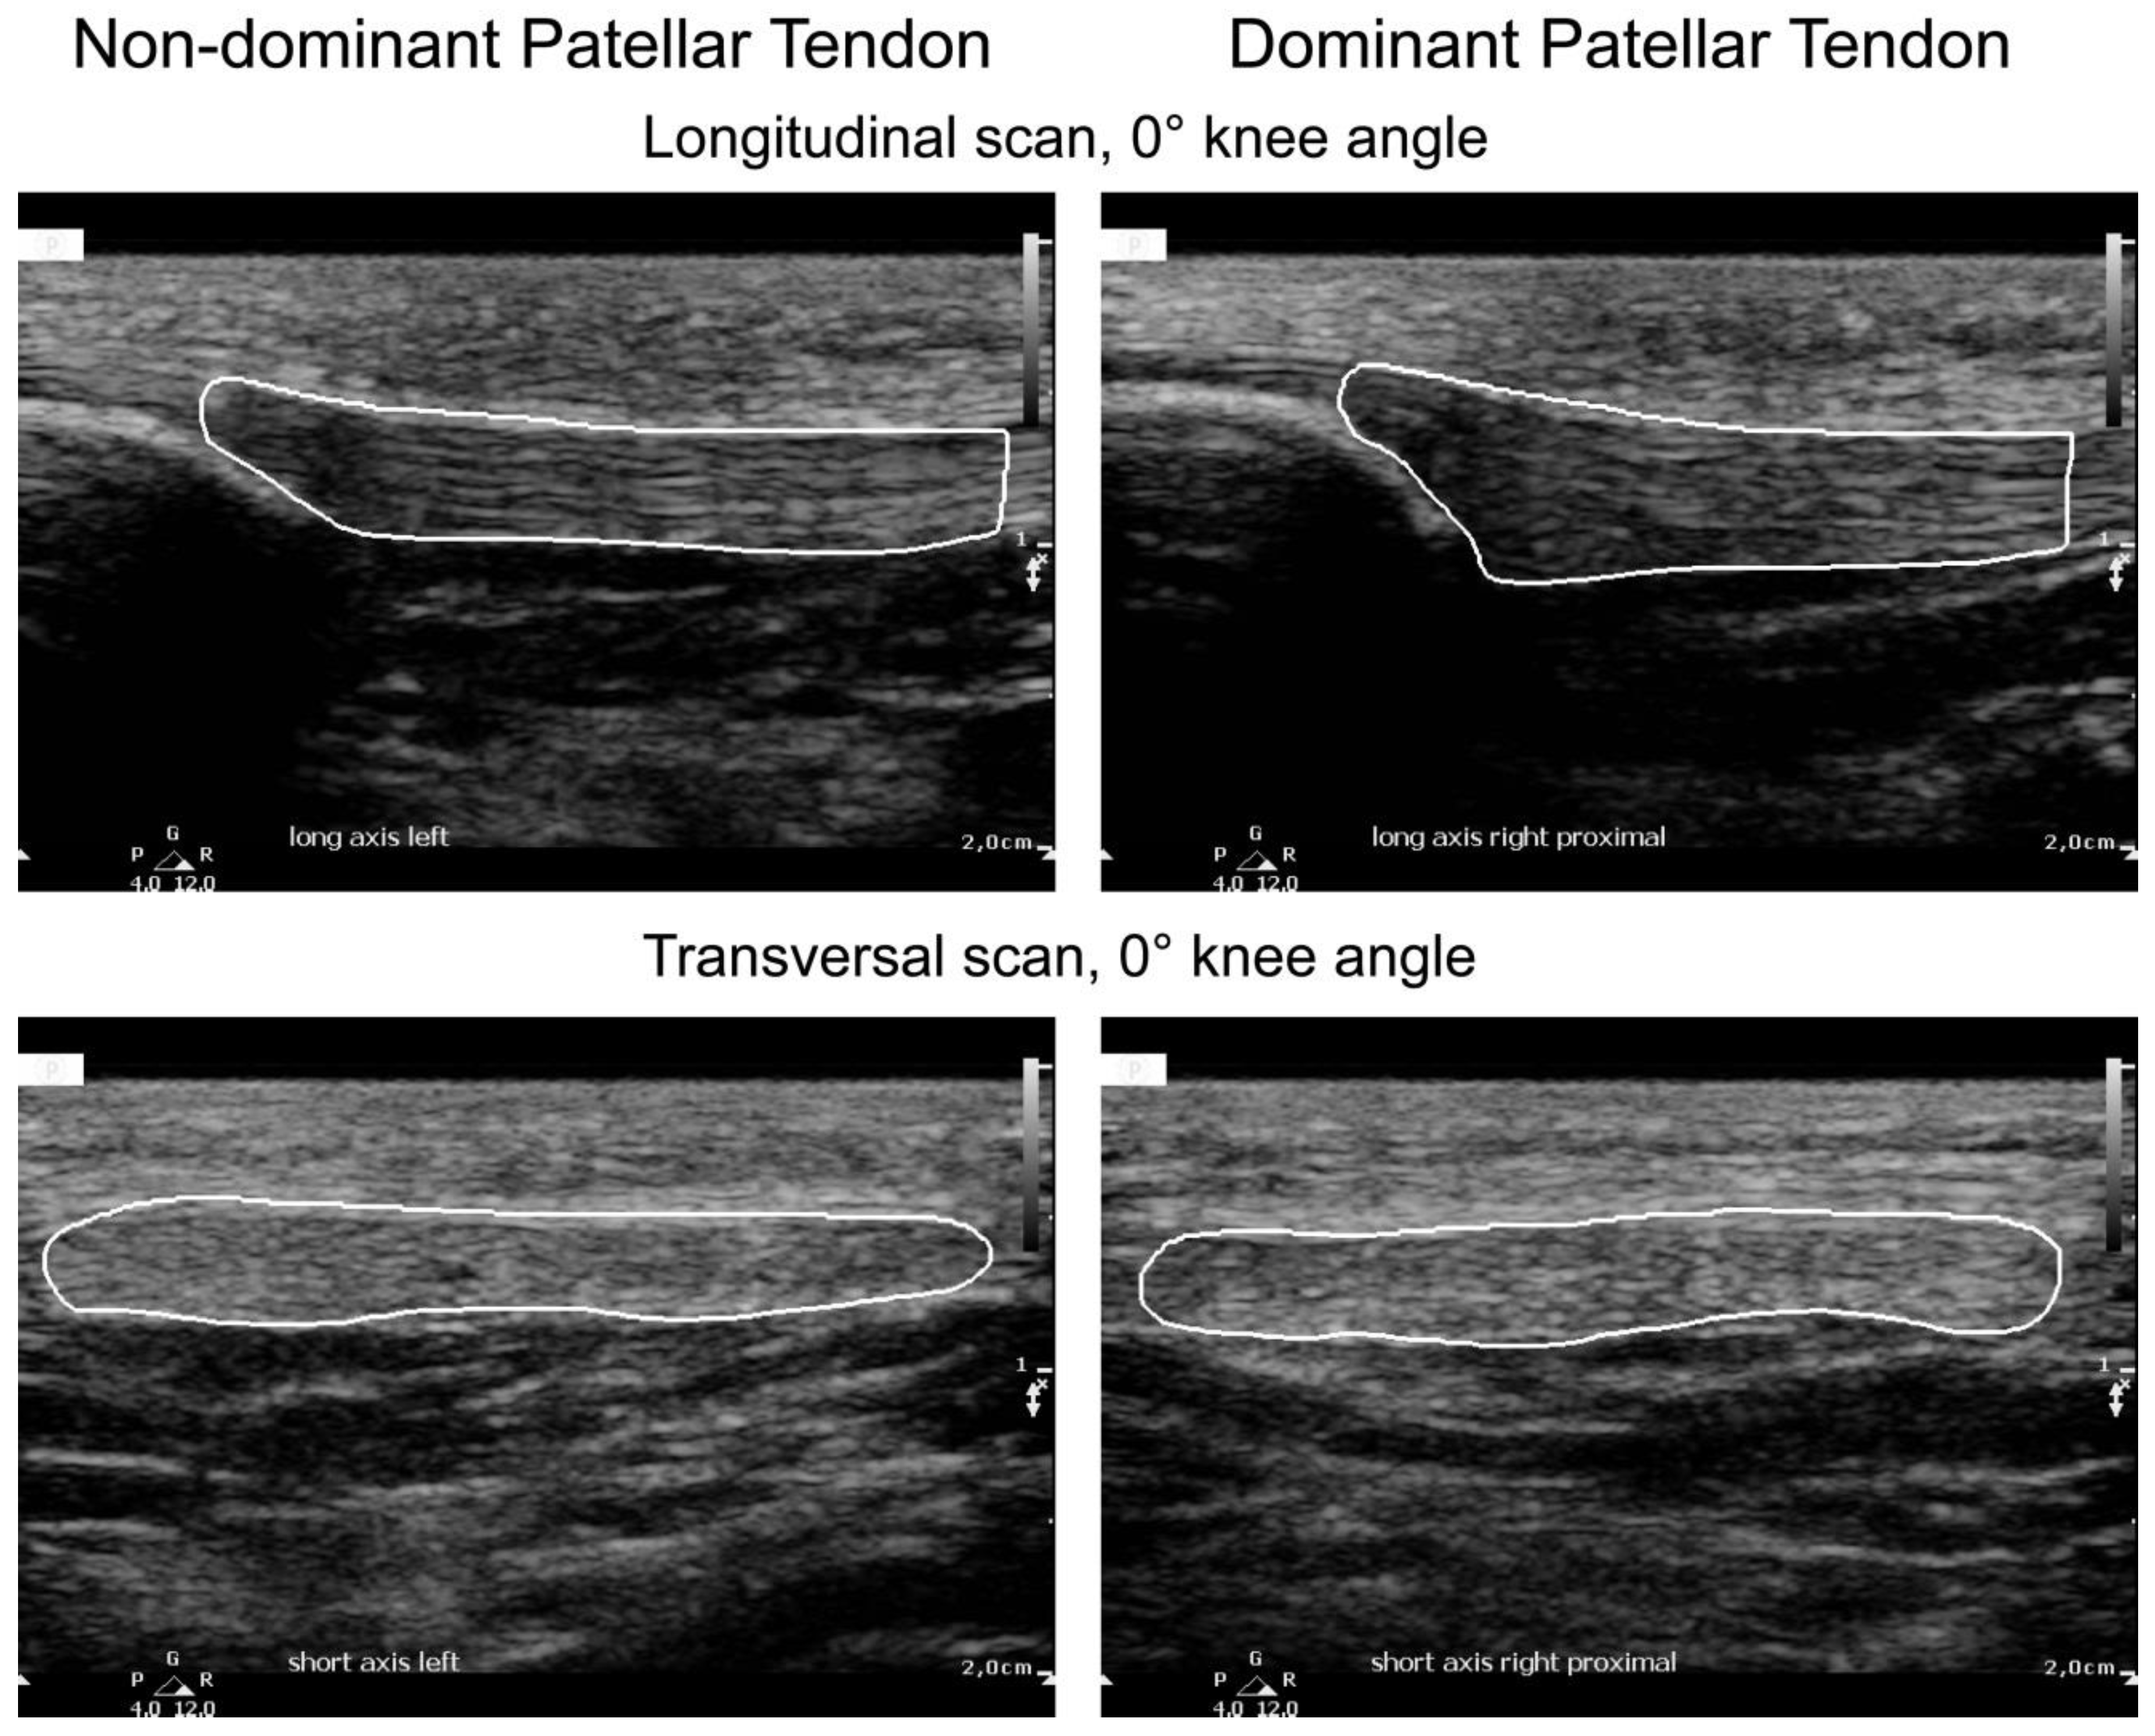
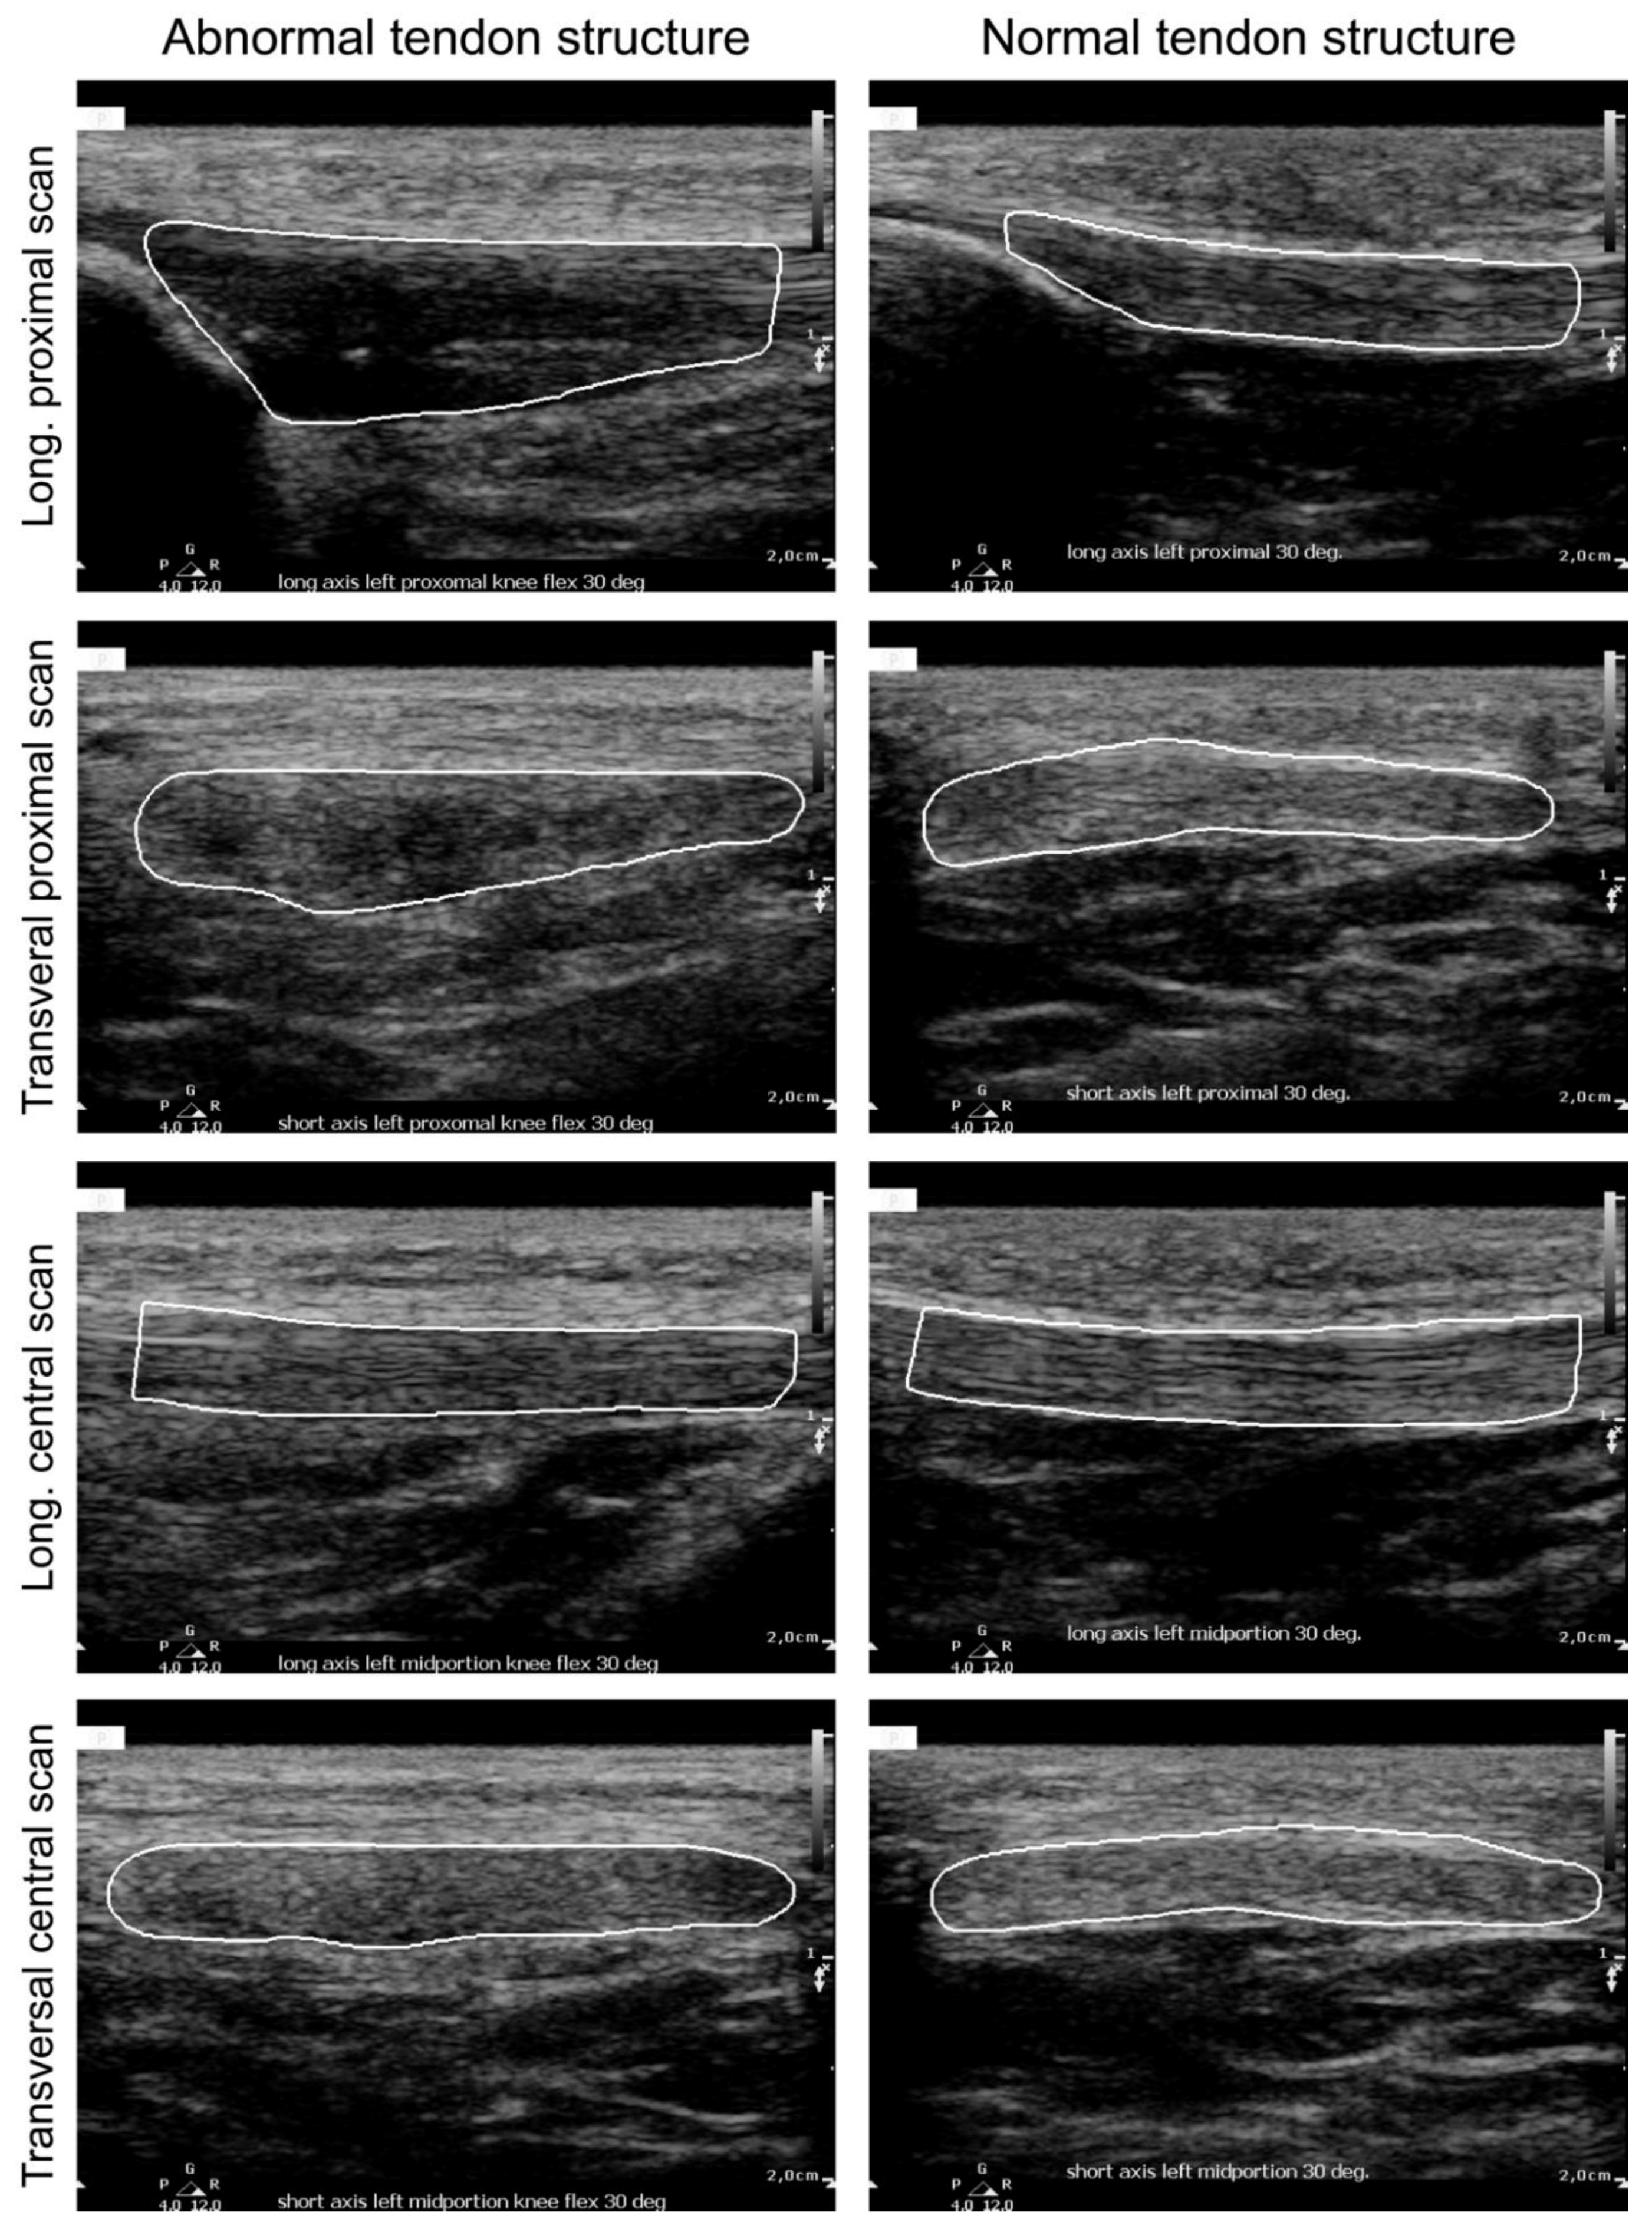
2.2. Ultrasound Image Acquisition and Protocol

The subjects were asked to refrain from performing any strenuous physical activity 24 h before the experimental session, during which B-mode ultrasound patellar tendon images were acquired. Both the dominant and the non-dominant side were studied. The same experienced sonographer (M.G.) performed all image acquisitions, for a total of 20 images for each subject. Specifically, while the subject had the quadriceps muscle relaxed and was lying in a supine position, 8 images were acquired with a knee angle of 30°, and then with a knee angle of 0°, 12 scans were acquired. For the purpose of this texture-analysis study, 6 images on each side were analyzed as reported in Table 1. The remaining 4 images on each side were employed also for qualitative assessments of neovascularization and tendon structure as reported in [23]. According to the definition as cited in the Introduction [23], 5 subjects out of the 14 were found to be affected by subclinical tendinopathy (i.e., 5 subjects demonstrated the presence of light structural changes in association with at least mild neovascularization or moderate/severe structural changes with/without neovascularization).
All images were acquired using a ClearVue 550 ultrasound machine (Philips Medical Systems, Milan, Italy) equipped with a linear array transducer (Philips L12-5, central frequency = 5–12 MHz). The time-gain compensation was kept equal for all scans (neutral), dynamic image compression was turned off, and the gain was set at 50% of the total range. The image acquisition preset was kept the same for each subject and throughout the study. The ultrasound images were stored as DICOM files and analyzed offline.

2.3. Texture Feature Extraction

All images were visually inspected and analyzed by the same experienced operator (C.C.) who drew a region of interest (ROI) encompassing the tendon area within the ultrasound image frame. Figure 1 shows some examples of ROIs for one subject, comparing the dominant and non-dominant side of the tendon. Figure 2 displays some example images of the non-dominant side of the players, highlighting the difference between a subject with a “normal” tendon structure and a subject with an abnormal tendon structure. An abnormal tendon structure was taken as one that fell into the category of subclinical tendinopathy as arbitrarily defined in the study by Giacchino et al. [23] and as stated previously.
Numerous texture features were then extracted from within the ROI of each image, including both the dominant side and the non-dominant side of the player. Specifically, a total of 90 texture features were extracted for each ROI, for a total of 1080 textures features extracted for each subject (90 features × 6 images × 2 sides). The texture features can be divided into the following three main categories: (1) first-order statistical descriptors, (2) Haralick features, and (3) higher-order spectra, entropy features, and Hu’s moments, which are subsequently described in more detail. All texture parameters were calculated by custom developed software in MATLAB (The MathWorks, Natick, MA, USA).

2.3.1. First-Order Statistical Descriptors

Six texture features that are based on the first order statistics were extracted: pixel intensity mean, variance, standard deviation, skewness, kurtosis, and energy. These features depend on the single gray level of the pixel and the mathematical descriptions are defined in Table 2.

2.3.2. Haralick Features

The Haralick features are based on the gray level co-occurrence matrix (GCLM) [31], which measures the number of times a specific intensity pattern between adjacent pixels is repeated. Since adjacency can be measured in four principal directions (e.g., vertical, horizontal, and two diagonal directions), the GLCM is computed using four angles: 0°, 45°, 90°, and 135°. The Haralick features mathematically describe the GLCM through the calculation of the symmetry, contrast, homogeneity, entropy, energy, and correlation. These features are computed for four directions, so a total of 24 descriptors are extracted for each ROI. The mathematical description of these features can be found in Table 3.

2.3.3. Higher-Order Spectra, Entropy Features, and Hu’s Moments

Higher-order spectra (HOS) invariants were first extracted from each ROI, which retains both phase and magnitude information of the image [32]. The normalized bispectrum and phase entropies are calculated from bispectrum plots for every 20° (i.e., 9 directions, from 0° to 160°), generating a total of 45 features since each bispectrum plot can be described with 5 features [32]. To further analyze and measure pixel variations, the energy, Shannon [33], Renyi [34], Fuzzy [35], Kapur [36], Yager [37], Vajda [38], and maximum entropy [39] were calculated on each ROI. Finally, 7 Hu’s moments which represent the invariant patterns of the image were extracted [40].

2.4. Statistical Analysis

The overall number of texture features for each ROI was equal to 90, and each subject was represented by 6 different B-mode images on both the dominant and non-dominant side. We used a multivariate analysis of variance (MANOVA) to test the equality of the means among groups, considering both the discrimination between (1) dominant side texture features and non-dominant side texture features, and (2) subclinical tendinopathy texture features and non-subclinical tendinopathy texture features, considering only the non-dominant side. In order to avoid singularities in the observation matrix, collinear variables were first removed by the Belsley collinearity diagnostics technique [41] prior to the MANOVA analysis. The default value of tolerance for the Belsley collinearity diagnostics was used (tolerance value = 0.5) when considering the discrimination between the dominant and non-dominant side. On the other hand, when determining the presence or absence of subclinical tendinopathy, a tolerance value of 0.35 was used. These optimal values were employed since a higher tolerance value led to an insufficient removal of collinear variables, whereas a lower value discarded an excessive number of variables.
The dimension of the MANOVA was used to assess how many groups the data belongs to; in particular, a dimension equal to 0 means that it is not possible to reject the null hypothesis that all subjects belong to the same group. Similarly, a dimension equal to 1 indicates that we can reject the null hypothesis, meaning that the subjects can be divided into two groups. The Receiving Operator Characteristic (ROC) analysis [42] was then performed on the first canonical variable in order to test the classification quality obtained with the MANOVA analysis.

3. Results

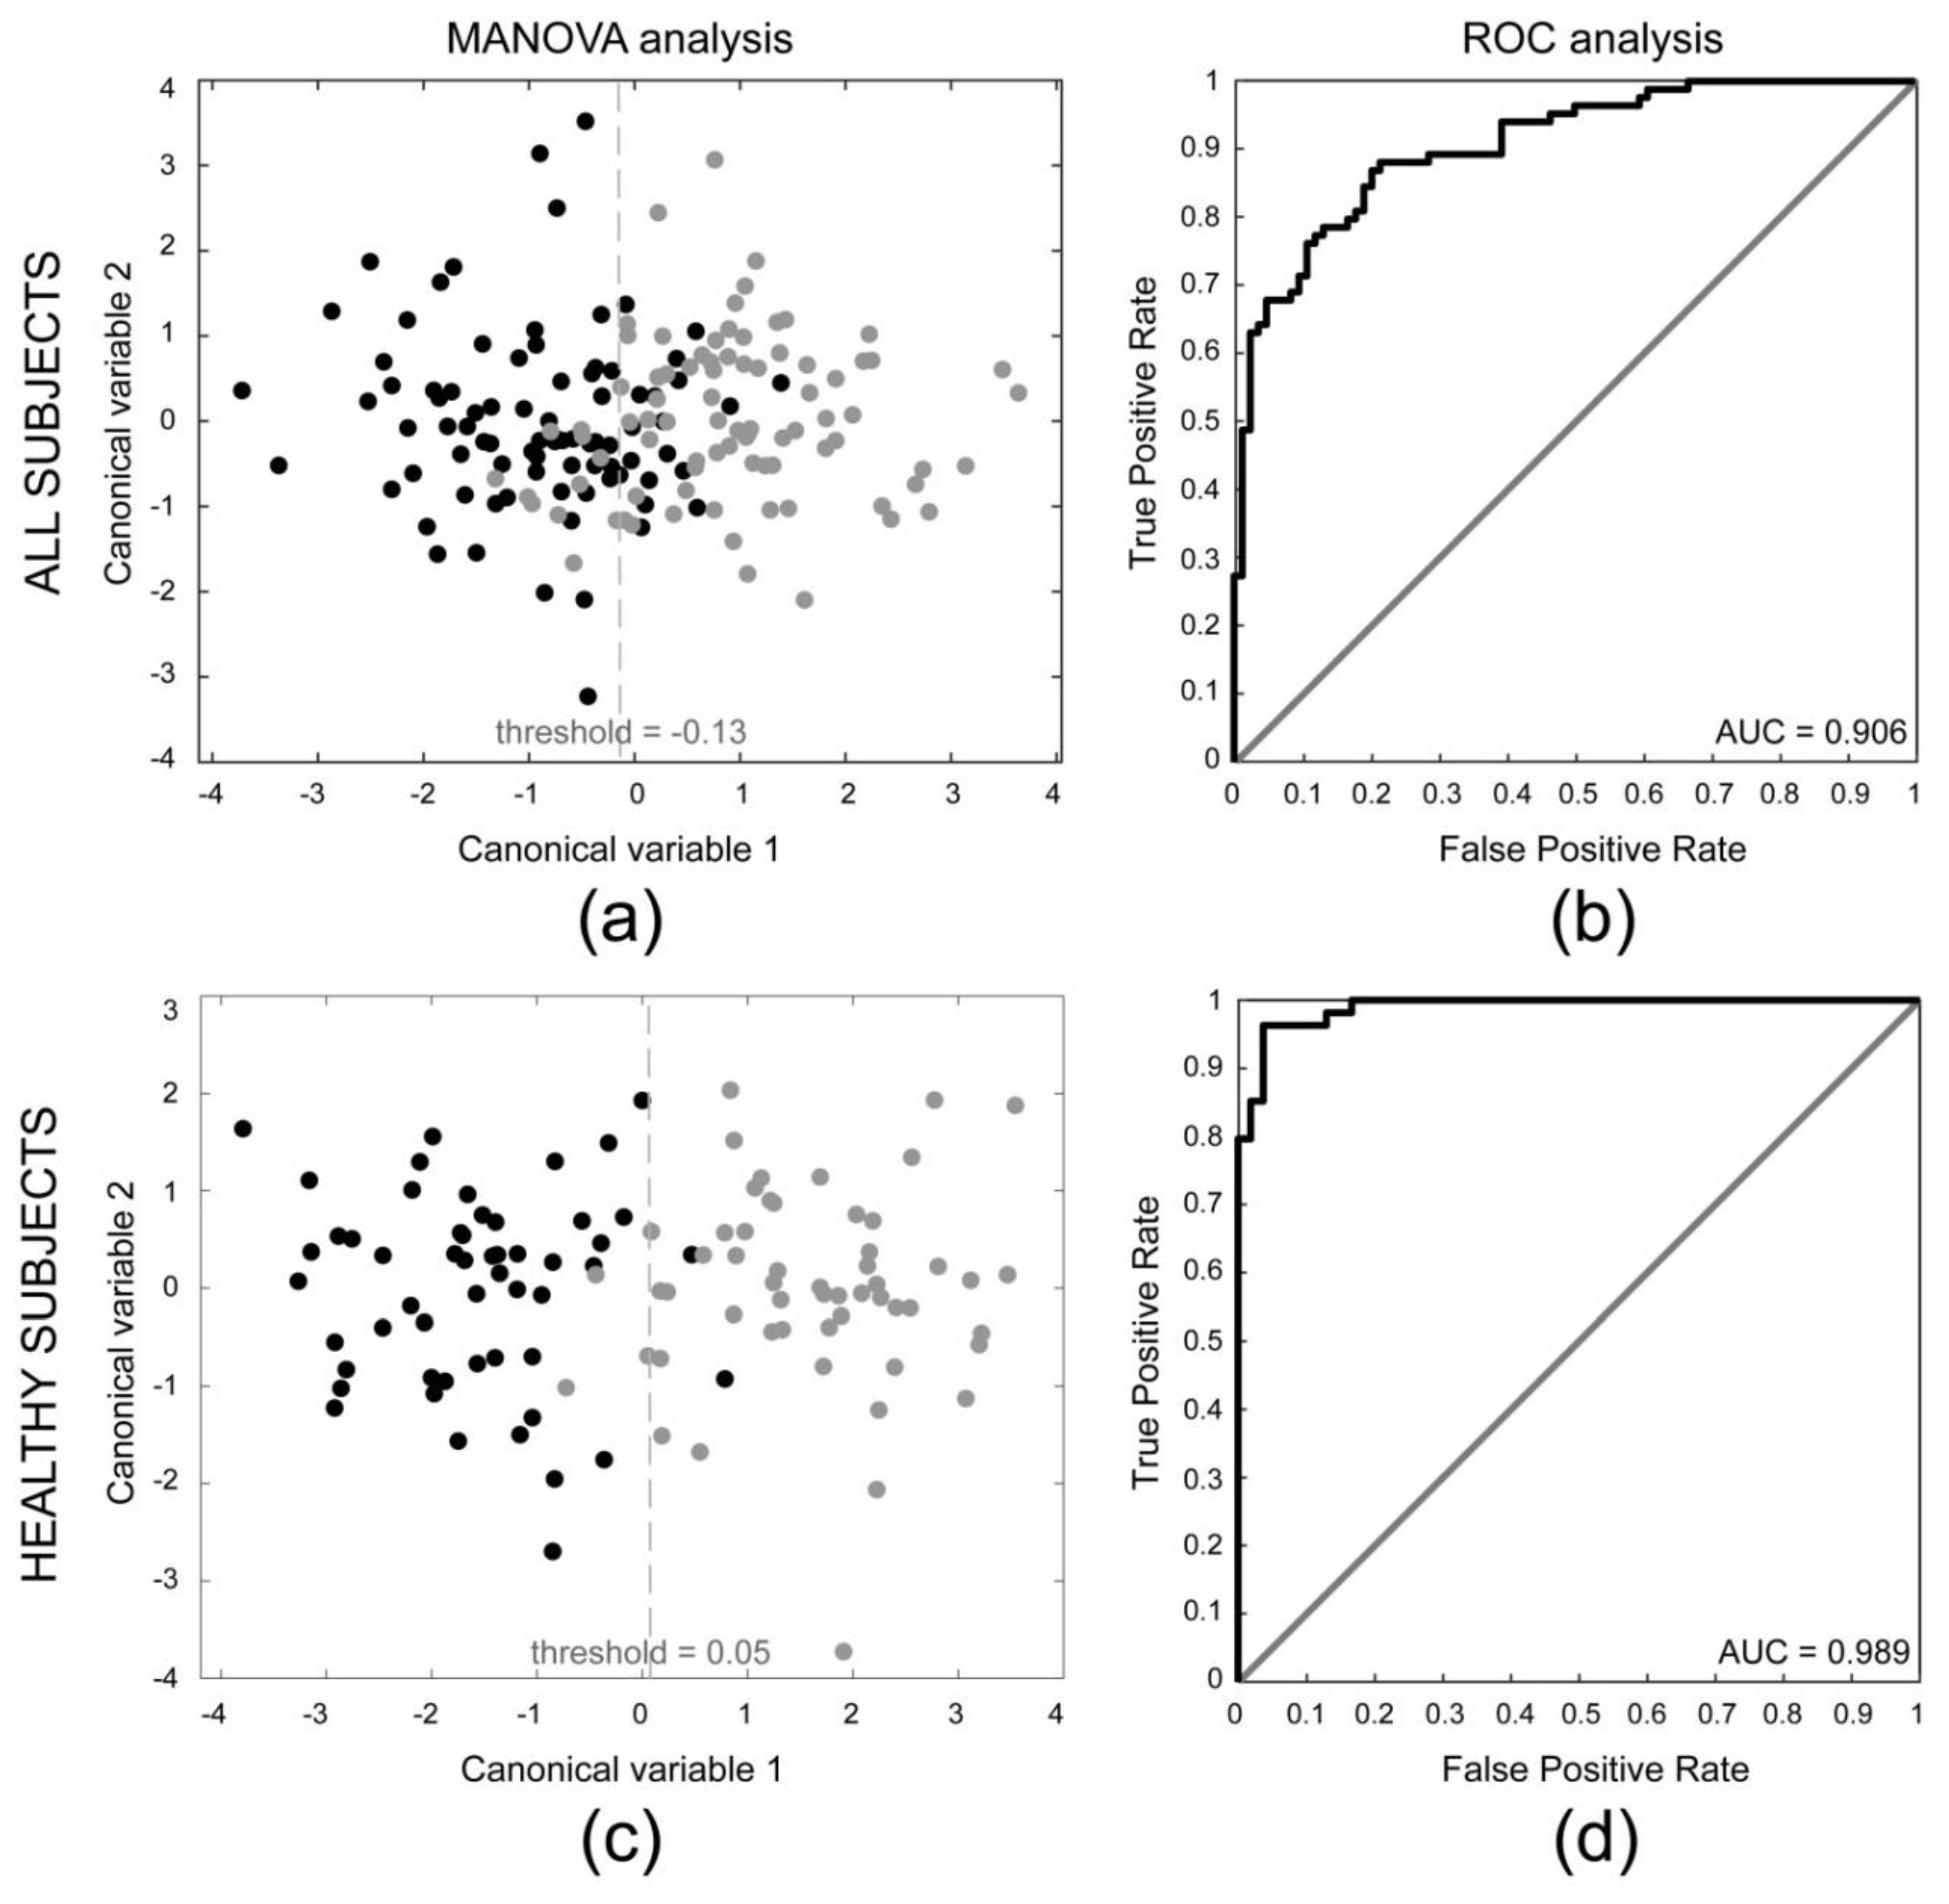
3.1. Comparison between Dominant and Non-Dominant Side

When the tendon side (dominant or non-dominant) was considered as the dependent variable, 28 collinear variables were removed using the Belsley collinearity diagnostics technique, therefore leaving a final total of 62 texture features that were considered in the MANOVA analysis. The MANOVA dimension of the groups means was equal to 1 (p < 0.05). MANOVA dimensionality is fundamental for understanding how the different samples were distributed on the canonical variables hyperplane. In fact, MANOVA canonical variables are linear combinations of the original texture features and are constructed so as to maximize the variance among groups. Finding a dimension of 1 therefore ensures that one canonical variable (i.e., the first, since they are ordered with decreasing explained variance) is sufficient to discriminate between tendon images of the dominant side of the players or of the non-dominant side of the players. Figure 3a shows the plot of the samples based on the first and second canonical variable, where a full dark circle indicates the dominant side of the player, and the full light gray circle indicates the non-dominant side. As can be seen in this figure, the first canonical variable is able to discriminate between the dominant and non-dominant side of the players.
The first column of Table 4 lists the texture features that had the highest absolute weight on the first canonical variable, meaning that they were the most discriminant for the determination of the side. The ROC analysis gave an area under the curve (AUC) equal to 0.906 (Figure 3b). Considering an optimal threshold as the one determined by the maximum Youden index (sensitivity + specificity − 1), the final classification results gave a sensitivity equal to 86.9%, a specificity equal to 79.8%, and an accuracy equal to 83.3%.
Furthermore, we then analyzed the same dependent variable (dominant or non-dominant side) but removing the subjects that presented subclinical tendinopathy. This further analysis was done to ensure that the presence of these subjects did not skew the previous results. In this case, 16 collinear variables were removed, leaving a final total of 74 texture features that were considered in the MANOVA analysis. Figure 3c shows the plot of the samples based on the first and second canonical variable, where a full dark circle indicates the dominant side of the player, and the full light gray circle indicates the non-dominant side. As can be seen in this figure, the first canonical variable is again able to discriminate between the dominant and non-dominant side of the healthy players.
The second column of Table 4 lists the texture features that had the highest absolute weight on the first canonical variable, meaning that they were the most discriminant for the determination of the side. The ROC analysis gave an area under the curve (AUC) equal to 0.989 (Figure 3d). Considering an optimal threshold as the one determined by the maximum Youden index, the final classification results gave sensitivity, specificity, and accuracy all equal to 96.3%.

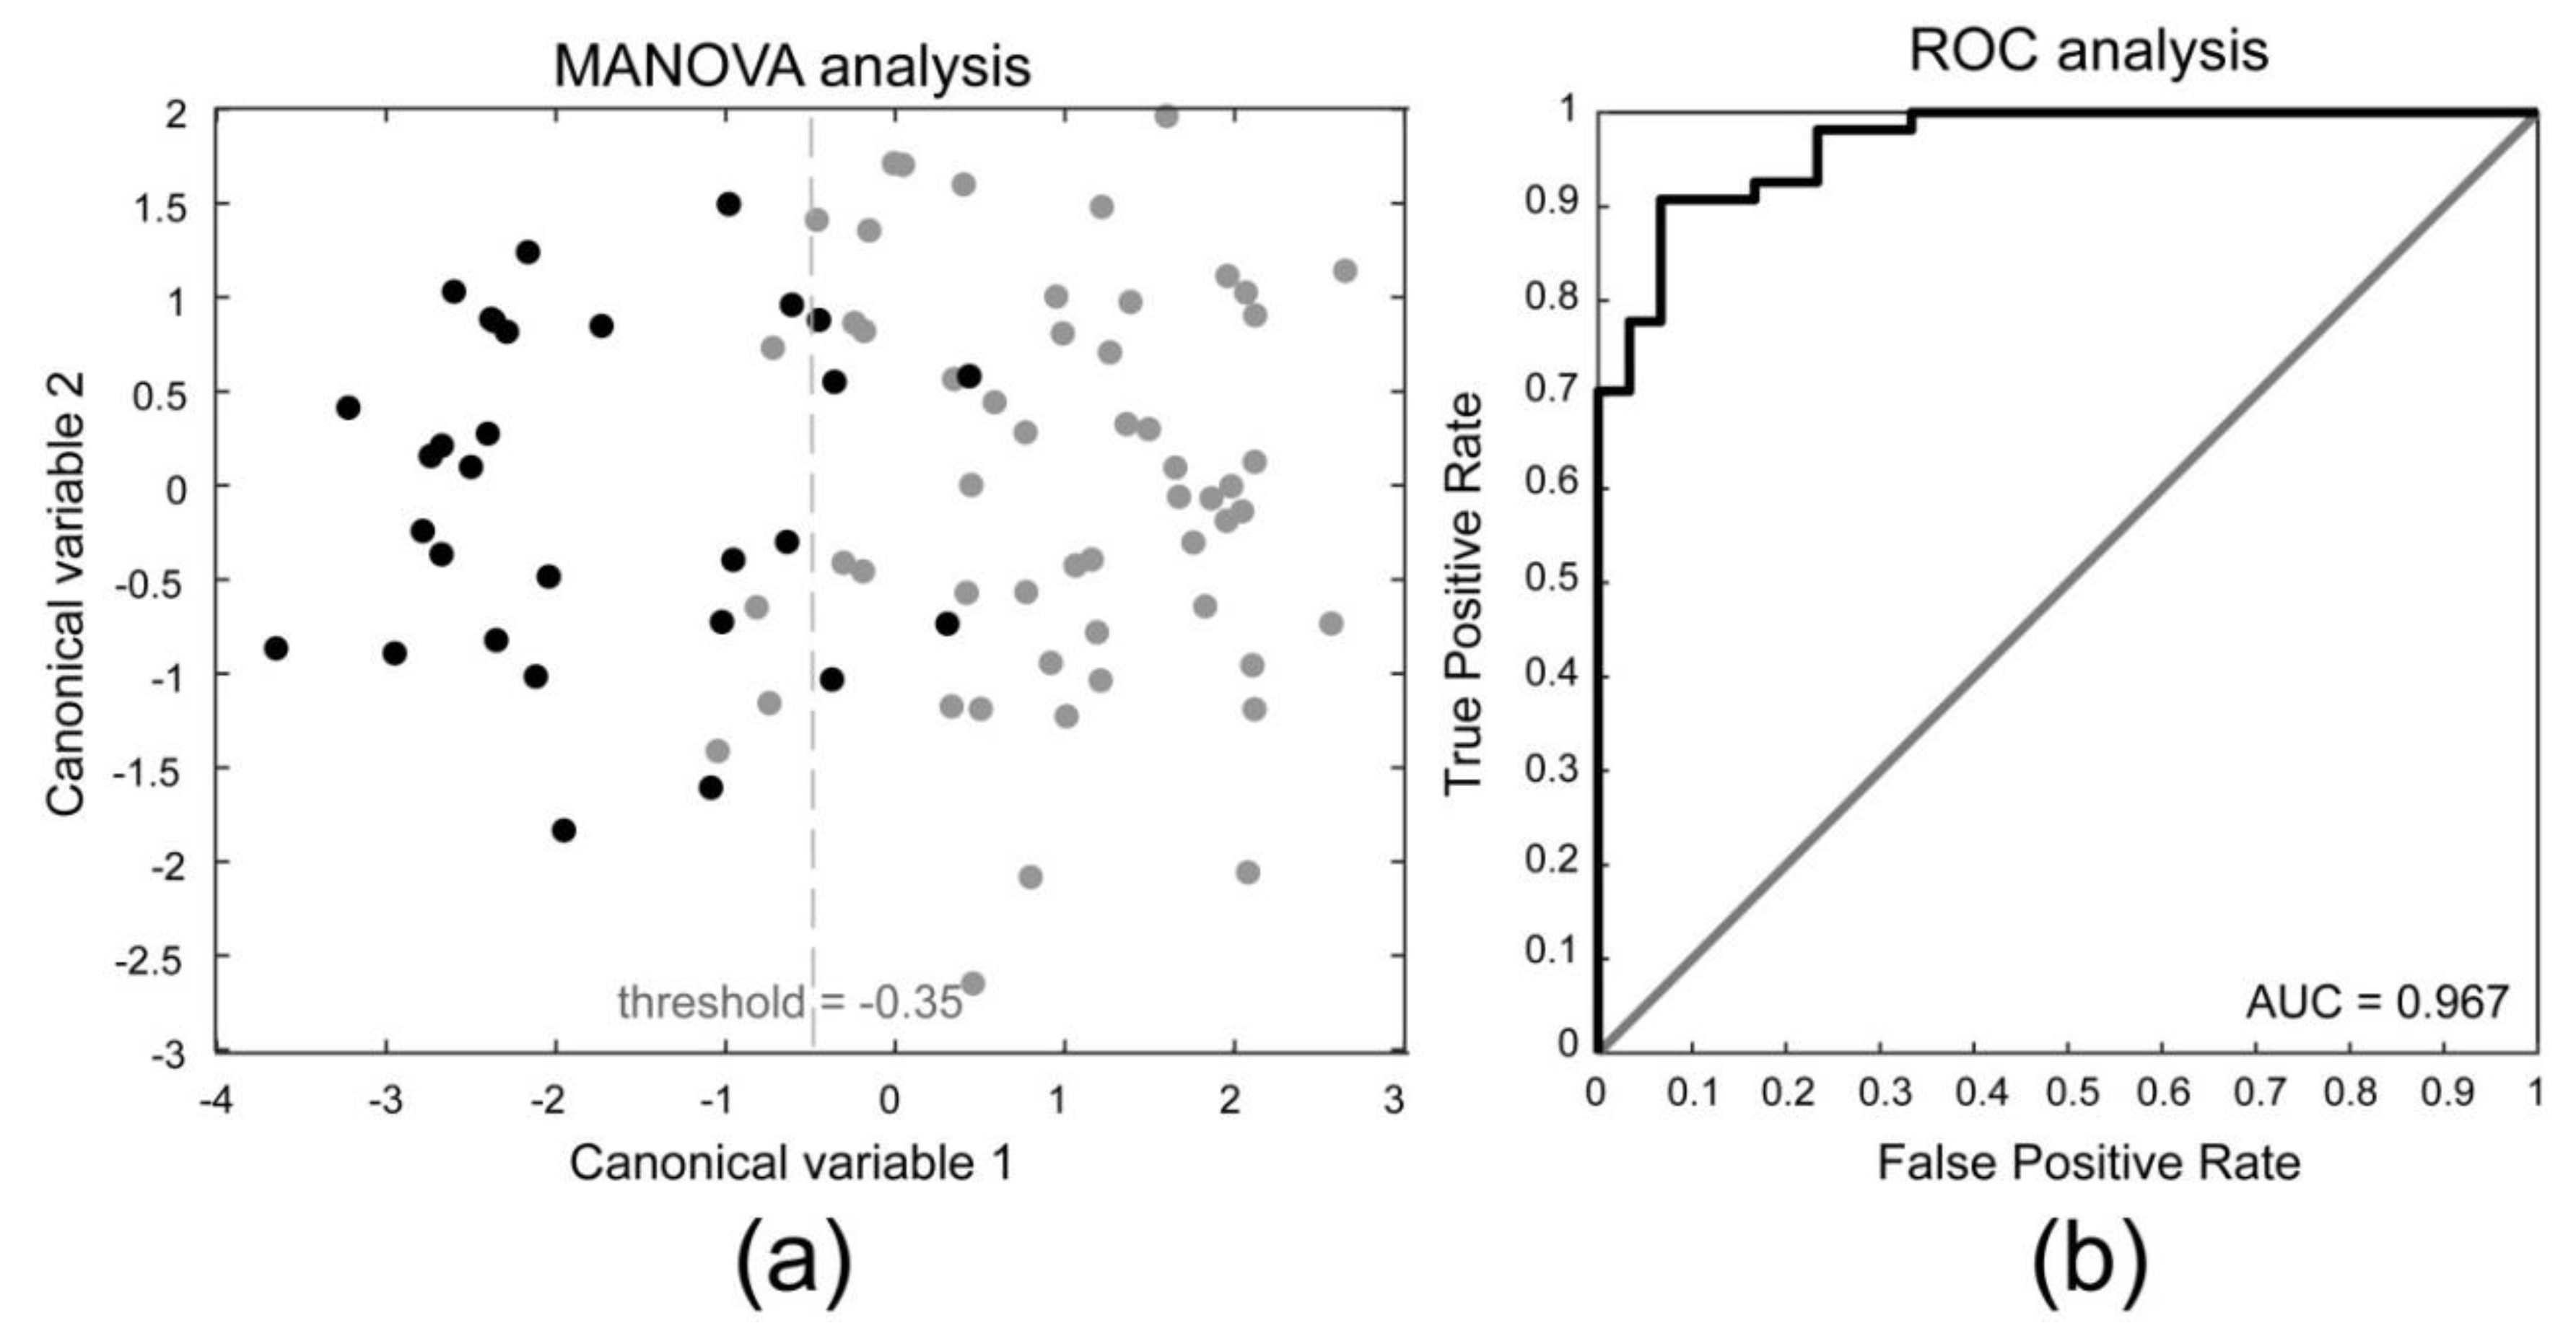
3.2. Comparison between Subclinical Tendinopathy and Non-Subclinical Tendinopathy

When aiming to discriminate between the patients that presented subclinical tendinopathy and those that did not, and using only the images acquired on the non-dominant side of each player (i.e., a non-dominant PT is expected in the investigated group of thrower players given that the throwing performance of these players implies a repeated overload of the non-dominant lower limb), 54 collinear variables were removed using the Belsley collinearity diagnostics technique, therefore leaving a final total of 36 texture features that were considered in the MANOVA analysis. The MANOVA analysis again showed a dimension of the groups means equal to 1 (p < 0.05). We can therefore be assured that the first canonical variable is able to discriminate between these two cases, as can be seen also in Figure 4a. In this figure, the full gray circles represent the “healthy” cases, whereas the black circles represent the subclinical tendinopathy cases.
The second column of Table 4 lists the texture features that had the highest weight on the first canonical variable, meaning that they were the most discriminant for the determination of subclinical tendinopathy. The ROC analysis gave forth an area under the curve (AUC) equal to 0.967 (Figure 4b). Considering an optimal threshold as the one determined by the maximum Youden index, the final classification results gave a sensitivity equal to 93.3%, a specificity equal to 90.7%, and an accuracy equal to 91.7%.
As can be appreciated from Table 4, the first-order and Haralick features proved to be the most discriminant for both determining the dominant or non-dominant side and in determining the presence or absence of subclinical tendinopathy. The higher-order spectra and entropy features, on the other hand, were not among the 10 most discriminant features.

4. Discussion

In the present study, quantitative ultrasonography was performed in tendon images of 14 players acquired on both the dominant and non-dominant side. Ninety texture features were calculated in the tendon region of each image in order assess the characterization performance of the texture descriptors in discriminating between sides and in discriminating the presence or absence of subclinical tendinopathy, as arbitrarily defined. Our results show that the first-order and Haralick features proved to be highly linked to both tendon side and the presence of subclinical tendinopathy, whereas the higher-order spectra and entropy features did not add any further information when considering these two cases. To the best of our knowledge, this is the first study that used texture features for the quantitative analysis of tendon images for the determination of patellar tendon abnormality.
The tendinopathic process includes an increase in the number of vessels, tendon thickness, hydrated components of the extracellular matrix, and the disorganization of collagen fibers and breakdown of tissue organization [43,44,45,46]. Most of these findings may underlie the occurrence of ultrasound markers of tendon histopathology, such as increased tendon cross-sectional area and vascularity and decreased tendon echogenicity and stiffness. In fact, PT can also be investigated through the employment of ultrasonic shear wave imaging [18,21,47,48,49], which gives information about the stiffness of the affected tendon, but it is still typically evaluated through the ultrasonographic assessment of tendon structure and size, such as the presence of hypoechoic areas, altered vascularity, and localized tendon thickening. A previous study by the authors demonstrated quantitatively how tendon size and echogenicity were related to the presence of subclinical tendinopathy [23]. However, in the study, only a qualitative analysis was done to assess structural changes and the presence of neovascularization. In this current study, we showed how we can effectively discriminate subjects based solely on the quantitative texture features.
As can be noted, the Haralick features were quite determinant in understanding if an image was either of the dominant or non-dominant side of the player and also in discriminating between the presence or absence of subclinical tendinopathy. These features are based on statistics calculated on the gray level co-occurrence matrix, which describes the patterns of neighboring pixels in an image, giving an idea of the complexity of the various distributions of pixel intensity. Although no histological analysis was done in this study, we can hypothesize that these features can be attributed to a disorganization of collagen fibers and breakdown of tissue organization which are typically not assessable through a mere calculation of tendon size or the presence of hypoechoic areas. It can be noted how the most discriminant features are different when considering side determination when including or excluding the subclinical tendinopathy subjects. In fact, when these subjects are included, the “kurtosis” and “skewness” features are among the most discriminant. These two features measure how outlier-prone a distribution is and the asymmetry of the data distribution, respectively, showing how, while the MANOVA analysis is still able to correctly discriminate between dominant and non-dominant sides, the subclinical tendinopathy subjects present discriminative features that are more related to a disorganization of tissues. This can also be observed when discriminating between subjects with and without subclinical tendinopathy, where the Haralick Symmetry feature (0°) is the most discriminant feature, and where numerous other features that can describe the tissue organization (such as entropy, correlation, homogeneity) are also found to be discriminant. As can be noted in the second column of Table 4, when considering only subjects without subclinical tendinopathy and discriminating the side determination, the first two features (Homogeneity and Contrast) represent a very high weight, approximately three times higher than the third feature. From this analysis, we can see that even when considering only healthy subjects, there is still a net difference in the tendon ultrasound texture parameters that relate to tissue organization and echogenicity, which is also in accordance with the study by Giacchino et al. [23].
A main finding of this study is how, through a quantitative textural analysis of only B-mode images, it is possible to determine with high accuracy the subjects that presented a subclinical tendinopathy as defined arbitrarily by inspecting both B-mode images and Power Doppler images (for the assessment of neovascularization). We can therefore hypothesize that a quantitative texture-based approach as presented here can be of aid for the diagnosis (as well as monitoring and prognosis) of subclinical tendinopathy in a standardized manner, requiring only the identification of the tendon ROI within the B-mode image.
The clinical management of patellar tendinopathy is currently complicated as the diagnosis is currently based on a combination of clinical criteria and ultrasound/MRI findings. However, there are no means to detect the onset of tendinopathy before the appearance of clinical signs and no tools are currently available for the prediction and prognosis of patellar tendinopathy. Therefore, the availability of ultrasound markers of tendon histopathology can be useful to track the progression of tendinopathy over time and may help to indicate early response to therapeutic interventions.
However, further studies are required to establish a causal association between ultrasound markers of tendon histopathology and the actual development of tendinopathy as well as the increased risk of tendon rupture.
This work has the following main limitations. First of all, the sample size was small and included only athletes that played a very specific sport, making it difficult to generalize our findings to other populations. Secondly, no histopathological assessment was done to confirm the development of tendinopathy.
In the future, we plan to extend our work presented here and analyze the potential correlations between tendon texture features and its stiffness, and to develop an automated tool for the segmentation of the tendon in the ultrasound frame, which would enhance both the morphological and elastic analysis of tendon properties.

5. Conclusions

In conclusion, the current study confirmed the possibility of identifying tendon abnormalities through the quantitative texture analysis of ultrasound B-mode images. Specifically, we showed how it is possible to both discriminate between the dominant and non-dominant patellar tendon of “pallapugno” players and, more importantly, to discriminate between players with or without subclinical tendinopathy by using only the quantitative texture features calculated on B-mode images, independent of both tendon size and information derived from a Power Doppler analysis.

Author Contributions

F.M. and M.A.M. conceived and designed the experiments; M.G. and C.C. performed the experiments; K.M.M. and M.S. analyzed the data; U.R.A. contributed analysis tools; K.M.M., F.M., M.A.M. and U.R.A. wrote the paper.

Conflicts of Interest

The authors declare no conflict of interest.

References

  1. Pillen, S.; Arts, I.M.P.; Zwarts, M.J. Muscle ultrasound in neuromuscular disorders. Muscle Nerve 2008, 37, 679–693. [Google Scholar] [CrossRef] [PubMed]
  2. Reeves, N.D.; Maganaris, C.N.; Narici, M.V. Ultrasonographic assessment of human skeletal muscle size. Eur. J. Appl. Physiol. 2004, 91, 116–118. [Google Scholar] [CrossRef] [PubMed]
  3. Meiburger, K.M.; Acharya, U.R.; Molinari, F. Automated localization and segmentation techniques for B-mode ultrasound images: A review. Comput. Biol. Med. 2018, 92, 210–235. [Google Scholar] [CrossRef] [PubMed]
  4. Caresio, C.; Salvi, M.; Molinari, F.; Meiburger, K.M.; Minetto, M.A. Fully Automated Muscle Ultrasound Analysis (MUSA): Robust and Accurate Muscle Thickness Measurement. Ultrasound Med. Biol. 2017, 43, 195–205. [Google Scholar] [CrossRef] [PubMed]
  5. Martinoli, C.; Derchi, L.E.; Pastorino, C.; Bertolotto, M.; Silvestri, E. Analysis of echotexture of tendons with US. Radiology 1993, 186, 839–843. [Google Scholar] [CrossRef] [PubMed]
  6. Rasmussen, O.S. Sonography of tendons. Scand. J. Med. Sci. Sports 2000, 10, 360–364. [Google Scholar] [CrossRef] [PubMed]
  7. Fredberg, U.; Bolvig, L.; Andersen, N.; Stengaard-Pedersen, K. Ultrasonography in Evaluation of Achilles and Patella Tendon Thickness. Eur. J. Ultrasound 2007, 29, 60–65. [Google Scholar] [CrossRef] [PubMed]
  8. Gellhorn, A.C.; Morgenroth, D.C.; Goldstein, B. A Novel Sonographic Method of Measuring Patellar Tendon Length. Ultrasound Med. Biol. 2012, 38, 719–726. [Google Scholar] [CrossRef] [PubMed]
  9. Sunding, K.; Fahlström, M.; Werner, S.; Forssblad, M.; Willberg, L. Evaluation of Achilles and patellar tendinopathy with greyscale ultrasound and colour Doppler: Using a four-grade scale. Knee Surg. Sport Traumatol. Arthrosc. 2016, 24, 1988–1996. [Google Scholar] [CrossRef] [PubMed]
  10. Kulig, K.; Landel, R.; Chang, Y.-J.; Hannanvash, N.; Reischl, S.F.; Song, P.; Bashford, G.R. Patellar tendon morphology in volleyball athletes with and without patellar tendinopathy. Scand. J. Med. Sci. Sports 2013, 23, e81–e88. [Google Scholar] [CrossRef] [PubMed]
  11. Giombini, A.; Dragoni, S.; Di Cesare, A.; Di Cesare, M.; Del Buono, A.; Maffulli, N. Asymptomatic Achilles, patellar, and quadriceps tendinopathy: A longitudinal clinical and ultrasonographic study in elite fencers. Scand. J. Med. Sci. Sports 2013, 23, 311–316. [Google Scholar] [CrossRef] [PubMed]
  12. Comin, J.; Cook, J.L.; Malliaras, P.; McCormack, M.; Calleja, M.; Clarke, A.; Connell, D. The prevalence and clinical significance of sonographic tendon abnormalities in asymptomatic ballet dancers: A 24-month longitudinal study. Br. J. Sports Med. 2013, 47, 89–92. [Google Scholar] [CrossRef] [PubMed]
  13. Visnes, H.; Tegnander, A.; Bahr, R. Ultrasound characteristics of the patellar and quadriceps tendons among young elite athletes. Scand. J. Med. Sci. Sports 2015, 25, 205–215. [Google Scholar] [CrossRef] [PubMed]
  14. Van der Worp, H.; de Poel, H.; Diercks, R.; van den Akker-Scheek, I.; Zwerver, J. Jumper’s Knee or Lander’s Knee? A Systematic Review of the Relation between Jump Biomechanics and Patellar Tendinopathy. Int. J. Sports Med. 2014, 35, 714–722. [Google Scholar] [CrossRef] [PubMed]
  15. Reinking, M.F. Current concepts in the treatment of patellar tendinopathy. Int. J. Sports Phys. Ther. 2016, 11, 854–866. [Google Scholar] [PubMed]
  16. Drakonaki, E.E.; Allen, G.M.; Wilson, D.J. Ultrasound elastography for musculoskeletal applications. Br. J. Radiol. 2012, 85, 1435–1445. [Google Scholar] [CrossRef] [PubMed]
  17. Arda, K.; Ciledag, N.; Aktas, E.; Arıbas, B.K.; Köse, K. Quantitative Assessment of Normal Soft-Tissue Elasticity Using Shear-Wave Ultrasound Elastography. Am. J. Roentgenol. 2011, 197, 532–536. [Google Scholar] [CrossRef] [PubMed]
  18. Zhang, Z.J.; Ng, G.Y.; Lee, W.C.; Fu, S.N. Changes in Morphological and Elastic Properties of Patellar Tendon in Athletes with Unilateral Patellar Tendinopathy and Their Relationships with Pain and Functional Disability. PLoS ONE 2014, 9, e108337. [Google Scholar] [CrossRef] [PubMed]
  19. Zhang, Z.J.; Fu, S.N. Shear Elastic Modulus on Patellar Tendon Captured from Supersonic Shear Imaging: Correlation with Tangent Traction Modulus Computed from Material Testing System and Test-Retest Reliability. PLoS ONE 2013, 8, e68216. [Google Scholar] [CrossRef] [PubMed]
  20. Porta, F.; Damjanov, N.; Galluccio, F.; Iagnocco, A.; Matucci-Cerinic, M. Ultrasound elastography is a reproducible and feasible tool for the evaluation of the patellar tendon in healthy subjects. Int. J. Rheum. Dis. 2014, 17, 762–766. [Google Scholar] [CrossRef] [PubMed]
  21. Hsiao, M.-Y.; Chen, Y.-C.; Lin, C.-Y.; Chen, W.-S.; Wang, T.-G. Reduced Patellar Tendon Elasticity with Aging: In Vivo Assessment by Shear Wave Elastography. Ultrasound Med. Biol. 2015, 41, 2899–2905. [Google Scholar] [CrossRef] [PubMed]
  22. Cook, J.L.; Khan, K.M.; Kiss, Z.S.; Coleman, B.D.; Griffiths, L. Asymptomatic hypoechoic regions on patellar tendon ultrasound: A 4-year clinical and ultrasound followup of 46 tendons. Scand. J. Med. Sci. Sports 2001, 11, 321–327. [Google Scholar] [CrossRef] [PubMed]
  23. Giacchino, M.; Caresio, C.; Gorji, N.E.; Molinari, F.; Massazza, G.; Minetto, M.A. Quantitative analysis of patellar tendon size and structure in asymptomatic professional players: Sonographic study. MLTJ 2017, 7, 449–458. [Google Scholar] [CrossRef] [PubMed]
  24. Pillen, S.; Tak, R.O.; Zwarts, M.J.; Lammens, M.M.Y.; Verrijp, K.N.; Arts, I.M.P.; van der Laak, J.A.; Hoogerbrugge, P.M.; van Engelen, B.G.M.; Verrips, A. Skeletal muscle ultrasound: Correlation between fibrous tissue and echo intensity. Ultrasound Med. Biol. 2009, 35, 443–446. [Google Scholar] [CrossRef] [PubMed]
  25. Singh, A.P.; Singh, B. Texture Features Extraction in Mammograms Using Non-Shannon Entropies; Springer: Dordrecht, The Netherlands, 2010; pp. 341–351. [Google Scholar]
  26. Acharya, U.R.; Krishnan, M.M.R.; Saba, L.; Molinari, F.; Guerriero, S.; Suri, J.S. Ovarian Tumor Characterization Using 3D Ultrasound. In Ovarian Neoplasm Imaging; Springer: Boston, MA, USA, 2013; pp. 399–412. [Google Scholar]
  27. Acharya, U.R.; Faust, O.; Sree, S.V.; Molinari, F.; Suri, J.S. ThyroScreen system: High resolution ultrasound thyroid image characterization into benign and malignant classes using novel combination of texture and discrete wavelet transform. Comput. Methods Programs Biomed. 2012, 107, 233–241. [Google Scholar] [CrossRef] [PubMed]
  28. Gao, S.; Peng, Y.; Guo, H.; Liu, W.; Gao, T.; Xu, Y.; Tang, X. Texture analysis and classification of ultrasound liver images. Biomed. Mater. Eng. 2014, 24, 1209–1216. [Google Scholar] [CrossRef] [PubMed]
  29. Molinari, F.; Caresio, C.; Acharya, U.R.; Mookiah, M.R.K.; Minetto, M.A. Advances in Quantitative Muscle Ultrasonography Using Texture Analysis of Ultrasound Images. Ultrasound Med. Biol. 2015, 41, 2520–2532. [Google Scholar] [CrossRef] [PubMed]
  30. Elias, L.J.; Bryden, M.P.; Bulman-Fleming, M.B. Footedness is a better predictor than is handedness of emotional lateralization. Neuropsychologia 1998, 36, 37–43. [Google Scholar] [CrossRef]
  31. Haralick, R.M.; Shanmugam, K.; Dinstein, I. Textural Features for Image Classification. IEEE Trans. Syst. Man Cybern. 1973, 6, 610–621. [Google Scholar] [CrossRef]
  32. Shao, Y.; Celenk, M. Higher-order spectra (HOS) invariants for shape recognition. Pattern Recognit. 2001, 34, 2097–2113. [Google Scholar] [CrossRef]
  33. Shannon, C.E. A Mathematical Theory of Communication. Bell Syst. Tech. J. 1948, 27, 379–423. [Google Scholar] [CrossRef]
  34. Rényi, A. On Measures of Entropy and Information. In Proceedings of the Fourth Berkeley Symposium on Mathematical Statistics and Probability, Berkeley, CA, USA, 14 April 1961. [Google Scholar]
  35. Chen, W.; Wang, Z.; Xie, H.; Yu, W. Characterization of Surface EMG Signal Based on Fuzzy Entropy. IEEE Trans. Neural Syst. Rehabil. Eng. 2007, 15, 266–272. [Google Scholar] [CrossRef] [PubMed]
  36. Kapur, J.N. Information of orderα and typeβ. Proc. Indian Acad. Sci. 1968, 68, 65–75. [Google Scholar] [CrossRef]
  37. Ghosh, M.; Chakraborty, C.; Ray, A.K. Yager’s measure based fuzzy divergence for microscopic color image segmentation. In Proceedings of the 2013 Indian Conference on Medical Informatics and Telemedicine (ICMIT), Kharagpur, India, 28–30 March 2013; pp. 13–16. [Google Scholar]
  38. Vajda, I. Theory of Statistical Inference and Information; Kluwer Academic: Dordrecht, The Netherlands, 1989; ISBN 9027727813. [Google Scholar]
  39. Yin, P.-Y. Maximum entropy-based optimal threshold selection using deterministic reinforcement learning with controlled randomization. Signal Process. 2002, 82, 993–1006. [Google Scholar] [CrossRef]
  40. Hu, M.-K. Visual pattern recognition by moment invariants. IEEE Trans. Inf. Theory 1962, 8, 179–187. [Google Scholar] [CrossRef]
  41. Belsley, D.A.; Kuh, E.; Welsch, R.E. Regression Diagnostics: Identifying Influential Data and Sources of Collinearity; Wiley: Hoboken, NJ, USA, 2004; ISBN 9780471725145. [Google Scholar]
  42. Hanley, J.A.; McNeil, B.J. The meaning and use of the area under a receiver operating characteristic (ROC) curve. Radiology 1982, 143, 29–36. [Google Scholar] [CrossRef] [PubMed]
  43. Sharma, P.; Maffulli, N. Biology of tendon injury: Healing, modeling and remodeling. J. Musculoskelet. Neuronal Interact. 2006, 6, 181–190. [Google Scholar] [PubMed]
  44. Khan, K.M.; Cook, J.L.; Bonar, F.; Harcourt, P.; Astrom, M. Histopathology of common tendinopathies. Update and implications for clinical management. Sports Med. 1999, 27, 393–408. [Google Scholar] [CrossRef] [PubMed]
  45. Khan, K.M.; Maffulli, N.; Coleman, B.D.; Cook, J.L.; Taunton, J.E. Patellar tendinopathy: Some aspects of basic science and clinical management. Br. J. Sports Med. 1998, 32, 346–355. [Google Scholar] [CrossRef] [PubMed]
  46. Scott, A.; Backman, L.J.; Speed, C. Tendinopathy: Update on Pathophysiology. J. Orthop. Sports Phys. Ther. 2015, 45, 833–841. [Google Scholar] [CrossRef] [PubMed]
  47. Peltz, C.D.; Haladik, J.A.; Divine, G.; Siegal, D.; Van Holsbeeck, M.; Bey, M.J. ShearWave elastography: Repeatability for measurement of tendon stiffness. Skelet. Radiol. 2013, 42, 1151–1156. [Google Scholar] [CrossRef] [PubMed]
  48. Aubry, S.; Nueffer, J.-P.; Tanter, M.; Becce, F.; Vidal, C.; Michel, F. Viscoelasticity in Achilles Tendonopathy: Quantitative Assessment by Using Real-time Shear-Wave Elastography. Radiology 2015, 274, 821–829. [Google Scholar] [CrossRef] [PubMed]
  49. Domenichini, R.; Pialat, J.-B.; Podda, A.; Aubry, S. Ultrasound elastography in tendon pathology: State of the art. Skelet. Radiol. 2017, 46, 1643–1655. [Google Scholar] [CrossRef] [PubMed]
Figure 1. Representative patellar tendon images of one player displaying both the dominant and non-dominant side.
Applsci 08 00660 g001
Figure 2. Representative patellar tendon images showing the non-dominant side of two players, one with a normal tendon structure (right panels), and one player with an abnormal tendon structure (left panels). An abnormal tendon structure was taken as one that fell into the category of subclinical tendinopathy as arbitrarily defined in the study by Giacchino et al. [23]. All scans reported in the figure were acquired with the knee at a 30° position. Long: longitudinal.
Applsci 08 00660 g002
Figure 3. Results obtained when comparing dominant and non-dominant side texture features considering all subjects (first row) and only subjects with normal tendon structure (second row). The black circles represent the dominant side textures features, while the gray circles represent the non-dominant side texture features. (a) Representation of all subjects in the plane of the first two canonical variables obtained by a MANOVA analysis. The vertical gray dotted line represents the optimal threshold used (maximum Youden index) to obtain the sensitivity (86.9%), specificity (79.8%), and accuracy (83.3%) results; (b) ROC analysis results demonstrating the classification quality of the first MANOVA canonical variable, with an AUC equal to 0.906; (c) Representation of the healthy subjects in the plane of the first two canonical variables obtained by a MANOVA analysis. The vertical gray dotted line represents the optimal threshold used (maximum Youden index) to obtain the sensitivity (96.3%), specificity (96.3%), and accuracy (96.3%) results; (d) ROC analysis results demonstrating the classification quality of the first MANOVA canonical variable, with an AUC equal to 0.989.
Applsci 08 00660 g003
Figure 4. Results obtained when comparing subjects with (n = 5) and without subclinical tendinopathy (n = 9). (a) Representation of the subjects in the plane of the first two canonical variables obtained by a MANOVA analysis. The black circles represent the texture features of subjects with subclinical tendinopathy, while the gray circles represent the texture features of subjects without subclinical tendinopathy. The vertical gray dotted line represents the optimal threshold (maximum Youden index) used to obtain the sensitivity (93.3%), specificity (90.7%), and accuracy (91.7%) results; (b) ROC analysis results demonstrating the classification quality of the first MANOVA canonical variable, with an AUC equal to 0.967.
Applsci 08 00660 g004
Table 1. Tendon B-mode image acquisition protocol for dominant and non-dominant side.
PlaneProbe PositionKnee Angle
TransversalProximal
LongitudinalProximal
TransversalProximal30°
LongitudinalProximal30°
TransversalCentral30°
LongitudinalCentral30°
Table 2. Mathematical description of first-order statistical features.
Feature NameMathematical Description
Mean (m) m = x = 1 M y = 1 N I ( x , y ) M × N
Standard deviation ( σ ) σ = x = 1 M y = 1 N { I ( x , y ) m } 2 M × N
Variance ( σ 2 ) σ 2 = x = 1 M y = 1 N { I ( x , y ) m } 2 M × N
Skewness (Sk) S k = 1 M × N x = 1 M y = 1 N { I ( x , y ) m } 3 σ 3
Kurtosis (Kt) K t = 1 M × N x = 1 M y = 1 N { I ( x , y ) m } 4 σ 4
Energy1 (E1) E 1 = x = 1 M y = 1 N I ( x , y ) 2
I(x,y) denotes the input muscle ROI.
Table 3. Mathematical description of Haralick features.
Feature NameMathematical Description
Symmetry (Isym) I s y m = 1 i = 0 N 1 j = 0 N 1 | i j | P ( i , j )
Contrast (Icon) I c o n = n = 0 N 1 n 2 { i = 0 N j = 0 N 1 P ( i , j ) }
Homogeneity (Ihmg) I h m g = i = 0 N 1 j = 0 N 1 1 1 + ( i j ) 2 P ( i , j )
Entropy (IEntr) I E n t r = i = 0 N 1 j = 0 N 1 P ( i , j ) log P ( i , j )
Energy (IEnrg) I E n r g = i = 0 N 1 j = 0 N 1 P ( i , j ) 2
Correlation (Icor) I c o r = i = 0 N 1 j = 0 N 1 ( i , j ) P ( i , j ) μ x μ y σ x σ y
σ x , σ y , μ y , μ y are the standard deviations and means of P x , P y , which are the partial probability density functions. p x ( i ) = i th entry in the marginal-probability matrix obtained by summing the rows of P ( i , j ) .
Table 4. Image features that were the most discriminant between dominant and non-dominant side (all subjects and only healthy subjects) and to determine subclinical tendinopathy.
Most Discriminant Features for Side Determination (Weight)Most Discriminant Features for Side Determination (Only Healthy Subjects) (Weight)Most Discriminant Features for Subclinical Tendinopathy Determination (Weight)
Kurtosis(−65.0)H. Homogeneity (45°)(172.0)H. Symmetry (0°)(−24.5)
H. Correlation (0°)(58.9)H. Contrast (45°)(−155.8)H. Contrast (45°)(−14.3)
H. Contrast (0°)(12.9)H. Symmetry (45°)(−48.7)H. Entropy (0°)(14.2)
Skewness(−12.3)H. Symmetry (0°)(−29.7)H. Correlation (45°)(13.4)
H. Entropy (0°)(9.6)H. Energy (0°)(27.2)H. Homogeneity (0°)(5.5)
H. Correlation (45°)(7.0)H. Correlation (0°)(27.1)Mean Intensity(4.8)
H. Energy (45°)(−6.3)H. Correlation (135°)(6.1)First−order Entropy(4.3)
H. Homogeneity (0°)(3.5)H. Energy (45°)(−5.3)Kurtosis(−4.2)
H. Entropy (45°)(2.3)Mean Intensity(5.1)Variance(3.0)
H. Symmetry (45°)(−2.2)H. Entropy (45°)(4.8)H. Correlation (0°)(2.9)

