Trouton’s Rule for Vapor Sorption in Solids

1
TNO, Leeghwaterstraat 46, 2628 CA Delft, The Netherlands
2
TNO, High Tech Campus 5, 5656 AE Eindhoven, The Netherlands
*
Author to whom correspondence should be addressed.
Appl. Sci. 2018, 8(4), 638; https://doi.org/10.3390/app8040638
Submission received: 21 December 2017
/
Revised: 13 April 2018
/
Accepted: 13 April 2018
/
Published: 20 April 2018
(This article belongs to the Special Issue Materials for Thermal Energy Storage)
Abstract
:Featured Application
A tool for the selection of the most suited material systems for (reversible) thermal heat storage with respect to the envisaged use cases. Temperatures of dehydration and rehydration are needed, as well as the heat storage density for the realization of heat batteries.
Abstract
Hygroscopic salts exhibiting fast and reversible hydration are promising systems for seasonal heat storage, providing the possibility of storing excess solar energy from the warm season for later use during the cold season. For heat storage, the salt is dehydrated with the available heat, and for heat recovery, the salt is rehydrated. There are many salt hydration transitions and for selecting the most suited ones with respect to the envisaged use cases, temperatures of dehydration and rehydration are needed, as well as the heat storage density. Estimation of these properties requires entropy and enthalpy changes of the transitions. Collections of hydration entropies and enthalpies have been published, but not all data seems reliable for various reasons, and it is often hard to access original sources and experimental conditions. For the necessary data validation, we propose the use of Trouton’s rule, known to hold for the evaporation of classes of fluids. Besides data validation, Trouton’s rule is useful for predicting heat storage densities and vapor pressures when only the transition enthalpy is known. We discuss the validity of Trouton’s rule for salt hydration and ammoniation transitions by theoretical and experimental evidence on the available extensive data collections.

1. Introduction
Here, we would like to share some results of our investigations on selecting salt hydrates for application in heat storage systems. Selection criteria are, for instance, a high heat storage density at favorable operating temperatures, sufficient output power, cycling stability, and low costs and low toxicity [1,2,3,4,5,6,7,8,9]. Examples of salt hydrates that could be used for heat storage are Na2S·5H2O (cf. [1,2,3,4]) and K2CO3·1½H2O [5], but there are many other candidate reactions [6,7,8,9]. Selecting a suited salt hydrate depends on a number of its properties, which are obtained from experimental data. Validation of such data is our main objective here, and we will discuss the application of Trouton’s rule for that purpose. In order to properly introduce our research questions and their relevance, we start with a brief discussion on heat storage by salt hydrates.
Salt hydrates can be used for heat storage by removing the contained crystal water molecules with the available heat, e.g., by the following transition:
K2CO3·1½H2O + Heat ↔ K2CO3 + 1½H2O.
This is an example of a reversible thermochemical reaction, and K2CO3·1½H2O is therefore a thermochemical material (TCM). The reaction products K2CO3 and H2O can be stored separately and the input heat can be recovered by rehydrating K2CO3 with water vapor. This way of heat storage is virtually loss-free and therefore particularly suited for long-term storage. Figure 1 is a sketch of a system for thermochemical heat storage (THS), designed for seasonal storage of excess solar heat in summer for later use in winter [4]. For heat storage, heat from solar collectors of, e.g., 80–90 °C, is transferred to a hot water storage tank. When sufficient heat is collected, hot water is transferred by a heat exchanger (HX) to a reactor containing modules with TCM, e.g., a hydrated salt. With the available heat, the salt is dried while the desorbed water is captured by a pool condenser. Condensation heat is transferred to a reservoir, which may be a borehole energy storage (BES). During heat storage, the salt is kept dry by closing a valve to the condenser. For heat recovery, the valve is opened. Then, the pool acts as an evaporator providing water vapor for rehydration. The hydration heat is transferred to hot water storage for further application. Meanwhile, the BES provides 10–15 °C heat to the evaporator to prevent it from cooling down during evaporation.
For this THS system, we need a salt hydrate dehydrating at 80–90 °C while the process water from the salt is condensed in the pool at, for example, 20 °C during summer. From the vapor-pressure lines (pT-lines) of water and a candidate salt hydration transition, one can determine whether the candidate transition is suited and indeed takes place at the given temperatures. As an example, Figure 2 shows the pT-lines of water (blue) and of the transition K2CO3·(1½–0)H2O (green). The horizonal red line shows the vapor pressure of about 23 hPa in the condenser at 20 °C. According to the intersection with the pT-line of K2CO3·(1½–0)H2O, the K2CO3·1½H2O needs to be heated to at least 68 °C to dehydrate. Thus, the transition can very well take place using the available 80–90 °C from the collector with the pool condenser at 20 °C. For heat regeneration during winter, the pool will be somewhat colder, say 10 °C, giving a pressure of about 12 hPa for evaporation, according to the horizontal blue line in Figure 2. From the intersection with the pT-line of K2CO3·(1½–0)H2O, it follows that the maximum achievable hydration temperature is then about 60 °C. Thus, apart from some sensible heat to preheat the salt for hydration or dehydration, all heat is recovered, although at a somewhat lower temperature due to the difference in condenser and evaporator temperatures during summer and winter.
We see that in order to estimate dehydration and hydration temperatures at given operation conditions, it is sufficient to have the pT-line of a candidate transition. In literature, [10], pT-lines of salt hydrate transitions are often represented by the entropy and enthalpy differences Δs0 and Δh0 of the transition at reference pressure p0 = 1 atm. The pT-line is then obtained by the relation [10,11]
Here, R = 8.314 J/mol⋅K is the gas constant. In the following section, we discuss the assumptions on which the derivation of this formula is based. Besides dehydration temperature at operating pressure, heat storage density Q/V (J/m3) is an important parameter, determining the system volume for a given amount of stored heat. The heat storage density follows by
This is the amount of heat per volume of hydrate, where Δh is the transition enthalpy, n the amount of water molecules involved in the transition, and ρ (kg/m3) and M (kg/mol) are the density and molar mass of the hydrate. For instance, for the transition K2CO3⋅(1½–0)H2O with Δh = Δh0 = 63.6 kJ/mol, n = 1½, ρ = 2181 kg/m3, and M = 0.1652 kg/mol, we obtain Q/V = 1.26 GJ/m3 = 350 kWh/m3.
Fortunately, tables of Δs0 and Δh0 have been published for many salt hydration transitions [5,10,12], as well as for salt ammoniate transitions [11]. However, hydration states as well as Δs0 and Δh0 values of different references are sometimes contradictory, and hydration states are not always confirmed by X-ray diffraction data from, e.g., the online database of the ICDD (International Centre for Diffraction Data) [13]. Besides, behind every pT-line is an article describing the measurements and the analysis of the obtained data to arrive at the fitted Δs0 and Δh0. Collecting and verifying all this information is not easy. Often sources are difficult to find and the reports sometimes lack sufficient completeness.
Therefore, a rule obeyed by Δs0 and Δh0 data of certain classes of transitions would be valuable. For that purpose, we consider Trouton’s rule [14] that asserts the proportionality of transition enthalpy Δh0 with transition temperature T0 at given reference pressure p0 for a certain class of transitions. Possible applications of Trouton’s rule include:
- Validation of experimentally obtained pT-lines;
- Estimation of pT-lines when only Δh0 is known;
- Predicting limits for the heat storage density of a given desorption temperature.
Trouton’s rule is usually considered for phase transition between liquid and vapor, but has, for instance, also been suggested and verified for adsorption reactions of, for example, activated carbon, silica gel and zeolite, and for evaporation of salt solutions [15,16]. Whether Trouton’s rule also applies to transitions of salt hydrates and ammoniates is verified in the following sections based on the theoretical and experimental evidence.
2. Thermodynamic Evidence for Trouton’s Rule
2.1. Modeling pT-Lines
We start by a discussion on the validity of Equation (1) for modeling pT-lines of vapor-liquid and vapor-sorbed equilibria. For such equilibria in contact with a reservoir at given p and T, the Gibbs free energy per mole, or chemical potential g (J/mol), of the molecules is equal for both phases [17]; that is, gv = gl for vapor-liquid and gv = gs for vapor-sorbed equilibria. With expressions for g(p,T) of the relevant phases, one can thus arrive at formulas for pT-lines. When the phases are ideal gases or diluted solutions, or when g of one of the phases can be considered constant, one thus obtains the Van’t Hoff equation [17]. In our case, however, simple analytic expressions for g(p,T) are not available for the liquid and sorbed states, not even for van der Waals fluids [18]. Instead, one may start with the differential relations dgv = dgl for vapor-liquid and dgv = dgs for vapor-sorbed equilibria. Then, using the thermodynamic identity dg = −sdT + vdp for e.g., both vapor and liquid, one obtains:
This is the Clausius-Clapeyron equation [17]. From here, the common way forward is to assume that far below the critical point T << Tc, the evaporation heat Δh is independent of T, that the vapor is an ideal gas, and that the molar volume of the liquid can be ignored. Then, Δv ≅ vv = p/RT and Equation (3) can be integrated, giving:
Here, p0, T0, Δh0, and Δs0 are values at any reference point on the pT-line. As p0 and T0 are related by the pT-line, and because Δs0 = Δh0/T0, the pT-line has only two free parameters. We thus obtain Equation (1). We note that for salt hydrate equilibria in the range T = 20–90 °C, vapor pressures are usually in the order of p0 = 10 mbar, so that Δh0 and Δs0 will actually be fitted around 10 mbar rather than at 1 atm. Using Equation (1) with, e.g., p0′ = 1 atm instead of p0 = 10 mbar, is then a matter of adding a constant offset; that is, with Δs(p0′) ≡ Δs(p0) + Rln(p0/p0′) and Δh(p0′) ≅ Δh(p0) by assumption, we arrive at Equation (4) with p0′.
How good, though, is the assumption that Δh is independent of T? This assumption seems suspicious because Δh vanishes towards the critical point Tc. For vapor-liquid transitions, the van der Waals equation provides evidence that Δh is indeed independent of T. The van der Waals equation of state reads [19]
Here the critical pressure, molar volume and temperature pc, vc, and Tc are related by pcvc = 3RTc/8, so that Equation (5) has only two independent parameters. For the van der Waals equation, the latent heat Δh at T << Tc approaches Δh = 9pcvc = 27RTc/8 [20,21] and deviates by only about 5% from this value for T/Tc < 0.5. This is illustrated by Figure 3, showing the latent heat Δh/RTc (orange) as well as the slope of the pT-line (1/Tc)d(lnp)/d(−1/T) (blue). These quantities are approximately equal if Δh/R ≅ d(lnp)/d(−1/T), according to Equation (4). We note that Figure 3 as well as the following Figure 4 and Figure 5 were made using published tables [21].
Moreover, according to the van der Waals equation, the slope of the pT-line increases from 27/8 = 3.375 to 4 towards Tc, as illustrated by the blue line in Figure 3. Hence, for van der Waals fluids, pT-lines of vapor-liquid equilibria are nearly straight up to the critical point Tc, as illustrated by Figure 4. This may be surprising regarding dp/dT according to Equation (3) and the fact that Δh vanishes towards Tc. However, the slope of the pT-line can remain finite towards Tc because Δs and Δv vanish simultaneously with Δh.
For vapor-sorbed equilibria, a pT-line model is provided by Polanyi and Wigner, modeling sorbed molecules as harmonic oscillators of angular frequency ω [22,23]. The resulting vapor pressure for thermal energies well above hω/2π reads:
Here, m is the molecular mass of the sorbent, k = 1.38 × 10⁻²³ J/K is Boltzmann’s constant, and ε is the latent heat per mole at T = 0. With Equation (3) applied to Equation (6) we find the following for the latent heat:
Here, the ideal gas law was used for the vapor phase. Equation (7) implies that for a temperature range of for instance ΔT = 100 K, the latent heat Δh varies by 415 J/mol, only about 1% of a typical value of 50–60 kJ/mol for water vapor sorption. It follows that for vapor-sorbed equilibria as well, the latent heat may be considered constant, confirming Equation (1) for vapor-sorbed equilibria as well.
2.2. Trouton’s Rule for Vapor-Liquid and Vapor-Sorber Equilibria
In his original paper, Trouton observed that for a collection of vapor-liquid equilibria for different fluids, the latent heat Δh is proportional to the normal boiling temperature T0 at p0 = 1 atm [14]. In fact, from g = h − Ts for both vapor and liquid in equilibrium at T = T0, we obtain:
This would imply the proportionality of Δh and T0 if Δs would be the same for different fluids j at the boiling temperature T0j at reference pressure p0. Trouton’s rule may thus be formulated as:
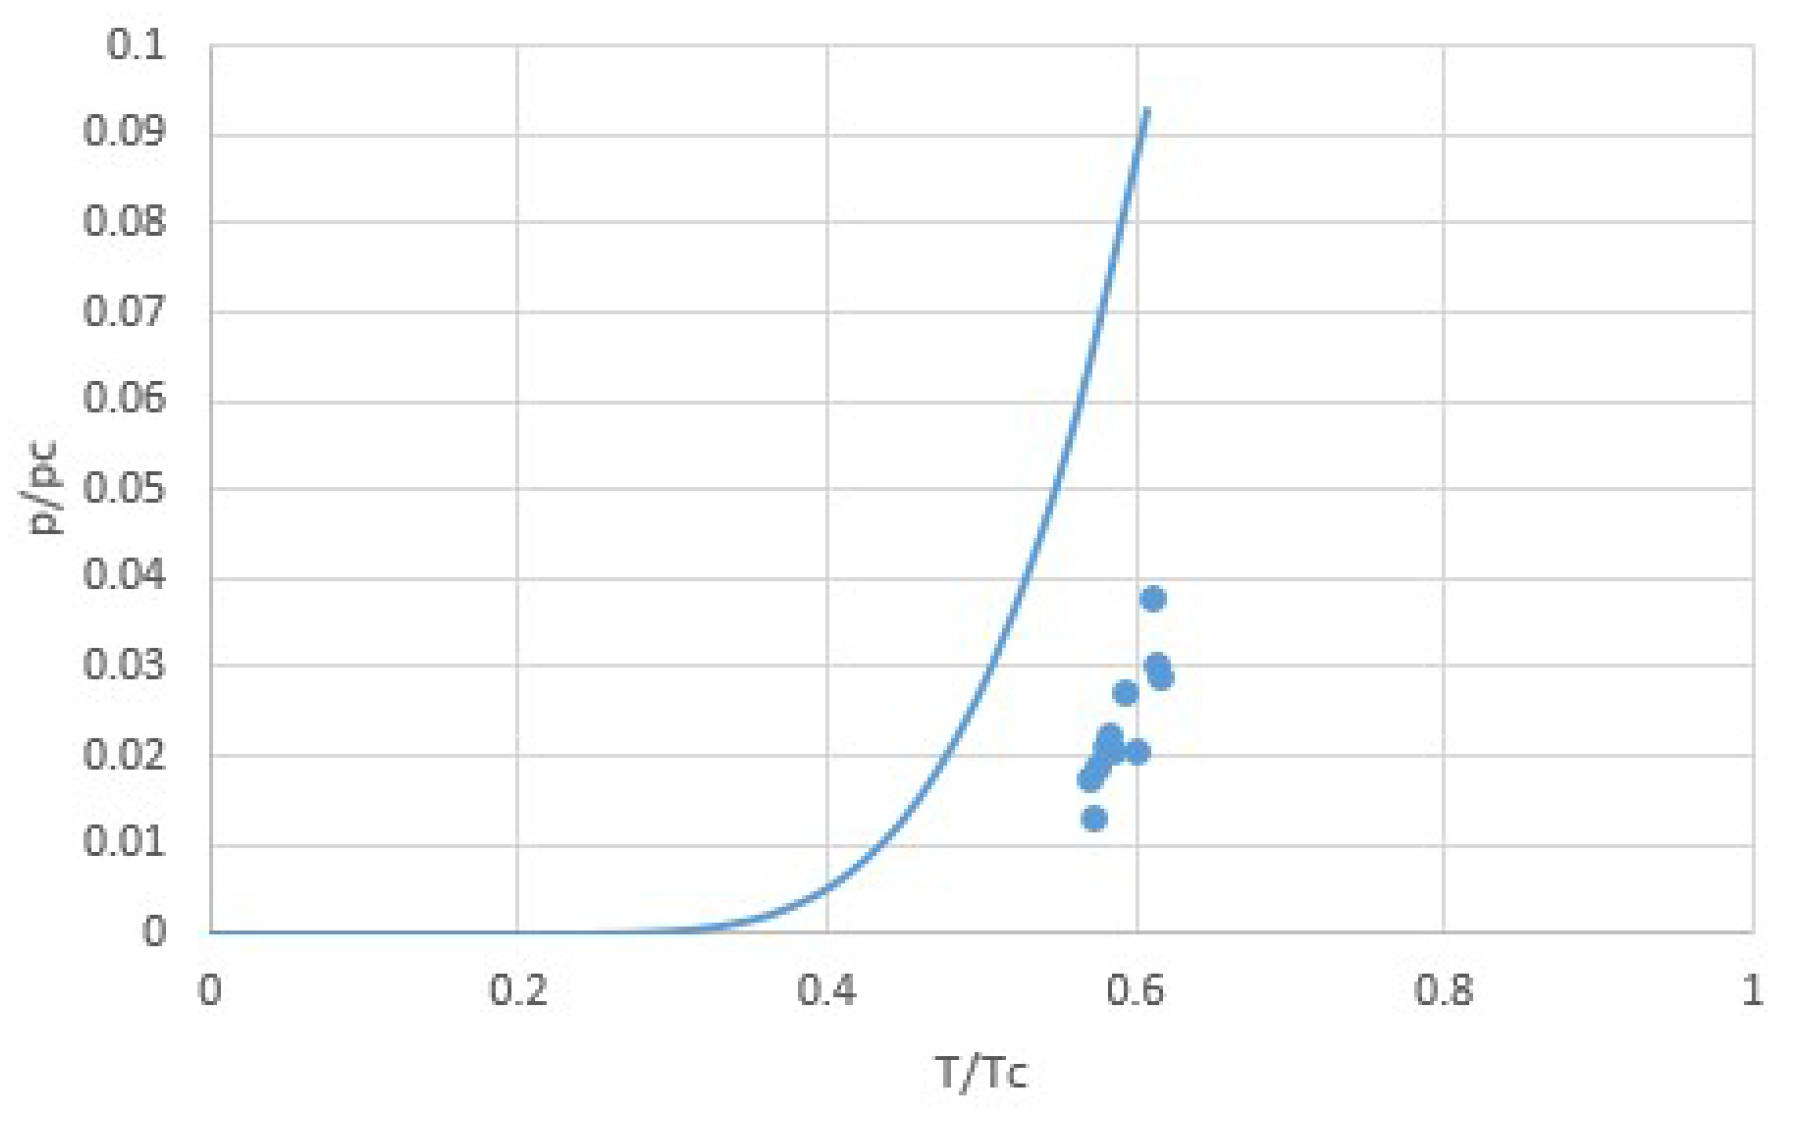
It has been argued from the principle of corresponding states that Trouton’s rule in the form of Equation (9) should not be valid, but that instead Δh should be proportional to the critical temperature Tc [17,24]. According to the principle of corresponding states, different media obey the same equation of states when expressed in terms of reduced pressure, temperature and volume p/pc, T/Tc, and v/vc, such as for van der Waals fluids. Indeed, we already noted that for van der Waals fluids, Δh ≅ 27RTc/8 for T < 0.5Tc. From this, Trouton’s rule (9) would additionally follow if the boiling temperature T0 at reference pressure p0 would be proportional to the critical temperature Tc, which is not obvious. However, for experimental boiling temperatures T0 at p0 = 1 atm for common gases, it indeed roughly holds that T0 ≅ 0.6Tc [17]. This is illustrated by Figure 5, showing p0/pc as a function of T0/Tc for both van der Waals fluids and for experimental values for common gases [17]. The experimental values are off the pT-line of the van der Waals equation, but the rapid increase of p0/pc with T0/Tc is similar, and we see that for the experimental values of p0/pc, the reduced boiling temperatures T0/Tc would vary with less than 10% around 0.5 for van der Waals fluids, somewhat below the experimental average of 0.6. Taking T0 ≅ 0.5Tc for van der Waals fluids with Δh = 27RTc/8 we arrive at the following prediction:
This can be regarded as Trouton’s rule for van der Waals fluids, with Δs ≅ 27R/4 = 6.75R. Although this is considerably off the experimental value of Δs ≅ 9.0R [17], the van der Waals equation and the above argument do support the idea that Δs should be roughly the same for common fluids. To this, we may add that the numerical accuracy of the van de Waals equation is limited anyway, as, for instance, the van der Waals equation predicts RTc/pcvc = 8/3 ≅ 2.7, while the experimental value for common gases is rather between 3.0 and 3.5 [19].
For vapor-sorbed equilibria, we cannot use the van der Waals equation, but we may adopt the idea that the entropy is a function of the free volume v − b, where b represents the volume occupied by the molecules [21]. Thus, at given pressure p0 we arrive at the following for the transition entropy of vapor-sorbed equilibria:
Here, we assumed vv >> b regarding the vapor as ideal gas. For liquids, v − b is hard to estimate, as the free volume is determined by the liquid itself. For sorbent molecules bound in solids, the free volume will be determined by the remaining vibration space in the bound position. If the type of binding is roughly the same for a collection of transitions j, then the free volume vsj − bj at fixed p0 will be roughly the same. Possible variations of Δs then mostly depend on the vapor entropy sv, which is determined by the type of sorbent. With the ideal gas law vv = RT0j/p0, we then obtain:
Here, C is independent of species j and temperature. As Rln(T0j) varies only mildly with T0j between 20–90 °C with respect to the vapor entropy, it then follows that Δs will not vary much for different sorbers j. We may note that heuristic modifications of Trouton’s rule [25,26] also include an additional Rln(Tj0) term, although this result was obtained from collections of experimental boiling temperatures of liquids instead of vapor-sorbed equilibria.
Alternatively, we may obtain an expression for Δs for vapor-sorbed equilibria from Equation (7) by comparison with Equation (4):
The mass per sorbed molecule m and the reference pressure p0 are the same a priori. Again, we obtain a mild ln(T0j) dependence on temperature. The only quantity that might differ for different sorbers j is the vibration frequency ω. For a harmonic oscillator, ω2 = c/m, where c (N/m) is the constant of the restoring force cx, where x is the sorbed molecule position relative to its equilibrium position. Assuming that the type of binding is roughly the same, at least for a certain class of sorbers, then ω will be the same and Trouton’s rule will hold for that class of sorbers.
Some support for Trouton’s rule also follows from Nerst’s argument that at T = 0, s = 0 [17]. This limits possible variations of the entropy in the bound state. For instance, for water, typical entropy values at atmospheric conditions for the vapor, liquid, and solid phases are sv = 190 J/molK, sl = 70 J/molK, and ss = 40 J/molK. Since ss << sv, the contribution of ss to Δs will be relatively small, limiting possible variations of Δs between transitions in different sorbers.
3. Experimental Evidence for Trouton’s Rule
3.1. Common Fluids
Figure 6 illustrates Trouton’s rule for a collection of common fluids [17]. The figure shows the evaporation enthalpy Δh as a function of both the normal boiling temperature Tb at 1 atm and the critical temperature Tc. We recall that Trouton’s rule predicts Δh ∝ Tb, while the principle of corresponding states instead predicts Δh ∝ Tc. The plots contain the fitted straight line as well as the regression coefficient r2, which for a relation between X and Y is determined by:
In other words, r is the covariance divided by the product of the standard deviations. In case of a linear relation, r = ± 1, giving the maximum r2 = 1. For the correlations Δh ∝ Tb and Δh ∝ Tc, we find r2 = 0.9861 and 0.9802, respectively, so from this data we cannot conclude that Δh ∝ Tc is a more suited correlation that Trouton’s rule Δh ∝ Tb.
According to this fit, we have Δh/Tb ≅ 78.9 J/molK = 9.5R and Δh/Tc ≅ 45.8 J/molK = 5.5R. It is interesting to compare this to the values for H2O and NH3, the sorbents considered in this paper. Table 1 shows Tb, Tc, and Δh, as well as the ratios Δh/RTc and Δh/RTb. We see that the latter quantities for H2O and NH3 are considerably higher than for common gases. This may be explained by the stronger mutual binding of the polar water and ammonia molecules, reducing the free volume and with that the entropy of the liquid state [25].
3.2. Salt Ammoniates
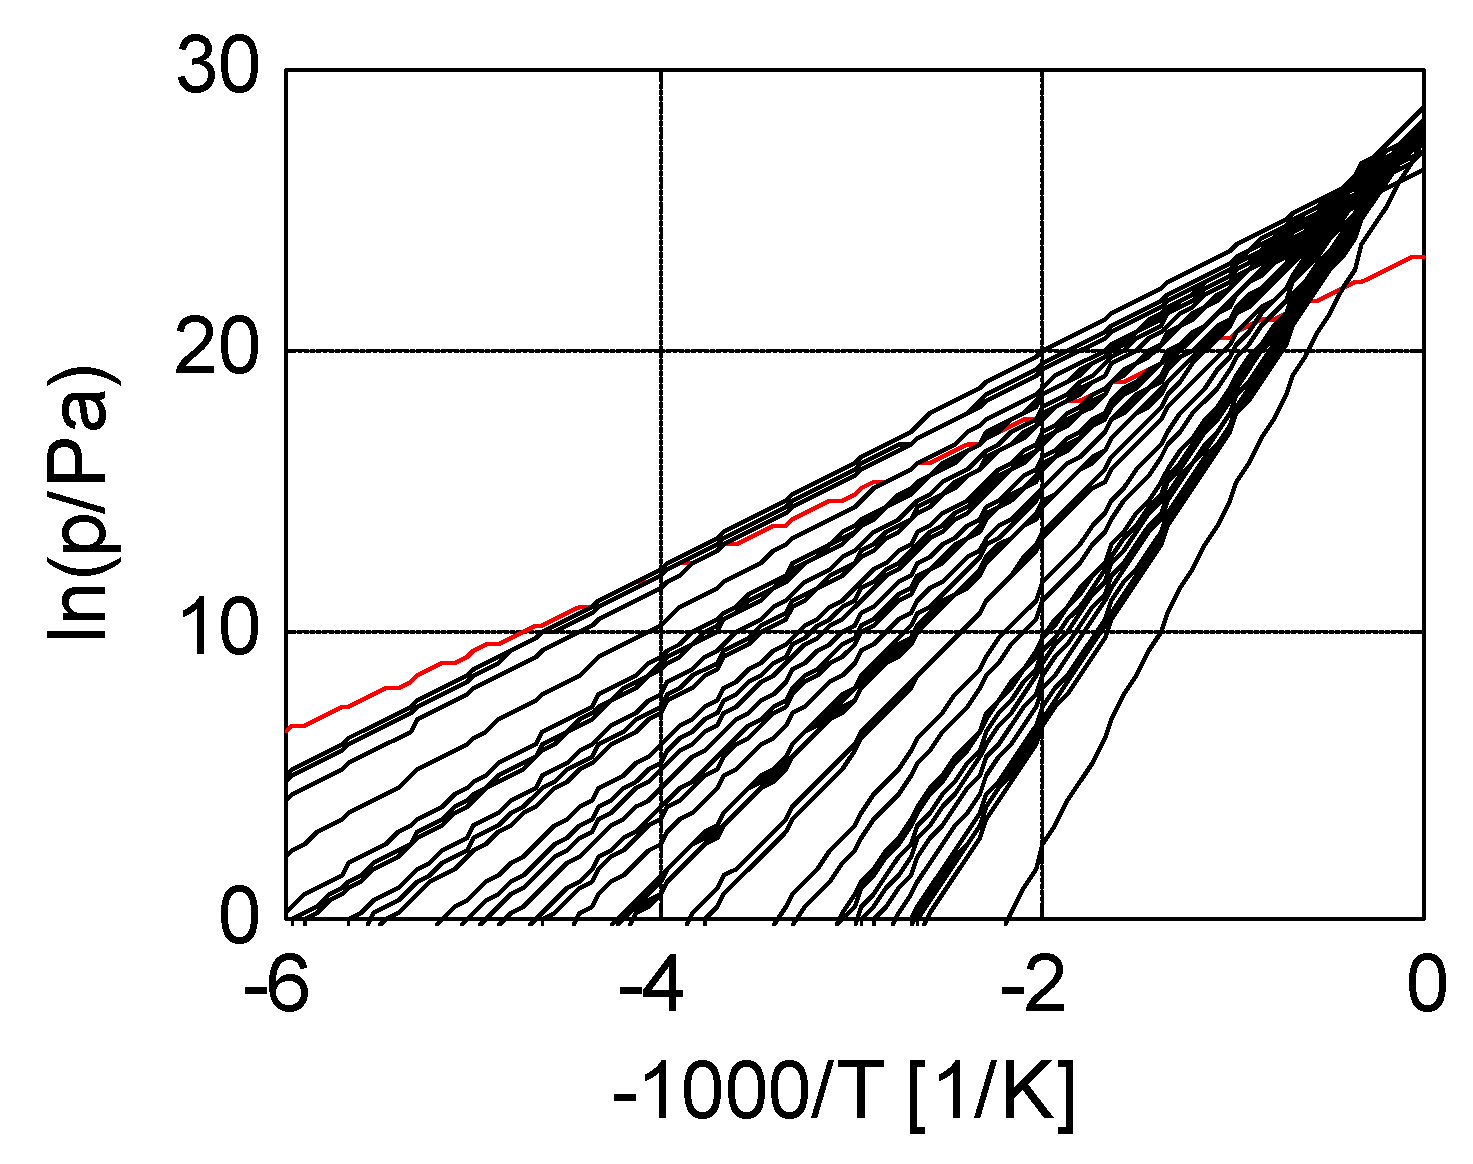
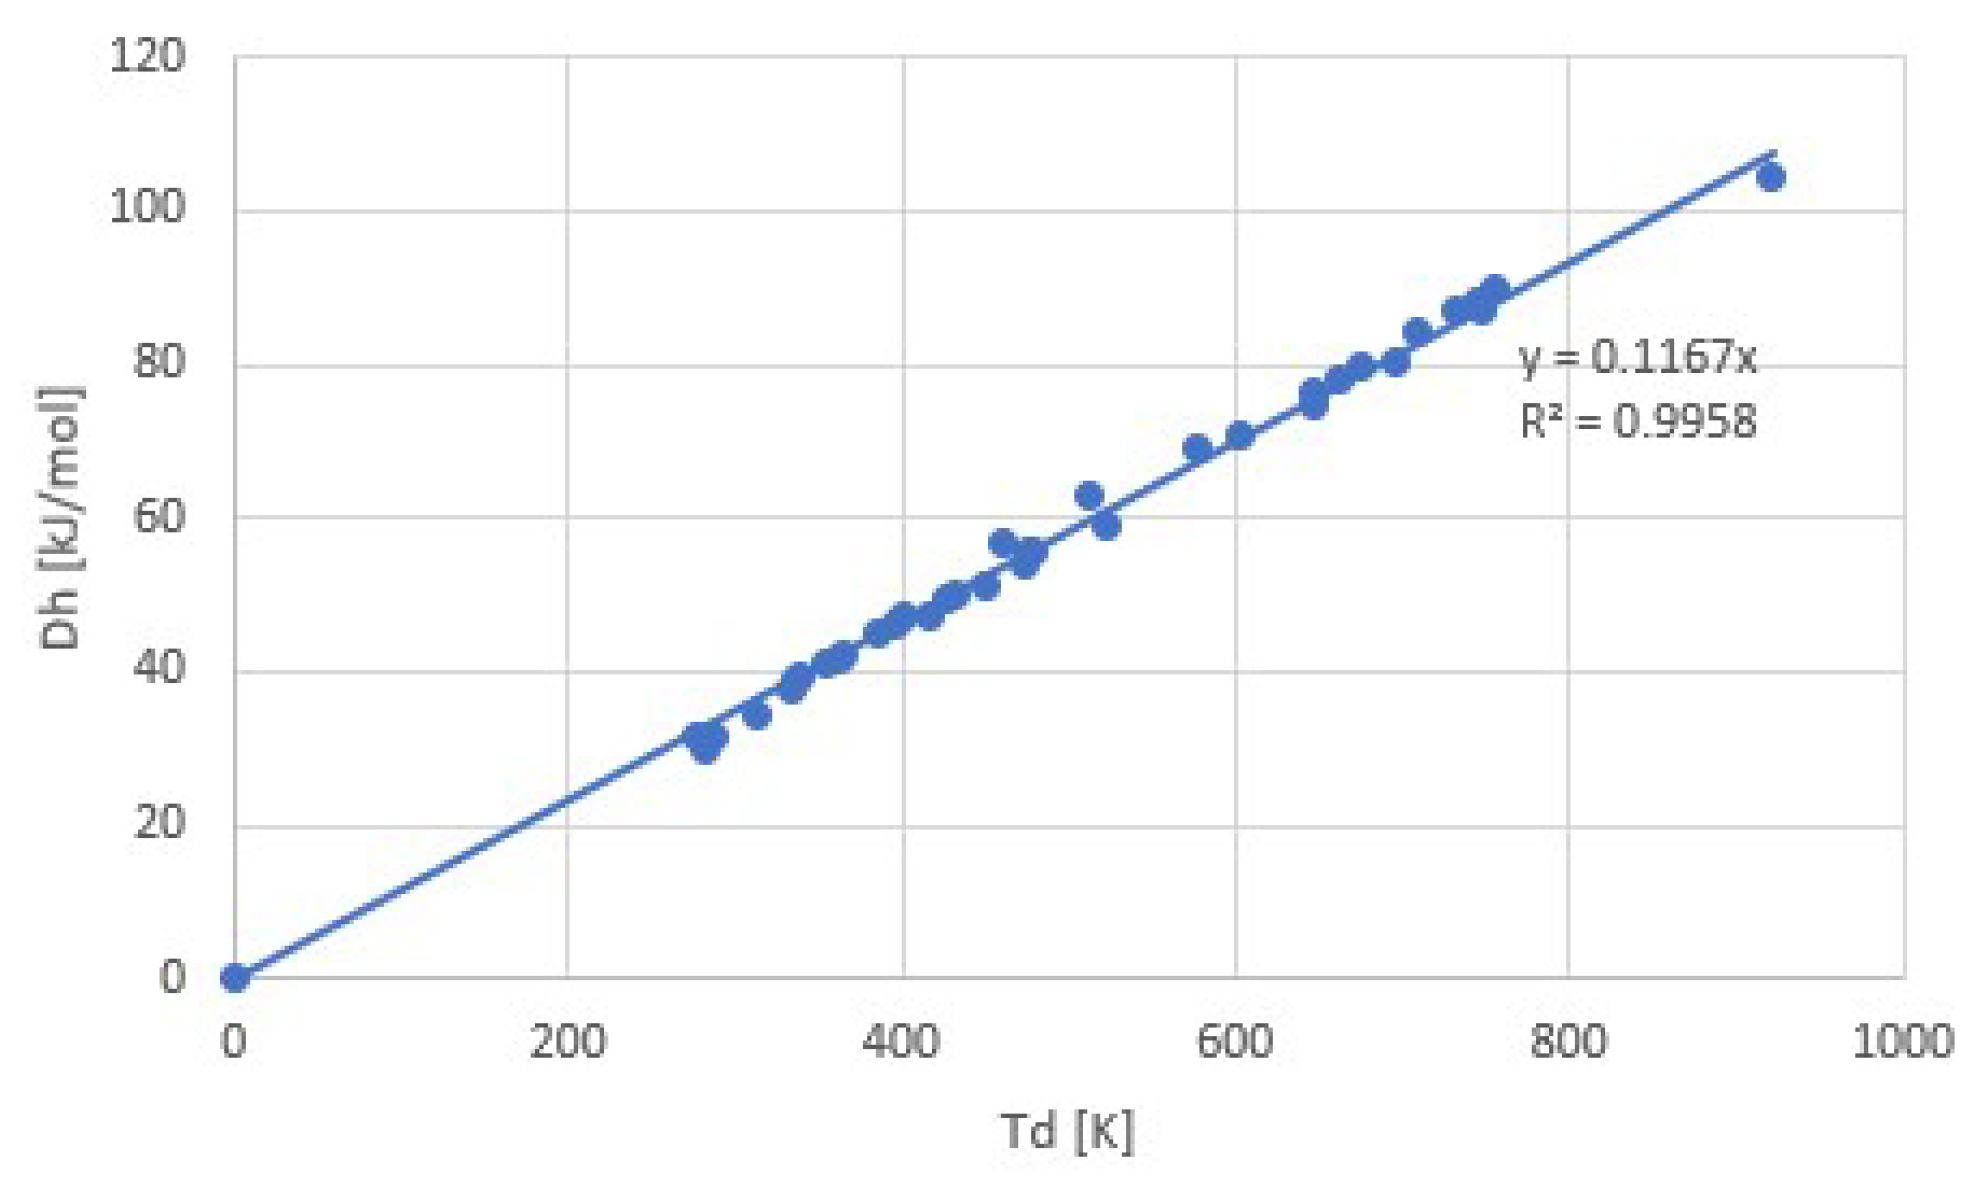
Figure 7 shows a collection of pT-lines of ammoniate transitions of chloride salts [11]. We extrapolated Neveu’s plot to 1/T = 0, so that an apparent intersection of pT-lines around 1/T = 0 emerges, which is predicted by Trouton’s rule (9) with Equation (4). Figure 7 also contains the pT-line of the ammonia vapor-liquid transition (red). This transition does not belong to the class of vapor-sorbed ammonia transitions, and indeed the pT-line does not intersect with the others around 1/T = 0. With the fitted transition entropies and enthalpies Δs and Δh, we constructed a plot of Trouton’s rule for chloride ammoniates, shown in Figure 8. We considered a pool evaporator-condenser at 20 °C, giving an NH3 vapor pressure of 8.6 bar. Hence, the temperature Td in Figure 8 is the deammoniation temperature at 8.6 bar.
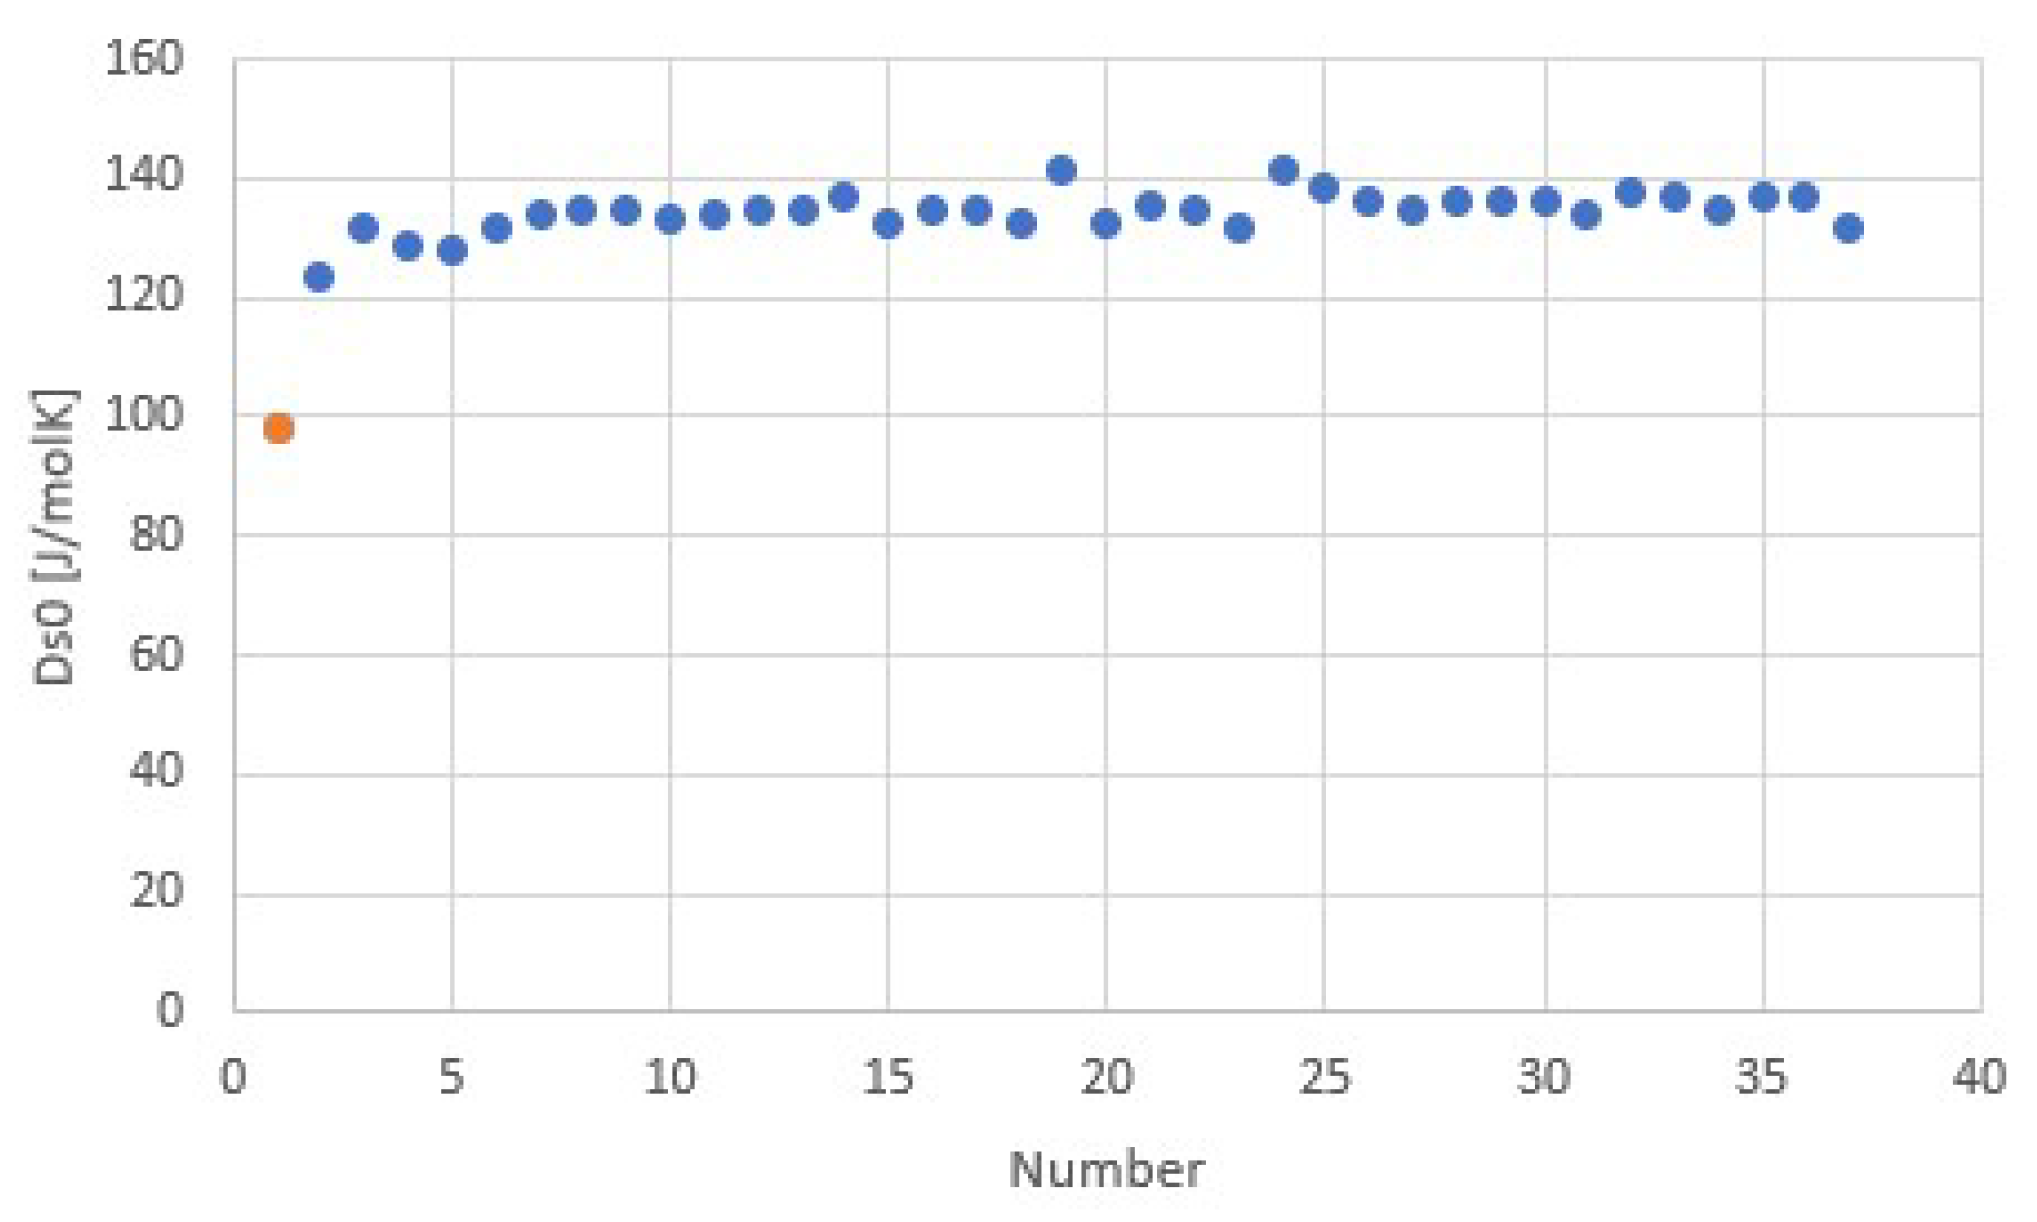
The fit provides Δh/Td = 116.7 J/molK = 14.0R = Δs at 8.6 bar. The regression coefficient is even higher than for the common gases shown earlier. This may be due to the fact that for all salts, the anion Cl− was the same, which might provide a well-defined binding environment for the NH3 molecules within the crystal lattices and coordination to the respective cations. Adding data for other ammoniate salts than chlorides [27] seems to result in a less accurate correlation. It would be interesting to further study the influence of anions and cations on the validity and accuracy of Trouton’s rule for salt ammoniates. Figure 9 shows Δsj for all chloride ammoniate transitions j, with an average of about 135 J/molK at p0 = 1 atm. In orange, we have added the transition entropy of 98.2 J/molK of ammonia vapor and liquid at 1 atm, which considerably differs from the average, in agreement with Figure 7.
3.3. Salt Hydrates
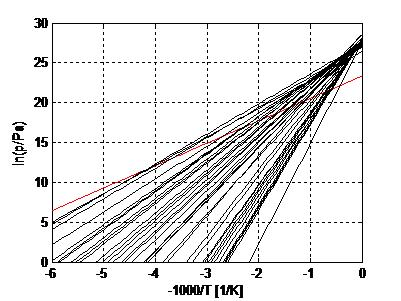
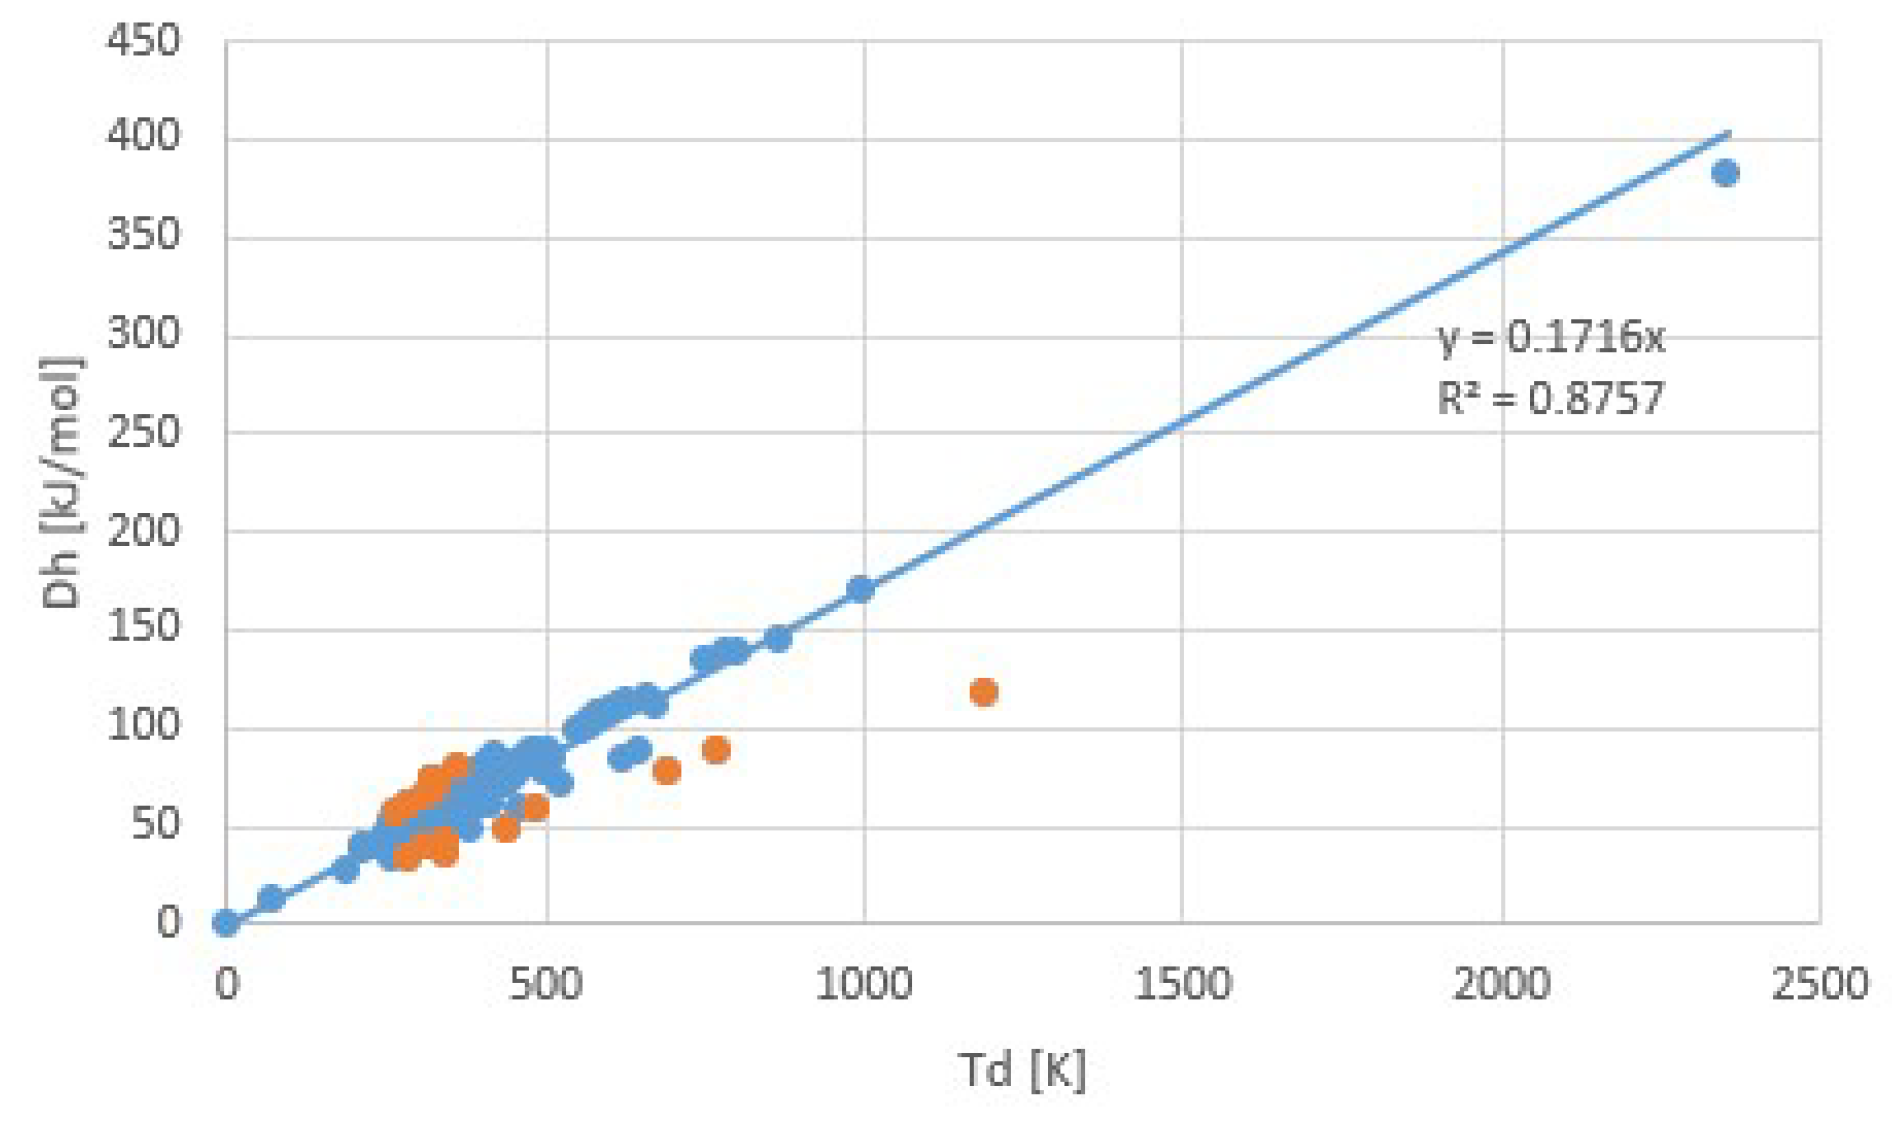
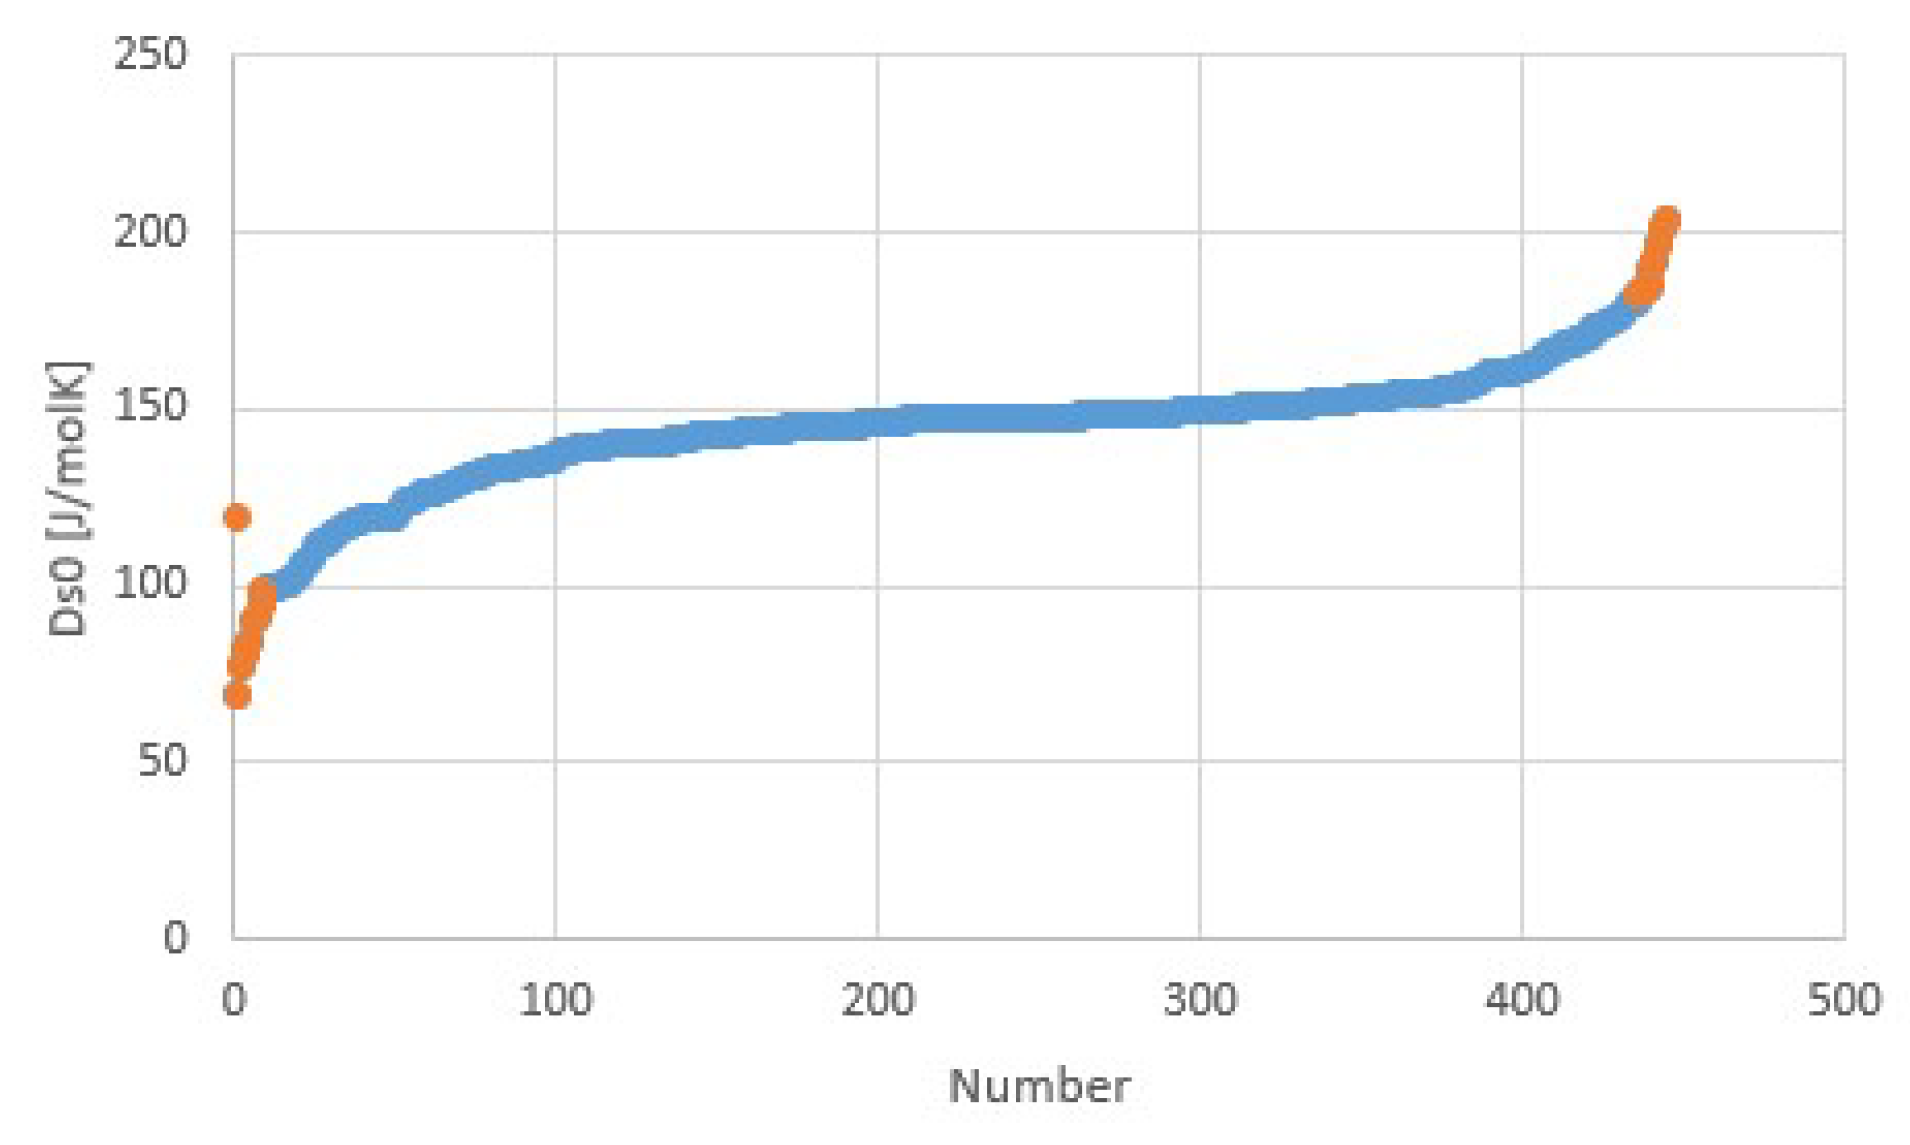
Figure 10 illustrates Trouton’s rule for a collection of salt hydrate transitions, calculated from collections of parametrized pT-lines [5,10]. Instead of the normal boiling point at 1 atm, we considered a pool evaporator-condenser at 20 °C, giving an H2O vapor pressure of 23.4 mbar. Thus, the temperature in Figure 10 is the dehydration temperature at 23.4 mbar. The fit provides Δh/Td = 171.6 J/molK = 20.6R = Δs at 23.4 mbar. Figure 11 shows Δsj for transitions j of the collection, with an average of about 145 J/molK at p0 = 1 atm. The first entry in orange is the transition entropy of 119 J/molK between water vapor and liquid at 1 atm, which differs considerably from the average value for hydration transitions, as expected.
Figure 10 was obtained after elimination of the most obvious outliers, e.g., with negative Δs, negative hydration states, etc. Remaining transitions with remarkably low and high Δs are plotted in orange in both Figure 10 and Figure 11. Table 2 shows Δs for these transitions. Sometimes different values of Δs are given [5]. For these cases, the last column gives the alternative Δs values. In some cases, the alternative value is close to the average 145 J/molK, making the outlier particularly suspicious. We do not see an obvious correlation with cation or anion type for the transitions with particularly low or high Δs. This may be due to the limited number of transitions in the table.
The corresponding regression coefficient r2 = 0.8757 of Trouton’s rule for salt hydrates is considerably worse than for chloride ammoniates. One possible explanation might be that this collection contains salts of many different anions and cations. We checked this by fitting Trouton’s rule separately for the largest sub-collections of chlorides and sulfates with 21 and 150 members, respectively. For chlorides we obtained Δh/Td = 21.4R with r2 = 0.8866 and for sulfates Δh/Td = 20.9R with r2 = 0.9717. For the rather large sulfate collection, the regression coefficients are considerably higher, but the fitted Δh/Td hardly differs from the value of 20.6R for the whole collection. Thus, this collection does not provide evidence that the type of anion makes much difference for obeying Trouton’s rule. We add that measurements of salt hydrates are calculated at typically lower pressure, around 10 mbar, than the typical value of around 1 bar for salt ammoniates. Experiments at low pressures may be more difficult as leakage may influence the measured pressure. In addition, driving forces for vapor transport may be lower at lower pressures, so that it may take considerably longer to measure equilibrium states.
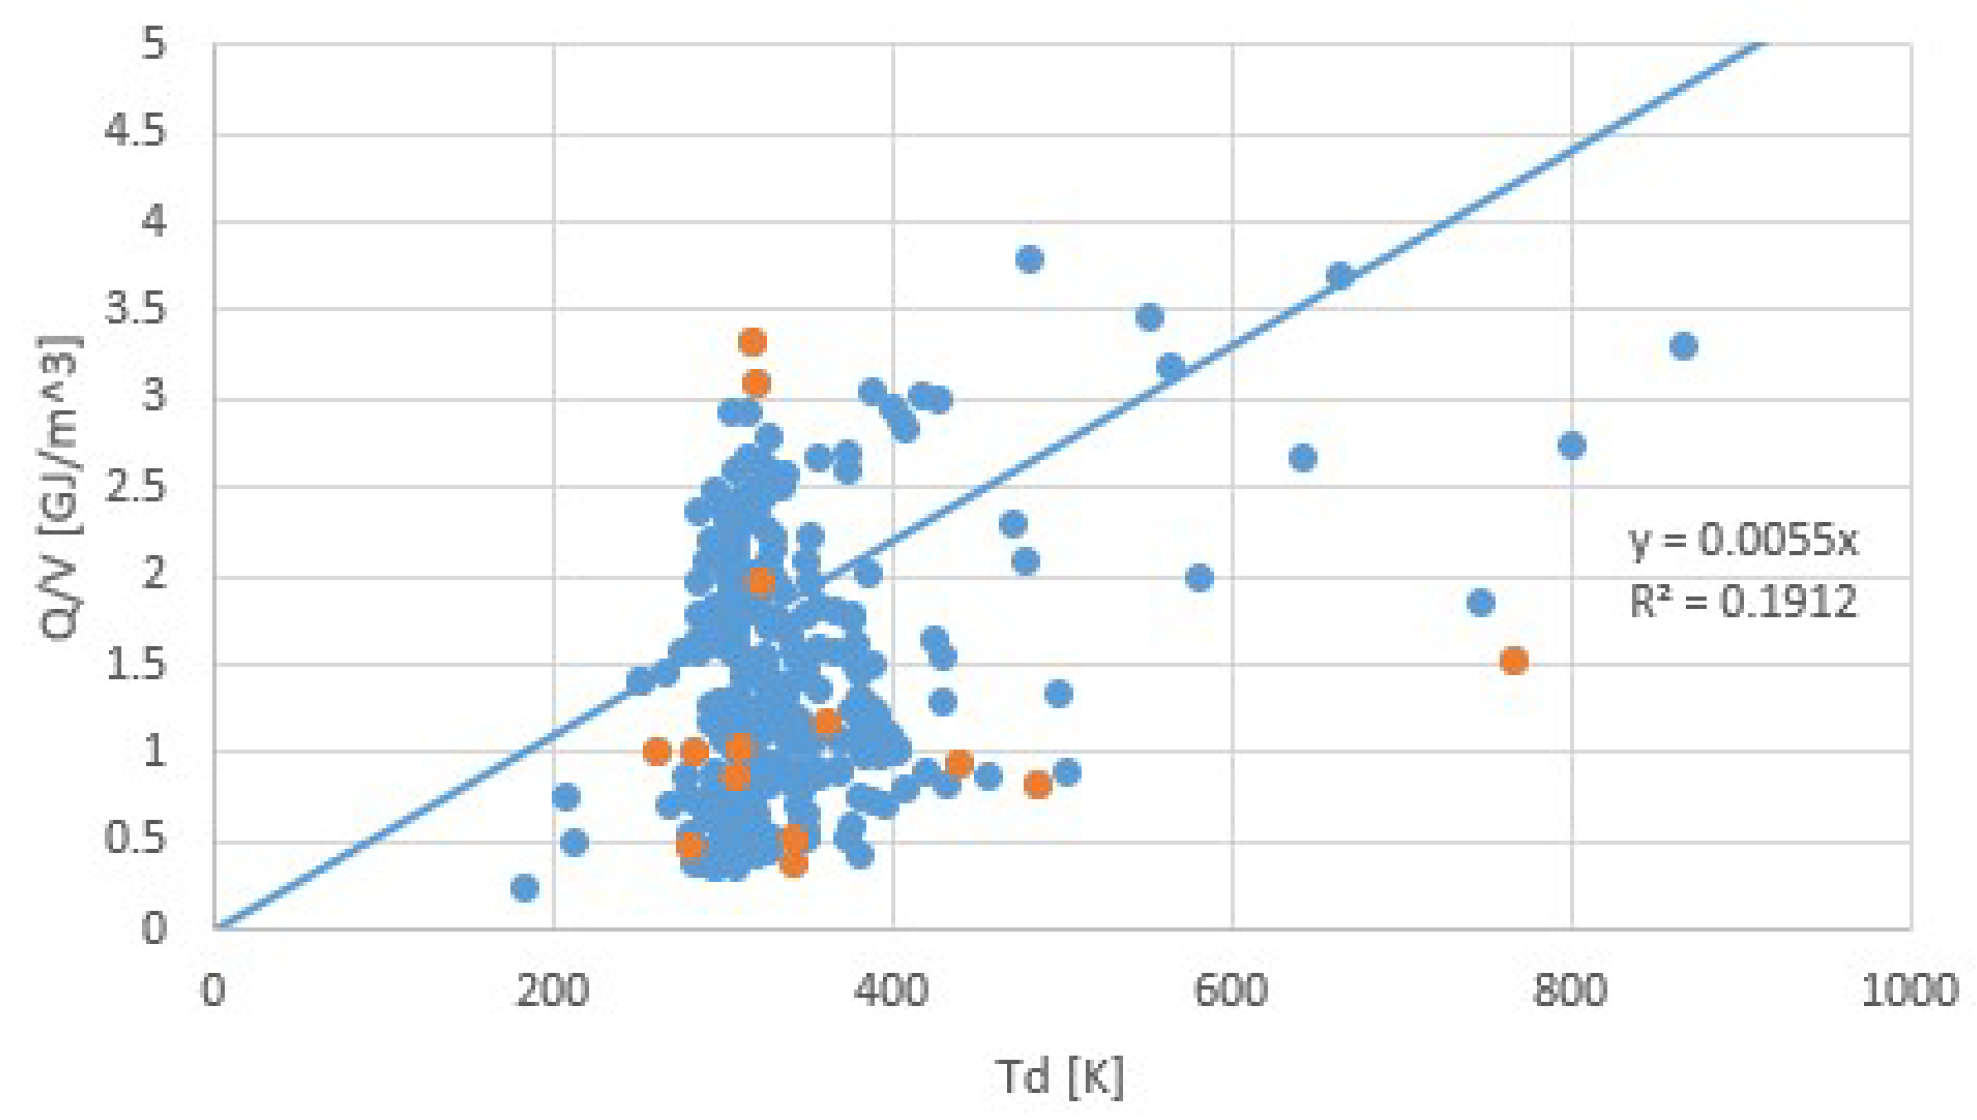
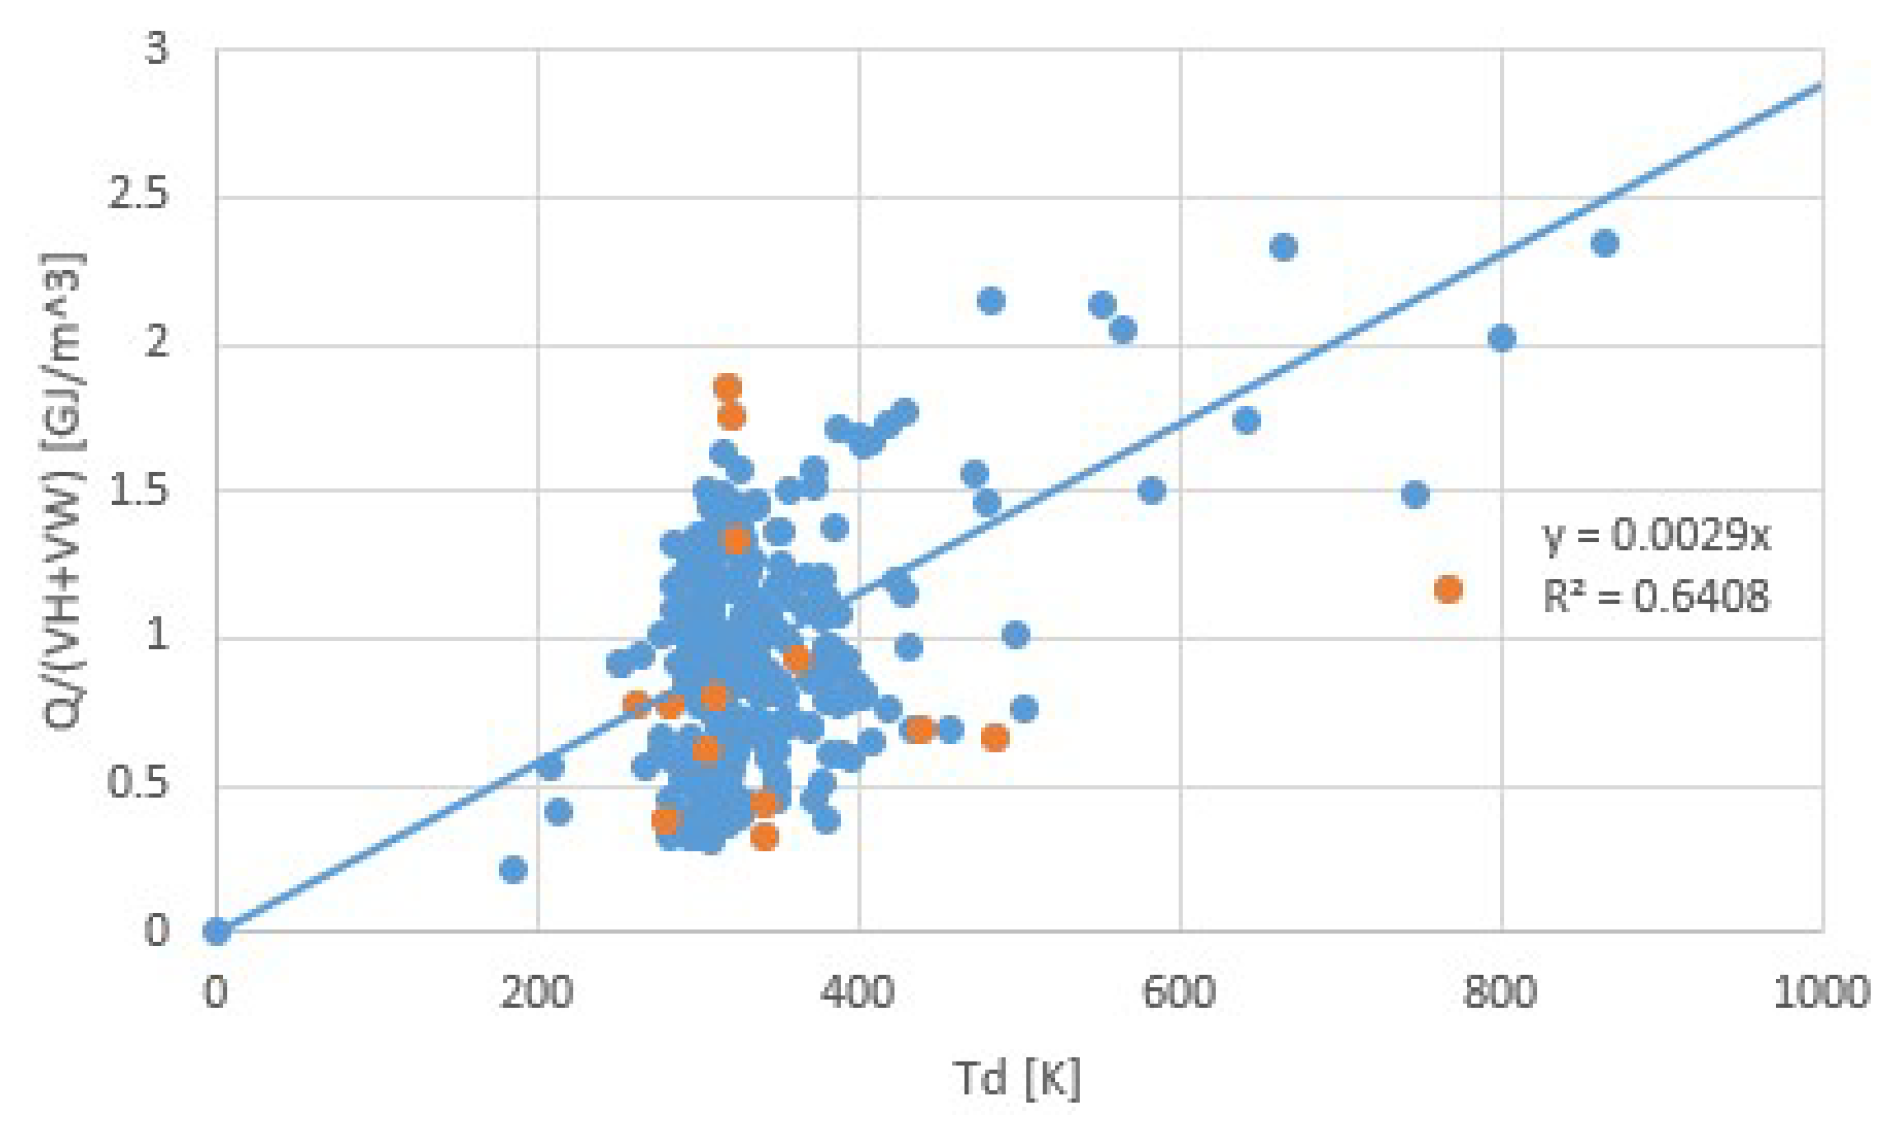
We now arrive at a discussion of the issues mentioned at the end of the introduction. In short, the validity of Trouton’s rule for salt hydrates is illustrated by Figure 10 and Figure 11. We have seen that to some extent, Trouton’s rule can be used to identify suspicious pT-lines. Predicting the pT-line of a salt hydrate transition for which only the sorption enthalpy Δh is known can be done by Equation (4), taking for Δs the average of collection of similar transitions. Finally, for a given Td of dehydration, one can predict that no more heat than about Δh = TdΔs per mole of sorbent molecules can be released. For estimating the heat storage density per volume of hydrate Q/V (J/m3), we also need the molar mass M (kg/mol) and density ρ (kg/m3) of the hydrate. Figure 12 shows the correlation between Q/V and Td. This figure was constructed from Figure 10 with available values for M and ρ [28]. With a regression coefficient of only r2 = 0.19, Figure 12 does not seem to be very valuable for predictions. The correlation is considerably improved by including process water, which is the water extracted from the salt at dehydration, to the material volume. Figure 13 shows the correlation between Q/(VH + VW) and Td, where VH is the hydrate volume and VW is the volume of process water. For this figure, a considerably better correlation with r2 = 0.64 is obtained. Including the process water in the heat storage density is fair when implementing a closed system such as in Figure 1.
4. Discussion
Selecting sorption reactions for sorption reactors involves collecting relevant vapor pressure lines. Fortunately, collections of parametrized vapor pressure are available [5,10,11], but it is not always easy to check the validity of the available data, as the original sources and with that the experimental methods and conditions are often difficult to access. For that purpose, we studied the thermodynamic background of vapor pressure lines in order to validate collections by mutual comparison of the data contained. For liquid-vapor equilibria, we considered the van der Waals equation, and for solid sorption, the Polanyi-Wigner equation.
In particular, we examined conditions for Trouton’s rule (1884) to hold, as this would provide a particularly useful method to examine the validity of vapor pressure lines compared to an existing collection. It is known that for liquid-vapor equilibria, Trouton’s rule cannot be derived from a law of corresponding states such as the van der Waals equation [17,24], but one can argue from the rapid increase of vapor pressure lines that Trouton’s rule may roughly hold for collections of common fluids. For solid sorption, the validity of Trouton’s rule seems to depend on the entropy or free space of sorbent molecules in the bound state, suggesting that for subgroups with certain types of bonds, Trouton’s rule will hold. Indeed, for the chloride ammoniate and the sulfate hydrate subgroups, Trouton’s rule was particularly accurate, with a high regression coefficient. When adding other salts to the hydrate collections, the regression coefficient becomes considerably smaller, although the fitted line seems about the same. Possible explanations for this observation may be the limited accuracy of the additional data for other salts or a fundamental difference in the binding of water to the other salts.
We note that the entropy difference of evaporation of the work fluid, e.g., water or ammonia, considerably differs from the corresponding entropy differences of sorption in salts. This is different for adsorption in, for example, activated carbon, silica gel, and zeolite, and for condensation in salt solutions, where these entropy differences are approximately equal [15,16].
It would be interesting to keep track of Trouton’s rule when new sorption measurements on ammoniation or hydration transitions are done or when old measurements are verified. Depending on the fundamental accuracy of Trouton’s rule, not only data validation can be done but also predictions of vapor pressure lines for transitions of which only the latent heat is known.
Trouton’s rule sets a limit to the possible heat storage density for THS systems for given desorption and sorption temperatures in terms of heat per mole sorbent. In terms of heat per volume of hydrated salt, no clear correlation with hydration and dehydration temperatures was found. However, a much better correlation was found when the process water, which is the water extracted from the salt during dehydration, was included in the heat storage density. The latter is fair in case a closed system is implemented, where all process water is stored in the system.
We also note that although Trouton’s rule may provide a way to check vapor pressure lines, it should still always be checked if for a given salt, all ammoniation or hydration states are known and verified, e.g., by XRD spectra [13].
5. Conclusions
The observation that vapor pressure lines are approximately straight when plotted as the logarithm of pressure versus temperature can be supported for the evaporation of fluids as well as for sorption in salt hydrates by the van der Waals and Polanyi-Wigner equations, respectively. The same models support the validity of Trouton’s rule, i.e., that the latent heat is proportional to the boiling temperature at a given pressure for certain classes of process, such as evaporation of liquids and vapor sorption in salts.
Deviations from Trouton’s rule are interesting in itself, as they may be symptoms of differences between materials, such as electric dipole interaction in the liquid state, structure in the gas phase, or different binding of crystal water. Trouton’s rule can also be used for validation of experiments, such as vapor pressure measurements on salt hydrates, or to predict the desorption temperature at a given vapor pressure when only the latent heat is known, and so on.
Finally, we recall that selecting sorption reactions involves more criteria than only the heat storage density and operation temperatures, including material costs, toxicity, possible side reactions under operation, cycling stability, kinetics of vapor and heat transport, corrosion issues and countermeasures, possible material enhancement for stabilization and improving kinetics, etc. We hope to address these issues in following papers.
Acknowledgments
The research was funded by the Dutch Ministry of Economic Affairs and Climate under the Early Research Program Energy Storage and Conversion of the Netherlands Organization for Applied Scientific Research.
Author Contributions
The authors worked together on salt selection for thermochemical heat storage systems. Ard-Jan analyzed the presented data, worked out the physics and thermodynamics and wrote the paper. Hartmut added valuable insights, especially from a chemical point of view, and came with many good suggestions to improve the paper to its present form.
Conflicts of Interest
The authors declare no conflict of interest.
References
- Brunberg, E.A. The TEPIDUS System for Seasonal Heat Storage and for Cooling. In Proceedings of the International Seminar on Thermochemical Heat Storage, Stockholm, Sweden, 7–9 January 1980; Wettermark, G.. pp. 247–260. [Google Scholar]
- Andersson, J.Y.; de Pablo, J.; Azoulay, M. Kinetics of the rehydration of sodium sulphide dehydrated in situ, under formation of its pentahydrate. Thermochim. Acta 1985, 91, 223–234. [Google Scholar] [CrossRef]
- De Boer, R.; Haije, W.; Veldhuis, J. Determination of structural, thermodynamic and phase properties in the Na2S-H2O system for application in a chemical heat pump. Thermochim. Acta 2003, 395, 3–19. [Google Scholar] [CrossRef]
- De Jong, A.J.; Trausel, F.; Finck, C.; van Vliet, L.; Cuypers, R. Thermochemical heat storage—System design issues. Energy Procedia 2014, 48, 309–319. [Google Scholar] [CrossRef]
- Donkers, P.A.J.; Sögütoglu, L.C.; Huinink, H.P.; Fischer, H.; Adan, O.C.G. A review of salt hydrates for seasonal heat storage in domestic applications. Appl. Energy 2017, 199, 45–68. [Google Scholar] [CrossRef]
- N’Tsoukpoe, K.; Liu, H.; Le Pierrès, N.; Luo, L. A review on long-term sorption solar energy storage. Renew. Sustain. Energy Rev. 2009, 13, 2385–2396. [Google Scholar] [CrossRef]
- Cot-Gores, J.; Castell, A.; Cabeza, L.F. Thermochemical energy storage and conversion: A-state-of-the-art review of the experimental research under practical conditions. Renew. Sustain. Energy Rev. 2012, 16, 5207–5224. [Google Scholar] [CrossRef]
- Aristov, Y.I. Challenging offers of material science for adsorption heat transformation: A review. Appl. Thermal Eng. 2013, 50, 1610–1618. [Google Scholar] [CrossRef]
- Solé, A.; Martorell, I.; Cabeza, L.F. State of the art on gas–solid thermochemical energy storage systems and reactors for building applications. Renew. Sustain. Energy Rev. 2015, 47, 386–398. [Google Scholar] [CrossRef]
- Glasser, L. Thermodynamics of Inorganic Hydration and of Humidity Control, with an Extensive Database of Salt Hydrate Pairs. J. Chem. Eng. Data 2014, 59, 526–530. [Google Scholar] [CrossRef]
- Neveu, P.; Castaing, J. Solid-gas chemical heat pumps: Field of application and performance of the internal heat of reaction recovery process. Heat Recovery Syst. CHP 1993, 13, 233–251. [Google Scholar] [CrossRef]
- Halling, P.J. Salt hydrates for water activity control with biocatalysts in organic media. Biotechnol. Tech. 1992, 6, 271–276. [Google Scholar] [CrossRef]
- The International Center for Diffraction Data (ICDD). Available online: www.icdd.com (accessed on 1 December 2017).
- Trouton, F. On Molecular Latent Heat. Philos. Mag. 1884, 18, 54–57. [Google Scholar] [CrossRef]
- Critoph, R.E. Performance limitations of adsorption cycles for solar cooking. Sol. Energy 1988, 41, 21–31. [Google Scholar] [CrossRef]
- Aristov, Y.I.; Tokarev, M.M.; Sharonov, V.E. Universal relation between the boundary temperatures of a basic cycle of sorption heat machines. Chem. Eng. Sci. 2008, 63, 2907–2912. [Google Scholar] [CrossRef]
- Zemansky, M.W.; Dittman, M. Heat and Thermodynamics, 6th ed.; McGraw-Hill Book Company: Tokyo, Japan, 1981; ISBN-13: 978-0070666474. [Google Scholar]
- Van der Waals, J.D. On the Continuity of the Gaseous and Liquid State. Ph.D. Thesis, University of Leiden, Leiden, The Netherlands, 1873. [Google Scholar]
- Tabor, D. Gases, Liquids and Solids, 2nd ed.; Cambridge University Press: Cambridge, UK, 1979; ISBN-13: 978-0521294669. [Google Scholar]
- Lekner, J. Parametric solution of the van dere Waals liquid-vapor coexistence curve. Am. J. Phys. 1982, 50, 161–163. [Google Scholar] [CrossRef]
- Johnston, D.C. Thermodynamic Properties of the van der Waals fluid. arXiv 2014. [Google Scholar]
- Polanyi, M.; Wigner, E.P. Über die Interferenz von Eigenschwingungen las Ursache von Energieschwankungen und chemischer Umsetzungen. Z. Phys. Chem. A 1928, 43, 439–452. [Google Scholar]
- Kittel, C.; Kroemer, H. Thermal Physics, 2nd ed.; W.H. Freeman & Company: San Francisco, CA, USA, 1980; ISBN-13: 978-0716710882. [Google Scholar]
- Guggenheim, E.A. The Principle of Corresponding States. J. Chem. Phys. 1945, 13, 253–261. [Google Scholar] [CrossRef]
- Hildebrand, J.H. The entropy of vaporization as a means of distinguishing normal liquids. J. Am. Chem. Soc. 1915, 37, 970–978. [Google Scholar] [CrossRef]
- Everett, D.H. Some Correlations between Thermodynamic Porperties and the Structure of Liquids. J. Chem. Soc. 1960, 2566–2573. [Google Scholar] [CrossRef]
- Donkers, P.A.J. Experimental Study on Thermochemical Heat Storage Materials. Ph.D. Thesis, Eindhoven University of Technology, Eindhoven, The Netherlands, 2015. [Google Scholar]
- Springer Materials. Available online: http://materials.springer.com/periodictable# (accessed on 15 December 2017).
Figure 1.
Elementary thermochemical heat storage (THS) system. The core of the system is a reactor containing modules with thermochemical material (TCM), e.g., a hydrated salt. The salt is dried by solar heat of, e.g., 80–90 °C, captured by a solar collector, buffered in hot water storage and transferred by a heat exchanger (HX). Process water from dehydrating the salt is captured in a pool which acts as a condenser during dehydration and as an evaporator during hydration. Process water is kept at 10–20 °C by an HX with a reservoir which may be a borehole energy storage (BES).
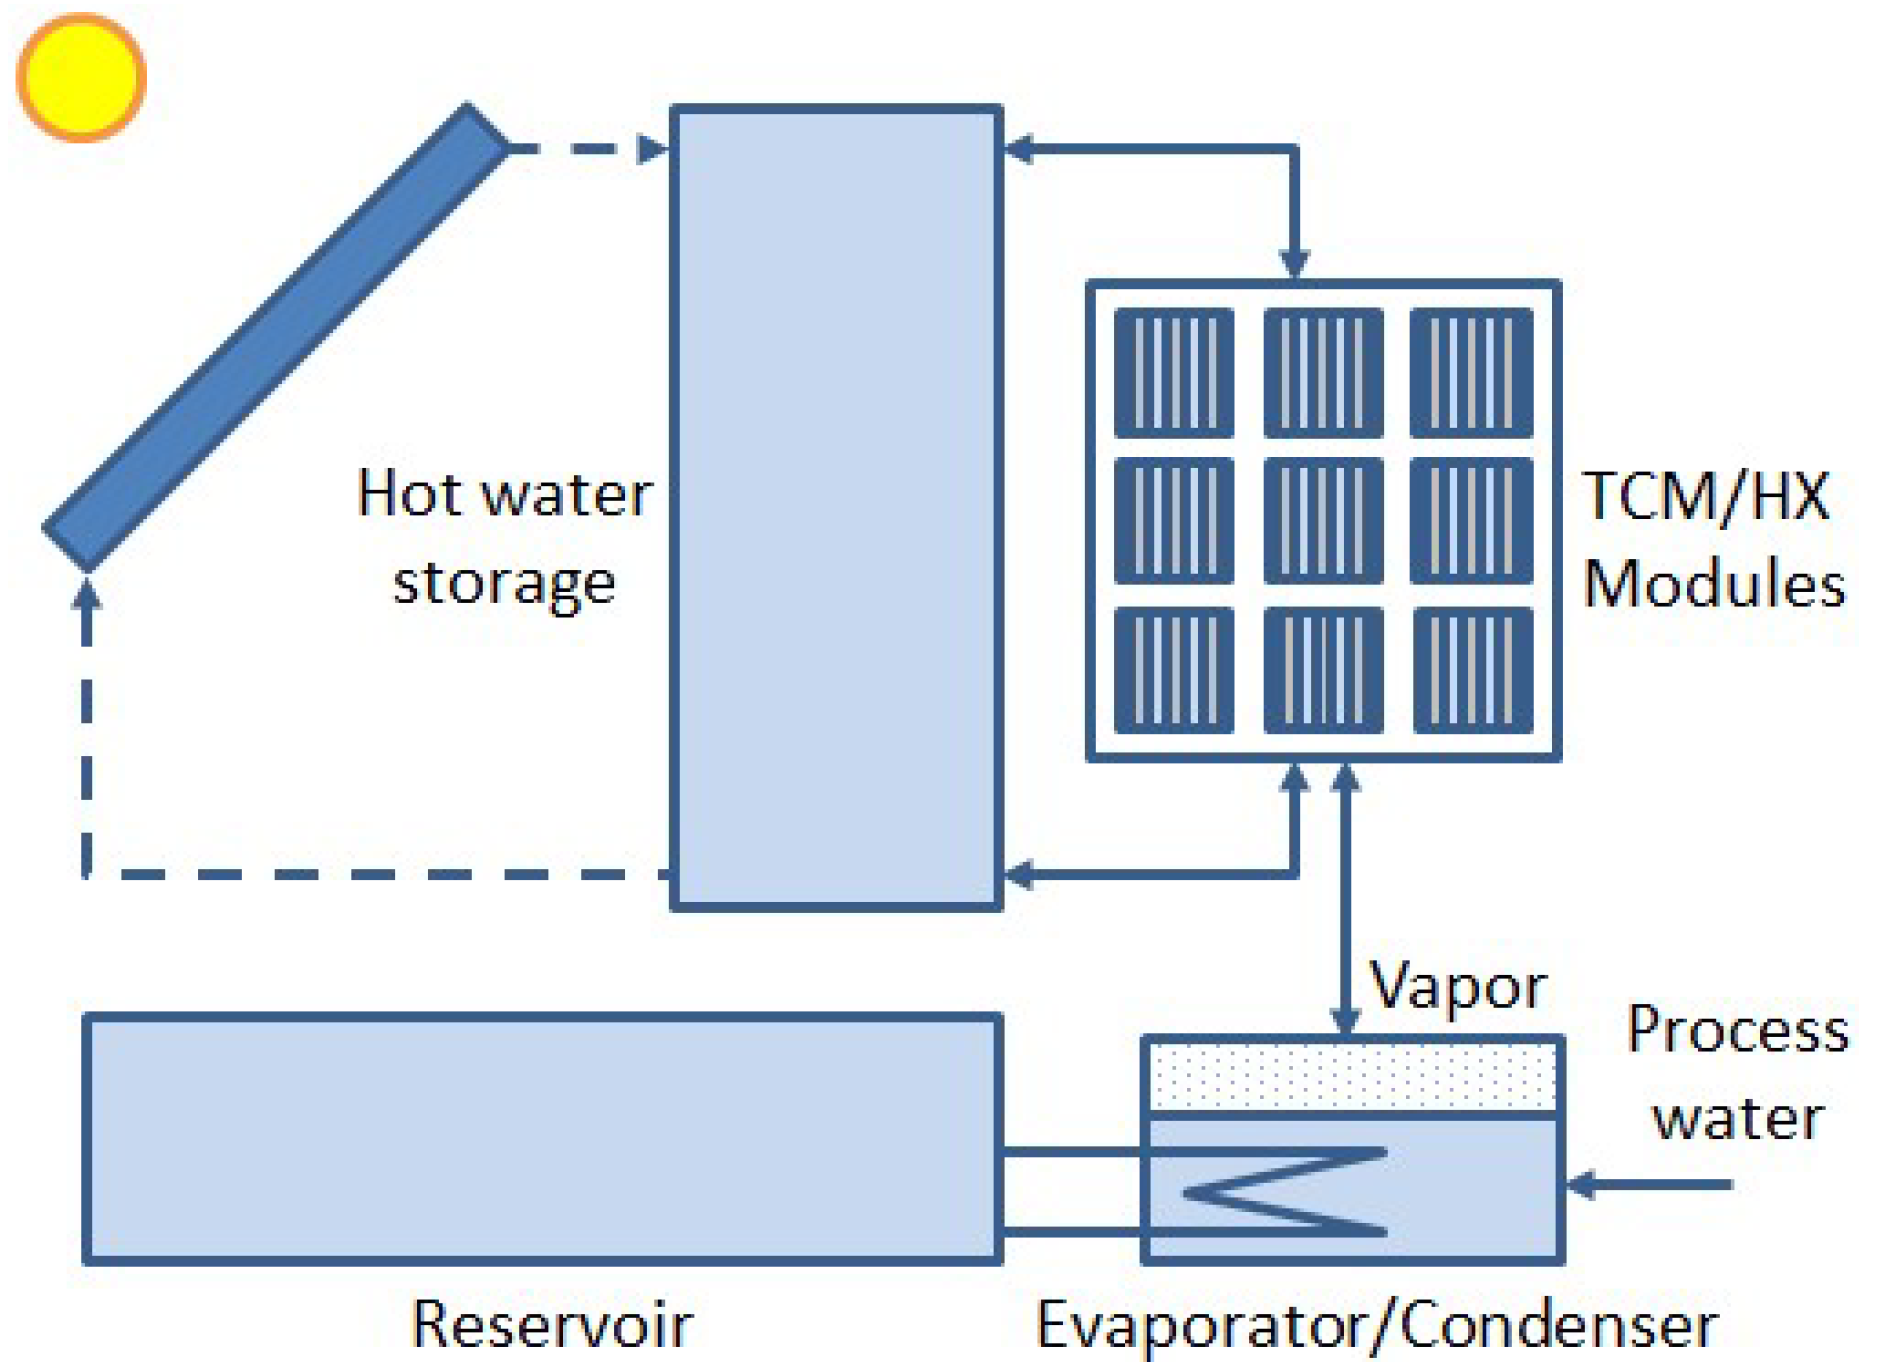
Figure 2.
Vapor pressure lines of water (blue) and K2CO3·(1½–0)H2O (green). The red horizontal line gives the vapor pressure of about 23 hPa for water at a typical condenser temperature of 20 °C. The intersection with the green line gives a minimum desorption temperature of K2CO3·1½H2O of about 68 °C. The blue horizontal line gives the vapor pressure of about 12 hPa for water at a typical evaporation temperature of 10 °C. The intersection with the green line gives the maximum sorption temperature of K2CO3·1½H2O of about 60 °C.
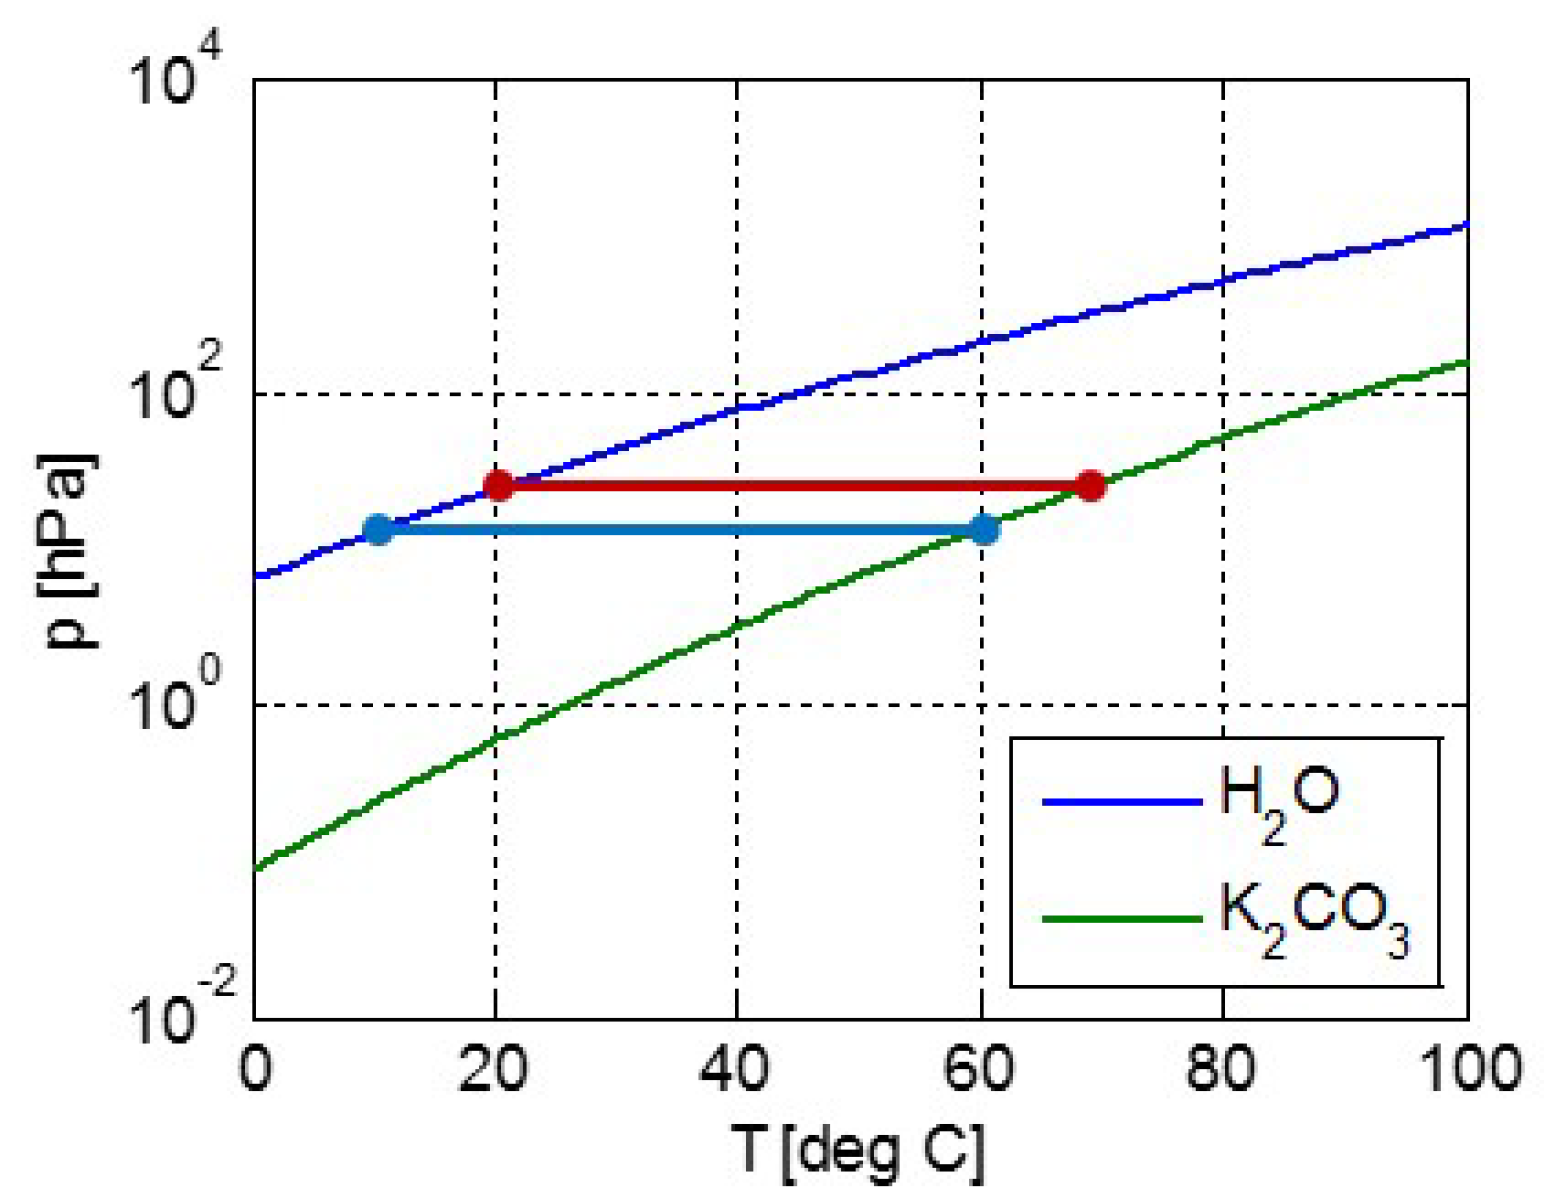
Figure 3.
Latent heat van der Waals fluid (orange) and slope of the pT-line (blue) as a function of temperature. For temperatures up to about 50% of the critical temperature, both are nearly constant with temperature and hardly differ. Hence for lower temperatures, the latent heat Δh can be considered constant, confirming the assumption for integrating the Clausius-Clapeyron equation.
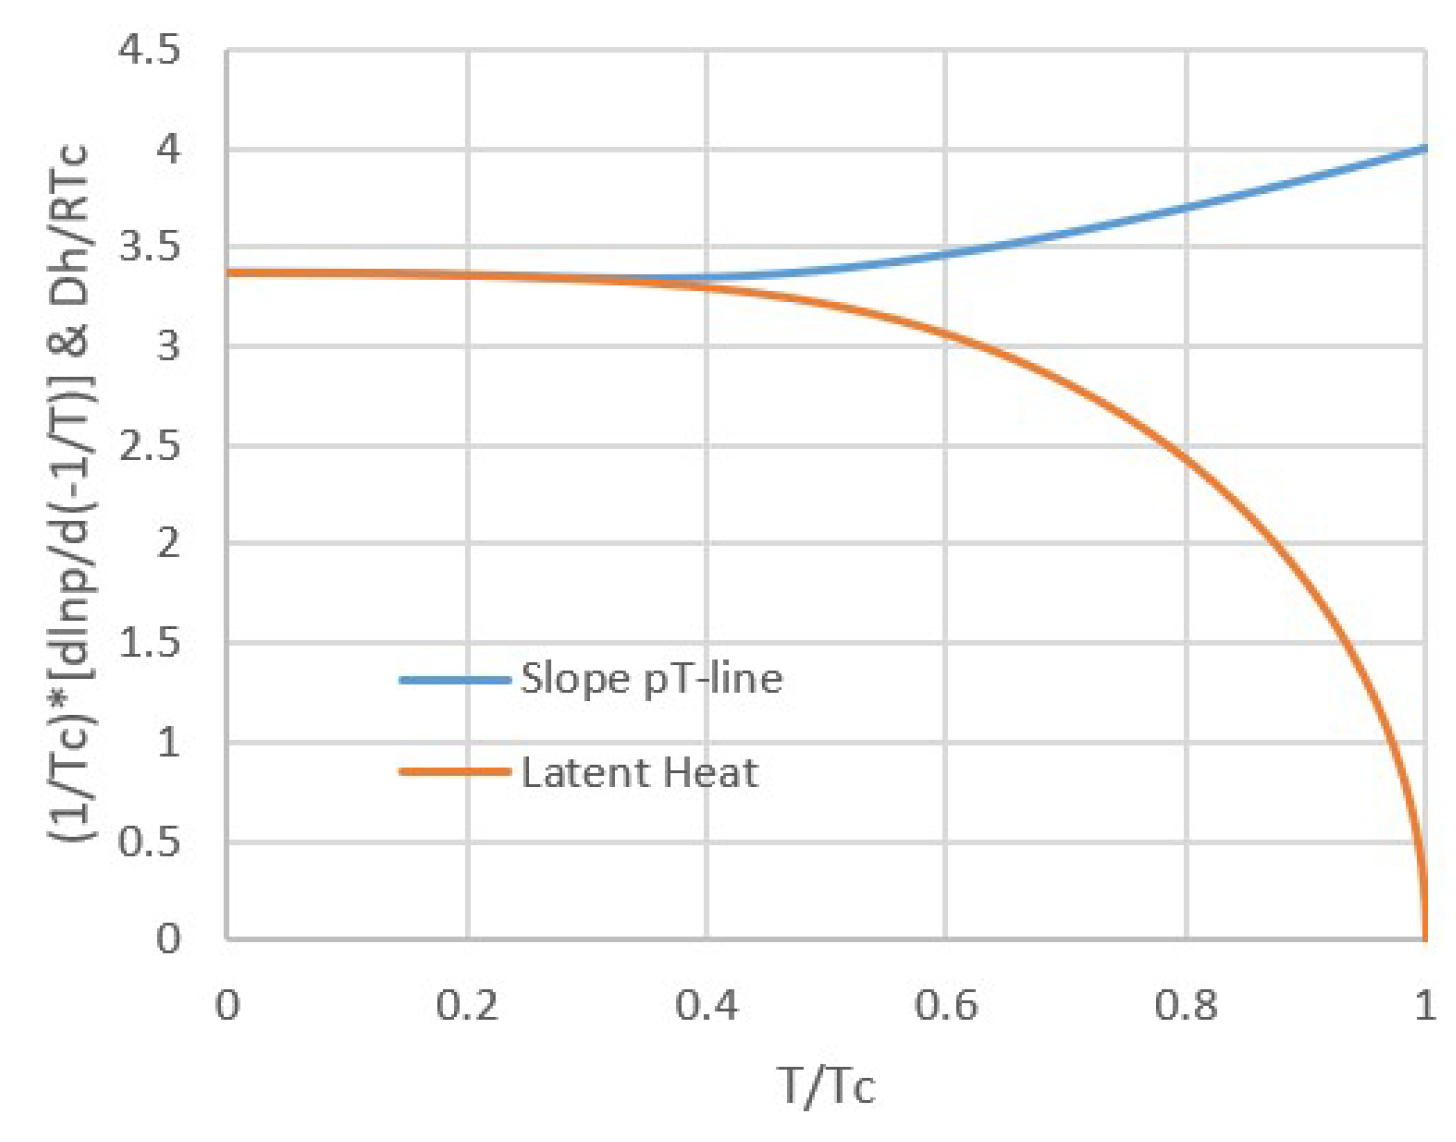
Figure 4.
Vapor pressure line for a van der Waals fluid. We see that although the latent heat Δh vanishes towards the critical temperature, the relation between the logarithm of vapor pressure and inverse temperature is nearly a straight line up to the critical temperature. This is possible because the molar volume and entropy differences Δv and Δs also vanish towards the critical temperature.
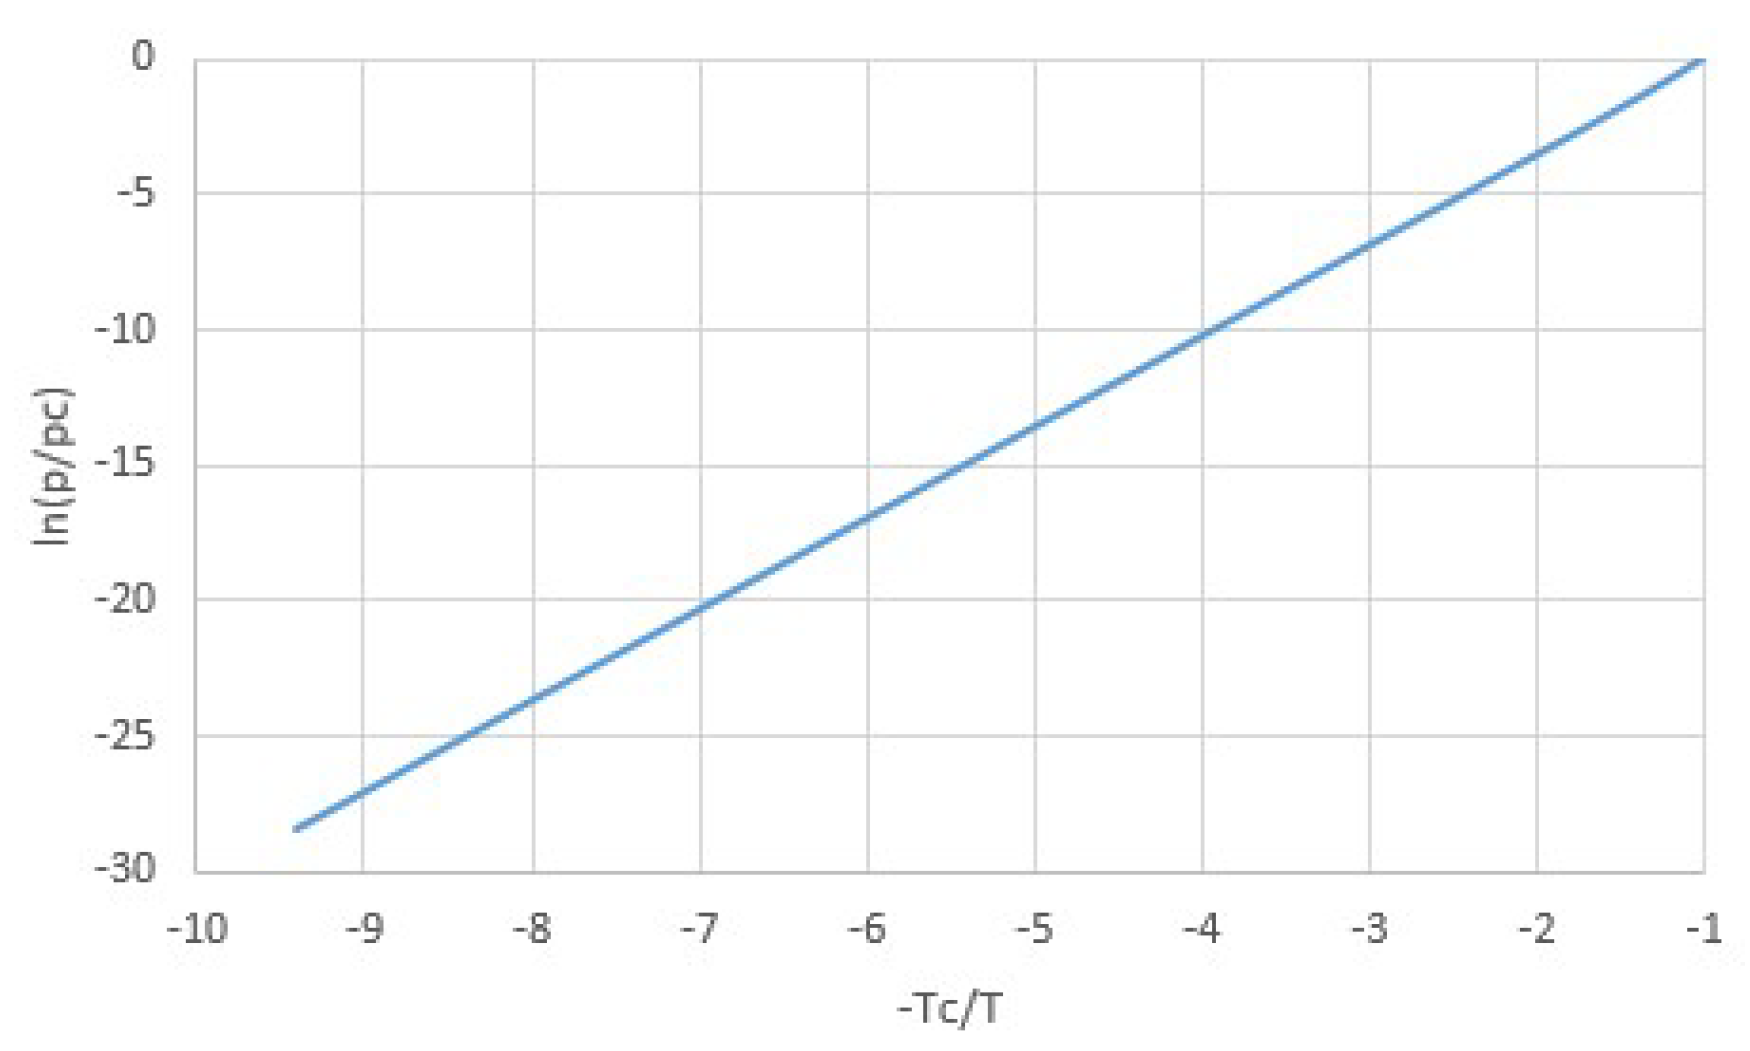
Figure 5.
Van der Waals normalized vapor pressure lines p0/pc as a function of normalized boiling temperatures T0/Tc at p0 = 1 atm, together with points representing experimental values for common fluids [17]. Although the points are well off the line, both the line and the points show a similar rapid increment of p0/pc with T0/Tc. Since the difference in critical pressures between common gases is limited between about 25 and 90 atm for the selected gases, and because p/pc increases so rapidly with T/Tc, it follows that the ratio of boiling temperature and critical temperature T0/Tc is roughly constant at a given pressure of e.g., p0 = 1 atm.

Figure 6.
Correlations of latent heat Δh versus the normal boiling temperature Tb (Trouton’s Rule, blue line) and of Δh versus the critical temperature Tc (principle of corresponding states, orange line) for some common fluids [17]. For this data, the regression coefficient is not better for the principle of corresponding states than for Trouton’s rule.
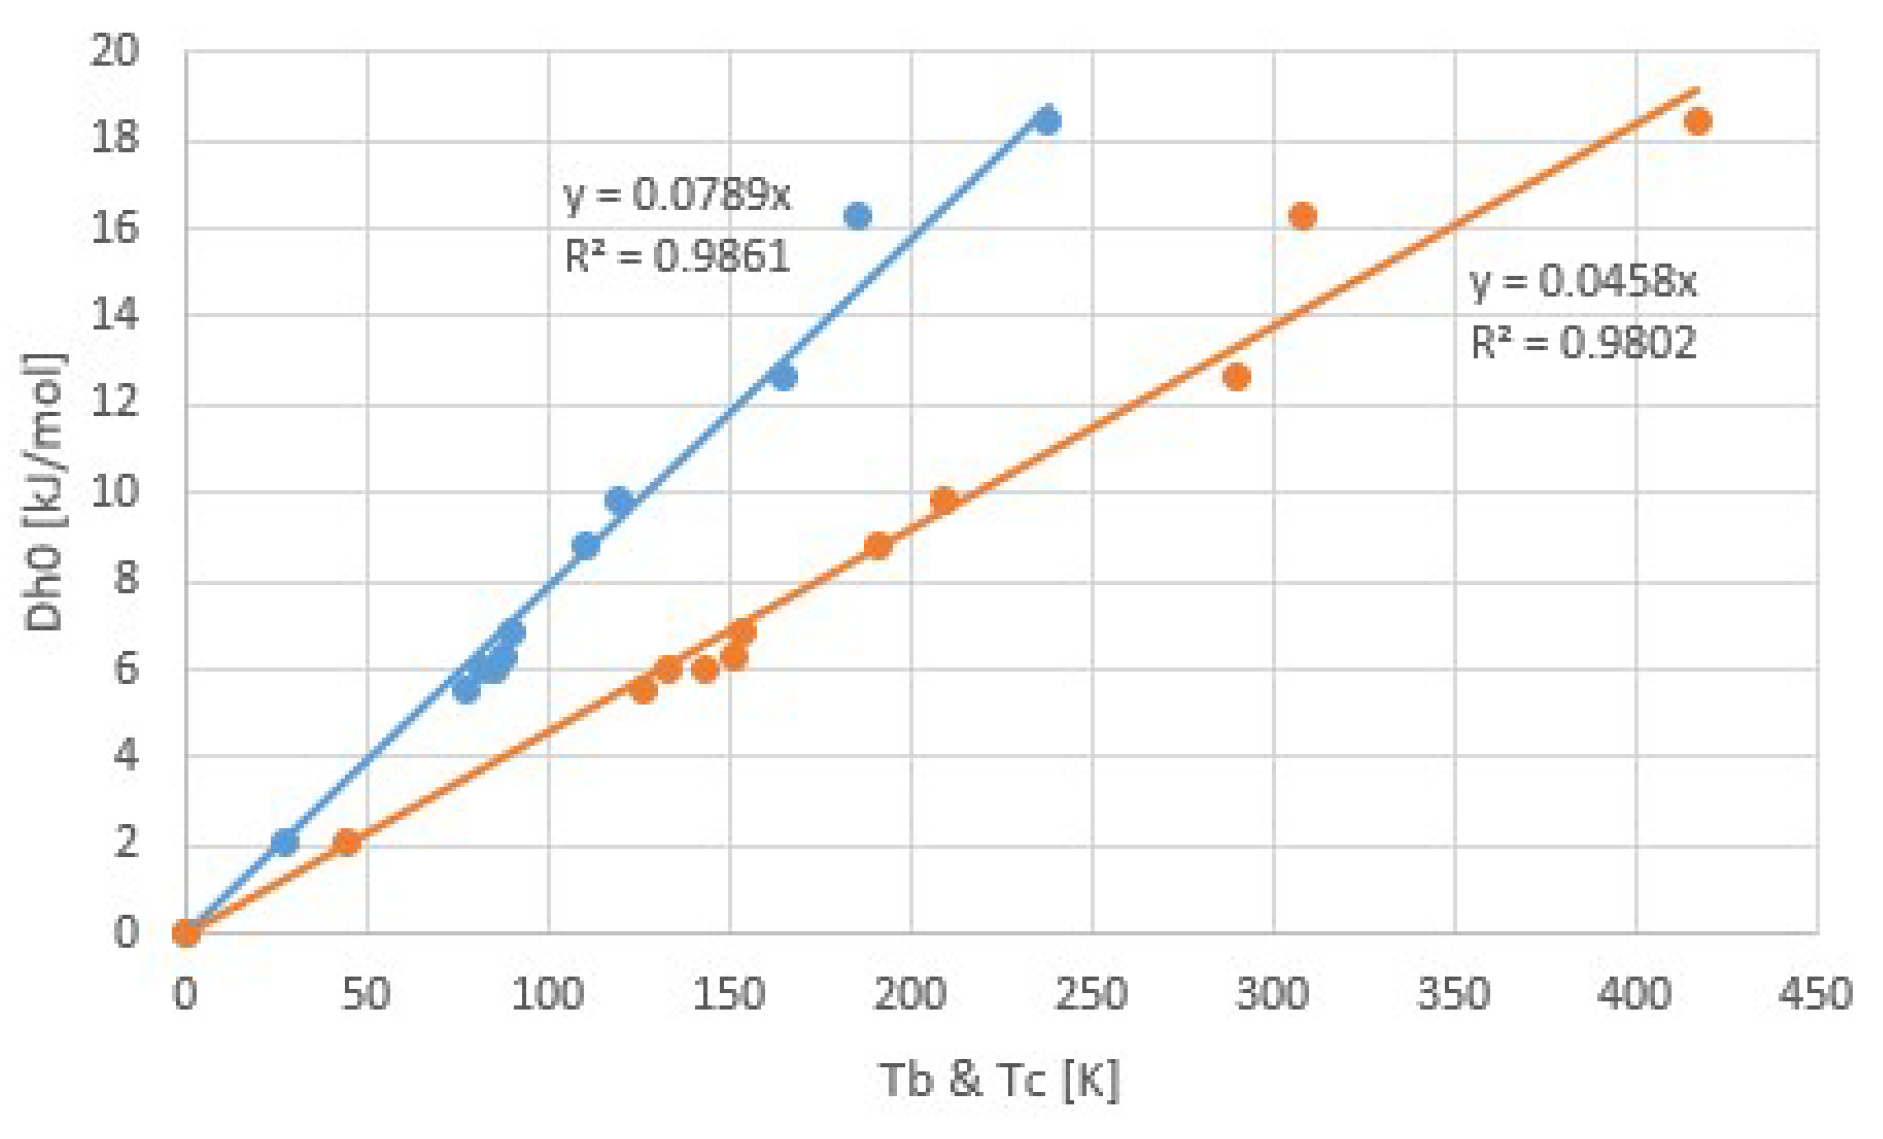
Figure 7.
Vapor pressure lines of chloride ammoniates (black) and ammonia (red). This plot is an extension of an earlier plot of Neveu [11], which we extrapolated towards 1/T = 0. Here, an approximate intersection of the pT-lines of the chloride ammoniates becomes apparent, which confirms Trouton’s rule for the collection. As anticipated, the vapor pressure line of ammonia does not intersect at 1/T = 0 and therefore does not belong to this collection.
Figure 8.
Trouton’s rule for ammoniates of chloride salts. This plot was constructed from the pT-lines of chloride ammoniates transitions of Figure 7. The regression coefficient r2 = 0.9958 is even better than for the vapor-liquid transitions of common liquids of Figure 6.

Figure 9.
Transition entropy at 1 atm for ammoniate transitions of chloride salts, corresponding to Figure 7 and Figure 8. The orange point is the transition entropy between ammonia vapor and liquid, which differs considerably from the average value for ammoniate transitions, as expected.

Figure 10.
Trouton’s rule for salt hydrates. Orange points are entries with highest and lowest transition entropy. The regression coefficient r2 = 0.8757 is considerably smaller than for chloride ammoniates.
Figure 10.
Trouton’s rule for salt hydrates. Orange points are entries with highest and lowest transition entropy. The regression coefficient r2 = 0.8757 is considerably smaller than for chloride ammoniates.
Figure 11.
Transition entropy at 1 atm for hydration transitions of salts. Orange points with highest and lowest transition entropies correspond to the orange points in Figure 10. The transition entropy of 118.9 J/mol for water evaporation is also plotted as the left-most point and differs considerably from the average, as expected.

Figure 12.
Heat storage densities Q/V (GJ/m3) for salt hydrates, obtained for the same collection as Figure 10 and Figure 11 for cases for which we found hydrate densities ρ (kg/m3). Orange points are transitions with the lowest and highest transition entropies. We see that due to hydrate densities and the amount of water in the transition, Q/V shows no clear correlation with Td, according to r2 = 0.19.
Figure 13.
Heat storage densities Q/V (GJ/m3) for salt hydrates, including the volume of process water in V for the same data as for Figure 12. Orange points are transitions with the lowest and highest transition entropies. Including process water in the storage density is fair for closed systems as in Figure 1 where process water is kept for rehydration. Consequently, the resulting heat storage density is smaller. In addition, the correlation heat between storage and temperature is more accurate, with r2 = 0.64 compared to r2 = 0.19 for Figure 12.


Table 1.
Trouton’s rule for H2O and NH3 at 1 atm.
| Fluid | Tb (K) | Tc (K) | Δh (J/molK) | Δh/RTb | Δh/RTc |
|---|---|---|---|---|---|
| H2O | 373.15 | 647.6 | 44.0 | 14.2 | 8.2 |
| NH3 | 239.75 | 405.5 | 23.35 | 11.7 | 6.9 |
Table 2.
Hydration transitions with lowest and highest Δs.
| Salt | H2O | Δs (J/molK) | Alternative Δs (J/molK) |
|---|---|---|---|
| Ca(H2PO4)2 | 1-0 | 69 | |
| MnI2 | 2-1 | 77 | |
| CuSO4 | 1-0 | 81 | |
| MnSeO4 | 1-0 | 82 | |
| MgSeO4 | 1-0 | 84 | |
| CsCd(SO4)2 | 6-2 | 90 | |
| SrCl2 | 2-1 | 91 | 148 |
| MnI2 | 1-0 | 95 | |
| Na2HPO4 | 12-7 | 99 | 149 |
| CaCl2 | 6-4 | 182 | 142, 166 |
| SrCl2 | 1-0 | 184 | |
| Tl(Al(SO4))2 | 12-0 | 184 | |
| LiBr | 2-1 | 185 | 171 |
| BaCl2 | 1-0 | 190 | 100, 145 |
| Na2B4O7 | 5-0 | 192 | 149 for 10-0 |
| CsCr(SeO4)2 | 12-0 | 196 | |
| HIO3 | 1-0 | 201 | |
| CH3NH2Cr(SO4)2 | 12-0 | 204 |
© 2018 by the authors. Licensee MDPI, Basel, Switzerland. This article is an open access article distributed under the terms and conditions of the Creative Commons Attribution (CC BY) license (http://creativecommons.org/licenses/by/4.0/).
Share and Cite
MDPI and ACS Style
De Jong, A.-J.; Fischer, H. Trouton’s Rule for Vapor Sorption in Solids. Appl. Sci. 2018, 8, 638. https://doi.org/10.3390/app8040638
AMA Style
De Jong A-J, Fischer H. Trouton’s Rule for Vapor Sorption in Solids. Applied Sciences. 2018; 8(4):638. https://doi.org/10.3390/app8040638
Chicago/Turabian StyleDe Jong, Ard-Jan, and Hartmut Fischer. 2018. "Trouton’s Rule for Vapor Sorption in Solids" Applied Sciences 8, no. 4: 638. https://doi.org/10.3390/app8040638
Note that from the first issue of 2016, this journal uses article numbers instead of page numbers. See further details here.