Solar Radiation Parameters for Assessing Temperature Distributions on Bridge Cross-Sections


1
College of Civil Engineering, Fuzhou University, Fuzhou, Fujian 350108, China
2
Department of Civil and Environmental Engineering, University of Wisconsin-Milwaukee, Milwaukee, WI 53211, USA
*
Author to whom correspondence should be addressed.
Appl. Sci. 2018, 8(4), 627; https://doi.org/10.3390/app8040627
Submission received: 20 March 2018
/
Revised: 8 April 2018
/
Accepted: 12 April 2018
/
Published: 17 April 2018
(This article belongs to the Section Energy Science and Technology)
Abstract
:Solar radiation is one of the most important factors influencing the temperature distribution on bridge girder cross-sections. The bridge temperature distribution can be estimated using estimation models that incorporate solar radiation data; however, such data could be cost- or time-prohibitive to obtain. A review of literature was carried out on estimation models for solar radiation parameters, including the global solar radiation, beam solar radiation and diffuse solar radiation. Solar radiation data from eight cities in Fujian Province in southeastern China were obtained on site. Solar radiation models applicable to Fujian, China were proposed and verified using the measured data. The linear Ångström–Page model (based on sunshine duration) can be used to estimate the daily global solar radiation. The Collares-Pereira and Rabl model and the Hottel model can be used to estimate the hourly global solar radiation and the beam solar radiation, respectively. Three bridges were chosen as case study, for which the temperature distribution on girder cross-sections were monitored on site. Finite element models (FEM) of cross-sections of bridge girders were implemented using the Midas program. The temperature–time curves obtained from FEM showed very close agreement with the measured values for summertime. Ignoring the solar radiation effect would result in lower and delayed temperature peaks. However, the influence of solar radiation on the temperature distribution in winter is negligible.
1. Introduction
Temperature distribution in bridge structures built in the outdoor environment are appreciably influenced by solar radiation and ambient temperature variations [1]. The thermal energy associated with solar radiation can result in an increase in temperature at the top surfaces of the structure beyond the ambient temperature. Solar radiation is one of the most important factors affecting the temperature distribution in bridge structures [2]. Heat conduction can further affect the temperature distribution. Although there are many experimental studies that address temperature distribution in bridges [3,4,5,6,7,8], few consider and measure solar radiation when assessing bridge temperature distributions. When carrying out a dynamic heat transfer analysis on bridge structures, the geometry of cross-section, initial thermal state, varying boundary conditions, thermal properties of materials, etc. should be input into any Finite Element Method (FEM) software used. The solar radiation levels on different parts of bridge structures represent one of the time-varying boundary conditions, which can be estimated by considering the various model parameters. Taking box girder bridges as example, the external surface of the top flange is influenced by both the beam and diffuse solar radiation, while the external surface of the web is influenced by a combination of the beam solar radiation, diffuse solar radiation and reflection from the ground. The undersides of the top and bottom flanges are influenced by ground reflection. The geometry of the cross-section, thermal parameters of materials, and bridge location are all determined or known at the beginning of the design process; however, the solar radiation must be estimated or measured. The accuracy of heat transfer analysis using FEM is influenced by the precision of solar radiation estimates. At present, there is a lack of measured solar radiation data in most parts of China. There are 756 meteorological stations in China, but only 122 of those stations monitor solar radiation data [9]. In Fujian, there are more than 60 meteorological stations, with only the Fuzhou and Jian’ou stations monitoring the solar radiation levels. Therefore, engineers usually establish estimation models of solar radiation for engineering applications or scientific research. However, choosing the appropriate estimation models for solar radiation from among those proposed by researchers is a key problem. Some are empirical models based on different meteorological parameters, while others are established using numerical simulation involving different types of artificial intelligence methodologies.
In this paper, the similarities and differences of various estimation models for solar radiation are summarized, including models for global, beam, and diffuse solar radiation, all of which should be considered in the analyses of temperature distribution on bridge girder cross-sections. Based on the solar radiation data obtained from eight cities in Fujian, China, estimation models of solar radiation applicable for Fujian, China were proposed. The monitoring of some bridges was carried out to obtain the temperature distribution on bridge girder cross-sections. The FEM of cross-sections of bridge girders were built using the Midas software. The influence of solar radiation on bridge temperature distribution in different seasons was analyzed. The results can be considered as a model for future development of specifications and estimation models for solar radiation in different regions in China and elsewhere.
2. State of Art of Estimation Models for Solar Radiation
2.1. Estimation Models for Global Solar Radiation
The global solar radiation is the sum of beam solar radiation and diffuse solar radiation. Most of the research on global solar radiation is based on two different time scales: daily and hourly.
2.1.1. Estimation Models for Daily Global Solar Radiation
The global solar radiation is mainly related to meteorological factors such as the duration of sunshine, extent of cloud cover, ambient temperature and so on. Accordingly, empirical regression analyses or artificial intelligence techniques are used by researchers to establish the estimation models of daily global solar radiation based on different meteorological factors.
- Sunshine duration fraction models
In 1924, a linear equation relating the clearness index and the sunshine duration fraction was proposed by Ångström [10], as shown below:
where H/HC is the clearness index, H is the daily global solar radiation (averaged over one month), HC is the average clear-day global solar radiation, S/S0 is the sunshine duration fraction, S is the daily sunshine duration (averaged over one month), S0 is the maximum daily sunshine duration (averaged over one month), and a and b are empirical coefficients.
H/HC = a + b(S/S0)
However, it is difficult to properly define the concept of “clear day” in the equation proposed by Ångström. Therefore, a daily extraterrestrial solar radiation on a horizontal surface (averaged over one month) (H0) was proposed by Page to be used instead of HC, resulting in the Ångström–Page equation as follows [11]:
where a’ and b’ are empirical coefficients in Ångström–Page equation.
H/H0 = a’ + b’(S/S0)
The Ångström–Page equation is one of the classical equations for estimation of the daily global solar radiation. Different mathematical expressions have been proposed by other researchers to improve its accuracy, including using quadratic [12], cubic [13], logarithmic [14], exponential [15] and power expressions [16]. However, the improvement in the accuracy of equations using these expressions is not obvious when comparing with the linear expression [17]. Therefore, the linear Ångström–Page equation is generally used due its sufficient accuracy and lower computational effort. In China, research on global solar radiation models began in the 1960s, and was based on the Ångström–Page equation with empirical coefficients for different geographic zones [18]. However, China is vast in territory, and environmental conditions in different regions are obviously different. Thus, it is difficult to establish a common set of empirical coefficients applicable to all regions.
Some researchers have used other meteorological and geographic parameters such as the ambient temperature, altitude, longitude and latitude information, relative humidity, and cloud cover to improve the accuracy of the Ångström–Page equation [19,20,21]. It is noted that sunshine duration has the greatest influence on the daily global solar radiation compared with other meteorological factors. Moreover, considering other meteorological factors may reduce the accuracy of the estimated values [22].
- Non-sunshine duration models
The ambient temperature was chosen by some researchers to establish an estimation model for global solar radiation. The difference between the daily maximum and minimum temperatures was used to predict the daily global solar radiation by Hargreaves and Samani (H-S model) in 1982 [23]. To improve the accuracy of the H-S model, some meteorological factors such as the altitude [24], and precipitation [25,26,27] were considered. Based on the H-S model, an exponential equation considering the daily temperature range was proposed by Bristow and Campbell (B-C model) in 1984 [28]. Grillone et al. compared the results of these empirical models with measured data from the Mediterranean region and concluded that the H-S model had the highest accuracy [29]. However, Liu et al. suggested using the B-C model after comparing various empirical models with measured data from 15 meteorological stations in Northern China due to better accuracy and ease of determining the empirical factors [30]. It should be noted that the estimation error for models based on ambient temperature is larger than for those based on sunshine duration [22].
The extent of cloud cover was chosen by some researchers to establish estimation models for global solar radiation due to the lack of measured sunshine duration in some regions, especially in the oceans, mountains and deserts, where few meteorological stations exist. However, cloud cover is usually noted visually, which may have great uncertainty and error. An increase in cloud cover would reduce the beam solar ration and increase the diffuse solar radiation. A linear equation for the clearness index and average total cloud cover was proposed by Kimball based on the measured data from many meteorological stations in the U.S. [31]. The relationships between the clearness index and the sunshine duration fraction, and between the clearness index and the extent of cloud cover, were discussed by Bennett in 1965 [32]. It is reported that the relationship between the clearness index and the sunshine duration fraction is more evident compared to other parameters. Three types of estimation models were presented by Wang based on the sunshine duration fraction, the extent of cloud cover, and the combination of the two [33]. Results indicated that the model considering the sunshine duration fraction had the highest accuracy.
- Artificial intelligence approach
The artificial intelligence approach has been utilized by some researchers to predict the global solar radiation [22,34,35,36,37]. However, more factors are involved in the artificial intelligence techniques compared to empirical models. Consequently, the computational effort is significantly higher, making them less convenient for engineering applications. Overall, the empirical model for daily global solar radiation based on the sunshine duration fraction is preferred for engineering applications.
2.1.2. Estimation Model for Hourly Global Solar Radiation
Hourly global solar radiation data are needed for research on temperature distribution on bridge girder cross-sections. Research on hourly global solar radiation is less frequent than its daily counterpart. A linear relationship between hourly and daily global solar radiation was proposed by Liu and Jordan in 1960 using the following Equation [38]:
where rT is the proportionality coefficient, I is the hourly global solar radiation, H is the daily global solar radiation, ω is the solar hour angle, and ωs is the sunset hour angle. However, some researchers have reported that a linear relationship only exists in a clear day [39]. The equation proposed by Liu and Jordan was modified by Collares-Pereira and Rabl as follows [40]:
where a = 0.409 + 0.5016sin(ωs − 60) and b = 0.6609 − 0.4767sin(ωs − 60). The validity of this equation was verified by measured data [41,42]. Although some modifications were proposed by other researchers [42,43,44], the Collares-Pereira and Rabl equation is the most frequently used model for estimating the hourly global solar radiation.
rT = I/H = (π(cosω − cosωs))/(24(sinωs − ωscosωs))
rT = I/H = ((a + bcosω)(π(cosω − cosωs)))/(24(sinωs − ωscosωs))
The Gaussian function was considered by some researchers to estimate the hourly global solar radiation, which assumes that the meteorological parameters are all stochastic and the variation of hourly global solar radiation follows a normal distribution. However, this approach can only be used for a clear day [45,46].
2.2. Estimation Model for Beam and Diffuse Solar Radiation
The beam solar radiation is related to the solar altitude, atmospheric transparency, cloud cover, altitude and so on [39]. The diffuse solar radiation is related to the incident angle of solar radiation, atmospheric condition and so on [39]. Literature on the beam or diffuse solar radiation are less frequent compared to the global solar radiation. Most of the research is focused on estimation models for beam and diffuse solar radiation under clear conditions. Moreover, most such estimation models are based on the hourly time scale. The model suggested by American Society of Heating, Refrigerating, and Air Conditioning Engineers (ASHRAE model) is a widely used estimation model for beam and diffuse solar radiation in a clear day [47]. Some modifications have been proposed to improve its accuracy [48,49,50].
A relationship between the transmission ratio of beam solar radiation τb and the transmission ratio of diffuse solar radiation τd was proposed by Liu and Jordan in 1960 [38] under the assumption that the atmosphere is transparent.
where τd = Id/I0, τb = Ib/I0, Id is the hourly diffuse solar radiation, Ib is the hourly beam solar radiation, and I0 is the hourly extraterrestrial solar radiation on a horizontal surface.
τd = 0.2710 − 0.2939τb
The following equation was proposed by Hottel in 1976 for estimating the transmission ratio of beam solar radiation based on the solar altitude angle and geographic altitude [51].
where a0, a1 and k are empirical coefficients considering the altitude and meteorological conditions, and h is the solar altitude angle. Other meteorological factors, such as ambient temperature and relative humidity, as well as the artificial intelligence approach, were considered by some researchers to establish a numerical relationship for beam solar radiation and diffuse solar radiation [35,52,53]. However, a combination of the Liu and Jordan equation and Hottel equation has been used by researchers to estimate the hourly beam and diffuse solar radiation values.
τb = a0 + a1exp(−k/sinh)
3. Monitoring of Solar Radiation
The maximum solar radiation in a clear day is generally considered to provide the maximum sunshine effect on the temperature distribution in bridge structures. In this paper, the hourly global solar radiation and hourly diffuse solar radiation for eight cities in Fujian were measured using an automated meteorological station, as shown in Figure 1. The cities (from north to south) and the corresponding measurement dates are shown in Figure 2: Fu’an (10 August 2016), Jian’ou (7 August 2016), Fuzhou (2 August 2010), Ninghua (4 August 2016), Zhangping (27 July 2016). Anxi (2 August 2015), Hua’an (30 July 2016) and Zhangzhou (31 July 2014).
The measured hourly global and diffuse solar radiation curves for the eight cities on a clear day are illustrated in Figure 3a,b, respectively. The hourly beam solar radiation can be calculated by subtracting the measured hourly diffuse solar radiation from the corresponding hourly global solar radiation. The calculated hourly beam solar radiation curves are shown in Figure 3c. The variation trend for all hourly solar radiation curves are similar, with the solar radiation appearing at about 06:00, reaching the peak value at about 12:00, and disappearing at about 18:00.
The global solar radiation is related to parameters such as latitude, altitude and atmospheric quality. The influence of latitude on the global solar radiation in Fujian is negligible, because all cities are located between 23° and 28° northern latitude. The maximum measured global solar radiation for Ninghua (about 1100 W/m2) was the highest among all cities, because this city has the highest altitude (as shown in Figure 3a). However, the difference between maximum global solar radiation values for different cities was not large (about 100 W/m2). The maximum measured diffuse solar radiation and the calculated beam solar radiation were in Fu’an (about 250 W/m2) and Ninghua (about 900 W/m2), respectively, as illustrated in Figure 3b,c. The difference between maximum diffuse or beam solar radiation values for different cities was about 150 W/m2.
4. Estimation Model for Solar Radiation in Fujian
4.1. Estimation Model for Daily Global Solar Radiation
As discussed earlier, the Ångström–Page equation [10,11] was chosen in this study to predict the daily global solar radiation for different cities in Fujian. The daily global solar radiation (averaged over one month) for the entire Fujian cannot be determined because only two meteorological stations in Fuzhou and Jian’ou provide such data. Instead, the daily global solar radiation (averaged over one month) from 1983 to 2005 provided in a U.S. NASA database was used in this analysis, since the NASA database is used by many researchers when meteorological data are lacking [54,55,56]. The NASA database divides the map of China into grids based on the longitude and latitude and provides data for each grid point. The validity of the data in NASA database has been verified by comparing with solar radiation data from 88 meteorological stations in China measured before 2010 [57].
The daily astronomical solar radiation can be calculated using earth–sun distance, solar elevation, duration of sunlight and so on [11]. The historical average sunshine duration (averaged over one month) since 1951 for four cities in Fujian (Nanping, Fuzhou, Yong’an and Xiamen) can be obtained from the National Meteorological Information Center, China Meteorological Administration [58]. The average maximum possible sunshine duration (averaged over one month) can be calculated using the following equation:
where ωs is the sunset hour angle. The empirical coefficients a’ and b’ for different cities in Fujian can be calculated by using a linear regression analysis between the clearness index H/HC and the sunshine duration fraction S/S0.
S0 = (2ωs/15) × (180/π)
4.1.1. Influence of Time Scale on Empirical Coefficients
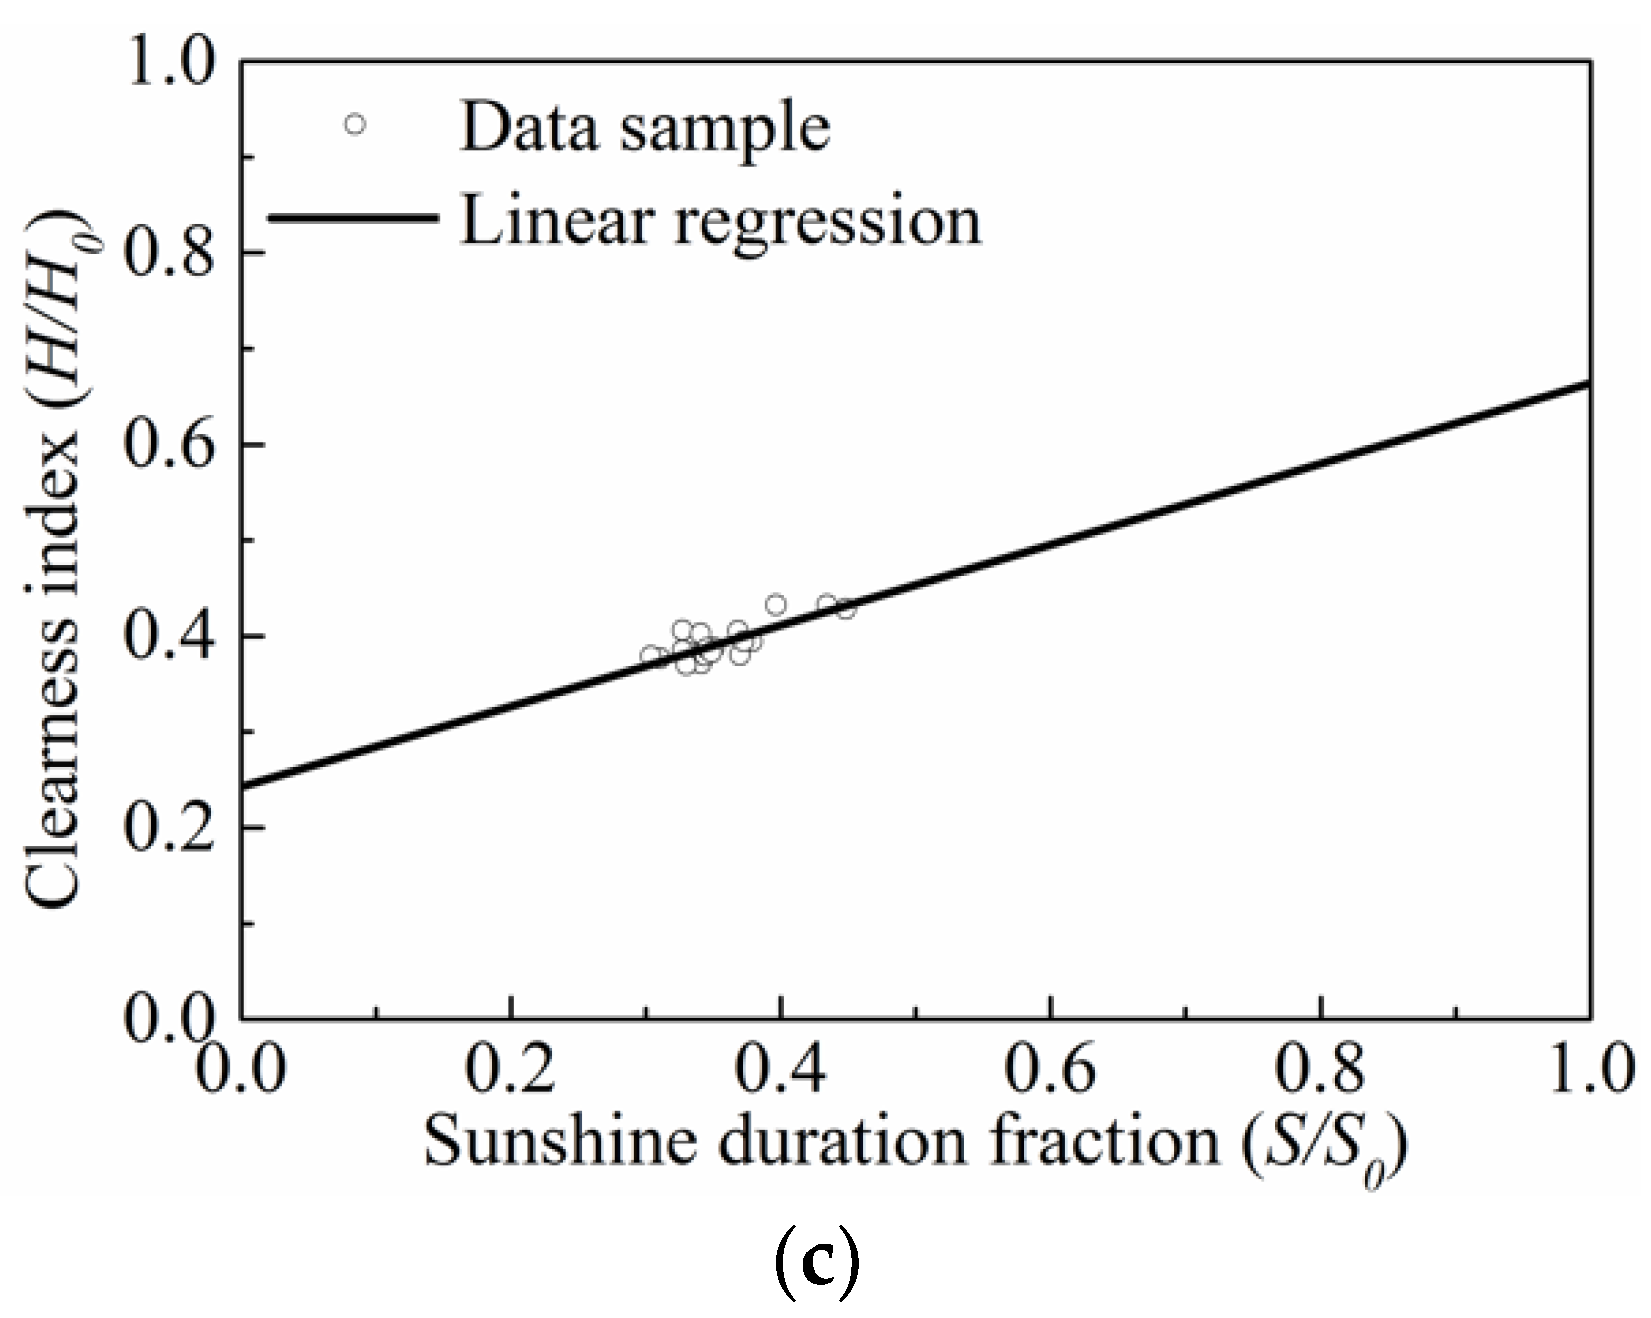
The daily clearness index and the sunshine duration fraction (both averaged over one month) were chosen by Ångström and Page [10,11]. The daily solar radiation data measured by 36 meteorological stations in China were compared with the calculated daily solar radiation using different time scales. The accuracy of estimated solar radiation using the monthly time scale is higher than those using daily or yearly time scales [59]. Fuzhou was chosen as an example to analyze the influence of different time scales (daily, monthly and yearly) on the empirical coefficients in the Ångström–Page equation. The results are listed in Table 1 and illustrated in Figure 4, in which the hollow points denote the data and the solid line denotes the linear regression. The coefficient of correlation (γxy) for the linear regression analysis using the monthly time scale is the largest among different time scales. Moreover, the root-mean-square error (RMSE) using the monthly time scale is the smallest. As a result, the monthly time scale was chosen to calculate the empirical coefficients in the Ångström–Page equation.
4.1.2. Influence of Sunshine Duration on the Empirical Coefficients
Aside from the time scale, the actual sunshine duration would also affect the empirical coefficients in the Ångström–Page equation. The measured average sunshine duration (averaged over one month) since 1951 for four cities in Fujian can be obtained from National Meteorological Information Center, China Meteorological Administration [58]. Hua’an was chosen as an example to illustrate the influence of sunshine duration on the empirical coefficients. The results listed in Table 2 show that the coefficient of correlation obtained using the sunshine duration are largest for Xiamen, which is nearest to Hua’an. Moreover, the root-mean-square error obtained by using the sunshine duration of Xiamen is the smallest. Consequently, the empirical coefficients for cities in the Fujian that did not have measured sunshine duration data can be predicted using the available sunshine duration for the nearest city (Nanping, Fuzhou, Yong’an, or Xiamen).
4.1.3. Verification of Ångström–Page Equation
To verify the applicability and accuracy of the Ångström–Page equation in Fujian, the accuracy of linear regression estimates for all eight cities are listed in Table 3. For all cities, the coefficients of correlation are larger than 0.84, and the root-mean-square errors are less than 0.05. Therefore, the accuracy of the Ångström–Page model is considered good, and this model can be used to predict the global solar radiation for different cities in the Fujian.
4.2. Estimation Model for Hourly Global Solar Radiation
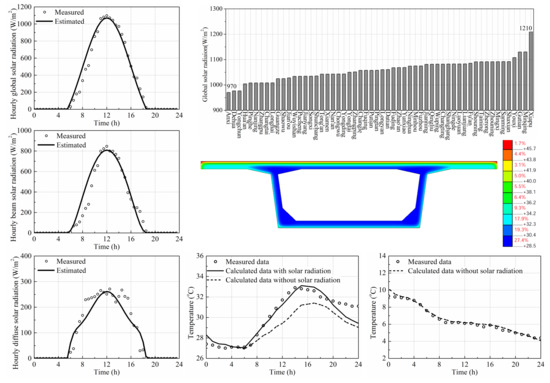
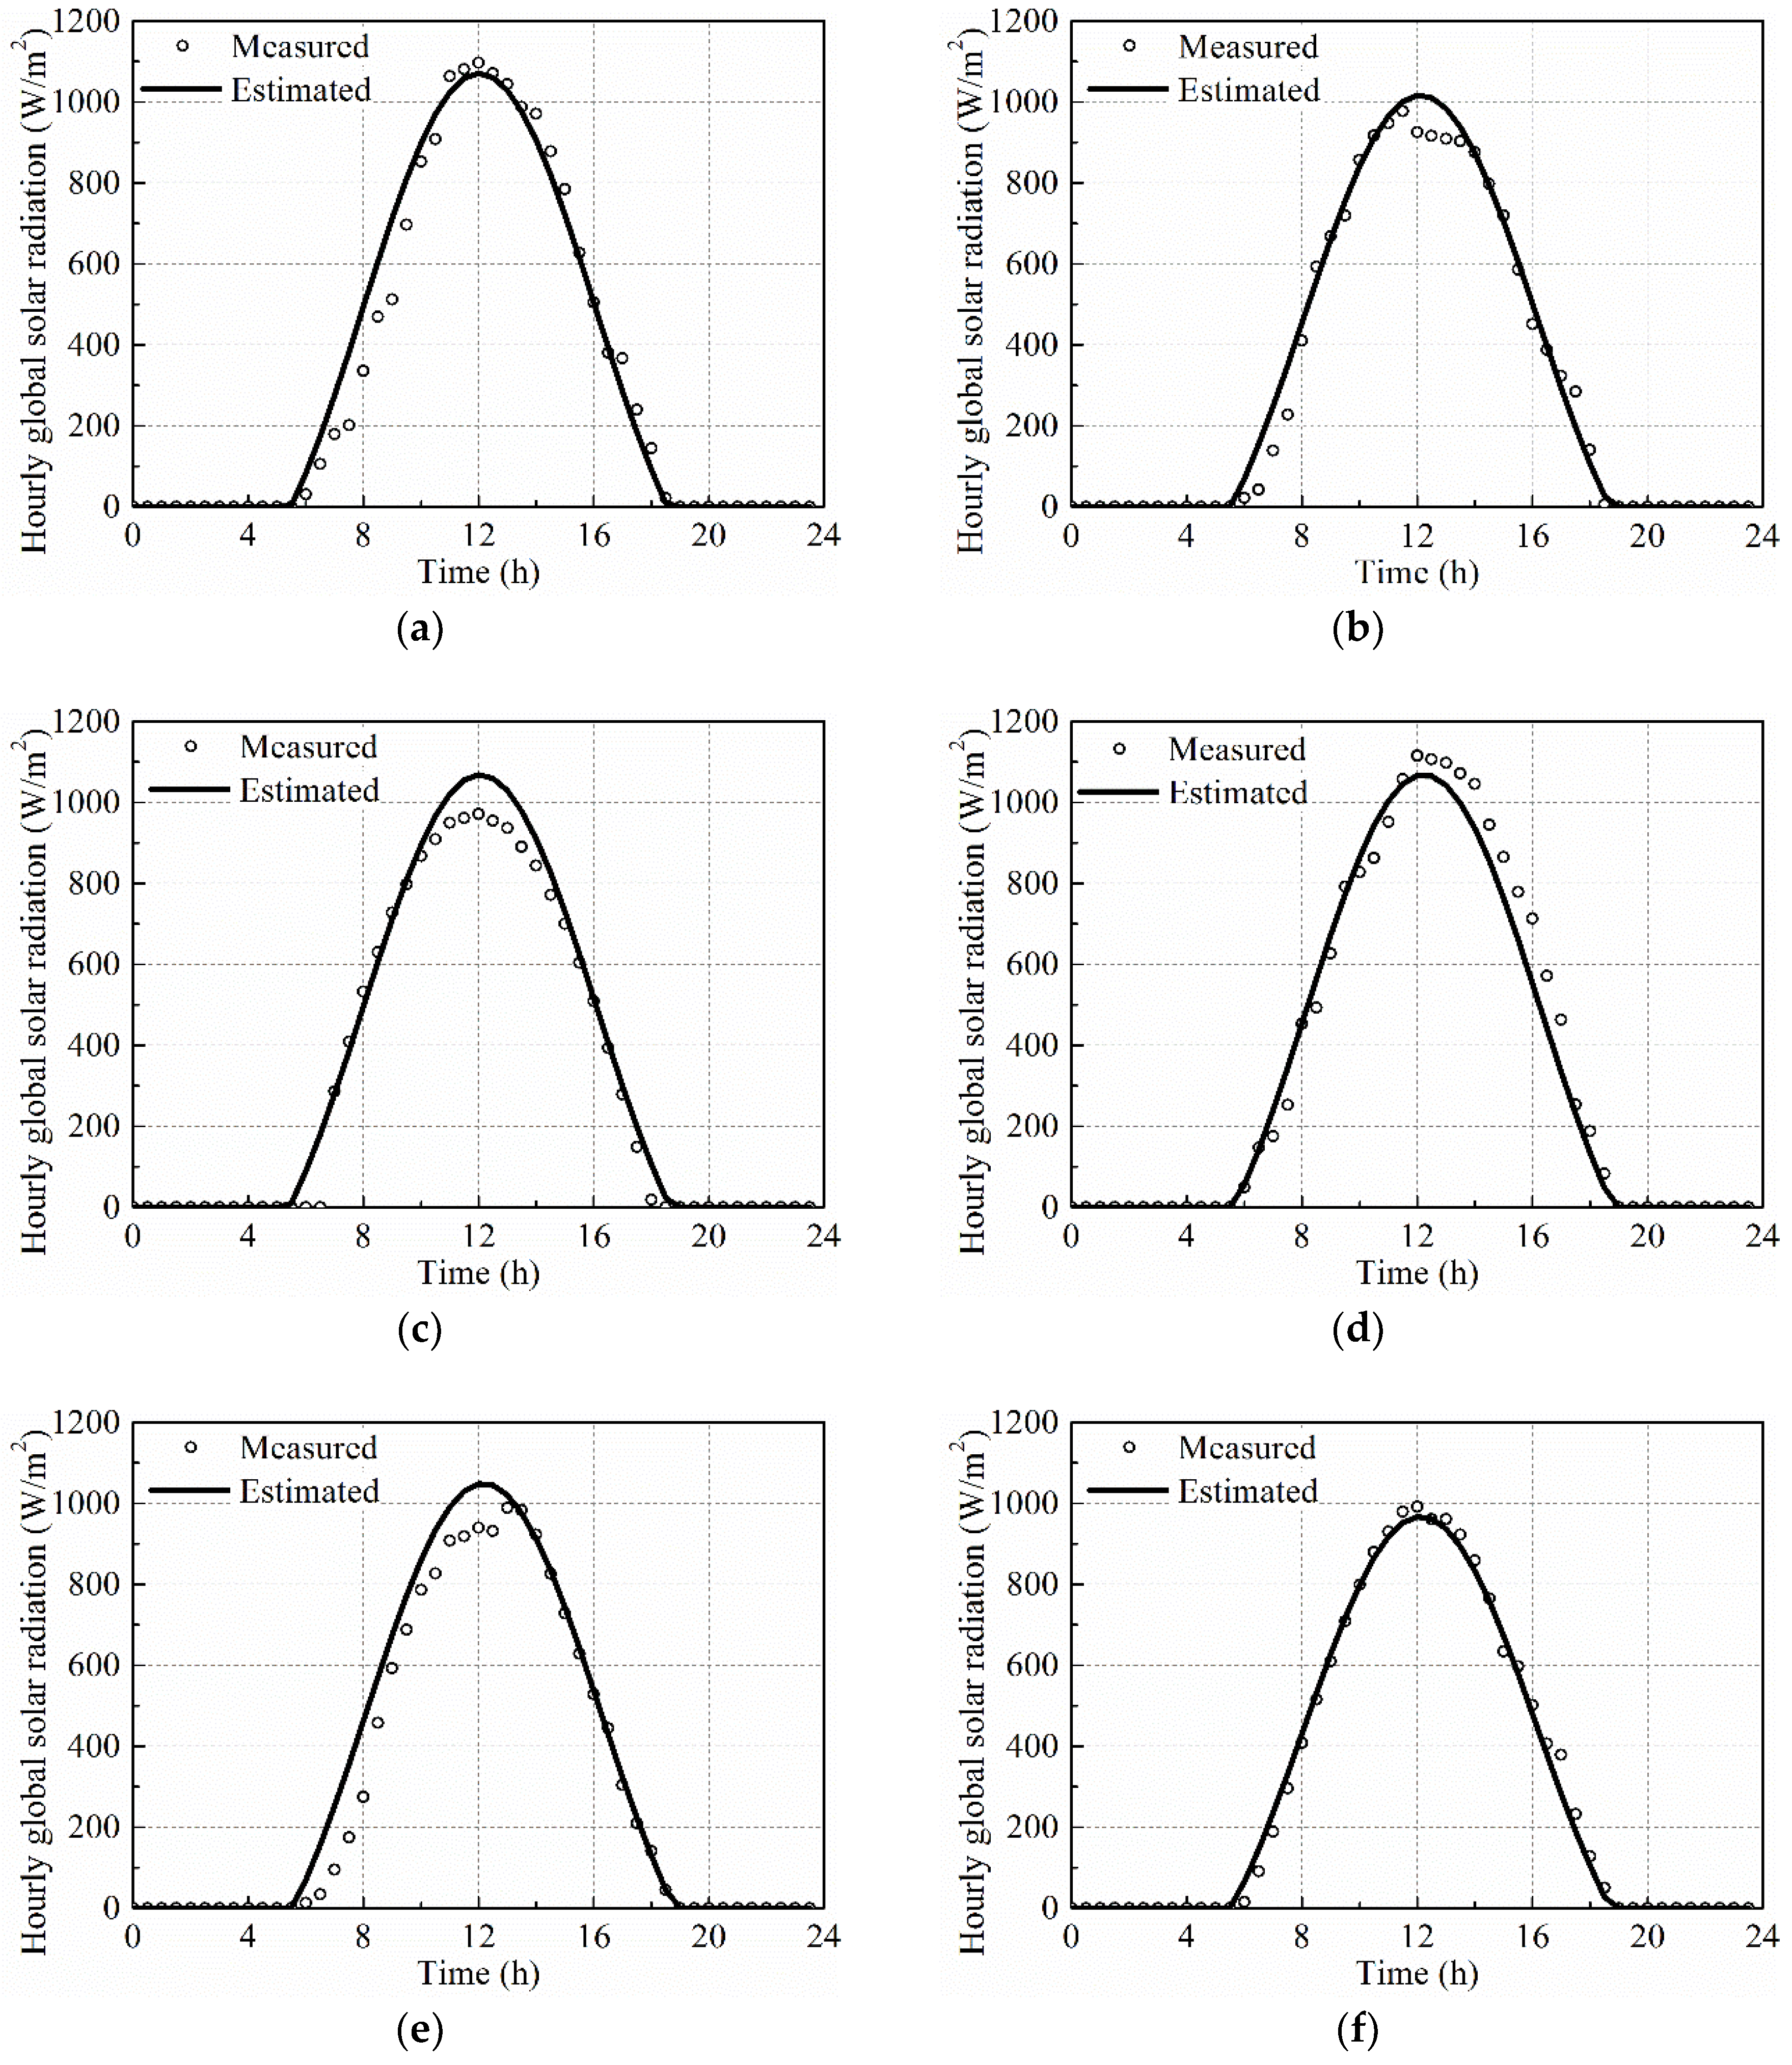
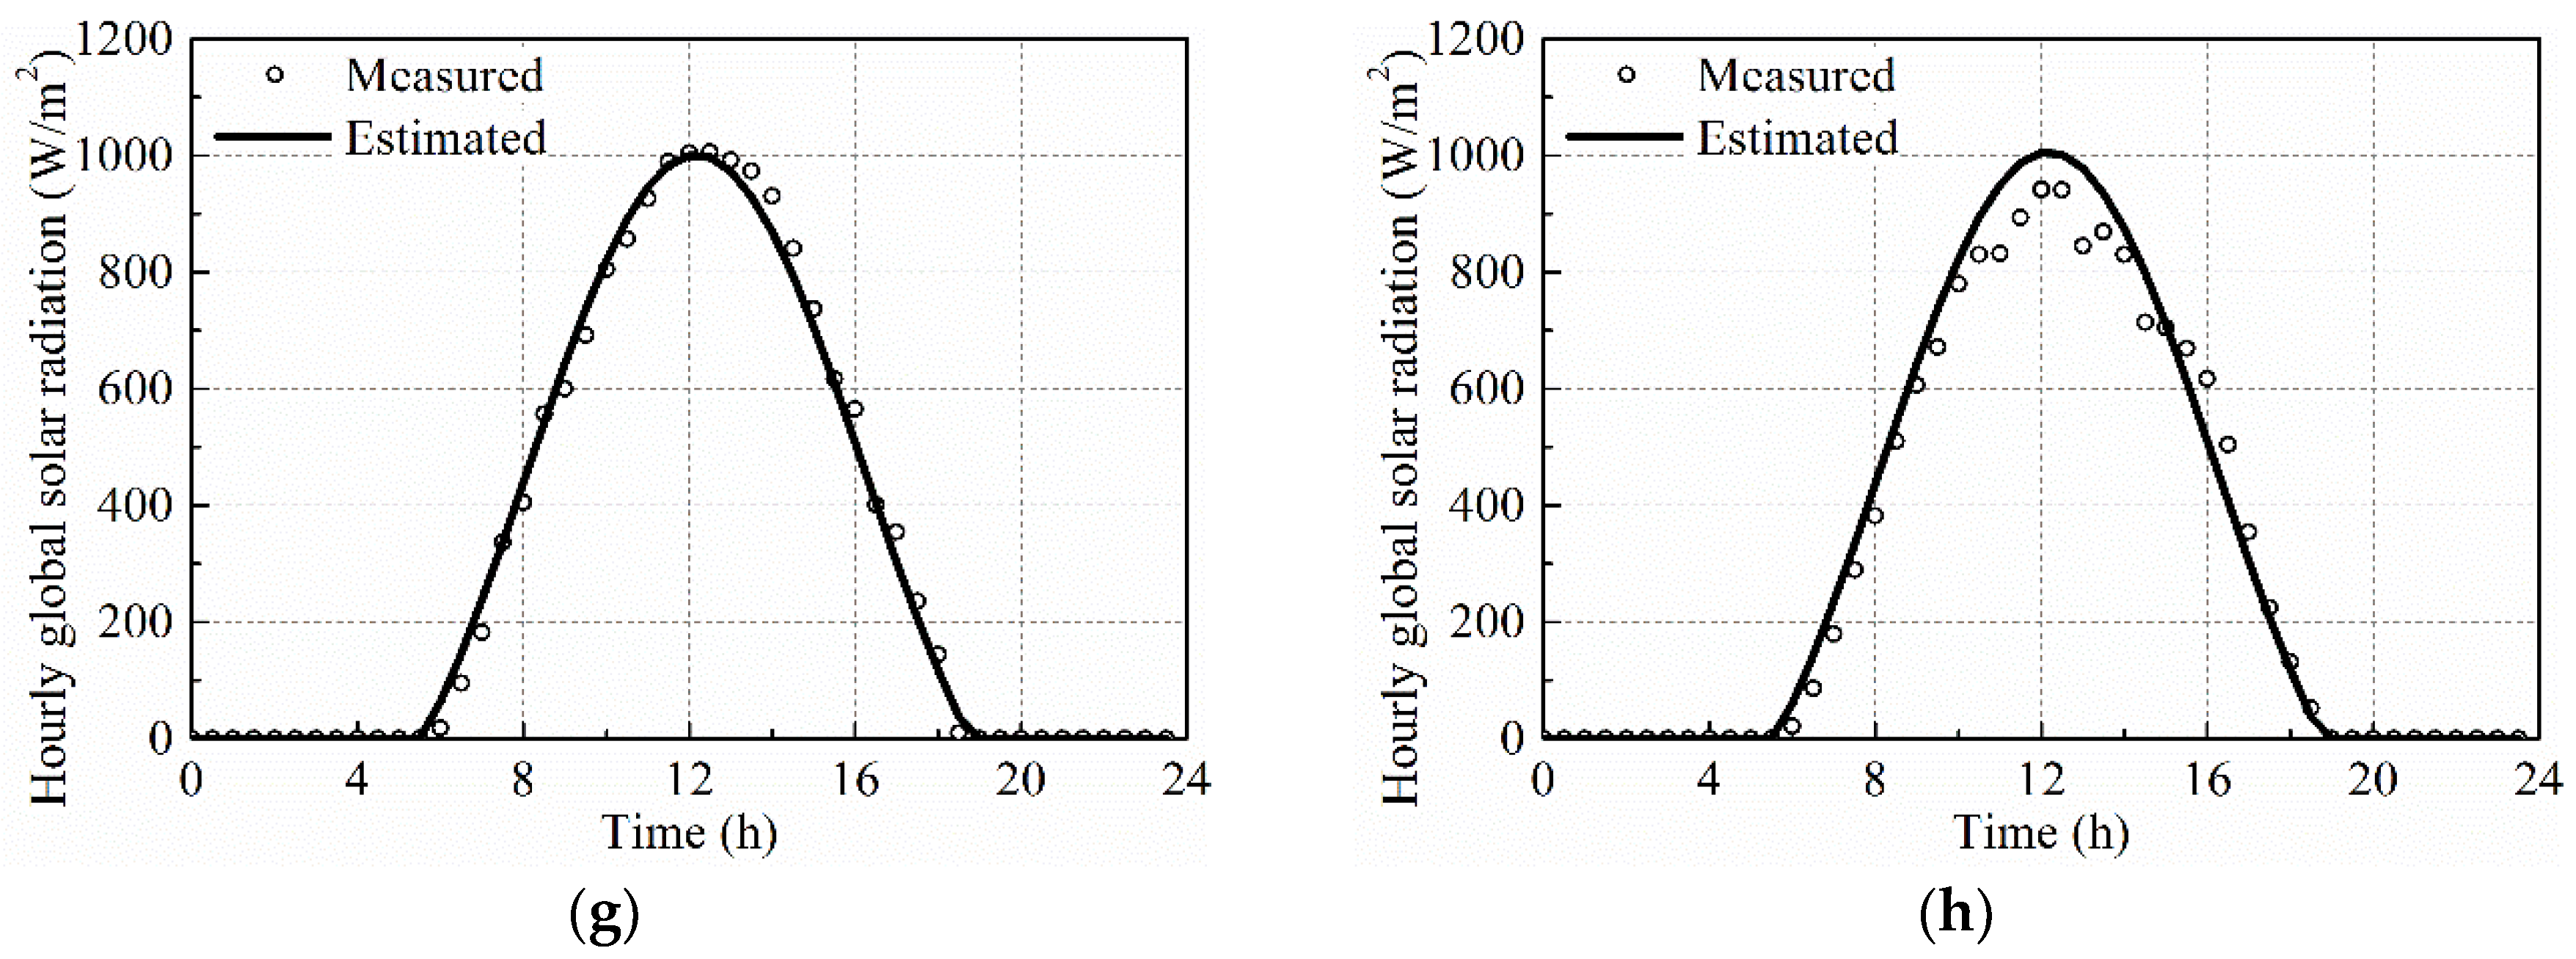
As discussed in Section 2.1.2, the Collares-Pereira and Rabl equation was chosen to estimate the hourly global solar radiation for different cities in Fujian based on the corresponding daily global solar radiation. The sunshine duration for the eight cities were measured on site. Fuzhou was chosen as example to estimate the hourly global solar radiation. The measured and estimated hourly global solar radiation curves for different cities are compared in Figure 5, with the hollow point denoting the measured values and the solid line showing the estimated results. The minimum coefficients of correlation for all eight cities is 0.989. Therefore, the hourly global solar radiation for different cities in Fujian can be accurately predicted by the Collares-Pereira and Rabl equation.
4.3. Estimation Model for Hourly Beam and Diffuse Solar Radiation
4.3.1. Estimation Model for Hourly Beam Solar Radiation
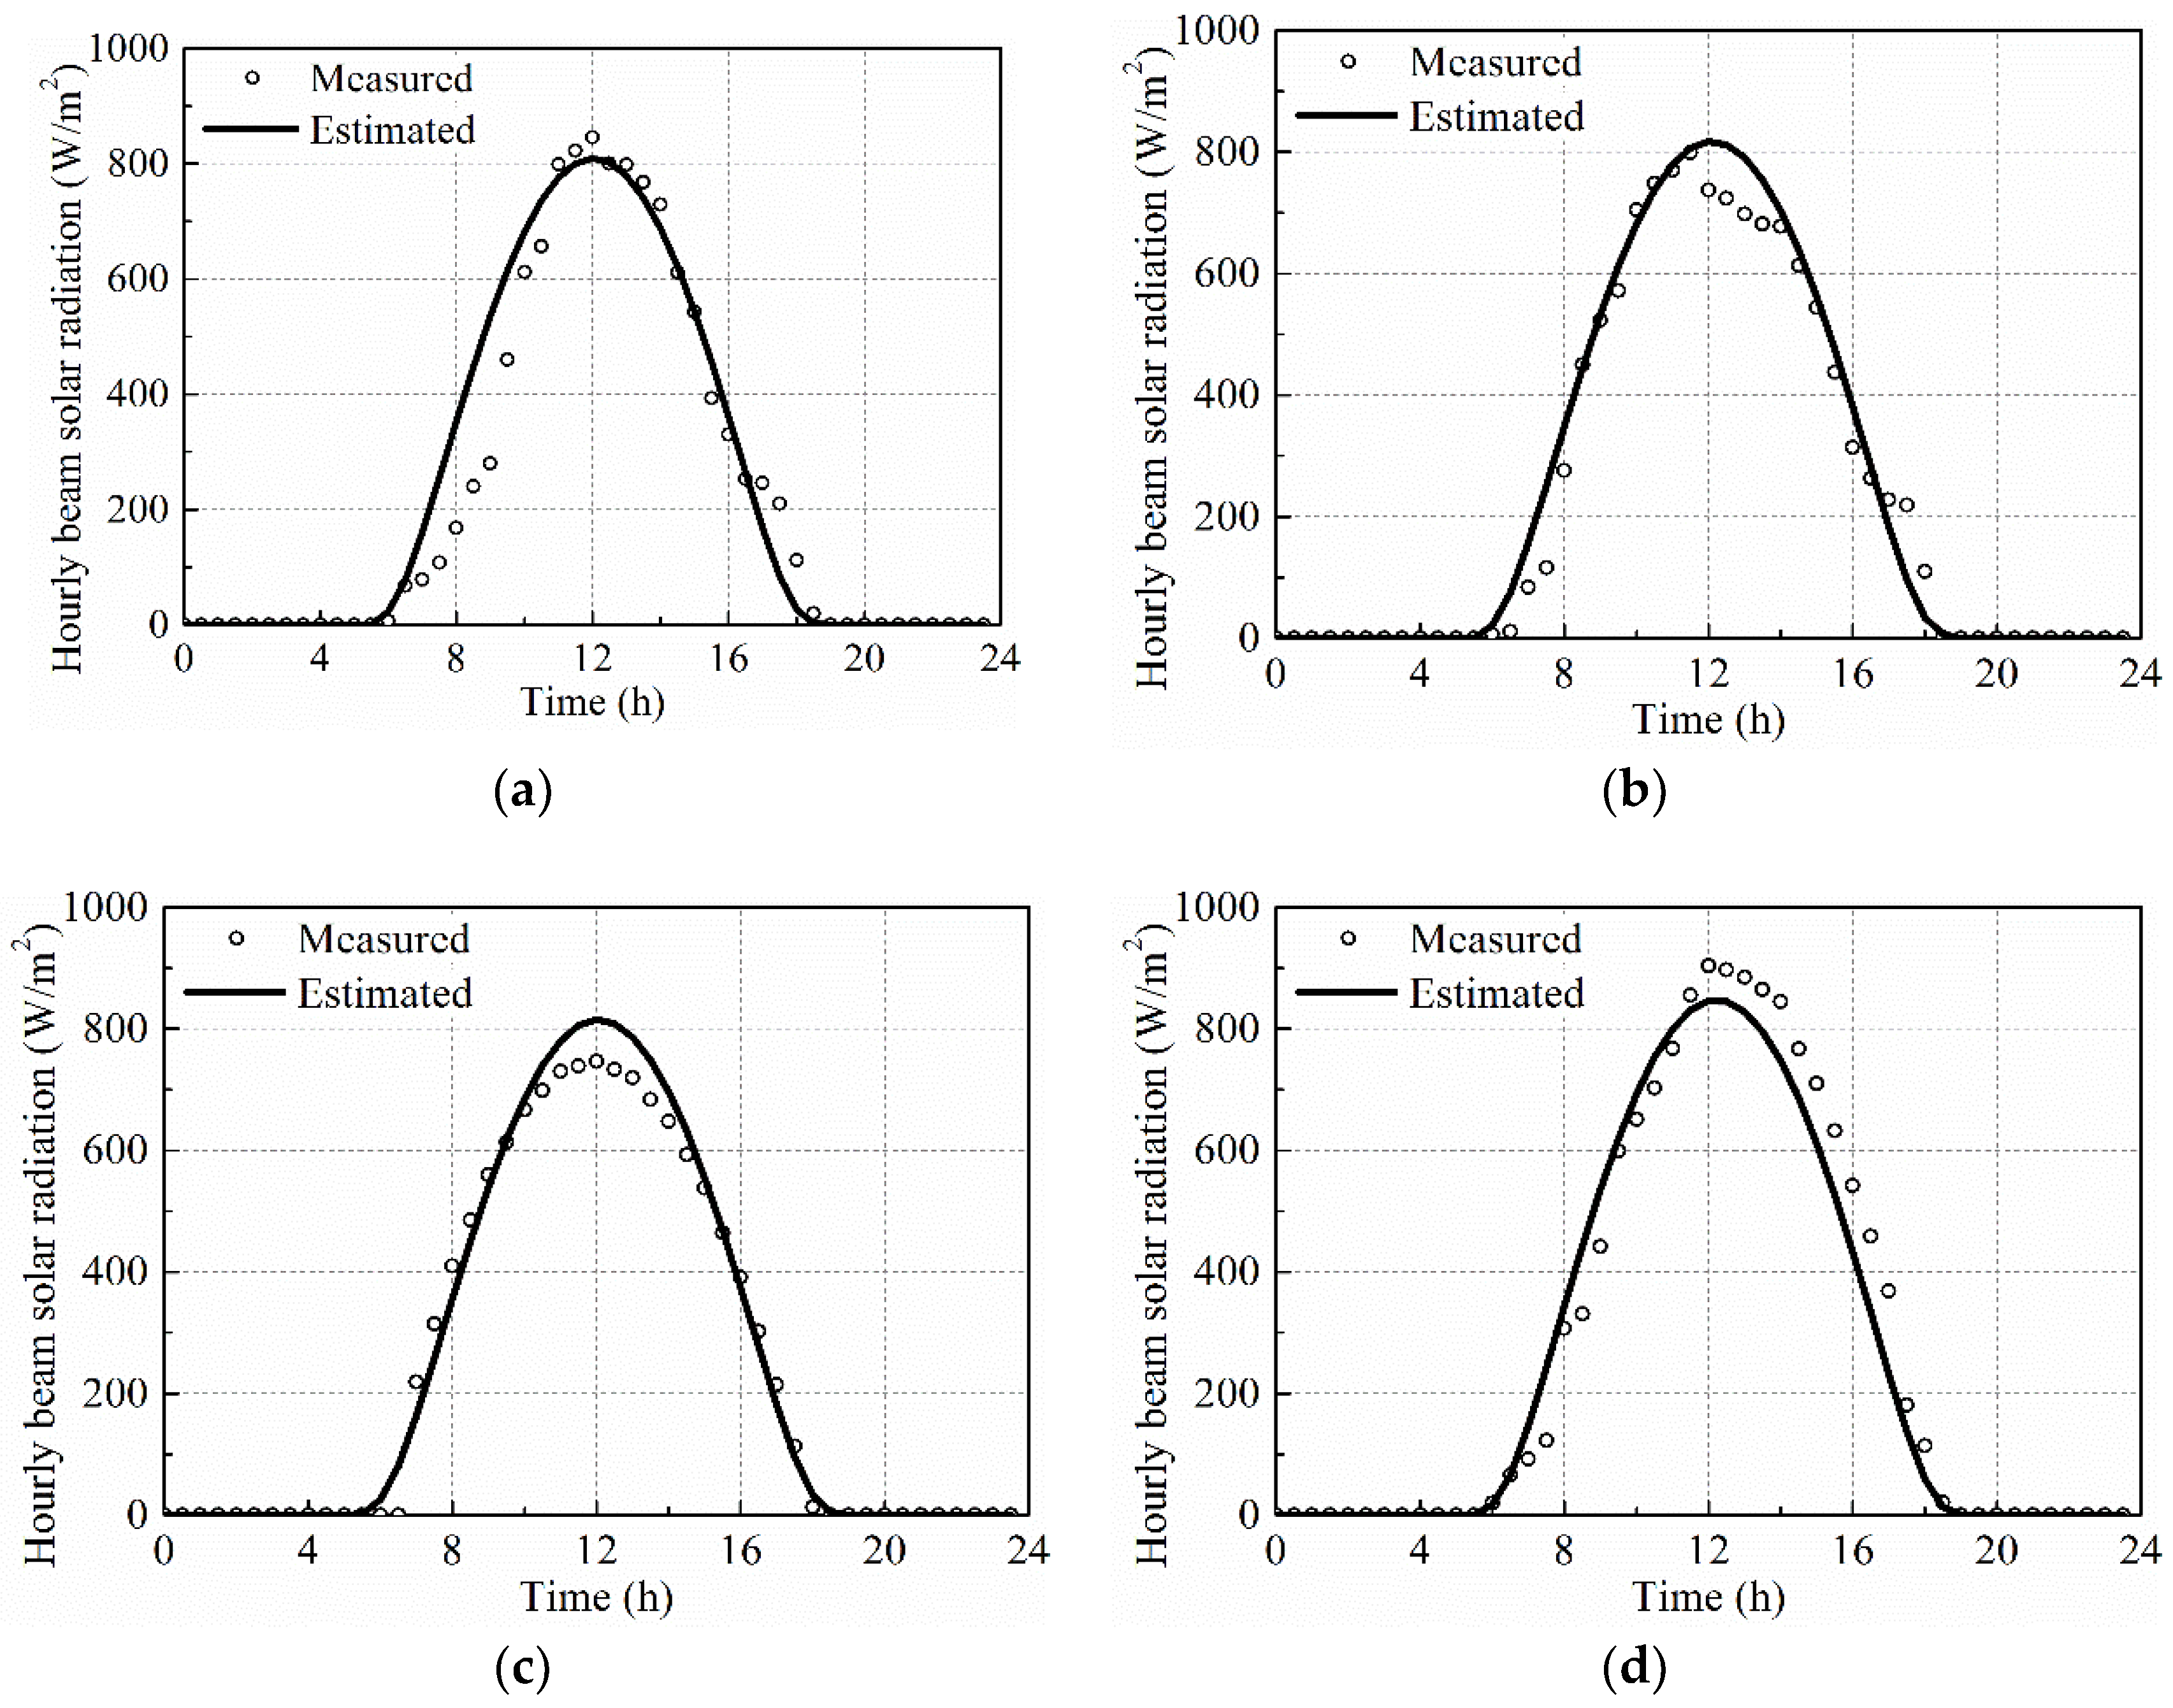
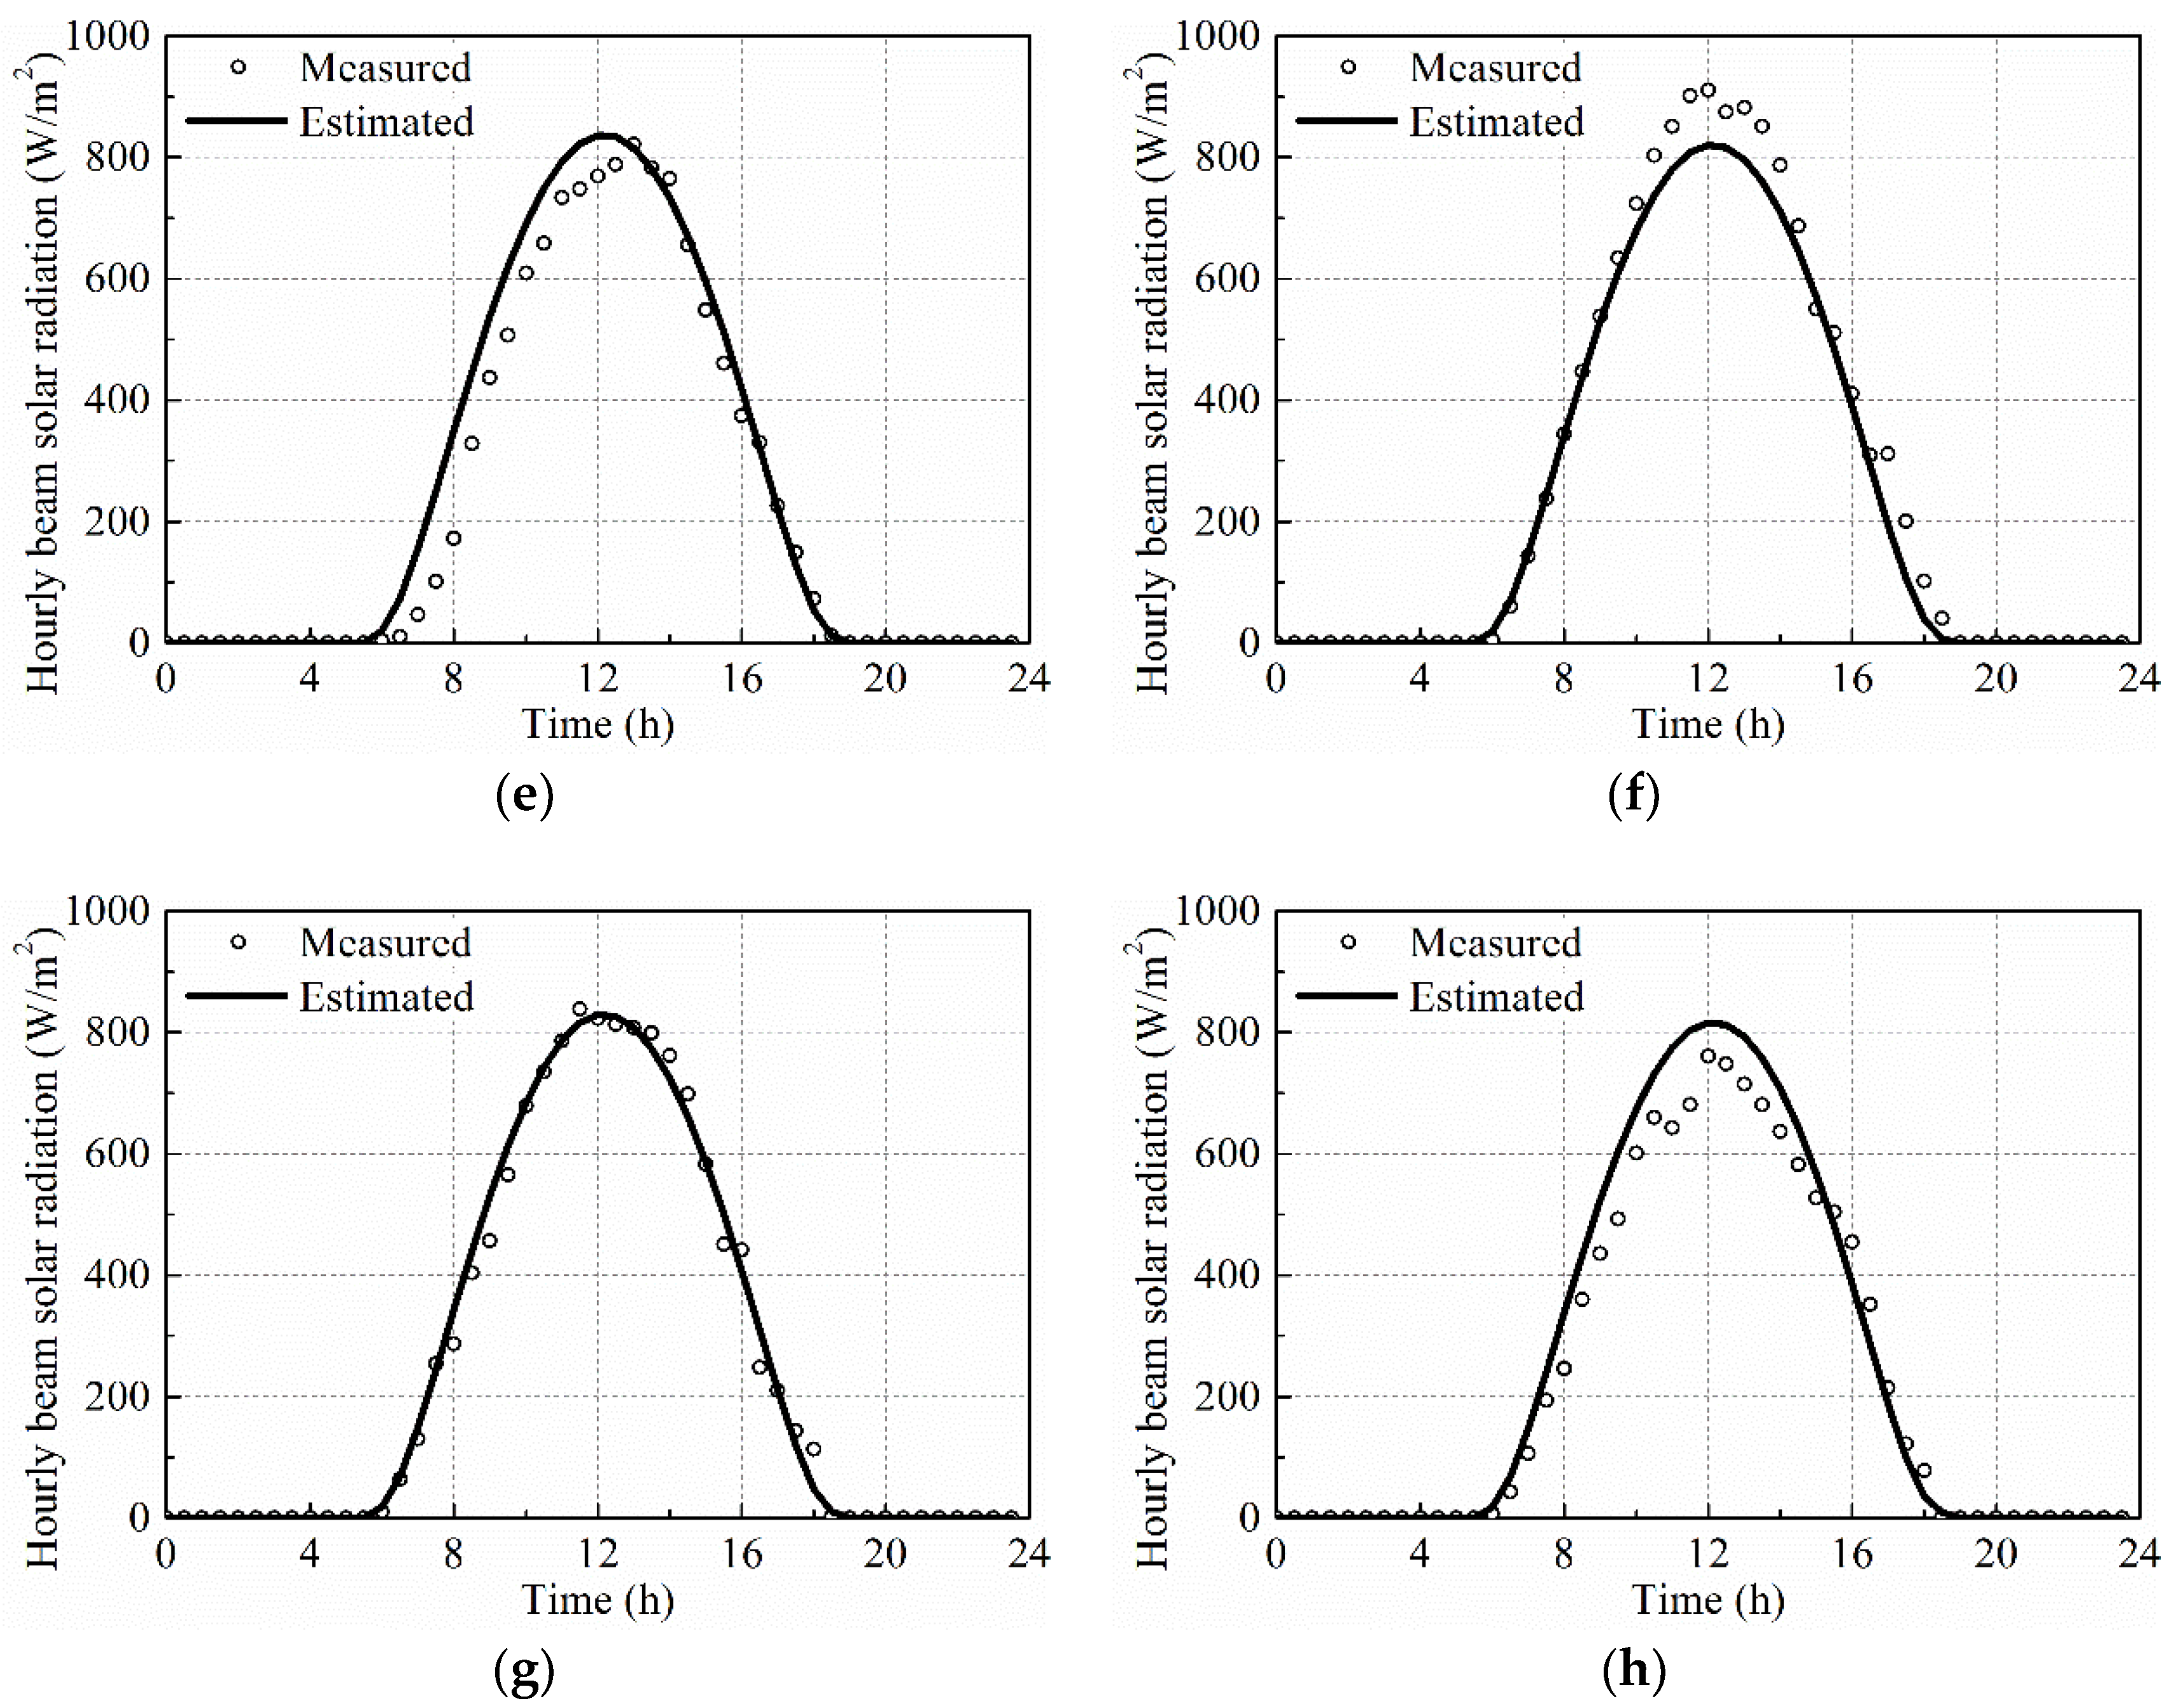
Global solar radiation should be separated into beam and diffuse solar radiation to analyze the temperature distribution on bridge girder cross-sections. As discussed earlier, the Hottel equation was chosen to predict the hourly beam solar radiation for different cities in Fujian. The measured and estimated hourly beam solar radiation curves for the eight cities in Fujian are compared in Figure 6, in which the hollow points denote the measured values and the solid line denotes the estimated results. The minimum coefficients of correlation for all eight cities is 0.974. Therefore, the hourly beam solar radiation for different cities in Fujian can be accurately predicted by the Hottel equation.
4.3.2. Estimation Model for Hourly Diffuse Solar Radiation
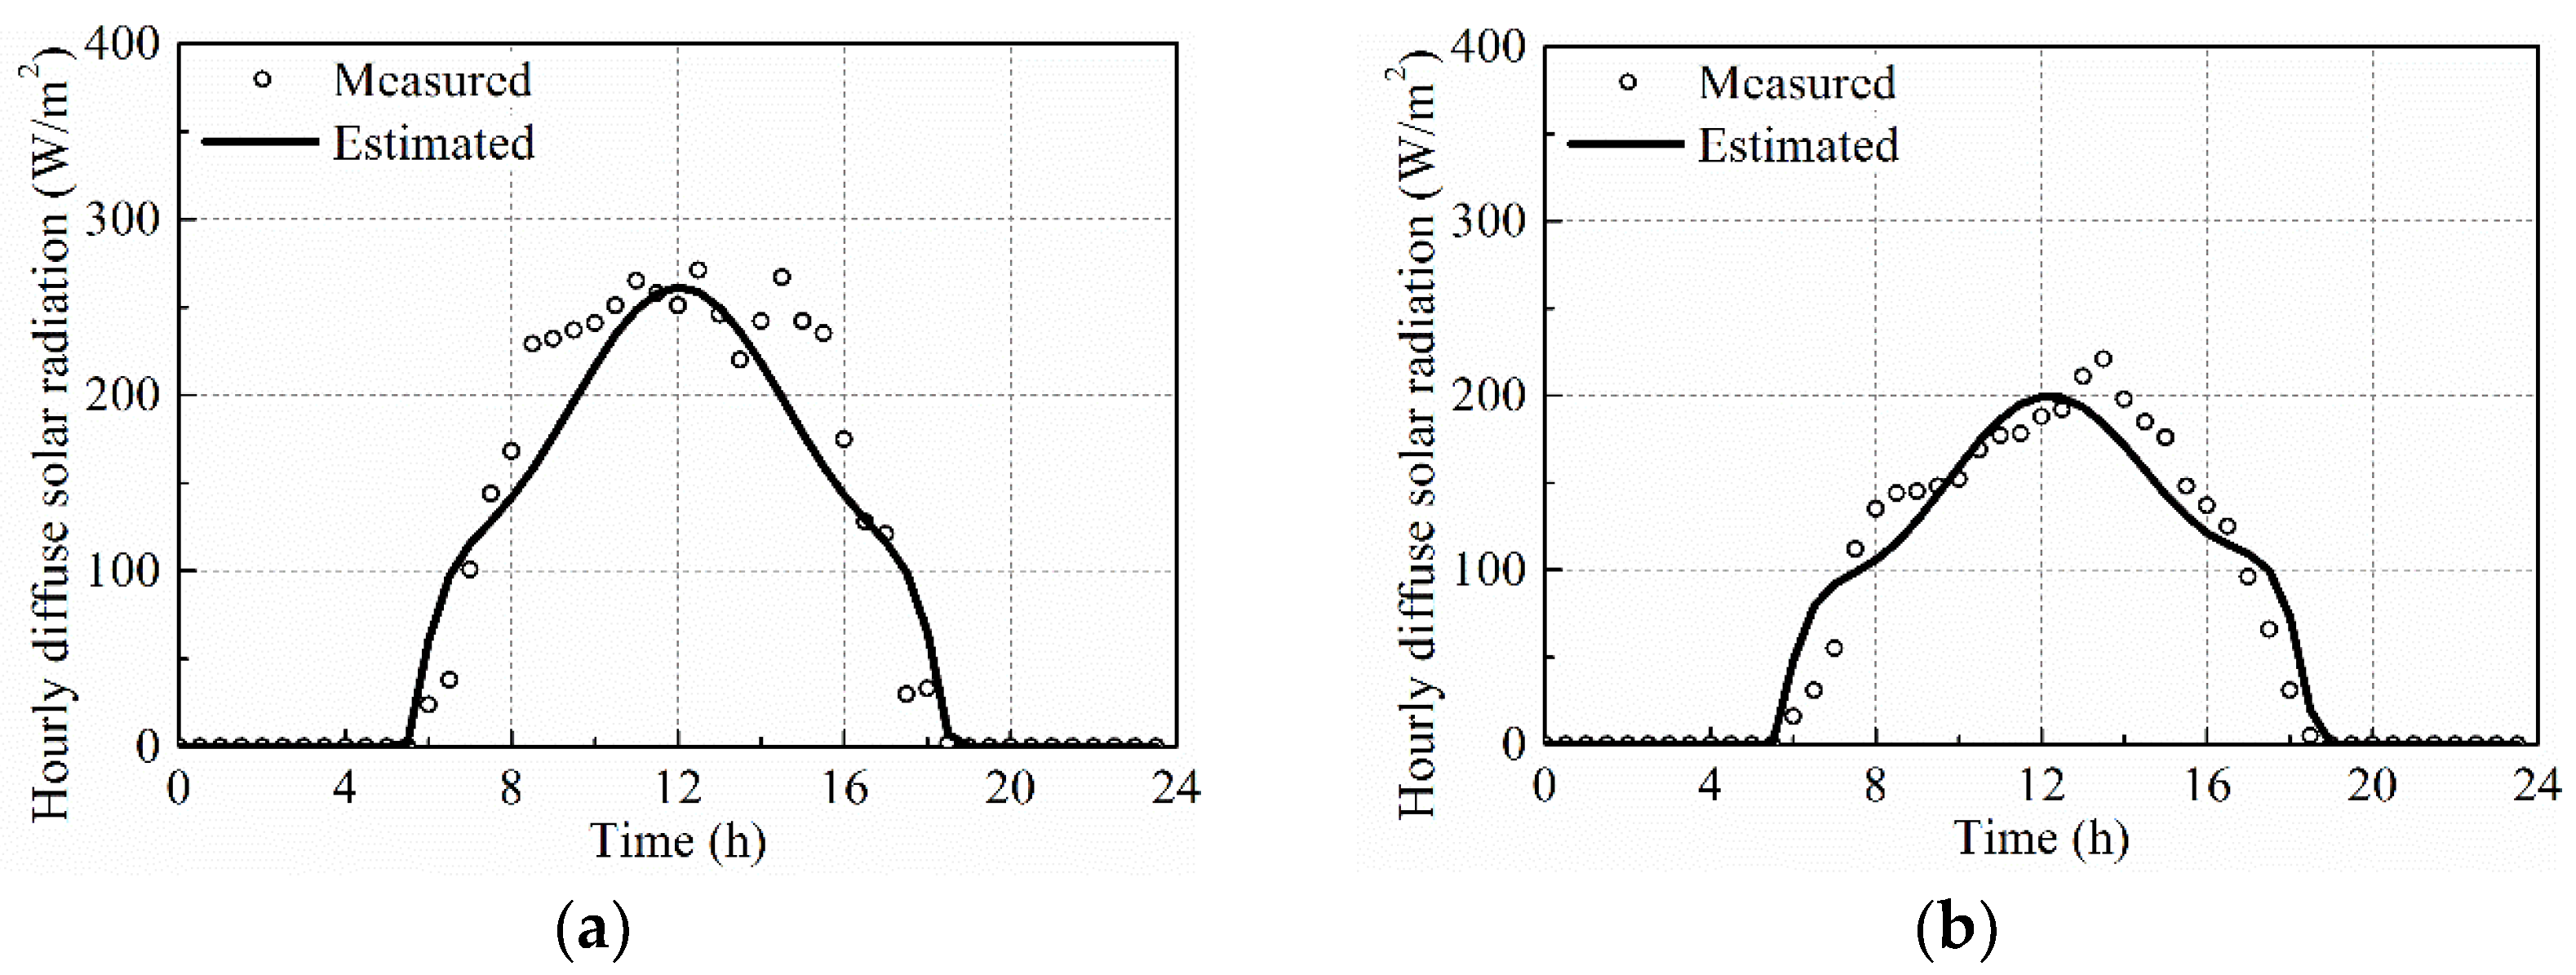
The hourly diffuse solar radiation can be calculated by subtracting the hourly beam solar radiation from the corresponding hourly global solar radiation. The measured and estimated hourly diffuse solar radiation curves for the eight cities in Fujian are compared in Figure 7, in which the hollow points denote the measured values and the solid line denotes the estimated results. The minimum coefficients of correlation for all eight cities is 0.948. Therefore, the estimated hourly diffuse solar radiation curves are close to the measured values.
5. Solar Radiation in Fujian
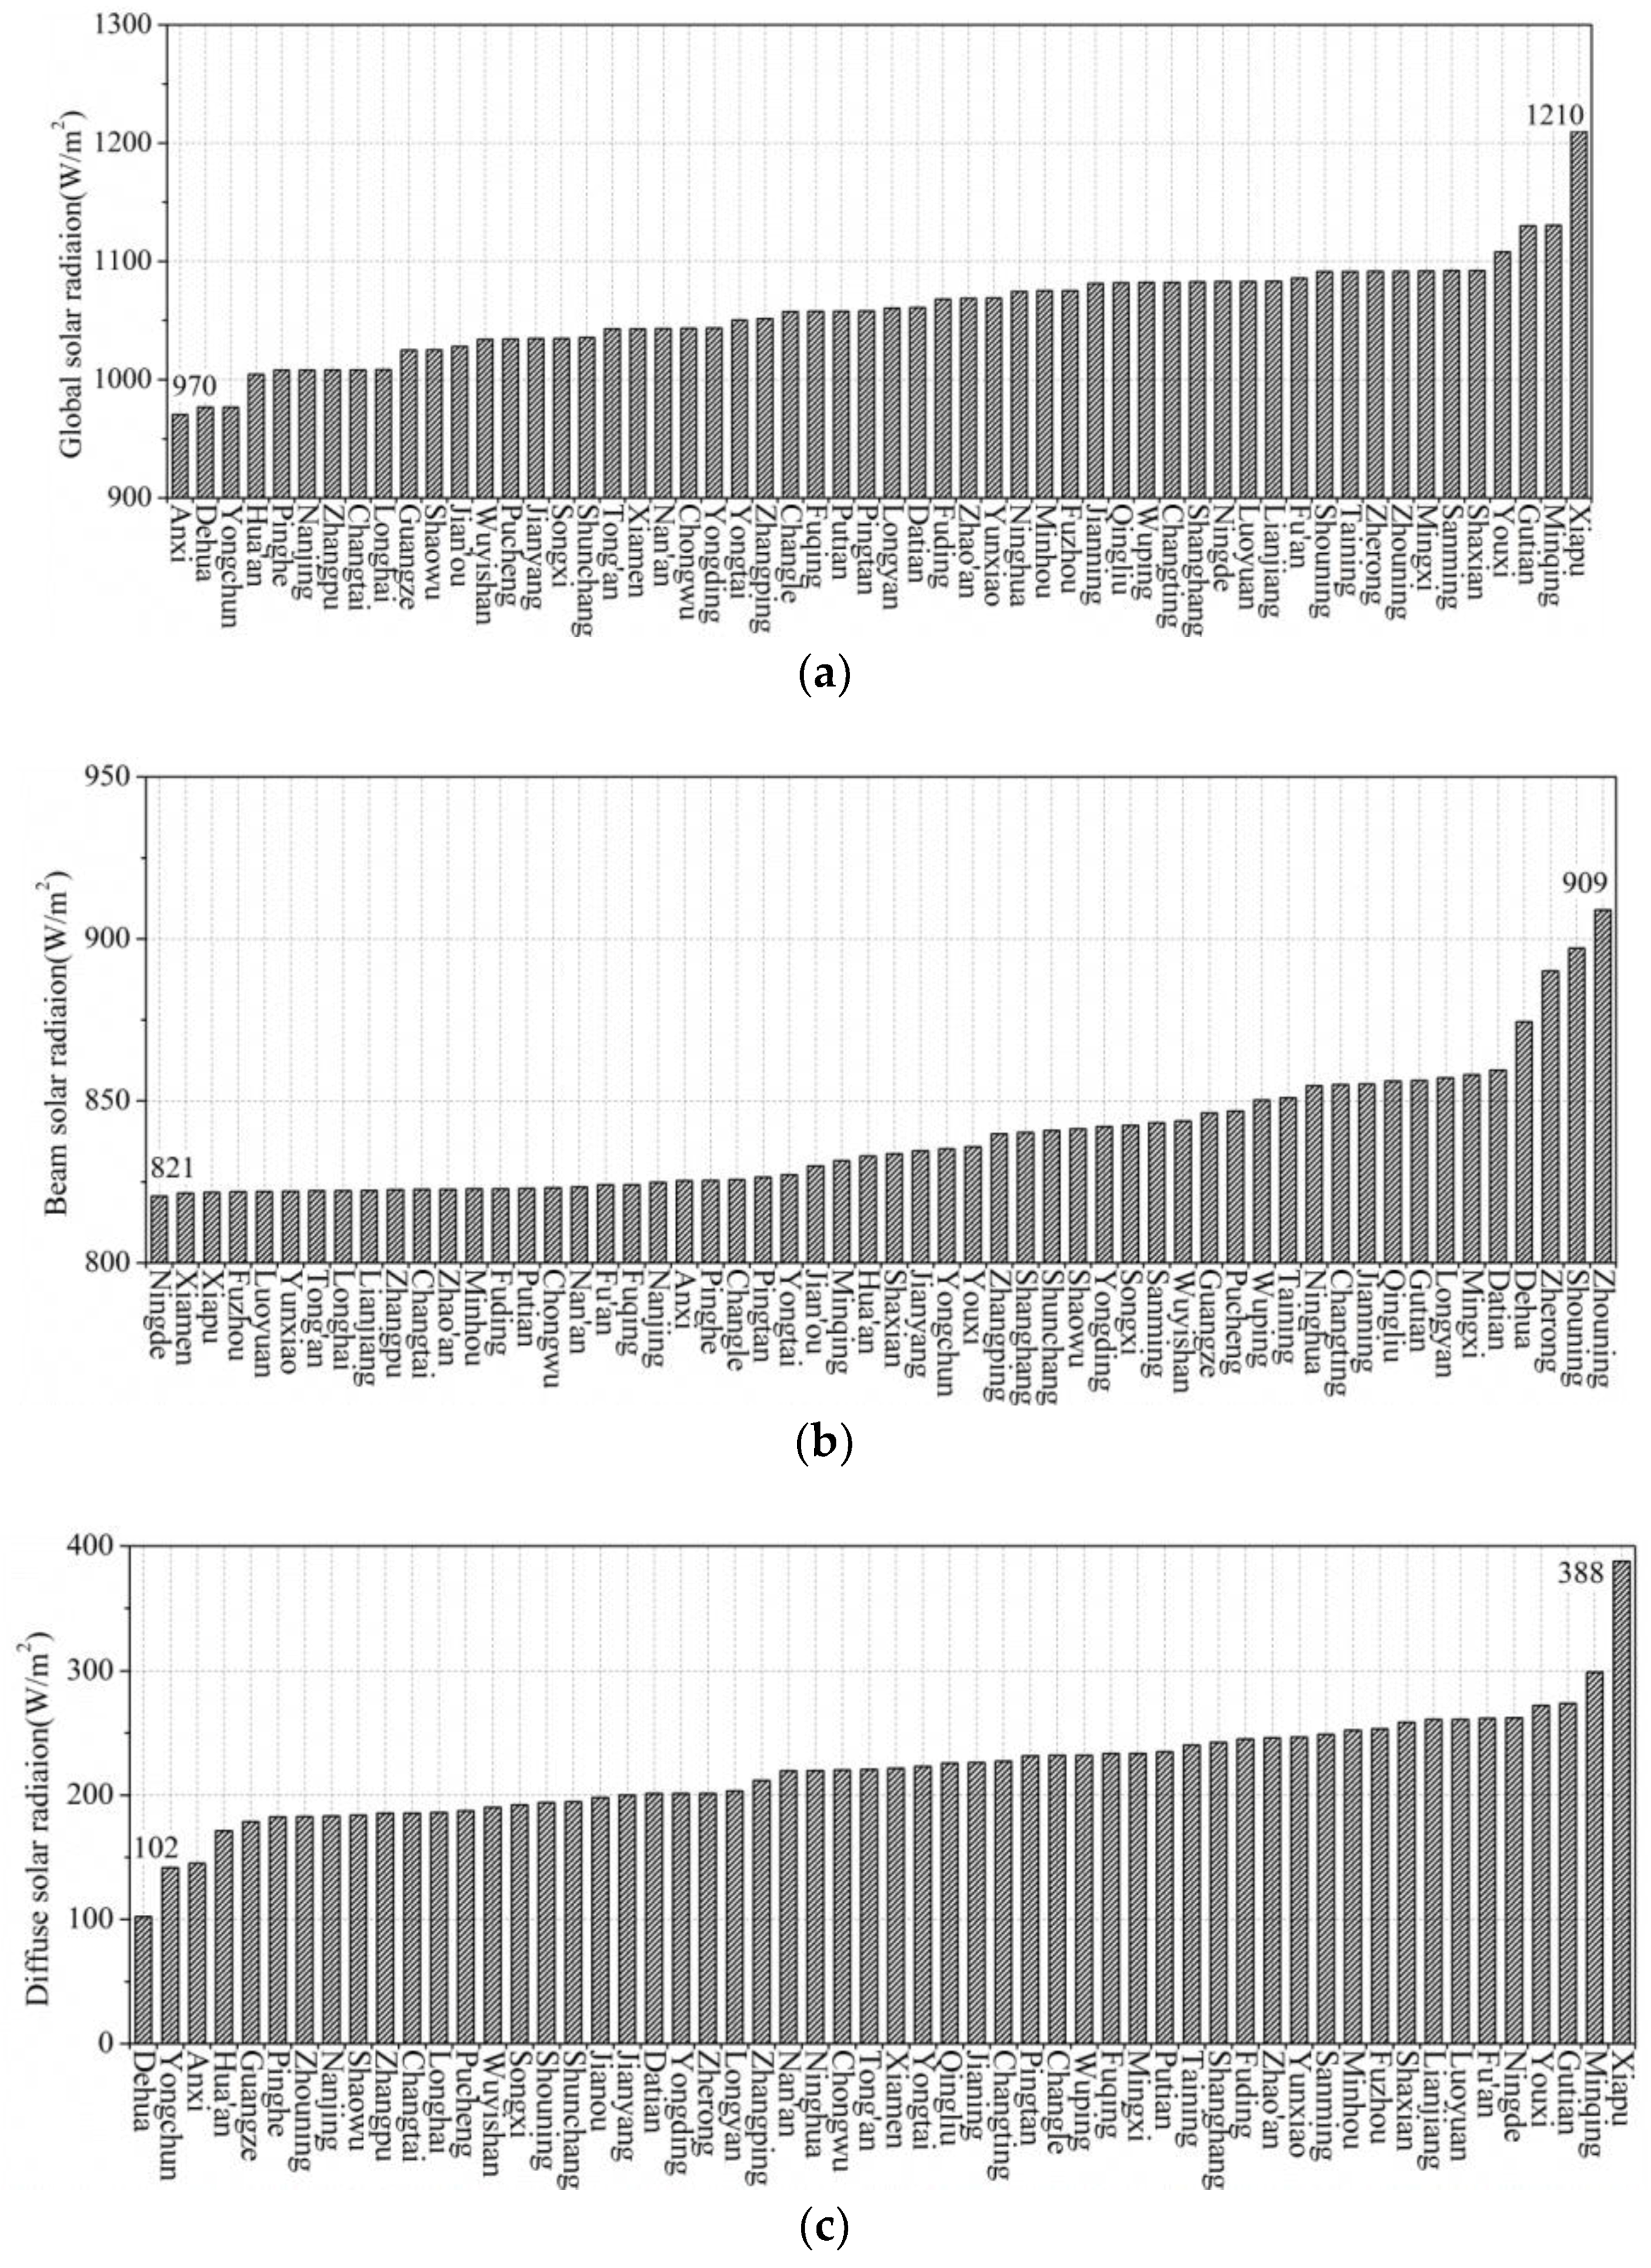
The maximum values of the global, beam and diffuse solar radiation (for summer solstice, 21 June) for 56 cities in Fujian were calculated using the models described in Section 3, and are illustrated in Figure 8. The maximum global solar radiation for Xiapu (about 1210 W/m2) is the highest and the maximum global solar radiation for Anxi (about 970 W/m2) is the lowest among all cities, as shown in Figure 8a. The biggest difference among the global solar radiation maxima in different cities is about 240 W/m2. The maximum beam solar radiation for Zhouning (about 909 W/m2) is the highest, and the maximum beam solar radiation for Ningde (about 821 W/m2) is the lowest among all cities, as shown in Figure 8b. The biggest difference among the beam solar radiation maxima for different cities is about 88 W/m2. The maximum diffuse solar radiation for Xiapu (about 388 W/m2) is the highest and the maximum diffuse solar radiation for Dehua (about 102 W/m2) is the lowest among all cities, as shown in Figure 8c. The biggest difference among the diffuse solar radiation maxima for different cities is about 286 W/m2.
6. Influence of Solar Radiation on Temperature Distribution on Bridge Girder Cross-Sections
6.1. Box Girder Bridge
6.1.1. Finite Element Model
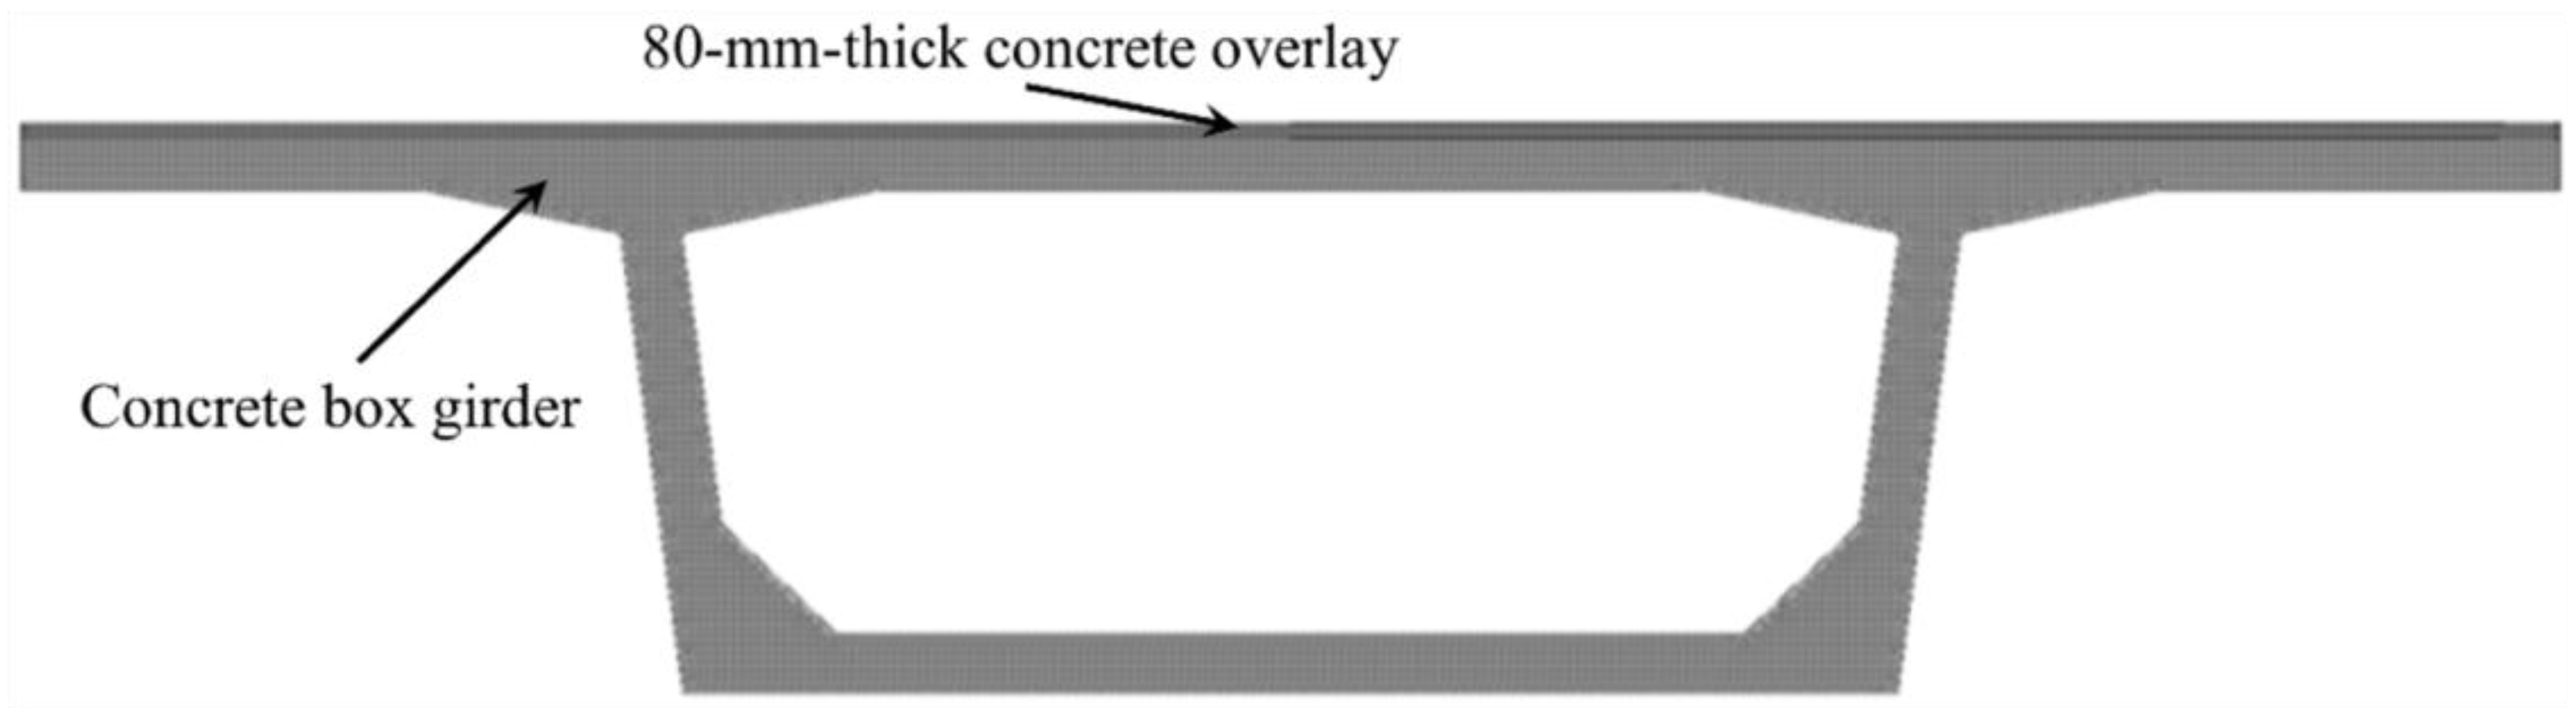
One 8-span continuous prestressed concrete box girder bridge in Fuzhou was chosen as case study. The dimensions of girder cross-section and the installation locations of temperature sensors are illustrated in Figure 9. The thickness of the concrete overlay is 80 mm. Four temperature sensors were installed near the external surfaces of the top flange (A–T), east web (A–E), west web (A–W) and bottom flange (A–B) to measure the air temperature at different parts of the box girder. One temperature sensor was hung in the box girder (A–I) to measure the air temperature inside the box girder. Six temperature sensors were installed in the concrete within the east web, west web and bottom flange, of which three were near the external surface (EW-1, WW-1 and B-1) and three were near the internal surface of each component (EW-2, WW-2 and B-2). The meteorological data, including hourly global solar radiation, hourly diffuse solar radiation and wind speed, were measured by an automated meteorological station. The monitoring period was from 1 April 2010 to 31 March 2011 and the time increment between measurements was one hour.
The software Midas was chosen to establish the finite element model of the cross-section of box girder (Figure 9) based on a heat-conduction model. A 2D plane strain element can used for steady-state or transient analyses. The ambient air temperature data were obtained from the temperature sensors installed near the external surfaces of the box girder. The solar radiation was calculated using the estimation models described earlier. The effects of solar radiation and convective and radiative heat transfer were considered at the external surfaces of the box girder. The surface heat transfer coefficient and the temperature of the surrounding fluid medium were input as boundary conditions for the finite element model. The influence of the solar radiation on different parts of the box girder was considered by using the following rules and assumptions: (a) The external surface of the top flange is influenced by both the beam and diffuse solar radiation. (b) The external surfaces of the two webs are in the shadow due to the top flange. Therefore, they are influenced by the diffuse solar radiation and ground reflection only. (c) The undersides of the top and bottom flanges are influenced by the ground reflection alone. The boundary condition of the internal surface of the box girder in the finite element model was set based on the measured temperature obtained from the temperature sensor hung in the box girder (A-I). For the thermal parameters of the concrete, specific heat of 960 J/(kg °C), heat conductivity of 1.5 W/(m °C), and density of 2400 kg/m3 were used [60]. The finite element mesh size was set as 0.02 m. There were 21,000 and 19,337 nodes and elements, respectively, as illustrated in Figure 10. Each node had a single temperature degree of freedom.
6.1.2. Influence of Solar Radiation on Temperature Distribution on Cross-Section of Box Girder
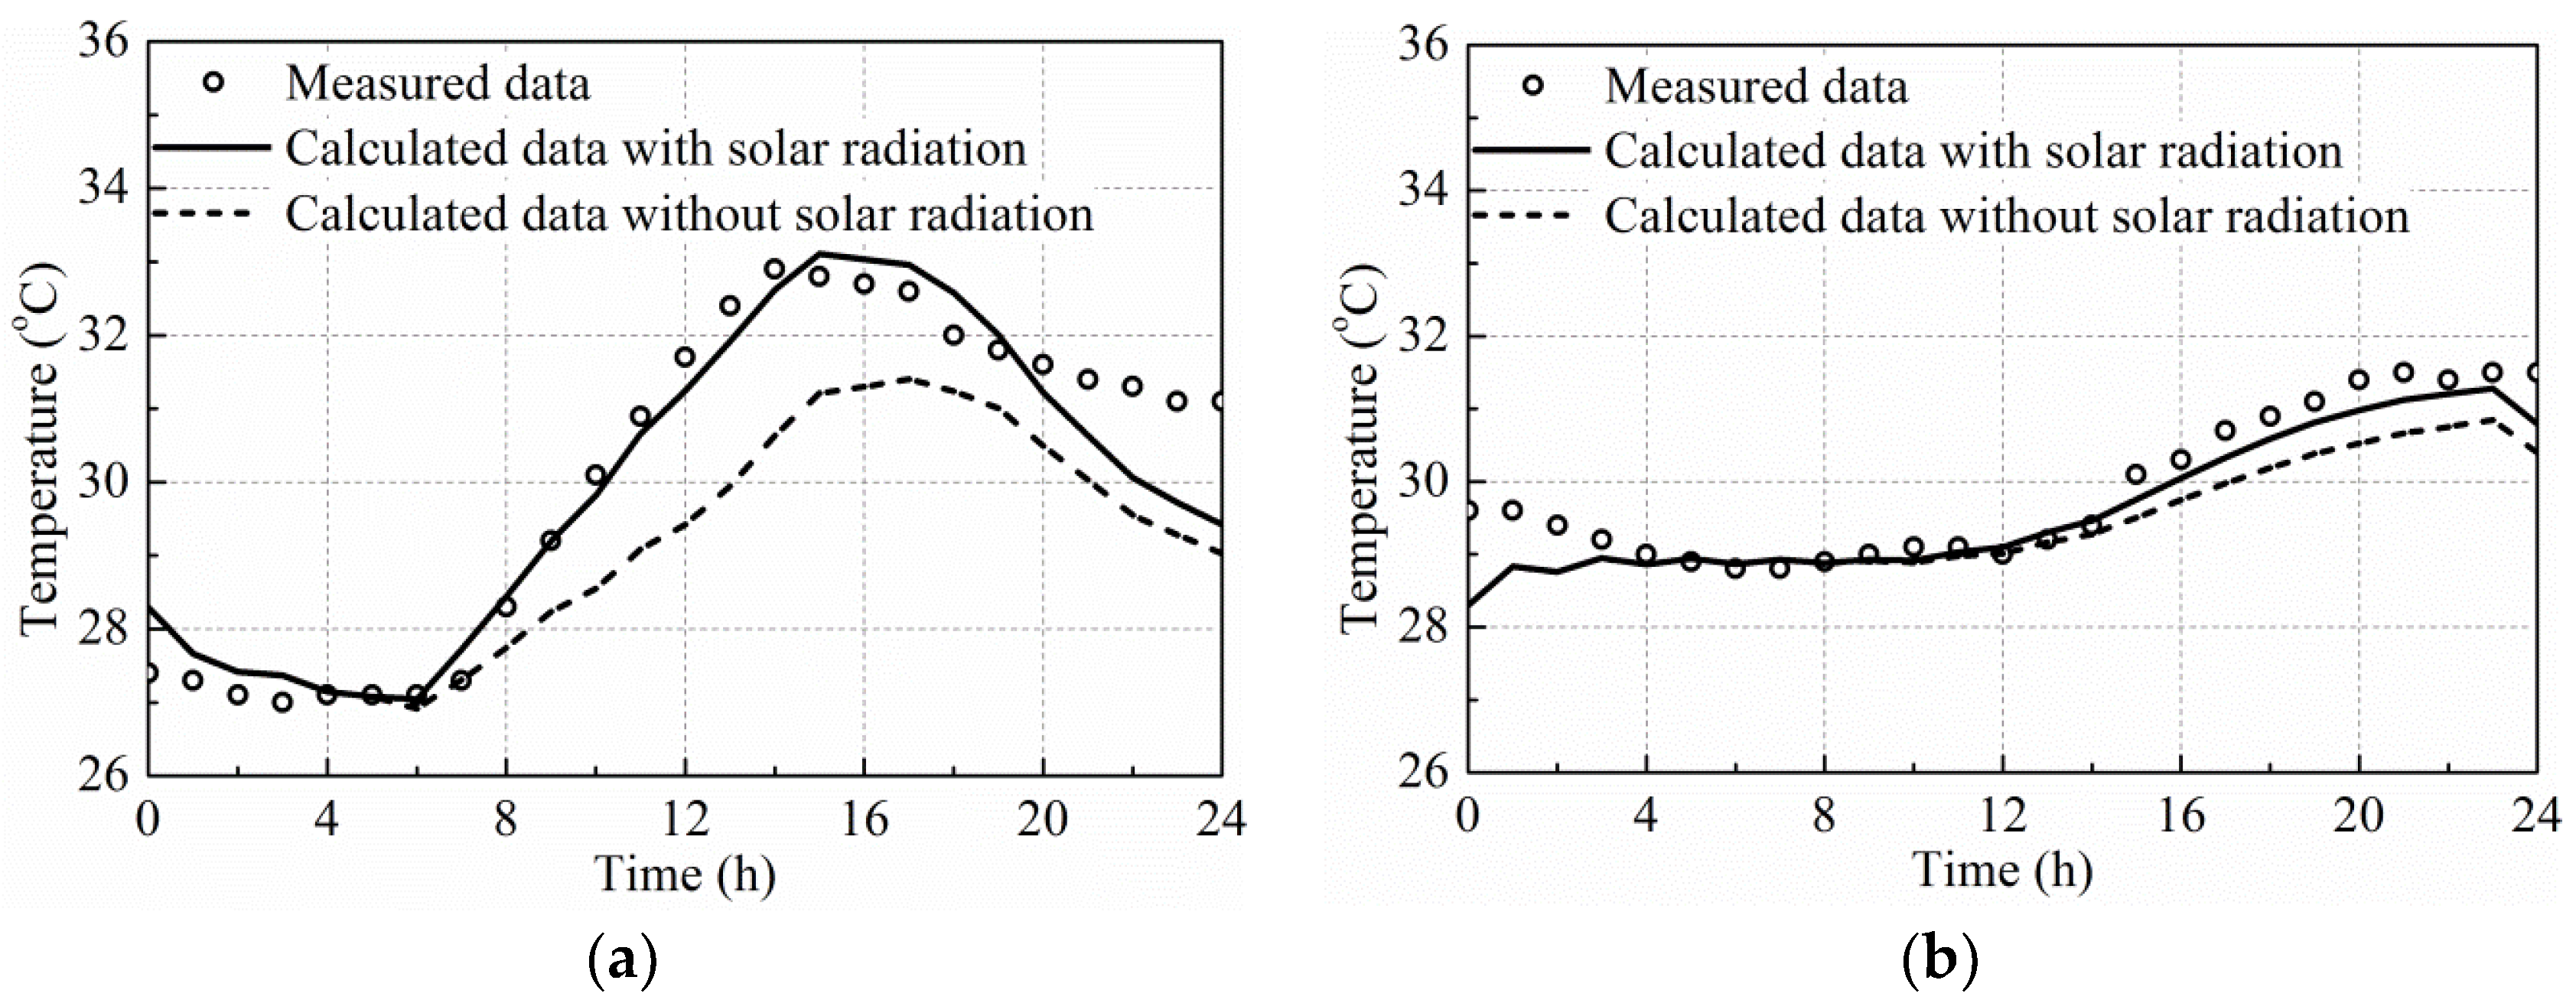
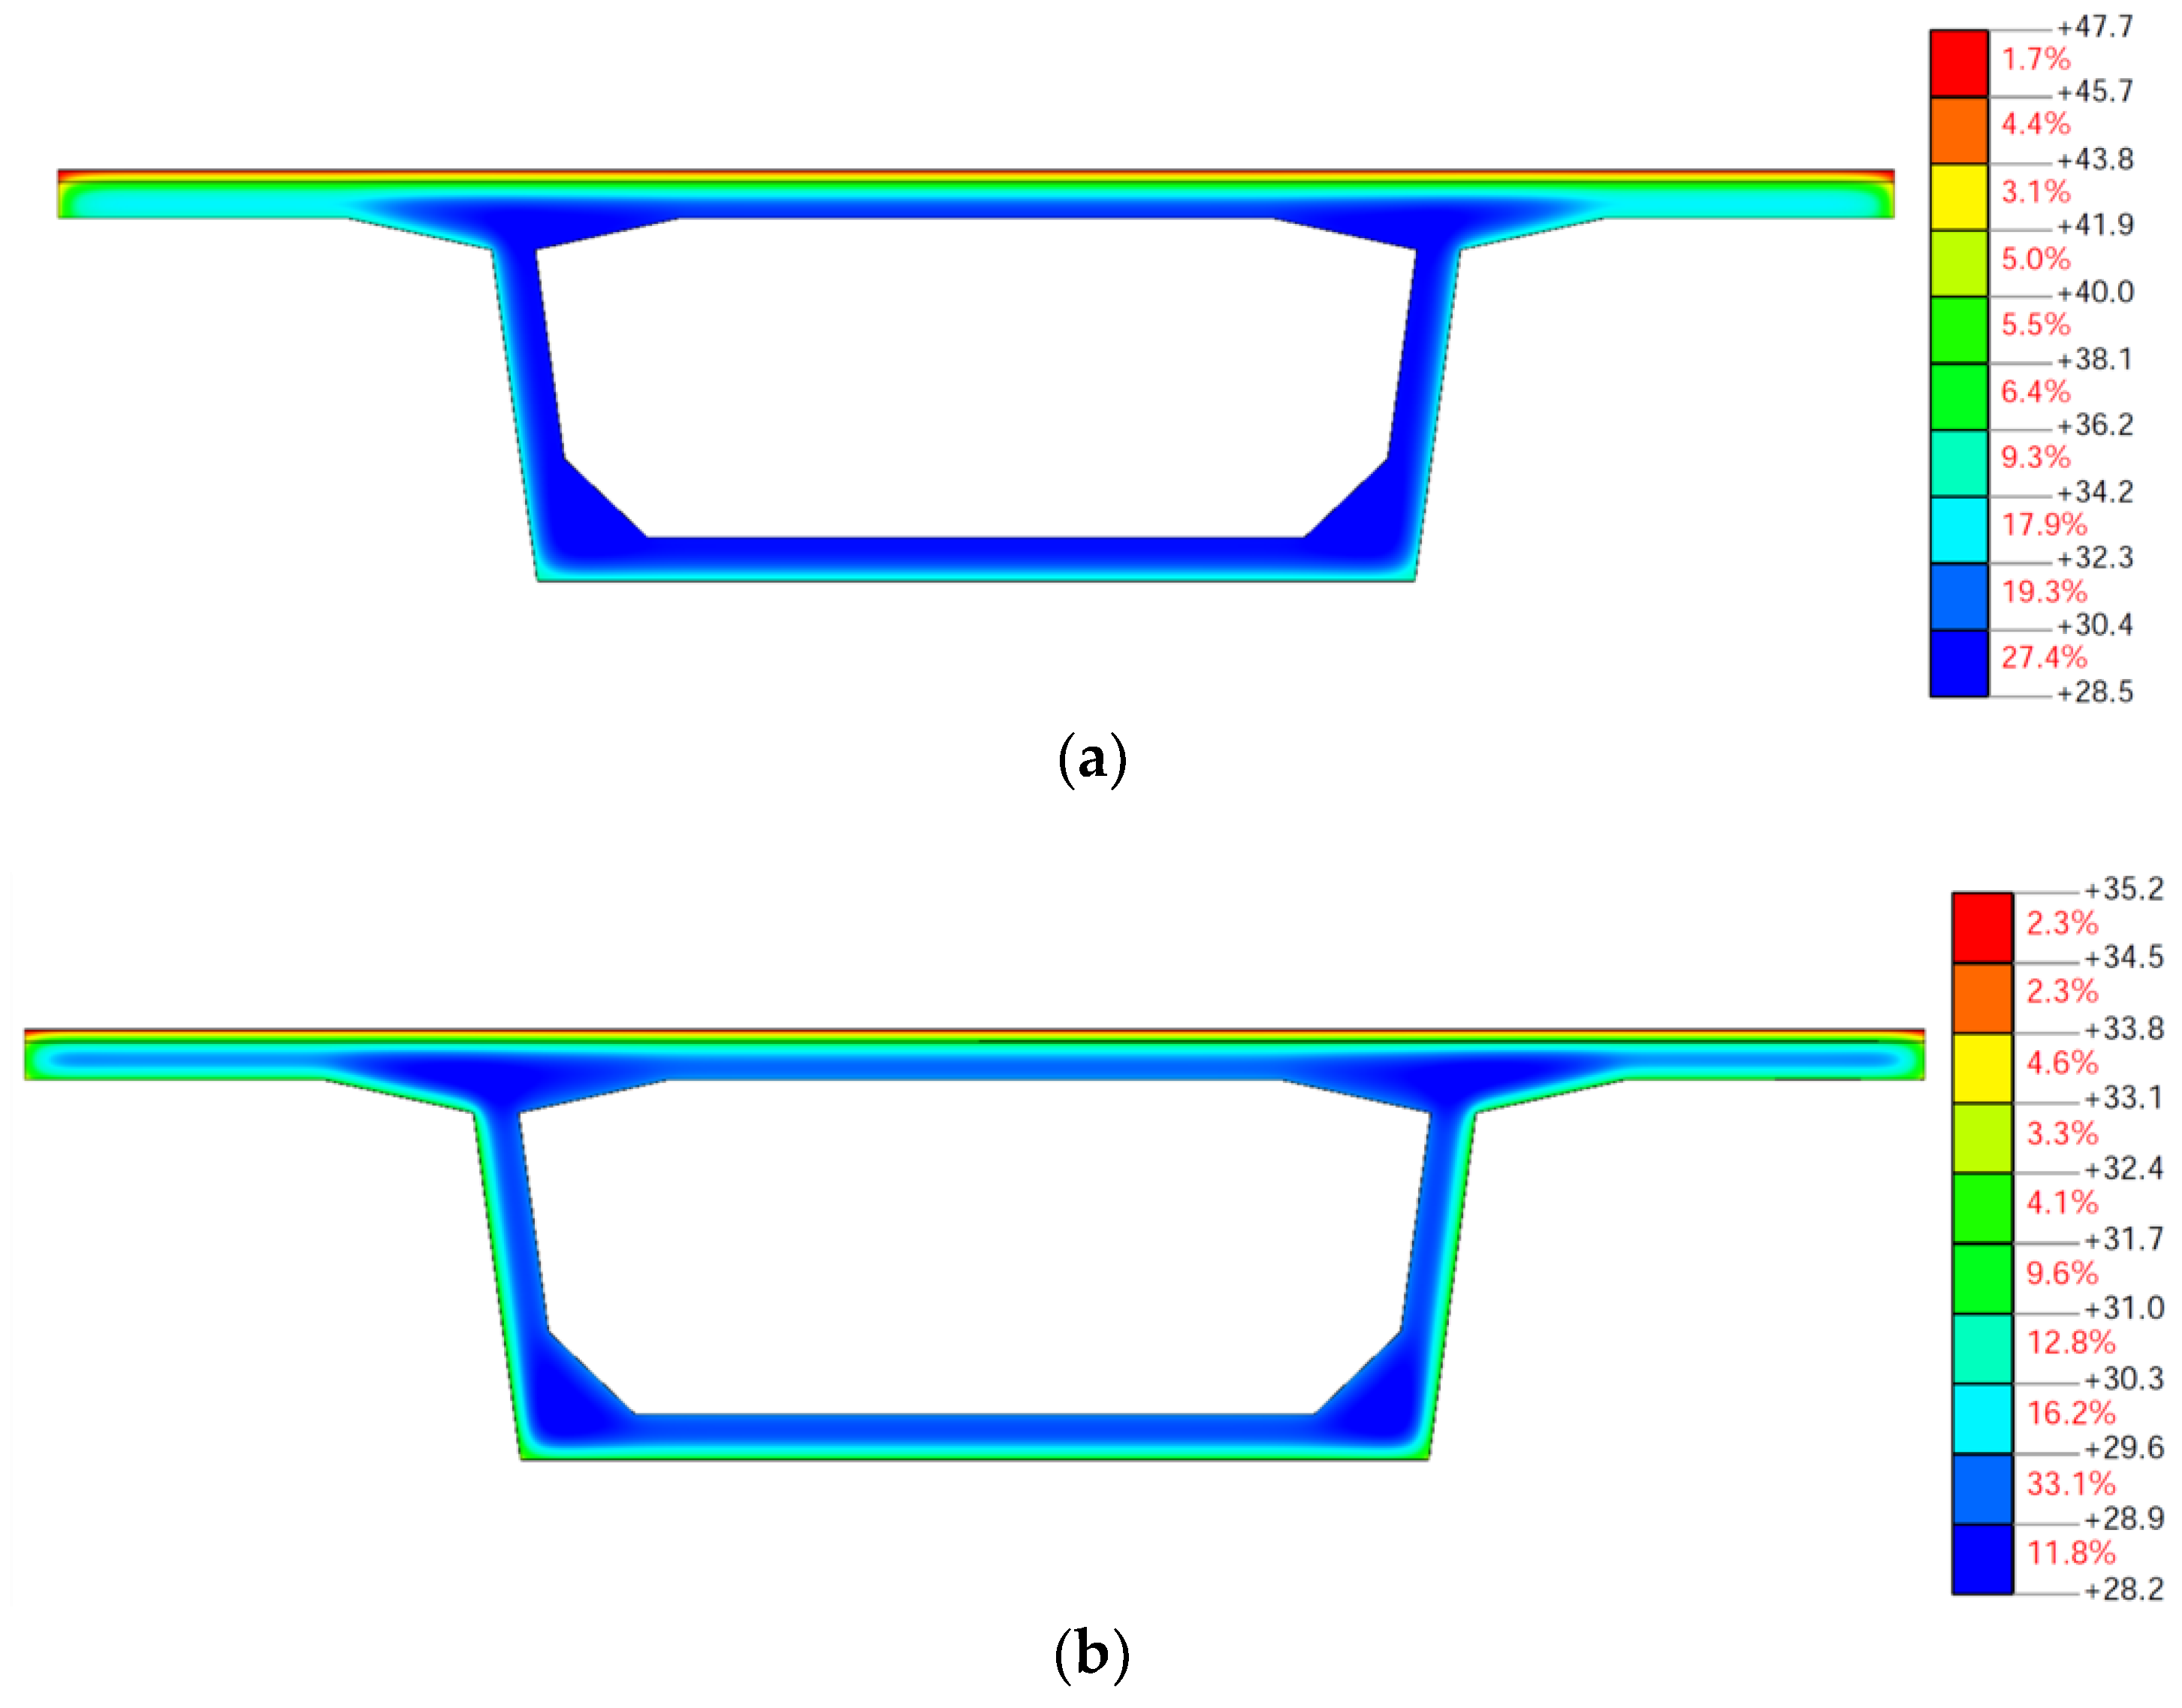
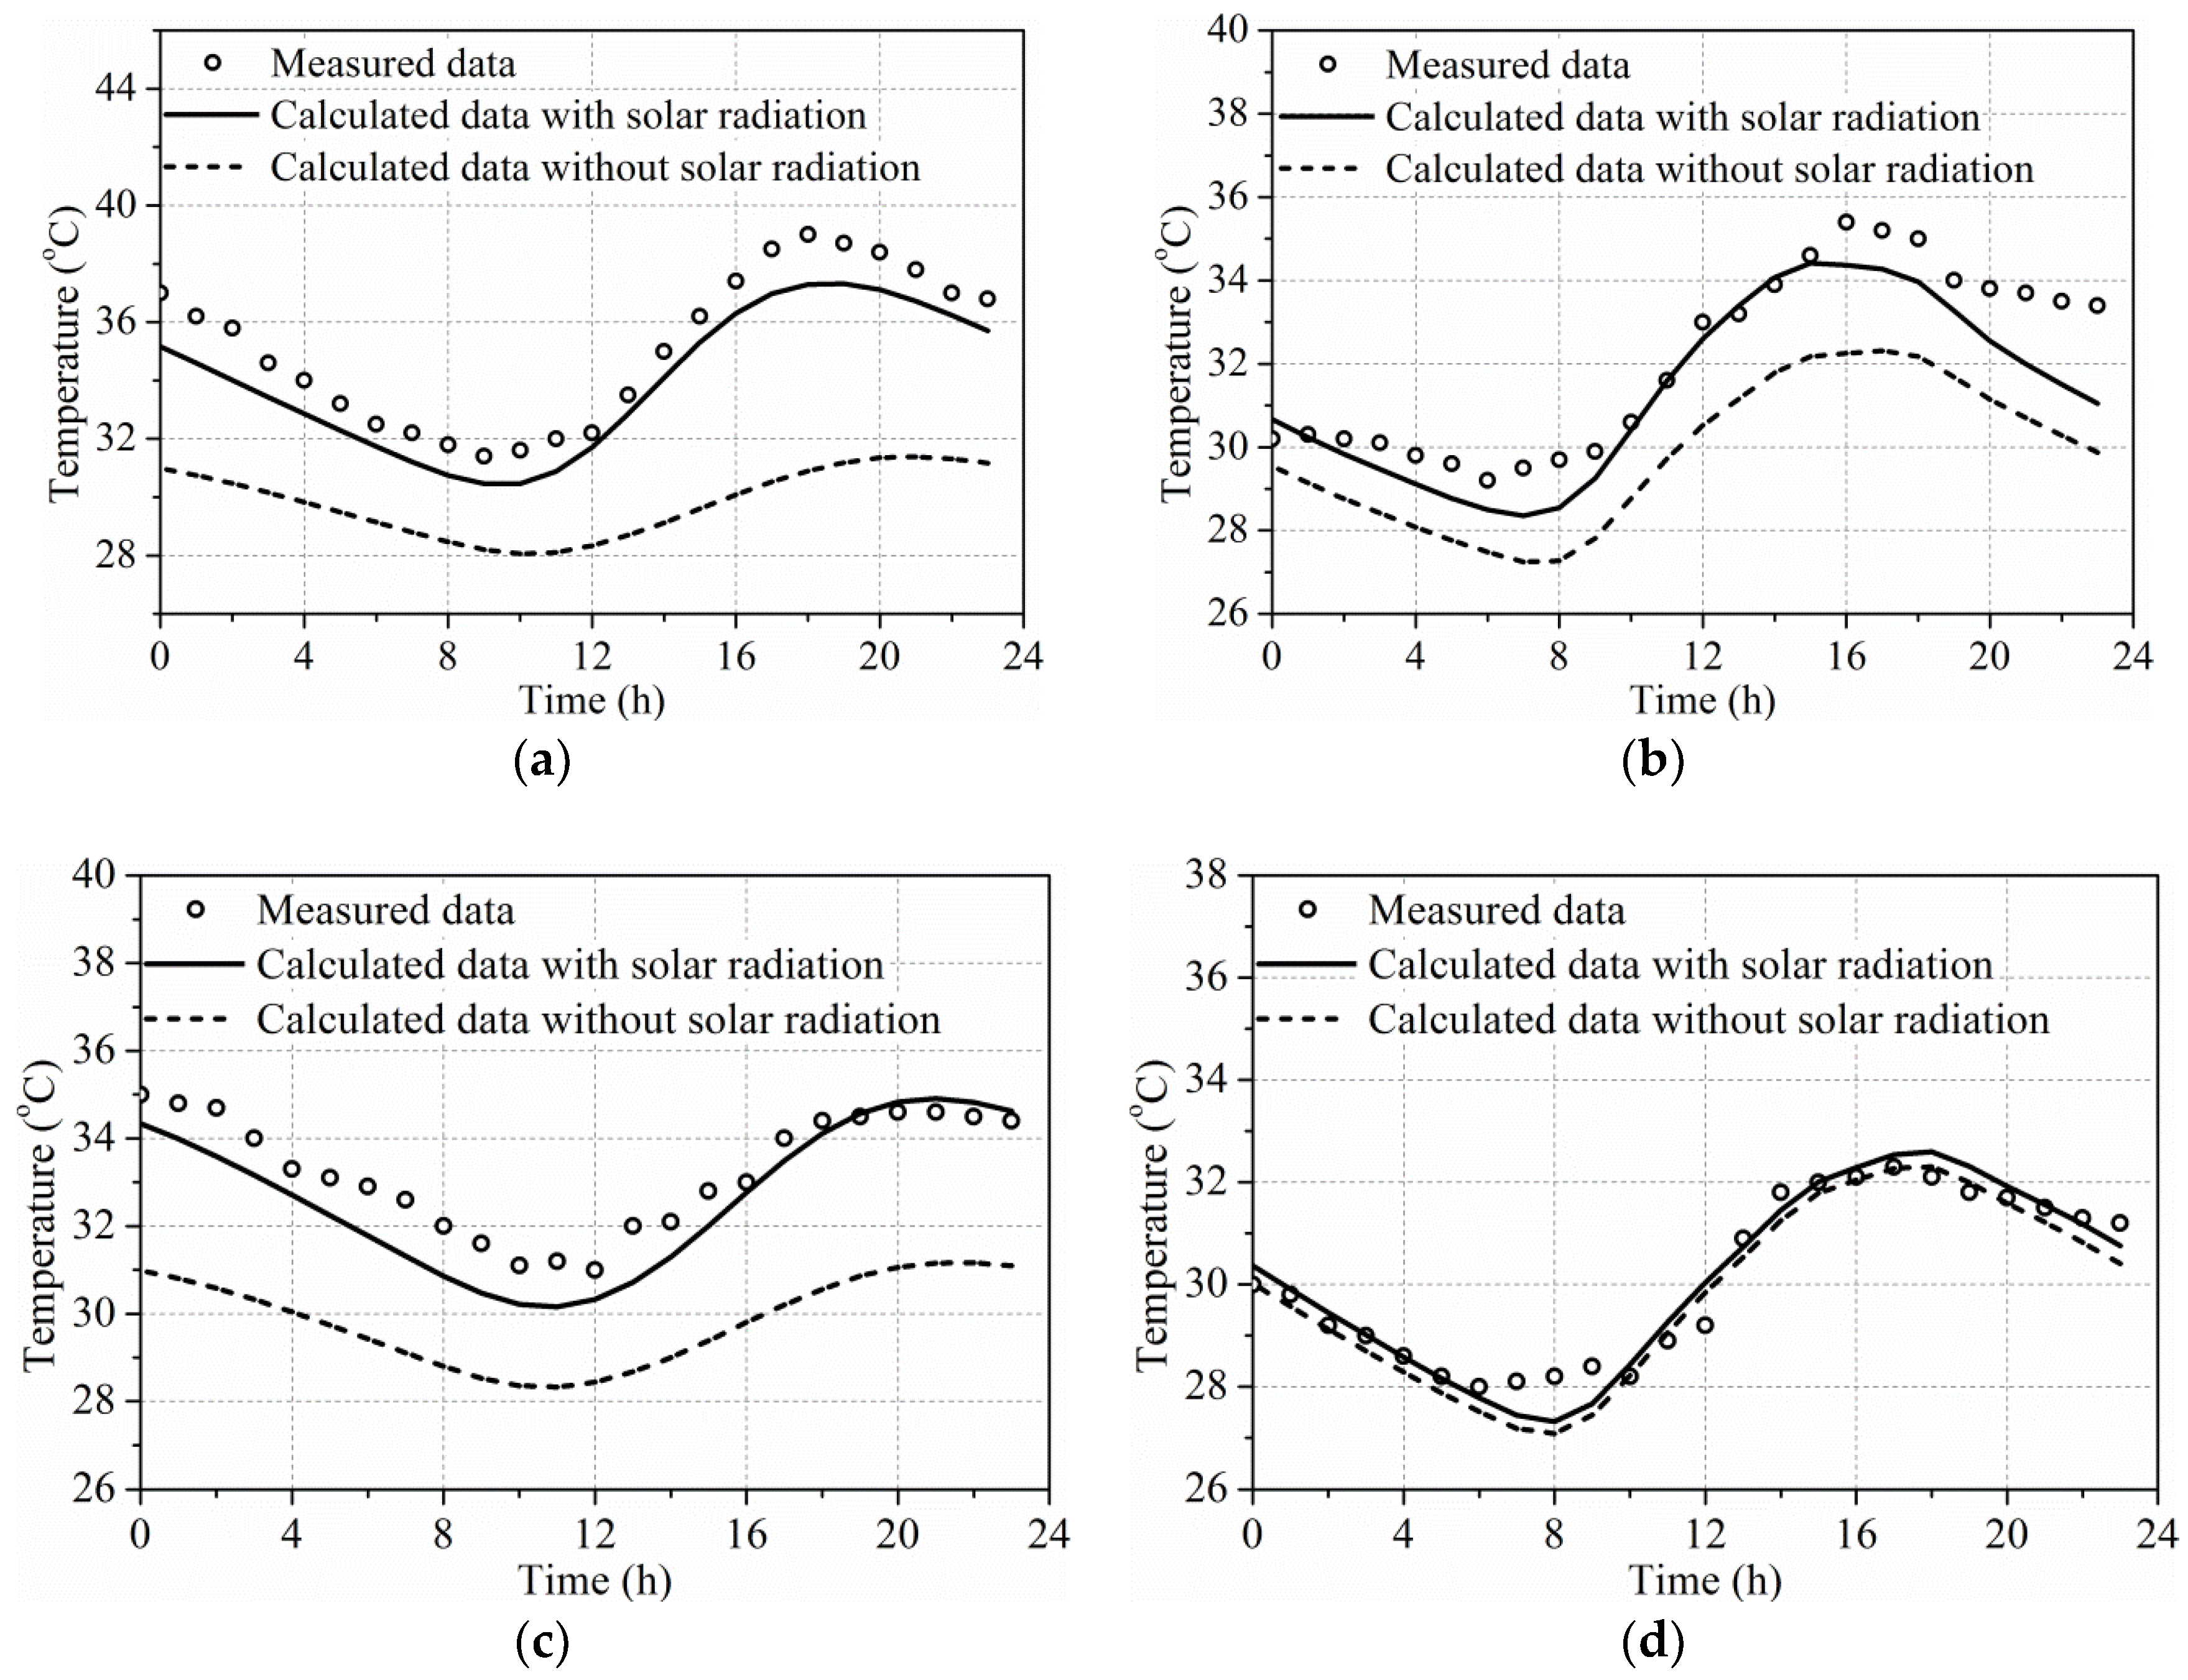
During the monitoring period, 2 August 2010 was a sunny day with high solar radiation. Comparisons of temperature–time curves obtained experimentally or from finite element model with or without the consideration of solar radiation are illustrated in Figure 11 (2 August 2010). The hollow points denote the measured data, the solid line denotes the calculated curves with the consideration of solar radiation, and the dashed line denotes the calculated curves without the consideration of solar radiation. The temperature contour plots obtained from finite element model with or without the consideration of solar radiation are compared in Figure 12 (15:00, 2 August 2010).
In Figure 11, it can be observed that the variation trends and the times at which the highest temperatures occurred are similar for measured and calculated results on 2 August 2010. The differences between the highest measured and calculated temperatures when considering the effect of solar radiation were very small (maximum 0.2 °C for the two webs and 1.1 °C for the bottom flange). However, the highest calculated temperatures without the consideration of solar radiation were lower (maximum 1.7 °C for the two webs and 1.3 °C for the bottom flange) and had a time delay (3 h for two webs and the bottom flange). The accuracy of the solar radiation calculated by using the estimation models can meet the engineering requirements. Moreover, when solar radiation was not considered, the differences between the highest measured and calculated temperatures at the external surfaces of the box girder (1.7 °C for EW-1, 1.5 °C for WW-1 and 1.3 °C for B-1) were significantly larger than the differences at the internal surfaces of the box girder (0.7 °C for EW-2, 0.2 °C for WW-2 and 0.5 °C for B-2). This is because the influence of solar radiation on the temperature distribution decreases as the distance from external surfaces increases. From Figure 12, it can be observed that the differences between the highest calculated temperatures with or without the consideration of solar radiation were significant at 15:00 on 2 August 2010 (maximum 12.5 °C). The vertical temperature variation on the cross-section of box girder when considering the effect of solar radiation (19.2 °C) was significantly larger than that without the consideration of solar radiation (7.0 °C). Therefore, the influence of solar radiation should be considered in the analyses of the temperature distribution on box girders.
During the monitoring period, 16 December 2010 was a cloudy day with low solar radiation. Comparisons of temperature–time curves obtained experimentally or from finite element model with or without the consideration of solar radiation are illustrated in Figure 13 (16 December 2010). The hollow points denote the measured data, the solid line denotes the calculated curves with the consideration of solar radiation, and the dashed line denotes the calculated curves without the consideration of solar radiation. The temperature contour plots obtained from finite element model with or without the consideration of solar radiation are compared in Figure 14 (24:00, 16 December 2010).
In Figure 13, it can be found that the variation trends, lowest temperatures and the times at which the lowest temperatures occurred were similar for measured and calculated values without the consideration of solar radiation on 16 December 2010 (maximum 0.3 °C for two webs and 0.2 °C for the bottom flange). In Figure 14, it can be observed that the differences between the highest calculated temperatures with or without the consideration of solar radiation were negligible at 24:00 on 16 December 2010 (maximum 0.1 °C). The vertical temperature variation on the cross-section of box girder were similar for calculated values with or without the consideration of solar radiation. Therefore, the influence of solar radiation on the temperature distribution on the cross-section of the box girder is negligible in winter.
6.2. Side-by-Side Box Girder Bridge
6.2.1. Finite Element Model
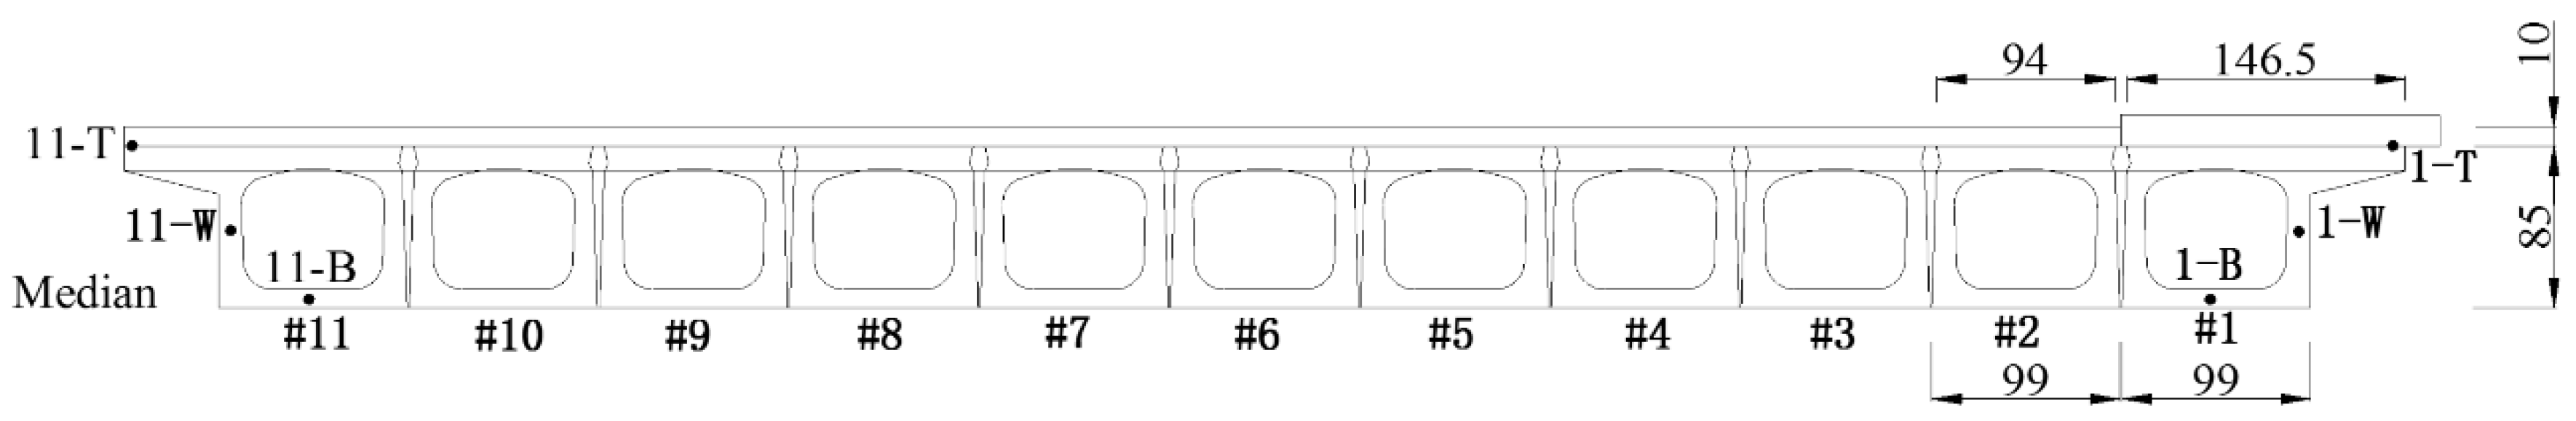
One 6-span concrete continuous bridge in Zhangzhou with a cross-section consisting of 11 side-by-side box girders was chosen as case study. The thickness of the concrete overlay is 100 mm. The dimensions of girder cross-sections and the installation locations of temperature sensors are illustrated in Figure 15. Six temperature sensors were installed in the concrete within the top flanges (1-T and 11-T), webs (1-W and 11-W) and bottom flanges (1-B and 11-B) of box girders #1 and #11. The meteorological data, including ambient air temperature, hourly global solar radiation, hourly diffuse solar radiation and wind speed, were measured by an automated meteorological station. The monitoring period was from 30 July 2014 to 3 August 2014 and the time increment between measurements was set as one hour.
The 2D plane strain element in Midas-FEA was chosen to establish the finite element model of the cross-sections of side-by-side box girders (Figure 15). The ambient air temperature data were obtained from the automated meteorological station. The solar radiation was calculated using the estimation models described earlier. The effects of solar radiation and convective and radiative heat transfer were considered at the external surfaces of the side-by-side box girders. The surface heat transfer coefficient and the temperature of the surrounding fluid medium were input as boundary conditions for the finite element model. The influence of the solar radiation on different parts of the side-by-side box girders was considered by using the following rules and assumptions: (a) The external surfaces of the top flanges are influenced by the beam solar radiation and diffuse solar radiation. (b) The webs in the shadow are influenced by the diffuse solar radiation and ground reflection. (c) The webs not in the shadow are influenced by the beam solar radiation, diffuse solar radiation and ground reflection. (d) The undersides of the top and bottom flanges are not influenced by the solar radiation or ground reflection, because the space below the side-by-side box girders is small obtained by the field observation. No temperature gauge was hung inside the side-by-side box girders. Therefore, the boundary condition of the internal surfaces of the side-by-side box girders was simulated using the 2D plane strain element with the thermal parameters of the air (0 °C and 100 °C) for the finite element model. The thermal parameters of the concrete were discussed earlier. For the air (at 0 °C), a specific heat of 714.8 J/(kg °C), heat conductivity of 0.023 W/(m °C) and density of 1.293 kg/m3 was used. For the air (at 100 °C), a specific heat of 716.9 J/(kg °C), heat conductivity of 0.030 W/(m °C) and density of 0.946 kg/m3 were used [61]. It can be found observed that the influence of temperature on the thermal parameters of the air is small. Therefore, the thermal parameters of the air (at 100 °C and air 0 °C) were input into the finite element models in summer and winter, respectively. The finite element mesh size was set as 0.02 m. There were 27,370 and 27,190 nodes and elements, respectively, as illustrated in Figure 16. Each node had a single temperature degree of freedom.
6.2.2. Influence of Solar Radiation on Temperature Distribution on Cross-Section of Side-by-Side Box Girder
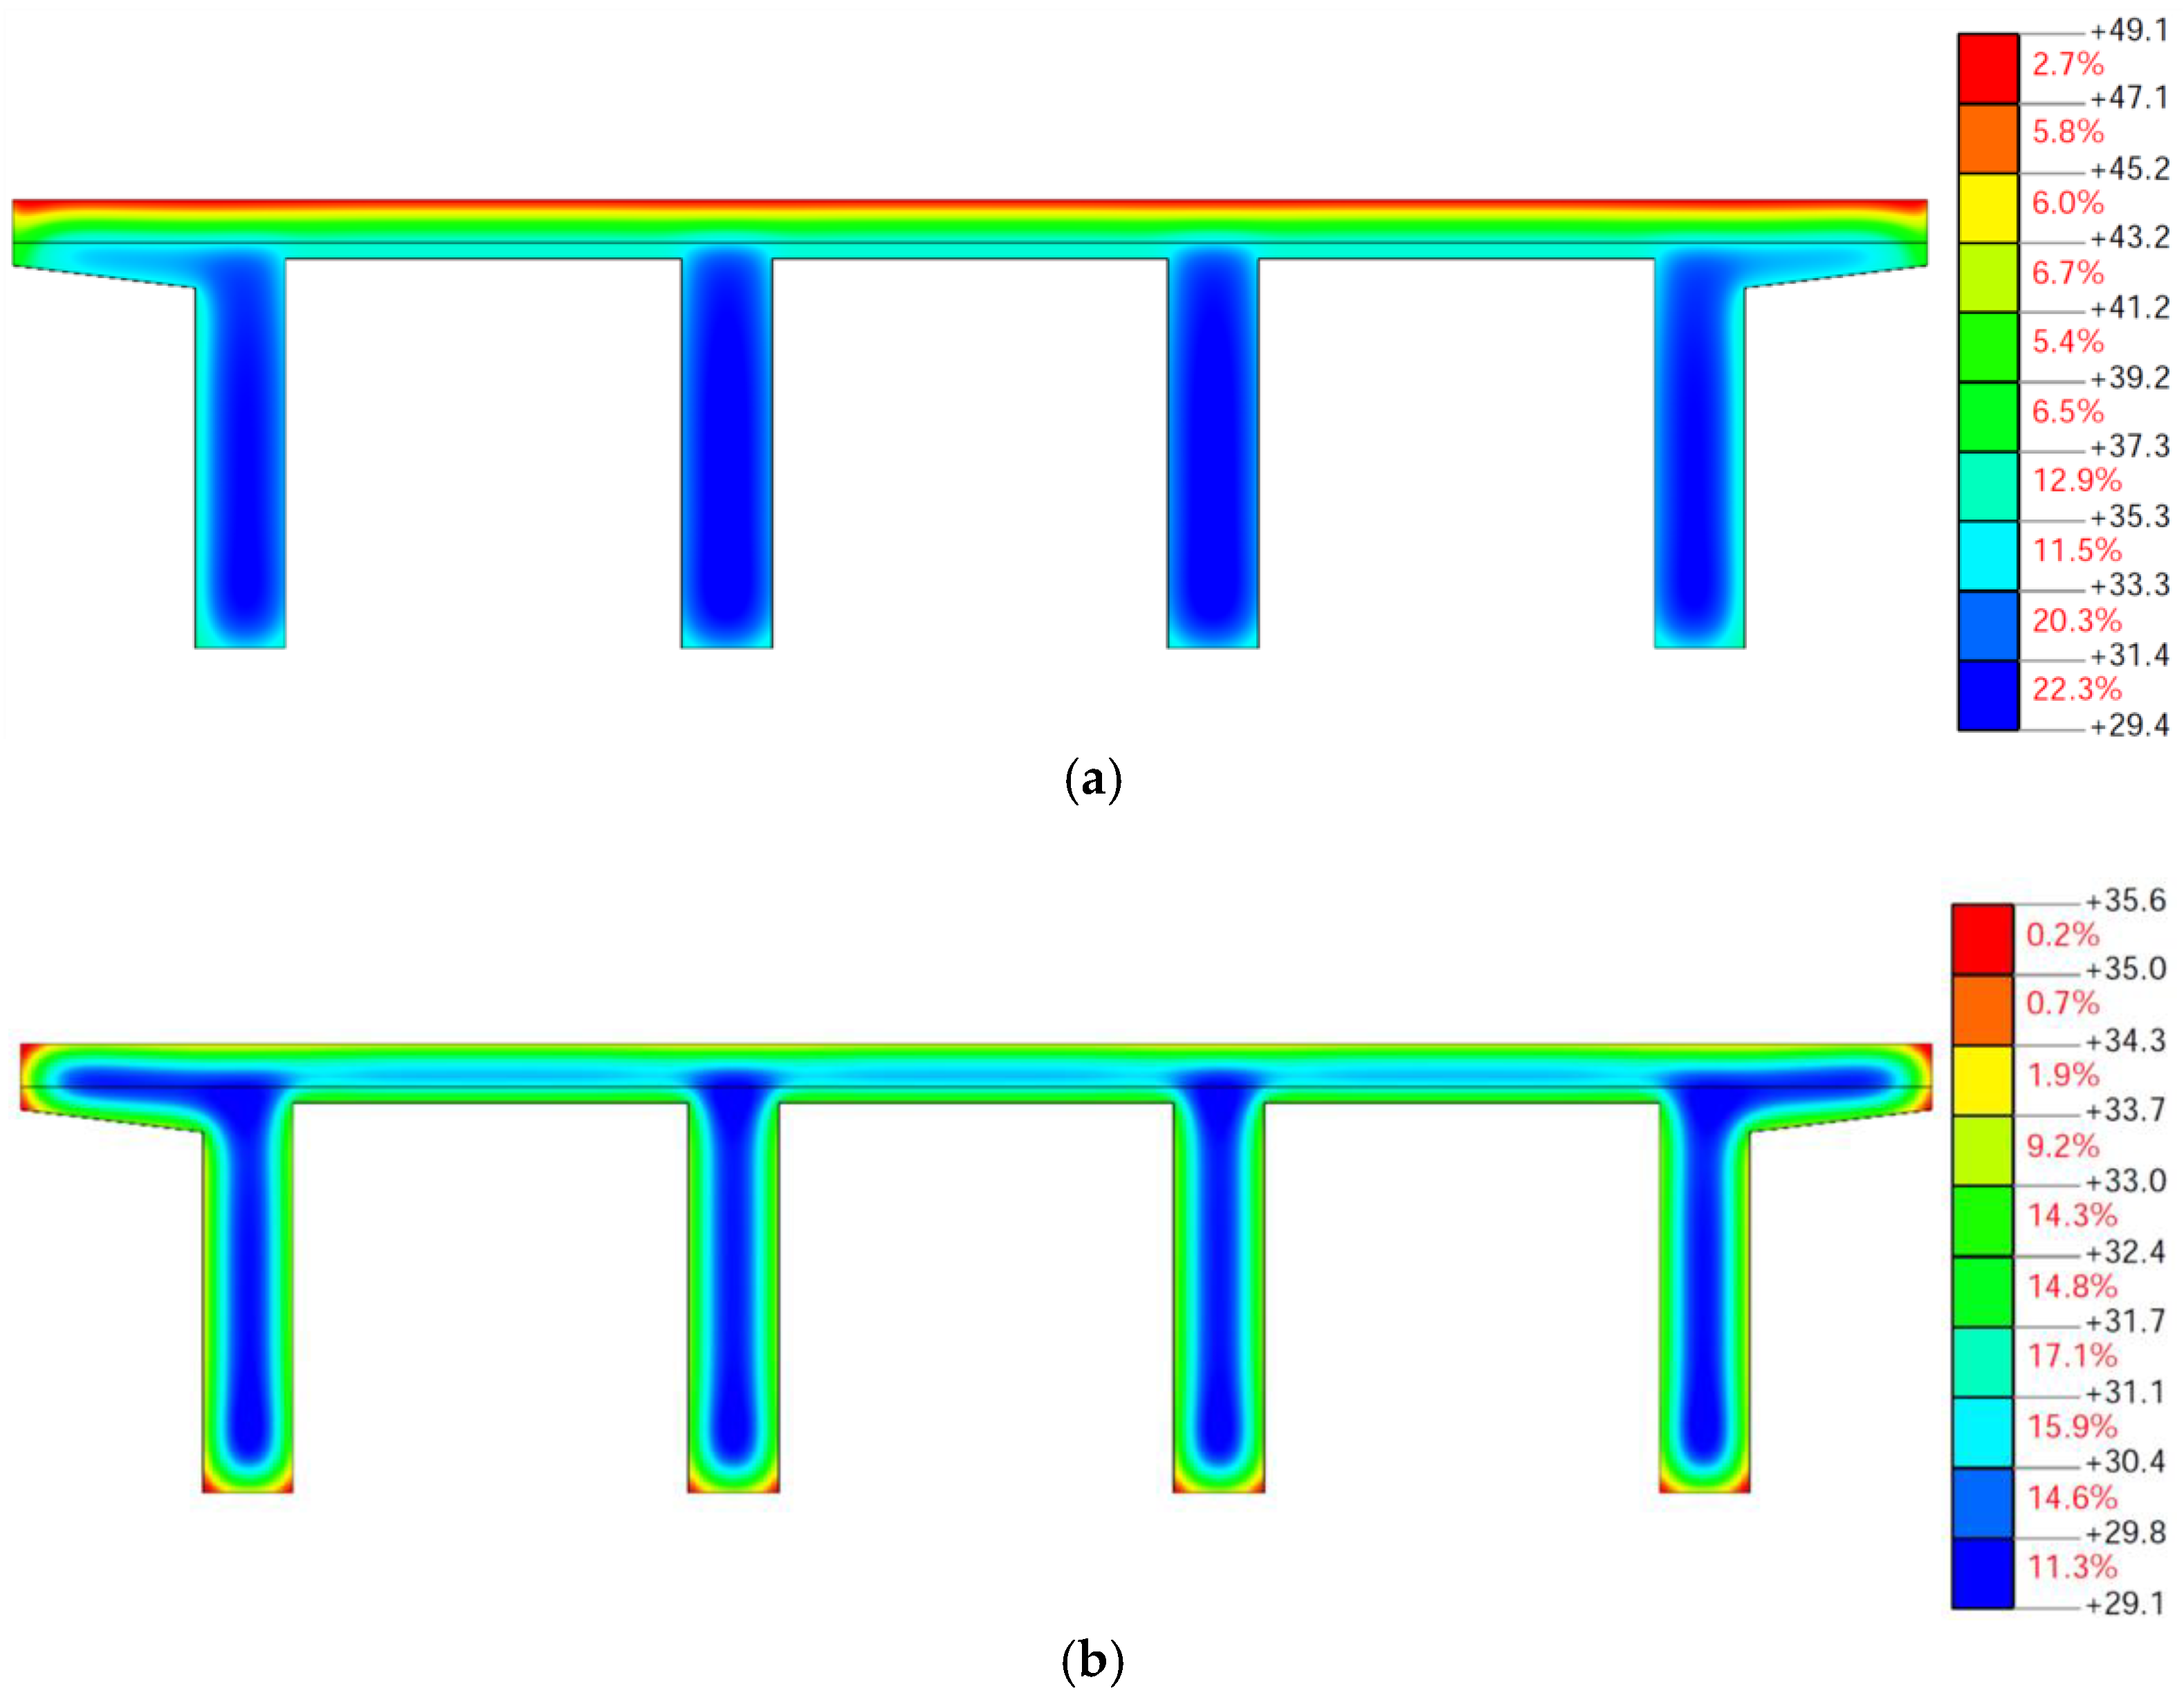
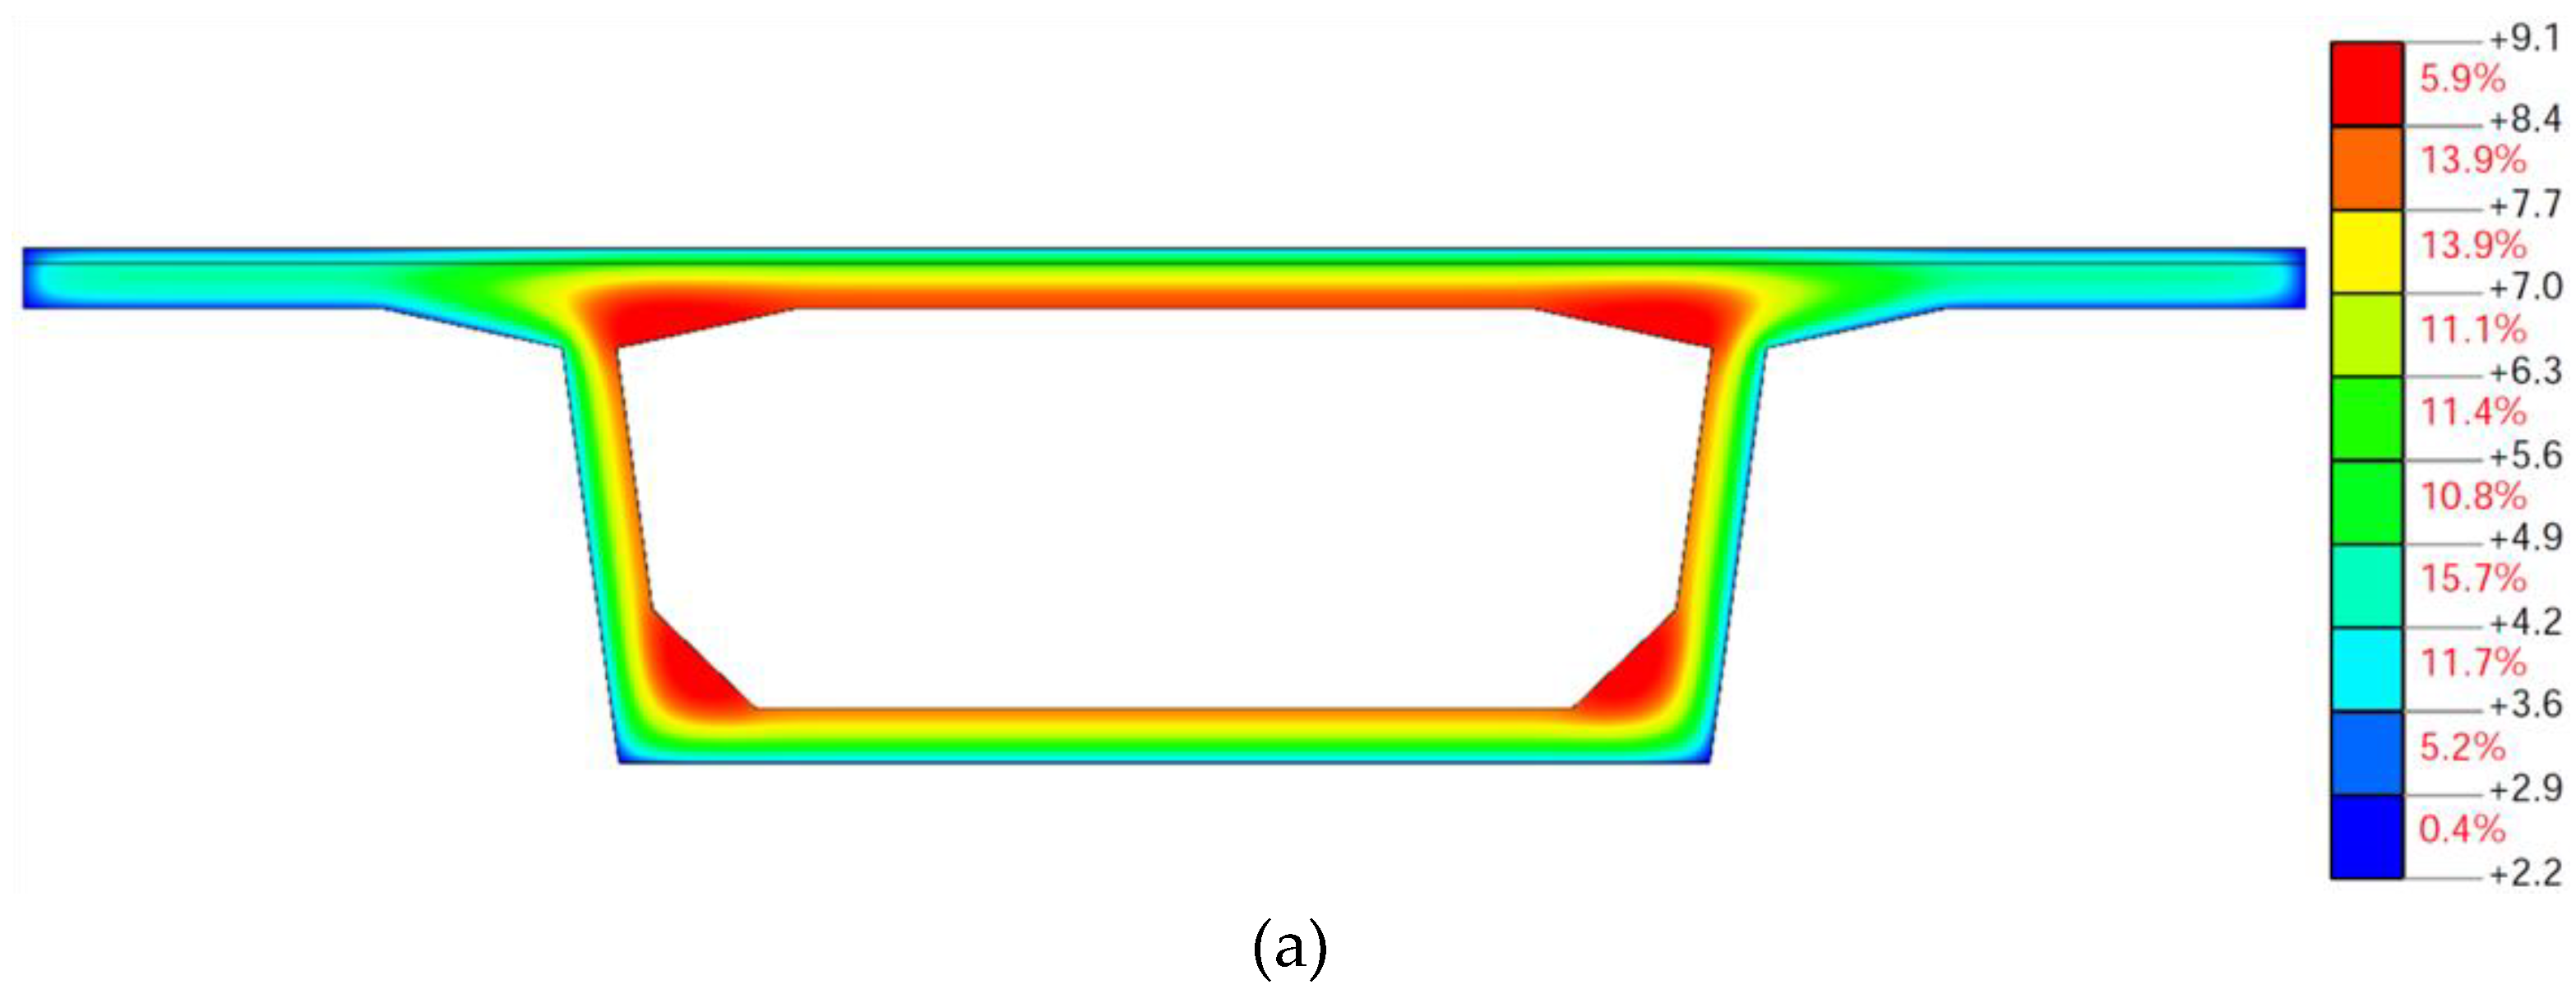
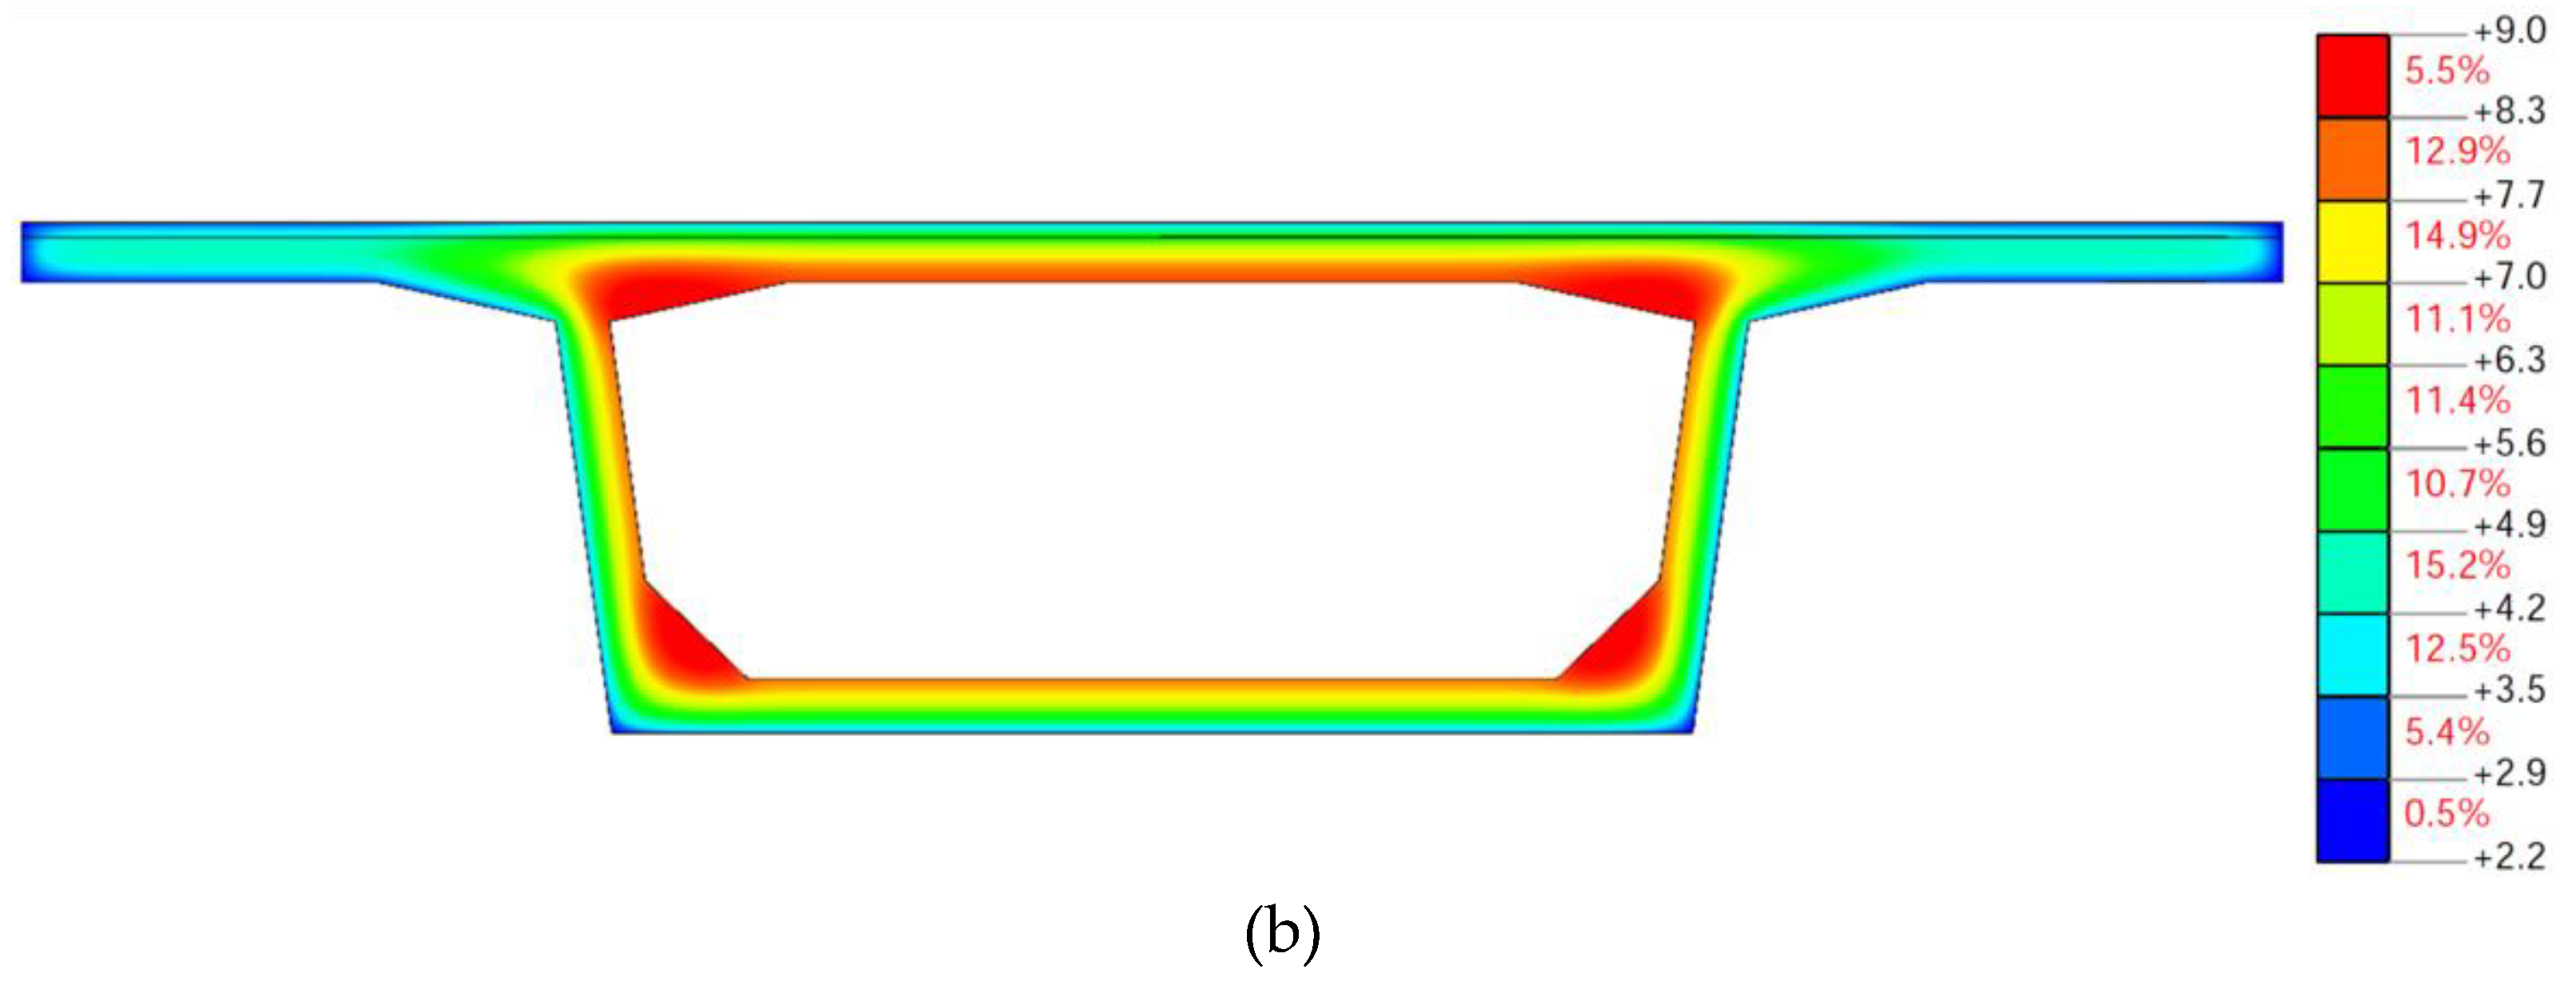
The monitoring period on 31 July 2014 was a sunny day with high solar radiation. Comparisons of temperature–time curves obtained experimentally or from finite element model with or without the consideration of solar radiation are illustrated in Figure 17 (31 July 2014). The hollow points denote the measured data, the solid line denotes the calculated curves with the consideration of solar radiation, and the dashed line denotes the calculated curves without consideration of solar radiation. The temperature contour plots obtained from finite element model with or without the consideration of solar radiation are compared in Figure 18 (16:00, 31 July 2014). In Figure 17, it can be observed that the variation trends and the times at which the highest temperatures occurred are similar for measured and calculated results on 31 July 2014. The differences between the highest measured and calculated temperatures when considering the effect of solar radiation were very small (maximum 0.5 °C for top flanges and 1.8 °C for webs). However, the highest calculated temperatures without the consideration of solar radiation were lower (maximum 9.3 °C for top flanges and 1.8 °C for webs) and had a time delay (2 h for top flanges). For bottom flanges, the differences between the highest measured and calculated temperatures with and without the consideration of solar radiation were very small (maximum 0.6 °C). The accuracy of the solar radiation calculated by using the estimation models can meet the engineering requirements. In Figure 18, it can be observed that the differences between the highest calculated temperatures with or without the consideration of solar radiation were significant at 16:00 on 31 July 2014 (maximum 10.3 °C). The vertical temperature variation on the cross-section of side-by-side box girder when considering the effect of solar radiation (15.5 °C) was significantly larger than that without the consideration of solar radiation (5.3 °C) in summer. Therefore, the influence of solar radiation should be considered in the analyses of the temperature distribution on side-by-side box girders, especially for top flanges.
6.3. T-Shaped Girder Bridge
6.3.1. Finite Element Model
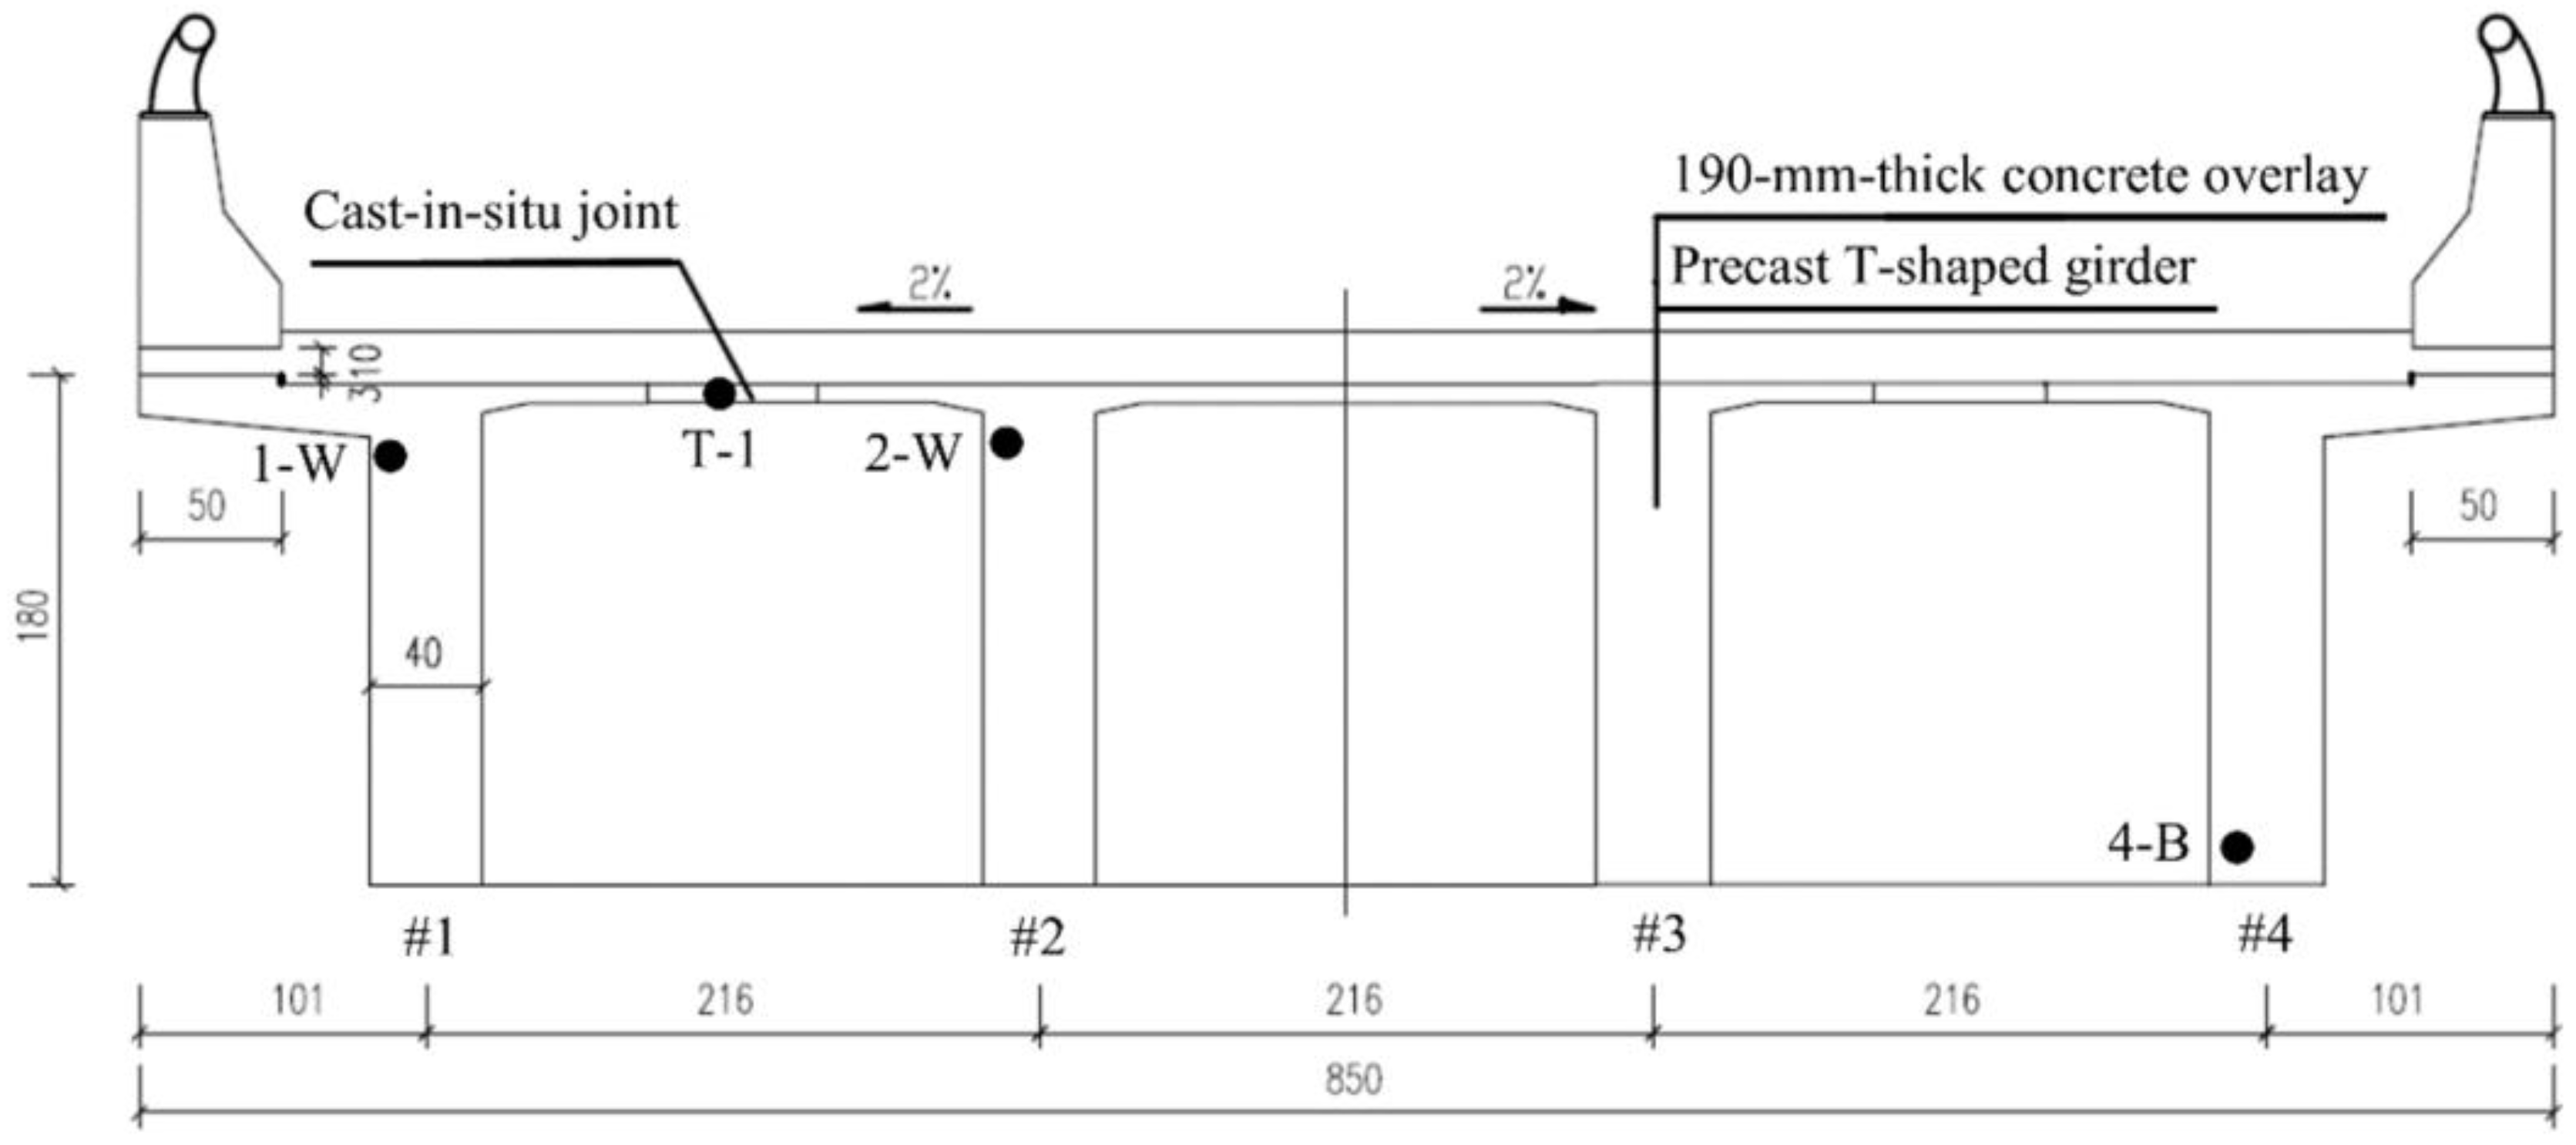
One 4-span concrete continuous bridge in Yongchun with a cross-section consisting of 4 T-shaped girders was chosen as case study. The thickness of the concrete overlay is 190 mm. The dimensions of girder cross-section and the installation locations of temperature sensors are illustrated in Figure 19. Four temperature sensors were installed in the concrete within the top flanges (T-1), webs (1-W and 2-W) and bottom flanges (4-B) of the T-shaped girders. The meteorological data, including ambient air temperature, hourly global solar radiation, hourly diffuse solar radiation and wind speed, were measured by an automated meteorological station. The monitoring period were from 15 August 2012 to 25 August 2012 and the time increment between measurements was set as one hour.
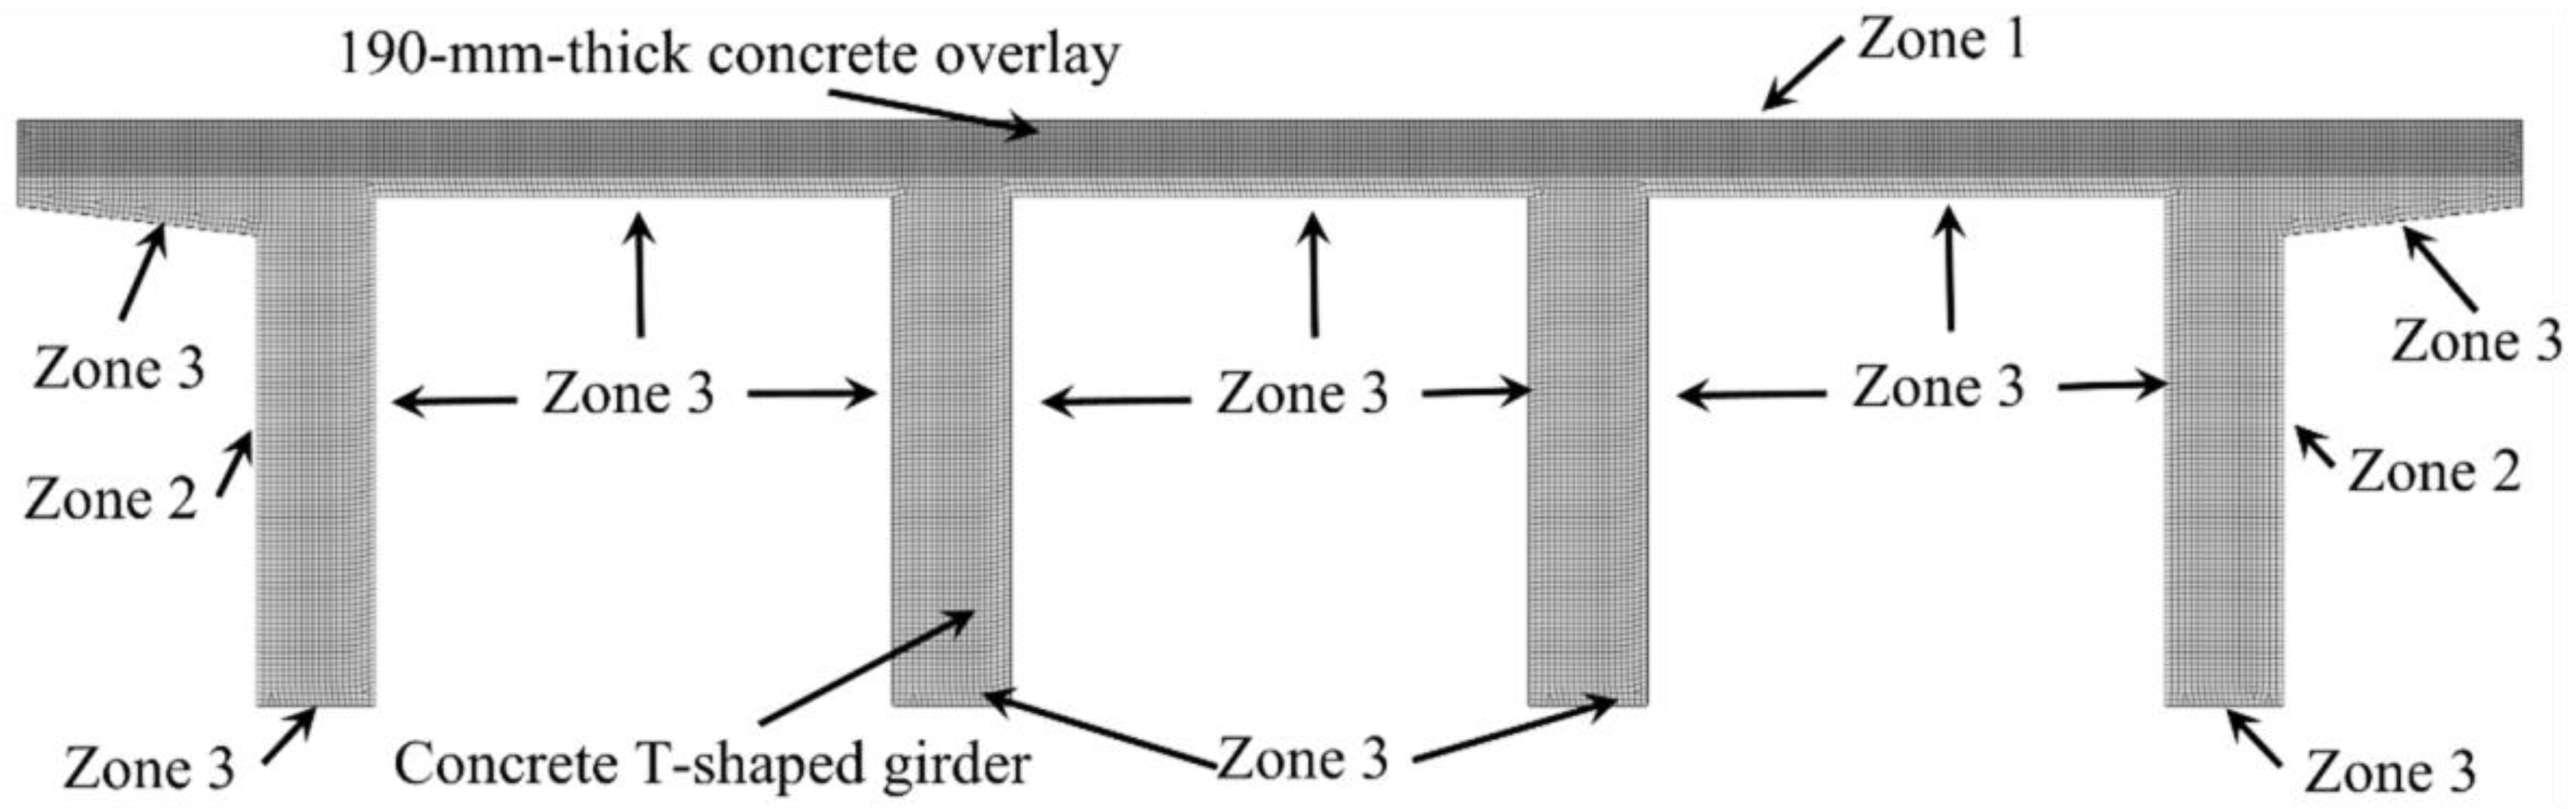
The 2D plane strain element in Midas-FEA was chosen to establish the finite element model of the cross-sections of T-shaped girders (Figure 19). The ambient air temperature data were obtained from the automated meteorological station. The solar radiation was calculated using the estimation models described earlier. The effects of solar radiation and convective and radiative heat transfer were considered at the external surfaces of the T-shaped girders. The surface heat transfer coefficient and the temperature of the surrounding fluid medium were input as boundary conditions for the finite element model. The influence of the solar radiation on different parts of the T-shaped girders was considered by dividing the cross-section into four zones, as shown in Figure 20. (a) The external surfaces of the top flanges are considered as Zone 1, which are influenced by the beam solar radiation and diffuse solar radiation. (b) The external surfaces of the webs of the girders #1 and #4 are considered as Zone 2, of which the parts in shadow are influenced by the diffuse solar radiation and ground reflection, and the parts not in shadow are influenced by the beam solar radiation, diffuse solar radiation and ground reflection. (c) The undersides of the top and bottom flanges are set as Zone 3, which are considered as the inner surfaces in the T-shaped girders and are not influenced by the solar radiation or ground reflection. Moreover, the convective heat transfer coefficient of the inner surfaces in the T-shaped girders was set as 5 W/(m2 °C), which is larger than that in the box girders (3.5 W/(m2 °C)) [62]. The finite element mesh size was set as 0.02 m. There were 16,165 and 15,149 nodes and elements, respectively, as illustrated in Figure 20. Each node had a single temperature degree of freedom.
6.3.2. Influence of Solar Radiation on Temperature Distribution on Cross-Section of T-Shaped Girder
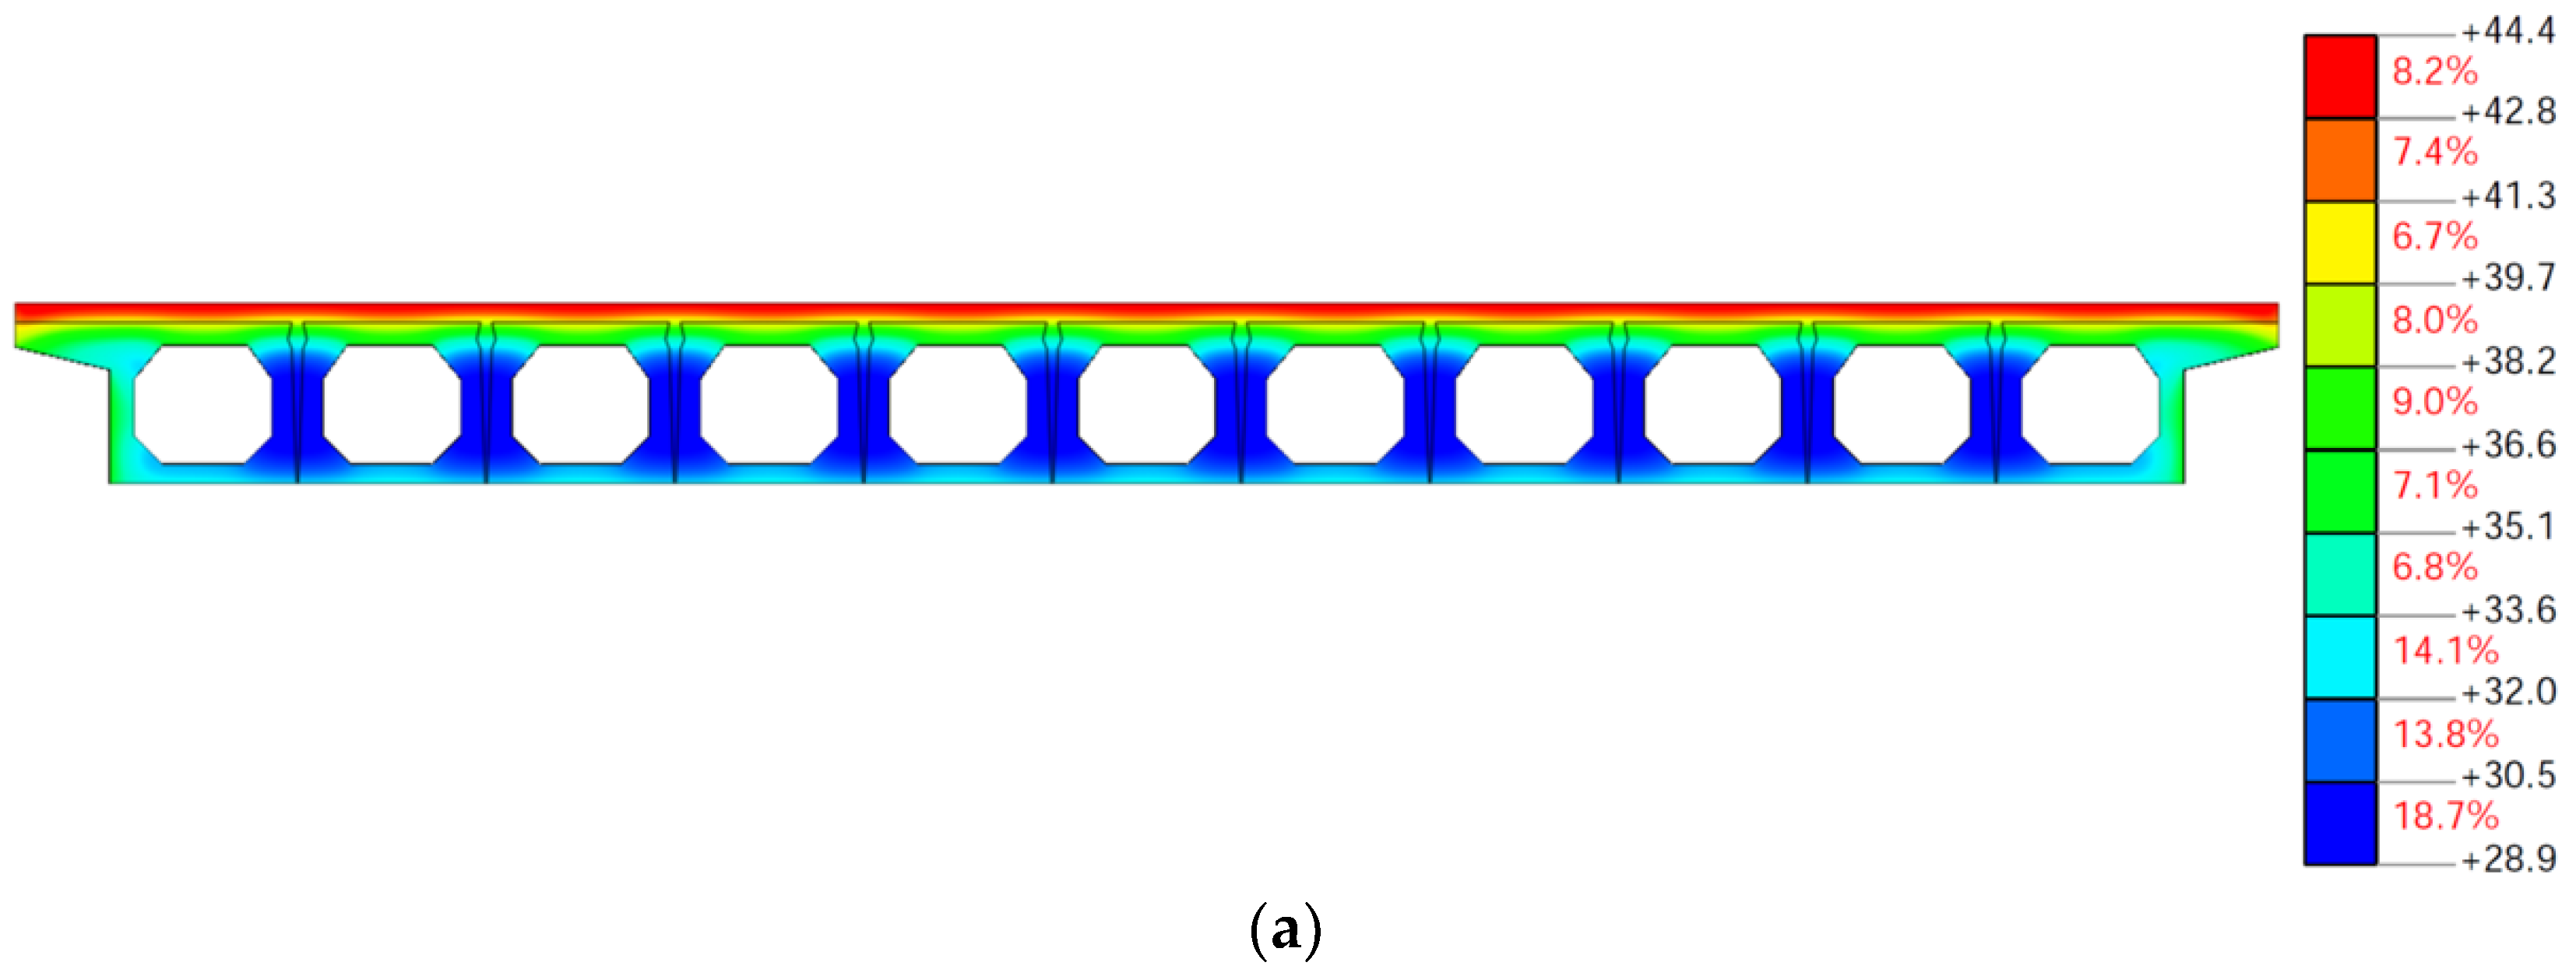
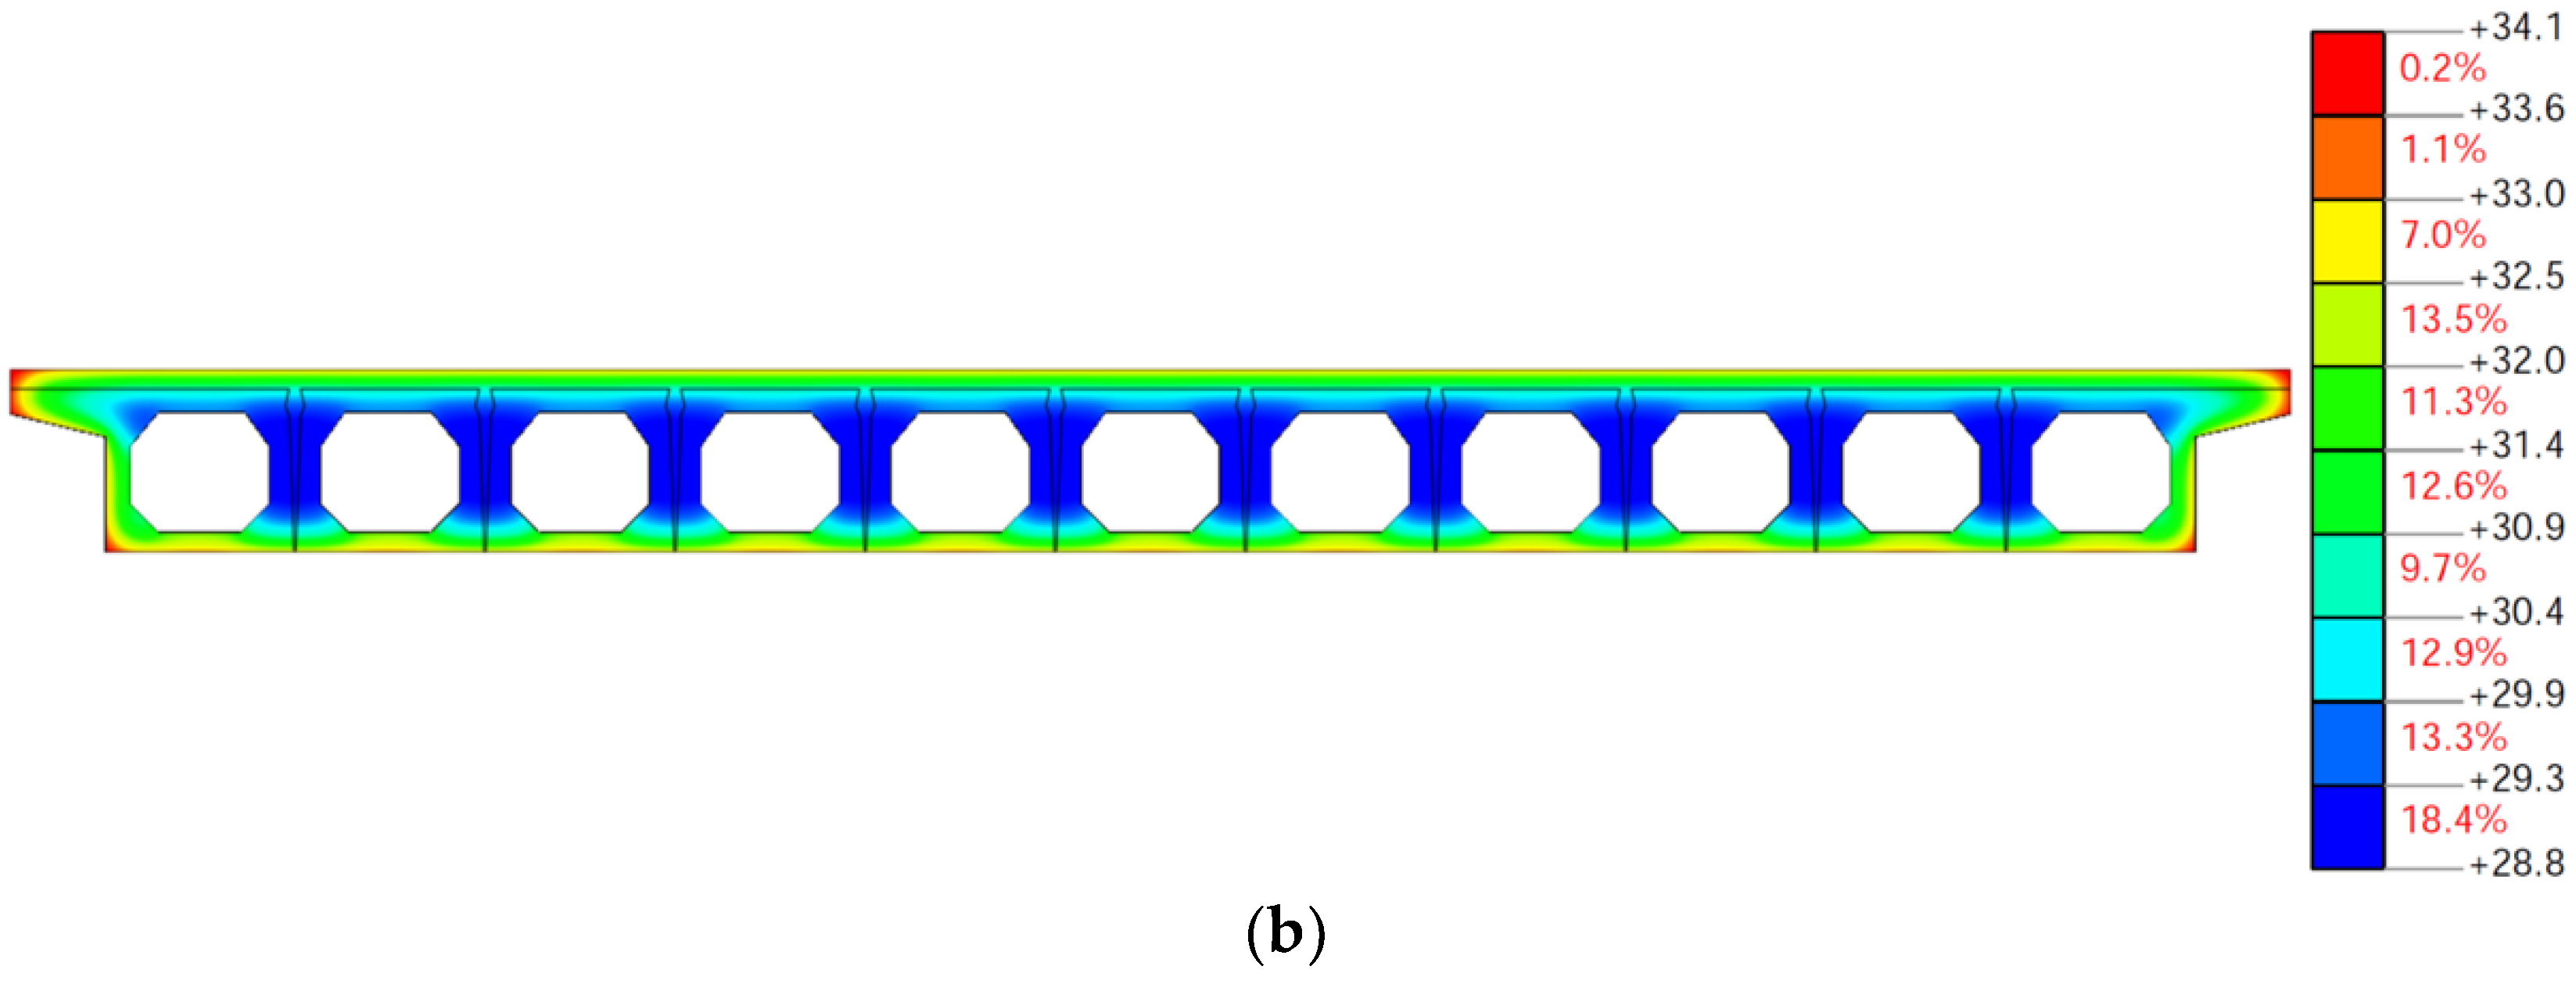
During the monitoring period, 23 August 2012 was a sunny day with the high solar radiation. Comparisons of temperature–time curves obtained experimentally or from finite element model with or without the consideration of solar radiation are illustrated in Figure 21 (23 August 2012). The hollow points denote the measured data, the solid line denotes the calculated curves with the consideration of solar radiation, and the dash line denotes the calculated curves without the consideration of solar radiation. The temperature contour plots obtained from finite element model with or without the consideration of solar radiation are compared in Figure 22 (15:00, 23 August 2012). In Figure 21, it can be observed that the variation trends and the times at which the highest temperatures occurred are similar for measured and calculated results on 23 August 2012. The differences between the highest measured and calculated temperatures when considering the effect of solar radiation were very small (maximum 1.7 °C for top flanges and 1.0 °C for webs). However, the highest calculated temperatures without the consideration of solar radiation were lower (maximum 7.6 °C for top flanges and 3.1 °C for webs) and had a time delay (2 h for top flanges). For bottom flanges, the differences between the highest measured and calculated temperatures with and without the consideration of solar radiation were very small (maximum 0.3 °C). The accuracy of the solar radiation calculated by using the estimation models can meet the engineering requirements. In Figure 22, it can be observed that the differences between the highest calculated temperatures with or without the consideration of solar radiation were significant at 15:00 on 23 August 2012 (maximum 13.5 °C). The vertical temperature variation on the cross-section of T-shaped girder when considering the effect of solar radiation (19.7 °C) was significantly larger than that without the consideration of solar radiation (6.5 °C) in summer. Therefore, the influence of solar radiation should be considered in the analyses of the temperature distribution on T-shaped girders, especially for top flanges and webs.
7. Discussion
The following discussions can be drawn based on the results and within the limitations of the research presented in this paper:
- (1)
- The variation trends for all hourly solar radiation curves are similar, with the solar radiation appearing at about 6:00 a.m., reaching the maxima at about 12:00 p.m. and disappearing at about 6:00 p.m. The maximum measured global solar radiation for Ninghua (about 1100 W/m2) was the highest and the difference between maximum global solar radiation for different cities was about 100 W/m2. The maximum measured diffuse solar radiation for Fu’an (about 250 W/m2) and the calculated beam solar radiation for Ninghua (about 900 W/m2) was the highest. The difference between the maximum diffuse or beam solar radiation for different cities were both about 150 W/m2.
- (2)
- The linear regression of Ångström–Page equation using the monthly time scale of data sample can predict the global solar radiation for different cities in Fujian. For the cities in Fujian that did not have actual data on sunshine duration, the empirical coefficients can be estimated using the available sunshine duration for the nearest city.
- (3)
- The Collares-Pereira and Rabl equation can estimate the hourly global solar radiation for different cities in Fujian based on the daily global solar radiation. The hourly beam solar radiation for different cities in Fujian can be predicted well using the Hottel equation. The hourly diffuse solar radiation for different cities in Fujian can be calculated by subtracting the hourly beam solar radiation from the corresponding hourly global solar radiation.
- (4)
- The maximum global solar radiation, beam solar radiation and diffuse solar radiation (for 21 June, the summer solstice) for 56 cities in Fujian were calculated. The maximum global solar radiation for Xiapu (about 1210 W/m2) is the highest and the maximum global solar radiation for Anxi (about 970 W/m2) is the lowest. The biggest difference among the global solar radiation maxima in different cities is about 240 W/m2. The maximum beam solar radiation for Zhouning (about 909 W/m2) is the highest and the maximum beam solar radiation for Ningde (about 821 W/m2) is the lowest. The biggest difference among the beam solar radiation maxima in different cities is about 88 W/m2. The maximum diffuse solar radiation for Xiapu (about 388 W/m2) is the highest and the maximum diffuse solar radiation for Dehua (about 102 W/m2) is the lowest. The biggest difference among the diffuse solar radiation maxima in different cities is about 286 W/m2.
- (5)
- Comparisons of the measured and calculated temperature–time responses for the concrete box girder, side-by-side box girder and T-shaped girder with or without the consideration of solar radiation indicates that the influence of solar radiation should be considered in the analyses of the temperature distribution on the bridge girder cross-sections in summer. The accuracy of the solar radiation calculated using the estimation models can meet the engineering requirements. The highest calculated temperatures without the consideration of solar radiation were lower and had a time delay, especially for top flanges in the summertime. The vertical temperature variation when considering the effect of solar radiation was significantly larger than that without the consideration of solar radiation. The influence of solar radiation on the temperature distribution decreases as the distance from external surfaces. The influence of solar radiation on the temperature distribution of the bridge girder cross-sections is negligible in winter.
- (6)
- The solar radiation parameters for other cities and regions in China and elsewhere, as well as different bridge superstructure types, can be similarly developed based on more case studies to establish the relevant estimation models. This can serve as a prelude for future development of specifications related to temperature effects in bridge engineering.
Acknowledgments
The research was supported by National Natural Science Foundation of China (51508103), National Natural Science Foundation of China (51778148), Fujian Provincial Education Department Research Foundation for Young Teacher (JA15074) and Recruitment Program of Global Experts Foundation (TM2012-27). The authors would also like to acknowledge the Sustainable and Innovative Bridge Engineering Research Center (SIBERC) of the College of Civil Engineering, Fuzhou University (Fuzhou, China) and National Meteorological Information Center, China Meteorological Administration.
Author Contributions
All authors substantially contributed to this work. Junqing Xue, Bruno Briseghella and Jianhui Lin conceived and performed the monitoring of solar radiation. Junqing Xue, Habib Tabatabai and Jianhui Lin conceived and designed the estimation model for solar radiation. Junqing Xue and Baochun Chen performed the monitoring of temperature distribution on bridge girder cross-sections. Junqing Xue and Jianhui Lin performed the finite element simulation and analyzed the temperature distribution on bridge girder cross-sections. All authors helped with the writing of the paper.
Conflicts of Interest
The authors declare no conflict of interest.
References
- Kehlbeck, F. Einfluss der Sonnenstrahlung bei Bruckenbauwerken; Werner: Dusseldorf, Germany, 1975. [Google Scholar]
- Peng, Y.S.; Qiang, S.Z. Analytical solution to temperature variations in highway concrete bridges due to solar radiation. In Proceedings of the First International Conference on Transportation Engineering, Chengdu, China, 22–24 July 2007; American Society of Civil Engineers: Reston, VA, USA, 2017; pp. 1536–1541. [Google Scholar]
- Emerson, M. Bridge Temperatures Estimated from the Shade Temperature; TRRL Laboratory Report 696; TRRL: Berkshire, UK, 1976. [Google Scholar]
- Imbsen, R.A.; Vandershaf, D.E.; Schamber, R.A.; Nutt, R.V. Thermal Effects in Concrete Bridge Superstructures; NCHRP Report 276; Transportation Research Board: Washington, DC, USA, 1985. [Google Scholar]
- Shiu, K.N.; Russell, H.G.; Tabatabai, H. Instrumentation of the Red River Bridge at Boyce; Report No. FHWA/LA-91/223; Louisiana Transportation Research Center: Baton Rouge, LA, USA, 1991. [Google Scholar]
- Shiu, K.N.; Tabatabai, H. Measured Thermal Response of Concrete Box-Girder Bridge; Transportation Research Record No. 1460; Transportation Research Board: Washington, DC, USA, 1994; pp. 94–105. [Google Scholar]
- Qin, Y.; Lin, L.; Tie, M.; Zhang, L. Observation and research on temperature distribution of concrete box girder in diurnal change of temperature. In Proceedings of the International Conference on Transportation, Mechanical, and Electrical Engineering, Changchun, China, 16–18 December 2011. [Google Scholar]
- Avossa, A.M.; Giacinto, D.D.; Malangone, P.; Rizzo, F. Seismic retrofit of a multispan prestressed concrete girder bridge with friction pendulum devices. Shock Vib. 2018, 2018, 1–22. [Google Scholar] [CrossRef]
- Zang, H.X.; Xu, Q.S.; Bian, H.H. Generation of typical solar radiation data for different climates of China. Energy 2012, 38, 236–248. [Google Scholar] [CrossRef]
- Angstrom, A. Solar and terrestrial radiation. Quart. J. R. Meteorol. Soc. 1924, 50, 121–126. [Google Scholar] [CrossRef]
- Page, J.K. The estimation of monthly mean values of daily total short wave radiation on-vertical and inclined surfaces from sun shine records for latitudes 40° N-40° S. In Proceedings of the United Nations Conference on New Sources of Energy, Rome, Italy, 21–31 August 1961; pp. 378–387. [Google Scholar]
- Ögelman, H.; Ecevit, A.; Tasdemiroǧlu, E. A new method for estimating solar radiation from bright sunshine data. Sol. Energy 1984, 33, 619–625. [Google Scholar] [CrossRef]
- Bahel, V.; Bakhsh, H.; Srinivasan, R. A correlation for estimation of global solar radiation. Energy 1987, 12, 131–135. [Google Scholar] [CrossRef]
- Bakirci, K. Correlations for estimation of daily global solar radiation with hours of bright sunshine in Turkey. Energy 2009, 34, 485–501. [Google Scholar] [CrossRef]
- Duzen, H.; Aydin, H. Sunshine-based estimation of global solar radiation on horizontal surface at Lake Van region (Turkey). Energy Convers. Manag. 2012, 58, 35–46. [Google Scholar] [CrossRef]
- Li, H.S.; Ma, W.B.; Lian, Y.W.; Wang, X.L.; Zhao, L. Global solar radiation estimation with sunshine duration in Tibet, China. Renew. Energy 2011, 36, 3141–3145. [Google Scholar] [CrossRef]
- Katiyar, A.K.; Pandey, C.K. Simple correlation for estimating the global solar radiation on horizontal surfaces in India. Fuel Energy Abstr. 2010, 35, 5043–5048. [Google Scholar] [CrossRef]
- Weng, D.M. Radiation Climate in China; China Meteorological Press: Beijing, China, 1997. [Google Scholar]
- Chen, R.S.; Kang, E.S.; Yang, J.P.; Lu, S.H.; Zhao, W.Z. Validation of five global radiation models with measured daily data in China. Energy Convers. Manag. 2004, 45, 1759–1769. [Google Scholar] [CrossRef]
- Chen, R.S.; Lu, S.H.; Kang, E.S.; Yang, J.P.; Ji, X.B. Estimating daily global radiation using two types of revised models in China. Energy Convers. Manag. 2006, 47, 865–878. [Google Scholar]
- Zhao, N.; Zeng, X.F.; Han, S.M. Solar radiation estimation using sunshine hour and air pollution index in China. Energy Convers. Manag. 2013, 76, 846–851. [Google Scholar] [CrossRef]
- Zhang, J.Y.; Zhao, L.; Deng, S.; Xu, W.C.; Zhang, Y. A critical review of the models used to estimate solar radiation. Renew. Sustain. Energy Rev. 2017, 70, 314–329. [Google Scholar] [CrossRef]
- Hargreaves, G.H.; Samani, Z.A. Estimating potential evapotranspiration. J. Irrig. Drain. Div. 1982, 108, 225–230. [Google Scholar]
- Annandale, J.; Jovanovic, N.; Benadé, N.; Allen, R. Software for missing data error analysis of Penman-Monteith reference evapotranspiration. Irrig. Sci. 2002, 21, 57–67. [Google Scholar]
- De, J.R.; Stewart, D.W. Estimating global solar radiation from common meteorological observations in western Canada. Can. J. Plant Sci. 1993, 73, 509–518. [Google Scholar]
- Hamby, A.L. Estimation of solar radiation for use in crop modeling. Agric. For. Meteorol. 1998, 91, 293–300. [Google Scholar]
- Wu, G.F.; Liu, Y.L.; Wang, T.J. Methods and strategy for modeling daily global solar radiation with measured meteorological data—A case study in Nanchang Station, China. Energy Convers. Manag. 2007, 48, 2447–2452. [Google Scholar] [CrossRef]
- Bristow, K.L.; Campbell, G.S. On the relationship between incoming solar radiation and daily maximum and minimum temperature. Agric. For. Meteorol. 1984, 31, 159–166. [Google Scholar] [CrossRef]
- Grillone, G.; Agnese, C.; D’asaro, F. Estimation of daily solar radiation from measured air temperature extremes in the Mid-Mediterranean area. J. Irrig. Drain. Eng. 2012, 138, 939–947. [Google Scholar] [CrossRef]
- Liu, X.Y.; Mei, X.R.; Li, Y.Z.; Wang, Q.S.; Jens, R.J.; Zhang, Y.Q.; Johnroy, P. Evaluation of temperature-based global solar radiation models in China. Agric. For. Meteorol. 2009, 149, 1433–1446. [Google Scholar] [CrossRef]
- Kimball, H.H. Solar and sky radiation measurements during June. Mon. Weather Rev. 1928, 56, 230. [Google Scholar] [CrossRef]
- Bennett, I. Monthly maps of mean daily insolation for the United States. Sol. Energy 1965, 9, 145–158. [Google Scholar] [CrossRef]
- Wang, B.Z.; Zhang, F.G.; Li, L.X. Solar energy resources in China. Acta Energ. Sol. Sin. 1980, 1, 229–241. [Google Scholar]
- Alsina, E.F.; Bortolini, M.; Gamberi, M.; Regattieri, A. Artificial neural network optimisation for monthly average daily global solar radiation prediction. Energy Convers. Manag. 2016, 120, 320–329. [Google Scholar] [CrossRef]
- Zou, L.; Wang, L.C.; Lin, A.W.; Zhu, H.J.; Peng, Y.L.; Zhao, Z.Z. Estimation of global solar radiation using an artificial neural network based on an interpolation technique in southeast China. J. Atmos. Sol. Terr. Phys. 2016, 146, 110–122. [Google Scholar] [CrossRef]
- Mehdizadeh, S.; Behmanesh, J.; Khalili, K. Comparison of artificial intelligence methods and empirical equations to estimate daily solar radiation. J. Atmos. Sol. Terr. Phys. 2016, 146, 215–227. [Google Scholar] [CrossRef]
- Voyant, C.; Notton, G.; Kalogirou, S.; Nivet, M.L.; Paoli, C.; Motte, F.; Fouilloy, A. Machine learning methods for solar radiation forecasting: A review. Renew. Energy 2017, 105, 569–582. [Google Scholar] [CrossRef]
- Liu, B.Y.H.; Jordan, R.C. The interrelationship and characteristic distribution of direct, diffuse and total solar radiation. Sol. Energy 1960, 4, 1–19. [Google Scholar] [CrossRef]
- Duffie, J.A.; Beckman, W.A. Solar Engineering of Thermal Processes, 4th ed.; John Wiley & Sons, Inc.: Hoboken, NJ, USA, 2013. [Google Scholar]
- Collares-Pereira, M.; Rabl, A. The average distribution of solar radiation-correlations between diffuse and hemispherical and between daily and hourly insolation values. Sol. Energy 1979, 22, 155–164. [Google Scholar] [CrossRef]
- Kalogirou, S.A.; Pashiardis, S.; Pashiardi, A. Statistical analysis and inter-comparison of the global solar radiation at two sites in Cyprus. Renew. Energy 2017, 101, 1102–1123. [Google Scholar] [CrossRef]
- Yao, W.X.; Li, Z.G.; Xiu, T.B.; Lu, Y.; Li, X.B. New decomposition models to estimate hourly global solar radiation from the daily value. Sol. Energy 2015, 120, 87–99. [Google Scholar] [CrossRef]
- Newell, T.A. Simple models for hourly to daily radiation ratio correlations. Sol. Energy 1983, 31, 339–342. [Google Scholar] [CrossRef]
- Zhang, S.N.; Tian, S.Y. The institution of the hourly solar radiation model. Acta Energy Sol. Sin. 1997, 18, 273–277. [Google Scholar]
- Jain, P.C. Comparison of techniques for the estimation of daily global irradiation and a new technique for the estimation of hourly global irradiation. Sol. Wind Technol. 1984, 1, 123–134. [Google Scholar] [CrossRef]
- Baig, A.; Akhter, P.; Mufti, A. A novel approach to estimate the clear day global radiation. Renew. Energy 1991, 1, 119–123. [Google Scholar] [CrossRef]
- American Society of Heating. Refrigerating, and Air Conditioning Engineers. In ASHRAE Handbook of Fundamentals; ASHRAE: New York, NY, USA, 1972. [Google Scholar]
- Nijegorodov, N. Improved ASHRAE model to predict hourly and daily solar radiation components in Botswana, Namibia, and Zimbabwe. Renew. Energy 1996, 9, 1270–1273. [Google Scholar] [CrossRef]
- Song, A.G.; Wang, F.R. Preliminary study on clear-day solar radiation model of Beijing region. Acta Energ. Sol. Sin. 1993, 14, 251–255. [Google Scholar]
- Al-Sanea, S.A.; Zedan, M.F.; Al-Ajlan, S.A. Adjustment factors for the ASHRAE clear-sky model based on solar-radiation measurements in Riyadh. Appl. Energy 2004, 79, 215–237. [Google Scholar] [CrossRef]
- Hottel, H.C. A simple model for estimating the transmittance of direct solar radiation through clear atmospheres. Sol. Energy 1976, 18, 129–134. [Google Scholar] [CrossRef]
- Jiang, Y.N. Correlation for diffuse radiation from global solar radiation and sunshine data at Beijing, China. J. Energy Eng. 2009, 135, 363–372. [Google Scholar] [CrossRef]
- Janjai, S.; Praditwong, P.; Moonin, C. A new model for computing monthly average daily diffuse radiation for Bangkok. Renew. Energy 1996, 9, 1283–1286. [Google Scholar] [CrossRef]
- Bai, J.S.; Chen, X.P.; Dobermann, A.; Yang, H.S.; Kennethg, C.; Zhang, F.S. Evaluation of NASA Satellite- and Model-Derived weather data for simulation of Maize yield potential in China. Agron. J. 2010, 102, 9–16. [Google Scholar] [CrossRef]
- Kaplanis, S.; Kumar, J.; Kaplani, E. On a universal model for the prediction of the daily global solar radiation. Renew. Energy 2016, 91, 178–188. [Google Scholar] [CrossRef] [Green Version]
- Bakirci, K. Prediction of global solar radiation and comparison with satellite data. J. Atmos. Sol. Terr. Phys. 2017, 152, 41–49. [Google Scholar] [CrossRef]
- Ma, X.Q. Estimation of Solar Radiation Using Nasa/Power Data. Master’s Thesis, Southwest University, Chongqing, China, 2015. [Google Scholar]
- National Meteorological Information Center, China Meteorological Administration. Available online: http://data.cma.cn/site/index.html (accessed on 15 March 2018).
- Zhang, J.F. Estimation Models of Solar Radiation at Different Time Scales. Master’s Thesis, Southwest University, Chongqing, China, 2013. [Google Scholar]
- Elbadry, M.M.; Ghali, A. Temperature Variations in Concrete Bridges. J. Struct. Eng. 1983, 109, 2355–2374. [Google Scholar] [CrossRef]
- Zhang, X.Y. Practical Handbook of Chemistry; National Defense Industry Press: Beijing, China, 2011. [Google Scholar]
- Chen, X.Y. Research on Sunlight Thermal Effect of Integral Abutment Bridge. Master’s Thesis, Fuzhou University, Fuzhou, China, 2012. [Google Scholar]
Figure 1.
Automated meteorological station.

Figure 2.
Map of eight cities in Fujian.
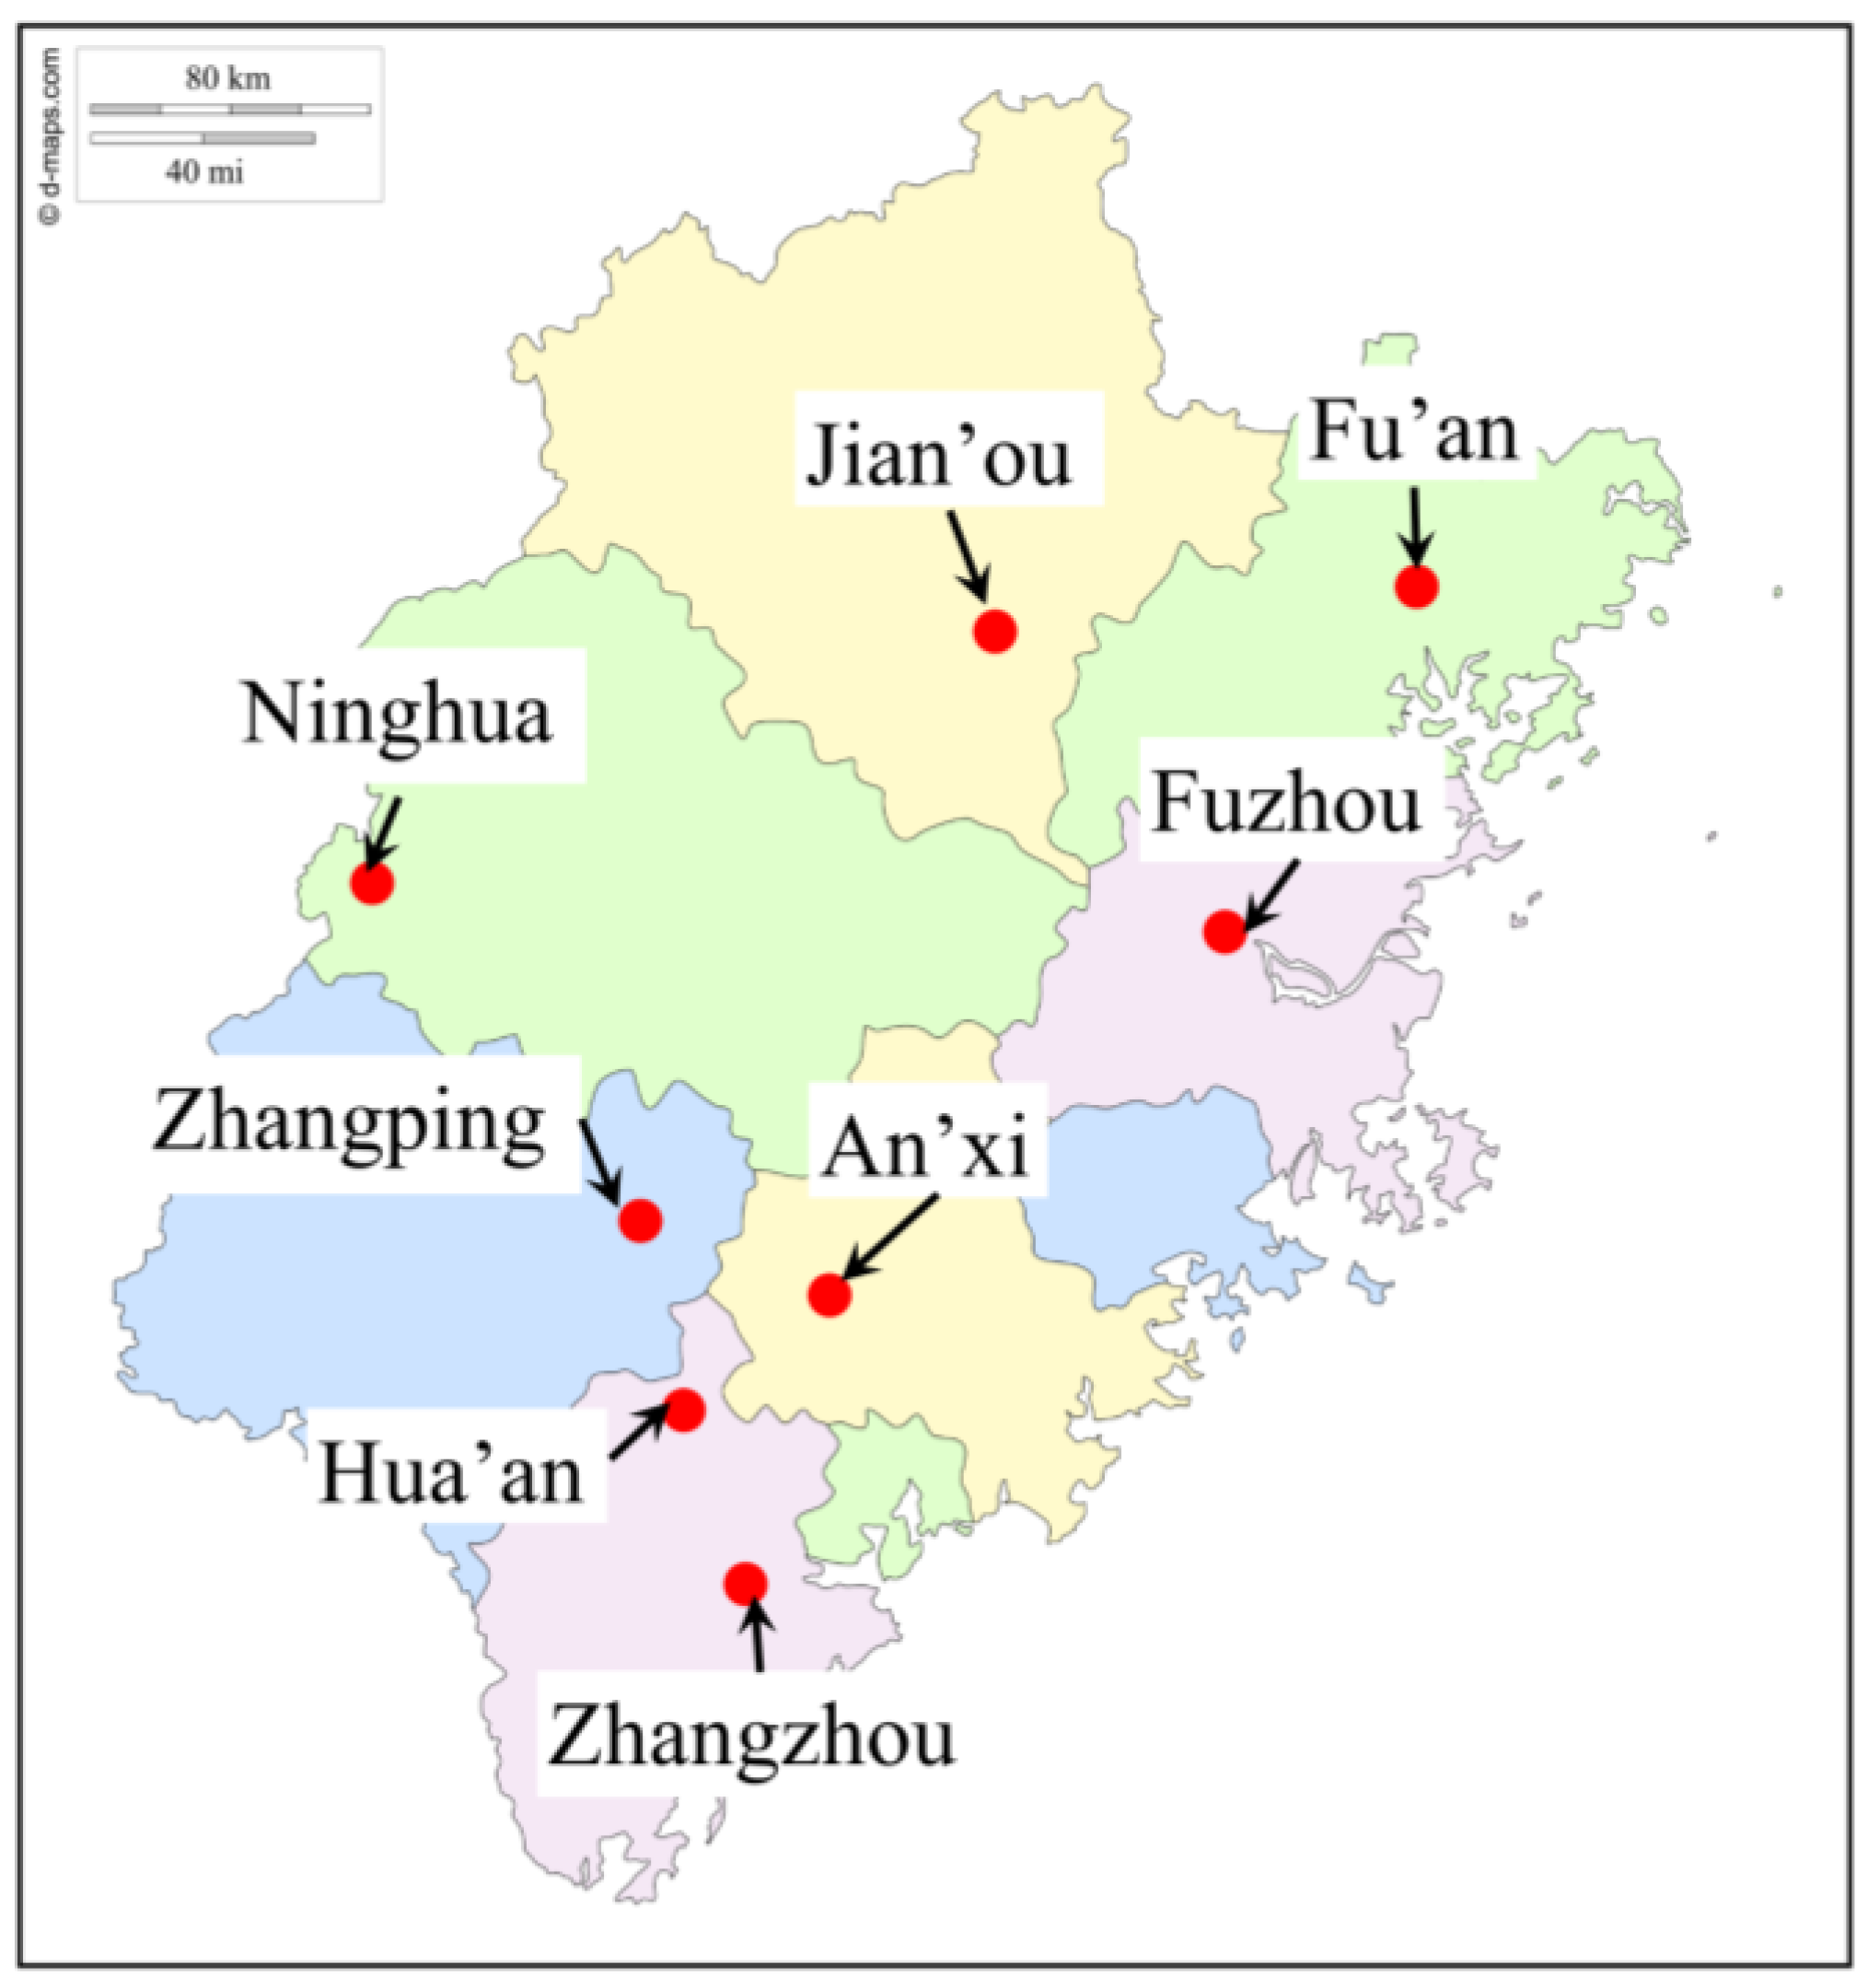
Figure 3.
Hourly solar radiation: (a) measured global solar radiation; (b) measured diffuse solar radiation; and (c) calculated beam solar radiation.
Figure 3.
Hourly solar radiation: (a) measured global solar radiation; (b) measured diffuse solar radiation; and (c) calculated beam solar radiation.
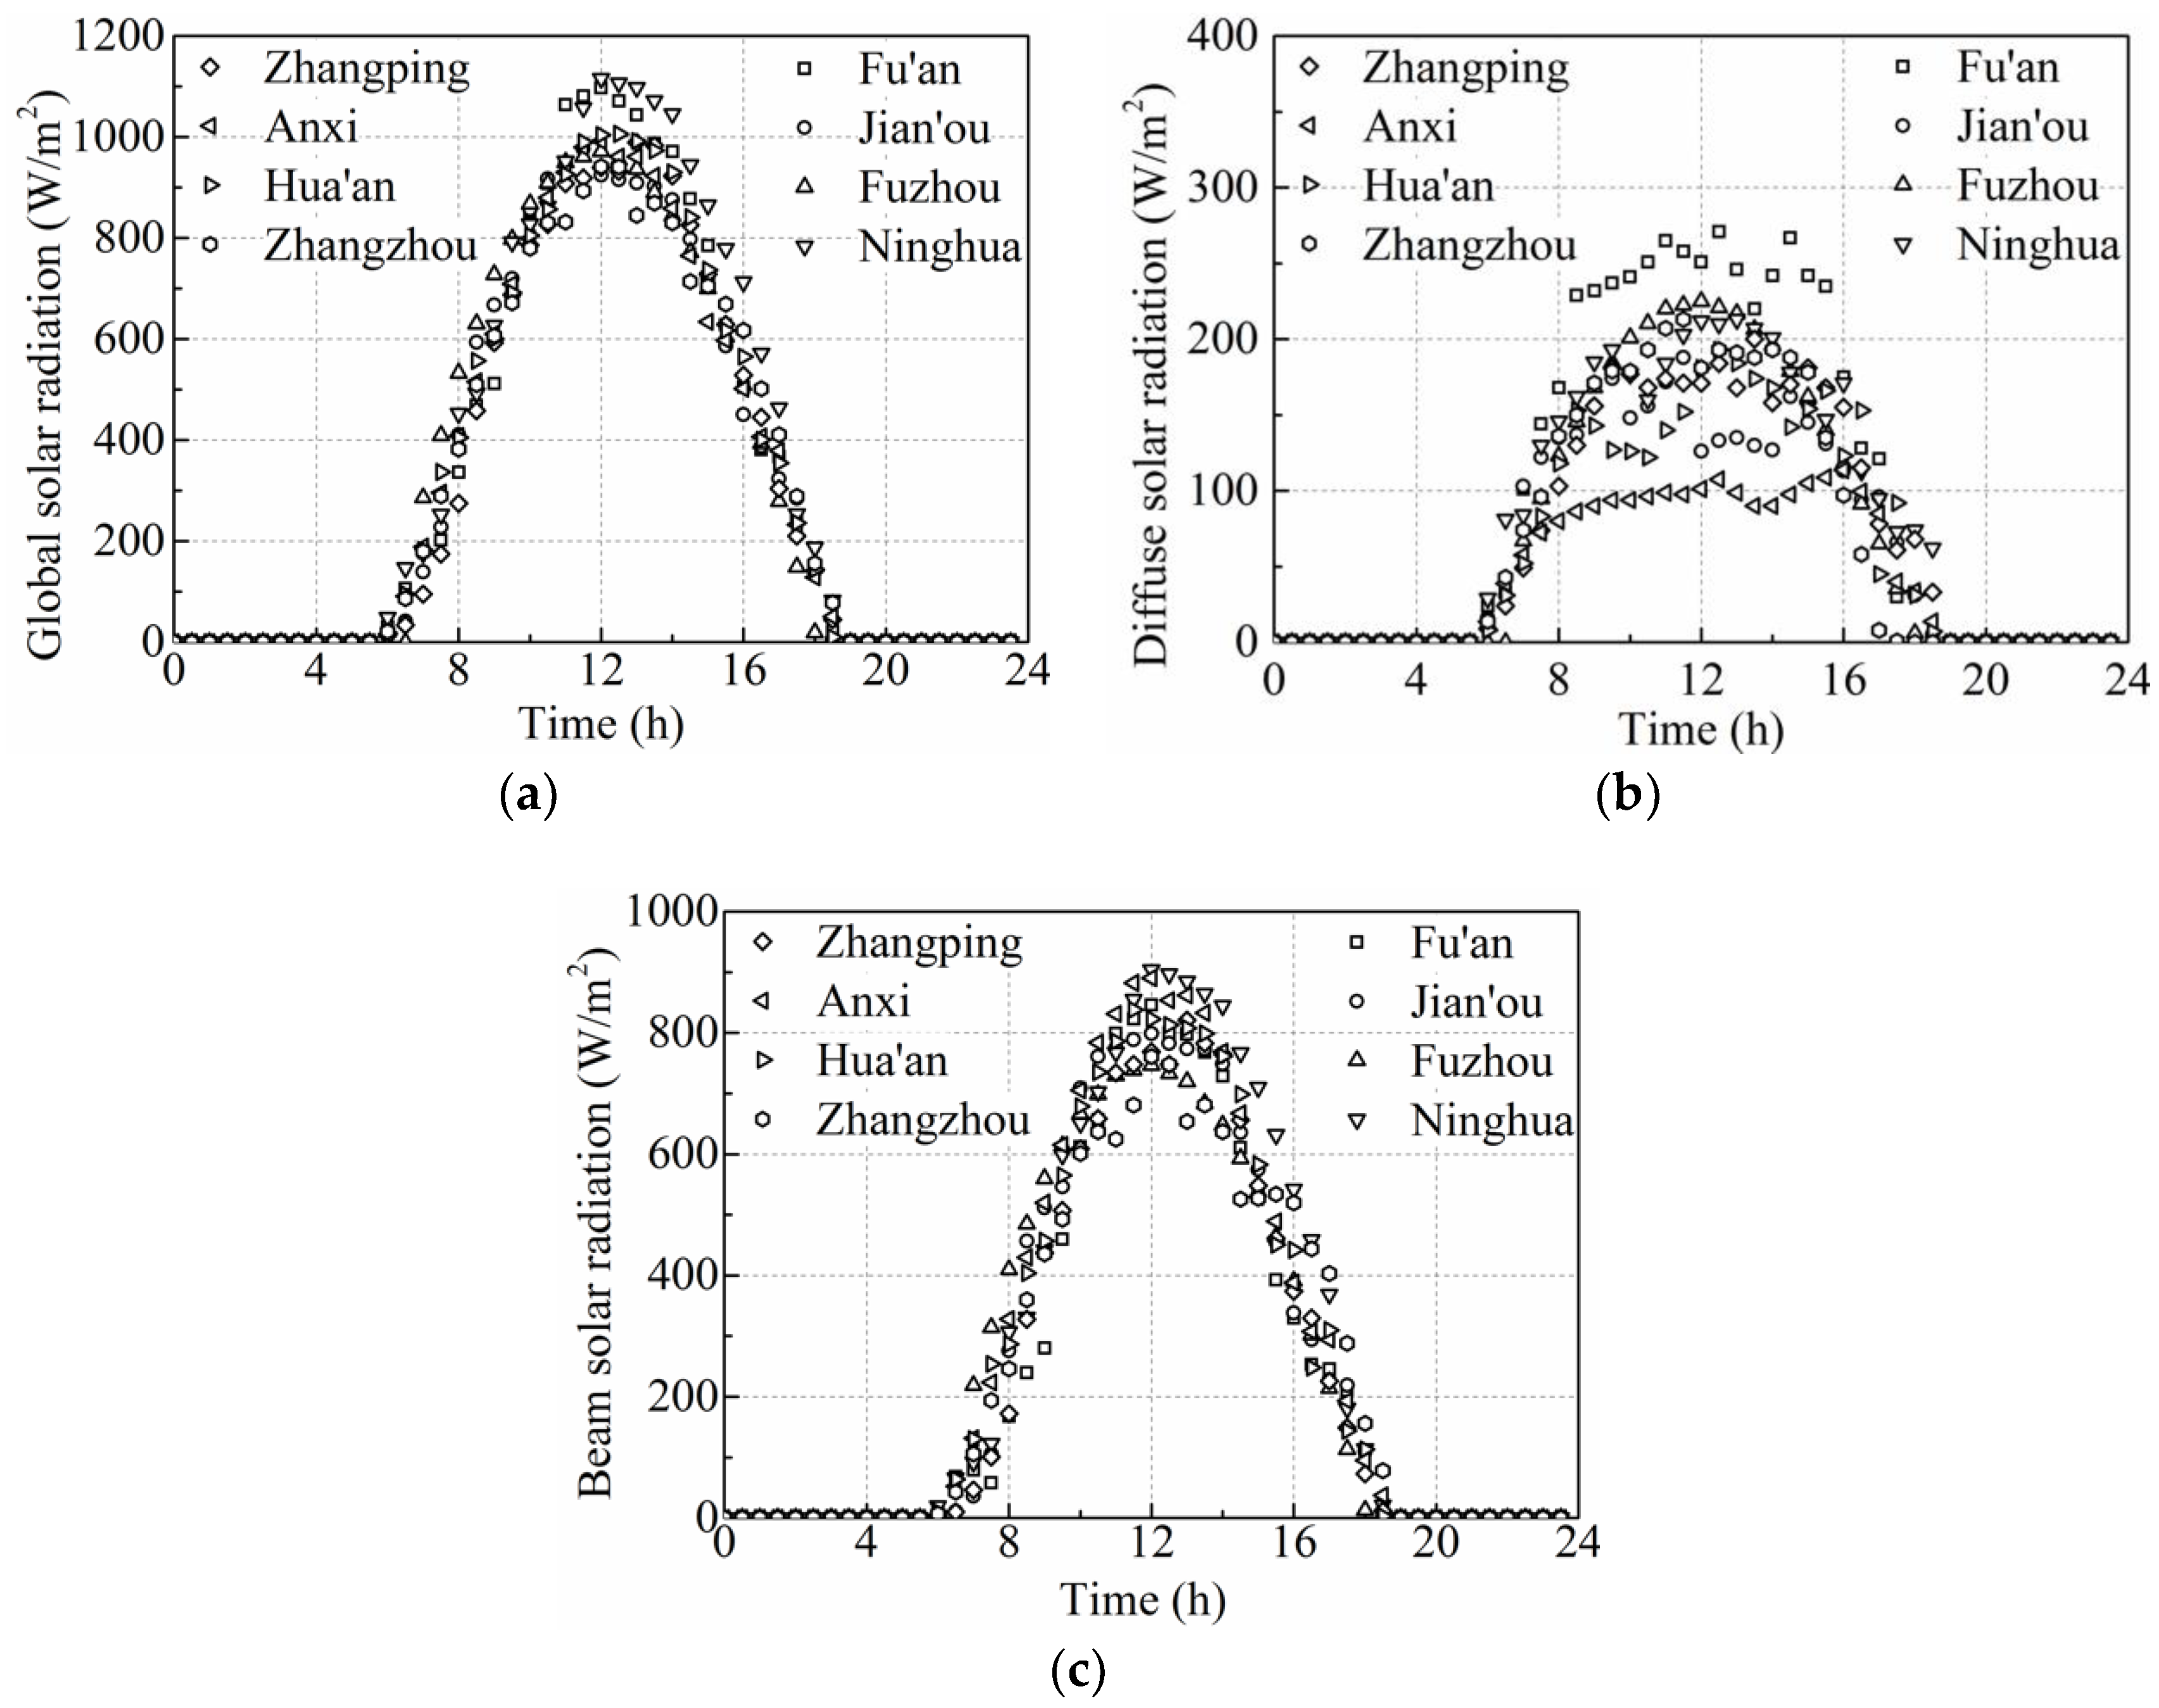
Figure 4.
Linear regression using different time scales: (a) daily time scale; (b) monthly time scale; and (c) yearly time scale.
Figure 4.
Linear regression using different time scales: (a) daily time scale; (b) monthly time scale; and (c) yearly time scale.
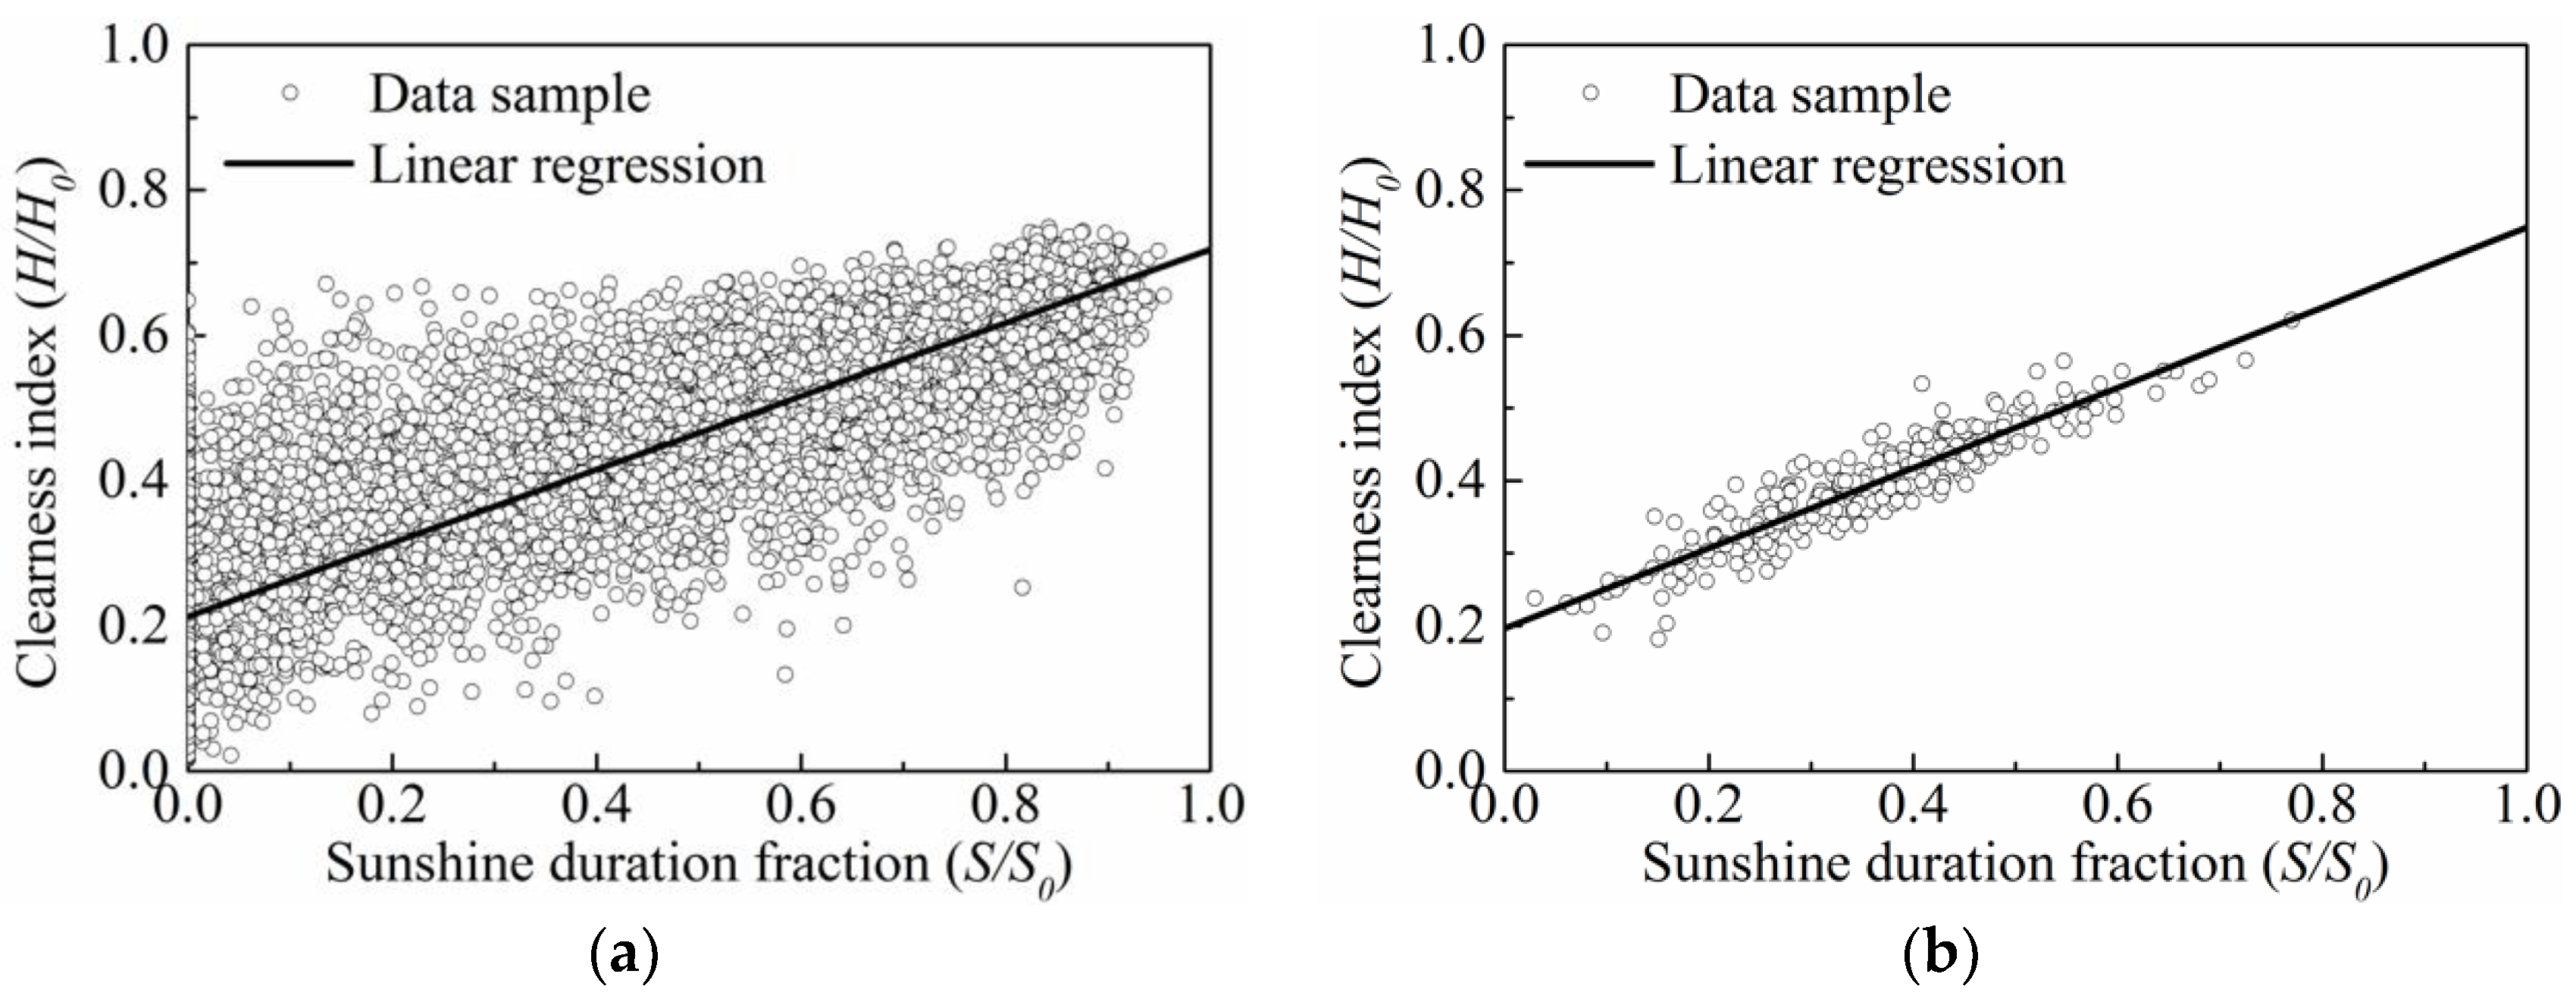

Figure 5.
Comparison between measured and estimated hourly global solar radiation curves for eight cities in Fujian: (a) Fu’an (10 August 2016); (b) Jian’ou (7 August 2016); (c) Fuzhou (2 August 2010); (d) Ninghua (4 August 2016); (e) Zhangping (27 July 2016); (f) Anxi (2 August 2015); (g) Hua’an (30 July 2016); and (h) Zhangzhou (31 July 2014).


Figure 6.
Comparison between measured and estimated hourly beam solar radiation curves for eight cities in Fujian: (a) Fu’an (10 August 2016); (b) Jian’ou (7 August 2016); (c) Fuzhou (2 August 2010); (d) Ninghua (4 August 2016); (e) Zhangping (27 July 2016); (f) Anxi (2 August 2015); (g) Hua’an (30 July 2016); and (h) Zhangzhou (31 July 2014).


Figure 7.
Comparison between measured and estimated hourly diffuse solar radiation curves for eight cities in Fujian: (a) Fu’an (10 August 2016); (b) Jian’ou (7 August 2016); (c) Fuzhou (2 August 2010); (d) Ninghua (4 August 2016); (e) Zhangping (27 July 2016); (f) Anxi (2 August 2015); (g) Hua’an (30 July 2016); and (h) Zhangzhou (31 July 2014).

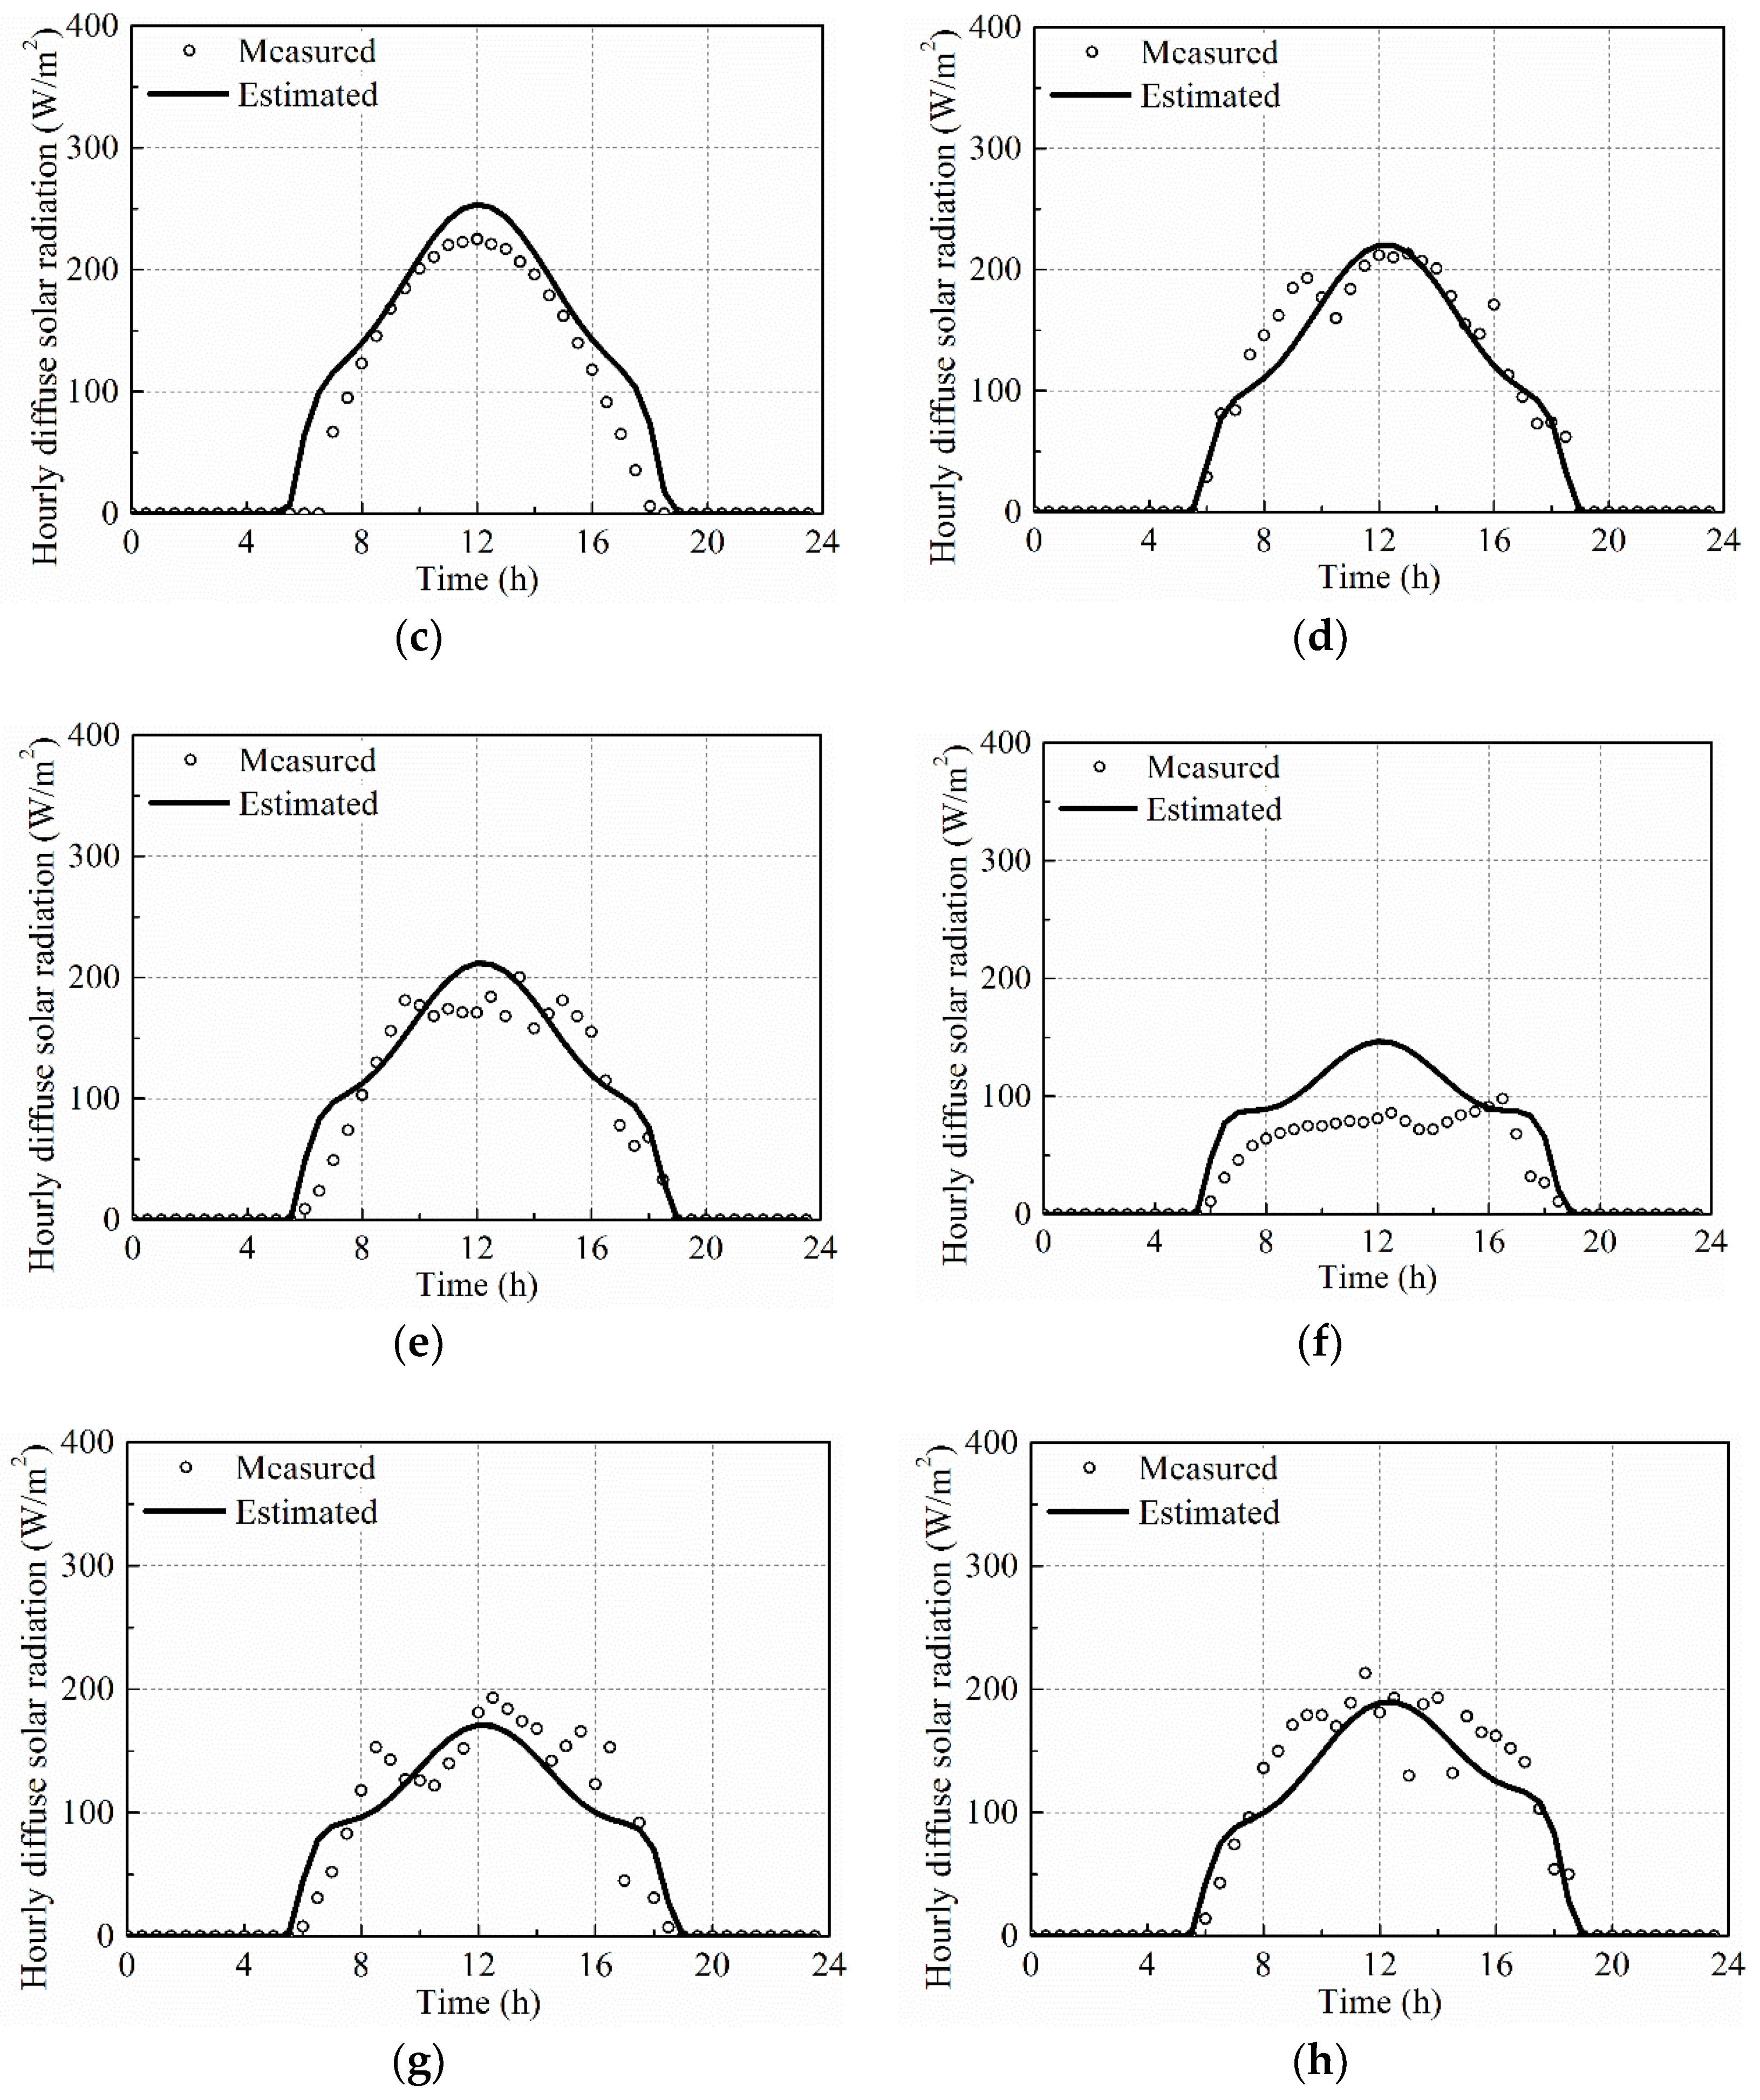
Figure 8.
Maximum solar radiation for 56 cities in Fujian: (a) maximum global solar radiation; (b) maximum beam solar radiation; and (c) maximum diffuse solar radiation.
Figure 8.
Maximum solar radiation for 56 cities in Fujian: (a) maximum global solar radiation; (b) maximum beam solar radiation; and (c) maximum diffuse solar radiation.

Figure 9.
Layout of cross-section of box girder (cm).
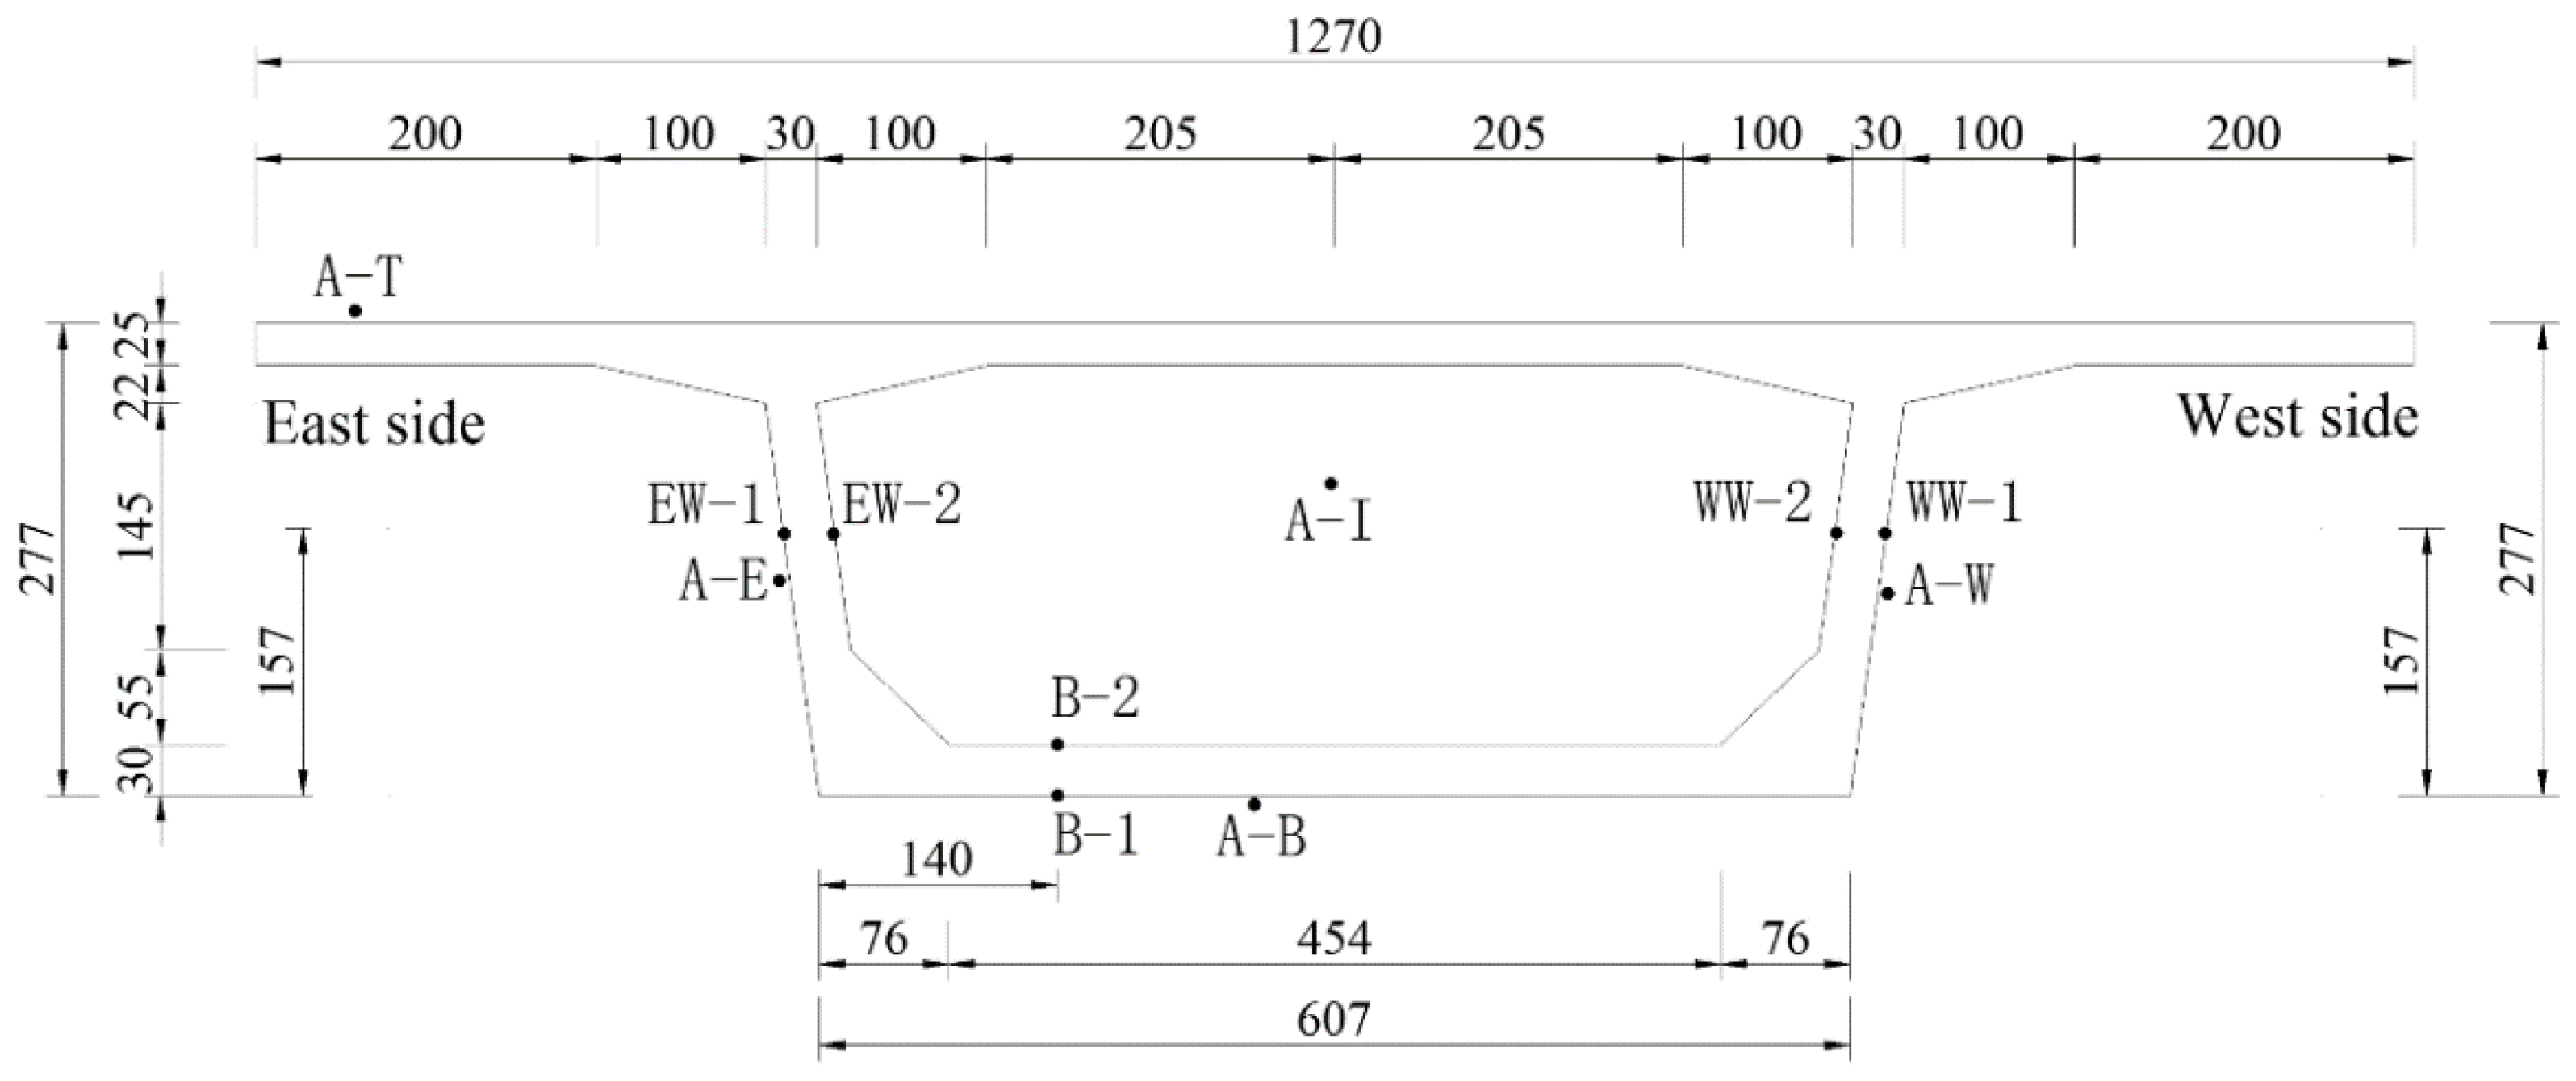
Figure 10.
Finite element model of cross-section of box girder.

Figure 11.
Influence of solar radiation on temperature distribution on cross-section of box girder in summer (2 August 2010): (a) east web (EW-1); (b) east web (EW-2); (c) west web (WW-1); (d) west web (WW-2); (e) bottom flange (B-1); and (f) bottom flange (B-2).
Figure 11.
Influence of solar radiation on temperature distribution on cross-section of box girder in summer (2 August 2010): (a) east web (EW-1); (b) east web (EW-2); (c) west web (WW-1); (d) west web (WW-2); (e) bottom flange (B-1); and (f) bottom flange (B-2).


Figure 12.
Temperature contour plots of box girder at 15:00 on 2 August 2010: (a) with solar radiation; and (b) without solar radiation.
Figure 12.
Temperature contour plots of box girder at 15:00 on 2 August 2010: (a) with solar radiation; and (b) without solar radiation.

Figure 13.
Influence of solar radiation on temperature distribution on cross-section of box girder in winter (16 December 2010): (a) east web (EW-1); and (b) bottom flange (B-1).
Figure 13.
Influence of solar radiation on temperature distribution on cross-section of box girder in winter (16 December 2010): (a) east web (EW-1); and (b) bottom flange (B-1).
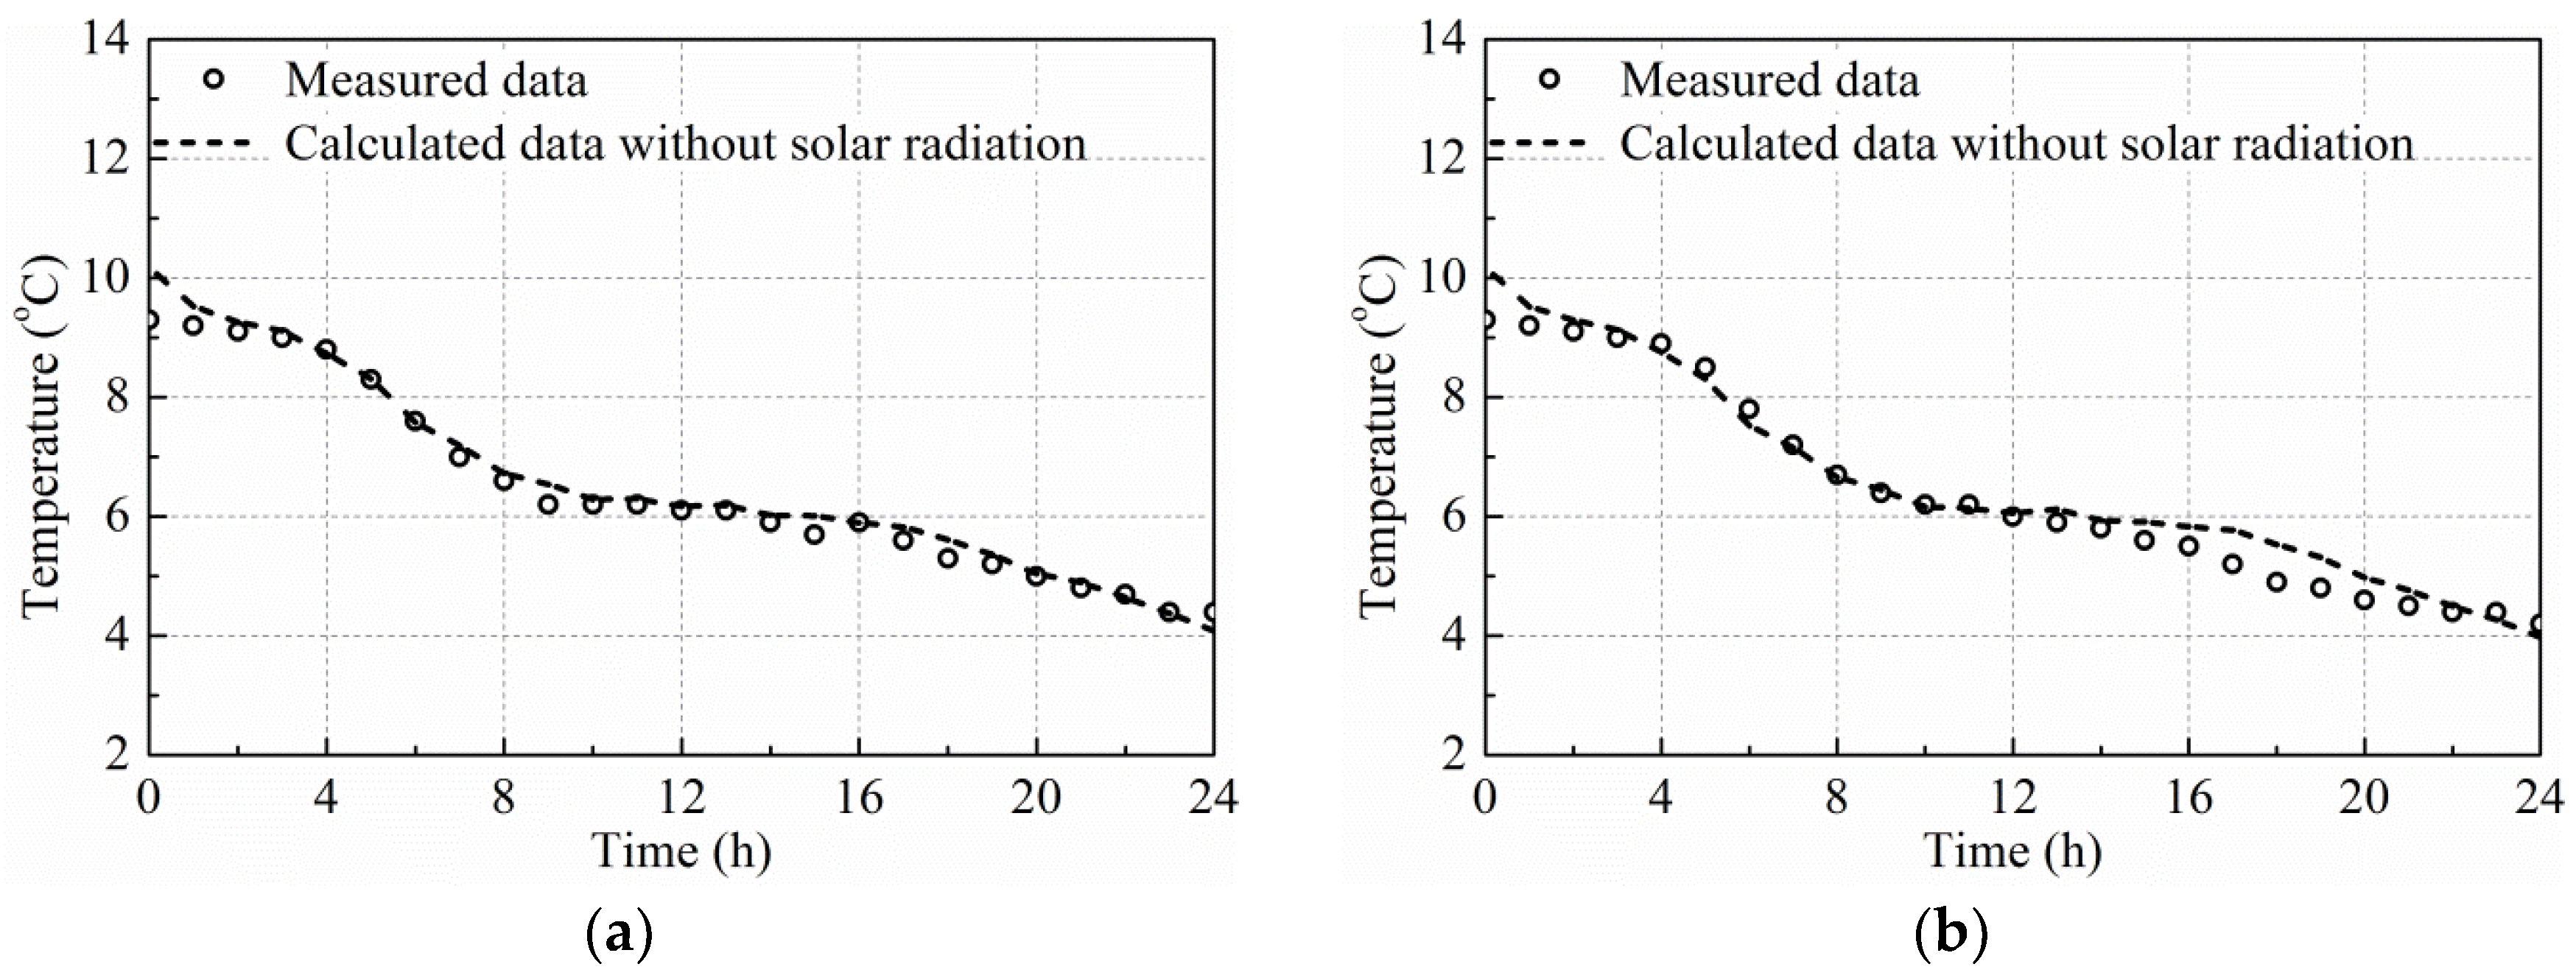
Figure 14.
Temperature contour plots of box girder at 24:00 on 16 December 2010: (a) with solar radiation; and (b) without solar radiation.
Figure 14.
Temperature contour plots of box girder at 24:00 on 16 December 2010: (a) with solar radiation; and (b) without solar radiation.


Figure 15.
Layout of cross-section of side-by-side box girder (cm).

Figure 16.
Finite element model of cross-section of side-by-side box girder.
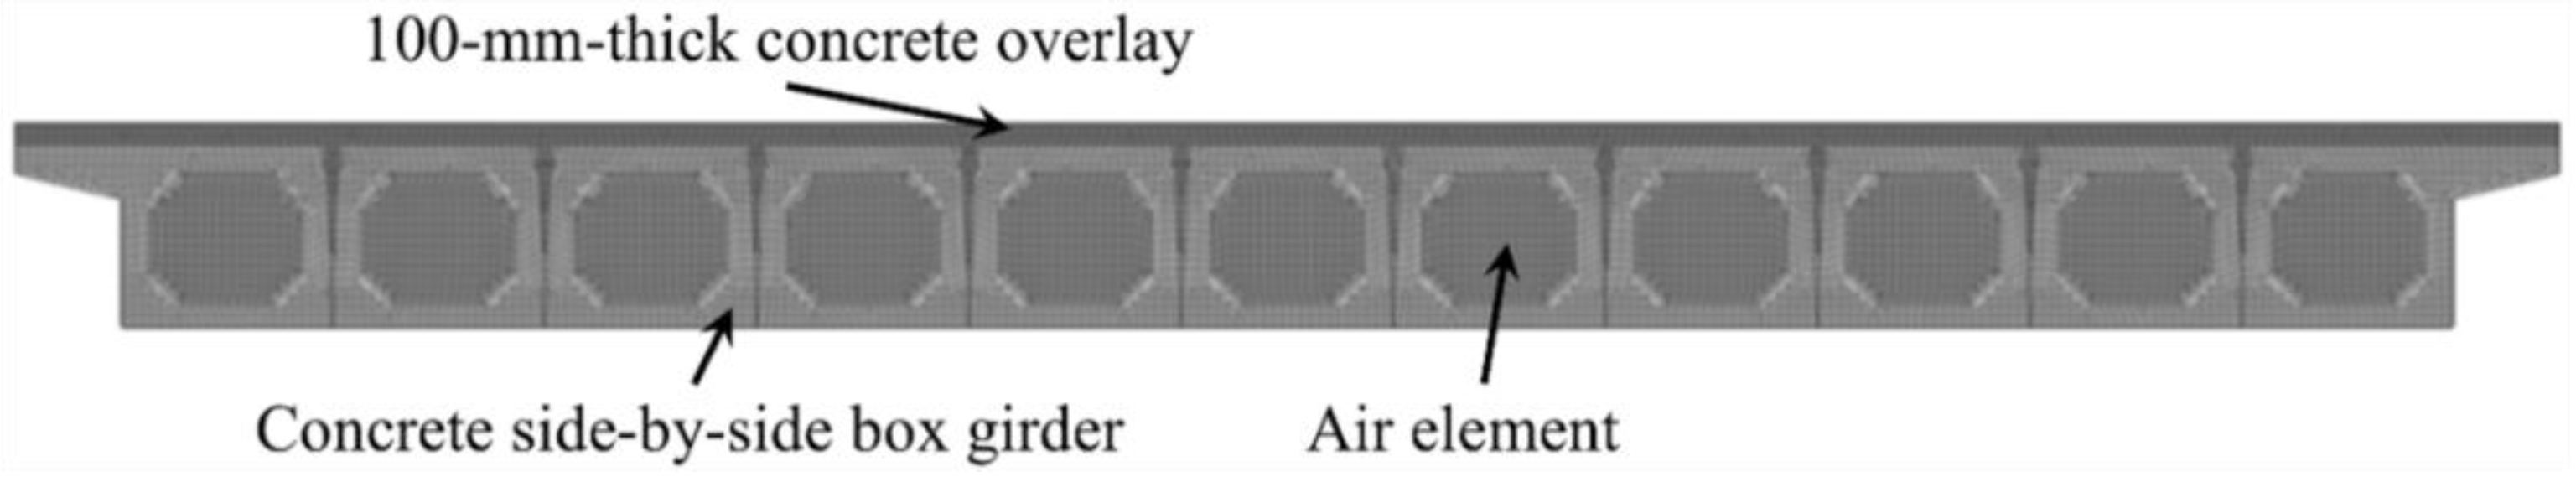
Figure 17.
Influence of solar radiation on temperature distribution on cross-section of side-by-side box girder in summer (31 July 2014): (a) top flange (1-T); (b) top flange (11-T); (c) web (1-W); (d) web (11-W); (e) bottom flange (1-B); and (f) bottom flange (11-B).
Figure 17.
Influence of solar radiation on temperature distribution on cross-section of side-by-side box girder in summer (31 July 2014): (a) top flange (1-T); (b) top flange (11-T); (c) web (1-W); (d) web (11-W); (e) bottom flange (1-B); and (f) bottom flange (11-B).
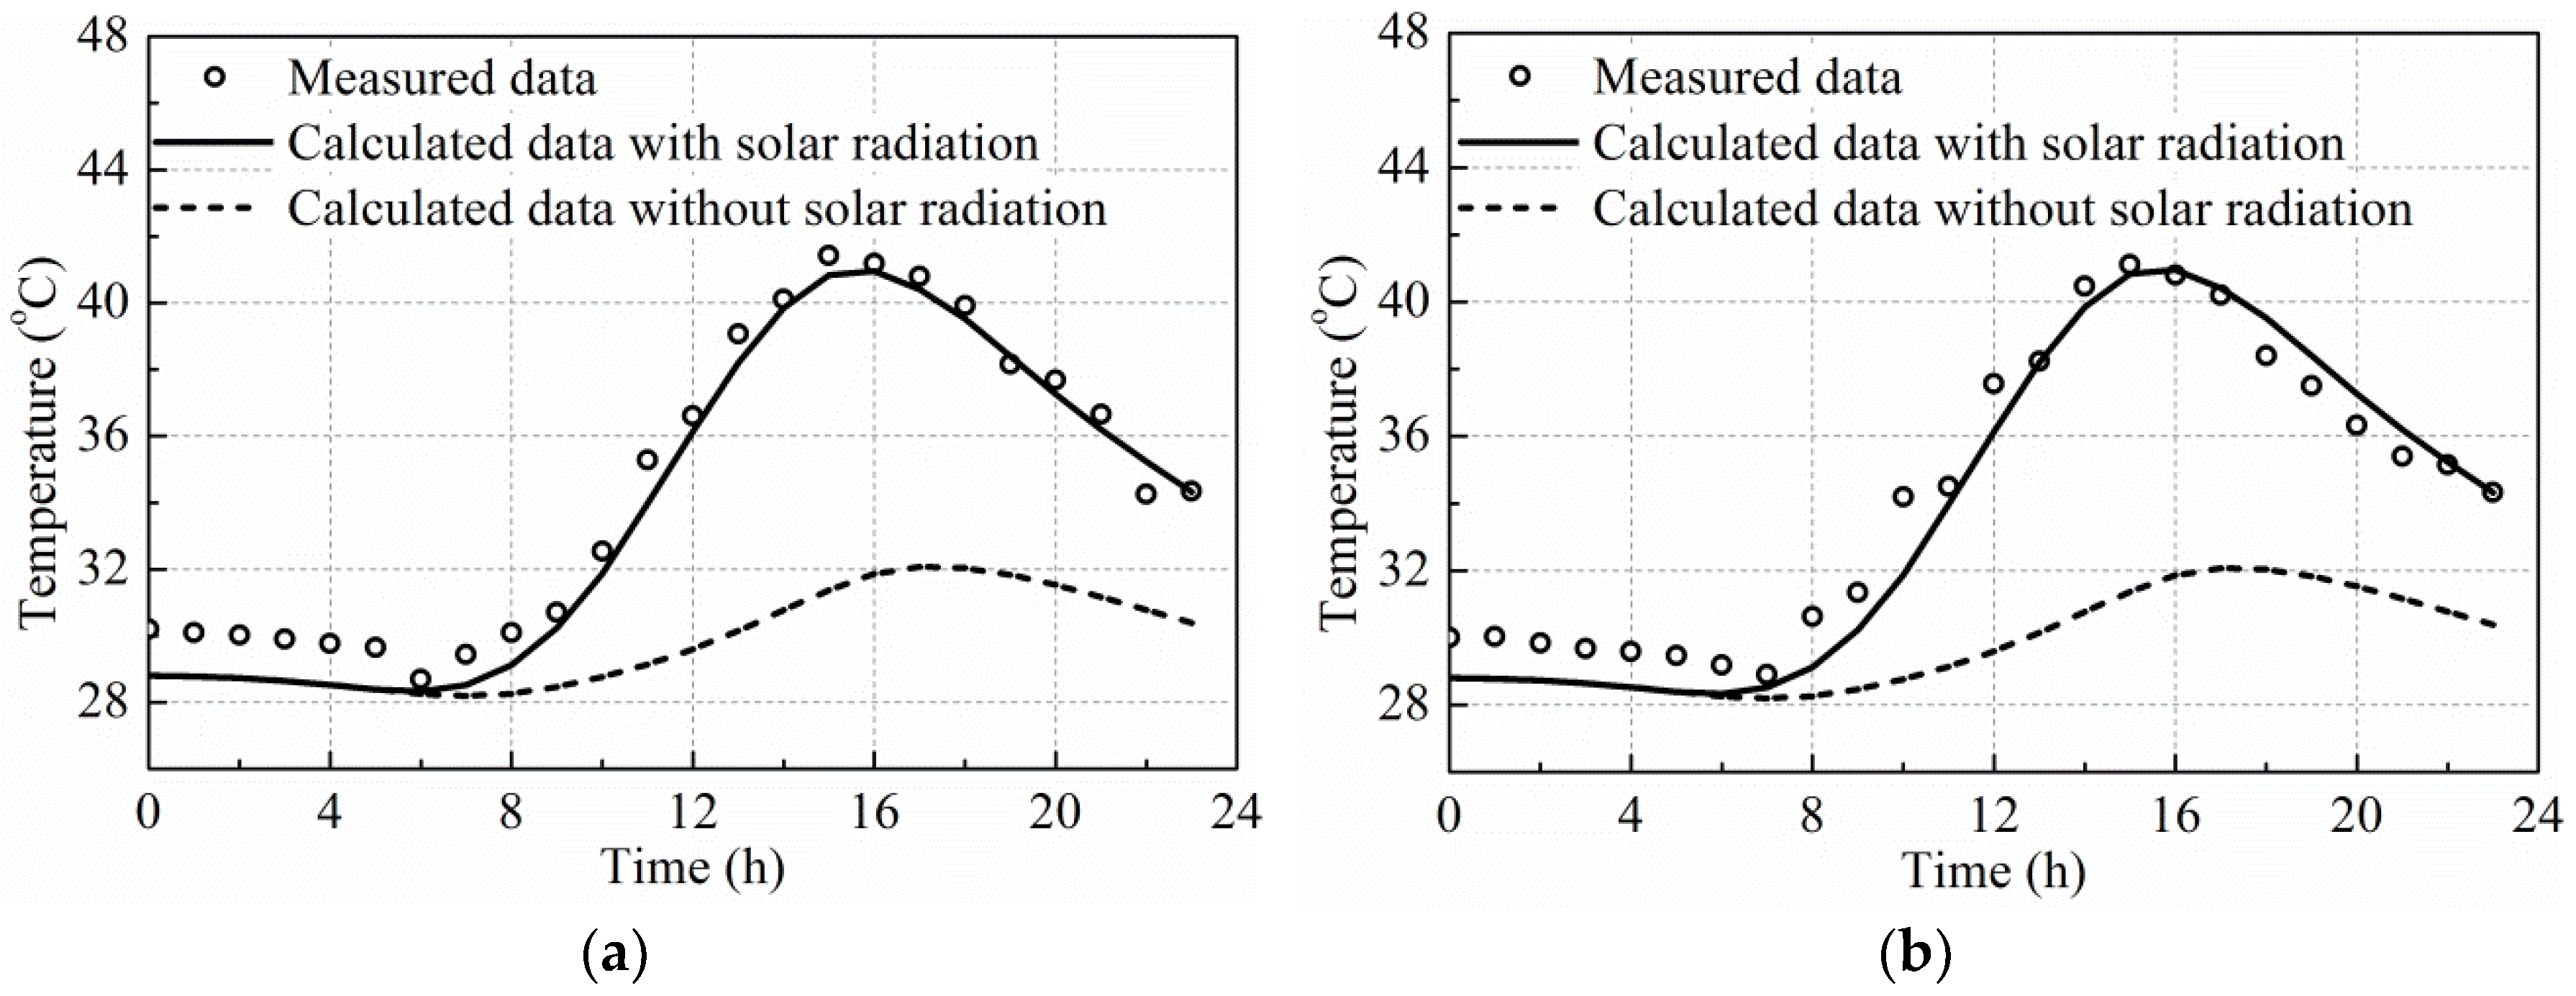
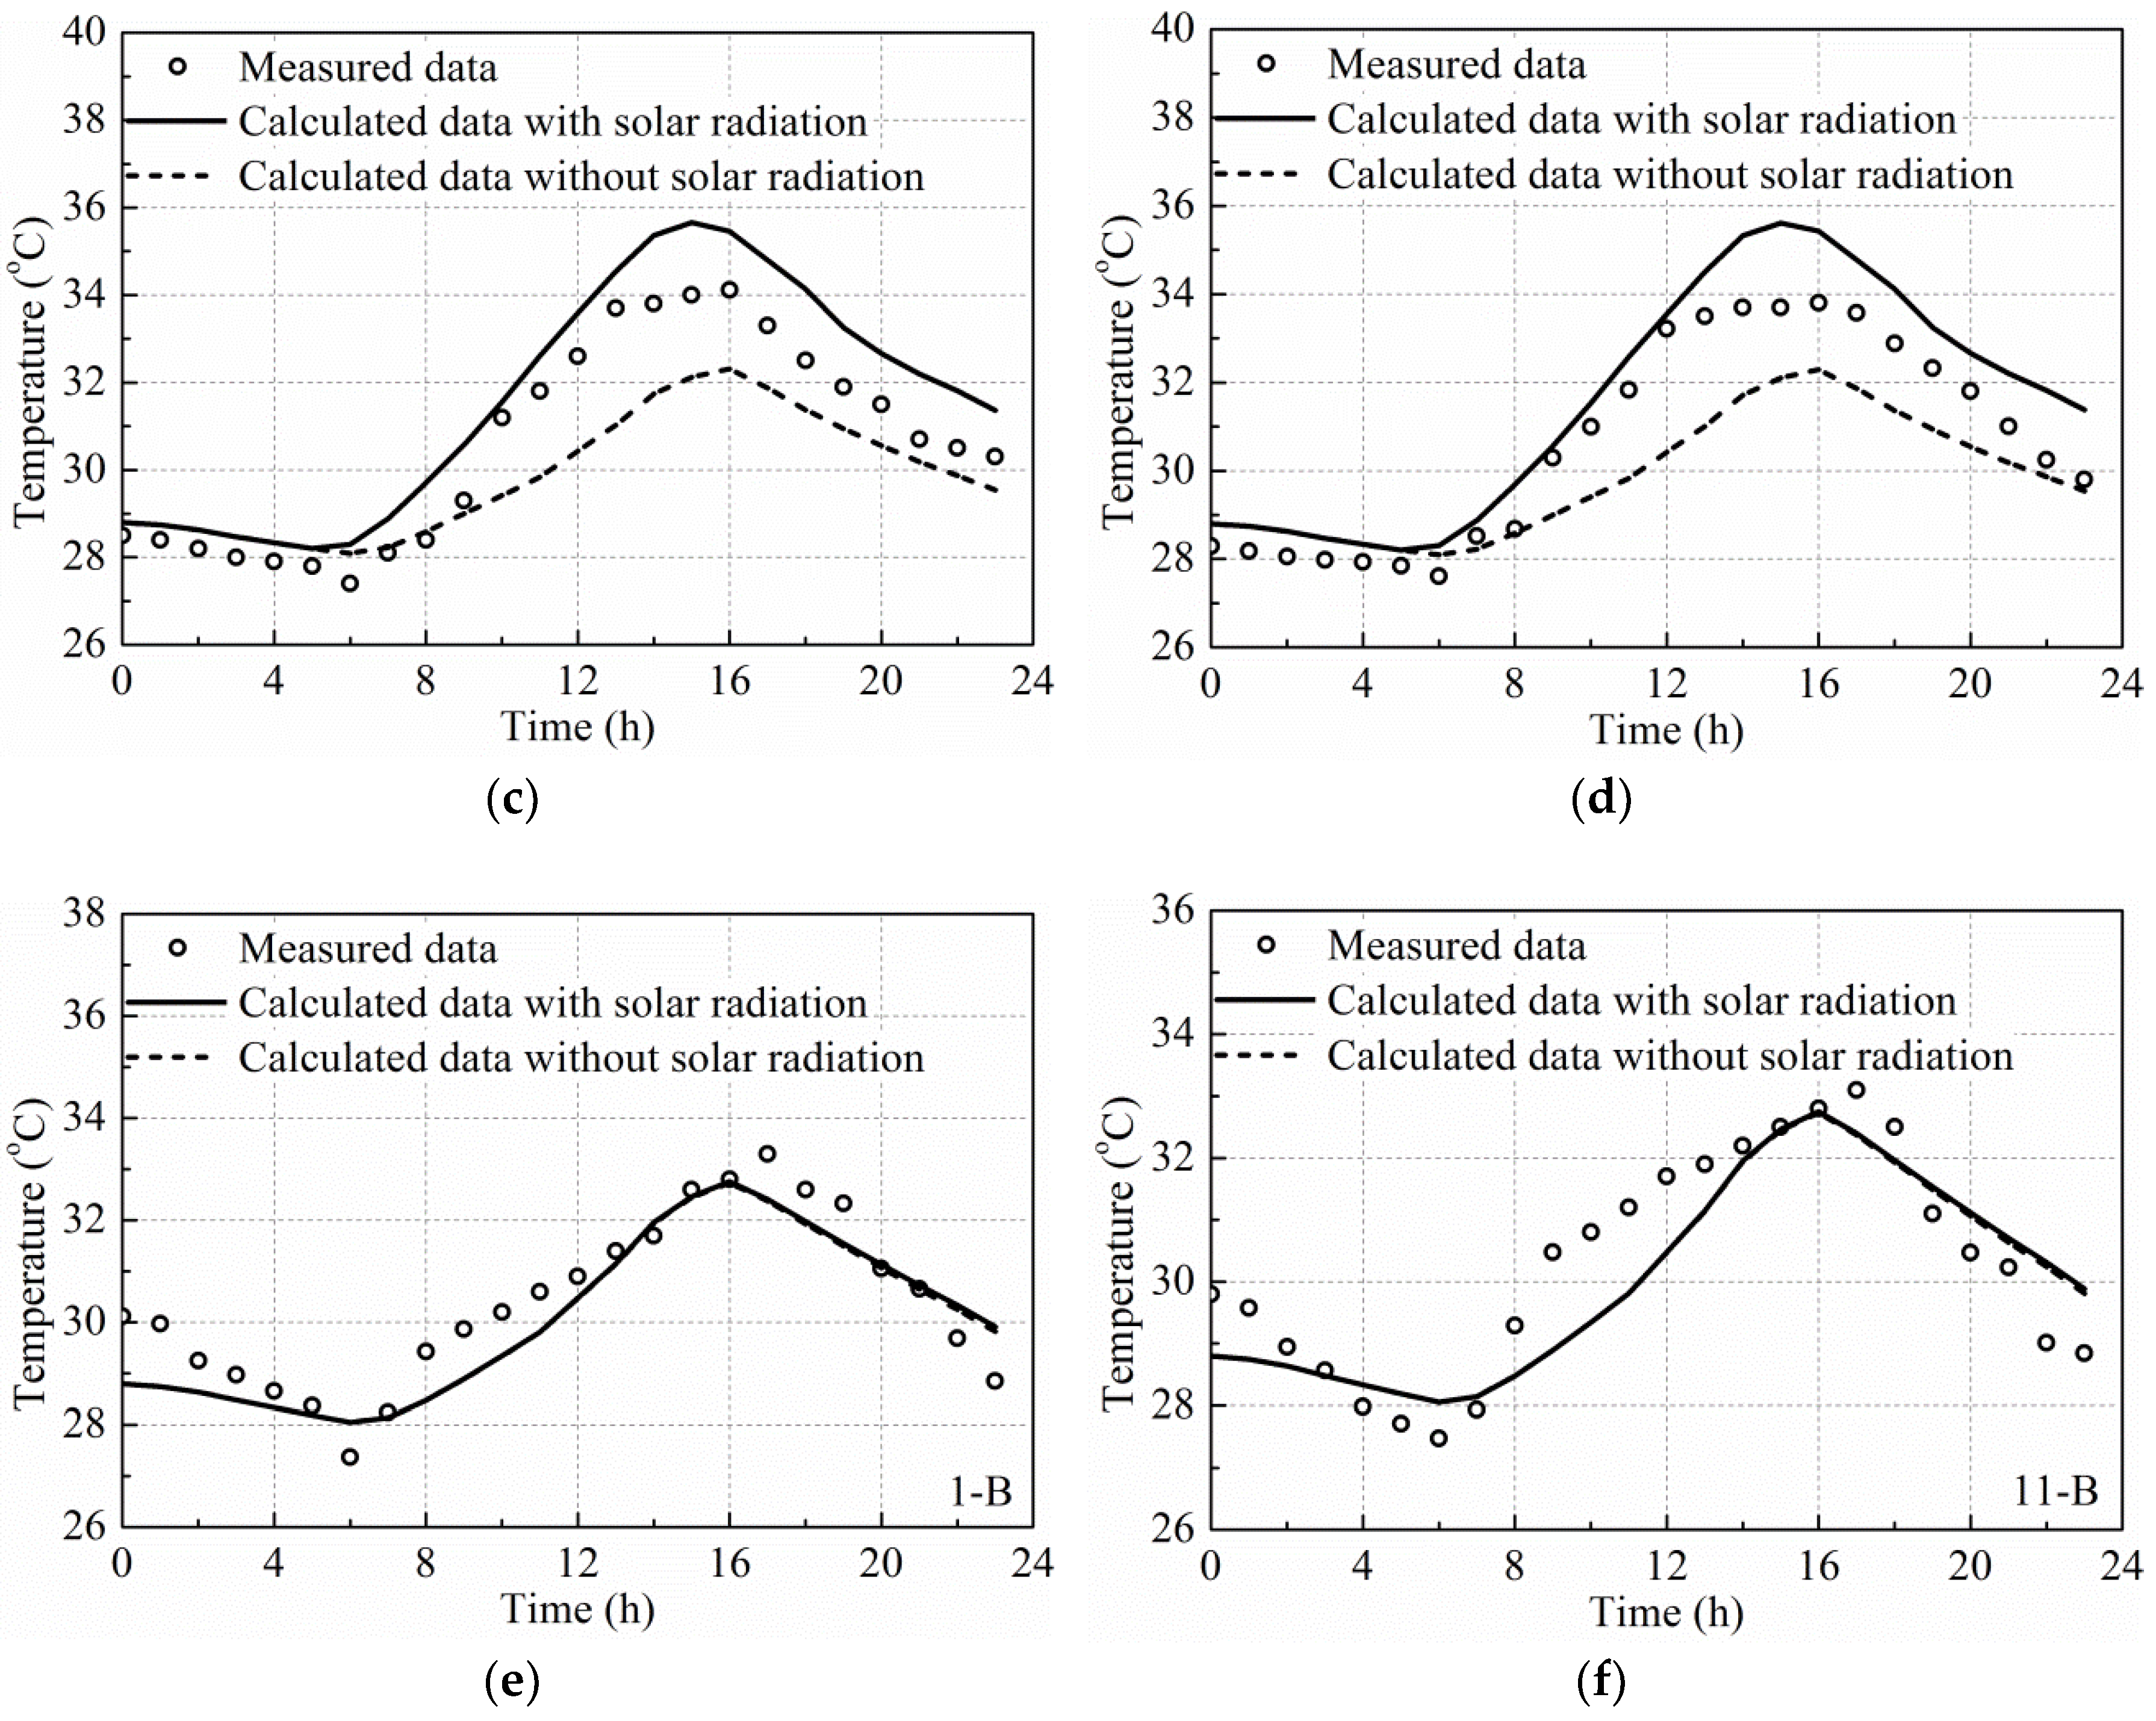
Figure 18.
Temperature contour plots of side-by-side box girder at 16:00 on 31 July 2014: (a) with solar radiation; and (b) without solar radiation.
Figure 18.
Temperature contour plots of side-by-side box girder at 16:00 on 31 July 2014: (a) with solar radiation; and (b) without solar radiation.


Figure 19.
Layout of cross-section of T-shaped girder (cm).

Figure 20.
Finite element model of cross-section of T-shaped girder.

Figure 21.
Influence of solar radiation on temperature distribution on cross-section of T-shaped girder in summer: (a) top flange (T-1); (b) web (1-W); (c) web (2-W); and (d) bottom flange (4-B).
Figure 21.
Influence of solar radiation on temperature distribution on cross-section of T-shaped girder in summer: (a) top flange (T-1); (b) web (1-W); (c) web (2-W); and (d) bottom flange (4-B).

Figure 22.
Temperature contour plots of T-shaped girder at 15:00 on 23 August 2012: (a) with solar radiation; and (b) without solar radiation.
Figure 22.
Temperature contour plots of T-shaped girder at 15:00 on 23 August 2012: (a) with solar radiation; and (b) without solar radiation.

Table 1.
Linear regression analysis of clearness index and sunshine duration fraction using different time scales.
Table 1.
Linear regression analysis of clearness index and sunshine duration fraction using different time scales.
| Time Scale Types | Data Points | a’ | b’ | γxy | RMSE |
|---|---|---|---|---|---|
| Daily | 8030 | 0.213 | 0.505 | 0.86 | 0.10 |
| Monthly | 264 | 0.196 | 0.553 | 0.92 | 0.03 |
| Yearly | 22 | 0.242 | 0.422 | 0.79 | 0.01 |
Table 2.
Linear regression analysis of clearness index and sunshine duration fraction using sunshine duration for four cities.
Table 2.
Linear regression analysis of clearness index and sunshine duration fraction using sunshine duration for four cities.
| Solar Radiation Data Source | Sunshine Duration Data Source | a’ | b’ | γxy | RMSE |
|---|---|---|---|---|---|
| Hua’an | Nanping | 0.216 | 0.467 | 0.81 | 0.05 |
| Hua’an | Fuzhou | 0.217 | 0.519 | 0.82 | 0.06 |
| Hua’an | Yong’an | 0.212 | 0.519 | 0.85 | 0.06 |
| Hua’an | Xiamen | 0.178 | 0.522 | 0.90 | 0.04 |
Table 3.
Linear regression analysis of clearness index and sunshine duration fraction for eight cities.
Table 3.
Linear regression analysis of clearness index and sunshine duration fraction for eight cities.
| City | Solar Radiation Data Source | Sunshine Duration Data Source | a’ | b’ | γxy | RMSE |
|---|---|---|---|---|---|---|
| Fu’an | Fu’an | Fuzhou | 0.211 | 0.546 | 0.84 | 0.05 |
| Jian’ou | Jian’ou | Nanping | 0.180 | 0.537 | 0.84 | 0.05 |
| Fuzhou | Fuzhou | Fuzhou | 0.196 | 0.553 | 0.92 | 0.03 |
| Ninghua | Ninghua | Yong’an | 0.179 | 0.571 | 0.85 | 0.05 |
| Zhangping | Zhangping | Yong’an | 0.213 | 0.520 | 0.84 | 0.05 |
| Anxi | Anxi | Xiamen | 0.197 | 0.479 | 0.88 | 0.04 |
| Hua’an | Hua’an | Xiamen | 0.178 | 0.522 | 0.90 | 0.04 |
| Zhangzhou | Zhangzhou | Xiamen | 0.196 | 0.506 | 0.89 | 0.04 |
© 2018 by the authors. Licensee MDPI, Basel, Switzerland. This article is an open access article distributed under the terms and conditions of the Creative Commons Attribution (CC BY) license (http://creativecommons.org/licenses/by/4.0/).
Share and Cite
MDPI and ACS Style
Xue, J.; Lin, J.; Briseghella, B.; Tabatabai, H.; Chen, B. Solar Radiation Parameters for Assessing Temperature Distributions on Bridge Cross-Sections. Appl. Sci. 2018, 8, 627. https://doi.org/10.3390/app8040627
AMA Style
Xue J, Lin J, Briseghella B, Tabatabai H, Chen B. Solar Radiation Parameters for Assessing Temperature Distributions on Bridge Cross-Sections. Applied Sciences. 2018; 8(4):627. https://doi.org/10.3390/app8040627
Chicago/Turabian StyleXue, Junqing, Jianhui Lin, Bruno Briseghella, Habib Tabatabai, and Baochun Chen. 2018. "Solar Radiation Parameters for Assessing Temperature Distributions on Bridge Cross-Sections" Applied Sciences 8, no. 4: 627. https://doi.org/10.3390/app8040627
Note that from the first issue of 2016, this journal uses article numbers instead of page numbers. See further details here.