Article

Experimental Study of Damage Development in Salt Rock under Uniaxial Stress Using Ultrasonic Velocity and Acoustic Emissions

1
Structural Health Monitoring and Control Institute, Shijiazhuang Tiedao University, Shijiazhuang 050043, Hebei, China
2
State Key Laboratory of Geomechanics and Geotechnical Engineering, Institute of Rock and Soil Mechanics, Chinese Academy of Sciences, Wuhan 430071, Hubei, China
3
Department of Energy and Mineral Engineering, G3 Center and EMS Energy Institute, Pennsylvania State University, University Park, PA 16802, USA
4
College of Pipeline and Civil Engineering, China University of Petroleum, Qingdao 266555, China
*
Author to whom correspondence should be addressed.
Appl. Sci. 2018, 8(4), 553; https://doi.org/10.3390/app8040553
Submission received: 21 February 2018 / Revised: 19 March 2018 / Accepted: 27 March 2018 / Published: 4 April 2018

Abstract

:
Ultrasonic waves and acoustic emissions (AE) are important technologies to reveal rock damage. However, few studies have simultaneously monitored both types of data in the same experiment because of limitations on the experimental apparatus. In this study, an integrated ultrasonic wave and AE testing device was developed to investigate the deformation characteristics and damage development of salt rock. Fracture experiments under uniaxial compression were carried out on three samples from the Jintan Salt Mine, Jiangsu Province, China. The deformation process can be divided into five stages. In the compression fissure and linear deformation stages, P- and S-waves rose slightly to stability, and acoustic emission activity was weak (0.04% and 2.66%, respectively). Subsequently, S-wave velocity slowly declined and AE events become more active, with about 13.8% of the total in the stabilized-growth cracks stage. When the salt rock entered the accelerated-growth cracks stage, AE events increased to 75.27%; with features of an earthquake swarm, the velocities of P- and S-waves began to fall significantly. After the peak stress, salt rock produced only a small number of AE events. The beginning stress of rock damage and dilatancy were about 42–50% and 62–67% of the uniaxial compressive strength, respectively. The ultrasonic wave velocity ratio, Ib-value, and r-value effectively predicted rock failure, but the r-value was superior owing to its sensitivity and ease of measurement.

1. Introduction

Salt rock, a medium with low seepage characteristics (permeability of less than 10−20 m2) and good damage repair ability, has been an ideal storage medium for energy and nuclear waste [1,2]. However, following years of use, the volume of underground salt caverns will fall because of changes in internal fluid pressure and rock creep. During this process, dislocations and slip among adjacent grains will occur and lead to severe rock damage. According to statistical analysis [3,4,5,6,7,8,9,10,11], 29 major accidents have occurred in the last 40 years, 20% of them due to rock damage. Therefore, it is of great significance to study the damage law of salt rock. However, this was a difficult task because of the micro-scale and extremely slow creep, which needed to be studied using special instruments or methods.
Acoustic emissions (AE) technology provides an indirect means of monitoring the internal deformation and damage process of salt rocks in the laboratory. In recent years, a wide range of studies on ‘hard’ rocks, such as granite and shale, indicated that AE technology provide a convenient tool for the study of deformation and failure of geologic materials [12,13,14,15,16,17]. For example, Chmel [12] and Zhao [13] studied the AE characteristics and the energy release law in granite at different stress stages, and demonstrated that energy accumulation was the root cause of crack growth, and a quiet period of AE events occurs before rock fracture. Geng [15] analyzed AE information under uniaxial compression to evaluate the dynamic damage process; they obtained a 3D distribution of AE events to illustrate the generation, growth, and connection of micro-cracks. Unfortunately, AE technology has not been extensively applied in the study of damage behavior of salt. Only a few studies have focused on the AE characteristics of salt rock, a ‘soft’ rock with coarse grains and non-uniform structures, whose AE characteristics are very different from others. Alkan [18] studied the AE features of salt rock during different strain phases in triaxial compression tests to determine the expansion and dilatancy boundary. Ren [19] analyzed the influence of stress level and loading rate on AE frequency, and summarized that the higher the loading rate, the more obvious the rock’s brittle features, and the lower the AE counts. Fan [20] and Filimonov [21] conducted AE monitoring in fatigue tests of salt under cyclic loading paths to reveal memory effects. However, they did not research the AE location owing to the limitations of experiments.
Ultrasonic waves, an active method and good indicator, can be used to evaluate pore structure, rock damage processes, and anisotropy. Szewczyk [22] found that the increasing saturation of shales decreased the difference between seismic and ultrasonic stress-sensitivities. Luo [23] showed that rock internal structure changed with variations in ultrasonic wave velocity and amplitude. Zhu [24] and Zheng [25] investigated the relationship between ultrasonic velocity and stress response in concrete, magmatic rocks, and sedimentary rocks; they found that ultrasonic velocity in rocks had a rising trend in the elastic loading stage. Although scholars have conducted many ultrasonic wave studies into rock damage, most focused on P-waves, not S-waves. Comparatively little work has been done on laboratory studies of ultrasonic velocity in salt rock under load [26,27,28].
The above studies are of great value; however, they only focused on either the variation of ultrasonic velocity or AE activity. In addition, because of the limitations of testing equipment, most did not concentrate on AE location and S-shear. In this study, we developed an integrated experimental apparatus of ultrasonic wave and AE activities, which was used to study the deformation properties and damage evolution of salt rock under uniaxial loading. Besides, the results of rock deformation, S-shear velocity, P-shear velocity, and AE activities were recorded and analyzed. Finally, the damage development process and evaluation indexes were considered. The results provide new insights into the damage process in salt rock and lay an important foundation for further study.

2. Experimental Apparatus and Procedure

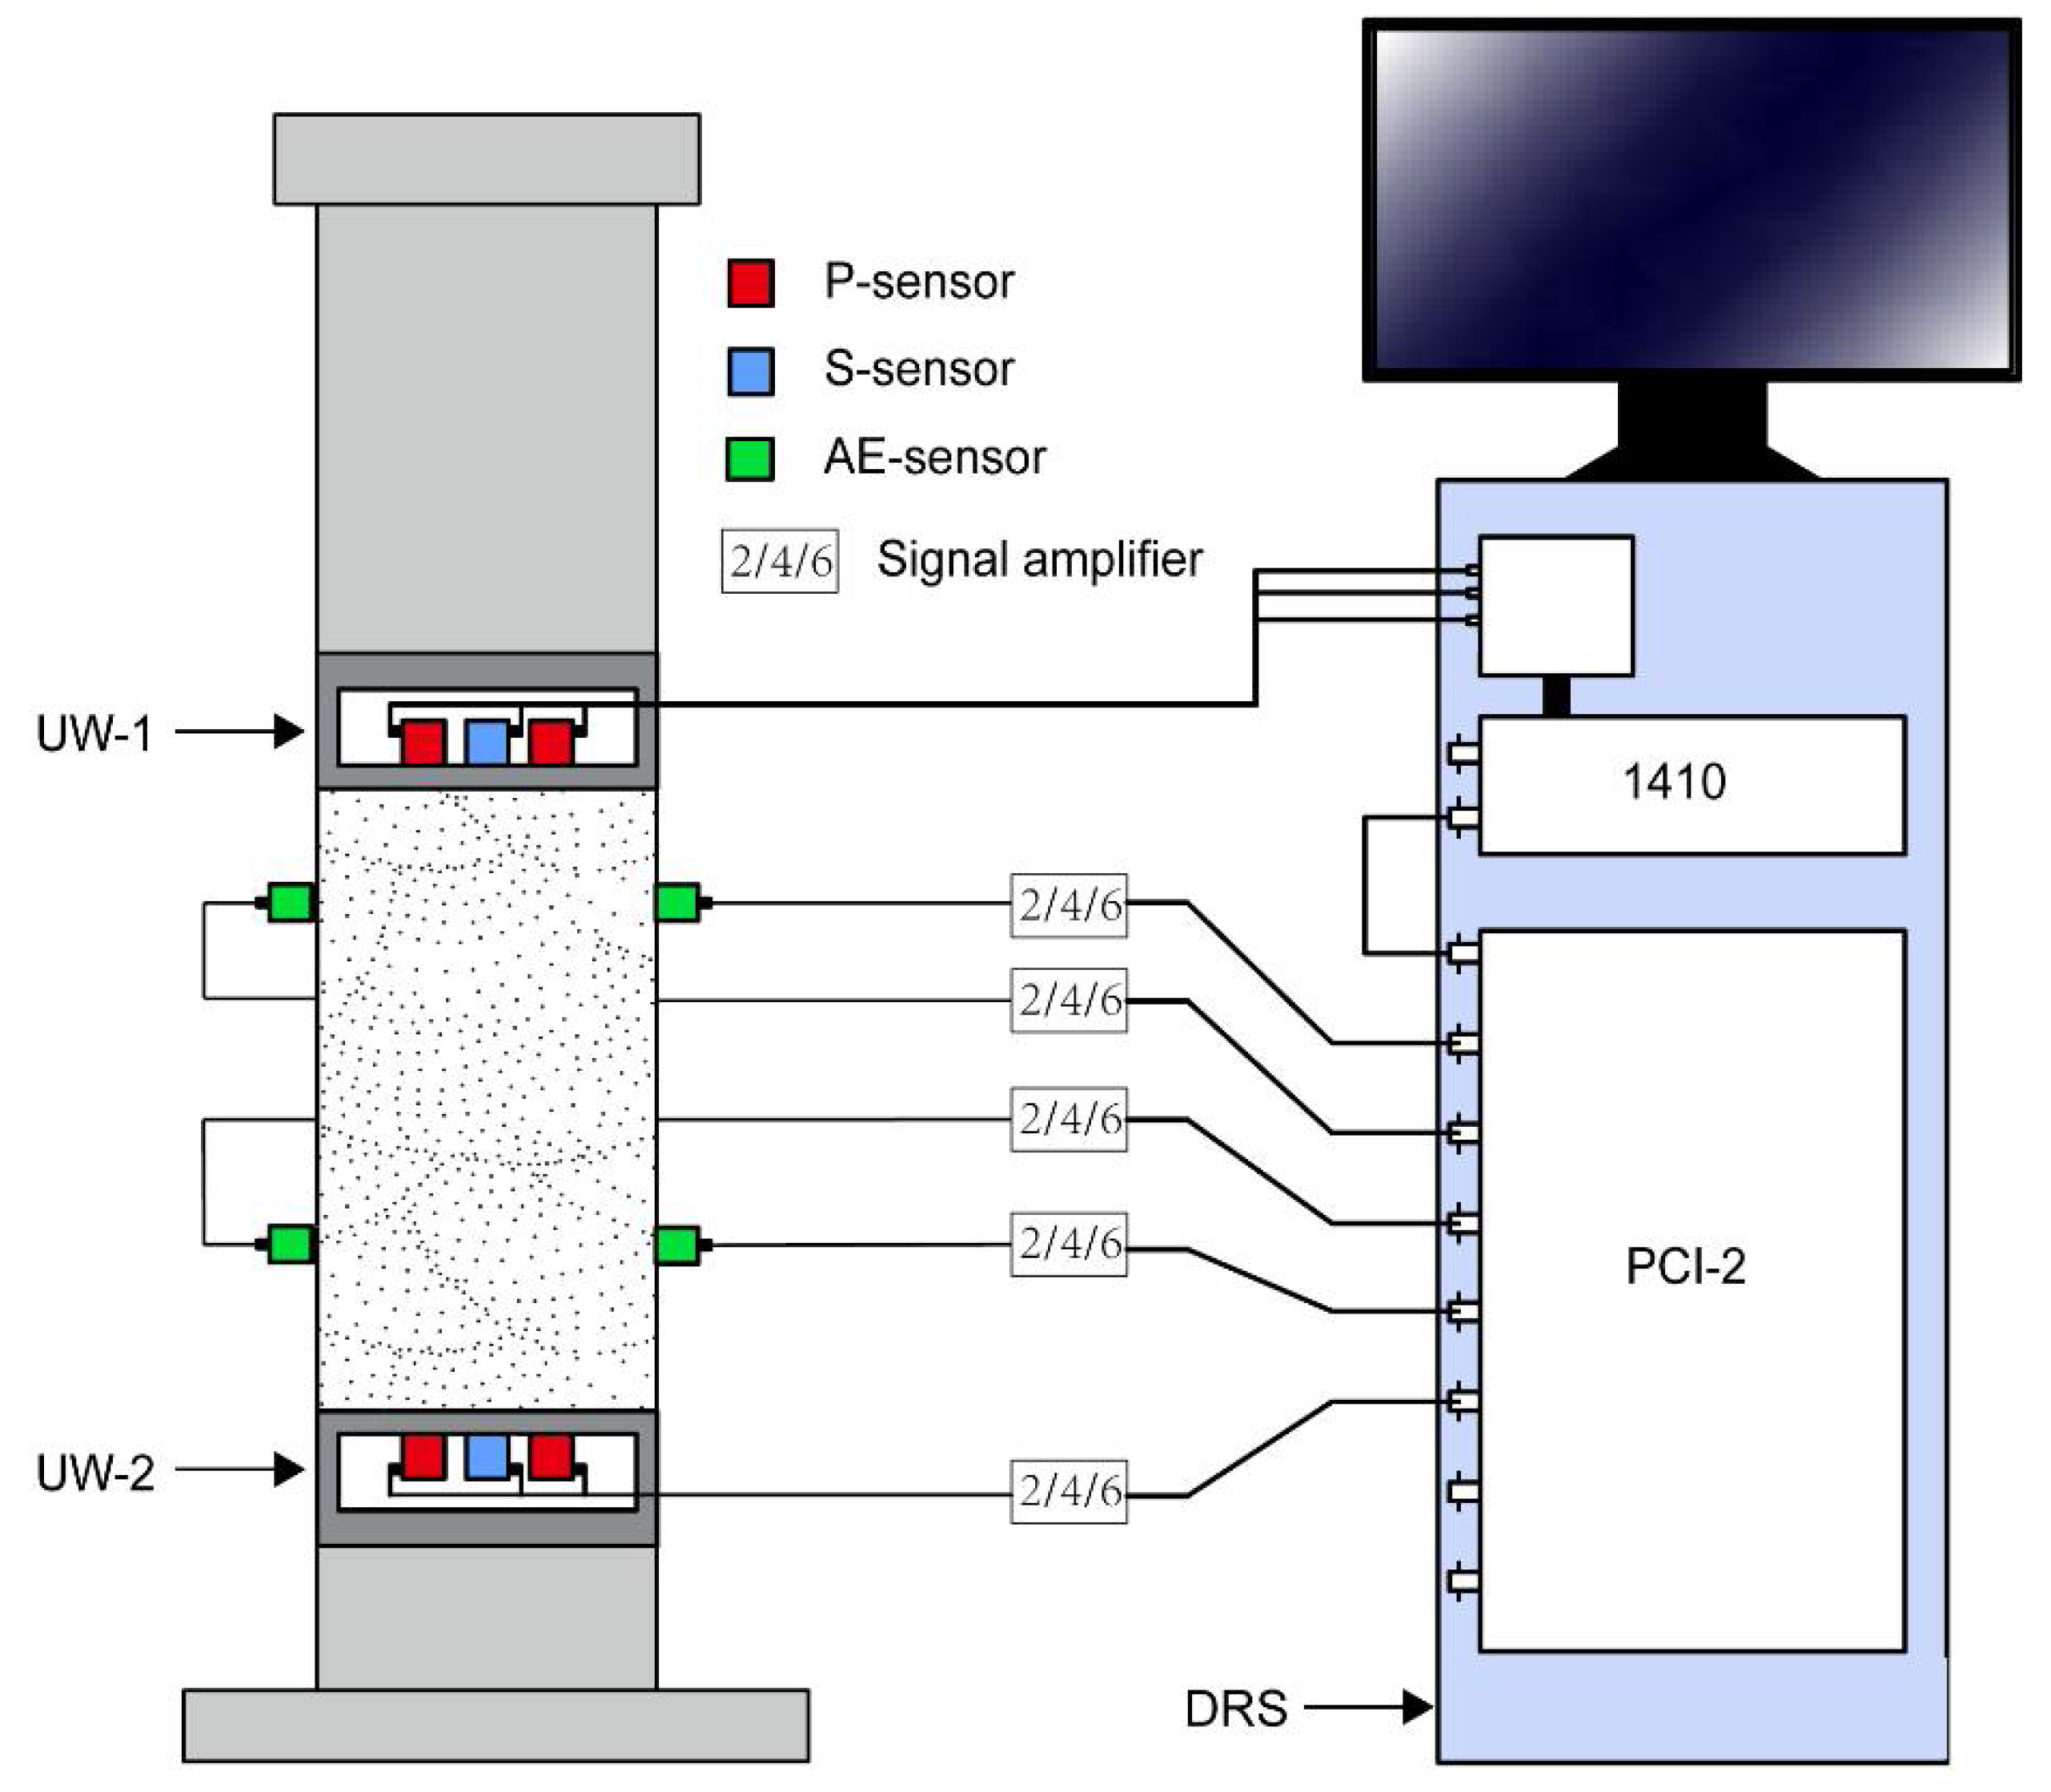
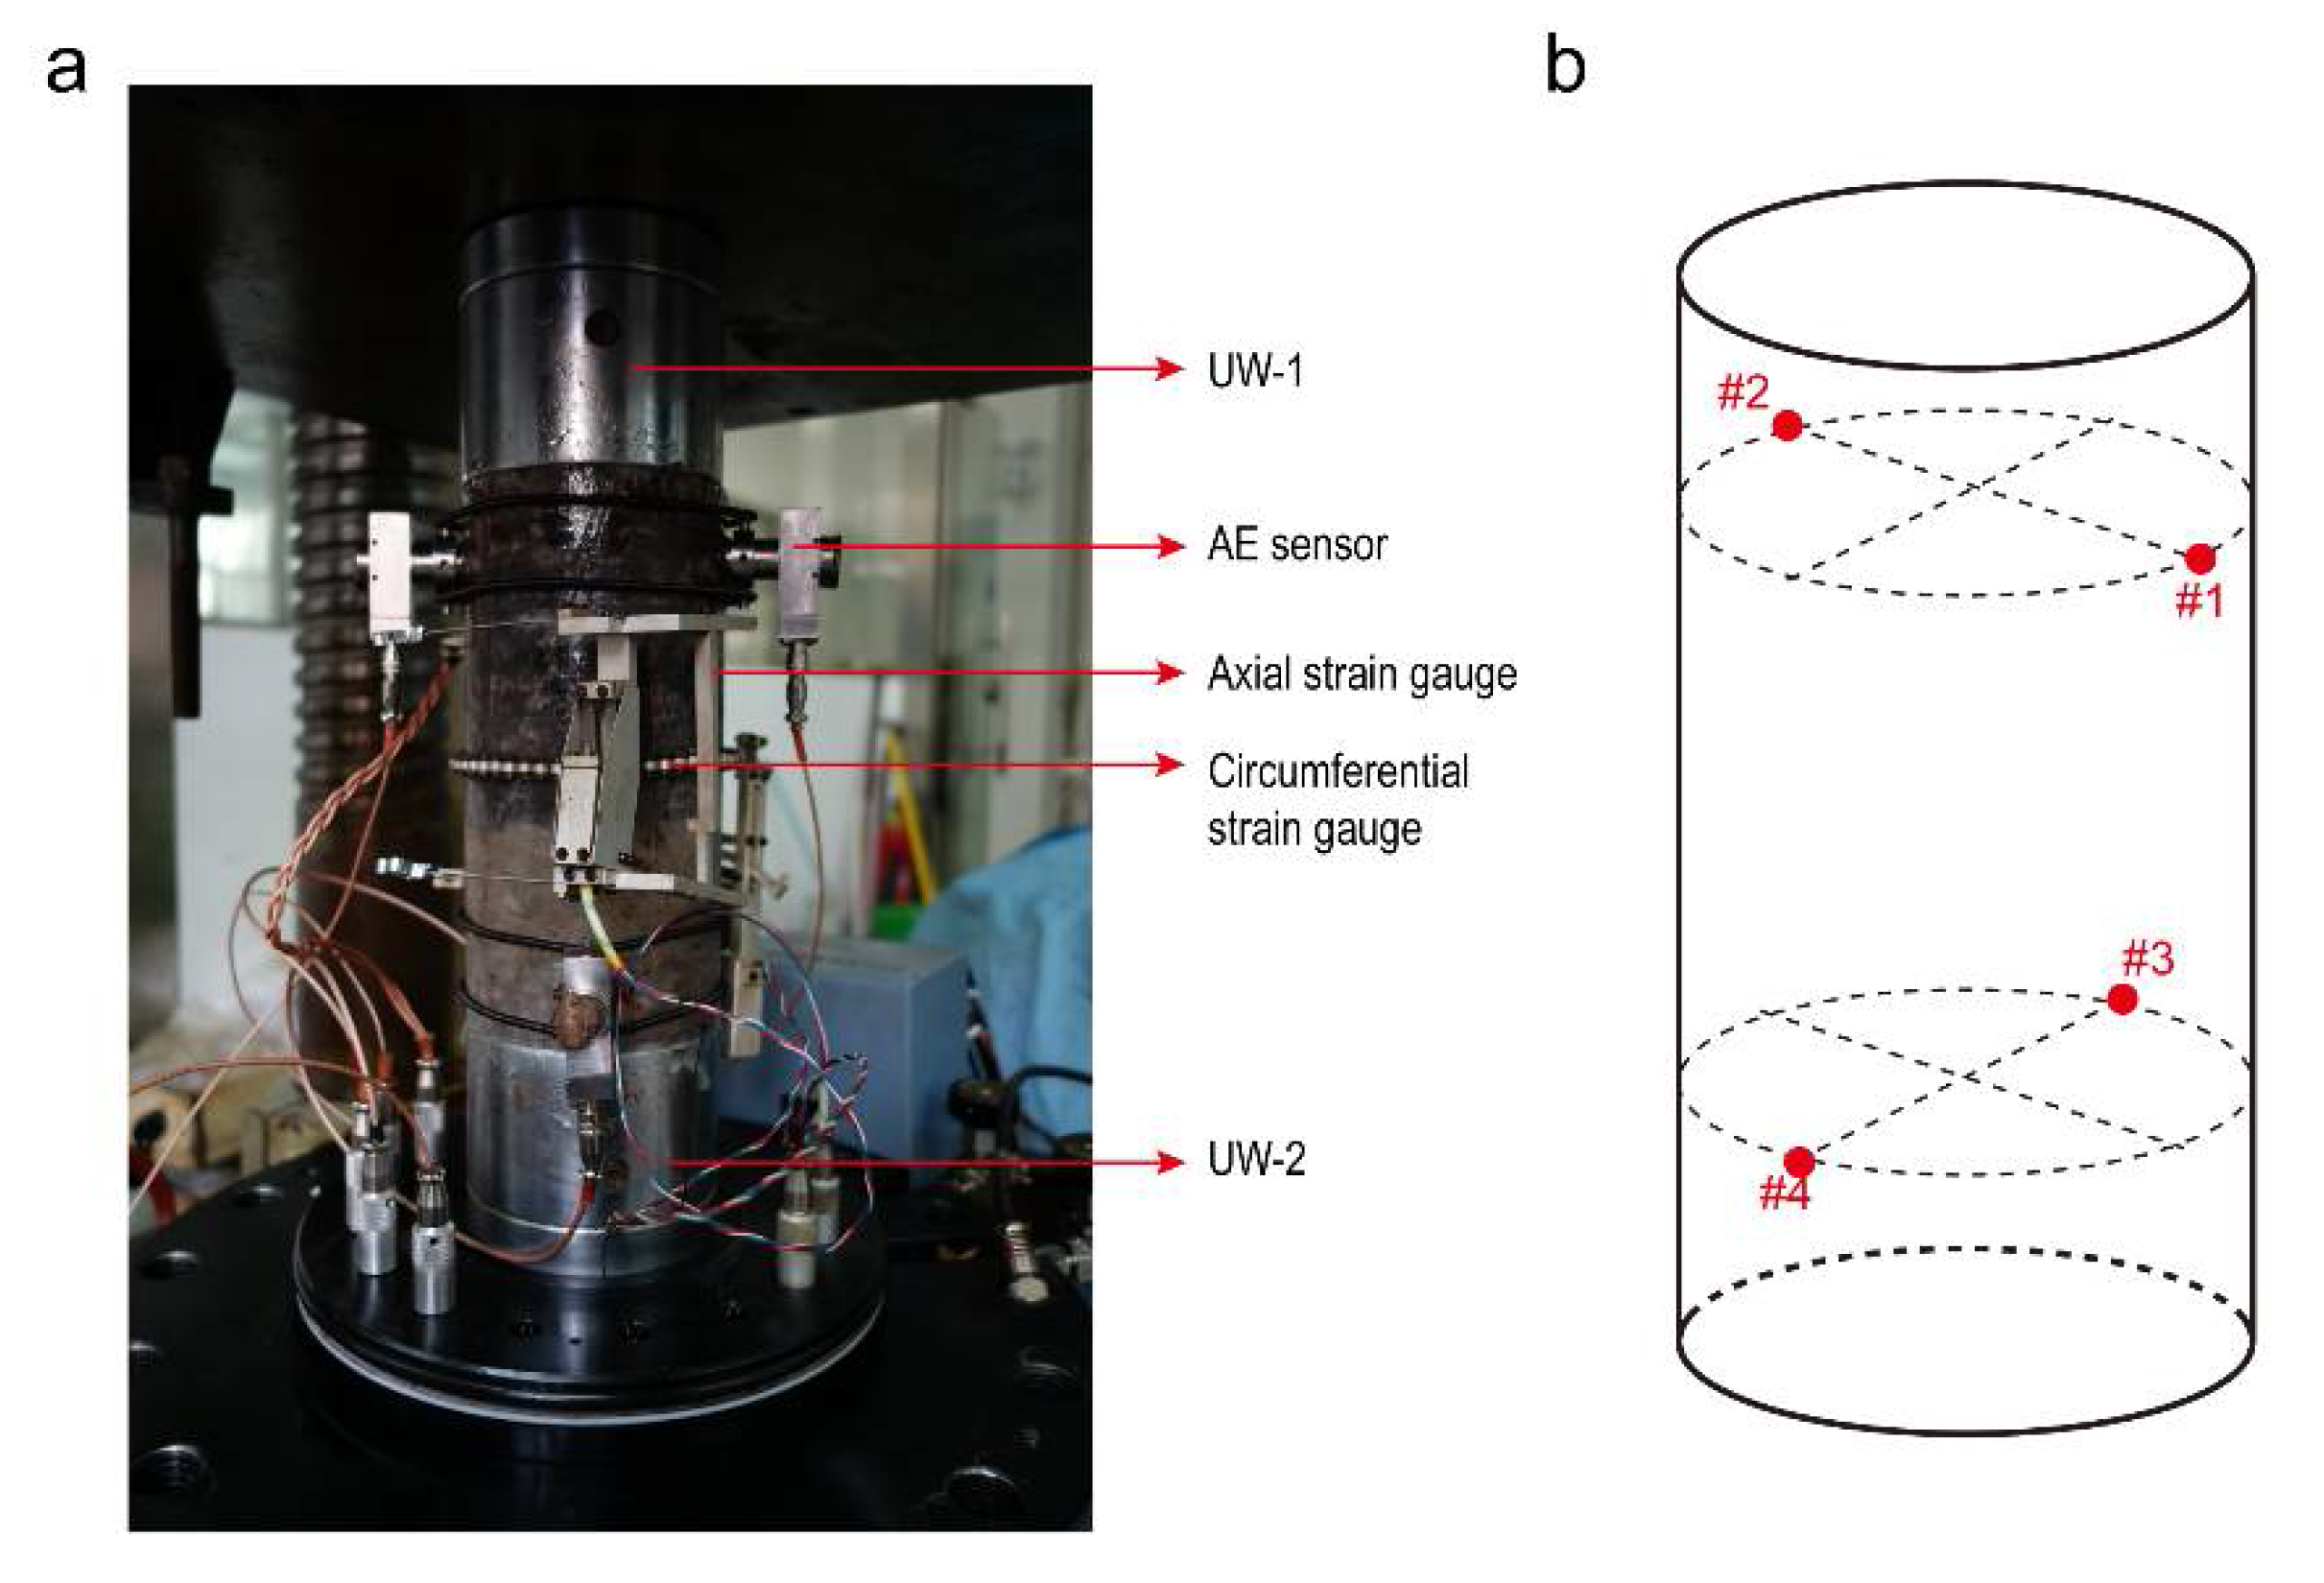
2.1. Experimental Apparatus
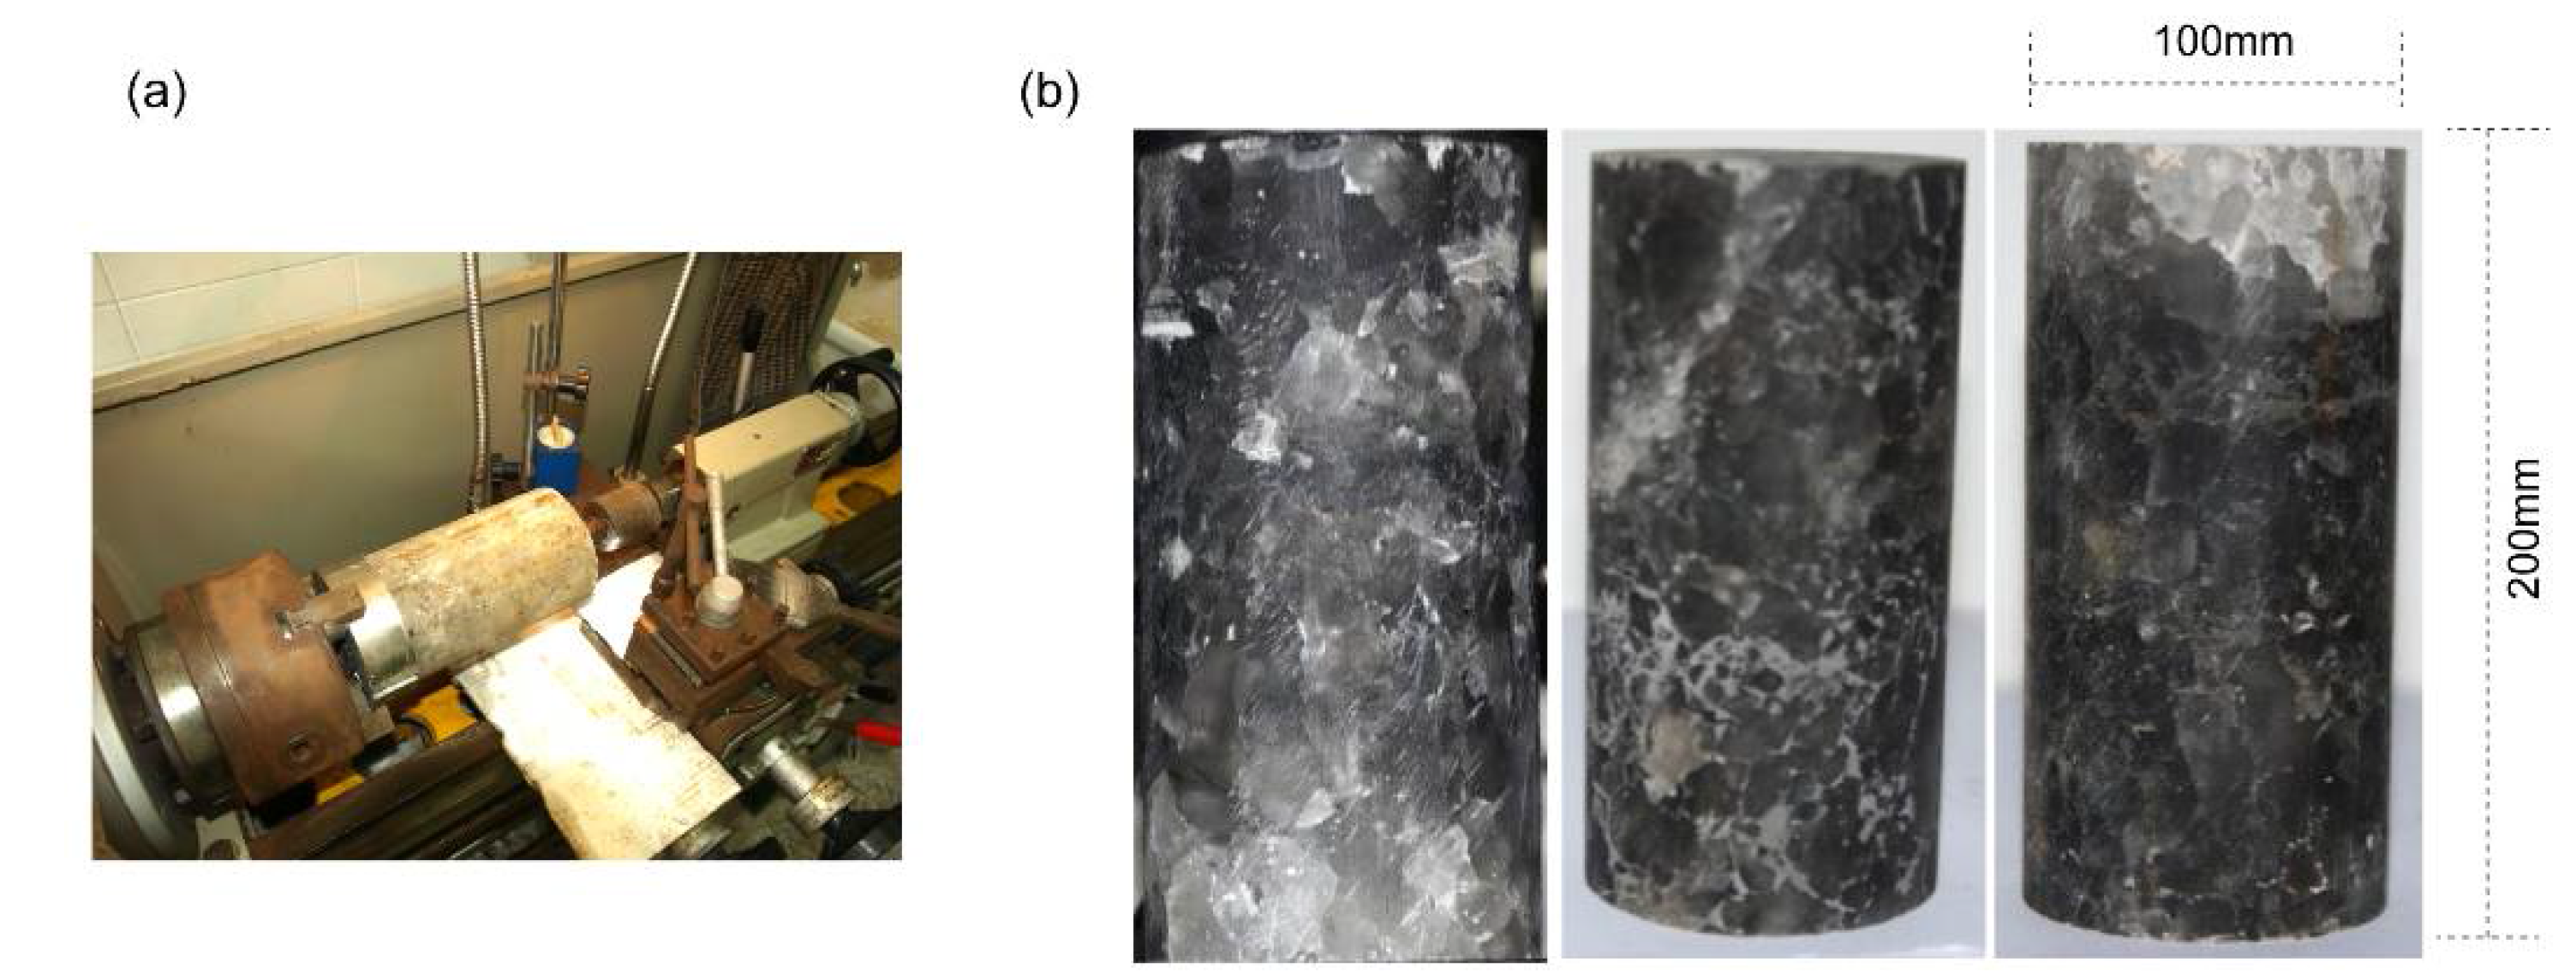
(1) Integrated Testing Apparatus for Ultrasonic Wave and Acoustic Emissions
The apparatus for ultrasonic wave measurement and AE monitoring was composed of an ultrasonic wave testing system (UWS), an AE testing system (AES), and a data recording system (DRS). A schematic of this system was shown in Figure 1; it has been patented in China (ZL2014101711015). It can be used to measure ultrasonic velocity as well as record AE information and location of a rock sample under uniaxial or triaxial loading. In this way, resources and costs can be saved, and it helped to reveal the coupling laws among rock cracks, ultrasonic wave and acoustic emission for future research.
Part 1, Ultrasonic Wave System (UWS): the UWS includes two steel indenters, UW-1 and UW-2, made of steel with the maximum allowable stress of 140 MPa. One P-wave sensor and two S-wave sensors are sealed in each (Figure 1). Sensors in UW-1 linking with the ultrasonic wave transmission channel can transmit the high-voltage signals positively. Sensors in UW-2 linking with the ultrasonic wave reception channel can receive the signal from UW-1. During the loading test, each indenter was placed in the same direction to make the P-wave sensor in UW-1 face the P-wave sensor in UW-2 and the S-wave sensor in UW-1face the S-wave sensor in UW-2. The ultrasonic velocity spreading in the rock was calculated by the elapsed time and distance of the pulsing signals.
Errors in the ultrasonic testing system were determined before the test was conducted. Firstly, the coupling agent was smeared on both sides of the indenters to ensure a good contact; secondly, the two indenters were set face-to-face with the same direction; then, we turned on the data recording system, and the acoustic signals from UW-1 were received by sensors in UW-2, the spread time was calculated as the error of the acoustic wave testing system. S-waves had an error of 12 us and P-waves had an error of 9 us.
Part 2, Acoustic Emission System (AES): AE sensors were located at different positions in the rock sample and connected with the AE received channel to record AE activities, which were applied to determine the locations of AE events. We used NANO-30 sensors (produced by the Physical Acoustics Company, Princeton Junction, NJ, USA) as the AE receivers; they were sealed in protective shells with sufficient stiffness, as shown in Section 2.3.
The sensitivities of the AE sensors were tested before use. We placed a crushed pencil lead of 0.5 mm thickness on the face of the AE receivers, and the data recording system recorded a signal. If the signal amplitude was higher than 90 dB, it indicated that the receiver was sensitive to the AE source; if this was not the case then we rechecked the link conditions and coupling quality of the sensors and repeated the tests until the sensitivity met the requirements.
Part 3, Data Recording System (DRS): the DRS included a personal computer (PC), a high-voltage signal transmitting card (Model ARB-1410, produced by the Physical Acoustics Company), and signal receiving cards (Model PCI-2, produced by the Physical Acoustics Company). ARB-1410, which was connected with UW-1, can emit different types of ultrasonic signals with enough power to overcome the energy attenuation in the spread process; the emission time interval, cycle time, and signal energy can be set by experimenters. PCI-2 was connected with UW-2 and the AE sensors, and they were used to record the ultrasonic wave and AE signals.
(2) Uniaxial Loading System
A uniaxial loading system was used to apply a uniaxial compression on salt rock samples. The maximum output axial loading was 4600 kN. Loading rates and controlling parameters can be set in software manually. In this study, we increased the loading force with the circumferential displacement control, and the increase rate was 0.4 mm/min. Circumferential and axial strains were recorded to analyze the relationship between stress and strain. Channels for ultrasonic signals and AE signals were designed in the bedplate of the loading system.

2.2. Test Sample

Salt rock was sourced from the Jintan Salt Mine, Jiangsu Province, China, and was extracted from approximately 874–883 m below ground level. Standard cylinder samples of a diameter of 100 mm and a length of 200 mm were built to conduct the tests. Plane parallelisms were controlled to within ±0.02 mm. The salt rock samples had a density of approximately 2250 kg/m3, and the dominant element was NaCl (over 85%; Figure 2).

2.3. Test Procedures

In order to eliminate environmental noise, we set the DRS threshold to 40 dB, and the ultrasonic wave and AE signals were amplified by 40 dB to ensure a clear signal. In the process of ultrasonic velocity measurement, three ultrasonic wave signals considered of a group; each signal had a 1 s time interval, and the cycle time between groups were set to 30 s. Therefore, 1 s after the first emission by sensor No. 1 in UW-1, sensor No. 2 in UW-1 discharged another emission, and sensor No. 3 in UW-1 launched another signal 2 s after the emission by sensor No. 1; another group of three signals was emitted in the same way 30 s after the emission by sensor No. 3.
The experimental and data processing procedures were as follows.
(1) First, UW-1 and UW-2 were set at each end of the rock samples with the same direction, and axial and circumferential strain gauges were placed around the sample to record deformation information. AE receivers were arranged at designed locations to monitor AE activity (Figure 3).
(2) The loading and data recording systems were turned on at the same time. With increasing loading stress, all information on P-waves, S-waves, and AE activities were recorded. This stage continued until the rock broke.
(3) After testing, data processing was conducted to analyze the ultrasonic velocity, AE activity, and deformation properties of the salt rock sample.

3. Experimental Results

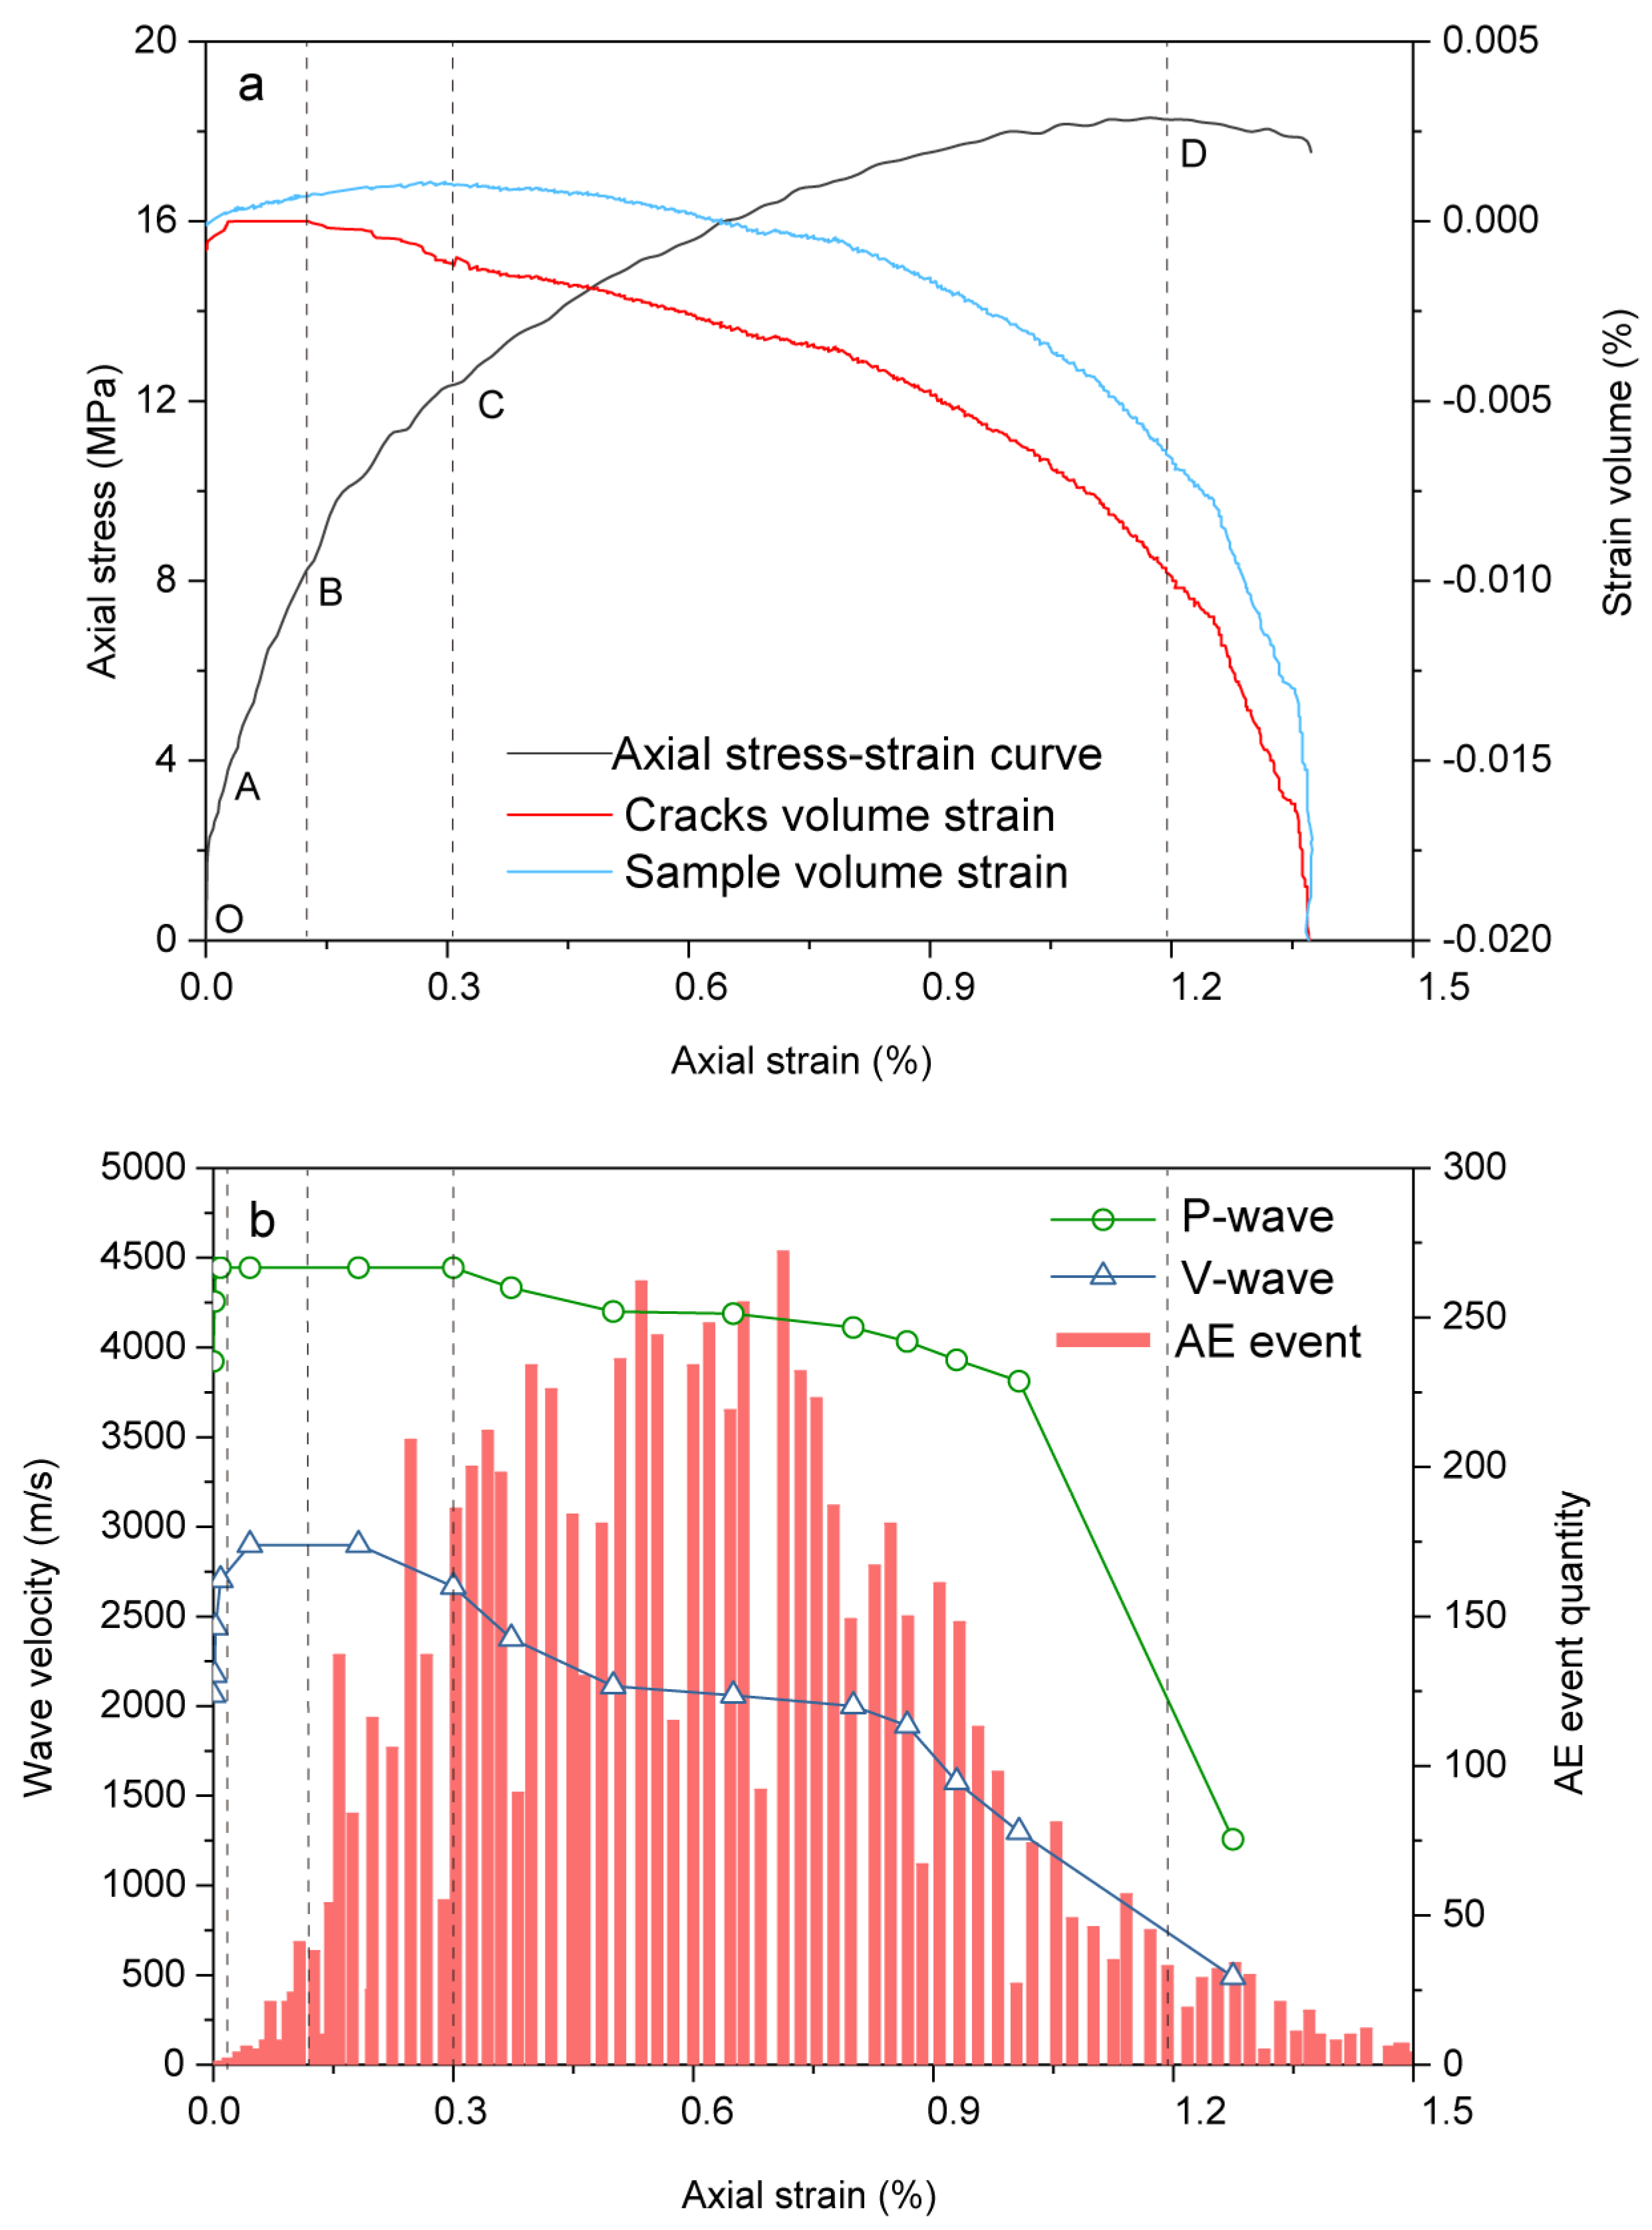
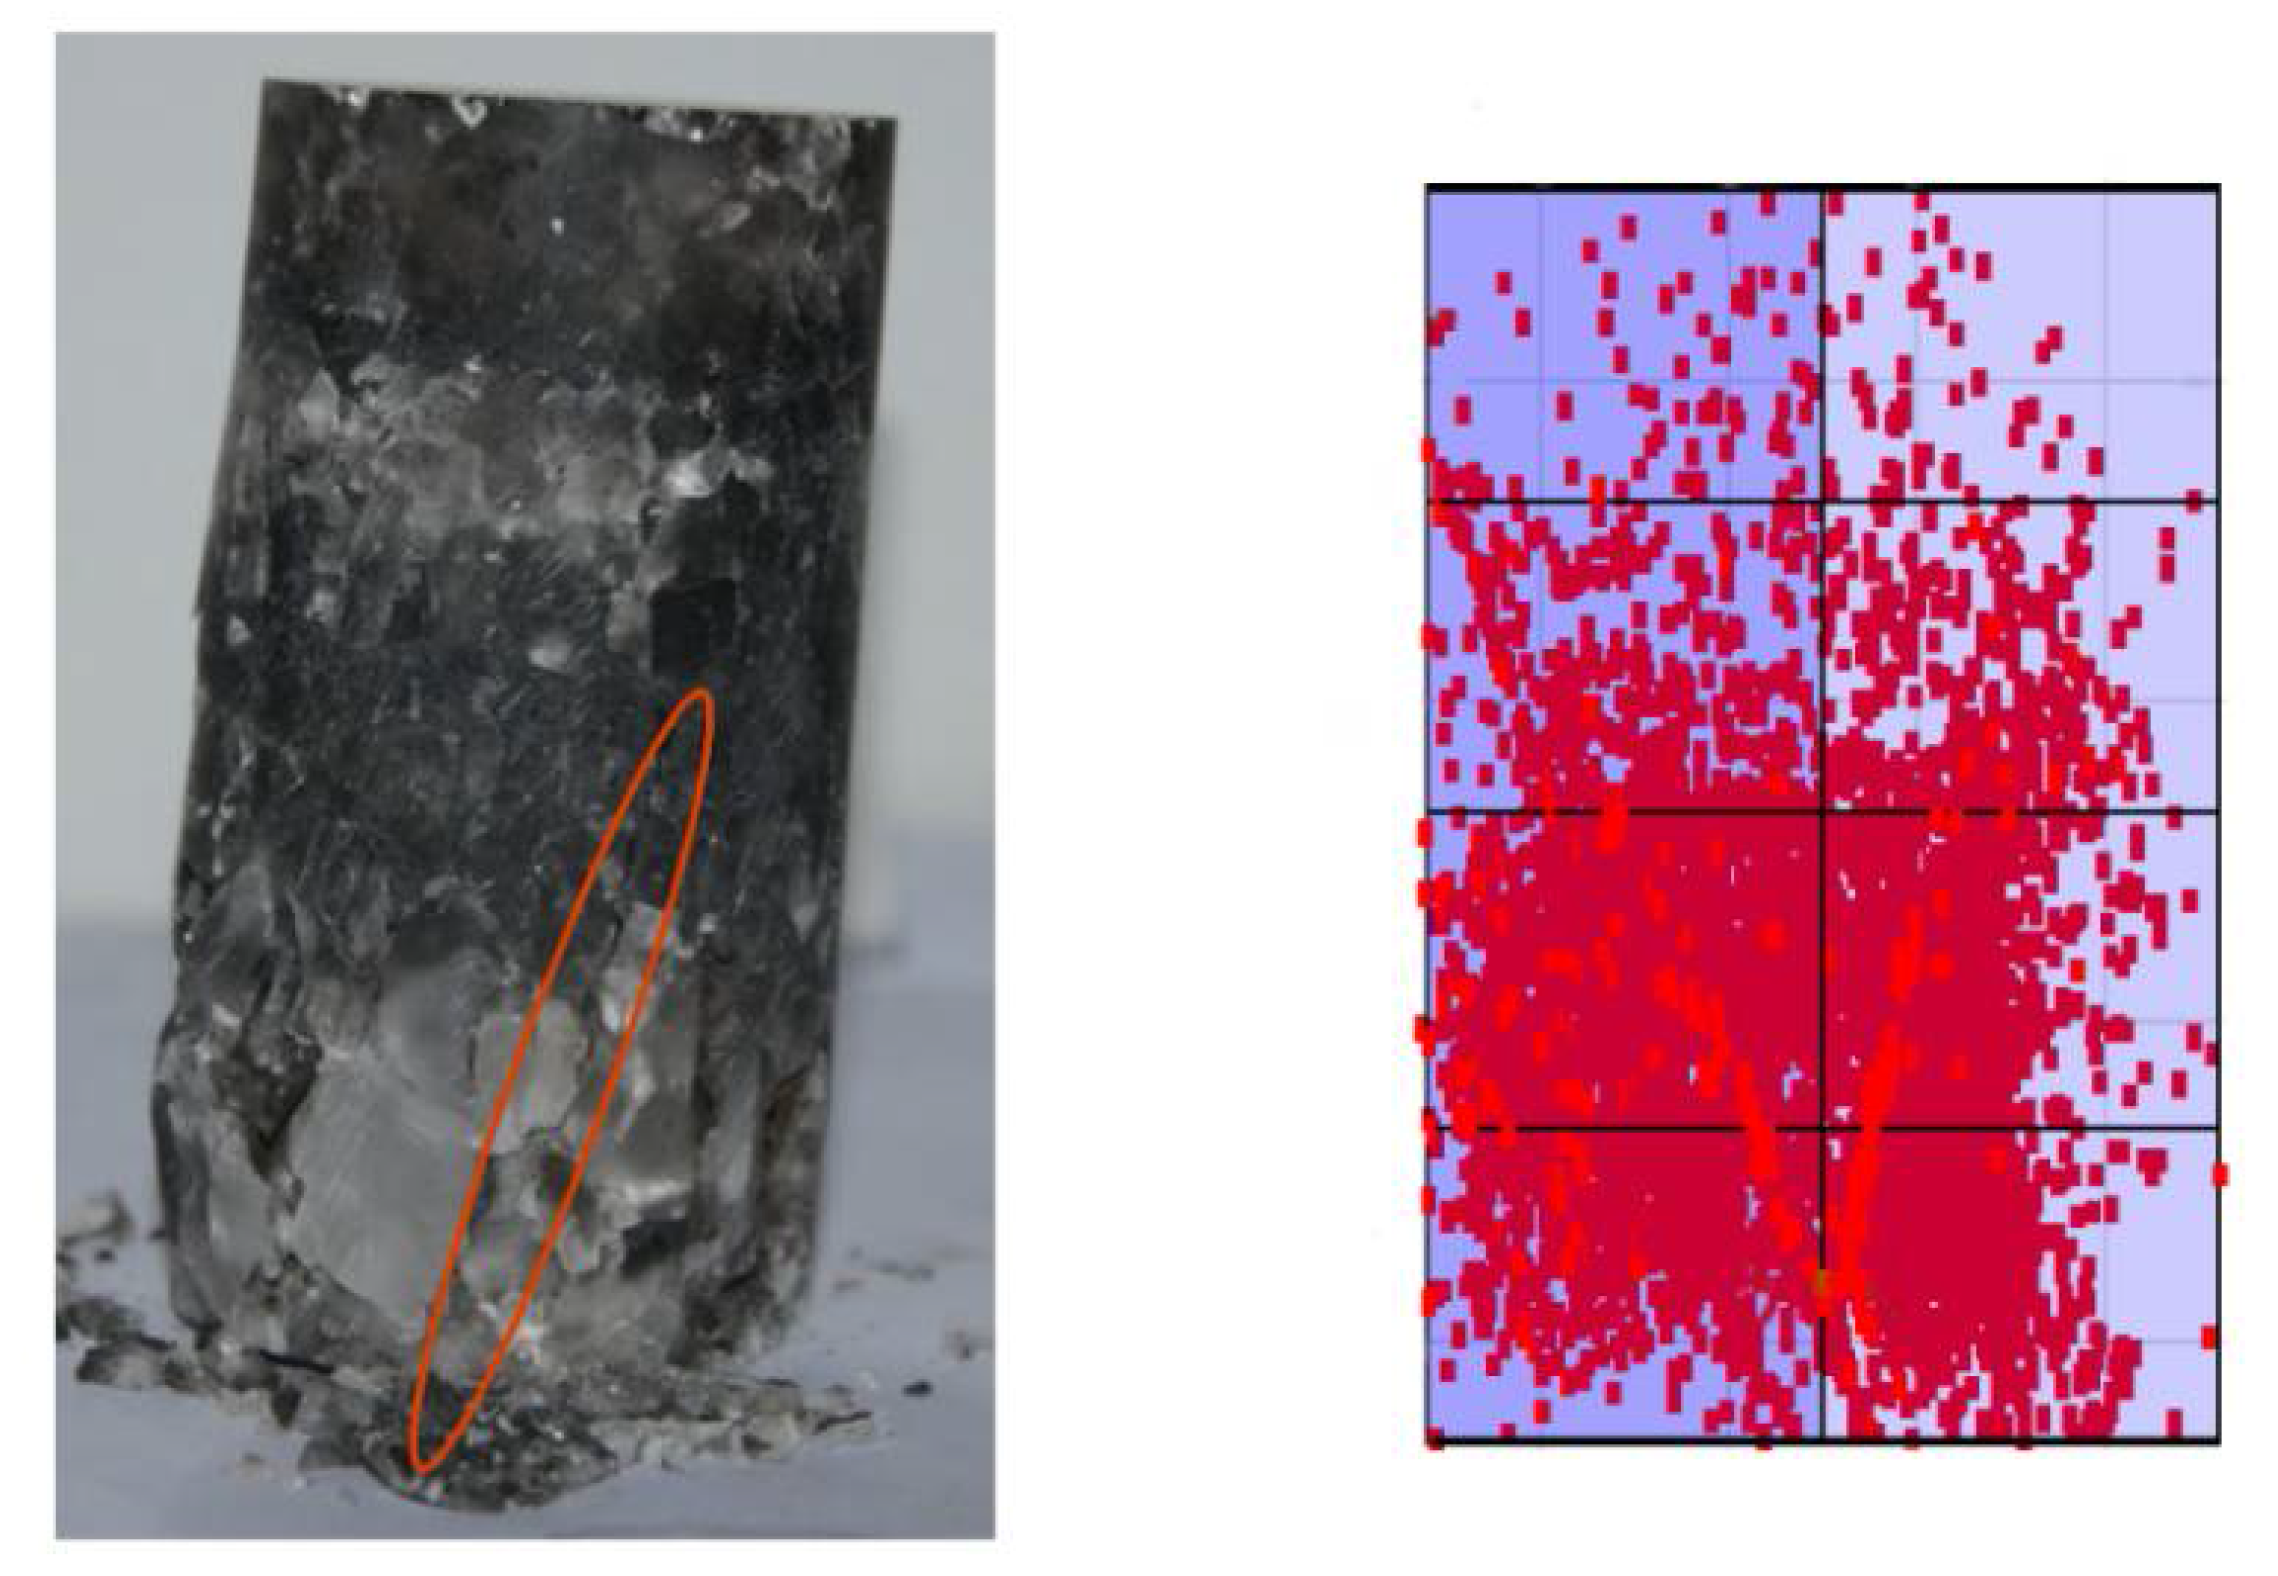
3.1. Deformation Features

Salt rock has a very good creep ability and produces large deformation during loading. According to the test results, the axial strain of salt rock was greater than 0.5% before losing carrying capacity. Therefore, we adopted the modified section area to calculate the mechanical strength of salt rock in this study.
In the tests, the axial and lateral strains were measured directly, whereas volume strain and crack volume were calculated from these values. Crack volume strain, ε v c , was determined by Equation (1) [29]:
ε v c = ε 1 c + ε 2 c + ε 3 c = ε v ( 1 2 μ ) E ( σ 1 + σ 2 + σ 3 ) ,
where σ 1 , σ 2 , and σ 3 are vertical space stresses, σ 1 is in the axial direction, σ 2 , and σ 3 are in the horizontal direction; ε 1 c is the crack strain in the axial direction, ε 2 c and ε 3 c are crack strains in the horizontal direction; μ is the Poisson ratio and E is the elastic modulus. Based on the stress-strain curves, the rock deformation process can be divided into five stages: the compression fissures stage, the linear deformation stage, the stabilized-growth cracks stage, the accelerated-growth cracks stage, and the after peak stress stage, as given in Figure 4 for sample #2 (SA-2).
Stage 1, the compression fissures stage (OA): OA was a short-term process and the stress range was approximately 0–20% of the uniaxial compression strength. In this stage, original cracks closed under compression, which led to a decrease in the crack volume of the specimens, but the compression volume strain increased slightly. Both P-wave and S-wave velocities rose slightly, and the P-wave velocity was approximately twice that of the S-wave velocity. The number of AE events in this stage was approximately 0.04% of the total number of AE events. This stage is completely reversible.
Stage 2, the linear deformation stage (AB): After the compression fissure stage, the compression volume strain increased, while the crack volume remained constant. The compression stress was approximately 21–45% of the uniaxial compression strength, and the volume strain had an obvious linear trend. The ultrasonic wave velocity was stable during this stage, and AE activity was weak, representing approximately 2.66% of the total AE events.
Stage 3, the stabilized-growth cracks stage (BC): When the stress was approximately 46–65% of the uniaxial compression strength, the linear stress-strain curve altered, cracks in rock samples began to generate and expand, and the compressed volume strain increased to a peak. Owing to irreparable damage produced in rock samples, the beginning stress at point B was representative of rock damage stress, about 42–50% of peak strength (Table 1). At the end of this stage, the volume strain of rock samples reached their peak, indicating that inflection and rock dilatancy would happen next. Thus, the stress at point C was termed as dilatancy stress, and was 62–67% of peak strength (Table 1). The P-wave velocity fluctuated slightly, while the S-wave velocity began a gradual decline. AE activities became active and accounted for approximately 13.0% of the total AE activity.
Stage 4,the accelerated-growth cracks stage (CD): As the stress increased to a peak in the accelerated-growth cracks stage, the samples exhibited visco-plastic deformation and the axial stress-strain curve showed nonlinear characteristics. While this was short-term behavior, is caused serious damage. At this stage, the ultrasonic wave velocity declined sharply, and the S-wave decelerated more than that of P-waves. AE activities were the strongest, accounting for approximately 75.27% of the total AE events.
Stage 5, the after peak stress stage (DE): During the last stage, the connected cracks extended in rock samples, and the rocks could not withstand the loading force.

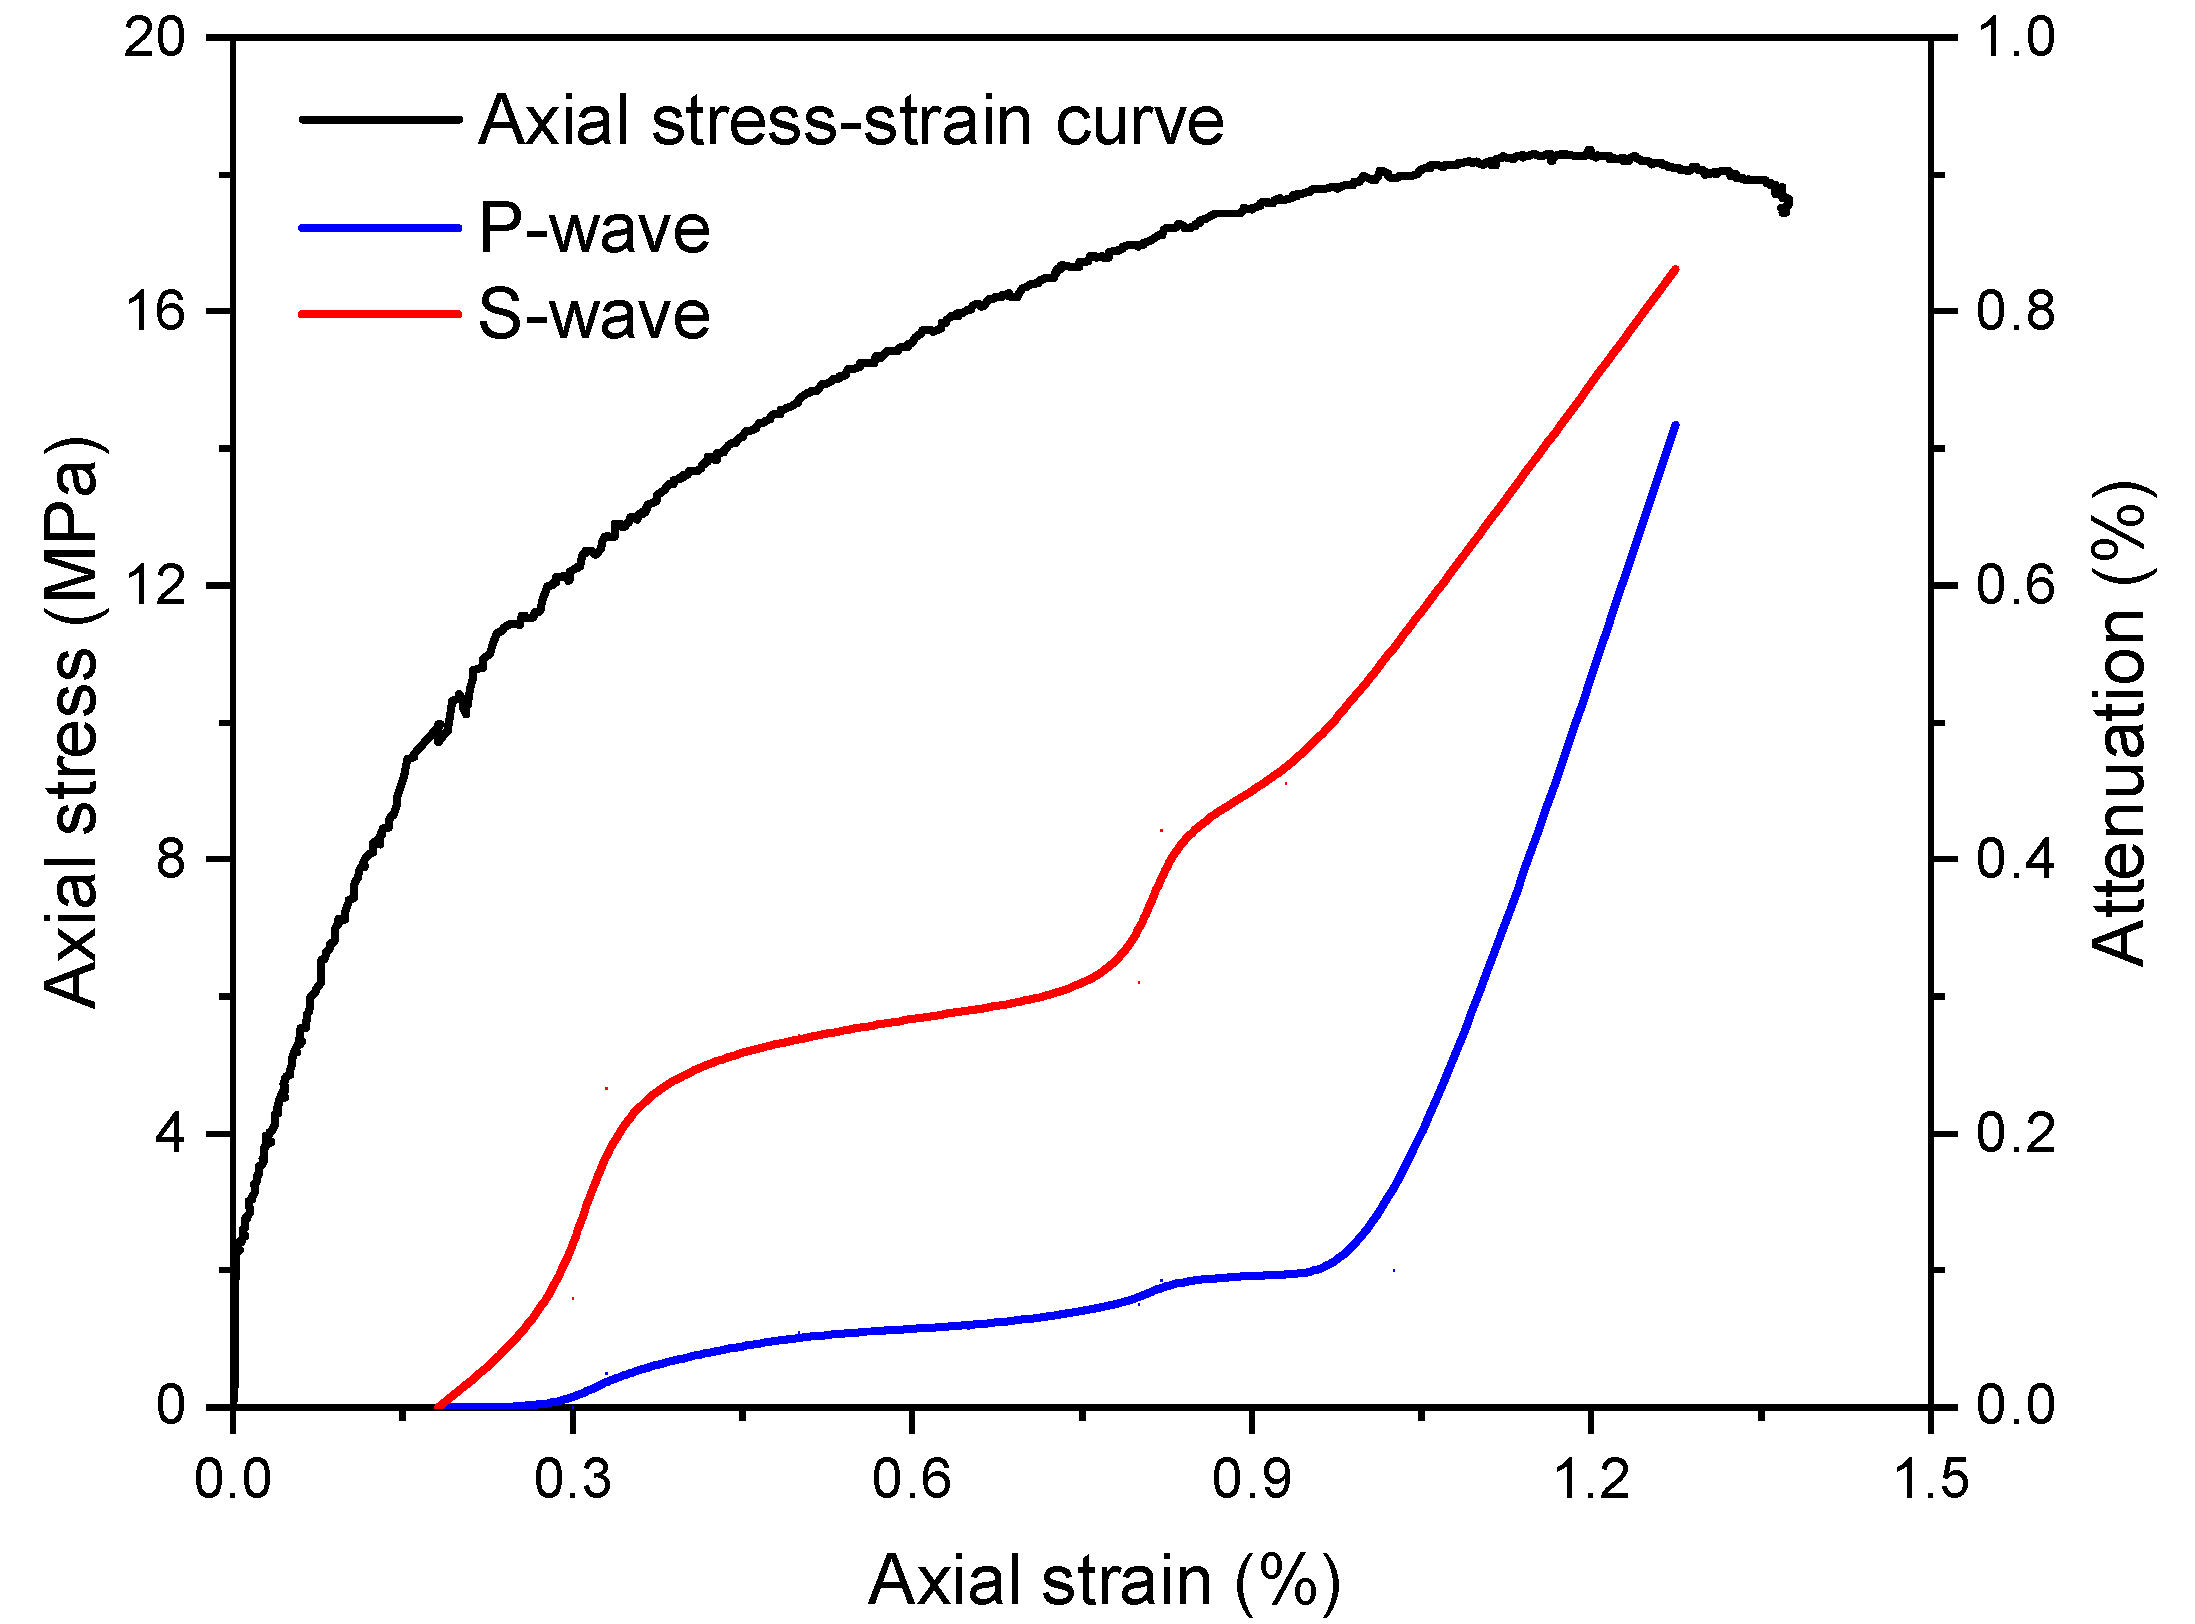
3.2. Ultrasonic Wave Velocity
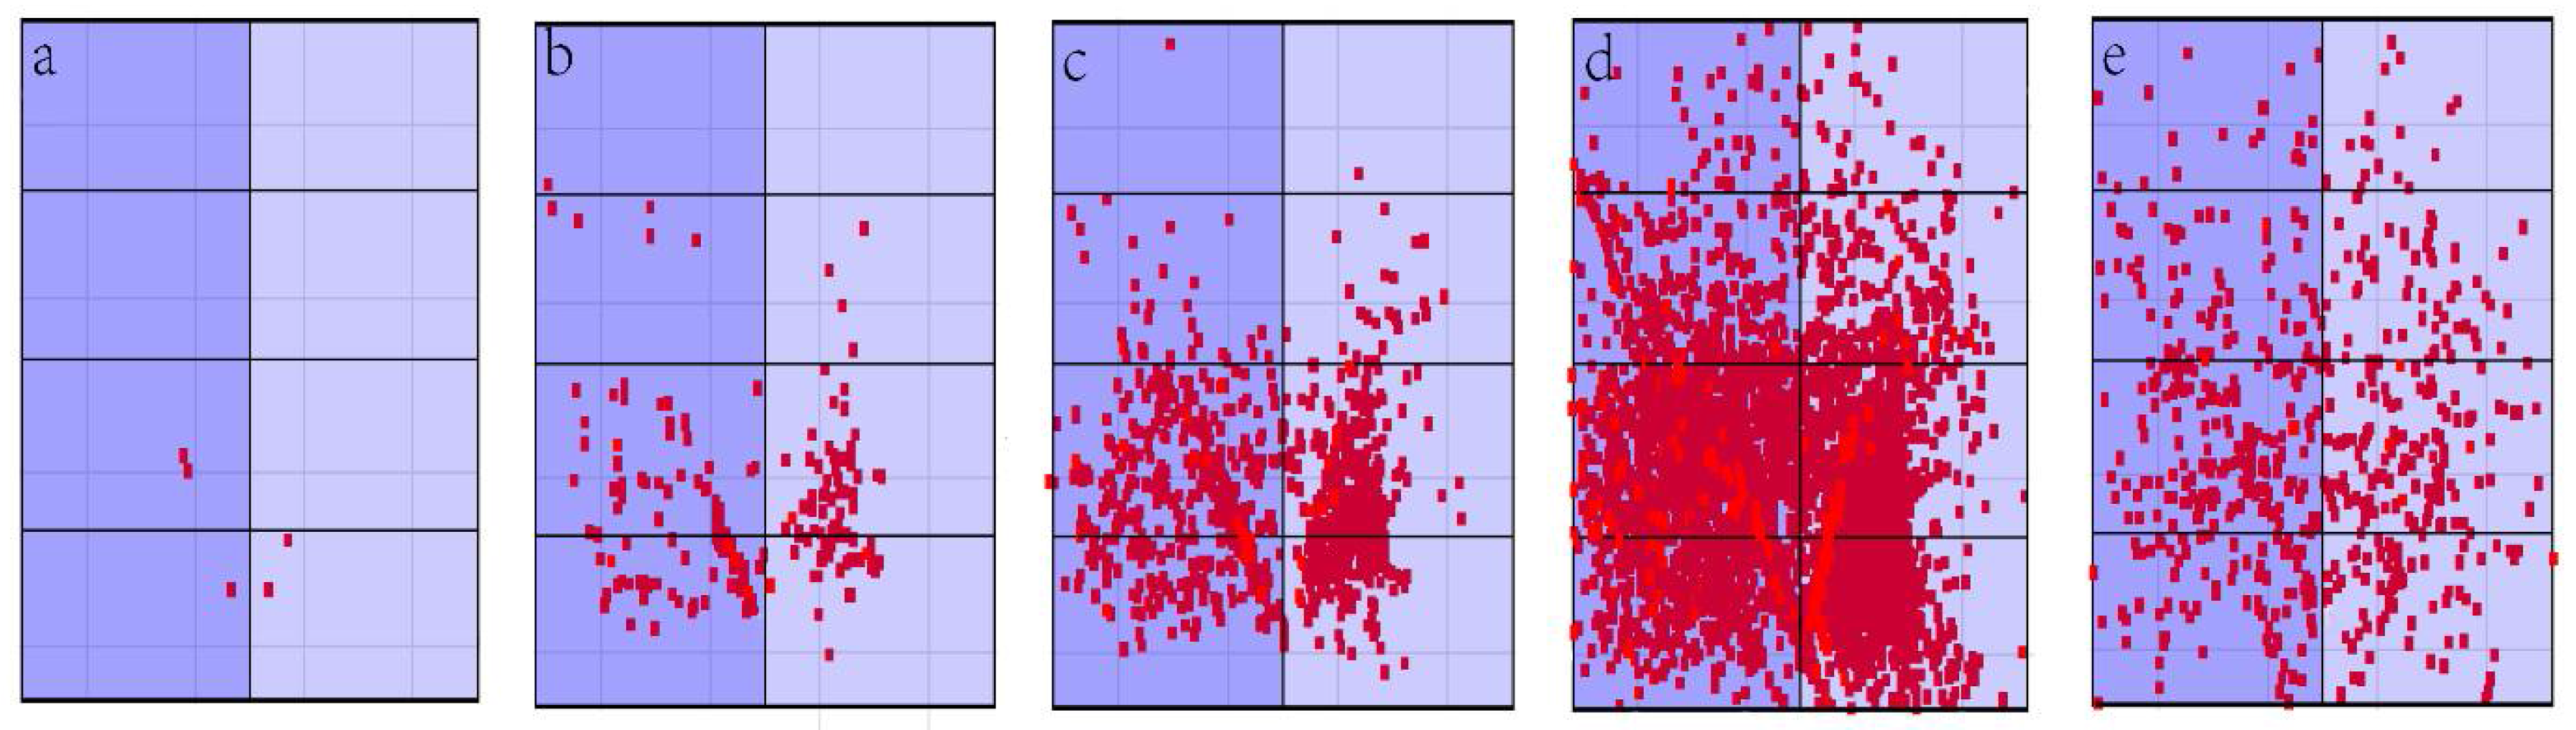
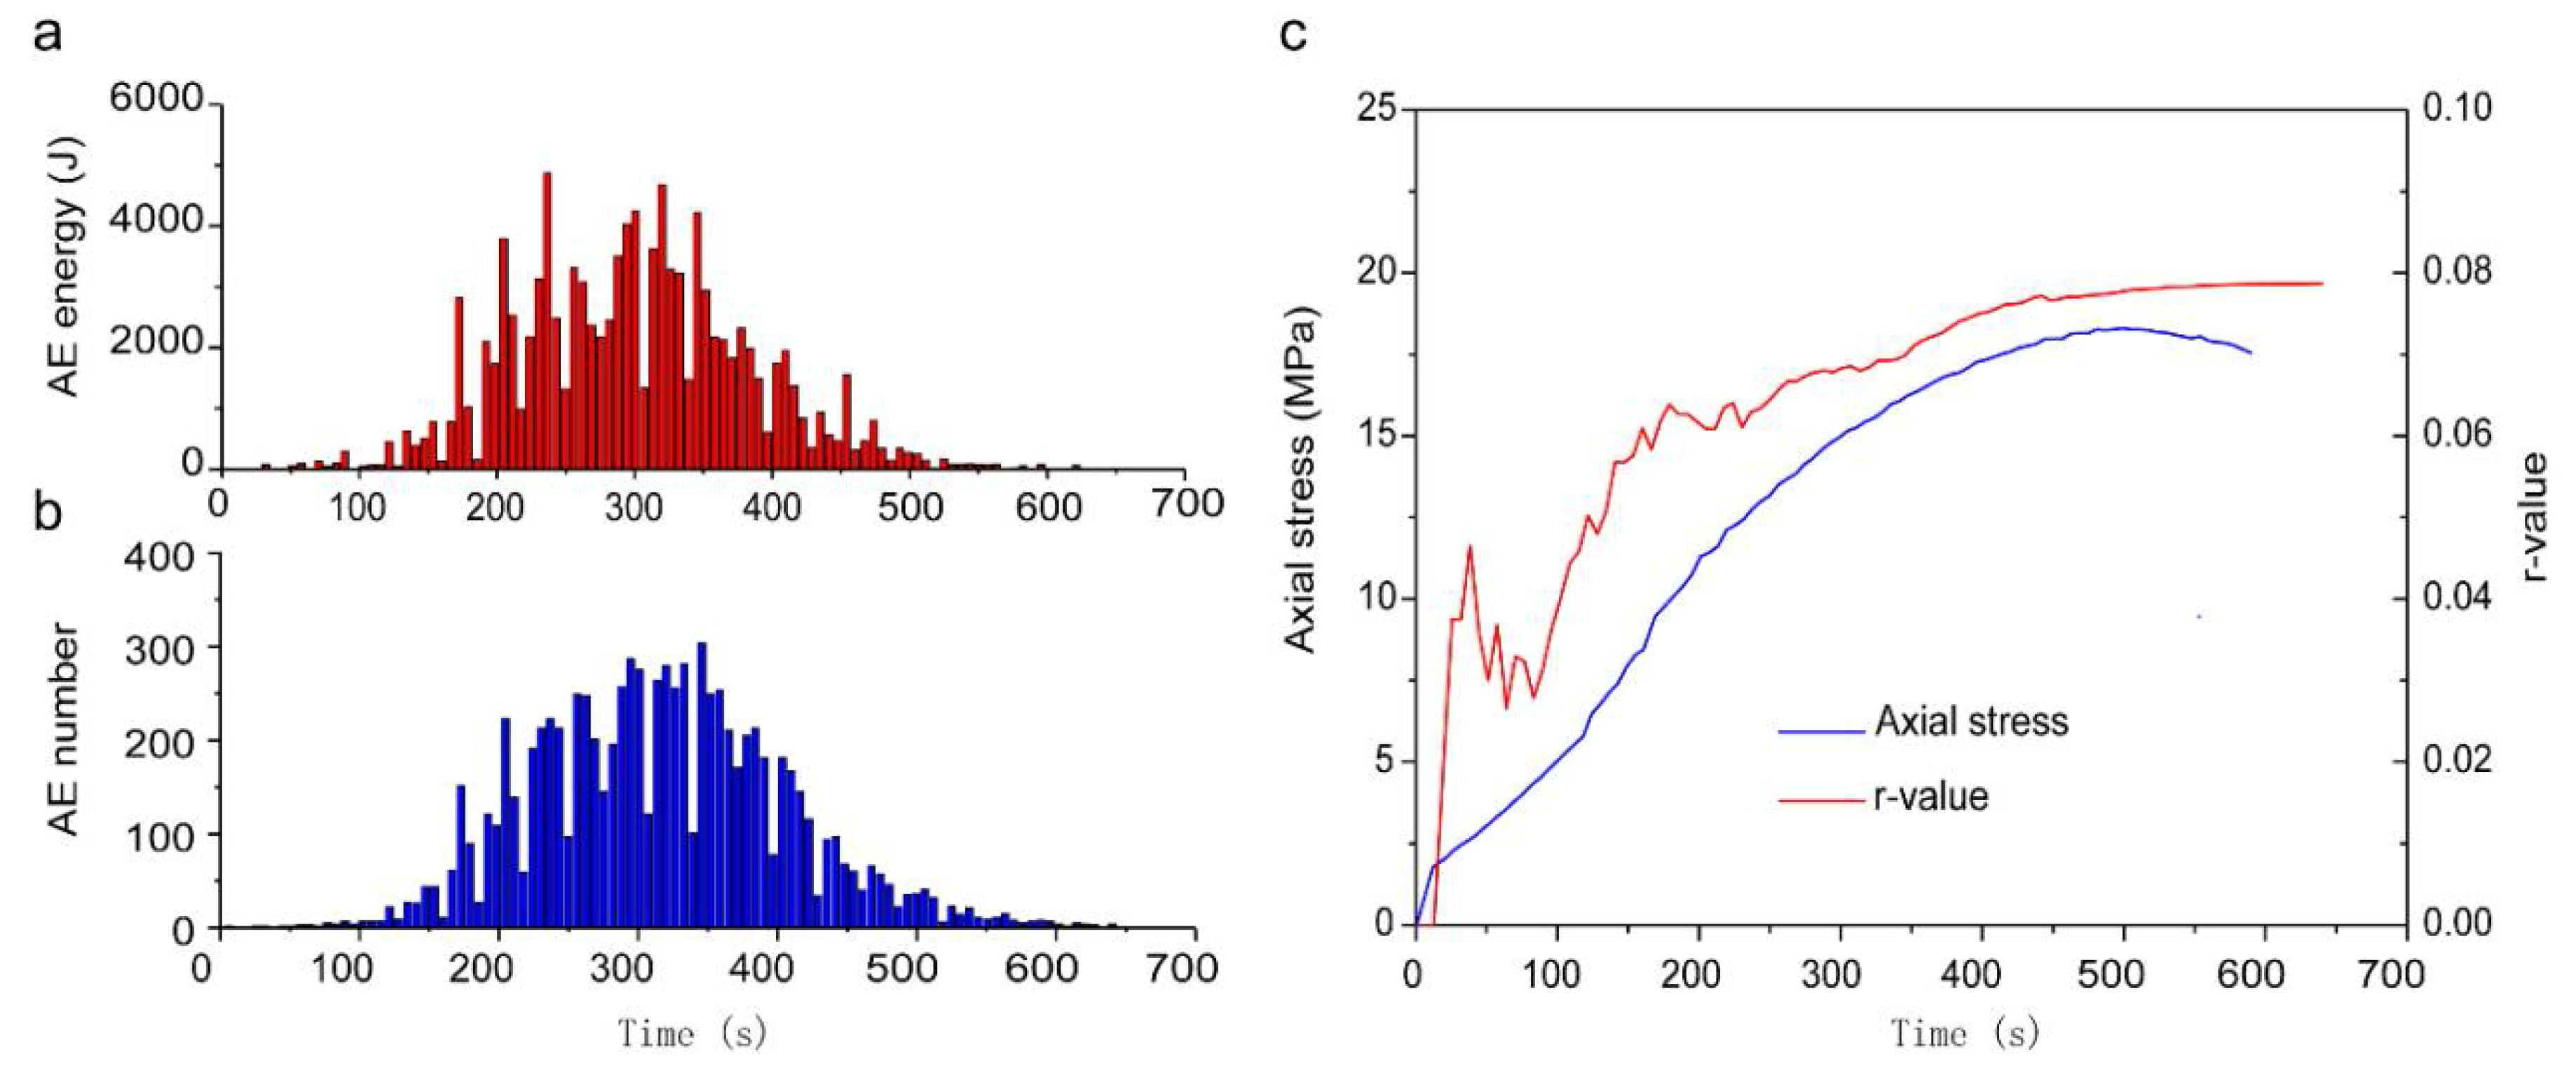
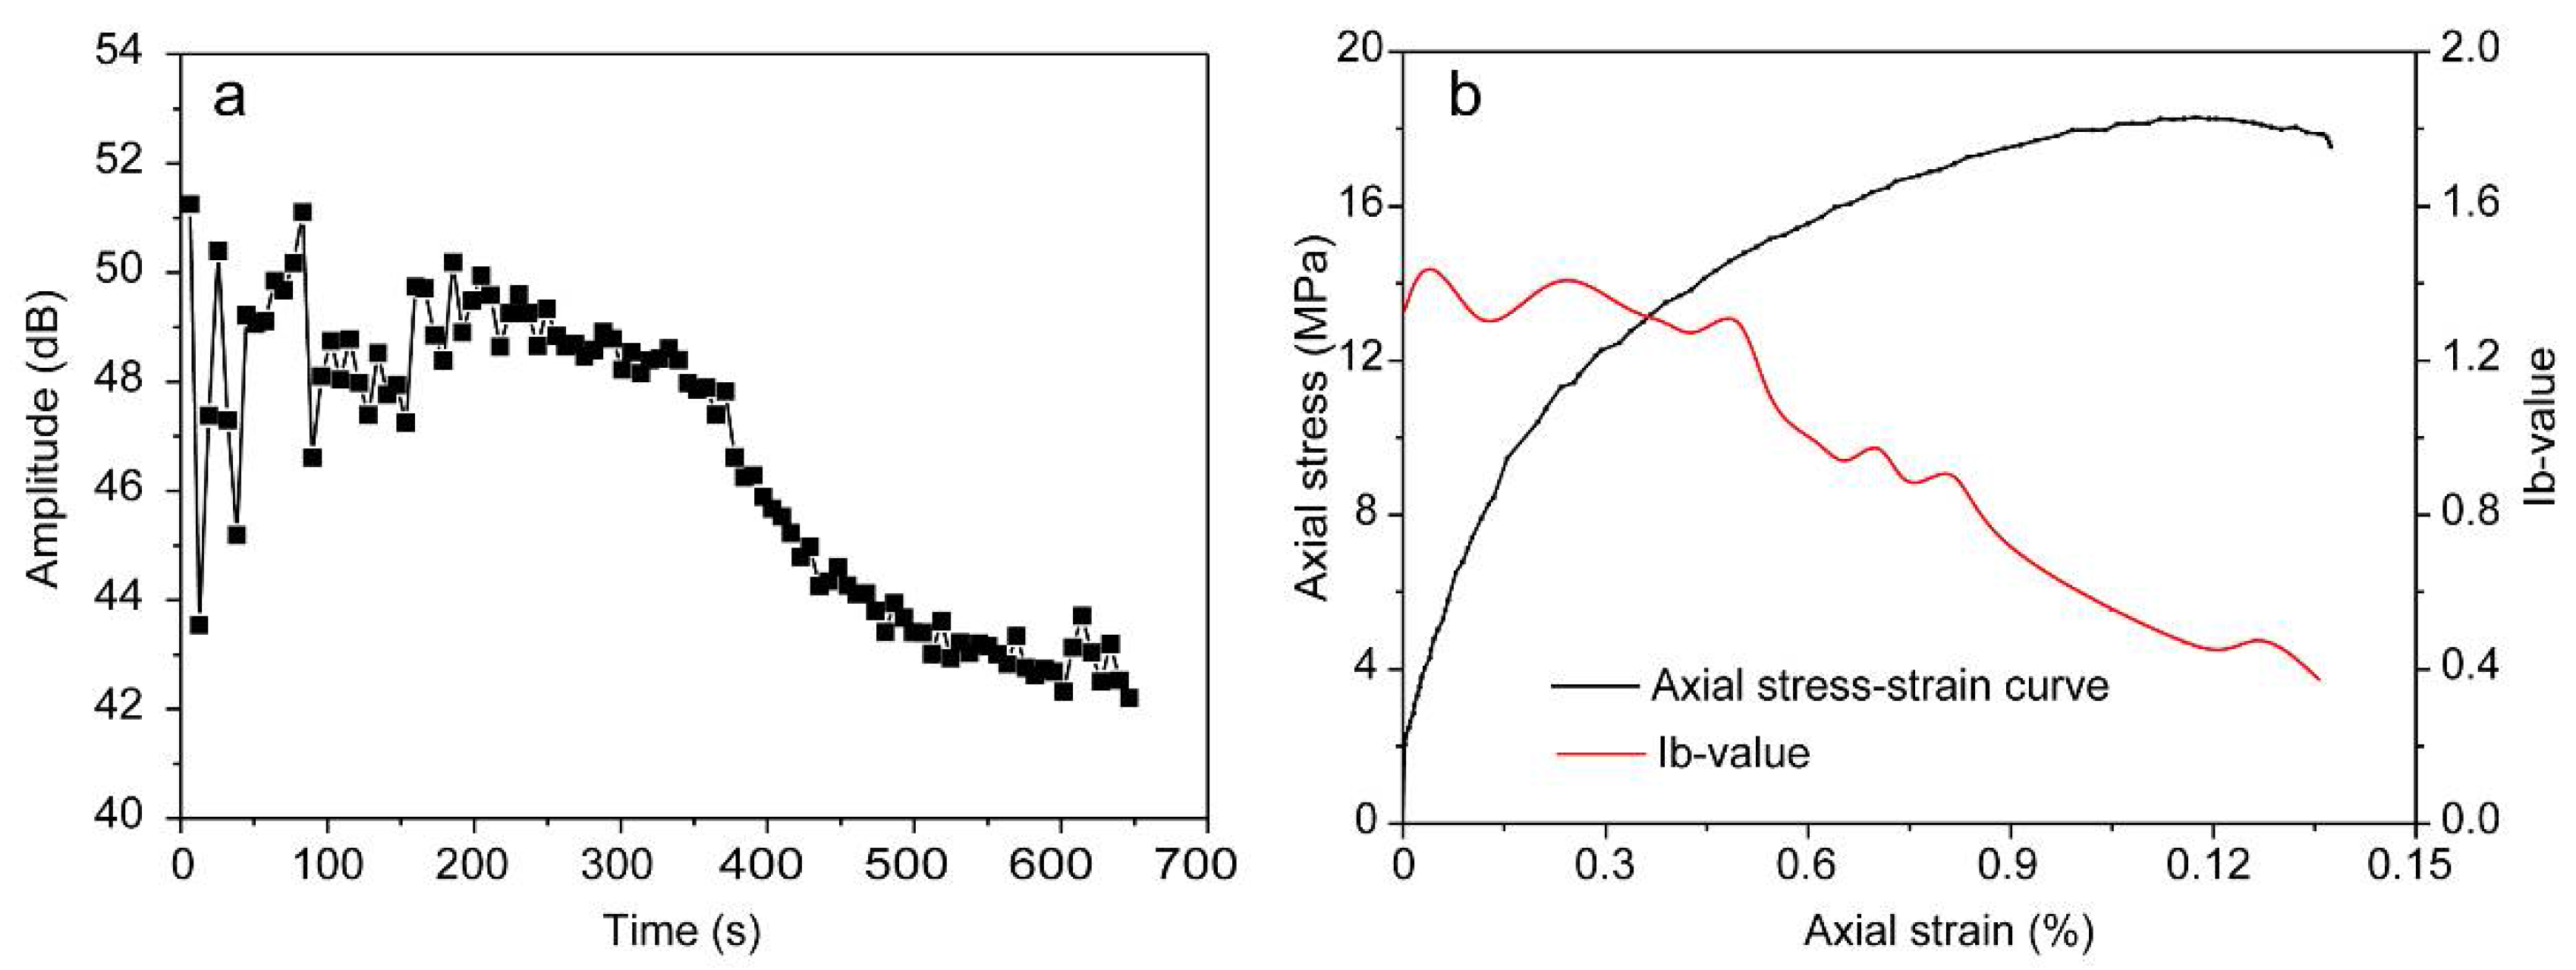
Repeated ultrasonic velocity measurements with cycle time of 30 s were performed during the loading test, and were interpreted by elapsed time through the rock sample. Ultrasonic velocities had a relative relationship with rock damage (Figure 5). The damage of salt rock was mainly caused by the dislocation and slip among rock grains, this movement resulted in micro-cracks among salt grains. When a large number of micro-cracks were connected, a fatal main crack would form [30]. For the salt rock sample under axial stress, P-wave and S-wave velocities did not show an obvious change before the stabilized-growth cracks stage, because there was only minor dislocation and slip among rock grains in the beginning [30]. When the grain dislocation exceeded a certain limitation, a number of micro-cracks were generated and extended; then the S-wave velocity had a downward trend, while the P-wave velocity remained constant. At the accelerated-growth cracks stage, both S-wave and P-wave velocities began to decrease significantly; P-wave velocity reduced from 4444 m/s to 2011 m/s, and S-wave velocity reduced from 2898 m/s to 834 m/s. Figure 5 shows the P- and S-wave velocity attenuations in sample SA-2 under uniaxial loading. We observed that the attenuation of S-waves was larger than that for the P-waves. In the axial compression, the samples had circumferential expansion with a great many of micro-cracks paralleling to the axial direction. S-waves showed a more sensitive response to this change.

3.3. AE Activity

Energy release and rock damage are associated with AE activity. Salt rocks are sensitive to AE during uniaxial loading because the crystal structure contributes to the friction effect [31]. AE events were consistent with the loading process, and were 0.04%, 2.66%, 13.8%, 75.27% and 8.23% of the total AE activity during the five deformation stages (Table 2). Based on seismological principles, AE events can be divided into three types: shock, swarm, and isolated. It is obvious that salt rock belongs to the second category because there was no extreme, high-level shock, and the energy was released by repeated activity with similar magnitudes within a longer time period, as shown in Figure 4b.
During testing, four AE sensors were used to locate the AE position, which clearly showed damage development inside the rock samples. From the compression fissures to accelerated-growth cracks stage, AE gradually became active and reached a peak, the AE located in the area with the most significant damage (Figure 6). In the uniaxial compression test, most of macro-cracks were parallel to the direction of stress, which presented a vertical splitting characteristic as shown in Figure 7. More serious damage and inconsistent distortions occurred in the lower part of the rock, as the loading stress came from the base of the test machine. Comparing the damaged salt rock after testing with AE events location (Figure 7), we clearly recognized that the location of the AE was in good agreement with the macro-cracks of the damaged samples. Where the damage was most serious, AE events were the most concentrated.

4. Rock Damage Recognition

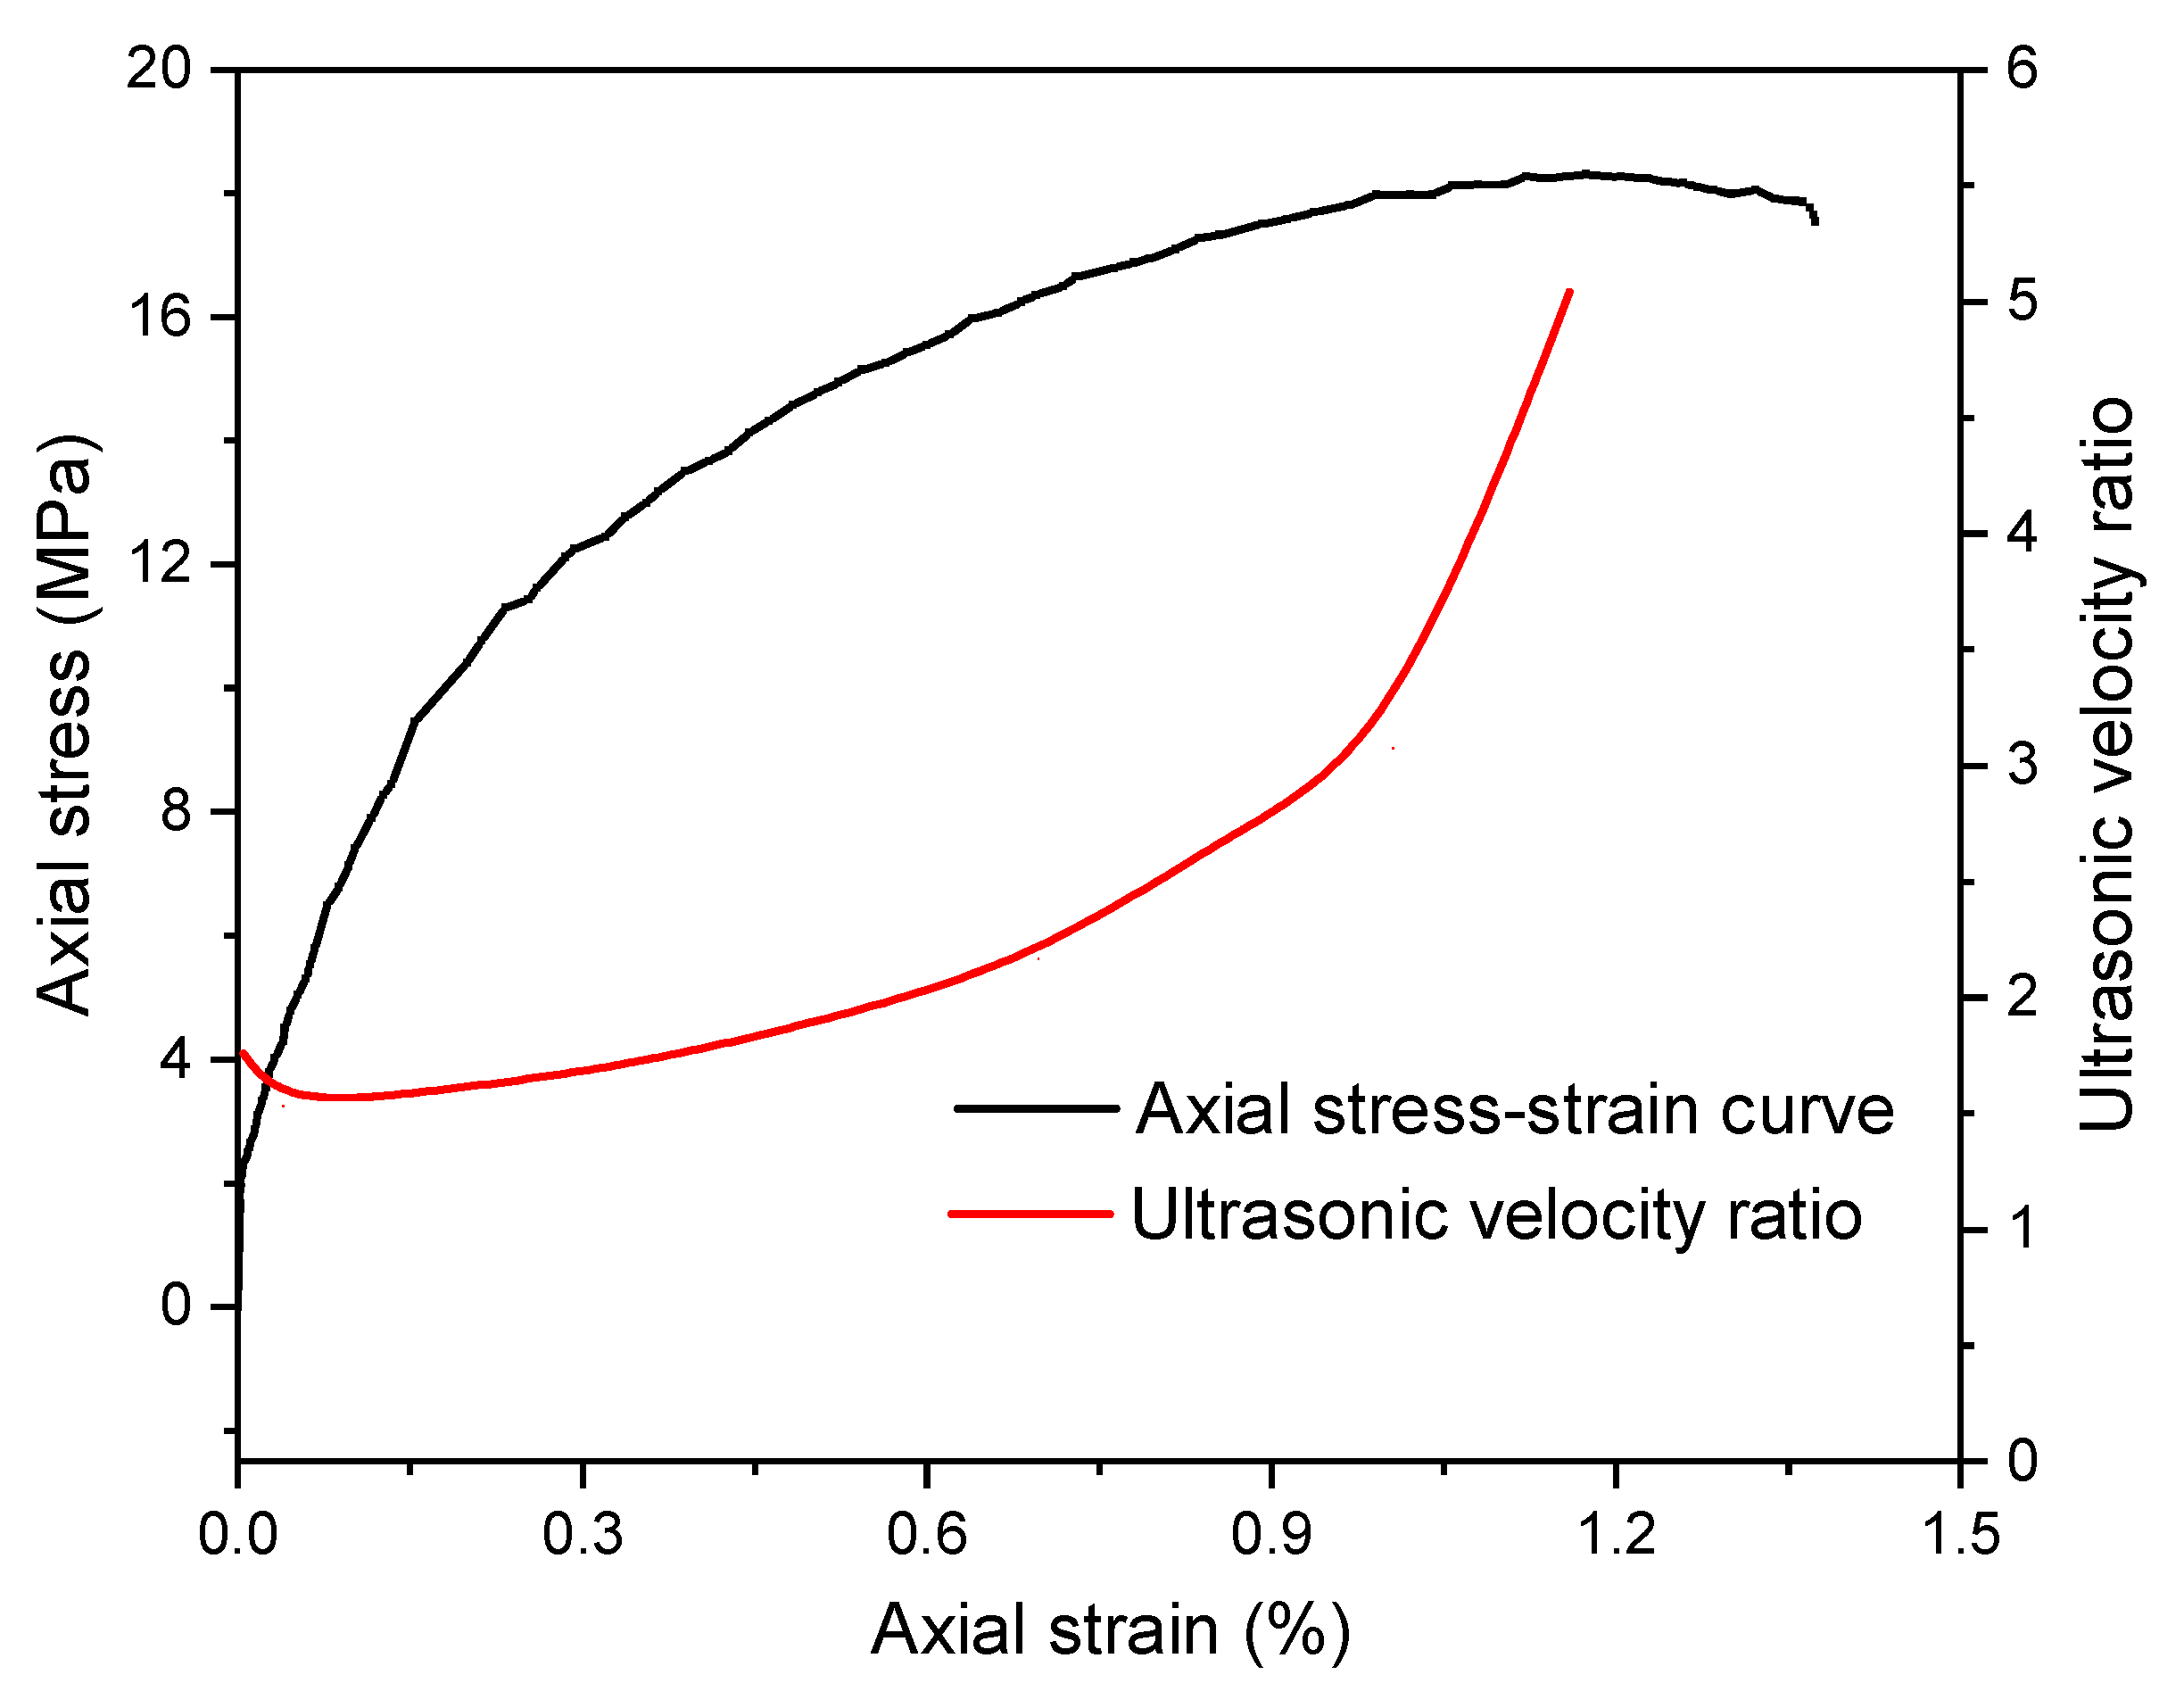
4.1. Ultrasonic Velocity Ratio

The ratio V P / V S , which reflects the damage process, decreased at first and rose later in the experiment (Figure 8). In the original salt rock sample, the P-wave velocity was 1.71 times the S-wave velocity; it decreased to 1.55 at the beginning of testing as the internal structure was compacted with increasing axial stress. When the stress increased, the salt rock was in the linear deformation stage, and V P / V S began to increase slowly. In the early stage of the stabilized-growth crack stage, the velocity ratio of the salt rock was 1.78; it then increased significantly to 2.04 at the end of this stage. After that, it increased sharply. When the stress level reached a peak, V P / V S rose to 3.08 and a large number of macroscopic cracks were produced inside the rock; at this point the rock approached failure. Based on three samples, the results show that rock damage can be effectively interpreted by V P / V S ; if V P / V S is less than 2.0, the rock is in a good condition; if V P / V S is 2.0–2.5, the rock had suffered serious damage; if V P / V S is over 2.5, the rock is about to fail.

4.2. Ib-Value

Gutenberg [32] defined the b-value with AE magnitude and frequency to interpret AE information. The formula was given as:
lg N = a b M ,
where M is the Richter magnitude for earthquakes, N is the incremental frequency whose magnitude is greater than M, and a and b are correlation coefficients. Rao [33] developed b-values using the Ib-value to clearly present rock damage:
I b = lg N ( w 1 ) lg N ( w 2 ) ( α 1 + α 2 ) σ ,
where α 1 and α 2 are user-defined constants between 0.5 and 5.0 (we set both constants to 1 in this study), w 2 is the upper amplitude limit, and w 1 is the lower amplitude limit. An increasing Ib-value indicates that rock damage is dominated by micro-cracks, while a decreasing Ib-value indicates that rock damage is dominated by macroscopic cracks. A stable trend in the Ib-value indicates that the damage status of the rock has not changed.
In this study, we used the mean amplitude of AE hits and Ib-values to analyze the damage process (Figure 9). Mean amplitude fluctuated within the first 200 s, as the sample was under the recoverable deformation state. It then entered a constant phase for a period of time before decreasing with increasing loading stress. Ib-values had consistent features with mean amplitude. In the compression fissures and linear deformation stages, it did not obviously change, only fluctuated slightly, which indicated the rock damage was in a stable state. However, it declined after the stabilized-growth cracks stage, indicating that a large number of cracks had been produced and connected inside the sample. The Ib-value fell to 0.43 at the peak loading stage.

4.3. r-Value

The energy of AE monitored by sensors can be used to quantify the stage of rock damage. Zang [34] used r-value to study damage in dry and wet sandstone, and defined the ratio of the sum of AE numbers and AE energy as follows:
r = N / E ,
where N is the sum of the AE numbers and E is the accumulated AE energy. In this study, AE energy was obtained by integrated hardware electronics of a PCI-2 Card (Figure 10a). The wavelets of AE numbers with loading time (Figure 10b) show that AE number and energy had different peaks. AE number peak occurred at 236 s, the beginning of the accelerated-growth cracks stage; while AE energy peaked at 345 s, the middle of the accelerated-growth crack stage. The curve between r-value and loading stress increased at first, declined later, and then gradually rose again (Figure 10c). In the beginning of testing, AE events were rare; however, they carried a certain amount of energy. Therefore, the r-value had a rising trend. It then declined when no energy was released during the compression fissure stage. After that, the r-value began to rise, indicating that energy was not released only by several events, but a great many rhythmic AE events with uniform energy. In contrast to other deformation stages, the r-value presented a slow rising character in the accelerated-growth crack stage, which implied that AE number and energy had consistent changes; in other words, energy release channels were unobstructed because of serious damage.

5. Discussion

The integrated testing apparatus for ultrasonic waves and acoustic emissions was a major advancement for the studies of rock damage. To distinguish acoustic wave signals emitted by UW-1, and AE activity, we applied a data filtering function [35] using the post-processing software (time filtering method) to eliminate the interference of acoustic wave signals in AE results. In this process, a small part of the AE signal was lost; however, it did not affect the overall pattern of AE. This defect needs to be optimized and improved in future developments. Although we did not study the coupling laws among rock cracks, ultrasonic wave and acoustic emission, the conclusions will be the basis of future studies.
According to seismological principles, the AE activity of salt rock conformed to swarm-type features; there was no prominent main shock, and the rock energy was released through many earthquakes with similar magnitudes over a long period. In addition, AE activity was discontinuous in time. As shown in Figure 4b, the AE activity of salt rock had interval burst features. The statistical results indicate that there were AE during 1% of the testing time, but no AE at other times because energy had to accumulate during the process of crack extension. Different kinds of rocks have different AE activity types, and the AE relationship can be an important parameter to determine rock damage.
We found that the ultrasonic velocity ratio, r-value, and Ib-value can be effective predictors of failure in the samples, but it is difficult to confirm the specific threshold. Based on this study, we recommend the r-value as the priority indicator to warn of rock failure. When the r-value has a slow rising trend, serious damage has happened inside the rock. While both the ultrasonic velocity ratio and Ib-value were also good representations of internal changes in the rock, they had their own deficiencies. Ultrasonic velocity, especially for the S-waves, was too sensitive to interpret accurately. Moreover, they did not have abnormal changes or inflection points before rock failure.

6. Conclusions

In this study, controlled laboratory experiments on salt rock samples under uniaxial stress were performed to study ultrasonic velocity and AE activity during deformation and damage. The conclusions are summarized as follows:
(1) An integrated apparatus of ultrasonic wave measurement and AE monitor was developed; it was composed of an ultrasonic wave testing system, an AE testing system, and a data recording system. It can be used to measure ultrasonic velocity and record AE information and location of a rock sample under uniaxial or triaxial loading. However, further improvements are needed to better separate the two types of data. In this paper, the results of ultrasonic wave and AE have been obtained on salt rock under uniaxial loading. This was an innovative experiment, which laid an important foundation for future research to reveal the coupling laws among rock cracks, ultrasonic waves and acoustic emission.
(2) The damage process of salt rock under uniaxial loading included five stages. In the compression fissures stage, the volumetric strain of salt rock increased while the crack volume decreased, but the crack volume strain was constant during the linear deformation stage. During the stabilized-growth crack stage, salt rock suffered unrecoverable damage and the compressed volumetric strain increased gradually and reached a peak. The beginning stresses of rock damage and dilatancy were about 42–50% and 62–67% of the uniaxial compressive strength, respectively. After dilatancy strength, internal cracks in the rocks expanded rapidly and connected, and the samples soon lost their carrying capacity.
(3) The ultrasonic wave velocity of salt rock first increased, stabilized for a time, and then finally decreased. S-waves were more sensitive to change than P-waves because micro-cracks were mostly parallel to the loading direction.
(4) In the compression fissures and linear deformation stage, AE activities in salt rock samples were very weak; however, they increased to account for 13.8% of the total AE activity in the stabilized-growth crack stage. When the loading stress was higher than the dilatation stress, AE activities were the most intense, accounting for 75.27% of the total AE events. After the stress peak, AE activities fell. We found that the AE location was a good predictor of crack development and rock damage. The ultrasonic wave velocity ratio, r-value, and Ib-value can predict damage to rock samples; however, r-values are superior owing to their sensitivity and ease of measurement.

Acknowledgments

The authors acknowledge the financial support of the National Natural Science Foundation for Young Scientists of China (Grant nos. 41602328, 51509261) and the Natural Science Foundation of Hebei Province (Grant no. D2017210182).

Author Contributions

Haoran Li and Mingyi Chen conceived and designed the experiments; Zhikai Dong performed the experiments; Haoran Li and Wenjun Jing analyzed the data; Haoran Li, Yun Yang and Bo Liu wrote the paper.

Conflicts of Interest

The authors declare no conflict of interest.

References

  1. Berest, P.; Brouare, B.; Durup, G. Behavior of Sealed Solution-mined Cavern. In Proceedings of the EURock 96 on Performance in Rock Mechanics and Rock Engineering, Turin, Italy, 2–5 September 1996; pp. 1127–1131. [Google Scholar]
  2. Cosenza, P.H.; Ghoreychi, M.; Bazargan-Sabet, B.; Marsily, G.D. In situ rock salt permeability measurement for long term safety assessment of storage. Int. J. Rock Mech. Min. Sci. 1999, 24, 509–526. [Google Scholar] [CrossRef]
  3. Evans, D.J. An appraisal of underground gas storage technologies and incidents, for the development of risk assessment methodology. J. Fuel Cell Technol. 2007, 49, 97–107. [Google Scholar]
  4. Berest, P.; Brouard, B. Safety of salt caverns used for underground storage. Oil Gas Sci. Technol. 2003, 58, 361–384. [Google Scholar] [CrossRef]
  5. Thoms, R.L.; Gehle, R.M. A brief history of salt cavern use. In Proceedings of the 8th World Salt Symposium, The Hague, Netherlands, 7–11 May 2000; pp. 207–214. [Google Scholar]
  6. Neal, J.T.; Magorian, T.R. Geologic site characterization (GSC) principles derived from storage and mining projects in salt, with application to environmental surety. Environ. Geol. 1997, 29, 165–175. [Google Scholar] [CrossRef]
  7. Tomasko, D.; Elcock, D.; Veil, J.; Caudle, D. Risk Analyses for Disposing Nonhazardous Oil Field Wastes in Salt Caverns; Argonne National Laboratory: Lemont, IL, USA, 1997. [Google Scholar]
  8. Keeley, D. Failure Rates for Underground Gas Storage-Significance for Land Use Planning Assessments; Health and Safety Laboratory: Buxton, UK, 2008. [Google Scholar]
  9. Sovacool, B.K. The costs of failure: A preliminary assessment of major energy accidents, 1907–2007. Energy Policy 2008, 36, 1802–1820. [Google Scholar] [CrossRef]
  10. Dirtert, J.A.; Pursell, D.A. Underground Natural Gas Storage; Simmons & Company International: Houston, TX, USA, 2000. [Google Scholar]
  11. Whyatt, J.K.; Varley, F.D. Catastrophic failures of underground evaporate mines. In Proceedings of the 27th International Conference on Ground Control in Mining, Morgantown, WV, USA, 29–31 July 2008; pp. 113–122. [Google Scholar]
  12. Chmel, A.; Shcherbakov, I. A comparative acoustic emission study of compression and impact fracture in granite. Int. J. Rock Mech. Min. Sci. 2013, 64, 56–59. [Google Scholar] [CrossRef]
  13. Zhao, X.D.; Tang, C.A.; Li, Y.H.; Yuan, R.F.; Zhang, J.Y. Study on AE activity characteristics under uniaxial compression loading. Chin. J Rock Mech. Eng. 2006, 25, 3673–3678. [Google Scholar]
  14. Chen, S.W.; Yang, C.H.; Liu, P.J.; Wang, G.B.; Wei, X. Laboratory simulation test of thermal cracking of Beishan granite. Rock Soil Mech. 2016, 37, 547–556. [Google Scholar]
  15. Geng, J.S.; Sun, Q.; Zhang, Y.C.; Cao, L.W.; Zhang, W.Q. Studying the dynamic damage failure of concrete based on acoustic emission. Constr. Build Mater. 2017, 149, 9–16. [Google Scholar] [CrossRef]
  16. Kong, B.; Wang, E.Y.; Li, Z.H.; Wang, X.R.; Liu, X.F.; Li, N.; Yang, Y.L. Electromagnetic radiation characteristics and mechanical properties of deformed and fractured sandstone after high temperature treatment. Eng. Geol. 2016, 209, 82–92. [Google Scholar] [CrossRef]
  17. Li, B.Q.; Einstein, H.H. Comparison of Visual and Acoustic Emission Observations in a Four Point Bending Experiment on Barre Granite. Rock Mech. Rock Eng. 2017, 50, 2277–2296. [Google Scholar] [CrossRef]
  18. Alkan, H.; Cinar, Y.; Pusch, G. Rock salt dilatancy boundary from combined acoustic emission and triaxial compression tests. Int. J. Rock Mech. Min. Sci. 2007, 44, 108–119. [Google Scholar] [CrossRef]
  19. Ren, S.; Bai, Y.M.; Zhang, J.P.; Jiang, D.Y.; Yang, C.H. Experimental investigation of the fatigue properties of salt rock. Int. J. Rock Mech. Min. Sci. 2013, 64, 68–72. [Google Scholar]
  20. Fan, J.Y.; Chen, J.; Jiang, D.Y.; Chemenda, A.; Chen, J.C.; Ambre, J. Discontinuous cyclic loading tests of salt with acoustic emission monitoring. Int. J. Fatigue 2017, 94, 140–144. [Google Scholar] [CrossRef]
  21. Filimonov, Y.L.; Lavrov, A.V.; Shafarenko, Y.M.; Shkuratnik, V.L. Memory effects in rock salt under triaxial stress state and their use for stress measurement in a rock mass. Rock Mech. Rock Eng. 2001, 34, 275–291. [Google Scholar] [CrossRef]
  22. Szewczyk, D.; Bauer, A.; Holt, R.M. Stress-dependent elastic properties of shales—laboratory experiments at seismic and ultrasonic frequencies. Geophys. J. Int. 2017, 212, 189–210. [Google Scholar] [CrossRef]
  23. Luo, J.H.; Cai, Z.L.; Liu, K.; Li, X.C. Determination of the various stages in the process of rock failure under loading by the acoustic parameters. Rock Soil Mech. 1992, 13, 51–56. [Google Scholar]
  24. Zhu, J.X.; Chen, L.Z.; Yan, X.S. Ultrasonic pulses behavior in concrete during compressive loading. Eng. Mech. 1998, 15, 111–117. [Google Scholar]
  25. Zheng, G.P.; Zhao, X.D.; Liu, J.P.; Li, Y.H. Experimental study on change in acoustic wave velocity when rock is loading. J. Northeast. Univ. 2009, 30, 1197–1200. [Google Scholar]
  26. Asselmeyer, F.; Hartmann, K. Solidification of rock salt crystals by ultrasonic-waves. Phys. Status Solidi A–Appl. Mater. Sci. 1972, 14, 613–622. [Google Scholar] [CrossRef]
  27. Chen, J.; Ren, S.; Yang, C.H.; Jiang, D.Y.; Li, L. Self-healing characteristics of damaged Rock salt under different healing conditions. Materials 2013, 6, 3438–3450. [Google Scholar] [CrossRef] [PubMed]
  28. Zong, J.J.; Stewart, R.R.; Dyaur, N.; Myers, M.T. Elastic properties of rock salt: Laboratory measurements and Gulf of Mexico well-log analysis. Geophysics 2017, 82, 303–317. [Google Scholar] [CrossRef]
  29. Wang, B.; Zhu, J.B.; Yan, P.; Huang, S.L.; Wu, A.Q. Damage strength determination of marble and its parameters evaluation based on damage control test. Chin. J. Rock Mech. Eng. 2012, 31, 3967–3973. [Google Scholar]
  30. Li, L.; Chen, J.; Jiang, D.Y.; Yang, C.H.; Liu, C. Analysis of surface crack growth in layered salt rock under uniaxial compression. Rock Soil Mech. 2011, 32, 1394–1398. [Google Scholar]
  31. Wang, X.Q.; Ge, H.K.; Song, L.L.; He, T.M.; Xin, W. Experimental study of two types of rock sample acoustic emission events and Kaiser effect point recognition approach. Chin. J. Rock Mech. Eng. 2011, 30, 580–588. [Google Scholar]
  32. Gutenberg, B.; Richter, C.F. Seismicity of the Earth and Associated Phenomena, 2nd ed.; Princeton University Press: Princeton, NJ, USA, 1954. [Google Scholar]
  33. Rao, M.V.M.S.; Lakshmi, K.J.P. Analysis of b-value and improved b-value of acoustic emissions accompanying rock fracture. Curr. Sci. 2005, 89, 1577–1582. [Google Scholar]
  34. Zang, A.; Wanger, F.C.; Dresen, G. Acoustic emission, microstructure, and damage model of dry and wet sandstone stressed to failure. J. Geophys. Res. 1996, 101, 17507–17521. [Google Scholar] [CrossRef]
  35. Li, H.R.; Yang, C.H.; Chen, F.; Hong-Ling, M.A.; Wu, S.W. Development of a device for rock’ acoustic waves and acoustic emission integrative testing and its application. Rock Soil Mech. 2016, 37, 287–296. [Google Scholar]
Figure 1. Schematic of integrated testing of ultrasonic waves and acoustic emissions for rock under uniaxial stress. AE, acoustic emissions; PCI, peripheral component interconnect; P-sensor, pressure wave sensor; S-sensor, shear wave sensor; UW-1, ultrasonic wave system part #1; UW-2, ultrasonic wave system part #2.
Applsci 08 00553 g001
Figure 2. Salt samples for testing. (a) Rock cutting machine; (b) standard cylinder samples with a diameter of 100 mm and a length of 200 mm.
Applsci 08 00553 g002
Figure 3. (a) Diagram of ultrasonic velocity and AE testing for salt rock under uniaxial stress; (b) AE sensor’s layout, #1, #2, #3, and #4 = the sensor’s number.
Applsci 08 00553 g003
Figure 4. (a) Axial stress–strain relationship for sample SA-2 under uniaxial compression; (b) the relationship between ultrasonic velocity and AE activity for sample SA-2 under uniaxial compression.
Applsci 08 00553 g004
Figure 5. P- and S-waves’ velocity attenuations in sample SA-2 at different loading phases.
Applsci 08 00553 g005
Figure 6. AE locations in sample SA-2 during different deformation stages; (a) compression fissures stage; (b) linear deformation stage; (c) stabilized-growth crack stage; (d) accelerated-growth cracks stage and (e) after peak stress stage. The purple part was the rock sample; the black grid helped to locate AE positions; the red spots represented the location of AE enents.
Applsci 08 00553 g006
Figure 7. Comparison of damaged rock after uniaxial compression and AE event locations for sample SA-2.
Applsci 08 00553 g007
Figure 8. Relationship between axial stress-strain curve and ultrasonic velocity ratio at different deformation stages for sample SA-2 under uniaxial compression.
Applsci 08 00553 g008
Figure 9. (a) Variation of AE hit average amplitude with loading time for sample SA-2 under uniaxial compression; (b) relationship between axial stress-strain curve and Ib-value during different deformation stages for sample SA-2 under uniaxial compression.
Applsci 08 00553 g009
Figure 10. (a) Relationship between AE energy and loading time for sample SA-2 under uniaxial compression; (b) relationship between AE number and loading time for sample SA-2 under uniaxial compression; (c) relationship between axial stress and r-values for sample SA-2 under uniaxial compression.
Applsci 08 00553 g010
Table 1. Damage and dilatancy strength for salt rock samples under uniaxial compression.
Sample NumberUniaxial Compression Strength/MPaDamage Strength/%Dilatancy Dtrength/%
SA-119.542.562.6
SA-216.445.066.4
SA-318.249.763.1
Mean value18.045.764.0
Standard deviation1.563.662.04
Table 2. Acoustic emission events of salt rock in different stages under uniaxial stress.
Sample NumberAE Event Percentage/%Event Sum
Stage 1Stage 2Stage 3Stage 4Stage 5
10.063.0414.471.910.66904
20.052.2111.979.46.47751
30.022.7415.174.57.68233
Mean value0.042.6613.875.278.237629
Standard deviation0.020.421.683.812.16673

