Heat Transfer Enhancement of the Air-Cooling Tower with Rotating Wind Deflectors under Crosswind Conditions


School of Electrical and Power Engineering, China University of Mining and Technology, Xuzhou 221116, China
*
Author to whom correspondence should be addressed.
Appl. Sci. 2018, 8(4), 544; https://doi.org/10.3390/app8040544
Submission received: 28 January 2018
/
Revised: 26 March 2018
/
Accepted: 28 March 2018
/
Published: 2 April 2018
(This article belongs to the Section Energy Science and Technology)
Abstract
:Featured Application
The results show that the performance of the air-cooling tower under crosswind conditions can be improved by using the rotating wind deflectors at an optimal rotation speed, which can supply the theoretical support for relevant engineering applications.
Abstract
To investigate the effect of wind deflectors on air flow and heat transfer performance of an air-cooling tower under crosswind conditions, an experimental system based on a surface condenser aluminum exchanger-type indirect air-cooling tower is established at a 1:100 proportional reduction. A 3-D computational fluid dynamics simulation model is built to study the air flow and temperature fields. The air flow rate into the cooling tower and the heat transfer rate of the radiators are used to evaluate cooling performance. Rotating wind deflectors are adopted to reduce the influence of crosswind on the cooling tower performance. The effects of the rotating wind deflectors on the thermal-hydraulic characteristics of the air-cooling tower under different environmental crosswind speeds are studied. Results indicate that the wind direction in the tower reverses as the rotating speed of the wind deflectors increases. The thermal performance of an air-cooling tower under crosswind conditions can be improved by using rotating wind deflectors. The heat transfer rate of a cooling tower with eight wind deflectors begins to increase when the rotating speed exceeds 2 r/min.
1. Introduction
Some areas are rich in coal resources but lacking in water resources. Air-cooling systems are widely used to help conserve water, especially in areas where water is scarce. Water quantity determines the type of cooling towers used in a power plant. An air conditioning system was modeled in TRNSYS software [1] for energy and water conservation; the results showed the benefits of optimizing the control strategy and cooling tower configuration with a maximum energy savings and water reduction of 10.8% and 4.8%, respectively [2]. To protect water resources, significant conservation is obtained by applying an indirect air-cooling tower as shown in References [3,4]. The indirect air-cooling tower is relatively complex, and the consumption of the circulating pump is relatively high; however, it can achieve low back pressure due to the hybrid condenser. The cooling unit could save approximately 50–80% of water compared to a wet-cooling tower. The indirect dry-cooling tower removes heat due to the natural buoyancy generated by heated air near the radiator; therefore, the thermal performance of the radiator is substantially affected by environmental factors, especially crosswind and temperature. Gao et al. [5] investigated the thermal performance of a wet-cooling tower with different filling layout patterns under windless and 0.4 m/s crosswind conditions, respectively, and discovered that the optimal nonuniform layout pattern has better thermal performance under 0.4 m/s crosswind conditions.
Previous research [6] has found that the cooling efficiency of the tower is reduced, and electricity produced by the power station decreases to a large extent due to a higher environmental temperature or crosswinds exceeding 4 m/s in the summer or windy season, respectively, thereby improving cooling efficiency through an air-cooling system [7]. Kapas [8] found that cooling capacity first increases and then decreases as the crosswind speed rises according to numerical simulation and experimental results. Chen et al. [9] indicated that heat transfer efficiency can decline due to inhomogeneous intake air around the tower inlet, the influence of which is greater than the air flow rate. Previous studies have suggested that a wind deflector can reduce the impact of crosswind on heat transfer and enhance the heat transfer rate in cooling tower radiators. Preez and Kröger [10] proposed the concept of windbreak to improve the cooling tower structure in 1993. The cooling performance of cooling towers has also been shown to improve using windbreak methods in and around towers on windy days [11]. The air flow rate of the tower and cooling efficiency can increase by 5–10% and 2–5%, respectively, after wind deflectors are used [12]. Goodarzi [13] established a new stack configuration for a dry-cooling tower and found that the cooling performance could be increased by 9% at a wind speed of 10 m/s according to numerical simulation. Lu et al. [14] indicated using numerical methods that a wind deflector can only improve cooling performance in a particular direction. Different climates, geographical conditions, and unit capacities garner different research results, including the effects of crosswind on heat transfer and the number of wind deflectors used in improvement measures.
While extensive studies have explored air-cooled heat exchangers [4,15,16,17,18,19,20,21] and air-cooling towers [7,22,23,24,25,26], few have looked at air-cooling towers with rotating wind deflectors. To investigate the effects of rotating wind deflectors on the air flow and heat transfer performance in air-cooling towers, an experimental system based on a surface condenser aluminum exchanger (SCAL)-type indirect air-cooling tower has been established with a 1:100 proportional reduction according to the similarity principle, and 3-D numerical models of the prototype indirect air-cooling tower have been built. The effects of crosswind and the number of wind deflectors on the cooling performance of the air-cooling tower under different ambient crosswind speeds are studied using an experiment and numerical simulation. Then, air flow rate and heat transfer performance are investigated when wind deflectors are rotated at various velocities. The heat transfer efficiency can be greatly improved at an optimal rotation speed through analyzing the energy balance, which could provide theoretical support for relevant engineering applications.
2. Experimental Procedure and Data Reduction
2.1. Experimental System and Procedure
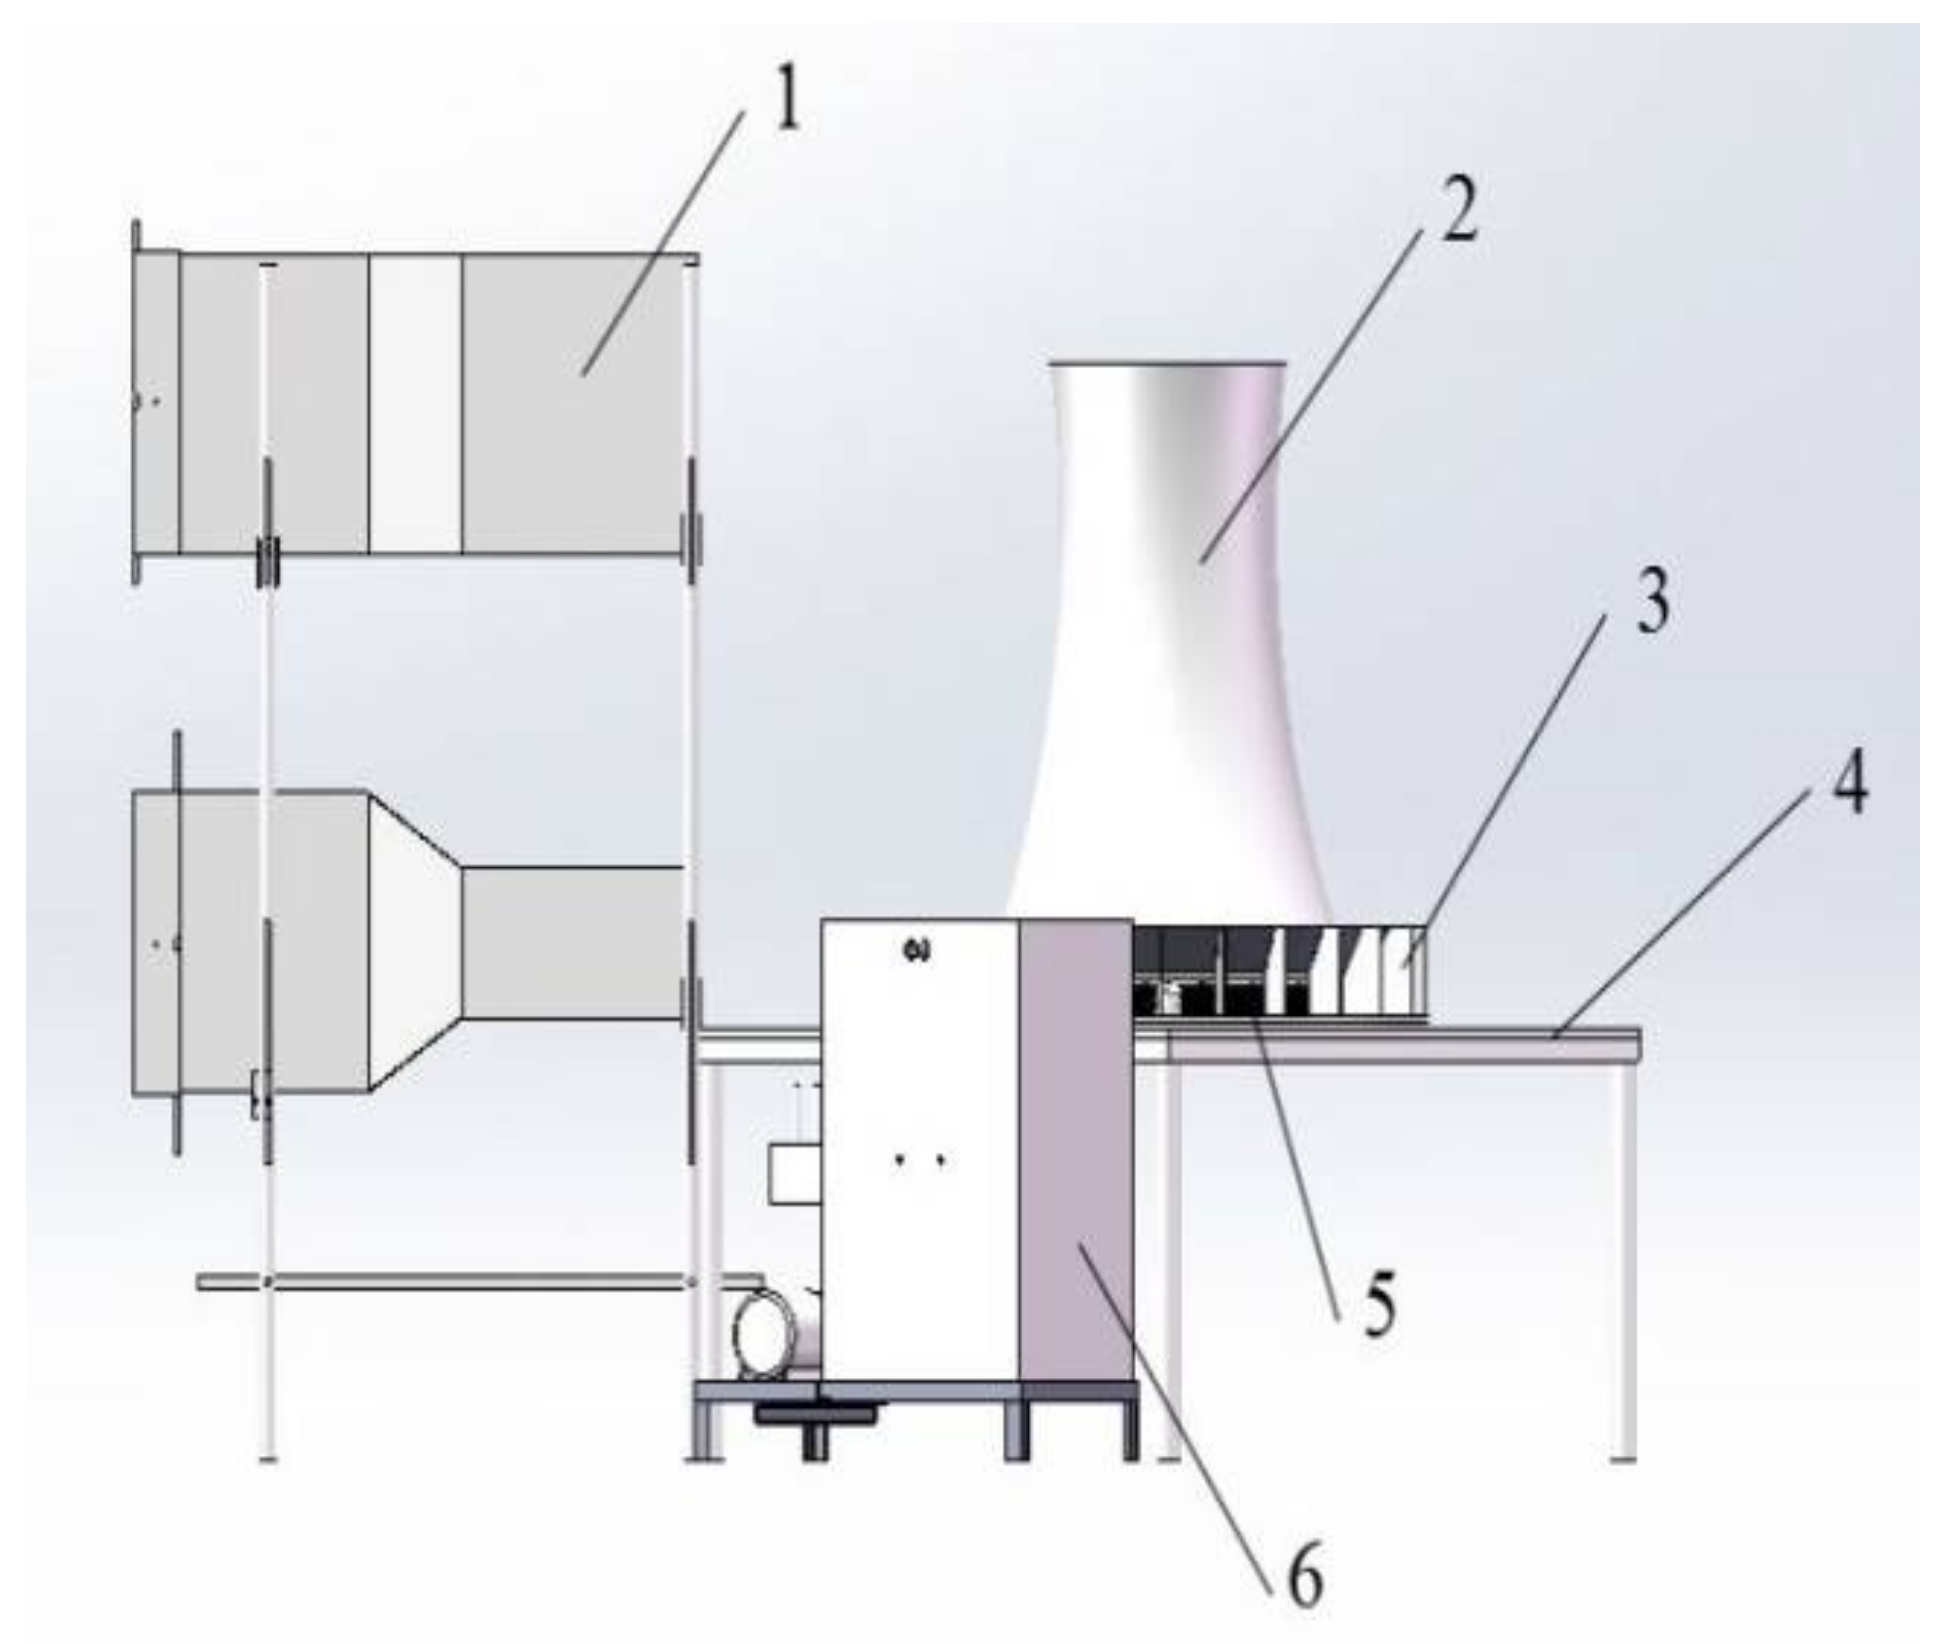
The height of the cooling tower in this experiment is 1540 mm; the air inlet height, throat radius, mean radius of the air inlet, and radius of the top of the tower are 104 mm, 343 mm, 580 mm, and 370 mm, respectively. Gao et al. [27] found that air velocities agreed under the same proportions. According to the similarity principle, the actual size of the air-cooling tower was simplified by a 1:100 proportional reduction, and then an experimental system of a SCAL-type indirect air-cooling tower was established. Experiments were conducted in a natural-wind-simulating system and water-cycling system. The schematic diagram of the experimental apparatus is shown in Figure 1, consisting of a cooling tower body, radiators, rotating wind deflectors, natural-wind-simulating system, and water-heating tank. The environmental natural wind simulation system is shown in Figure 2.
It is difficult to perfectly satisfy the similarities for ReD and Fr simultaneously in the laboratory; limited similarity conditions could be achieved between the prototype and the experimental model. The key scaling parameters used in the experimental model include the aspect ratio of the tower, crosswind speed ratio, Froude number, and Euler number [28]. Hot water was intended to provide hot fluid at 40 °C through the radiator tubes in the air-cooling tower. The outlet temperature of the radiators was taken by the average temperature after several experiments. Hot water flowed inside the tubes while air acted as a coolant, flowing outside the finned tubes. The wind speed in the experiment was 1/10 of the true wind speed; thus, the inlet wind velocity at the upward side of the tower, produced by the lower fan, was 0 m/s for the windless state and 0.2, 0.3, 0.4, 0.5, 0.6, and 0.8 m/s thereafter. According to the distribution of natural wind and the vertical distance between the two fans in the experiment, the top-level wind velocity produced by the upper fan was approximately 0 m/s in the windless state and 0.4, 0.6, 0.8, 1.0, 1.2, and 1.6 m/s according to previous research [27].
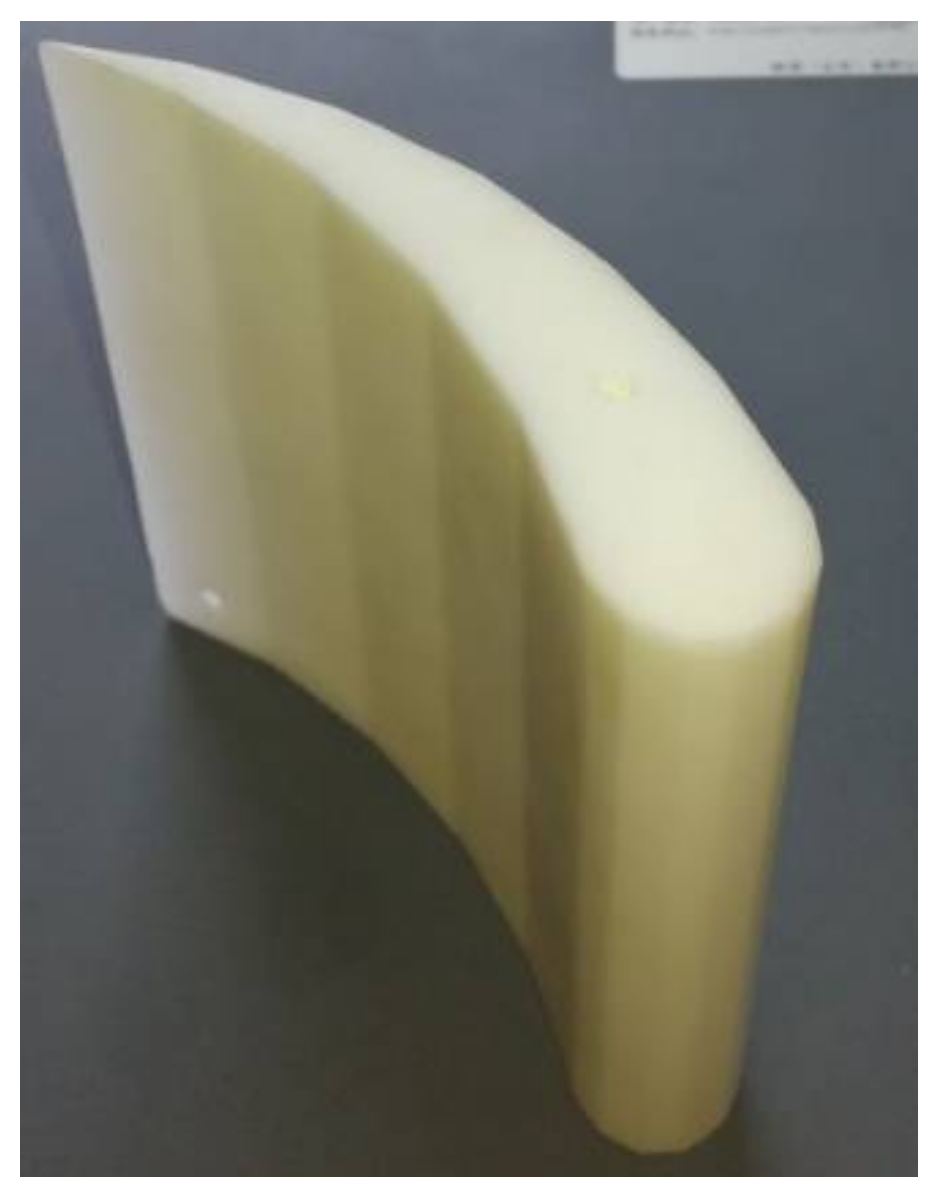
The inlet velocity of the air in the air-cooling tower was quite small due to natural wind, which led to a larger measurement error. The natural-wind-simulating system shown in Figure 3 was used in the experiment to increase the inlet velocity. To investigate the effect of inlet air on the cooling performance and to improve the wind environment, a rotating wind deflector system was adopted in the experimental system. A sketch of the rotating wind deflector system is shown in Figure 3, and a picture of the wind deflector is shown in Figure 4.
During the experimental process, air flow from the laboratory room was induced through the wind tunnel by a small fan to pass successfully into the air-cooling tower. Hot water was driven to the air-cooled heat exchangers by a pump from a hot water tank, which could heat the water to 40 °C using electric heating rods (0–6 kW). The outlet temperature of the water in the heat exchangers was measured using two high-precision PT100-type thermal resistors with an accuracy of ±0.1 °C. The flow rate of water into the tower was measured by a rotameter (0–15 L/min with a minimum scale of 0.01 L/min). Air velocity was measured using a KA22-type hot-wire anemometer with an accuracy of 0.01 m/s. The air temperatures of the tower inlet and outlet were measured by two sets of multi-point T-type copper-constantan thermocouple grids, respectively. Each set contained six calibrated thermocouples with an accuracy of ±0.2 °C.
The change law of total heat transfer for the radiators was revealed by testing the temperature differences of the cooling water in the radiators. Small adjustable-speed fans were placed in the upper and lower air ducts to simulate ambient crosswind. During data collection, each measured value was read at least three times. Then, the arithmetic mean of the recorded data for a certain working condition was used to calculate the other parameters.
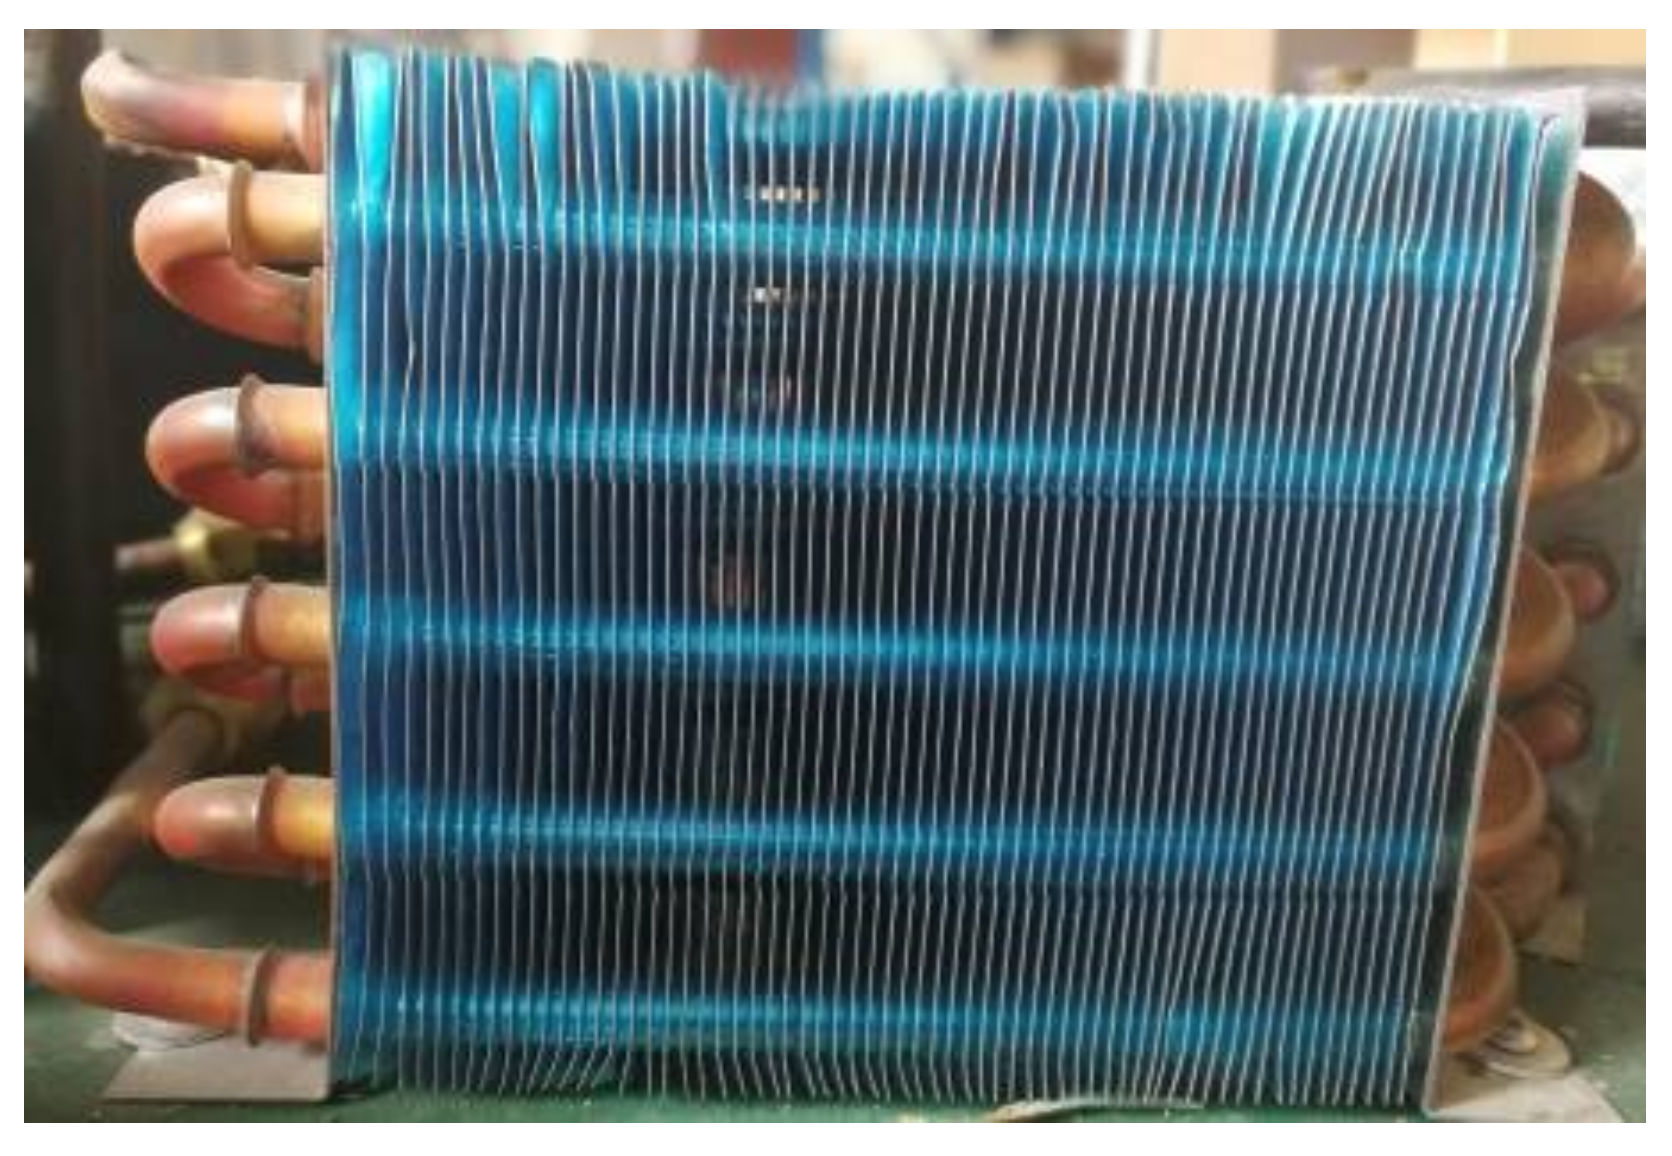
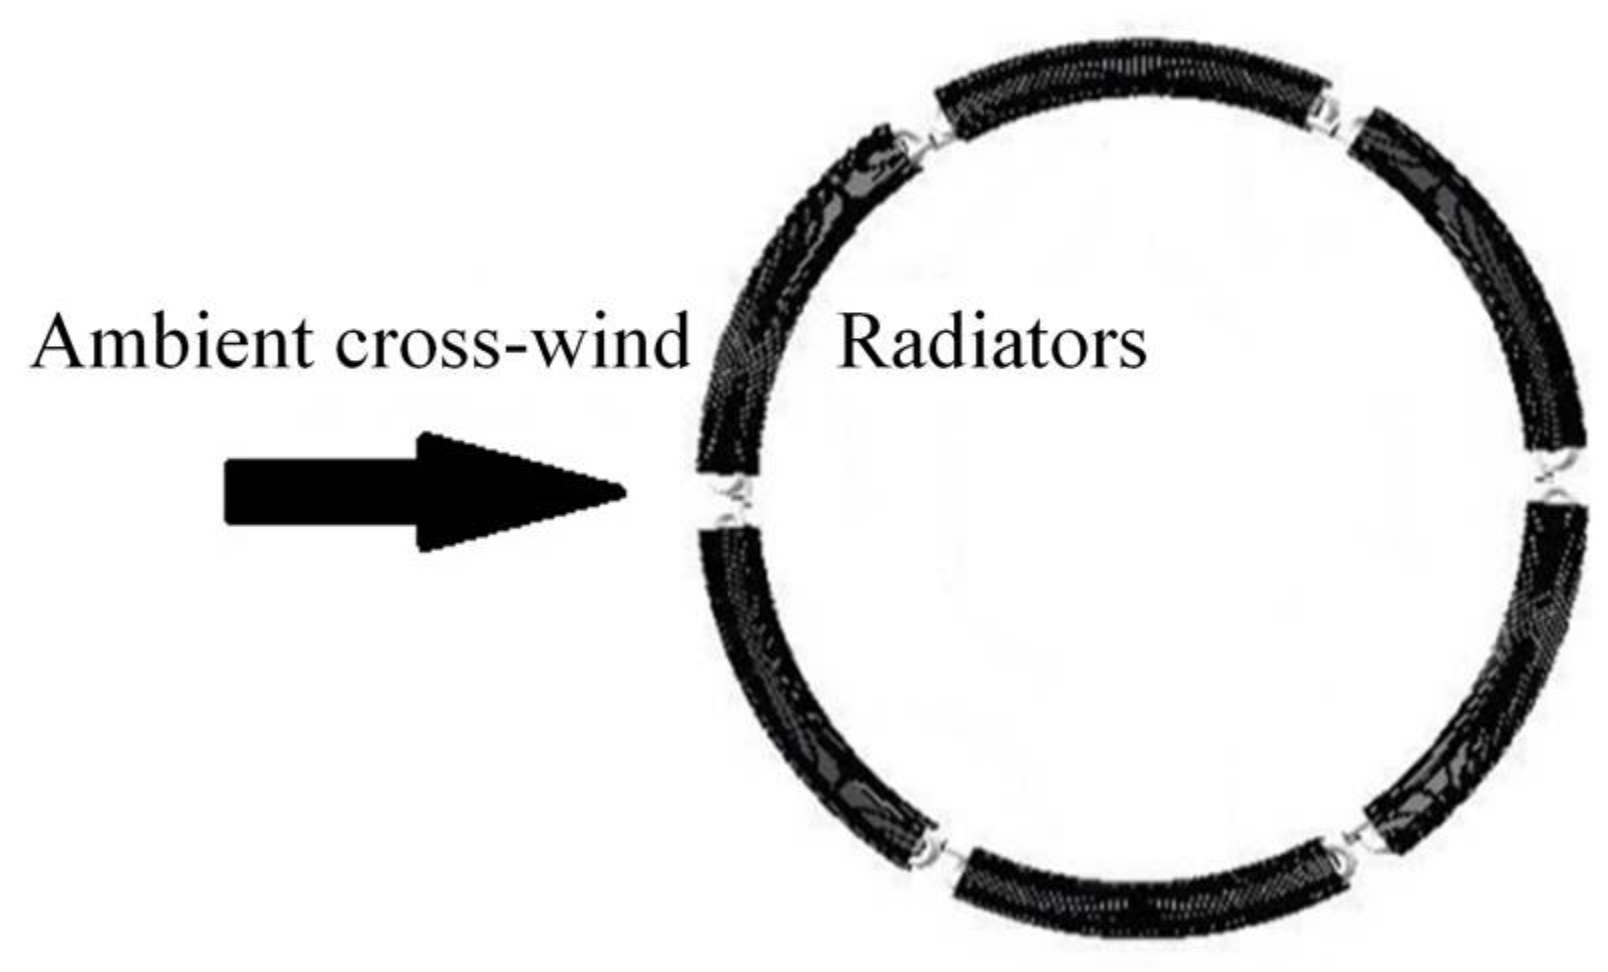
This experiment was completed under atmospheric pressure and room-temperature conditions (15–25 °C). The air-cooled radiators in a crossflow of air were studied. One of the radiators is shown in Figure 5; they consisted of finned tube heat exchangers with double rows of tubes, a single tube-pass, and plain fins. Heat exchangers only tested samples of the air-cooling tower used in the power plant. The tubes and fins were constructed from copper and aluminum, respectively. The fins measured 143 × 125 × 44 mm, and fin thickness and space were 0.5 mm and 2.5 mm, respectively. Six sets of radiators were installed at the bottom of the cooling tower in this experiment, with 10 tubes inside each set of radiators. The installation configuration of the experimental system is shown in Figure 6.
Suitable data acquisition systems and data collectors were used to gather and save the experimental data. The transient temperature of water and air, declines in water pressure, and water flow meter signals were measured and recorded using a real-time hybrid recorder. The testing parts were covered by thick foam insulation to reduce heat loss. All measurement instruments were adjusted to verify the testing methods and results before the experiment was officially initiated. According to uncertainty estimation methods [29], the maximum experimental uncertainty for the temperature drop and heat transfer rate of water was 1.41% and 2.06%, respectively.
2.2. Data Reduction
Given the challenge in measuring some parameters directly (e.g., the wall temperature of heat exchangers and heat transfer rate) to obtain the convection heat transfer coefficient of the air side, experimental data were reduced to evaluate the cooling performance of the air-cooling tower. The thermal properties of air and water were determined based on the average value of each respective temperature. The main data reduction process is described in detail below. The cooling performance of the air-cooling tower is characterized by selecting the key measurement parameters and evaluation indices.
2.2.1. Cooling Temperature Drop
The mean cooling temperature drop of cooling water can reflect the cooling performance of the cooling tower in the natural wind environment. The mean cooling temperature drop of cooling water, , is calculated by
where and are the inlet and outlet temperature of cooling water, respectively, inside the cooling tower.
2.2.2. Heat Dissipating Capacity
The heat dissipating capacity of the cooling tower represents the heat transfer rate of the radiators at the bottom of the tower. It is computed by the temperature drop in cooling water.
where is the volume flow rate of cooling water.
2.2.3. Thermal Efficiency Coefficient
The mean cooling temperature drop of cooling water does not fully reflect cooling tower performance. The thermal efficiency coefficient [30] of the cooling tower is adopted to characterize the difference in cooling performance of the indirect air-cooling tower under crosswind conditions or windless conditions. The thermal efficiency coefficient is defined as the ratio of heat transfer rate at a certain wind velocity to that with no wind [30]:
where the subscript “v” stands for crosswind with a certain velocity, and the subscript “0” indicates no crosswind.
The thermal efficiency coefficient of the cooling tower is a dimensionless parameter, denoting cooling performance between the experimental model and numerical model. The thermal efficiency coefficient from the experiment is calculated according to the temperature decline of water flowing through the cooling tower radiators. The coefficient from the numerical simulation can be obtained according to the ratio of the heat transfer rate through FLUENT software. Then, results from the experiment can be compared and analyzed against those from the numerical model based on the thermal efficiency coefficient.
2.2.4. Dimensionless Velocity
Dimensionless velocity is adopted to compare the results from the experimental and numerical methods, considering the differences between the models used in the experiment and numerical analysis. Dimensionless velocity V at a certain value is defined as
where v is the crosswind velocity; and and are the maximum and minimum velocities with crosswind, respectively.
3. Numerical Model
3.1. Governing Equations
Air flow is assumed to be steady. A general differential equation of flow and heat transfer is governed by the following equation [31]:
where is the general dependent variable, which can represent u, v, w, k, ε, T, and 1. ρ is the air density; Γ is the generalized diffusion coefficient; and S is the source term. The specific forms of these equations are listed in Table 1. In Table 1, µt is the turbulent viscosity coefficient, and G is the turbulent energy generation rate derived from the following equations.
is the net source term. The constants of the turbulence model in Table 1 are as follows: , where is the Prandlt number of fluid and is the turbulent Prandlt number.
The treatment of buoyancy is based on the Boussinesq approximation of density variation and temperature change. The air flow in the computational domain is assumed to be incompressible. The variation in air density in the tower is mainly caused by air temperature according to the following equation:
It is difficult to draw a grid for the complex structure of the radiator in the cooling tower, especially the finned tube bundles. In FLUENT, the radiator model is an effective method to manage the structure. The resistance in air flow caused by the radiators is expressed as a drag source term in a momentum equation:
where the pressure drop coefficient is a constant computed from the following experimental correlation [32] with a value of 0.81. Heat transferred from the finned tube bundle radiators to air is expressed as an energy source term in the air energy equation:
where k is the overall heat transfer coefficient of the radiator. Tw is the water temperature, and is the air temperature. Av is the heat transfer area of the radiators. The overall heat transfer coefficient k is approximately 1600 W/(m2·K) according to the experimental data.
3.2. Model Geometry
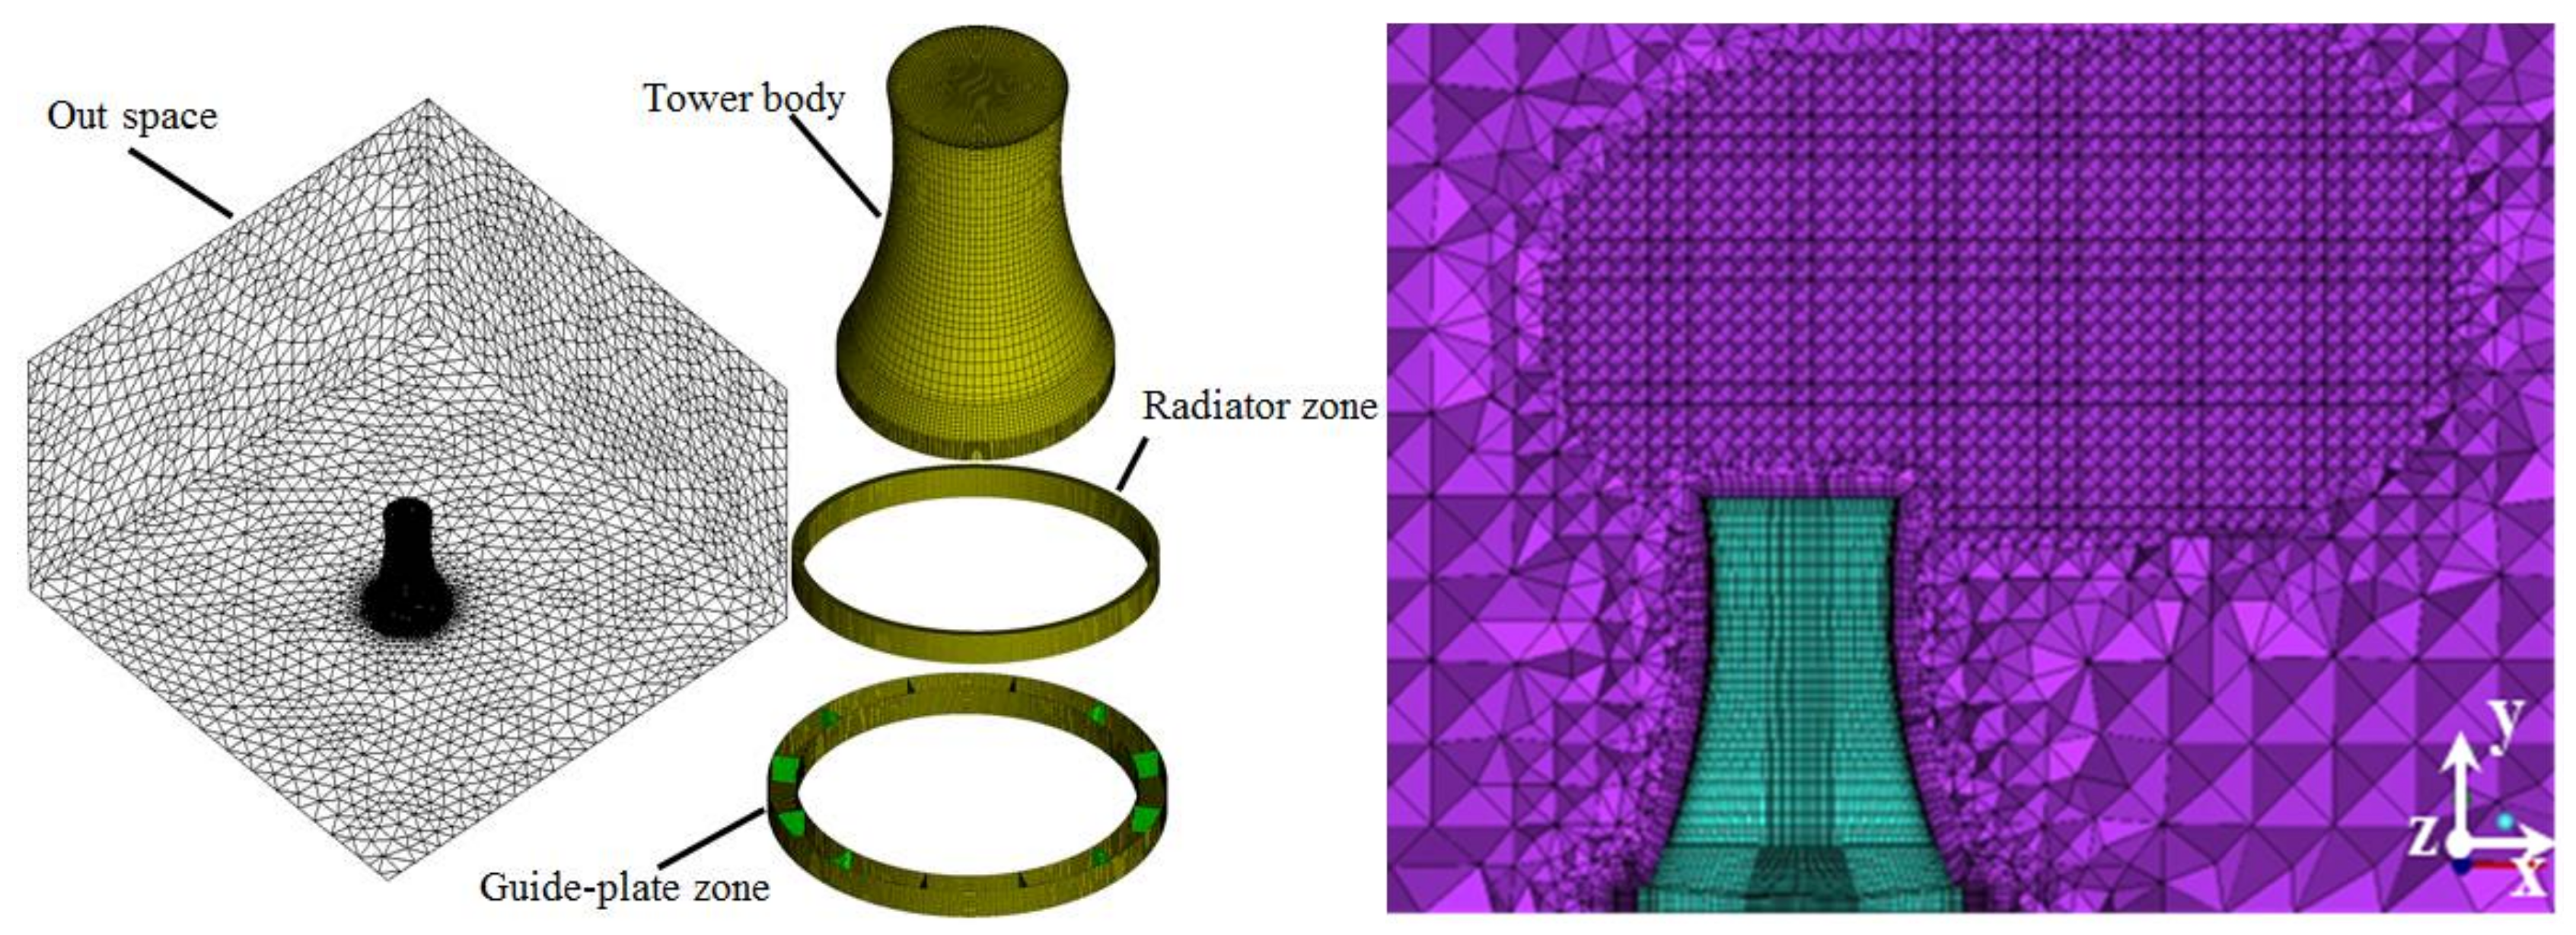
The hyperbolic-type natural draft dry-cooling tower modeled in the previous CFD study is 154 m tall and 58 m in diameter with a 10.5 m tower inlet height and throat diameter of 34 m. The computational domain is a cube shape measuring 400 m high and 800 m long, as shown in Figure 7. Based on the similarity principle, the experimental cooling tower model is a reduced model with a scale of 0.01, and the numerical results can be compared with experimental data based on heat transfer characteristics.
3.3. Boundary Conditions
As shown in Figure 8, the pressure-inlet condition on the boundary of the computational domain is used when there is no crosswind, whereas the velocity-inlet condition is adopted when crosswind exists. Environmental wind speeds at different heights are solved by the power exponent function according to the following air velocity profile [33], where the user-defined function is used to set the different wind speed at different heights:
where is the velocity at a height of 10 m, and the exponent in Equation (11) is the crosswind velocity profile index based on ground roughness, which depends on atmospheric stability (set at 0.28) [34]. The other four outlet boundaries were defined as pressure outlets with atmospheric pressure. The ground was set to an adiabatic and no-slip boundary condition with the standard wall function adopted for near-wall treatment of turbulent flow. The flow pressure loss and heat transfer process in the radiator zone was treated as an infinite thin surface applied to the radiator model in ANSYS FLUENT. The radiator temperature was set at 313 K.
3.4. Solver and Mesh
The geometric model was divided into four parts, drawing each grid separately before assembling mesh to generate the hybrid grid, shown in Figure 7. The face between the outward space and wind deflector zone, the face between the wind deflector zone and radiator zone, and the face out of the tower were set as the interface. The density box was used at the cooling tower exit.
The pressure-based solver with a steady state and SIMPLE solution method was applied to incompressible air flow. The viscous model was set as the standard k-ε model to describe the turbulence condition. The second-order upwind scheme was adopted to discretize the governing equation, where the body force weighted was used. The residual of the absolute convergence criteria was set at 0.0001 each for the continuity, momentum, and energy equations. The convergence criteria were consistently obtained after about 3000 iterations from a standard initial solution.
3.5. Grid Independence and Model Validation
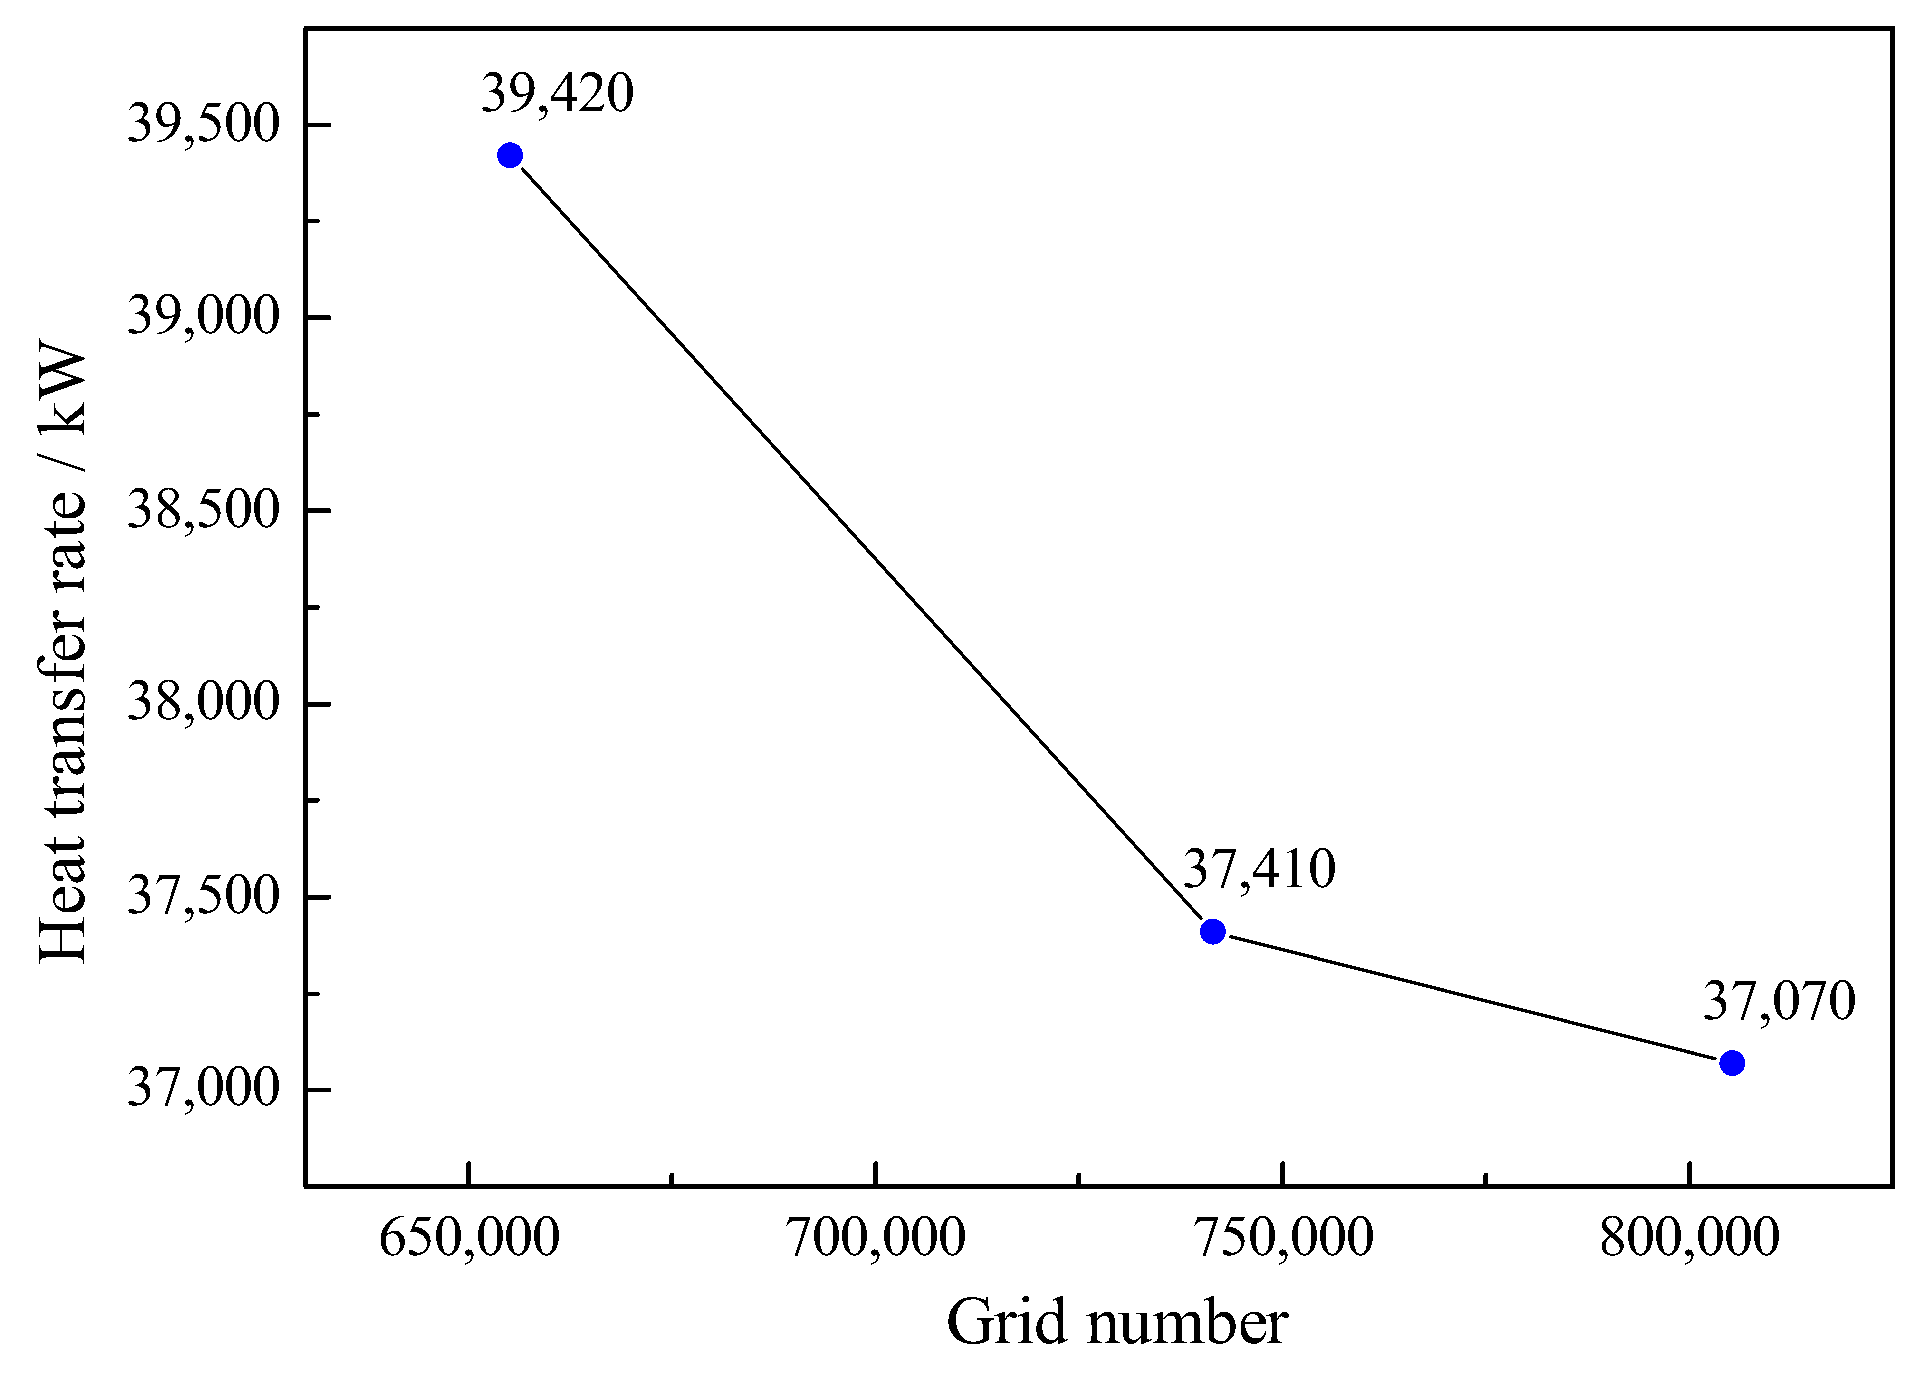
To verify the independence of the grid, three grid members with cells of 655,132, 741,451, and 805,315 were adopted separately. The air flow rate into the tower was calculated using three individual grids. Then, the heat transfer rate of the three cases was compared, displayed in Figure 9. The heat transfer rate of 655,132 cells is 5% greater than that of 741,451 cells. The result varies negligibly when the number of grid nodes exceeds 800,000: the results of 805,315 cells is 1% less than that of 741,451 cells, indicating that further refinement of the grids has little influence on the numerical results. Thus, the grid number of 741,451 was chosen for the following computations.
To validate the numerical model, thermal efficiency coefficients of the cooling tower from the numerical model are compared with those from the experiment, shown in Figure 10, which depicts the effect of crosswind on the thermal efficiency coefficients. The maximum deviation of the thermal efficiency coefficient between the numerical simulation and experiment is 13.02% when the dimensionless velocity is 0.5, and the mean difference between them is 4.9%. The results of the numerical simulation agree well with those of the experiment.
4. Results and Discussion
4.1. The Effect of Crosswind on Cooling Performance
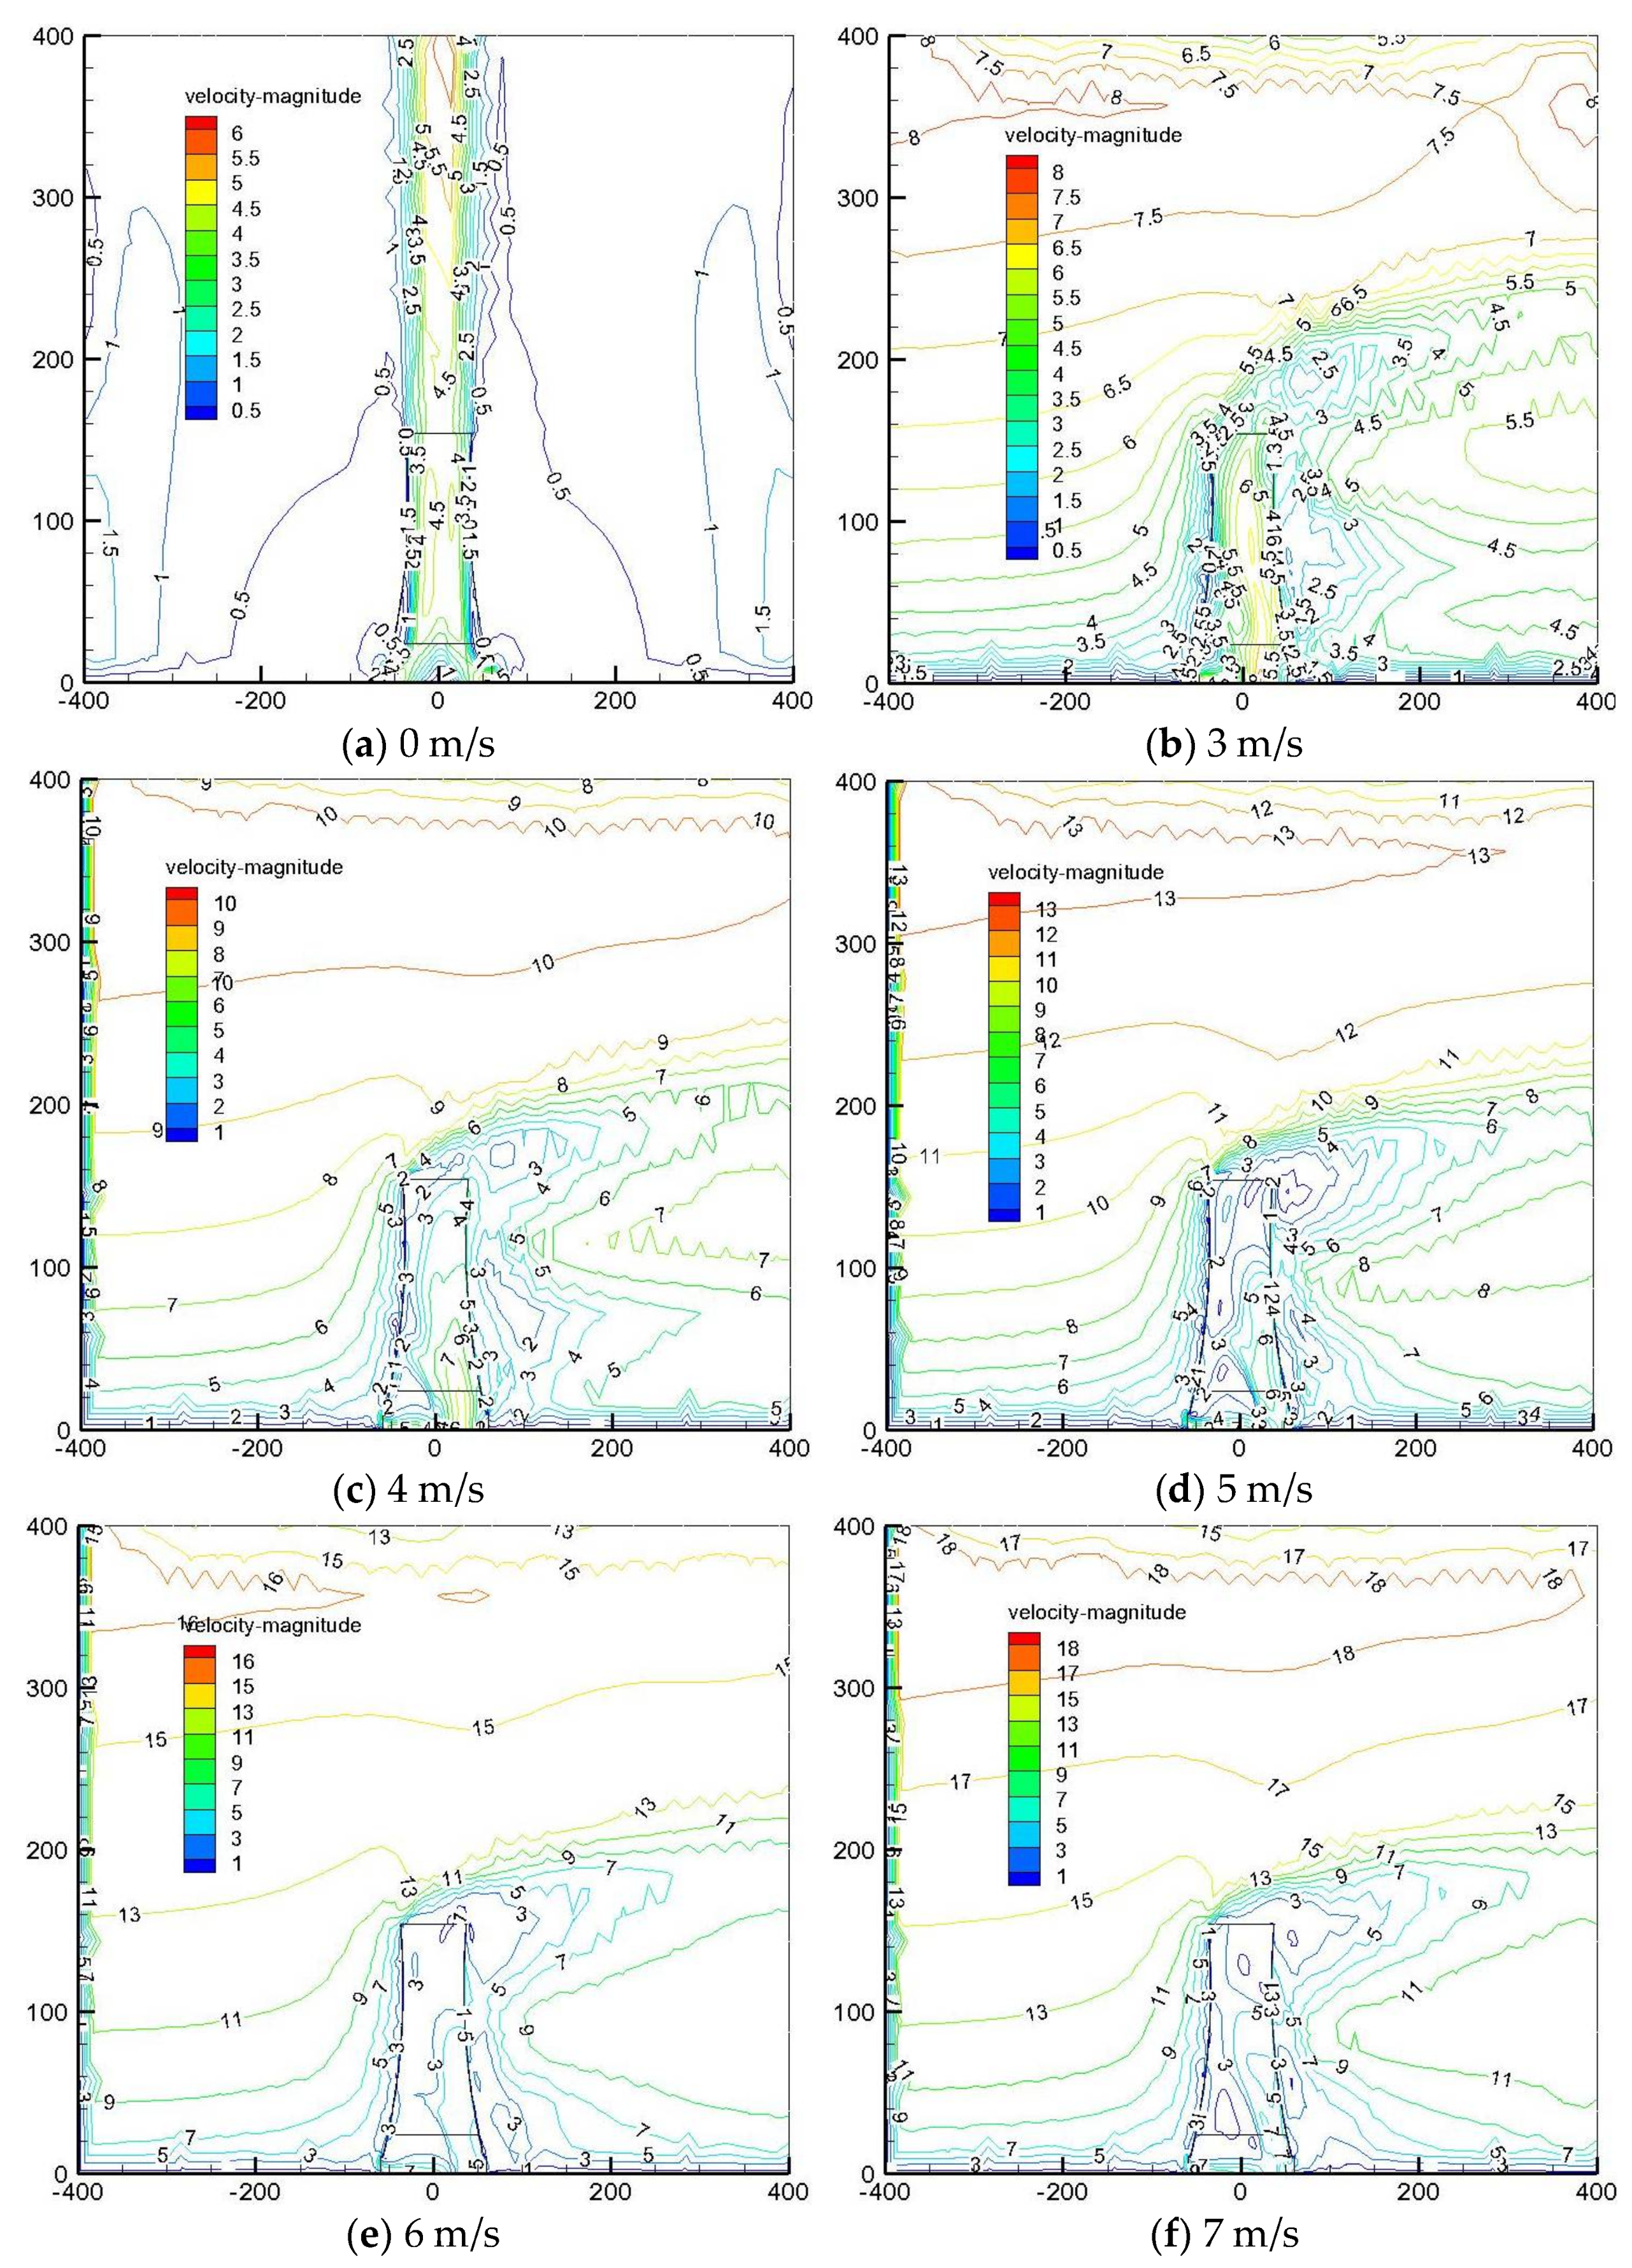
In the air-cooling tower, heat transfers from hot water to the radiators and finally to the air. The air density varies with changing temperature. Surrounding air enters the cooling tower evenly from all sides depending on the density difference. Figure 11 shows the air velocity contours with crosswind when the crosswind speed is 0 m/s, 3 m/s, 4 m/s, 5 m/s, 6 m/s, and 7 m/s. The speed field inside and outside the tower is clearly depicted; the whole space presents a symmetrical distribution, and the contour map is essentially symmetrical from left to right in the absence of crosswind.
The air velocity near the tower wall is smallest due to the viscous force effect of the wall. When the crosswind speed gradually becomes larger, the wind velocity in the tower becomes greater at low wind speeds. The air velocity flowing out of the tower is relatively close to that of ambient wind flow passing through the outlet of the cooling tower, suggesting that the air flow rate is not substantially affected by crosswind under a low wind speed. Meanwhile, the heat transfer of the radiators in the bottom of the cooling tower is enhanced because the air velocity of the tower inlet wind speed becomes larger. As the crosswind speed continues to increase, the air flow in the cooling tower is more complex, and the flow rate is slower. In this case, the air flow rate at the outlet of the cooling tower decreases, implying that the air flow rate entering the tower is smaller. Thus, heat transfer from the bottom radiator is weakened in the cooling tower.
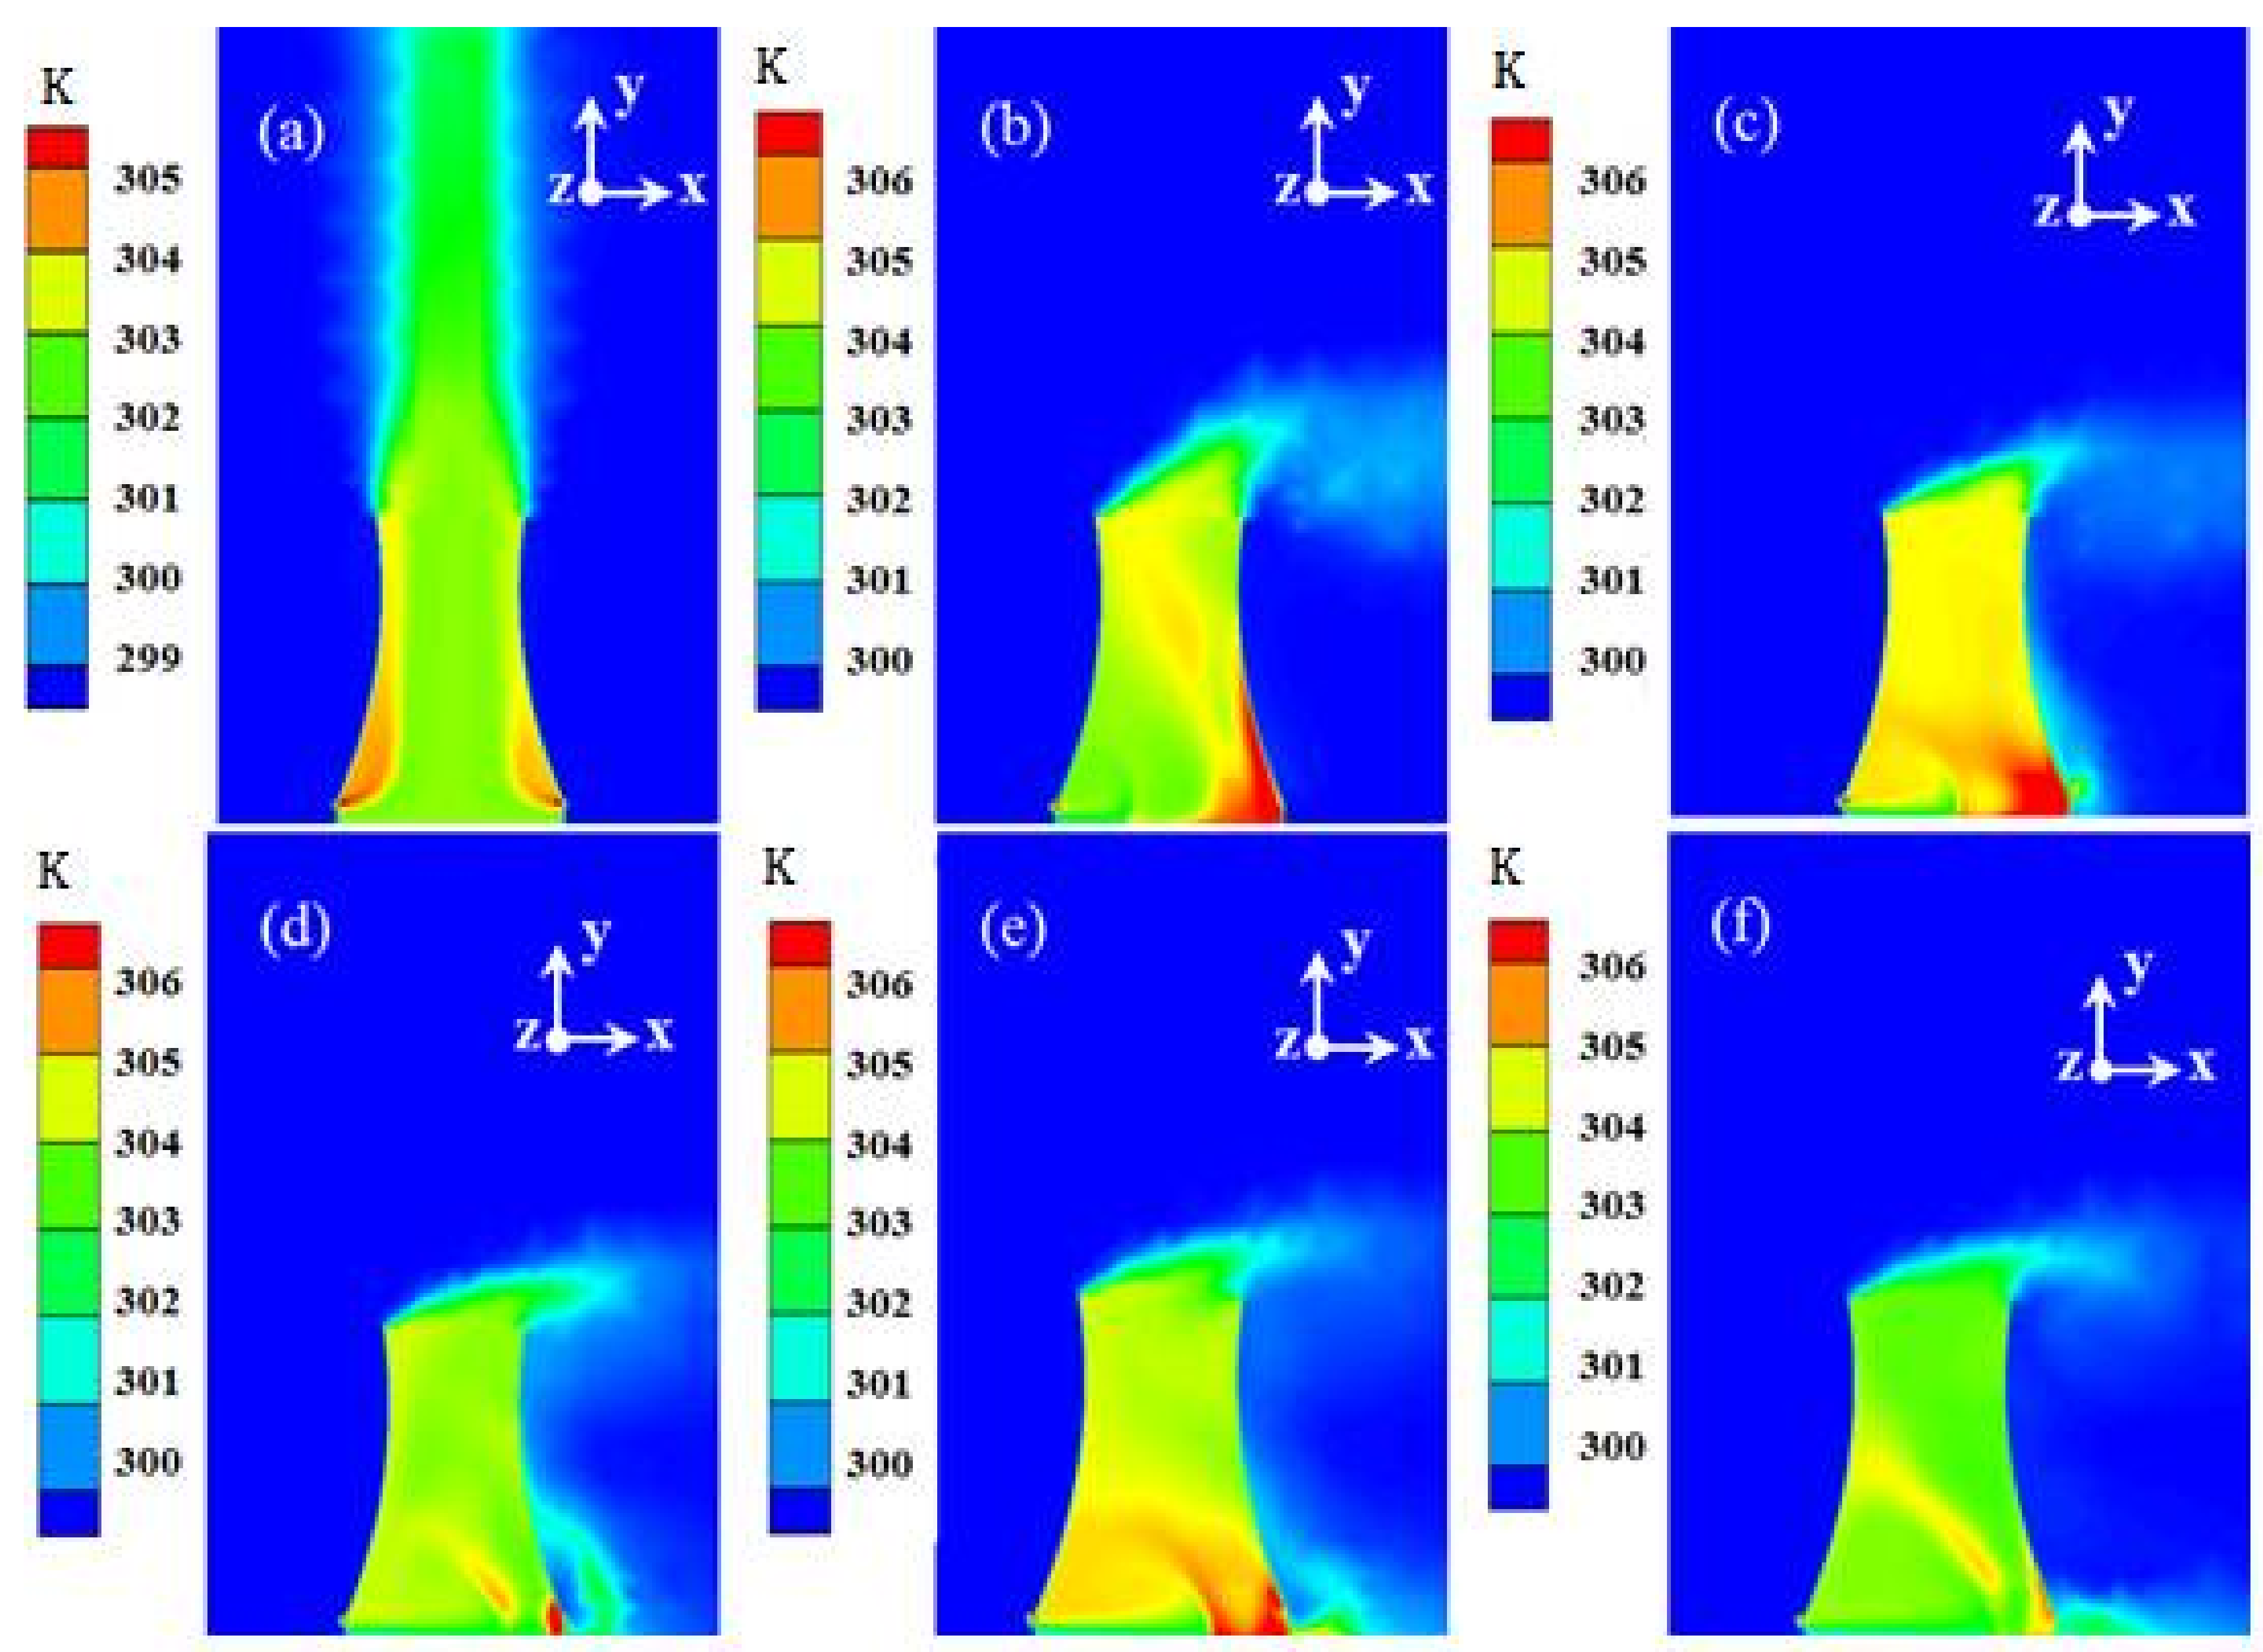
Figure 11 shows that the air flow rate into the tower becomes nonuniform with the increment of wind speed and declines on both sides. The air is forced to change direction around a cylinder for radiator resistance at the upwind. Therefore, a lower temperature exists upwind for stronger convective heat transfer compared to downwind. The heat transfer efficiency of the radiators declines accordingly. These results agree with those reported earlier by Al-Waked [35]. The temperature contours at the center of the xy plane at various crosswind speeds are shown in Figure 12.
However, as the crosswind speed increases, the heat transfer rate and air flow rate into the tower increase slightly once the wind speed exceeds 6 m/s. The air flow rate and heat transfer rate obtained by numerical simulation vary with crosswind velocity as shown in Figure 13. Moreover, the thermal efficiency coefficients of the cooling tower from the numerical and experimental results are shown in Figure 10 and are used to validate the numerical model. Figure 14 shows the variation of the temperature drop with the increment of wind velocity as obtained through the experiment.
The cross-ventilation at the bottom of the tower reaches a minimum at the velocity of 6 m/s. The worst heat transfer performance occurs at the velocity of 5 m/s through comparing the numerical results with the experimental data; the heat transfer rate is reduced by 32.4% and the air flow rate is reduced by 62.5% according to Figure 13 and Figure 14, versus results without crosswind. Figure 14 shows that the corresponding temperature drop is the minimum, and the crosswind at 5 m/s exerts a substantial impact on the overall performance of the tower.
4.2. Effect of Crosswind on Performance with Wind Deflectors
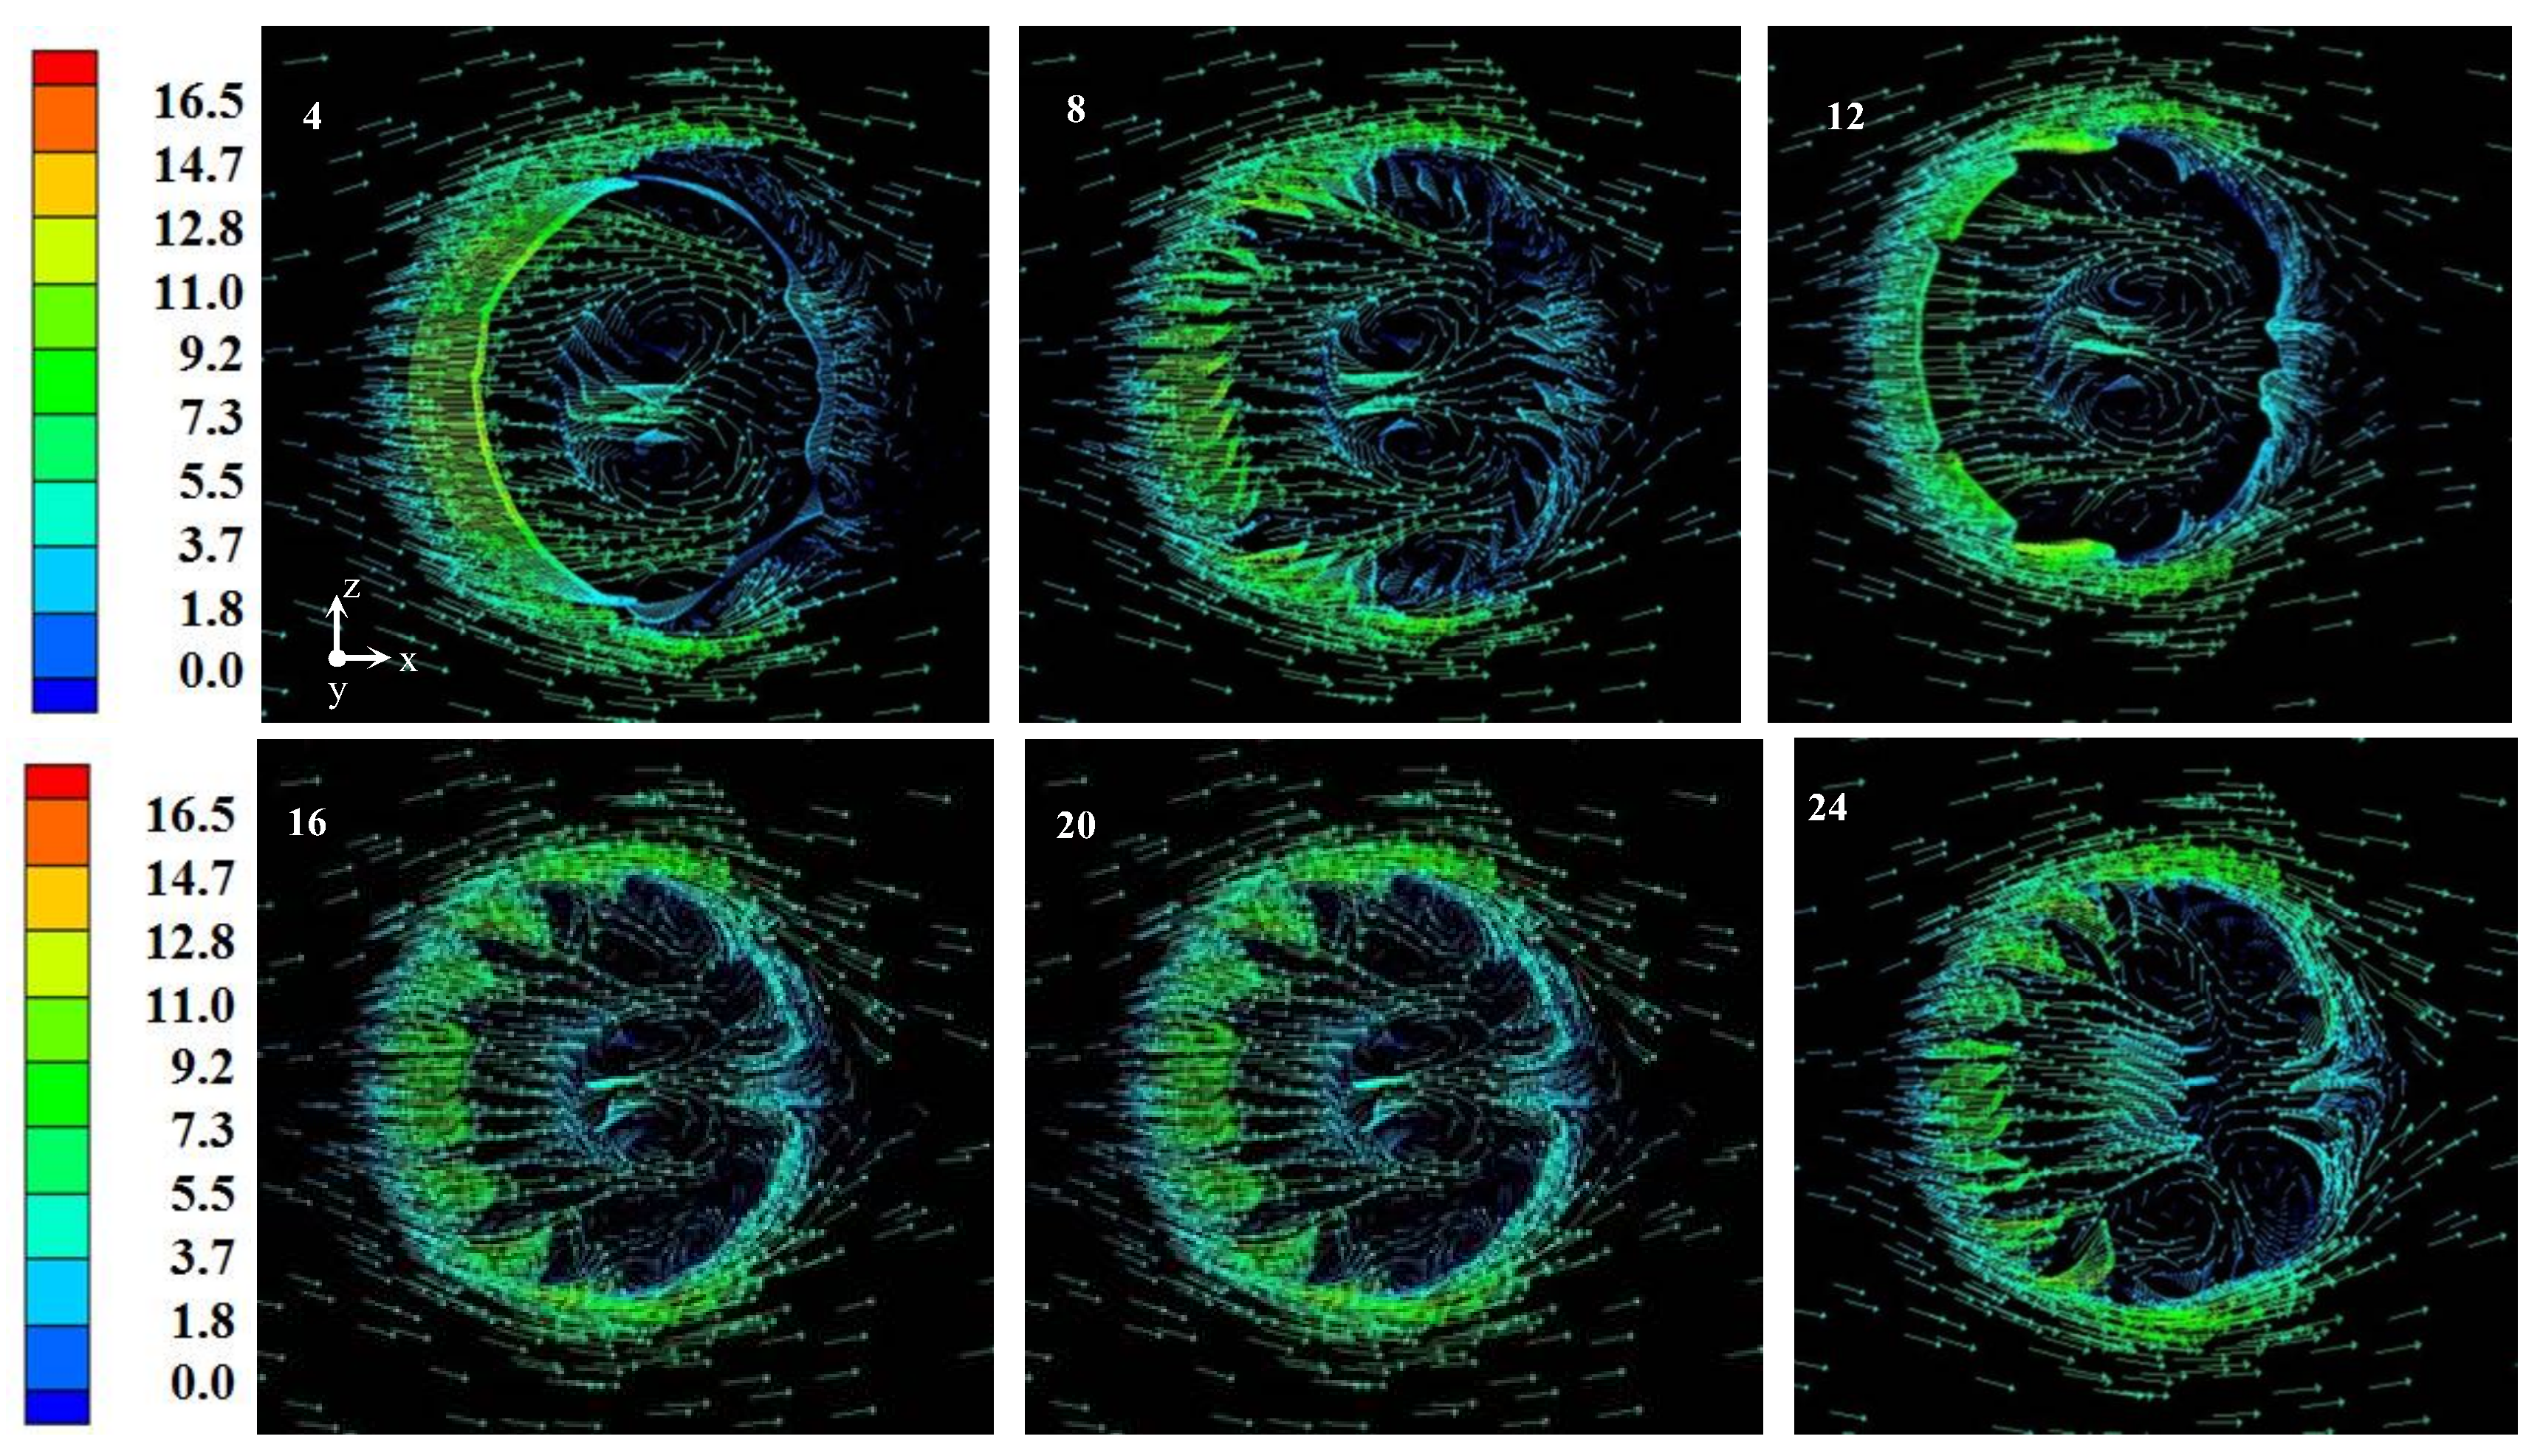
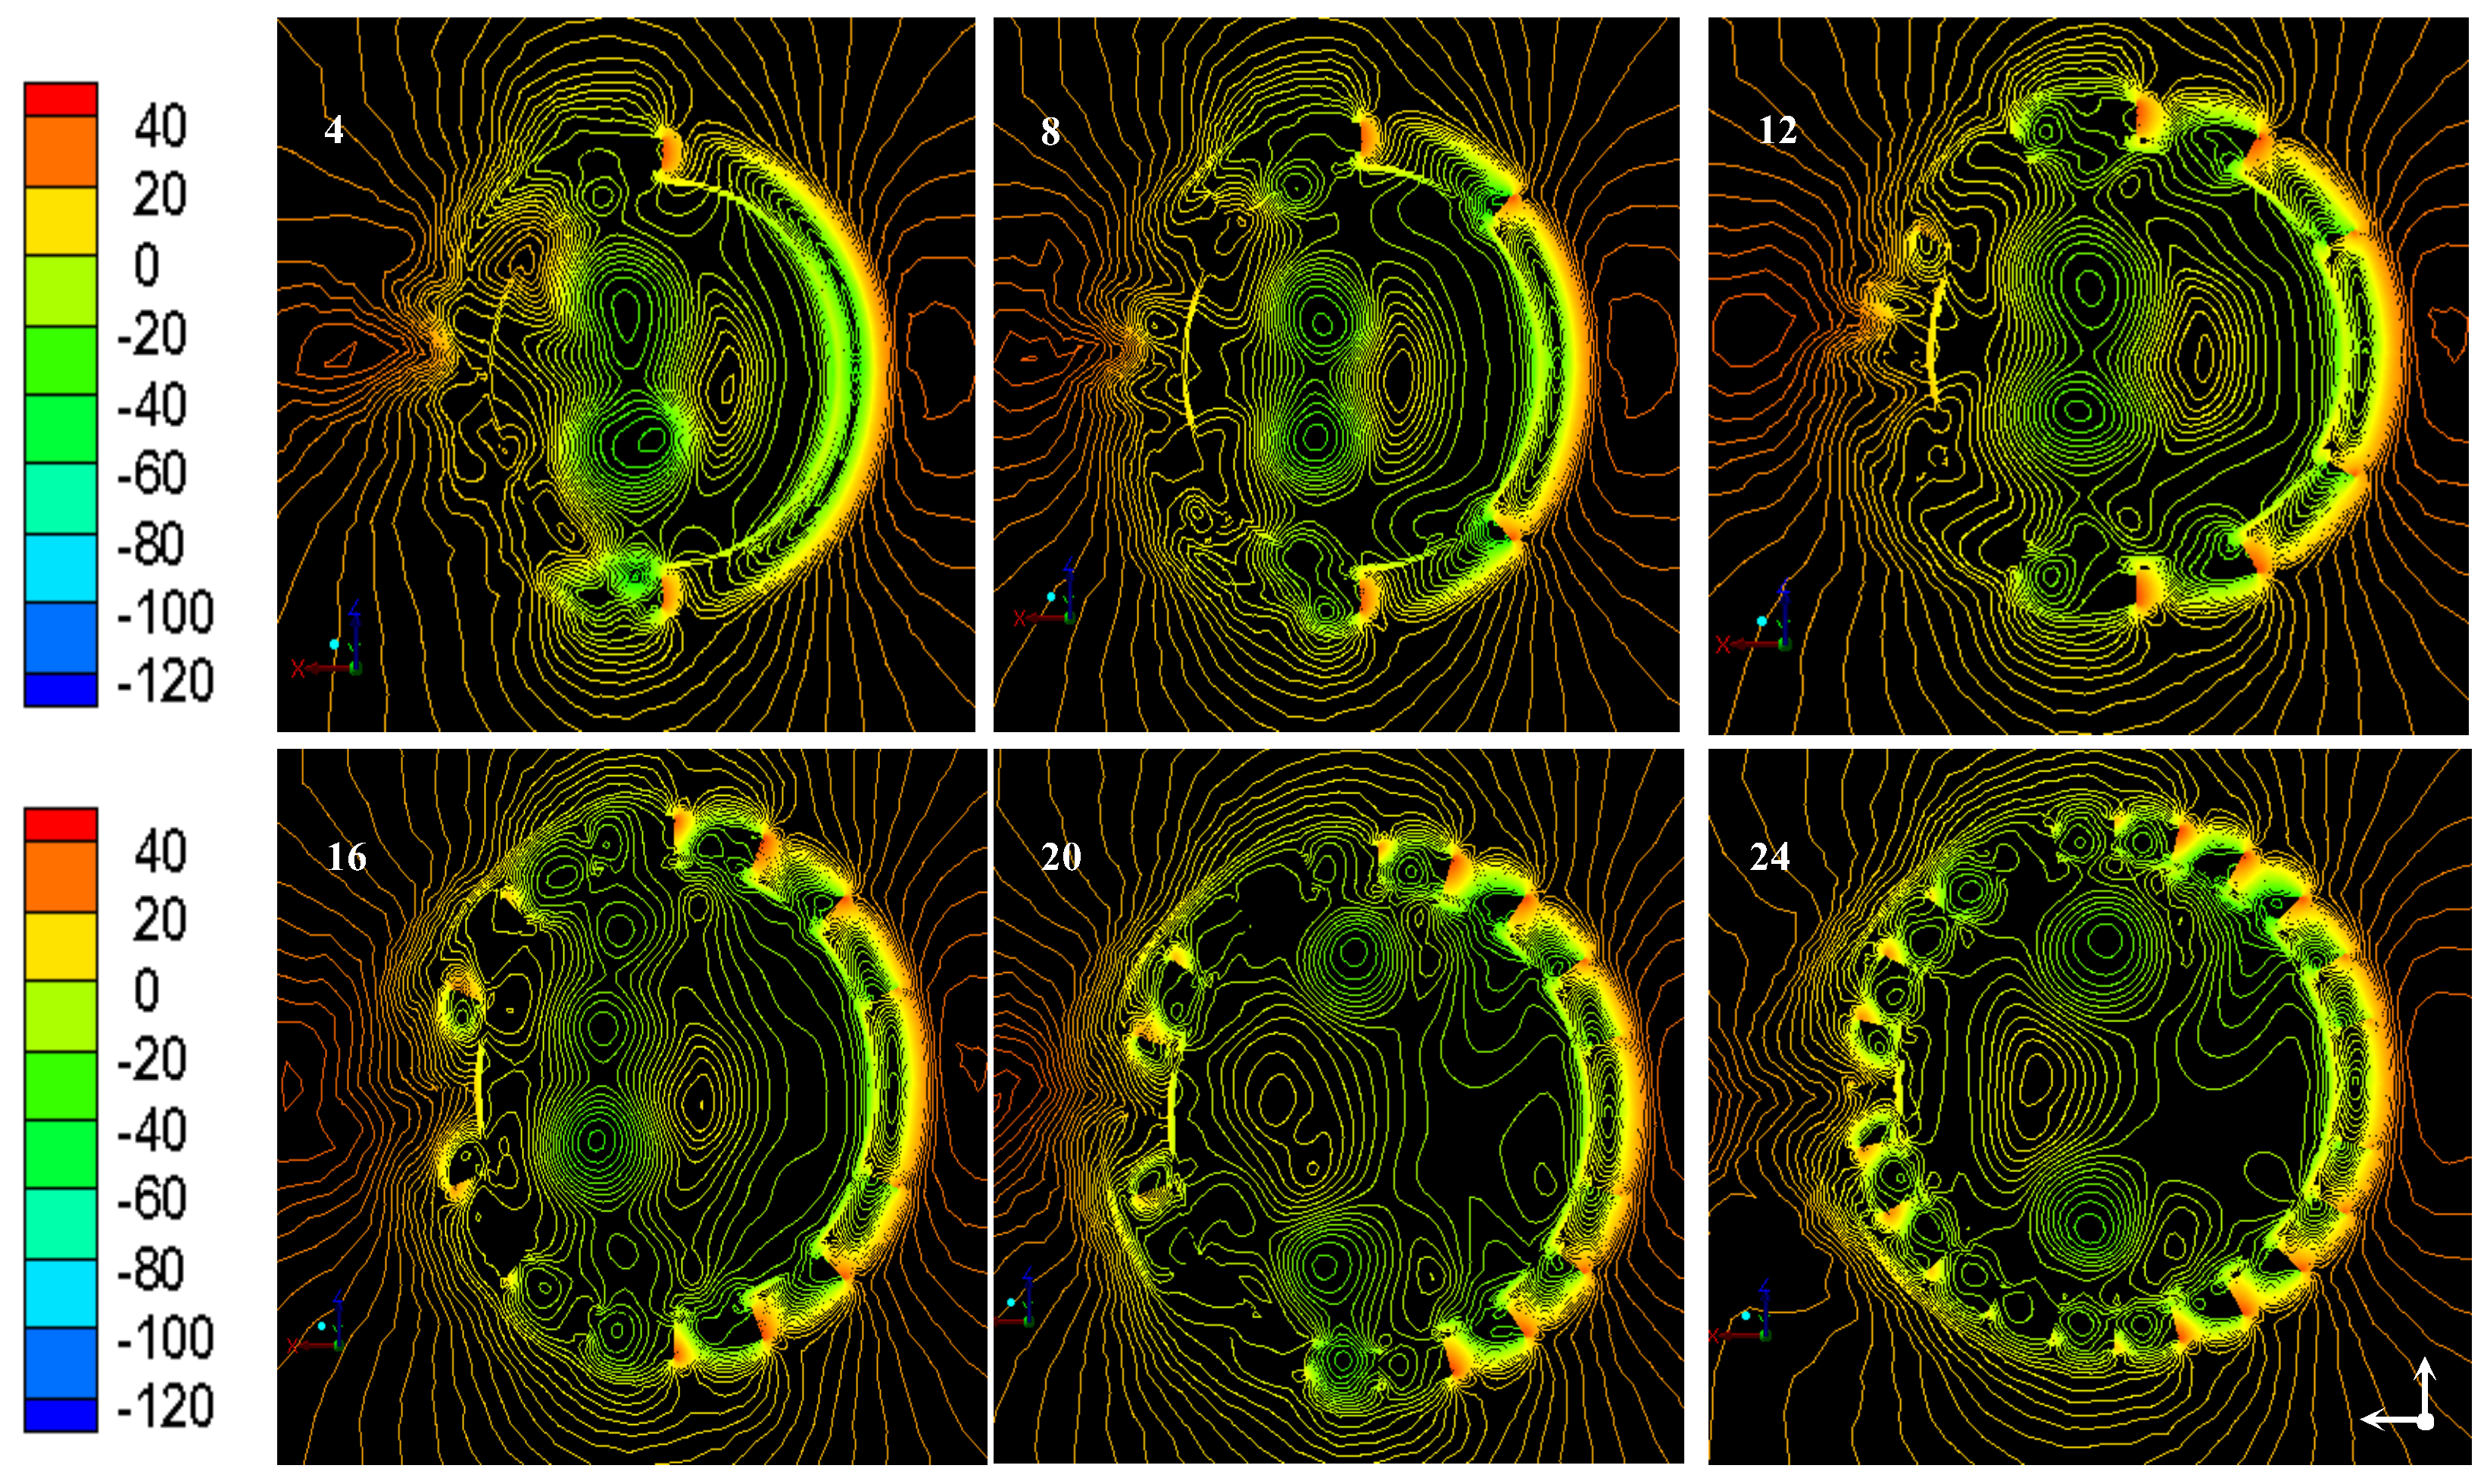
From the above result, the crosswind with 5 m/s velocity has a significant effect on the air flow rate and heat transfer rate. To improve heat transfer performance, a numerical simulation was carried out with crosswind at 5 m/s. The results were observed and analyzed with various numbers of wind deflectors: 4, 8, 12, 16, 20, and 24, respectively. The velocity vectors of air at the tower inlet with varying wind deflectors under a crosswind speed of 5 m/s are shown in Figure 15. Figure 16 illustrates the contours of static pressure of air at the tower inlet with various wind deflectors under a crosswind speed of 5 m/s.
Figure 15 and Figure 16 show that different numbers of wind deflectors exert different effects on the air flow field. As the number of wind deflectors increases, the wind static pressure in the center of the tower begins to climb, presumably because the wind at the bottom of the cooling tower starts to gather toward the center, and the wind speed on the leeward side gradually increases. The inlet air velocity of the leeward side with 24 wind deflectors is significantly higher than that with other numbers of wind deflectors.
Figure 17 shows the variations in air flow rate and heat transfer rate with different numbers of wind deflectors obtained by the numerical simulation. Ventilation and heat transfer are respectively maximized with eight and four wind deflectors.
The comparison of temperature contours at the tower inlet with four and eight wind deflectors is shown in Figure 18. The local high temperature and ventilation with eight wind deflectors is weaker and more homogeneous than with four wind deflectors because the former allows heat transfer from the radiators to be removed quickly from the cooling tower to avoid heat accumulation at the bottom of the tower. Moreover, the radiator is protected. The numerical results show that the air flow rate and heat transfer rate of the tower can be increased maximally by 61.7% and 15.1%, respectively, when eight wind deflectors are arranged at the bottom of the cooling tower.
4.3. Effect of Crosswind on Performance with Rotating Wind Deflectors
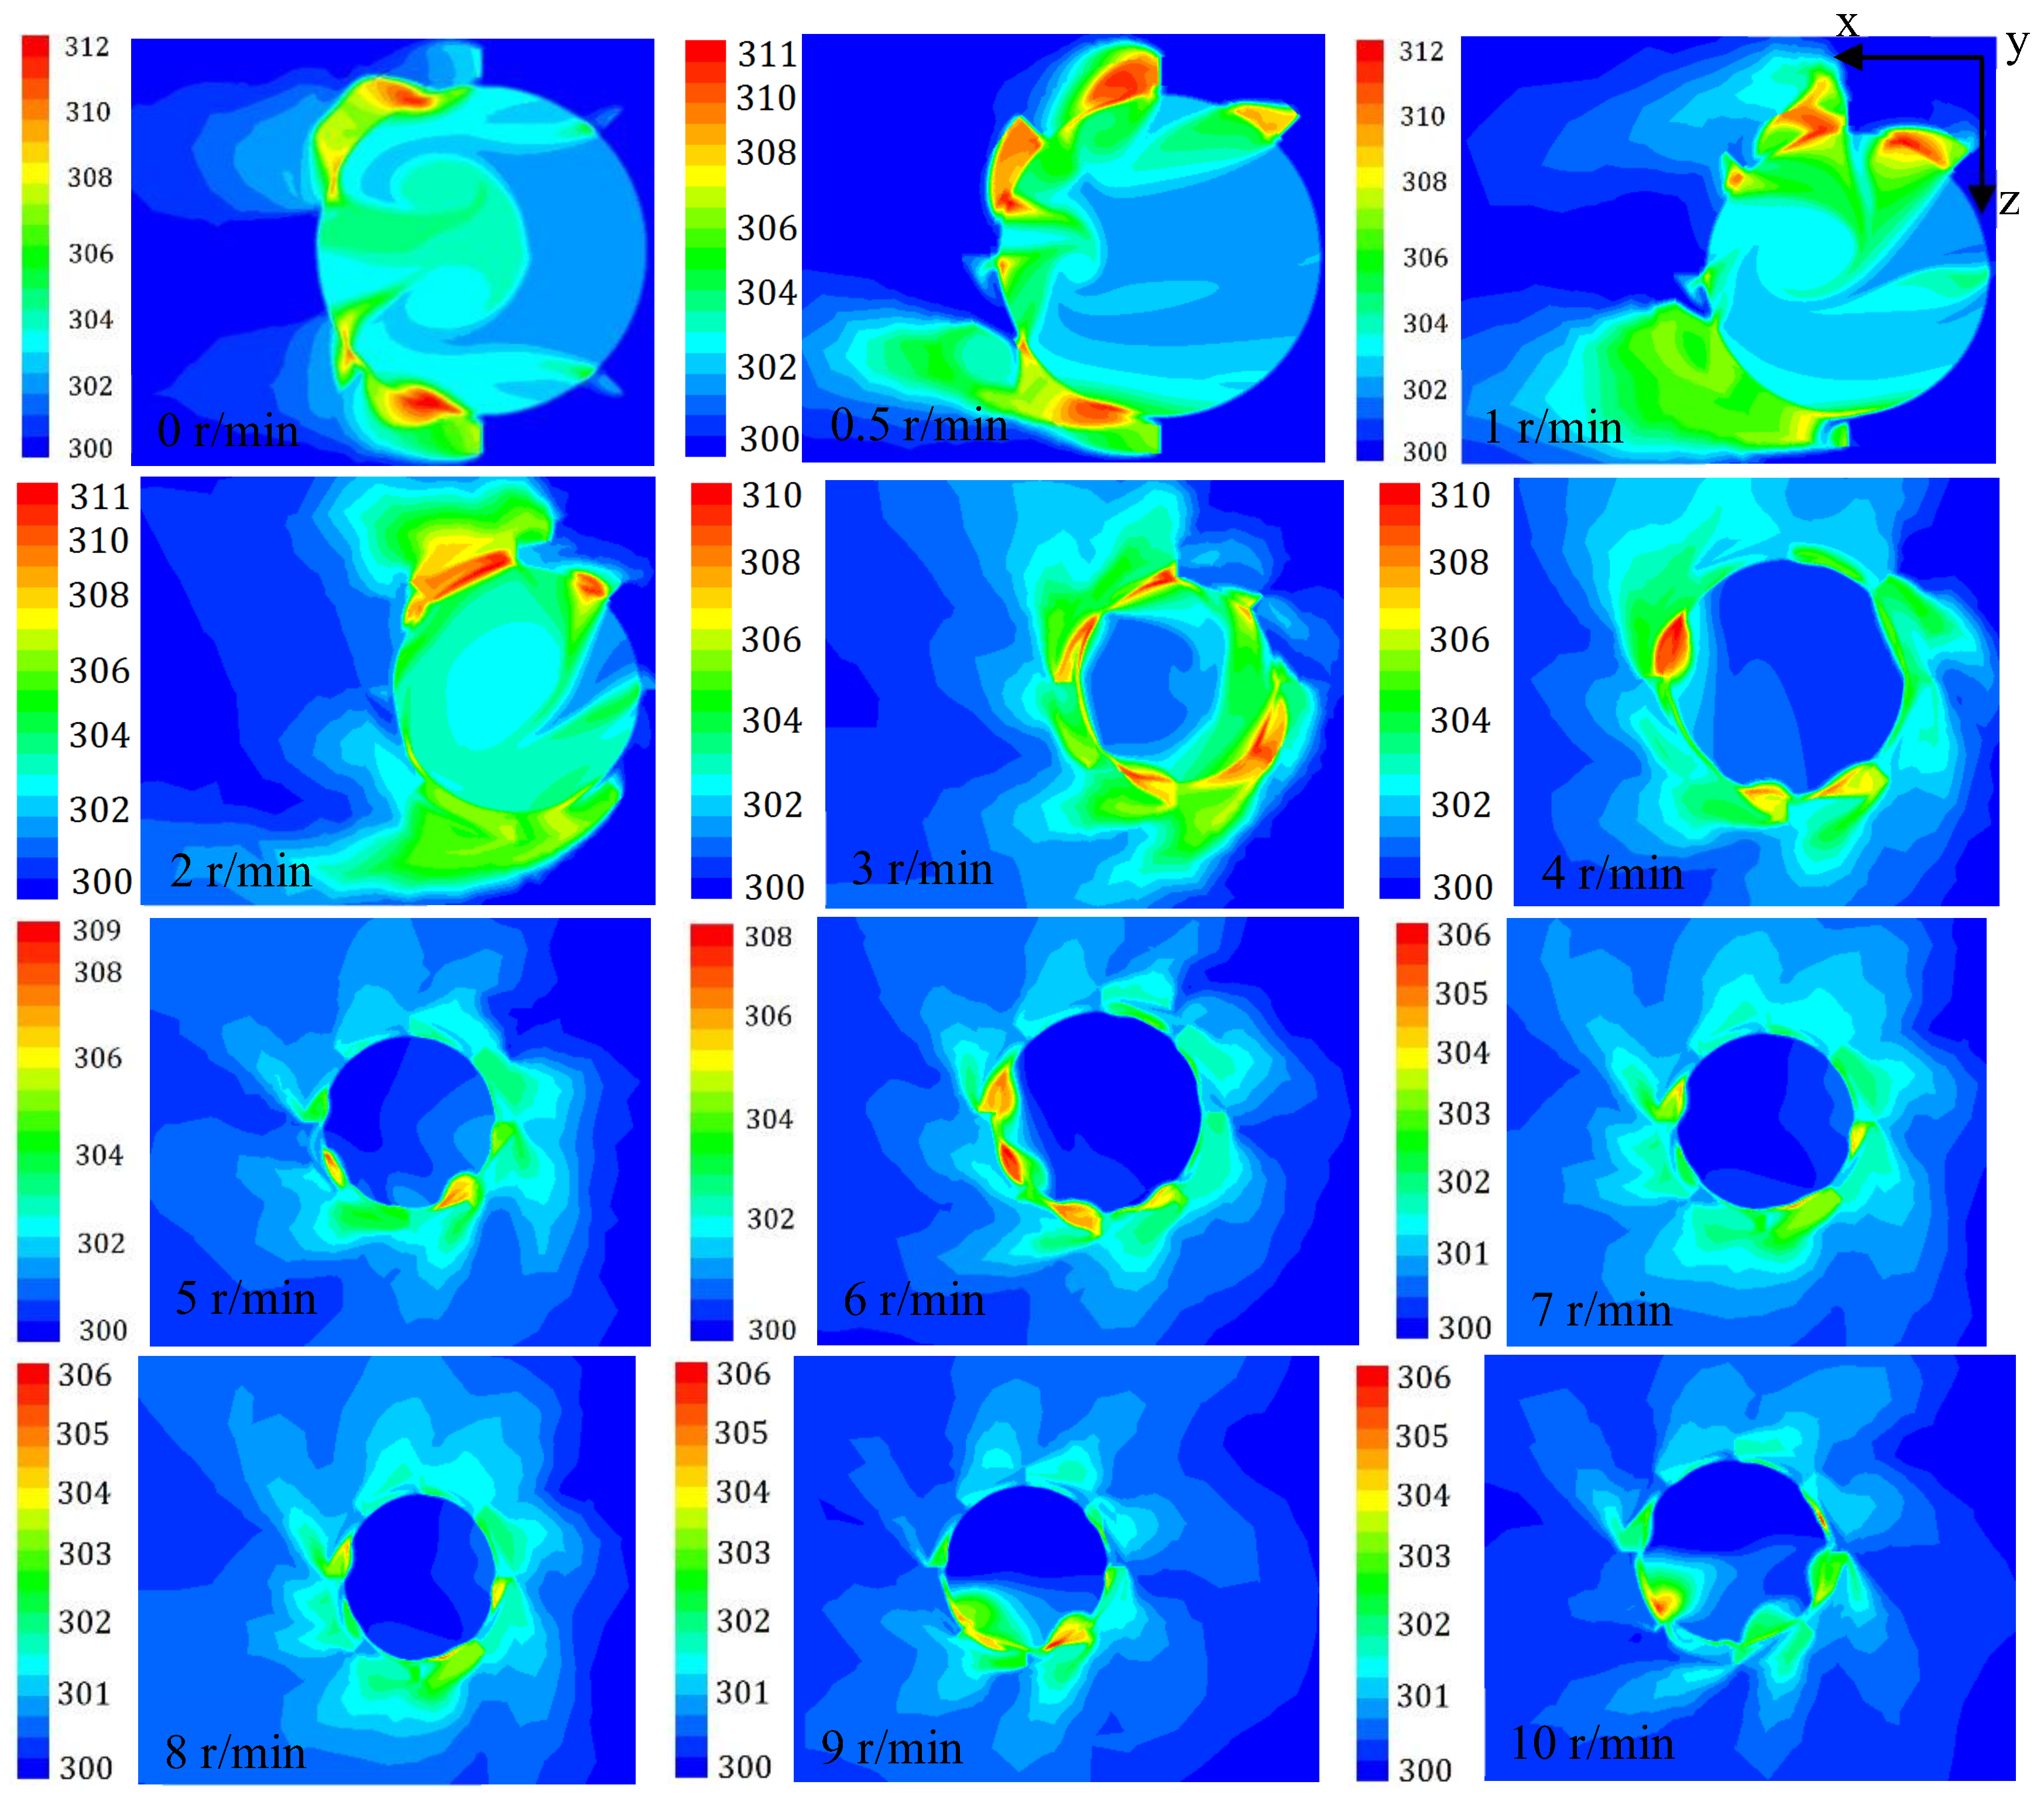
To reduce the influence of crosswind on the cooling tower, wind deflectors were installed on a motor-driven rotary support. The rotating velocity was controlled by a transmission. The air flow rate and heat transfer rate of the tower were obtained from the numerical results when the crosswind velocity was 5 m/s with eight wind deflectors. The temperature contours at the tower inlet with various rotating velocity for the wind deflectors are shown in Figure 19 at a crosswind speed of 5 m/s.
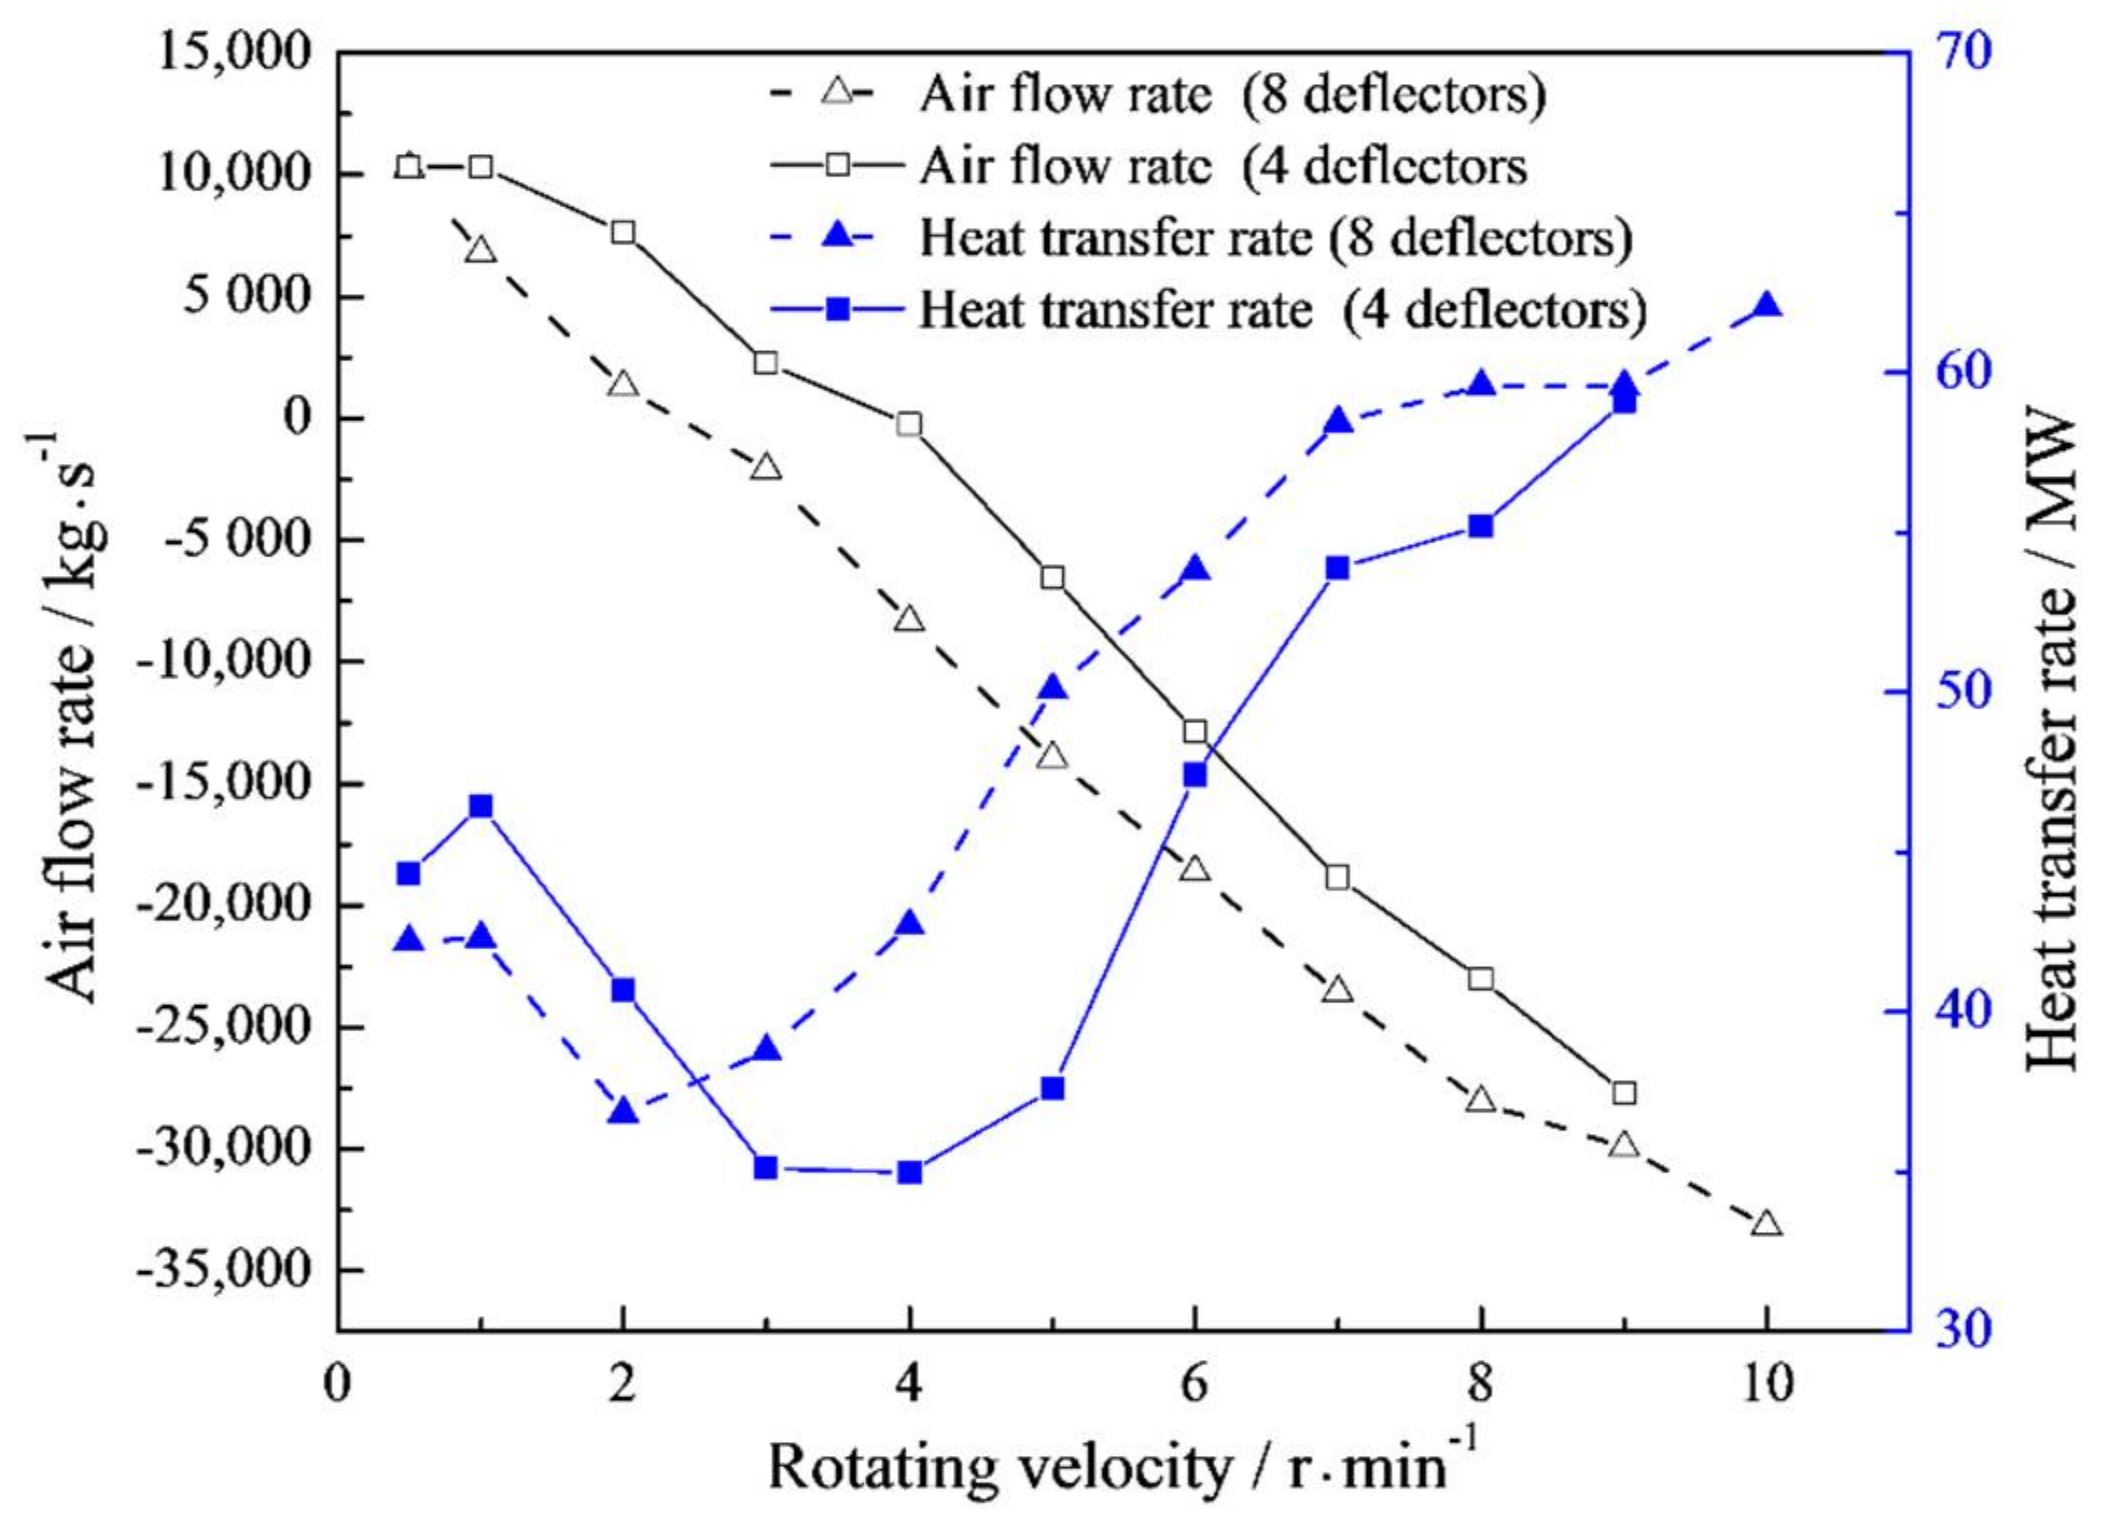
Variations in the air flow rate and heat transfer rate of the cooling tower with different rotating velocities with four and eight wind deflectors at a wind speed of 5 m/s are shown in Figure 20. The air flow rate decreases continuously, while the heat transfer rate decreases to the minimum at a rotating velocity of 2 r/min with eight wind deflectors and 4 r/min with four wind deflectors. The entrance of outside air into the tower is prevented by the wind deflectors with a lower rotation speed, which seriously affects the radiator heat transfer. The heat transfer rate of the cooling tower with eight wind deflectors begins to increase as the rotating velocity of the wind deflectors exceeds 2 r/min, while that with four deflectors begins to increase when the rotating velocity is over 4 r/min.
Furthermore, the air is disturbed by the rotating deflectors at the bottom of the tower. In the present study, the air flow rate is positive when air flows from the bottom to the top of the tower and negative when air flows from the top to the bottom in the tower. Figure 20 shows that when the air is disturbed by the rotating deflectors, the air flow rate becomes negative when the rotating velocity is higher than 2 r/min with eight deflectors or higher than 4 r/min with four deflectors, indicating that the air flow direction moves from top to bottom. The heat transfer rate increases with an increasing absolute value of the air flow rate.
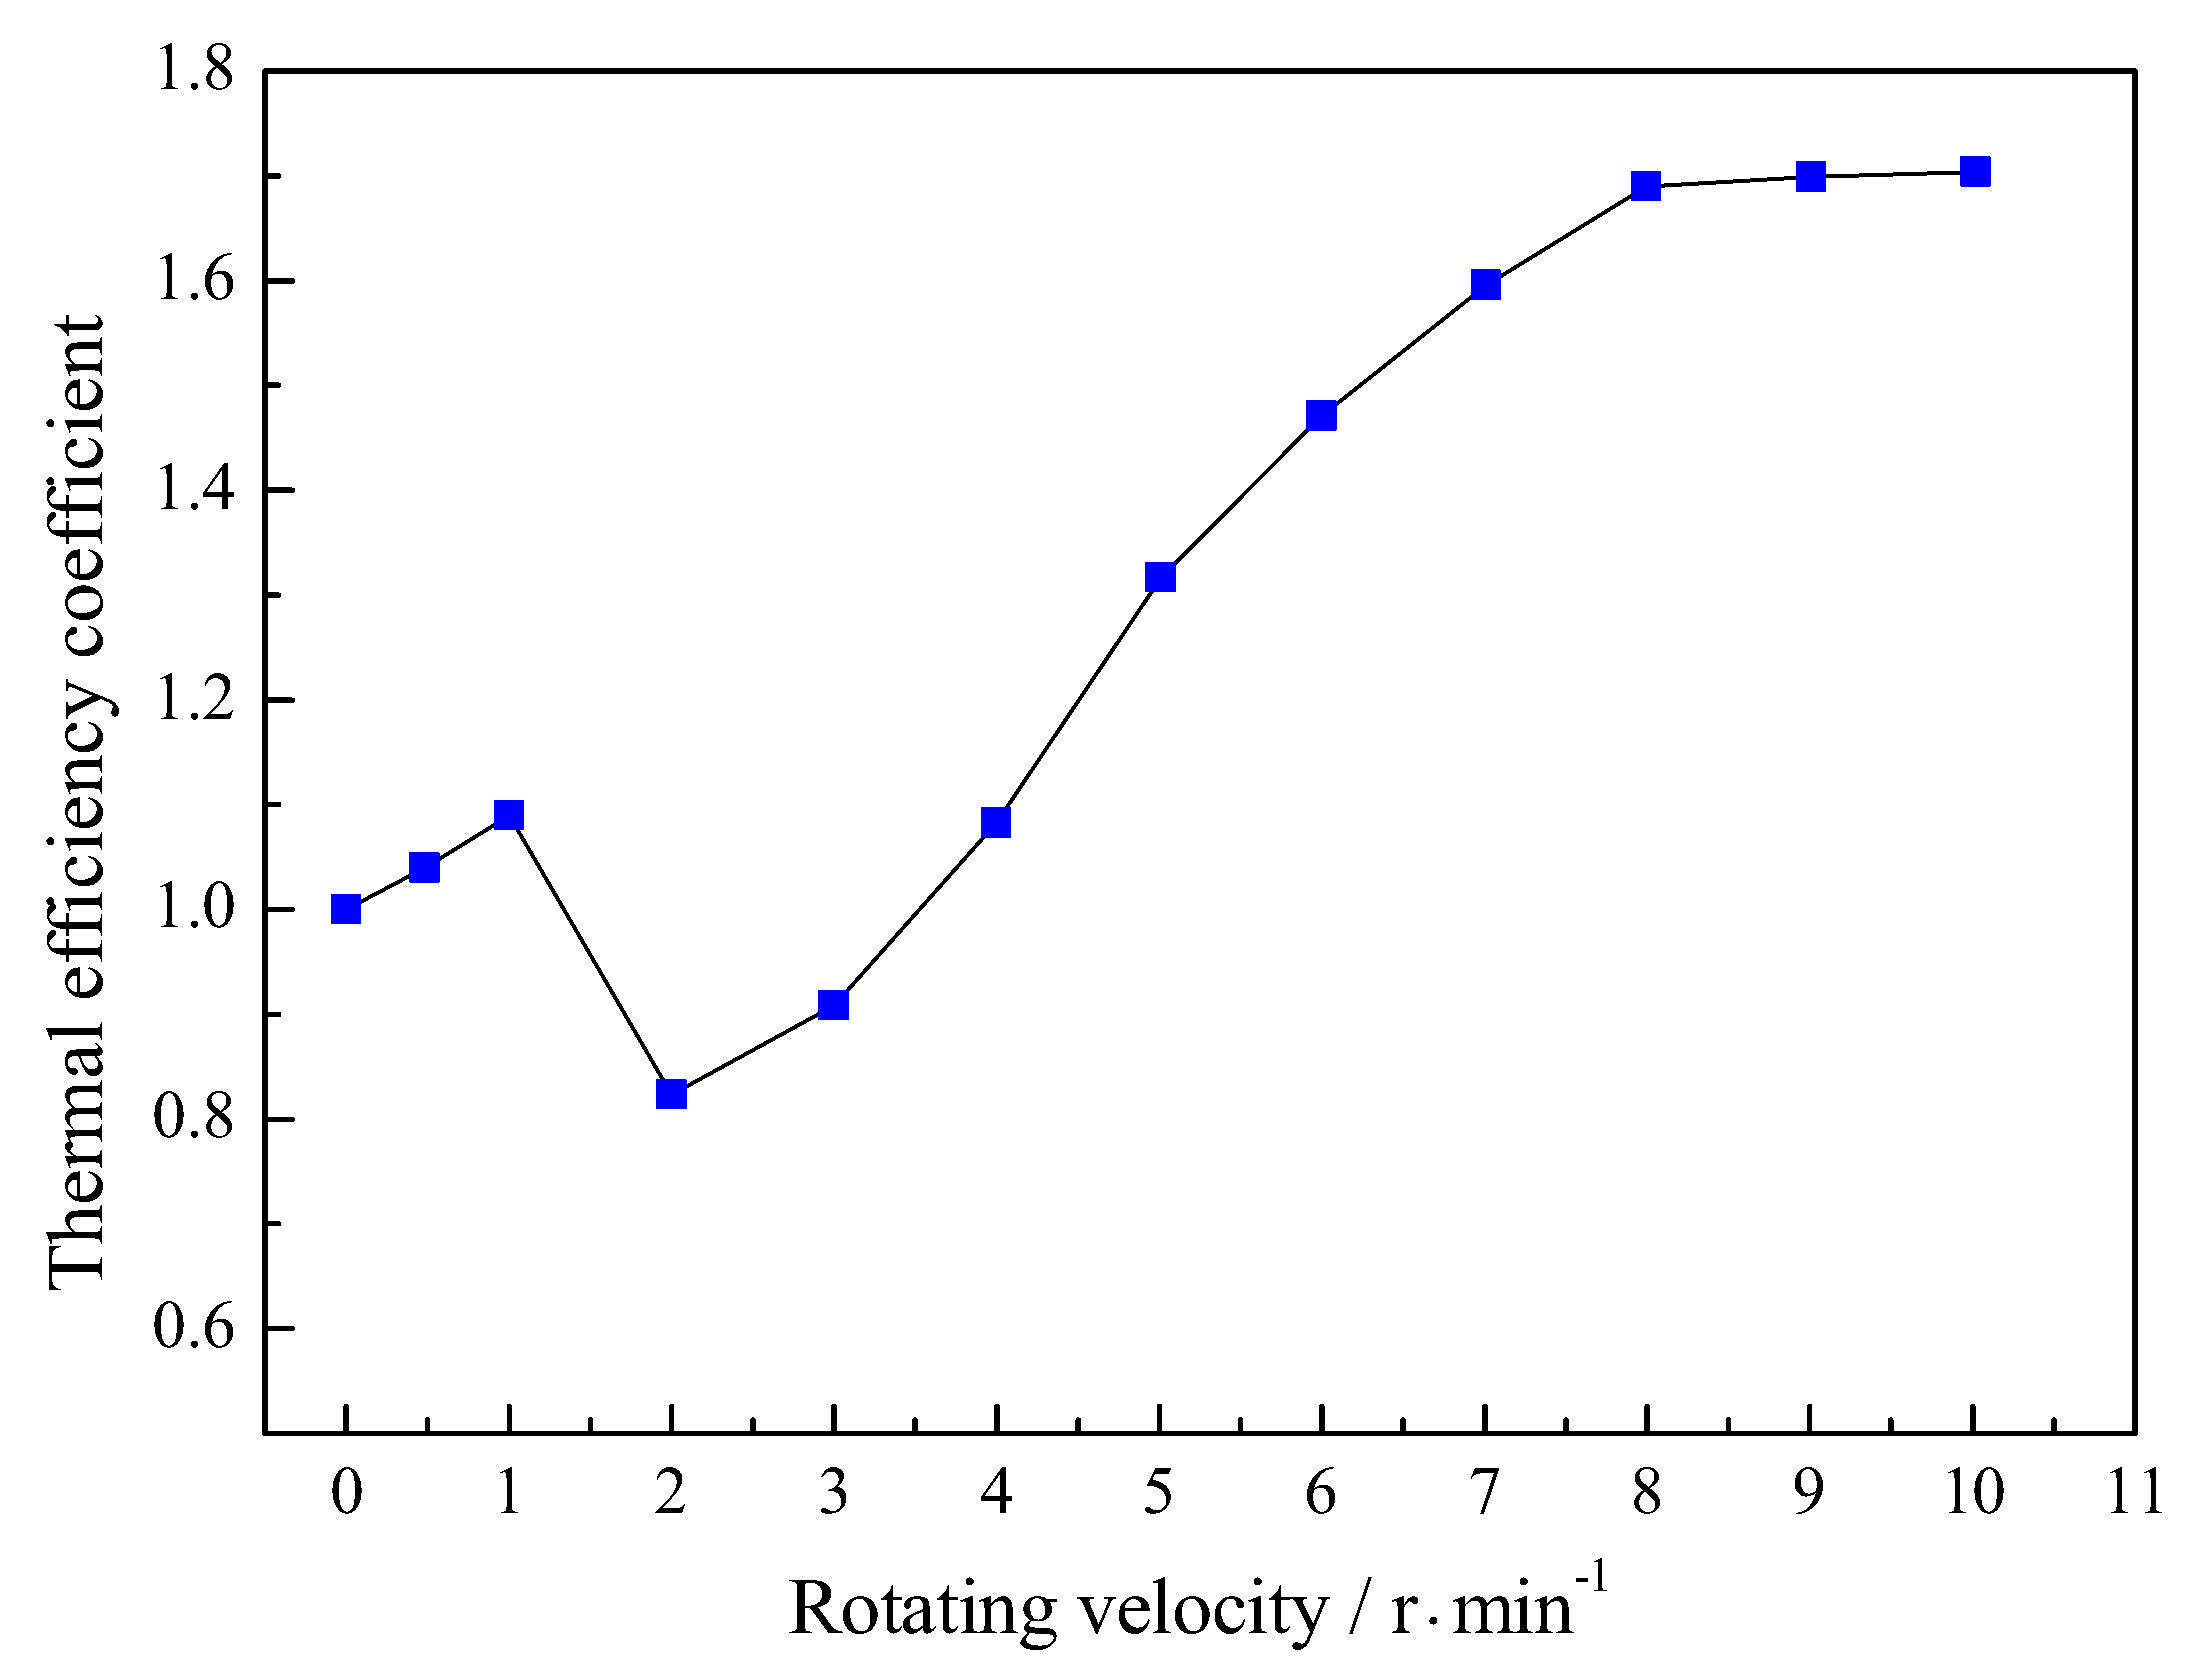
The numerical simulation results of the thermal efficiency coefficients of the cooling tower with rotating wind deflectors are shown in Figure 21. The thermal efficiency coefficients grow with the increment of the rotating velocity when it exceeds 2 r/min.
With eight wind deflectors, the effect of heat transfer from the radiators improves as the rotating speed increases to over 2 r/min. Thereafter, the wind direction in the tower reverses as the rotating speed increases. As the rotating speed accelerates, the suction effect becomes stronger, similar to a wind machine. Then, heated air is removed from the tower. Thus, the thermal-hydraulic and cooling performance of the air-cooling tower is enhanced by rotating wind deflectors.
However, the economic benefit of rotating wind deflectors is mainly determined by heat transfer enhancement and power consumption from the driving motor. For example, the motor power is approximately 3 kW when driving a gear of 400 kg rotating at a speed of 5 r/min, and the heat transfer rate can be increased by 33.9% according to Figure 20 whereas motor power loss is negligible.
5. Conclusions
Under windless conditions, the wind entering the tower is uniform. However, as the crosswind speed increases, the air flow rate and heat transfer rate of the air-cooling tower decreases and then increases. Therefore, the idea of rotating wind deflectors is proposed and found to be efficacious for saving energy on radiator heat transfer in the air-cooling tower according to the numerical simulation and experimental results. The following conclusions are drawn.
(1) Crosswind has great influence on air-cooling tower performance. The worst point occurs at a crosswind speed of 5 m/s, at which point the heat transfer rate and air flow rate decline by 32.4% and 62.5%, respectively.
(2) Compared with conditions without wind deflectors at a crosswind speed of 5 m/s, the air flow rate and heat transfer rate of the tower increase maximally by 61.7% and 15.1%, respectively, when eight wind deflectors are arranged at the bottom of the cooling tower.
(3) The thermal-hydraulic and cooling performance of the air-cooling tower are enhanced by rotating wind deflectors. An air-cooling system with rotating wind deflectors is complex; hence, the relevant mechanisms and applications warrant further study with attention paid to thermal-hydraulic, energy-saving, pump consumption, space-saving, and economic performance.
Acknowledgments
This work is supported by the Fundamental Research Funds for the Central Universities (No. 2015XKMS059).
Author Contributions
Xueping Du designed the experiment system, conducted the model experiment, and wrote the manuscript. Dongtai Han proposed the numerical simulation model, analyzed the results, and checked and revised the whole manuscript. Qiangmin Zhu finished the numerical simulation and collected the experimental data together.
Conflicts of Interest
The authors declare no conflict of interest.
Nomenclature
| A | Heat transfer area, [m2] |
| cp | Specific heat at constant pressure, [J∙kg−1∙K−1] |
| Fr | Froude number |
| k | Overall heat transfer coefficient, [W∙m−2∙K−1] |
| Pr | Prandlt number of the fluid |
| qw | Volume flow rate of the cooling water, [m3∙s−1] |
| Q | Heat dissipating capacity, [W] |
| T | Temperature, [K] |
| v | Wind velocity, [m∙s−1] |
| V | Dimensionless velocity |
| Greek symbols | |
| Thermal efficiency coefficient | |
| Temperature difference, [K] | |
| λ | Coefficient of heat conductivity, [W∙m−1∙K−1] |
| ρ | Density, [kg∙m−3] |
| Subscripts | |
| 0 | No crosswind |
| a | Air |
| i | Inlet |
| max | Maximum value |
| min | Minimum value |
| o | Outlet |
| v | Crosswind with a certain velocity |
| w | Water |
References
- Klein, S.; Beckman, W.; Mitchell, J.; Duffie, J.; Duffie, N.; Freeman, T.; Mitchell, J.; Braun, J.; Evans, B.; Kummer, J. TRNSYS 16. A TRaNsient SYstem Simulation Program; Mathematical Reference; Energy Laboratory, University of Wisconsin-Madison: Madison, WI, USA, 2004; Volume 5. [Google Scholar]
- Cutillas, C.G.; Ramírez, J.R.; Miralles, M.L. Optimum design and operation of an HVAC cooling tower for energy and water conservation. Energies 2017, 10, 299. [Google Scholar] [CrossRef]
- Wang, Q.W.; Zeng, M.; Ma, T.; Du, X.P.; Yang, J.F. Recent development and application of several high-efficiency surface heat exchangers for energy conversion and utilization. Appl. Energy 2014, 35, 748–777. [Google Scholar] [CrossRef]
- Du, X.P.; Yin, Y.T.; Zeng, M.; Yu, P.Q.; Wang, Q.W.; Dong, Z.Y.; Chen, Y.T. An experimental investigation on air-side performances of finned tube heat exchangers for indirect air-cooling tower. Therm. Sci. 2014, 18, 863–874. [Google Scholar] [CrossRef]
- Gao, M.; Guo, C.; Ma, C.; Shi, Y.; Sun, F. Thermal performance for wet cooling tower with different layout patterns of fillings under typical crosswind conditions. Energies 2017, 10, 65. [Google Scholar] [CrossRef]
- Su, M.D.; Tang, G.F.; Fu, S. Numerical simulation of fluid flow and thermal performance of a dry-cooling tower under cross wind condition. J. Wind Eng. Ind. Aerodyn. 1999, 79, 289–306. [Google Scholar] [CrossRef]
- Zhao, Y.; Sun, F.; Li, Y.; Long, G.; Yang, Z. Numerical study on the cooling performance of natural draft dry cooling tower with vertical delta radiators under constant heat load. Appl. Energy 2015, 149, 225–237. [Google Scholar] [CrossRef]
- Kapas, N. Behavior of natural draught cooling towers in wind. In Proceedings of the 4th International Conference on Fluid Flow Technologies, Budapest, Hungary, 3–6 September 2003. [Google Scholar]
- Chen, Y.; Sun, F.; Gao, M.; Zhao, Y.; Shi, Y. Experimental study of cross walls effect on the performance of wet cooling towers. Proc. CSEE 2012, 32, 28–34. [Google Scholar]
- Preez, A.F.D.; Kröger, D.G. Effect of wind on performance of a dry-cooling tower. Heat Recovery Syst. CHP 1993, 13, 139–146. [Google Scholar] [CrossRef]
- Zhai, Z.; Fu, S. Improving cooling efficiency of dry-cooling towers under cross-wind conditions by using wind-break methods. Appl. Therm. Eng. 2006, 26, 1008–1017. [Google Scholar] [CrossRef]
- Wang, K. Research on Flow Resistance of Inlet Air Performance Optimization of Natural Draft Counter Flow Wet Cooling Tower with Air Deflectors; Shandong University: Jinan, China, 2009. [Google Scholar]
- Goodarzi, M. A proposed stack configuration for dry cooling tower to improve cooling efficiency under crosswind. J. Wind Eng. Ind. Aerodyn. 2010, 98, 858–863. [Google Scholar] [CrossRef]
- Lu, Y.; Guan, Z.; Gurgenci, H.; Zou, Z. Windbreak walls reverse the negative effect of crosswind in short natural draft dry cooling towers into a performance enhancement. Int. J. Heat Mass Transf. 2013, 63, 162–170. [Google Scholar] [CrossRef]
- Du, X.; Hu, H.; Shen, Y.; Yang, L.; Yang, Y. Reduced order analysis of flow and heat transfer for air-cooled condenser of power generating unit. Appl. Therm. Eng. 2013, 51, 383–392. [Google Scholar] [CrossRef]
- Du, X.P.; Zeng, M.; Dong, Z.Y.; Wang, Q.W. Experimental study of the effect of air inlet angle on the air-side performance for cross-flow finned oval-tube heat exchangers. Exp. Therm. Fluid Sci. 2014, 52, 146–155. [Google Scholar] [CrossRef]
- Du, X.P.; Zeng, M.; Wang, Q.W.; Dong, Z. Experimental investigation of heat transfer and resistance characteristics of a finned oval-tube heat exchanger with different air inlet angles. Heat Transf. Eng. 2014, 35, 703–710. [Google Scholar] [CrossRef]
- Huang, J.; Liu, M.; Jin, T. A comprehensive empirical correlation for finned heat exchangers with parallel plates working in oscillating flow. Appl. Sci. 2017, 7, 117. [Google Scholar] [CrossRef]
- Liu, Z.Y.; Varbanov, P.S.; Klemeš, J.J.; Yong, J.Y. Recent developments in applied thermal engineering: Process integration, heat exchangers, enhanced heat transfer, solar thermal energy, combustion and high temperature processes and thermal process modelling. Appl. Therm. Eng. 2016, 105, 755–762. [Google Scholar] [CrossRef]
- Liang, C.; Tong, X.; Lei, T.; Li, Z.; Wu, G. Optimal design of an air-to-air heat exchanger with cross-corrugated triangular ducts by using a particle swarm optimization algorithm. Appl. Sci. 2017, 7, 554. [Google Scholar] [CrossRef]
- Hooman, K.; Huang, X.; Jiang, F. Solar-enhanced air-cooled heat exchangers for geothermal power plants. Energies 2017, 10, 1676. [Google Scholar] [CrossRef]
- Chen, Y.; Sun, F.; Wang, H.; Mu, N.; Gao, M. Experimental research of the cross walls effect on the thermal performance of wet cooling towers under crosswind conditions. Appl. Therm. Eng. 2011, 31, 4007–4013. [Google Scholar] [CrossRef]
- Chen, L.; Yang, L.; Du, X.; Yang, Y. Performance improvement of natural draft dry cooling system by interior and exterior windbreaker configurations. Int. J. Heat Mass Transf. 2016, 96, 42–63. [Google Scholar] [CrossRef]
- Naik, B.K.; Muthukumar, P. A novel approach for performance assessment of mechanical draft wet cooling towers. Appl. Therm. Eng. 2017, 121, 14–26. [Google Scholar] [CrossRef]
- Wang, W.; Chen, L.; Huang, X.; Yang, L.; Du, X. Performance recovery of natural draft dry cooling systems by combined air leading strategies. Energies 2017, 10, 2166. [Google Scholar] [CrossRef]
- Takata, K.; Michioka, T.; Kurose, R. Prediction of a visible plume from a dry and wet combined cooling tower and its mechanism of abatement. Atmosphere 2016, 7, 59. [Google Scholar] [CrossRef]
- Gao, M.; Sun, F.Z.; Wang, K.; Shi, Y.T.; Zhao, Y.B. Experimental research of heat transfer performance on natural draft counter flow wet cooling tower under cross-wind conditions. Int. J. Therm. Sci. 2008, 47, 935–941. [Google Scholar] [CrossRef]
- Lu, Y.; Guan, Z.; Gurgenci, H.; Hooman, K.; He, S.; Bharathan, D. Experimental study of crosswind effects on the performance of small cylindrical natural draft dry cooling towers. Energy Convers. Manag. 2015, 91, 238–248. [Google Scholar] [CrossRef]
- Kline, S.J.; McClintock, F.A. Describing uncertainties in single-sample experiments. Mech. Eng. 1953, 75, 3–8. [Google Scholar]
- Gong, T. Experimental Research and Numerical Simulation of Crosswind Effect on the Performance of Indirect Air Cooling Tower; Shandong University: Jinan, China, 2012. [Google Scholar]
- Patankar, S.V. Numerical Heat Transfer and Fluid Flow; Hemisphere Publishing Corporation: New York, NY, USA, 1980. [Google Scholar]
- Al-Waked, R.; Behnia, M. CFD simulation of wet cooling towers. Appl. Therm. Eng. 2006, 26, 382–395. [Google Scholar] [CrossRef]
- Yang, L.J.; Wu, X.P.; Du, X.Z.; Yang, Y.P. Dimensional characteristics of wind effects on the performance of indirect dry cooling system with vertically arranged heat exchanger bundles. Int. J. Heat Mass Transf. 2013, 67, 853–866. [Google Scholar] [CrossRef]
- Zhao, Y.; Long, G.; Sun, F.; Yan, L.; Zhang, C. Numerical study on the cooling performance of dry cooling tower with vertical two-pass column radiators under crosswind. Appl. Therm. Eng. 2014, 75, 1106–1117. [Google Scholar] [CrossRef]
- Al-Waked, R. Crosswinds effect on the performance of natural draft wet cooling towers. Int. J. Therm. Sci. 2010, 49, 218–224. [Google Scholar] [CrossRef]
Figure 1.
Schematic diagram of experimental system. 1—Natural-wind-simulating system; 2—Cooling tower; 3—Wind deflector; 4—Experiment table; 5—Radiators; 6—Water tank.
Figure 1.
Schematic diagram of experimental system. 1—Natural-wind-simulating system; 2—Cooling tower; 3—Wind deflector; 4—Experiment table; 5—Radiators; 6—Water tank.

Figure 2.
Environmental natural wind simulation system.
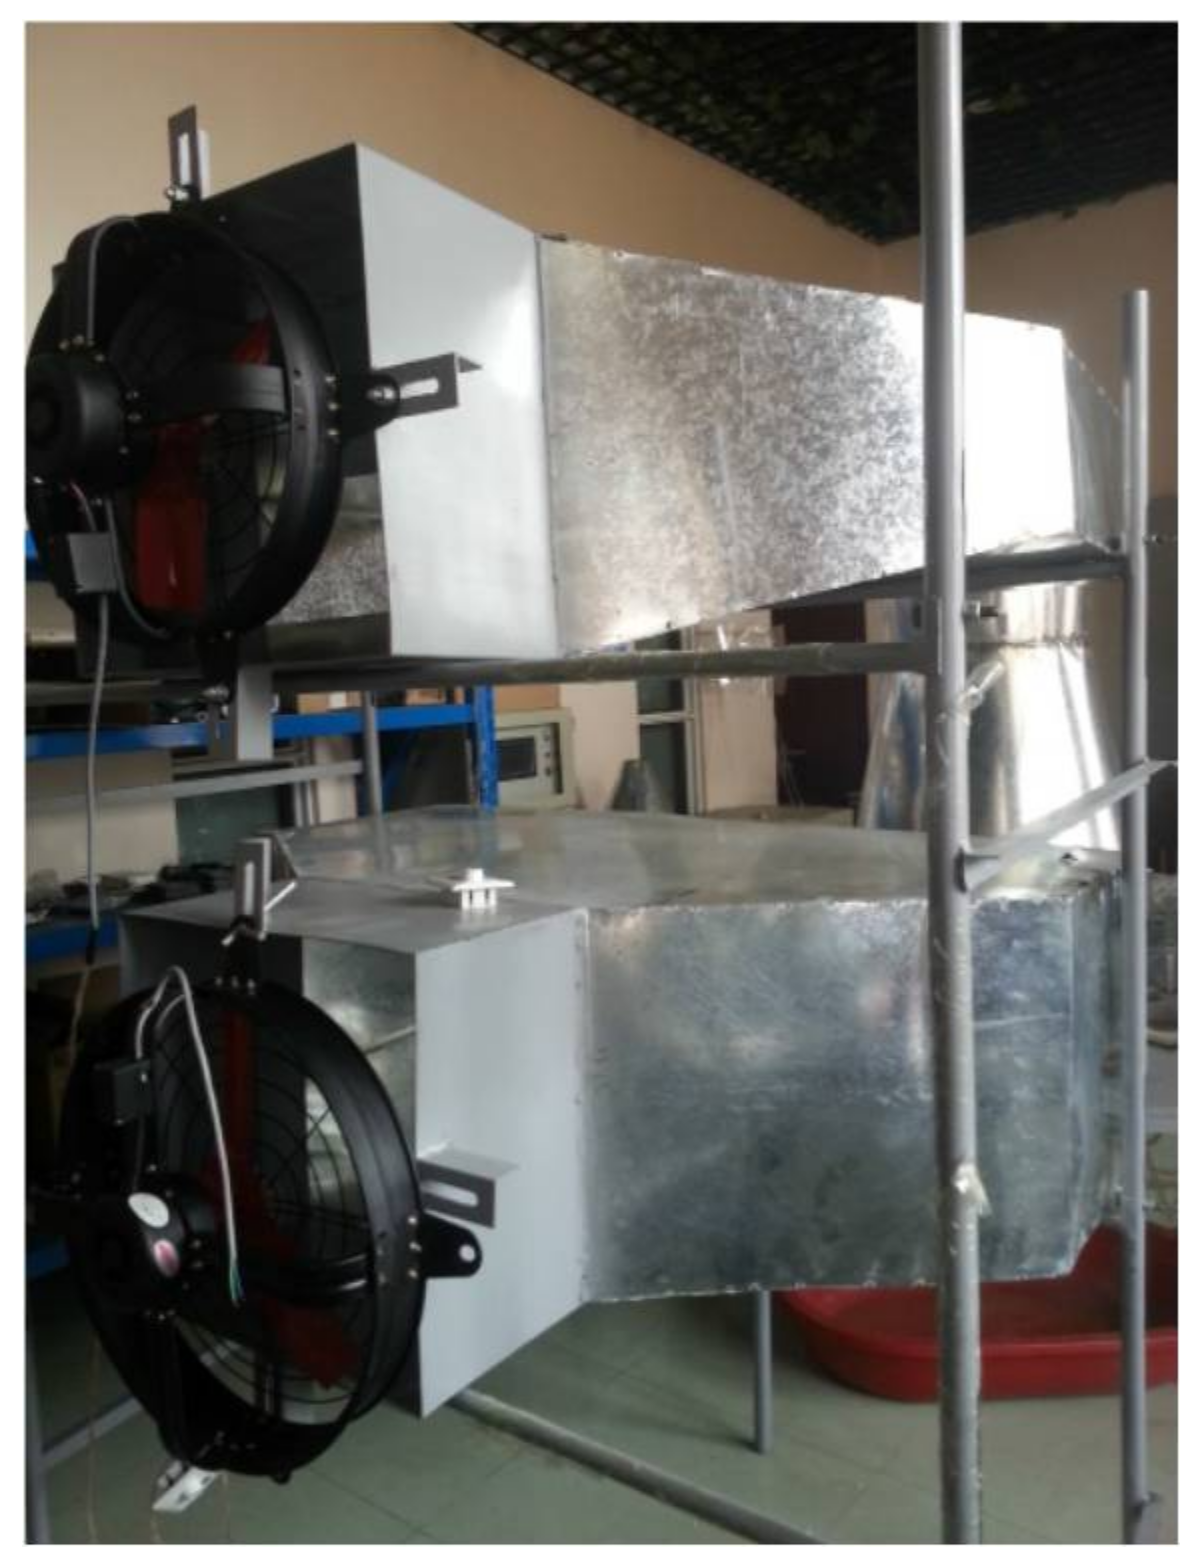
Figure 3.
Sketch of the rotating wind deflector system. 1—Wind deflector; 2—Slewing bearing; 3—Driving gear; 4—Driving motor.
Figure 3.
Sketch of the rotating wind deflector system. 1—Wind deflector; 2—Slewing bearing; 3—Driving gear; 4—Driving motor.
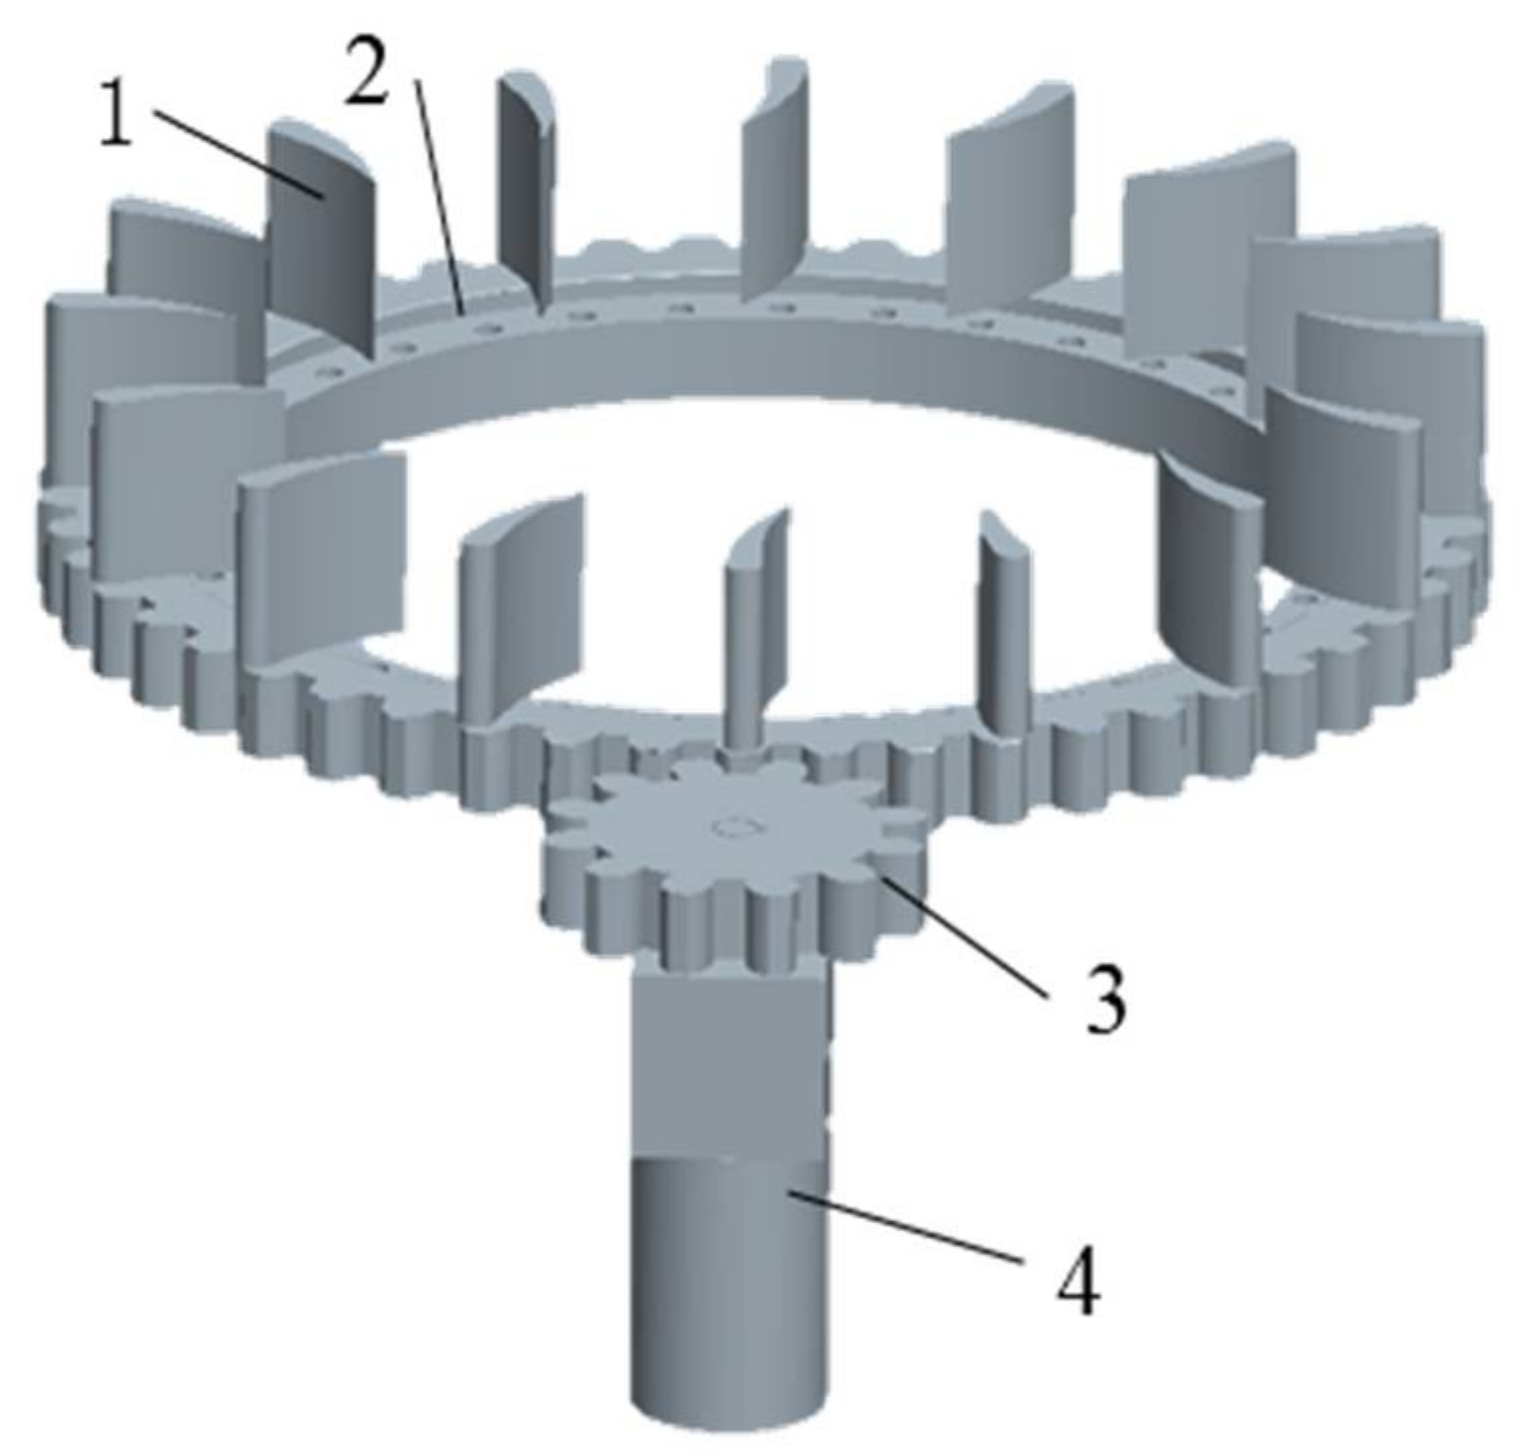
Figure 4.
Picture of the wind deflector.

Figure 5.
Picture of a radiator.

Figure 6.
Radiator installation configuration of the experimental system.

Figure 7.
Grid of various parts and the density box.

Figure 8.
Computational domain and air flow boundaries.
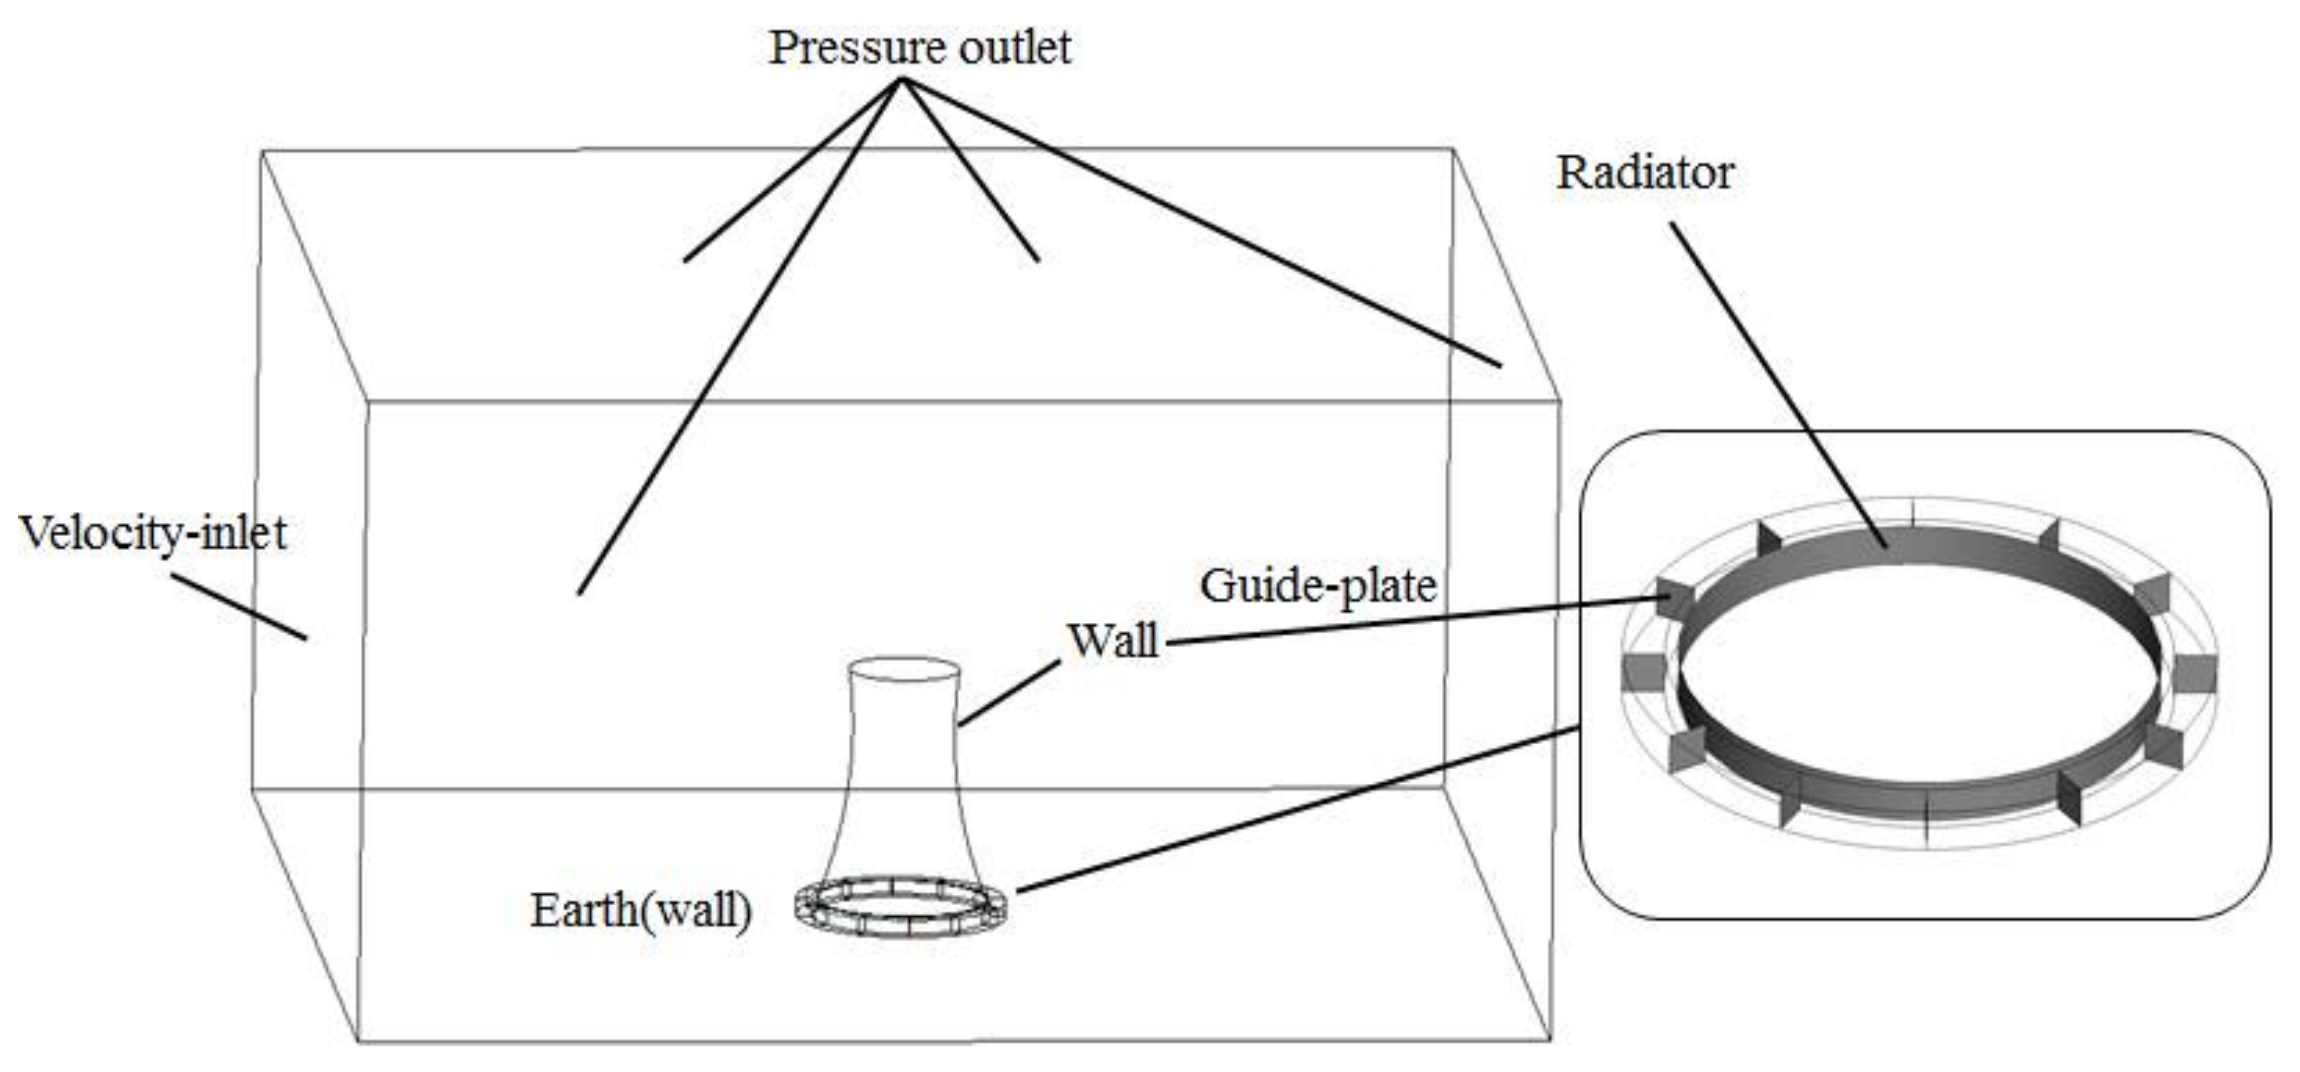
Figure 9.
Grid independence test.

Figure 10.
Comparison of thermal efficiency coefficients from numerical simulation with those from the experiment.
Figure 10.
Comparison of thermal efficiency coefficients from numerical simulation with those from the experiment.
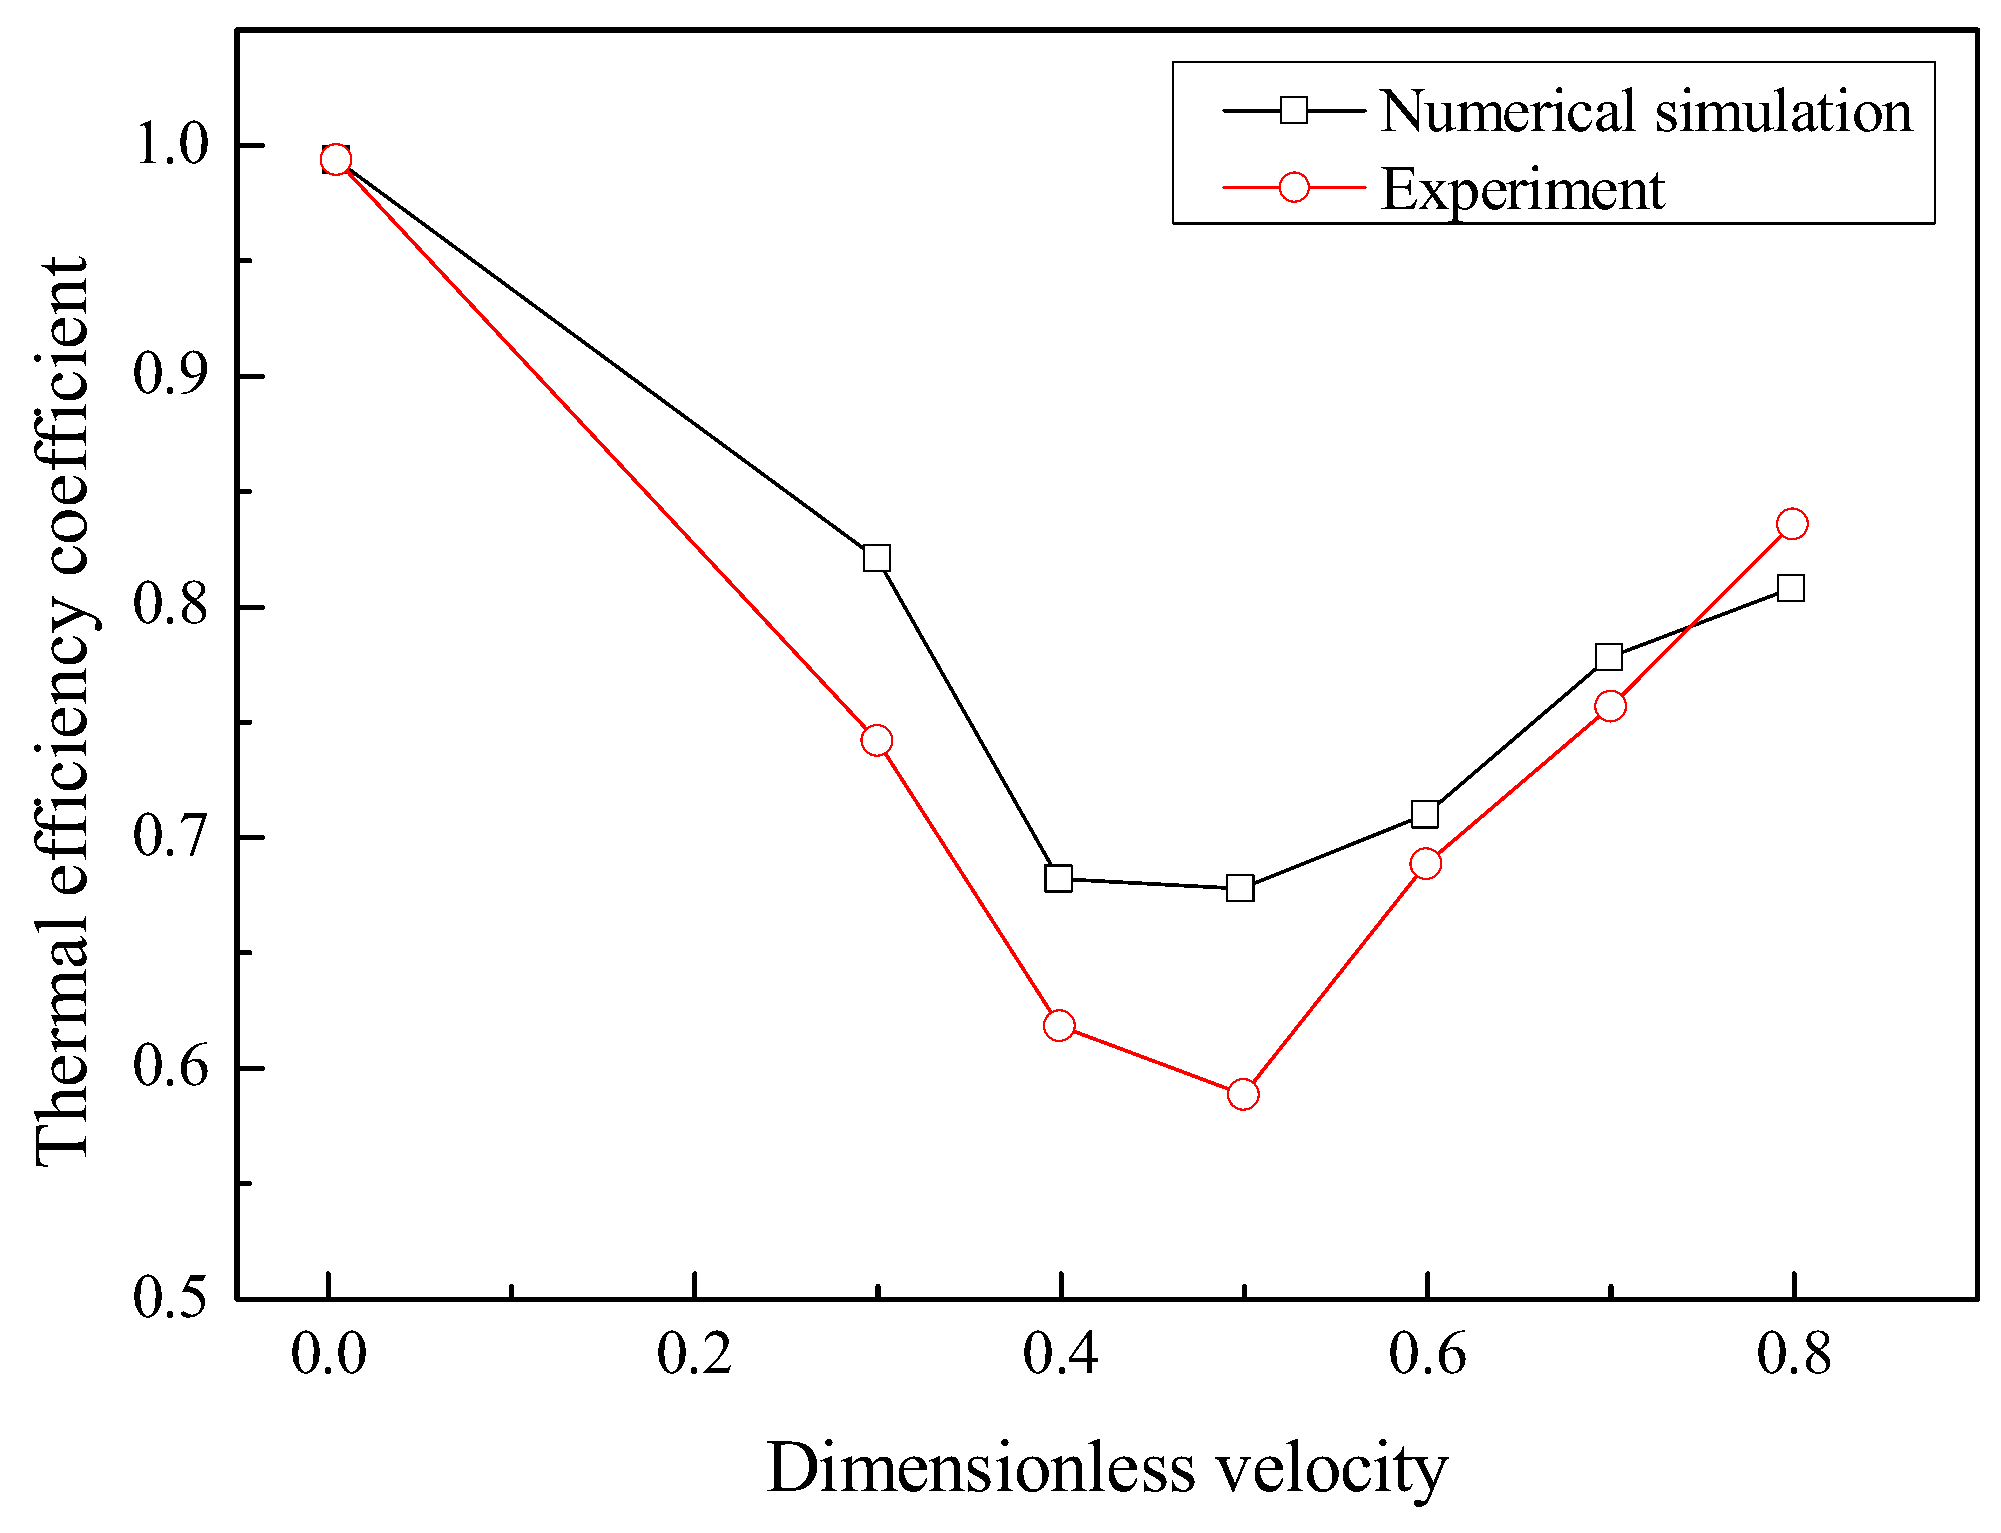
Figure 11.
Air velocity contour at crosswind speeds of (a) 0 m/s, (b) 3 m/s, (c) 4 m/s, (d) 5 m/s, (e) 6 m/s, and (f) 7 m/s.
Figure 11.
Air velocity contour at crosswind speeds of (a) 0 m/s, (b) 3 m/s, (c) 4 m/s, (d) 5 m/s, (e) 6 m/s, and (f) 7 m/s.

Figure 12.
Temperature contour at the center of the mid-xy plane at a wind velocity of (a) 0 m/s, (b) 3 m/s, (c) 4 m/s, (d) 5 m/s, (e) 6 m/s, and (f) 7 m/s.
Figure 12.
Temperature contour at the center of the mid-xy plane at a wind velocity of (a) 0 m/s, (b) 3 m/s, (c) 4 m/s, (d) 5 m/s, (e) 6 m/s, and (f) 7 m/s.

Figure 13.
Air flow rate and heat transfer rate versus wind velocity.

Figure 14.
Water temperature decline from experiment versus dimensionless velocity.
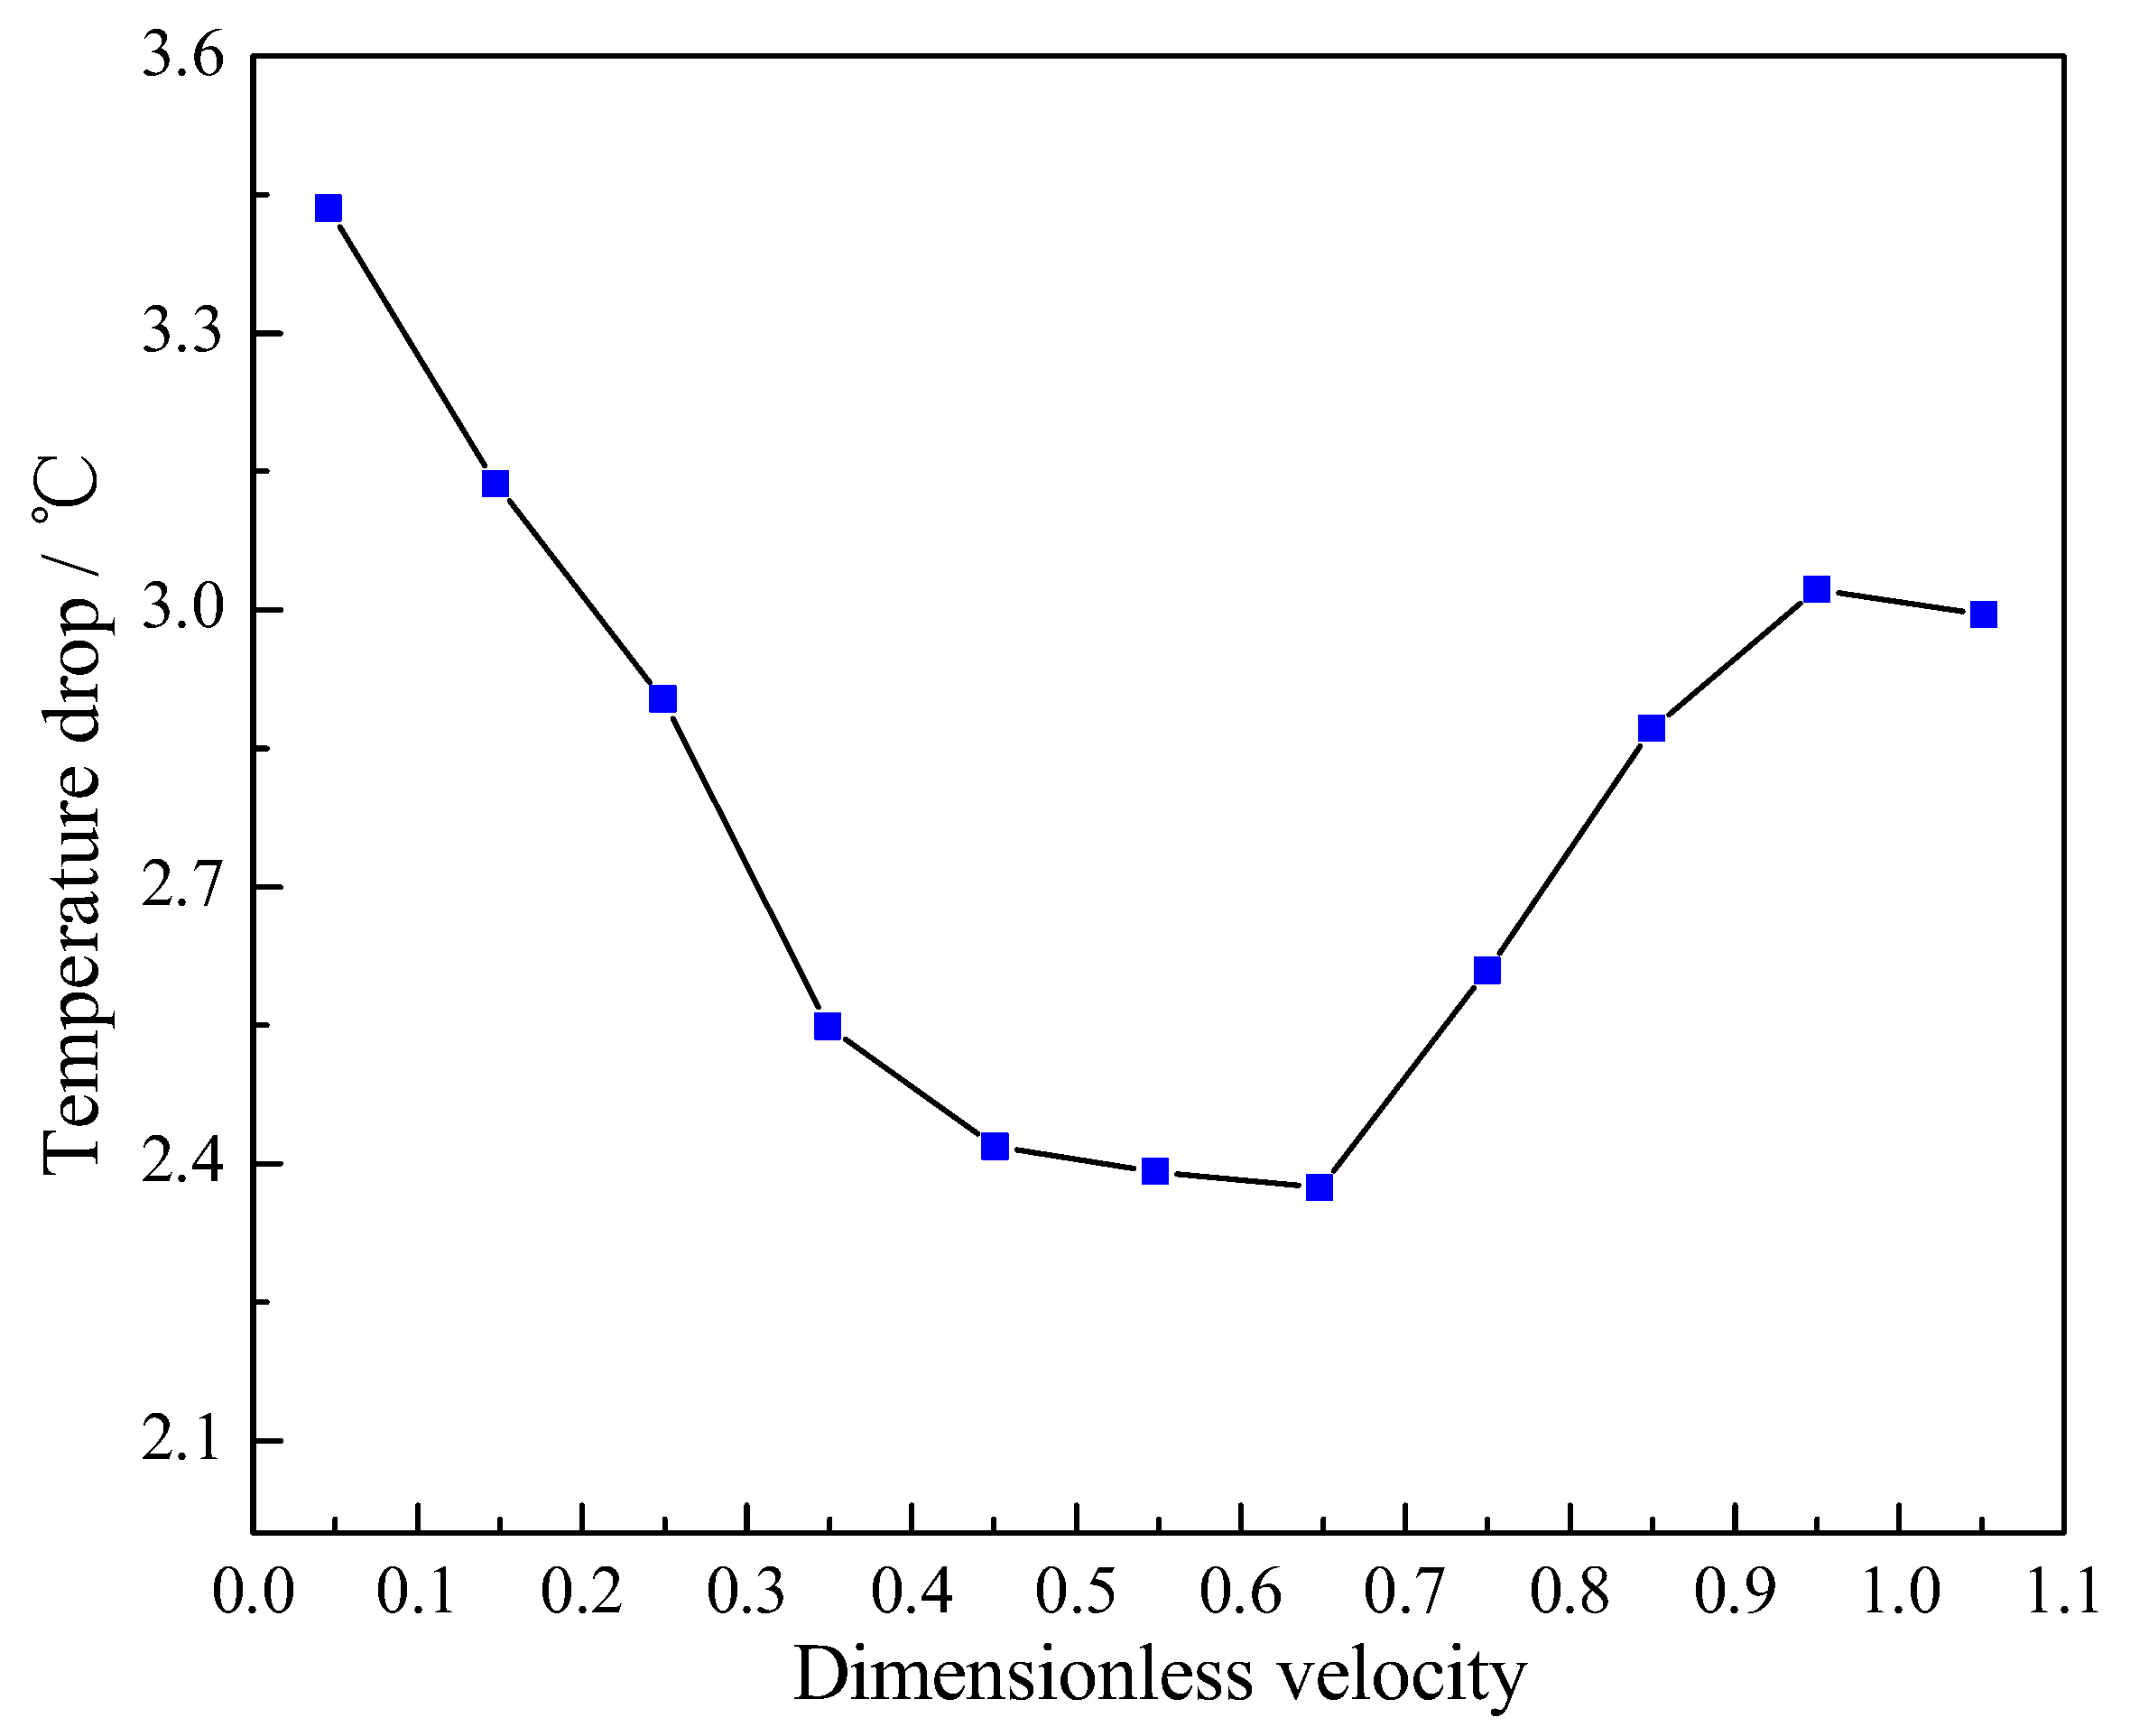
Figure 15.
Velocity vectors (unit: m·s−1) of the air at the tower inlet with various number of wind deflectors under the crosswind speed of 5 m/s.
Figure 15.
Velocity vectors (unit: m·s−1) of the air at the tower inlet with various number of wind deflectors under the crosswind speed of 5 m/s.

Figure 16.
Contours of static pressure (unit: Pa) of air at the tower inlet with various wind deflectors under a crosswind speed of 5 m/s.
Figure 16.
Contours of static pressure (unit: Pa) of air at the tower inlet with various wind deflectors under a crosswind speed of 5 m/s.

Figure 17.
Air flow rate and heat transfer rate versus number of wind deflectors.

Figure 18.
Temperature contours at the tower inlet (unit: K). (a) 4 deflectors, (b) 8 deflectors.
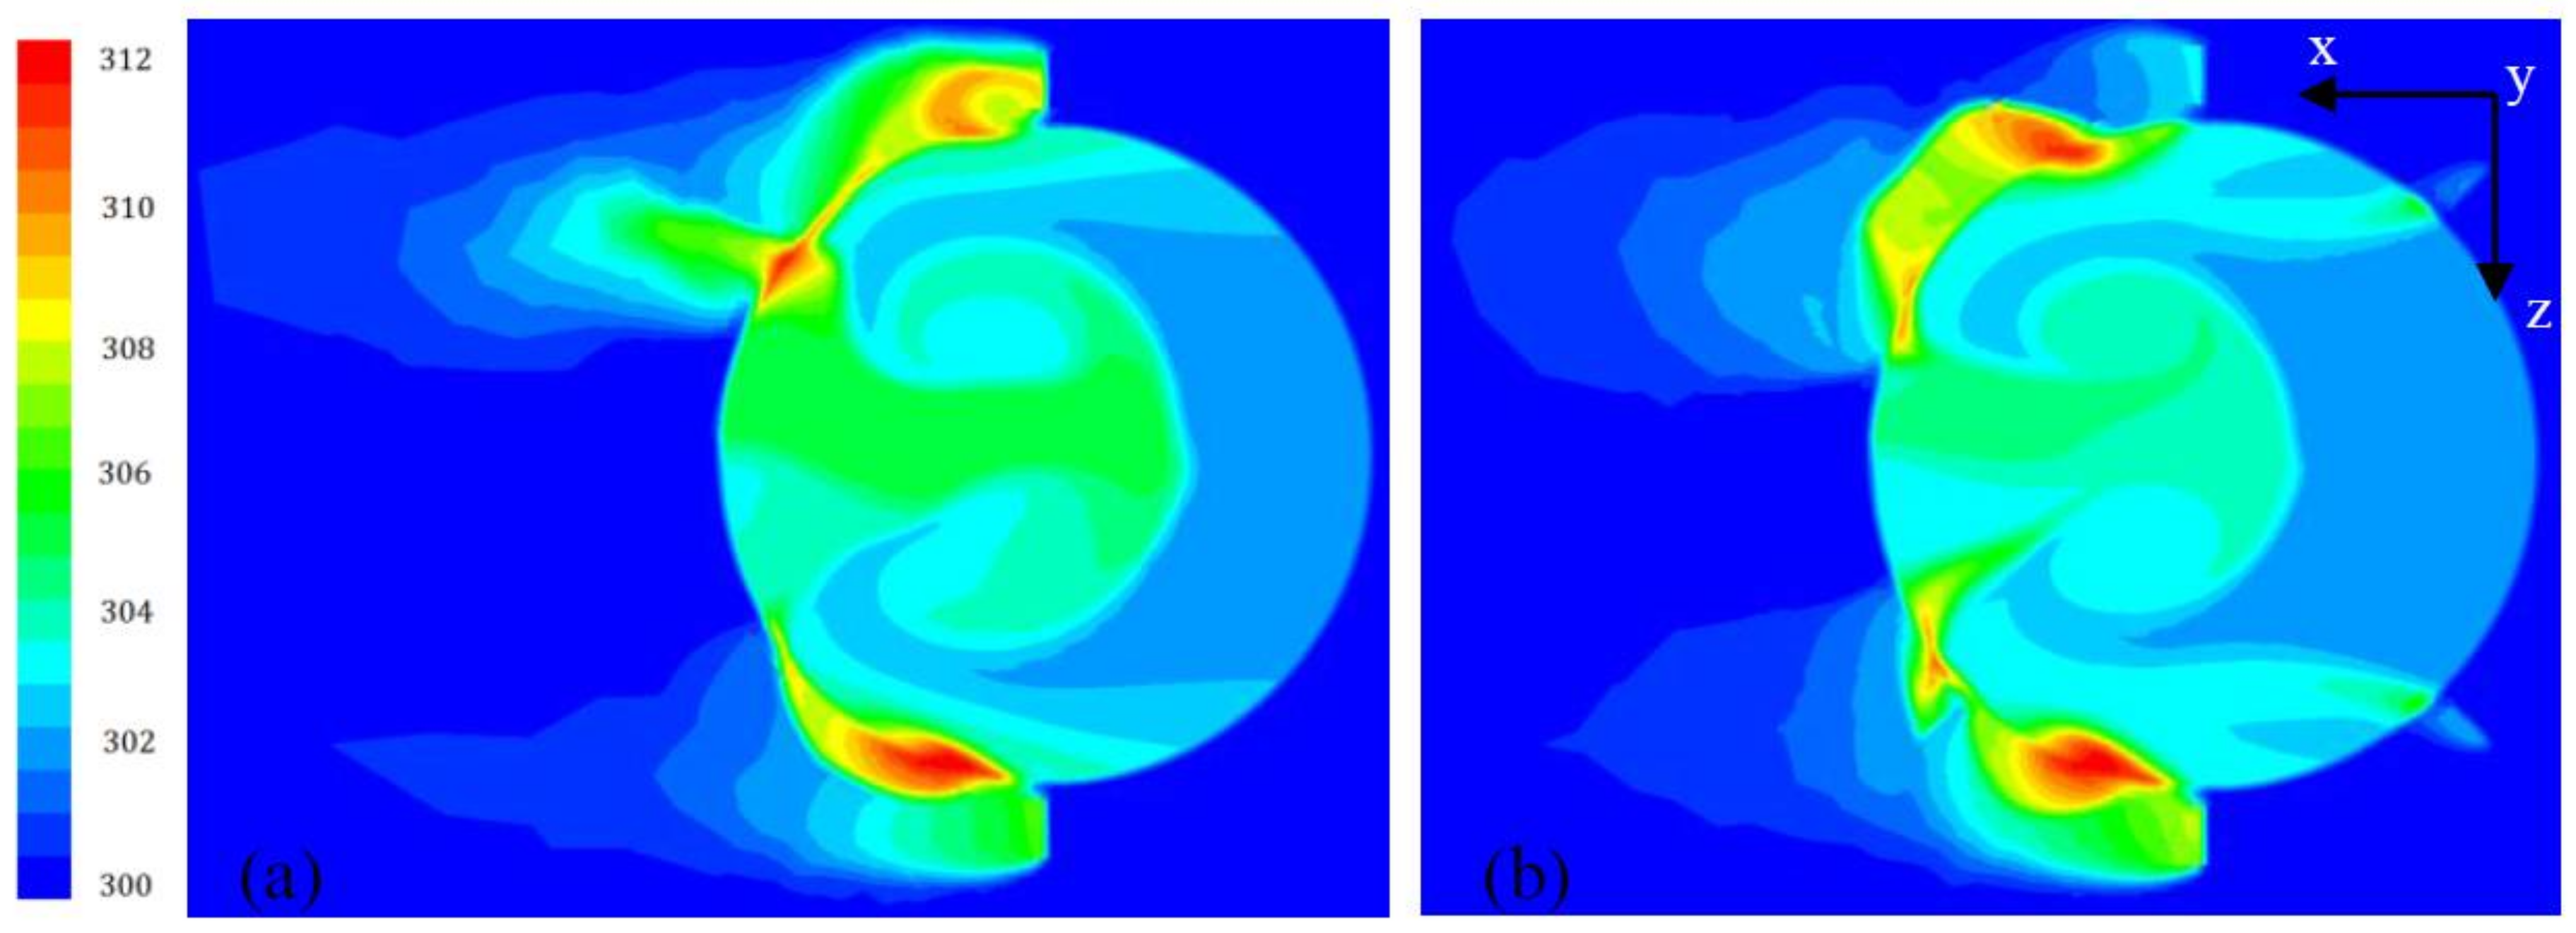
Figure 19.
Temperature contours (unit: K) at the inlet of tower with various rotating velocity for wind deflectors under 5 m/s wind speed.
Figure 19.
Temperature contours (unit: K) at the inlet of tower with various rotating velocity for wind deflectors under 5 m/s wind speed.

Figure 20.
Air flow rate and heat transfer rate versus rotating velocity of four and eight wind deflectors under 5 m/s crosswind speed.
Figure 20.
Air flow rate and heat transfer rate versus rotating velocity of four and eight wind deflectors under 5 m/s crosswind speed.

Figure 21.
Comparison of thermal efficiency coefficients from experimental and numerical simulation results with rotating wind deflectors.
Figure 21.
Comparison of thermal efficiency coefficients from experimental and numerical simulation results with rotating wind deflectors.


Table 1.
Parameters of general equations.
| Equation Name | |||
|---|---|---|---|
| Continuous | 1 | - | - |
| X-momentum | | ||
| Y-momentum | |||
| Z-momentum | |||
| Turbulent kinetic energy | |||
| Turbulence dissipation rate | |||
| Energy equation |
© 2018 by the authors. Licensee MDPI, Basel, Switzerland. This article is an open access article distributed under the terms and conditions of the Creative Commons Attribution (CC BY) license (http://creativecommons.org/licenses/by/4.0/).
Share and Cite
MDPI and ACS Style
Du, X.; Han, D.; Zhu, Q. Heat Transfer Enhancement of the Air-Cooling Tower with Rotating Wind Deflectors under Crosswind Conditions. Appl. Sci. 2018, 8, 544. https://doi.org/10.3390/app8040544
AMA Style
Du X, Han D, Zhu Q. Heat Transfer Enhancement of the Air-Cooling Tower with Rotating Wind Deflectors under Crosswind Conditions. Applied Sciences. 2018; 8(4):544. https://doi.org/10.3390/app8040544
Chicago/Turabian StyleDu, Xueping, Dongtai Han, and Qiangmin Zhu. 2018. "Heat Transfer Enhancement of the Air-Cooling Tower with Rotating Wind Deflectors under Crosswind Conditions" Applied Sciences 8, no. 4: 544. https://doi.org/10.3390/app8040544
Note that from the first issue of 2016, this journal uses article numbers instead of page numbers. See further details here.