Octave Spanning Supercontinuum in Titanium Dioxide Waveguides
by
 ,
,
Kamal Hammani
* ,
,
Laurent Markey
,
Manon Lamy
,
Bertrand Kibler
,
Juan Arocas
,
Julien Fatome
,
Alain Dereux
,
Jean-Claude Weeber
and
Christophe Finot
Laboratoire Interdisciplinaire Carnot de Bourgogne (ICB), UMR 6303 CNRS—Université Bourgogne Franche-Comté, 9 Avenue Alain Savary, BP 47870, 21078 Dijon CEDEX, France
*
Author to whom correspondence should be addressed.
Appl. Sci. 2018, 8(4), 543; https://doi.org/10.3390/app8040543
Submission received: 13 February 2018
/
Revised: 22 March 2018
/
Accepted: 28 March 2018
/
Published: 2 April 2018
(This article belongs to the Special Issue Mid-Infrared Supercontinuum Sources: Materials, Waveguides and Applications)
Abstract
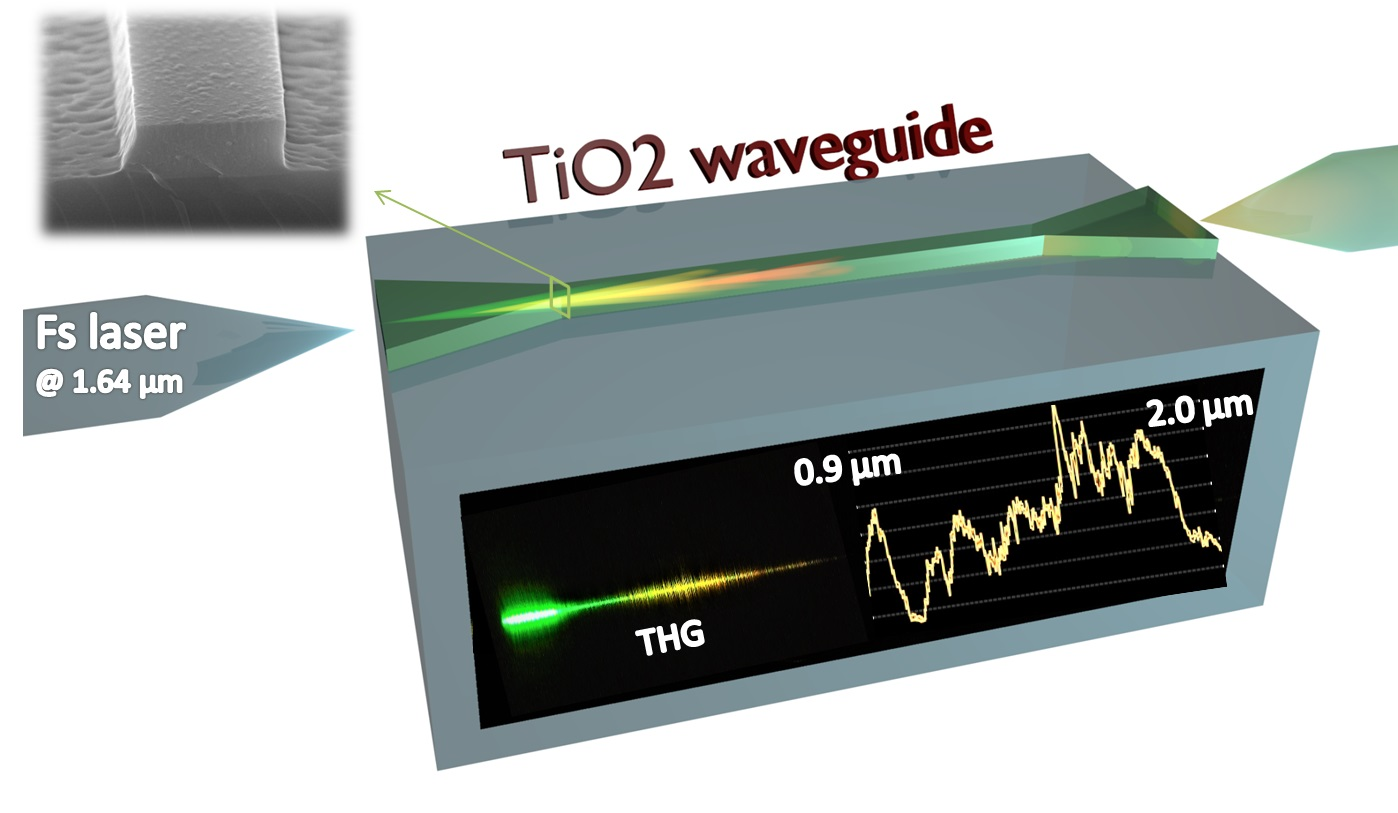
:We report on the experimental generation of an octave-spanning supercontinuum in a 2.2 cm-long titanium dioxide optical waveguide with two zero dispersion wavelengths. The resulting on-chip supercontinuum reaches the visible wavelength range as well as the mid-infrared region by using a femtosecond fiber laser pump at 1.64 µm.
1. Introduction
Generation of optical supercontinua (SC) is a fundamental topic that has stimulated tremendous interest since the early works of Alfano et al. in the 1970s [1]. The development of practical applications, as well as the physical understanding of the various processes involved in this nonlinear spectral broadening, have strongly benefited from the progress in optical fibre technologies. More especially, the emergence of photonic crystal fibres, combining tailored dispersion properties and enhanced nonlinearity, has led to record spectral expansion [2,3]. Moreover, advances in soft-glass materials such as fluoride, tellurite or chalcogenide fibres have also contributed to the extension of SC bandwidth far beyond the silica transmission window breaking the short wavelength limit by reaching the deep UV region [4] but also the high wavelength limit paving the way toward mid-infrared SC sources [5,6,7,8]. The next exciting stage is to reduce the footprint of the component and generate octave spanning supercontinua on an optical chip. To this aim, various platforms have been successfully investigated: Si [9,10,11], SiGe [12,13,14], SiN [15,16,17,18], diamond-on-insulator [19], chalcogenide waveguides [20] or III-V material based waveguides (InGaP [21]) and AlGaAs [22]. Each material provides specific advantages but also strong potential limitations including two photon absorption (TPA) and associated free carrier absorption, high level of losses, limiting transparency window, low refractive index, low handling power as well as high cost or complex manufacturing processes.
In this context, we consider here Titanium dioxide (TiO2) as an alternative platform that remained until now relatively unexplored. TiO2 is a promising material thanks to a transparency window spanning from the visible to the mid-infrared wavelengths [23], high linear and nonlinear refractive indices (of >2.3 and 30 times, respectively, larger than silica [24,25]) and a wide bandgap (3.4 eV) allowing a negligible TPA beyond 800 nm. Its thermo-optic properties can also be of great interest for thermal stability [26,27,28]. Moreover, thin films can be prepared by several techniques such as e-beam evaporation, atomic layer deposition (ALD), plasma-enhanced chemical vapour deposition (PE-CVD) or sol-gel process [29]. Therefore, it has become increasingly desirable to consider this cost-efficient material in different scenarios such as subwavelength optical waveguides [30], integrated optical resonators [25,27,31,32], infrared high speed transmissions [33] or sensing applications [34,35]. Quite recently, several studies aimed at taking advantage of the Kerr nonlinearity of TiO2 and have reported the observation of self-phase modulation induced spectral broadening of a femtosecond pulse [24], the parametric wavelength conversion of a continuous wave [25] as well as the efficient generation of photon triplet [36].
In the present contribution, to the best of our knowledge, we report on the first experimental generation of a supercontinuum covering an octave in a TiO2-based on-chip waveguide. The manuscript is organized as follows. We first describe the properties of the cm-long on-chip waveguides in which SC generation is demonstrated. Next, we detail the experimental set-up based on a femtosecond fibre laser at 1.64 µm and finally we analyse the main features of the generated supercontinua.
2. TiO2 Waveguide Design and Fabrication
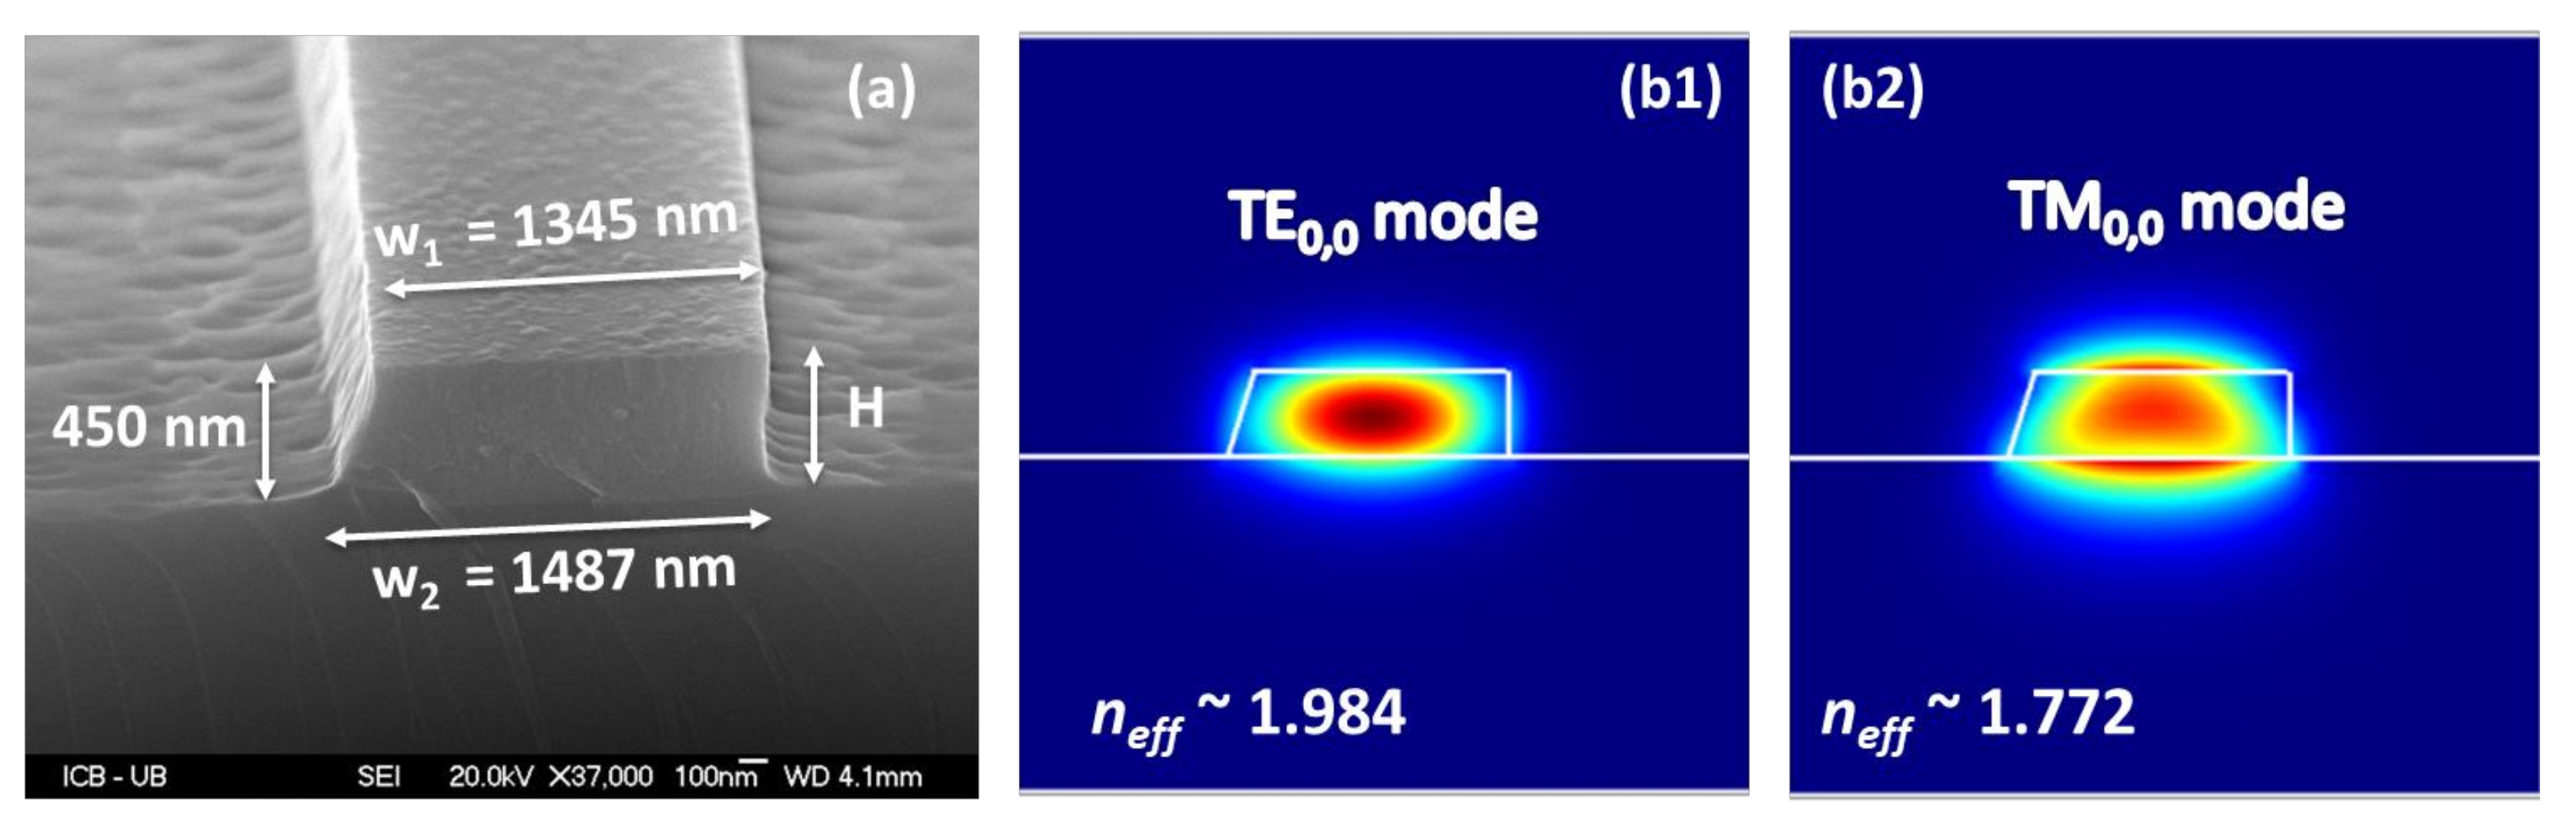
The fabrication process starts with the deposition of a 450 nm-thick layer of TiO2 onto a 2′ thermally oxidized Si wafer (SiO2 thickness = 2.0 µm). TiO2 deposition is performed by DC magnetron sputtering of a 99.9% pure titanium under an argon oxygen controlled atmosphere. It is well known that different TiO2 phases can be obtained: rutile [37,38], anatase [39,40] or amorphous [25,40]. In this case, Raman spectroscopy experiments (not shown) reveal that the layers are dominantly in the anatase phase. The 2.2 cm-long waveguides considered in the following are obtained by I-line patterning of the UV sensitive resist AZ MiR 701. The patterned resist is then used as a protective mask during the subsequent reactive ion etching of the TiO2 layer. After stripping of the residual mask, strip waveguides featuring a typical width of 1.5 µm are obtained as shown by scanning electron microscope (SEM) image displayed in Figure 1a. This image shows that the fabrication process leads to asymmetric sidewalls such that the top width (w1 = 1.345 µm) is shorter than the base width (w2 = 1.487 µm), so that the waveguide section is close to a right trapezoid.
The high contrast between the TiO2 (the estimated refractive index for the anatase TiO2 layer at 1.64 µm is 2.35) and the silica layer (refractive index = 1.44) or the surrounding air is highly beneficial for a strong light confinement. The refractive index for anatase phase TiO2 layer reported in Ref. [40] appears as a good starting point for the numerical investigation of the optical properties of the waveguides. By operating a commercial mode-solver relying on finite element method (COMSOL Multiphysics®), we found that the structure may sustain 4 modes. The modal intensity distributions of the two lowest orders modes are displayed for the transverse electric (TE) and transverse magnetic (TM) in Figure 1b1,b2, respectively. The TE polarized fundamental mode of interest features an effective area [41] of 0.54 µm2 with 85% of the energy carried out by the mode confined within the TiO2 core at a wavelength of 1.64 µm. In addition, as detailed in the following (Figure 4a), in the spectral region around 1.6 µm, the fundamental mode features an anomalous regime of chromatic dispersion which is a prerequisite for ultra-broad SC generation [25]. Compared to previous works [24,33,42], such an anomalous dispersion is obtained thanks to a thicker layer.
Due to the field enhancement at the top and lower interface of the waveguide (resulting from the continuity of the normal component of the electric displacement vector), the TM0,0 mode exhibits a lower confinement and thus an effective area increased by about 30% as compared to the fundamental mode.
3. Experimental Setup
The experimental setup is sketched in Figure 2. The pulse pump is generated from an all-fibre femtosecond laser source delivering fs pulses at a central wavelength of 1.56 µm and operating at a repetition rate of 80 MHz (OneFive GmbH, Origami 15-SP). The maximum available peak power is about 16 kW (maximum pulse energy of ~1.5 nJ). Then, the fs-pulses passed through an inline polarization controller (Lefevre loops) in order to optimize the energy launched into the fundamental TE mode of the waveguide. Indeed, given the noticeable difference in the values of effective area between TE and TM modes, the broadest SC can only be achieved for a proper TE linearly polarized wave. The total power injected into the waveguide can be adjusted by means of a set of calibrated fixed optical attenuators (OA). The injection of light into our TiO2 waveguides is ensured by a butt coupling technique through lensed fibres (Figure 2b1) characterized by a working-distance of 14 µm. To reduce the insertion losses through such butt-coupling of light, the component design includes 1 mm-long tapers (Figure 2b2) at both ends of the waveguide. Note that the nonlinear propagation of the initial pulse, equivalent to a near fundamental soliton pulse (N~1) [43], within the segment of standard anomalous dispersion SMF 28 fibre between the fs-laser output and the TiO2 waveguide leads to the tuning of the central wavelength of the initial pulse from 1.56 µm towards 1.64 µm through Raman soliton self-frequency shift (see Figure 2c).
The injecting conditions are optimized thanks to a visible camera (providing a top view of the sample) as well as a second infrared camera implemented at the waveguide output in such a way to image the far-field modal profile. The typical injection losses are around 11 dB (per facet) while the propagation losses are estimated to around 5.5 dB/cm, thus leading to an effective length below 1 cm, similar to the results available in the literature [25,40]. As a consequence, we believe that for the present experiment, the finite length of the device is not the main limiting effect. Note that a different process of fabrication avoiding etching could decrease drastically such losses down to around 1 dB/cm [44].
Once the input conditions are properly adjusted, the output camera is replaced by a second single-mode lensed fibre connected to an optical spectrum analyser (OSA) operating in the near-infrared range (Anritsu MS9740A). For analysis beyond 1.7 µm, the output silica lensed fibre is replaced by a fluoride multimode fibre and the injection in this collecting fibre is now achieved through a free-space setup involving two microscope objectives. Note that in this case, the OSA is also switched to another one operating up to 2.4 µm (Yokogawa AQ6375B) that includes a built-in cut filter to eliminate higher order diffracted light. However, despite this filter, some residual contribution of spurious double-order mode may eventually contribute to the spectrum recorded between 2200 and 2400 nm.
4. Supercontinuum Generation
4.1. Experimental Results
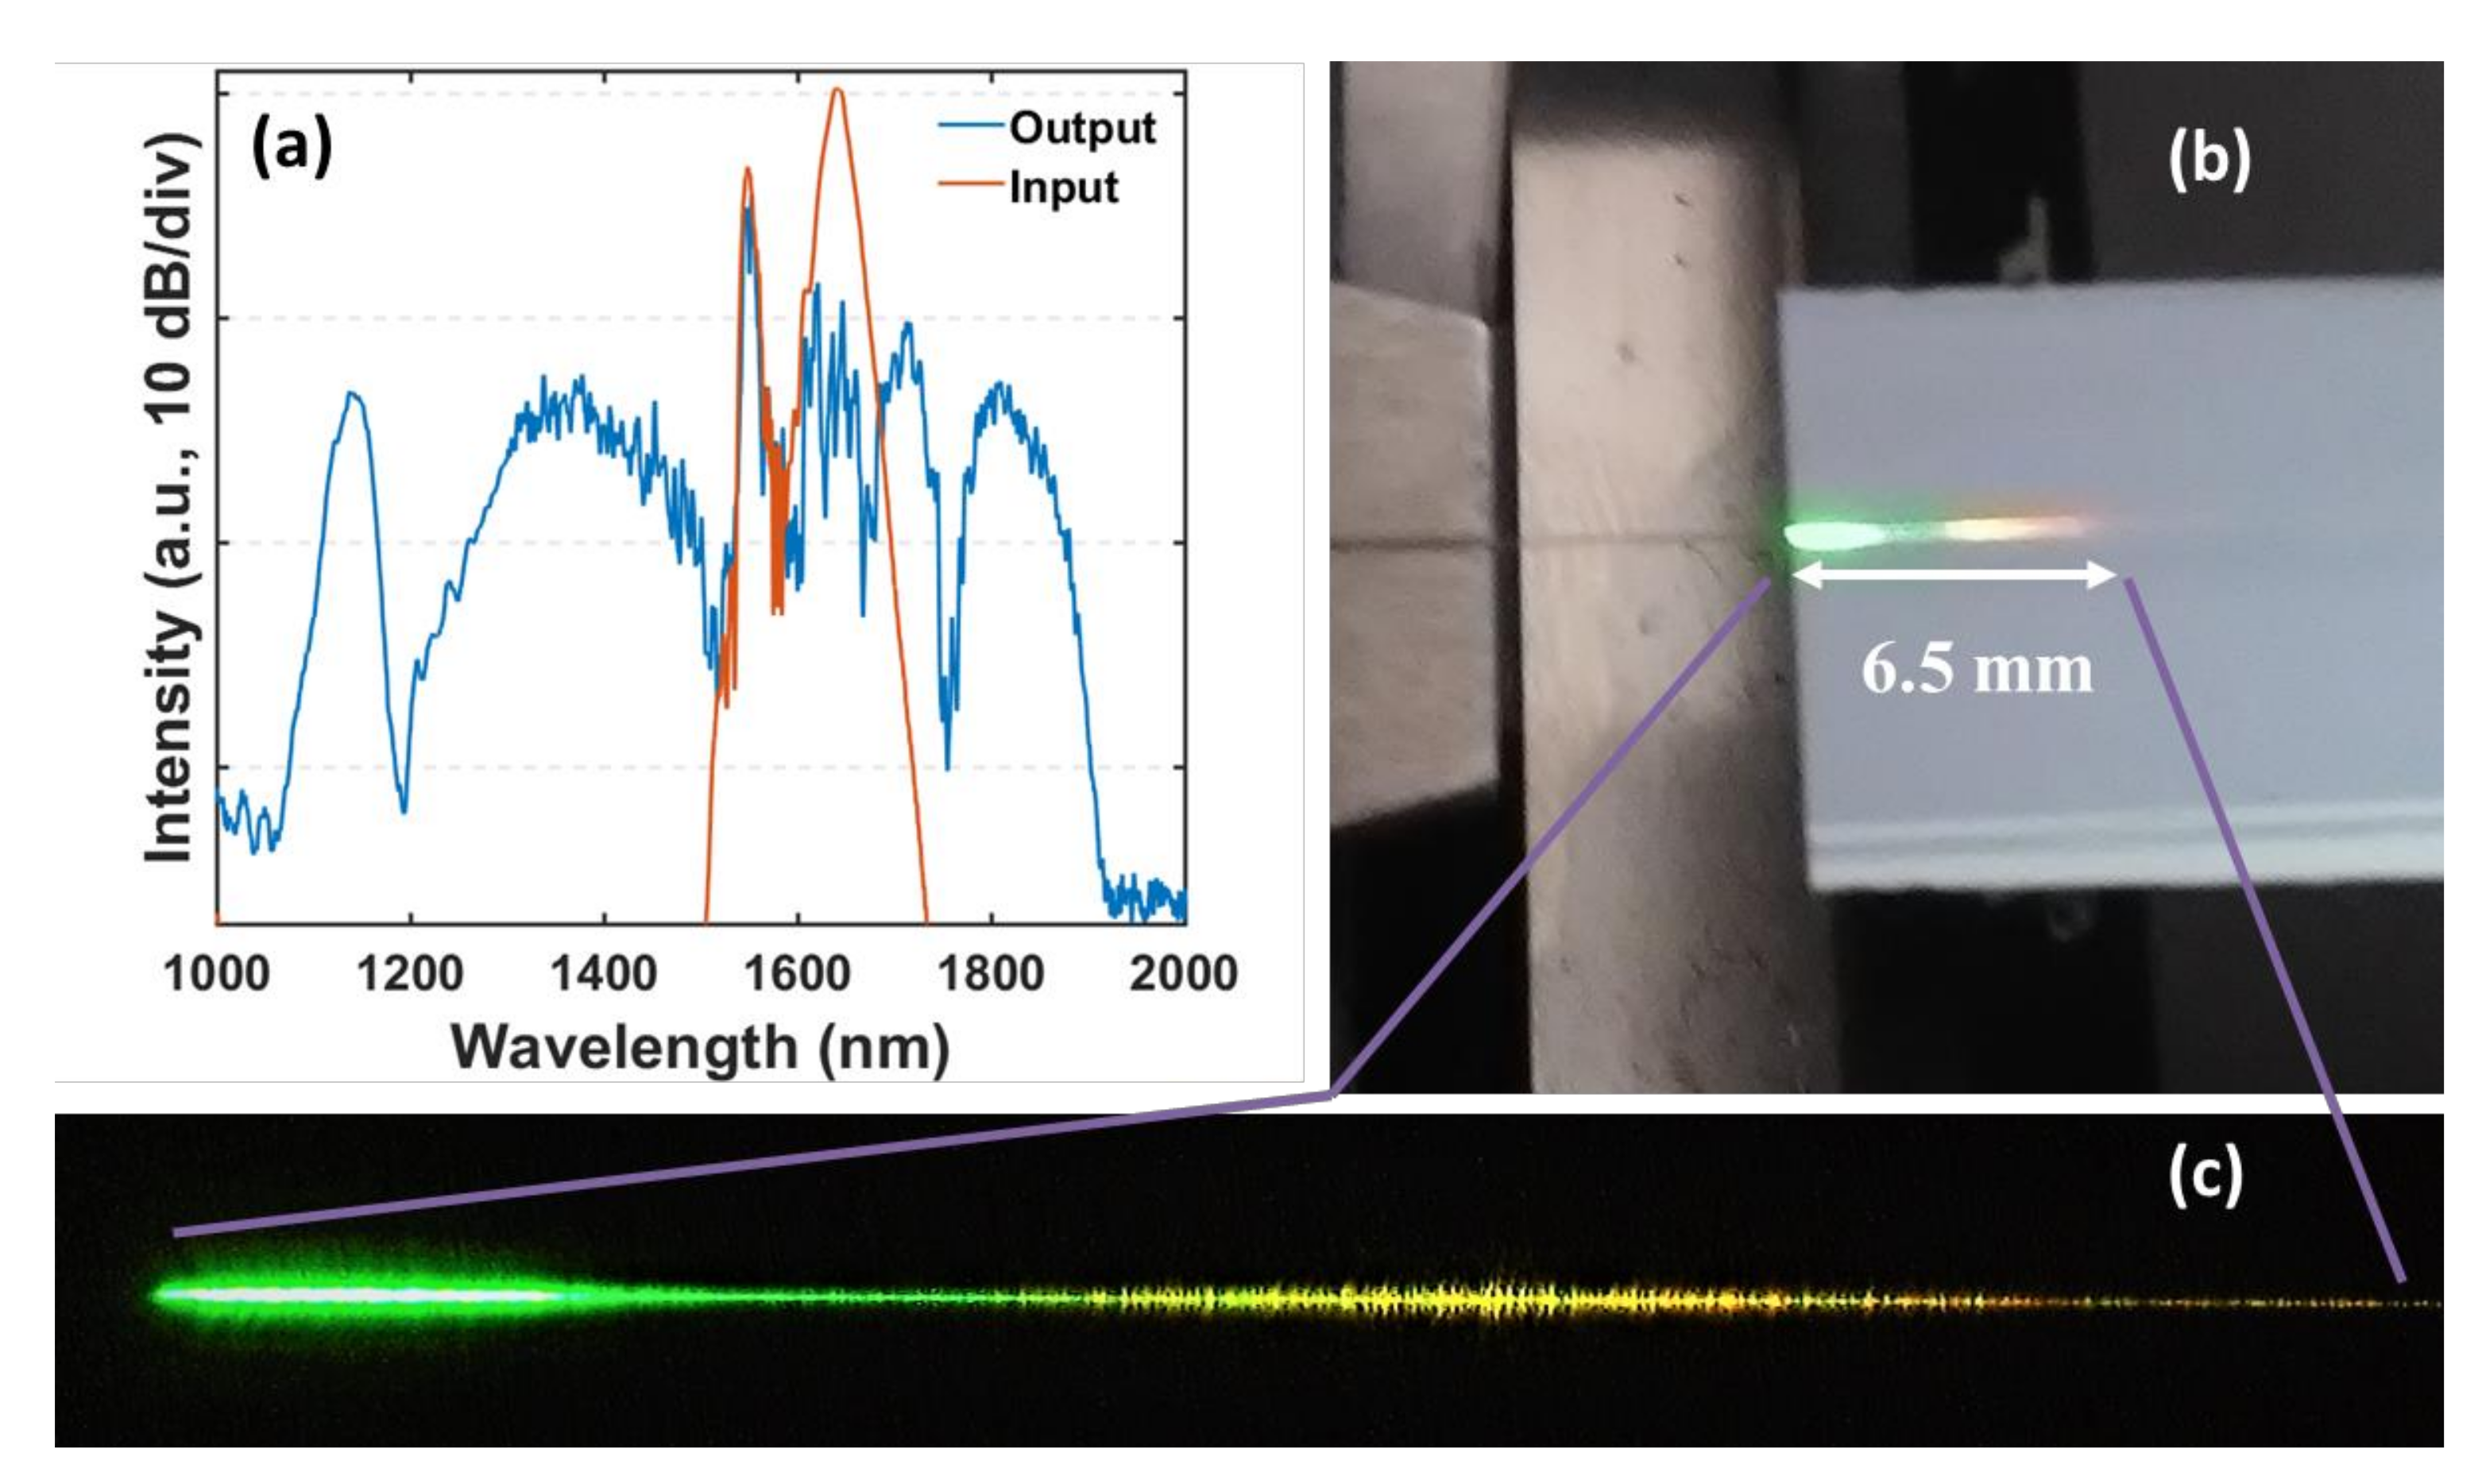
Figure 3 summarizes the typical spectral properties of the SC generated in the 1.5-µm wide TiO2 waveguide. The input peak power of the fs-pulses injected into the waveguide was estimated to almost 1.3 kW (corresponding to a soliton number N = 15 [2,43]) but given the experimental difficulty to evaluate precisely the energy coupled into the fundamental mode, this value remains a rough estimate. By means of a careful adjustment of the input polarization aligned to the fundamental TE mode which is expected to be in anomalous dispersion regime at the pump wavelength, an octave-spanning supercontinuum spectrum is then generated, with a central part ranging from 1050 nm up to 1910 nm (−20 dB spectral width in Figure 3a). Compared to the pioneer experiments of spectral broadening leading to tens of nanometres around 1550 nm reported by Evans et al. [24], the present results represent a significant improvement by much more than one order of magnitude. A third harmonic signal is also generated into the waveguide [45] so that visible light is also clearly observed by the naked eye in the early stage of propagation as can be seen from the photography taken from the top of the waveguide (Figure 3b,c). From these pictures, we can also notice that green light is generated first, followed by yellow, orange and then red, which is consistent with the progressive frequency shift of the femtosecond pulse during its propagation within the nonlinear waveguide. The visible light emitted along the waveguide represents therefore an indirect but practical way to track the longitudinal evolution of the central wavelength of the Raman-shifted soliton. However, the level of losses of TiO2 in the visible region remains slightly too high and, given the sensitivity of our spectral analysis devices, has prevented the detection of the visible part of the generated light at the output of the 2-cm-long waveguide.
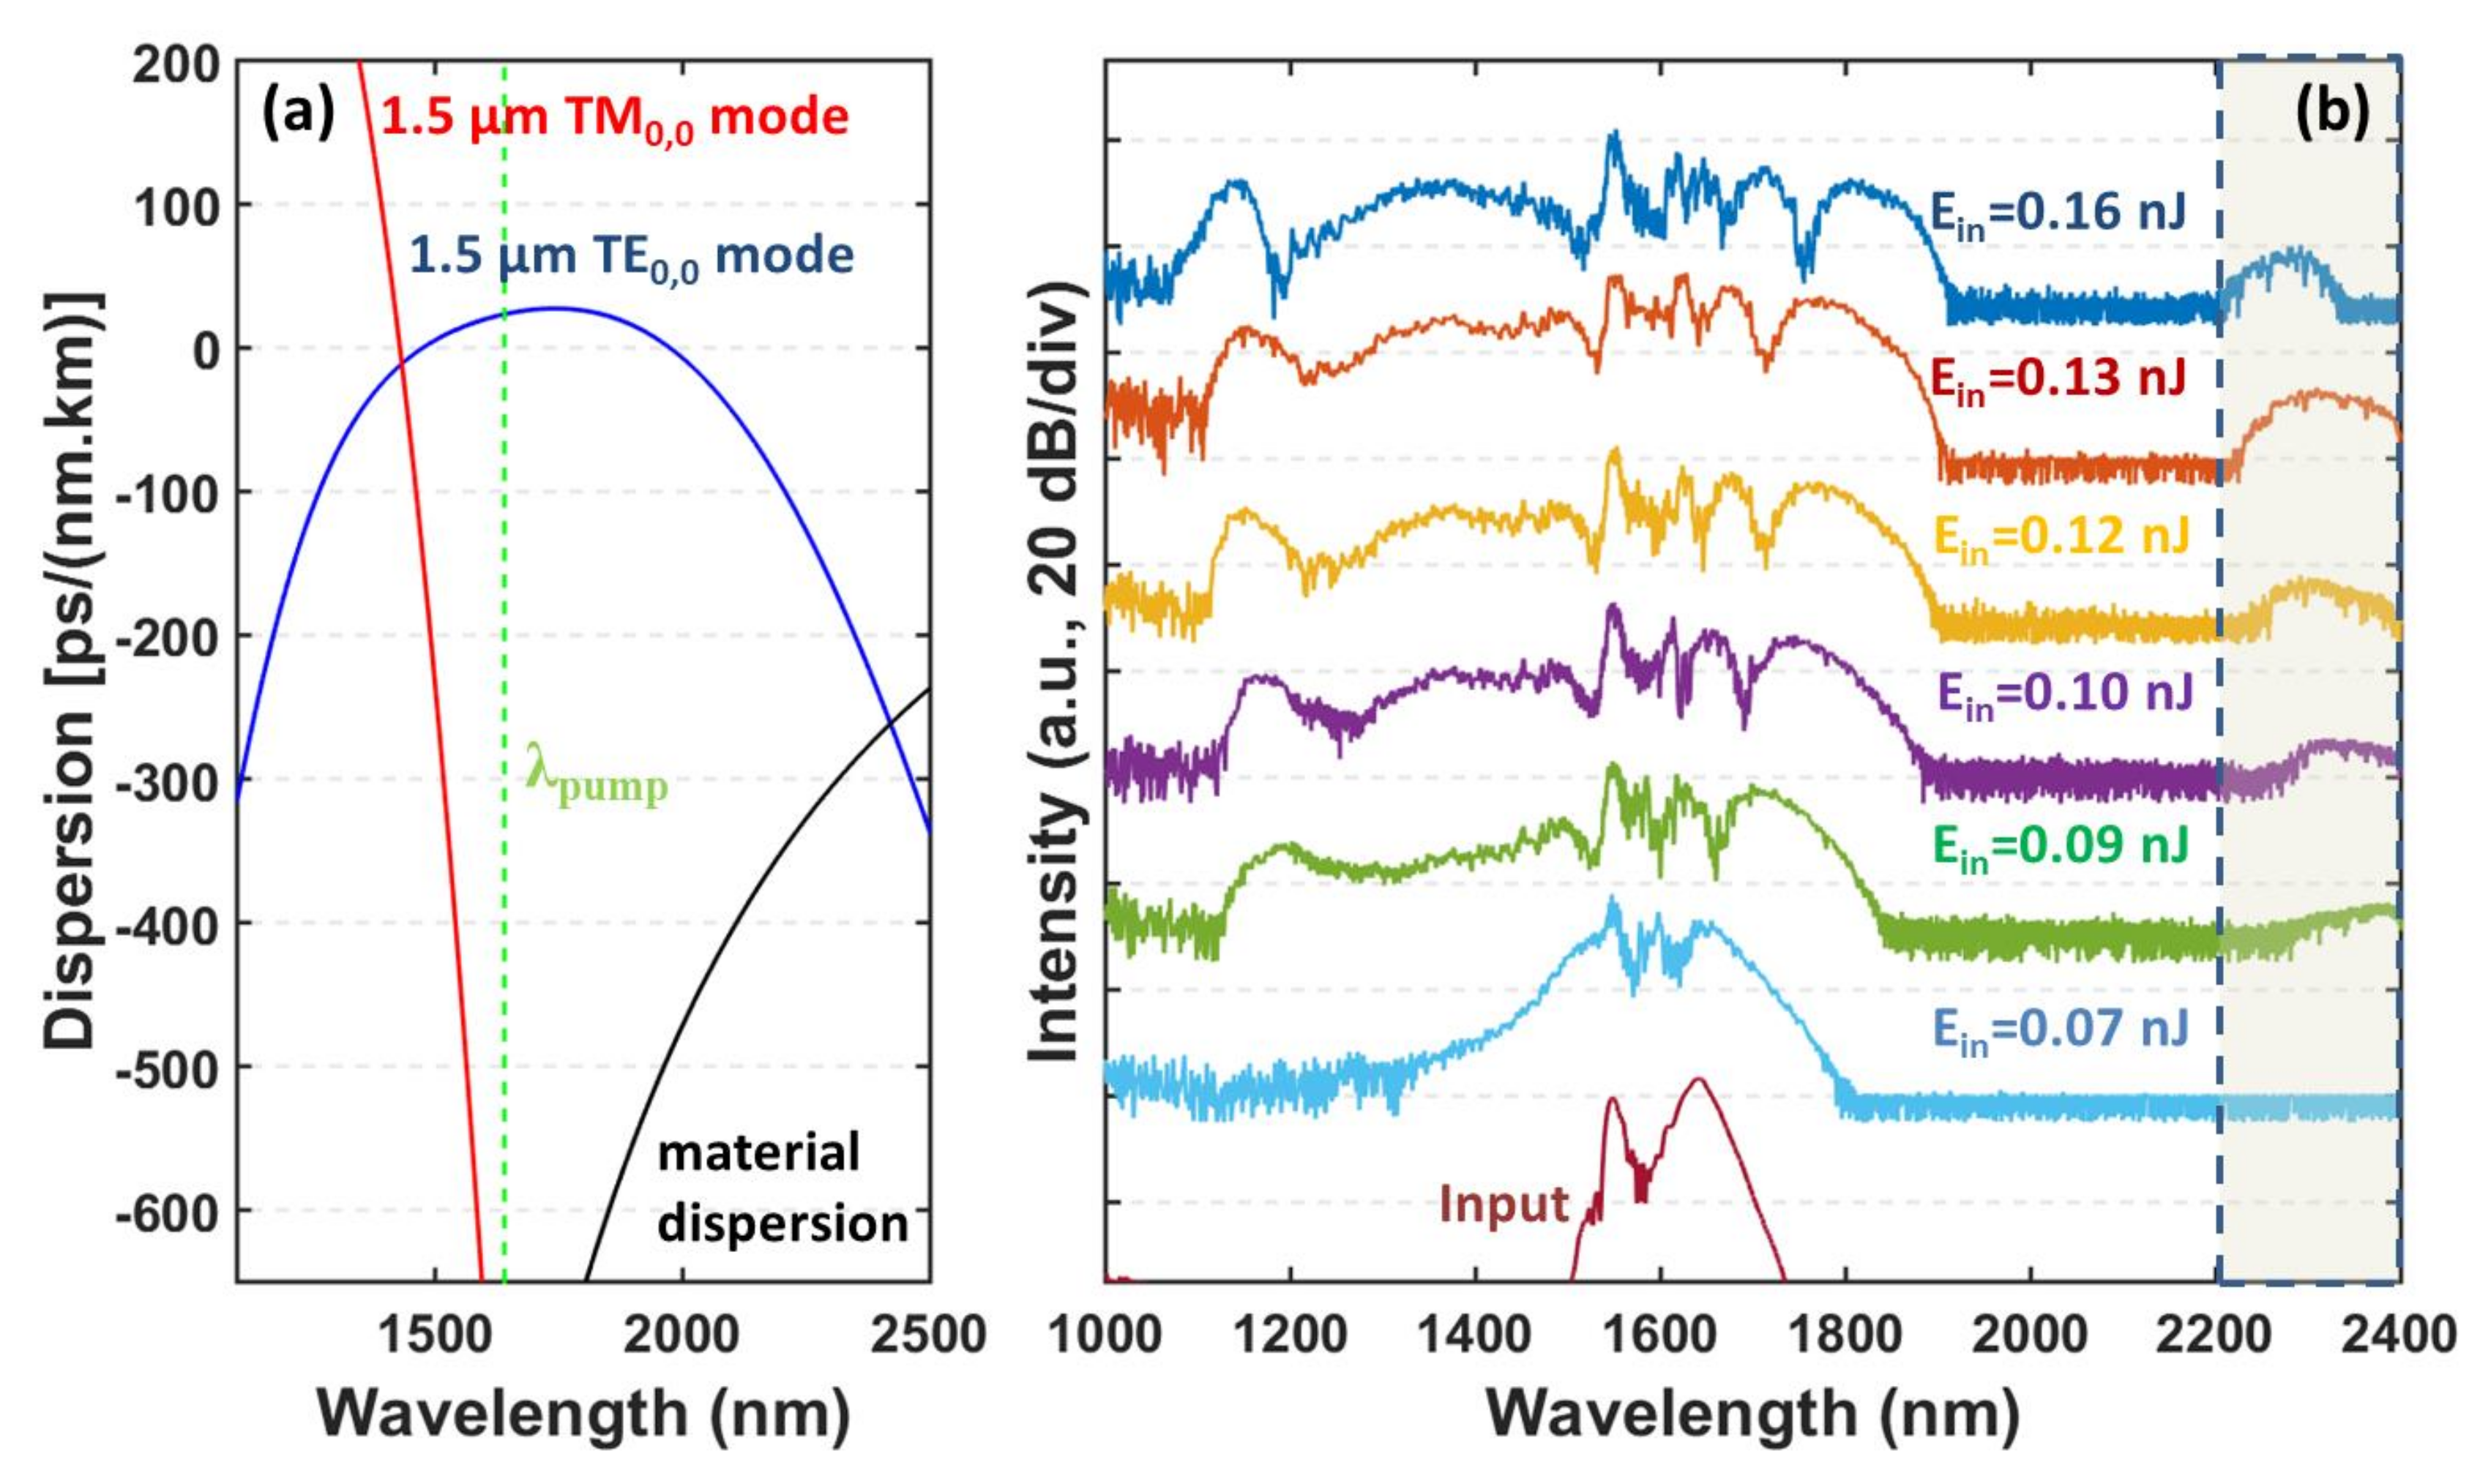
Figure 4a shows the dispersion curve of the waveguide obtained from finite element simulations and highlights the significant contribution of the waveguide to the overall dispersion that strongly differs from the properties of the TiO2 material. The TE fundamental mode is expected to be anomalous around the pumping wavelength, therefore enabling a soliton-driven SC dynamics [3,46]. Moreover, we confirm here that the waveguide presents two zero dispersion wavelengths that ultimately limit the spectral expansion of our supercontinuum [47]. Note also that the TM mode lies in the normal dispersion regime at the pump wavelength and its considerable dispersion value makes that only a negligible broadening can be expected (not presented here because similar to the input pulse). This point therefore further explains the high polarization sensitivity of the input conditions.
In order to better describe the SC dynamics, other spectra in the infrared part of the spectrum are plotted in Figure 4b as a function of the estimated coupled energy into the waveguide. As expected, the input pulse undergoes a strong and rapid self-phase modulation process with increased input energy, then followed by the emission of a dispersive wave at short wavelengths located in normal dispersion regime. Indeed, due to the presence of two zero-dispersion wavelengths, short- and long-wavelength SC edges are determined through phase-matched dispersive wave generation, namely below 1.3 µm and beyond 2.1 µm. However, note that the possible residual contribution of spurious double-order mode in the recorded spectra of Figure 4b in the 2200–2400 nm wavelength range prevent us to assert the generation of a dispersive wave in this spectral region. This is the reason why this wavelength area has been shaded in Figure 4b to avoid any misleading interpretation. Simultaneously, we observe the Raman self-frequency shift of one soliton, emitted from the initial pulse breakup, until 1.84 µm for the maximum input energy. It is worth mentioning this behaviour is also associated to the blue-shift of dispersive waves around 1.2 µm.
4.2. Numerical Simulations
In order to confirm the qualitative insights into the nonlinear dynamics occurring during the spectral broadening process, we have performed simulations based on the generalized nonlinear Schrödinger equation (GNLSE) governing the evolution of the complex envelope of the electrical field A(z,t) [2,12,48]:
where z and t are the distance and the temporal coordinates respectively. α is the linear loss, γ is the usual nonlinear coefficient, R(t) is the response function that takes into account both instantaneous electronic and delayed Raman contributions defined from the parameters given in Ref. [24]. βk’s are the dispersion coefficients associated with the Taylor series expansion of the propagation constant β around the central frequency. Note that we do not include terms based on the two-photon absorption (α2) and three photon absorption (α3) since titanium dioxide presents negligible nonlinear absorption in the spectral region of interest. The main limitations of the above GNLSE is related to the fact that visible light obtained through frequency tripling of the input pulse cannot be modelled [49,50] and that it assumes a pure single-mode propagation. However, note that the aim of these numerical simulations is to qualitatively reproduce the observed SC generation. Indeed, several parameters of the TiO2 waveguide such as its dispersive properties or the exact value of the nonlinear coefficient have not been experimentally assessed yet and would deserve a devoted study that is well beyond the scope of the present letter. The exact physical features of the optical pulse entering into the waveguide are not accurately known but it can be considered as an initial 90-fs transformed-limited hyperbolic-secant pulse centred at 1.64 µm (as shown in Figure 2c). For the qualitative discussion, our numerical simulations used a nonlinear index value (n2 = 0.16 × 10⁻¹⁸ m²/W) and a Raman coefficient inferred from the literature [24], which leads to a nonlinear parameter about 1.2 W−1·m−1.
In the presence of higher-order dispersion, a soliton sheds away energy into radiative dispersive waves (DWs). The frequencies of those DWs can be determined by the following phase matching condition [47]:
where ωsol is the angular frequency of the soliton and Psol its peak power. The calculated phase matching curves are shown in Figure 5a. These curves help to understand the results of the simulations summarized in Figure 5b which have to be compared with spectra recorded and depicted in Figure 4. In particular, the resulting supercontinuum is bounded by two dispersive waves located around 1.2 and 2.3 µm. Note that the SC bandwidth can be controlled by a suitable engineering of the waveguide dispersion. Here the main experimental SC features and evolution as a function of input energy are well predicted from the GNLSE simulations. In particular, the soliton frequency-shift towards 1.9 µm wavelength as well as the position and the blue-shift of the dispersive waves are indeed well reproduced. The optical signal to noise ratio being much higher in our simulations compared to our experiments, we find spectral features in Figure 5 that can be only hardly observed in the experimental results. Nevertheless, we conclude that our approach based on the GNLSE captures most of the dominant spectral properties of the SC generated in our TiO2 waveguides.
4.3. Discussion
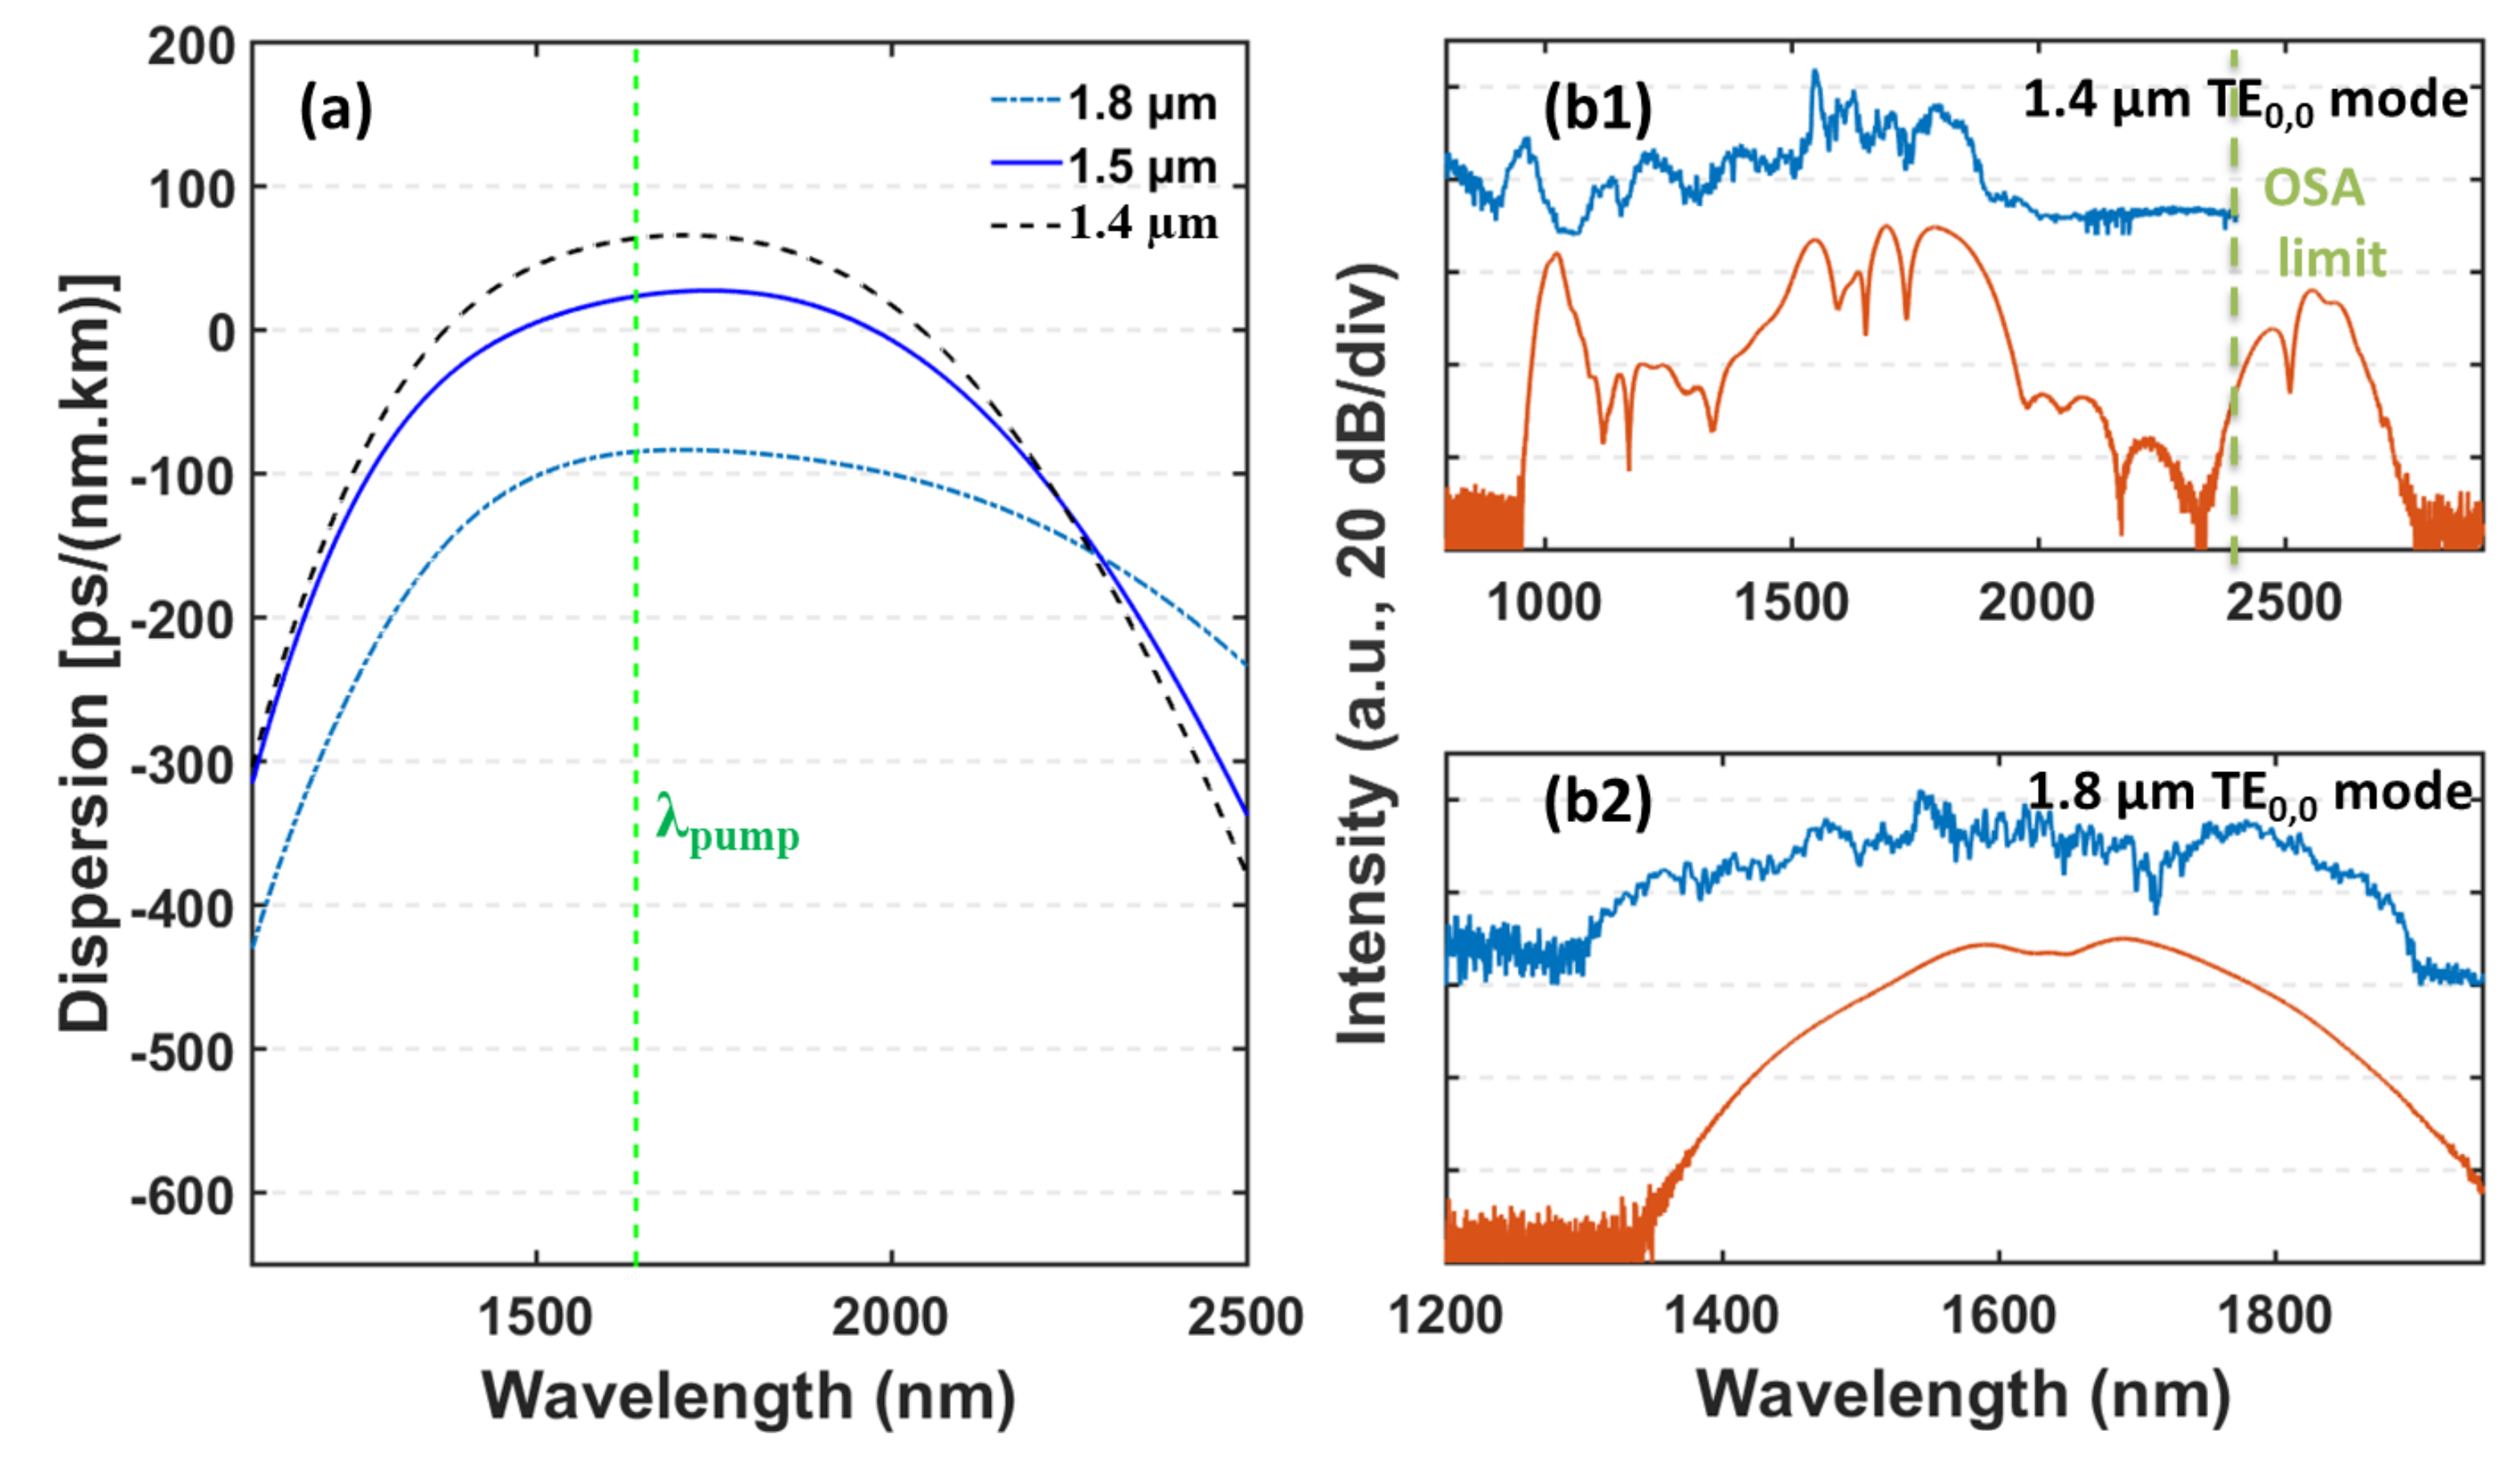
Figure 6a shows the dispersion curves of the fundamental TE0,0 mode for different widths of the waveguide. Figure 6b displays the experimental spectrum obtained in two other TiO2 waveguides with distinct widths as well as the corresponding numerical simulations. Once again, a good agreement is obtained. The broader waveguide (width = 1.8 µm) exhibits an all-normal dispersion regime. Therefore, the self-phase modulation and wave-breaking dynamics are dominant effects governing the spectrum expansion [2,51,52].
On the contrary, the 1.4-µm-wide waveguide exhibits a similar dispersion curve as the 1.5-µm-wide waveguide but the dispersion is now shifted to higher values, which increases the gap between the two zero-dispersion wavelengths. As a consequence, the dispersive waves are also moved away: the blue edge of the supercontinuum is now shifted below 1 µm leading to more than an octave SC generation (at −20 dB). Those results (Figure 6b1) show that with a dispersion engineered waveguide, a two-octave spanning SC and larger is conceivable.
5. Conclusions
In this work, we have reported the first experimental demonstration of an octave spanning supercontinuum generation in a compact TiO2 optical waveguide. Following soliton-based nonlinear dynamics, the spectral broadening of femtosecond pulses at 1.64 µm leads to the generation of new wavelengths from the visible up to 1.92 µm, that is, this involves spectral components covering more than an octave. Both experiments and simulations also stress the crucial importance of the geometrical parameters of the waveguide structure that governs the dispersion properties and ultimately the supercontinuum extent. This study therefore confirms the strong potential of TiO2 for nonlinear applications. With further reduction of the propagation losses combined with more advanced dispersion engineering of the waveguide and optimization of the device length, noticeable enhancements of the resulting SC source are expected and decade spanning SC could potentially be reached. Using TiO2 in amorphous phase can also be a source of improvement. The use of wideband coupling grating structures such as reported in [42] that are able to handle femtosecond pulses could also improve the stability of the source and increase the power coupled within the waveguide.
Compared to other widely used materials, its transparency in the visible also makes TiO2 appealing for pumping with cost-efficient fibre laser sources operating around ytterbium typical wavelength (1.06 µm) as well as the versatile titanium-sapphire ultrashort lasers. Other intrinsic advantages of TiO2 such as the absence of TPA and its thermal stability are also critical to enable the efficient generation of continuum from sources delivering longer picosecond or nanosecond pulses, which paves the way for future theoretical and experimental investigations.
Acknowledgments
This work is financially supported by PARI PHOTCOM Région Bourgogne, by Carnot Arts Institute (PICASSO 2.0 project), by the Institut Universitaire de France, by FEDER-FSE Bourgogne 2014/2020 and by the the french “Investissements d’Avenir” program, project ISITE-BFC (contract ANR-15-IDEX-0003). The research work has benefited from the PICASSO experimental platform and the ARCEN-CARNOT nanofabrication facilities of the University of Burgundy.
Author Contributions
K.H., C.F., J.F. and B.K. conceived, designed and performed the experiment of supercontinuum generation; K.H., J.A., L.M. and J.-C.W. fabricated and took part in the characterization of the optical waveguides. M.L., K.H. and J.-C.W. were involved in the numerical modelling and design of the component. All the authors contribute to the analysis of the results and to the writing of the manuscript. K.H. supervised the project.
Conflicts of Interest
The authors declare no conflict of interest.
References
- Alfano, R.R. The Supercontinuum Laser Source: The Ultimate White Light; Springer: New York, NY, USA, 2016. [Google Scholar]
- Dudley, J.M.; Genty, G.; Coen, S. Supercontinuum generation in photonic crystal fibre. Rev. Mod. Phys. 2006, 78, 1135–1184. [Google Scholar] [CrossRef]
- Dudley, J.M.; Taylor, J.R. Supercontinuum Generation in Optical Fibers; Cambridge University Press: Cambridge, UK, 2010. [Google Scholar]
- Jiang, X.; Joly, N.Y.; Finger, M.A.; Babic, F.; Wong, G.K.L.; Travers, J.C.; Russell, P.S.J. Deep-ultraviolet to mid-infrared supercontinuum generated in solid-core ZBLAN photonic crystal fibre. Nat. Photonics 2015, 9, 133–139. [Google Scholar] [CrossRef]
- Savelli, I.; Mouawad, O.; Fatome, J.; Kibler, B.; Désévédavy, F.; Gadret, G.; Jules, J.-C.; Bony, P.-Y.; Kawashima, H.; Gao, W.; et al. Mid-infrared 2000-nm bandwidth supercontinuum generation in suspended-core microstructured Sulfide and Tellurite optical fibres. Opt. Express 2012, 20, 27083–27093. [Google Scholar] [CrossRef] [PubMed]
- Møller, U.; Yu, Y.; Kubat, I.; Petersen, C.R.; Gai, X.; Brilland, L.; Méchin, D.; Caillaud, C.; Troles, J.; Luther-Davies, B.; et al. Multi-milliwatt mid-infrared supercontinuum generation in a suspended core chalcogenide fibre. Opt. Express 2015, 23, 3282–3291. [Google Scholar] [CrossRef] [PubMed]
- Cheng, T.; Nagasaka, K.; Tuan, T.H.; Xue, X.; Matsumoto, M.; Tezuka, H.; Suzuki, T.; Ohishi, Y. Mid-infrared supercontinuum generation spanning 20 to 151 μm in a chalcogenide step-index fibre. Opt. Lett. 2016, 41, 2117–2120. [Google Scholar] [CrossRef] [PubMed]
- Domachuk, P.; Wolchover, N.A.; Cronin-Golomb, M.; Wang, A.; George, A.K.; Cordeiro, C.M.B.; Knight, J.C.; Omenetto, F.G. Over 4000 nm bandwidth of mid-IR supercontinuum generation in sub-centimeter segments of highly nonlinear tellurite PCFs. Opt. Express 2008, 16, 7161–7168. [Google Scholar] [CrossRef] [PubMed]
- Hsieh, I.-W.; Chen, X.; Liu, X.; Dadap, J.I.; Panoiu, N.C.; Chou, C.-Y.; Xia, F.; Green, W.M.; Vlasov, Y.A.; Osgood, R.M. Supercontinuum generation in silicon photonic wires. Opt. Express 2007, 15, 15242–15249. [Google Scholar] [CrossRef] [PubMed]
- Kuyken, B.; Liu, X.; Osgood, R.M., Jr.; Baets, R.; Roelkens, G.; Green, W.M.J. Mid-infrared to telecom-band supercontinuum generation in highly nonlinear silicon-on-insulator wire waveguides. Opt. Express 2011, 19, 20172–20181. [Google Scholar] [CrossRef] [PubMed]
- Singh, N.; Xin, M.; Vermeulen, D.; Shtyrkova, K.; Li, N.; Callahan, P.T.; Magden, E.S.; Ruocco, A.; Fahrenkopf, N.; Baiocco, C.; et al. Octave-spanning coherent supercontinuum generation in silicon on insulator from 1.06 μm to beyond 2.4 μm. Light Sci. Appl. 2018, 7, 17131. [Google Scholar] [CrossRef]
- Ettabib, M.A.; Xu, L.; Bogris, A.; Kapsalis, A.; Belal, M.; Lorent, E.; Labeye, P.; Nicoletti, S.; Hammani, K.; Syvridis, D.; et al. Broadband telecom to mid-infrared supercontinuum generation in a dispersionengineered silicon germanium waveguide. Opt. Lett. 2015, 40, 4118–4121. [Google Scholar] [CrossRef] [PubMed]
- Lacava, C.; Ettabib, M.; Petropoulos, P. Nonlinear Silicon Photonic Signal Processing Devices for Future Optical Networks. Appl. Sci. 2017, 7, 103. [Google Scholar] [CrossRef]
- Hammani, K.; Ettabib, M.A.; Bogris, A.; Kapsalis, A.; Syvridis, D.; Brun, M.; Labeye, P.; Nicoletti, S.; Petropoulos, P. Towards nonlinear conversion from mid- to near-infrared wavelengths using Silicon Germanium waveguides. Opt. Express 2014, 22, 9667–9674. [Google Scholar] [CrossRef] [PubMed]
- Liu, X.; Pu, M.; Zhou, B.; Krückel, C.J.; Fülöp, A.; Torres-Company, V.; Bache, M. Octave-spanning supercontinuum generation in a silicon-rich nitride waveguide. Opt. Lett. 2016, 41, 1–4. [Google Scholar]
- Halir, R.; Okawachi, Y.; Levy, J.S.; Foster, M.A.; Lipson, M.; Gaeta, A.L. Ultrabroadband supercontinuum generation in a CMOS-compatible platform. Opt. Lett. 2012, 37, 1685–1687. [Google Scholar] [CrossRef] [PubMed]
- Okawachi, Y.; Saha, K.; Levy, J.S.; Wen, Y.H.; Lipson, M.; Gaeta, A.L. Octave-spanning frequency comb generation in a silicon nitride chip. Opt. Lett. 2011, 36, 3398–3400. [Google Scholar] [CrossRef] [PubMed]
- Johnson, A.R.; Mayer, A.S.; Klenner, A.; Luke, K.; Lamb, E.S.; Lamont, M.R.E.; Joshi, C.; Okawachi, Y.; Wise, F.W.; Lipson, M.; et al. Octave-spanning coherent supercontinuum generation in a silicon nitride waveguide. Opt. Lett. 2015, 40, 5117–5120. [Google Scholar] [CrossRef] [PubMed]
- Feigel, B.; Castelló-Lurbe, D.; Thienpont, H.; Vermeulen, N. Opportunities for visible supercontinuum light generation in integrated diamond waveguides. Opt. Lett. 2017, 42, 3804–3807. [Google Scholar] [CrossRef] [PubMed]
- Lamont, M.R.; Luther-Davies, B.; Choi, D.-Y.; Madden, S.; Eggleton, B.J. Supercontinuum generation in dispersion engineered highly nonlinear (γ = 10 /W/m) As2S3 chalcogenide planar waveguide. Opt. Express 2008, 16, 14938–14944. [Google Scholar] [CrossRef] [PubMed]
- Dave, U.D.; Ciret, C.; Gorza, S.-P.; Combrie, S.; de Rossi, A.; Raineri, F.; Roelkens, G.; Kuyken, B. Dispersive-wave-based octave-spanning supercontinuum generation in InGaP membrane waveguides on a silicon substrate. Opt. Lett. 2015, 40, 3584–3587. [Google Scholar] [CrossRef] [PubMed]
- Pu, M.; Ottaviano, L.; Semenova, E.; Yvind, K. Efficient frequency comb generation in AlGaAs-on-insulator. Optica 2016, 3, 823–826. [Google Scholar] [CrossRef]
- Kischkat, J.; Peters, S.; Gruska, B.; Semtsiv, M.; Chashnikova, M.; Klinkmüller, M.; Fedosenko, O.; Machulik, S.; Aleksandrova, A.; Monastyrskyi, G.; et al. Mid-infrared optical properties of thin films of aluminum oxide, titanium dioxide, silicon dioxide, aluminum nitride, and silicon nitride. Appl. Opt. 2012, 51, 6789–6798. [Google Scholar] [CrossRef] [PubMed]
- Evans, C.C.; Shtyrkova, K.; Bradley, J.D.B.; Reshef, O.; Ippen, E.; Mazur, E. Spectral broadening in anatase titanium dioxide waveguides at telecommunication and near-visible wavelengths. Opt. Express 2013, 21, 18582–18591. [Google Scholar] [CrossRef] [PubMed]
- Guan, X.; Hu, H.; Oxenløwe, L.K.; Frandsen, L.H. Compact titanium dioxide waveguides with high nonlinearity at telecommunication wavelengths. Opt. Express 2018, 26, 1055–1063. [Google Scholar] [CrossRef] [PubMed]
- Qiu, F.; Spring, A.M.; Yokoyama, S. Athermal and high-Q hybrid TiO2-Si3N4 ring resonator via an etching-free fabrication technique. ACS Photonics 2015, 2, 405–409. [Google Scholar] [CrossRef]
- Reshef, O.; Shtyrkova, K.; Moebius, M.G.; Griesse-Nascimento, S.; Spector, S.; Evans, C.C.; Ippen, E.; Mazur, E. Polycrystalline anatase titanium dioxide microring resonators with negative thermo-optic coefficient. J. Opt. Soc. Am. B 2015, 32, 2288–2293. [Google Scholar] [CrossRef]
- Guha, B.; Cardenas, J.; Lipson, M. Athermal silicon microring resonators with titanium oxide cladding. Opt. Express 2013, 21, 26557–26563. [Google Scholar] [CrossRef] [PubMed]
- Hadjoub, I.; Touam, T.; Chelouche, A.; Atoui, M.; Solard, J.; Chakaroun, M.; Fischer, A.; Boudrioua, A.; Peng, L.H. Post-deposition annealing effect on RF-sputtered TiO2 thin-film properties for photonic applications. Appl. Phys. A Mater. Sci. Process. 2016, 122, 1–8. [Google Scholar] [CrossRef]
- Quidant, R.; Weeber, J.-C.; Dereux, A.; Peyrade, D.; Chen, Y.; Girard, C. Near-field observation of evanescent light wave coupling in subwavelength optical waveguides. Europhys. Lett. 2002, 57, 191–197. [Google Scholar] [CrossRef]
- Choy, J.T.; Bradley, J.D.B.; Deotare, P.B.; Burgess, I.B.; Evans, C.C.; Mazur, E.; Lon, M. Integrated TiO2 resonators for visible photonics. Opt. Lett. 2012, 37, 539–541. [Google Scholar] [CrossRef] [PubMed]
- Giudicatti, S.; Marz, S.M.; Soler, L.; Madani, A.; Jorgensen, M.R.; Sanchez, S.; Schmidt, O.G. Photoactive rolled-up TiO2 microtubes: fabrication, characterization and applications. J. Mater. Chem. C 2014, 2, 5892–5901. [Google Scholar] [CrossRef] [PubMed]
- Lamy, M.; Finot, C.; Fatome, J.; Arocas, J.; Weeber, J.-C.; Hammani, K. Demonstration of High-Speed Optical Transmission at 2 µm in Titanium Dioxide Waveguides. Appl. Sci. 2017, 7, 631. [Google Scholar] [CrossRef]
- Madani, A.; Harazim, S.M.; Quiñones, V.A.B.; Kleinert, M.; Finn, A.; Naz, E.S.G.; Ma, L.; Schmidt, O.G. Optical microtube cavities monolithically integrated on photonic chips for optofluidic sensing. Opt. Lett. 2017, 42, 486–489. [Google Scholar] [CrossRef] [PubMed]
- Evans, C.C.; Liu, C.; Suntivich, J. TiO2 Nanophotonic Sensors for Efficient Integrated Evanescent Raman Spectroscopy. ACS Photonics 2016, 3, 1662–1669. [Google Scholar] [CrossRef]
- Moebius, M.G.; Herrera, F.; Griesse-Nascimento, S.; Reshef, O.; Evans, C.C.; Guerreschi, G.G.; Aspuru-Guzik, A.; Mazur, E. Efficient photon triplet generation in integrated nanophotonic waveguides. Opt. Express 2016, 24, 9932–9954. [Google Scholar] [CrossRef] [PubMed]
- Abe, K.; Teraoka, E.Y.M.; Kita, T.; Yamada, H. Nonlinear optical waveguides with rutile TiO2. Proc. SPIE 2011, 79401. [Google Scholar] [CrossRef]
- Ma, Y.-J.; Lu, F.; Xiang, B.-X.; Zhao, J.-L.; Ruan, S.-C. Fabrication of TiO2 thin films with both anatase and rutile structures together using the ion-implantation method. Opt. Mater. Express 2018, 8, 532–540. [Google Scholar] [CrossRef]
- Jiang, L.; Evans, C.C.; Reshef, O.; Mazur, E. Optimizing anatase-TiO2 deposition for low-loss planar waveguides. Proc. SPIE 2013, 8626. [Google Scholar] [CrossRef]
- Bradley, J.D.B.; Evans, C.C.; Choy, J.T.; Reshef, O.; Parag, B.; Parsy, F.; Phillips, K.C.; Lon, M.; Mazur, E. Submicrometer-wide amorphous and polycrystalline anatase TiO2 waveguides for microphotonic devices. Opt. Express 2012, 20, 8336–8346. [Google Scholar] [CrossRef] [PubMed]
- Foster, M.A.; Moll, K.D.; Gaeta, A.L. Optimal waveguide dimensions for nonlinear interactions. Opt. Express 2004, 12, 2880–2887. [Google Scholar] [CrossRef] [PubMed]
- Lamy, M.; Hammani, K.; Arocas, J.; Finot, C.; Weeber, J.-C. Broadband etching-free metal grating couplers embedded in titanium dioxide waveguides. Opt. Lett. 2017, 42, 2778–2781. [Google Scholar] [CrossRef] [PubMed]
- Agrawal, G.P. Nonlinear Fiber Optics; Elsevier Science: Amsterdam, The Netherlands, 2013. [Google Scholar]
- Evans, C.C.; Liu, C.; Suntivich, J. Low-loss titanium dioxide waveguides and resonators using a dielectric lift-off fabrication process. Opt. Express 2015, 23, 11160–11169. [Google Scholar] [CrossRef] [PubMed]
- Evans, C.C.; Shtyrkova, K.; Reshef, O.; Moebius, M.; Bradley, J.D.B.; Griesse-Nascimento, S.; Ippen, E.; Mazur, E. Multimode phase-matched third-harmonic generation in sub-micrometer-wide anatase TiO2 waveguides. Opt. Express 2015, 23, 7832–7841. [Google Scholar] [CrossRef] [PubMed]
- Skryabin, D.V.; Gorbach, A.V. Colloquium: Looking at a soliton through the prism of optical supercontinuum. Rev. Mod. Phys. 2010, 82, 1287–1299. [Google Scholar] [CrossRef]
- Mussot, A.; Beaugeois, M.; Bouazaoui, M.; Sylvestre, T. Tailoring CW supercontinuum generation in microstructured fibers with two-zero dispersion wavelengths. Opt. Express 2007, 15, 11553–11563. [Google Scholar] [CrossRef] [PubMed]
- Porcel, M.A.G.; Schepers, F.; Epping, J.P.; Hellwig, T.; Hoekman, M.; Heideman, R.G.; van der Slot, P.J.M.; Lee, C.J.; Schmidt, R.; Bratschitsch, R.; et al. Two-octave spanning supercontinuum generation in stoichiometric silicon nitride waveguides pumped at telecom wavelengths. Opt. Express 2017, 25, 1542–1554. [Google Scholar] [CrossRef] [PubMed]
- Kibler, B.; Fischer, R.; Genty, G.; Neshev, D.N.; Dudley, J.M. Simultaneous fs pulse spectral broadening and third harmonic generation in highly nonlinear fibre: Experiments and simulations. Appl. Phys. B 2008, 91, 349–352. [Google Scholar] [CrossRef]
- Genty, G.; Kinsler, P.; Kibler, B.; Dudley, J.M. Nonlinear envelope equation modeling of sub-cycle dynamics and harmonic generation in nonlinear waveguides. Opt. Express 2007, 15, 5382–5387. [Google Scholar] [CrossRef] [PubMed]
- Finot, C.; Kibler, B.; Provost, L.; Wabnitz, S. Beneficial impact of wave-breaking for coherent continuum formation in normally dispersive nonlinear fibers. J. Opt. Soc. Am. B 2008, 25, 1938–1948. [Google Scholar] [CrossRef]
- Heidt, A.M. Pulse preserving flat-top supercontinuum generation in all-normal dispersion photonic crystal fibers. J. Opt. Soc. Am. B 2010, 27, 550–559. [Google Scholar] [CrossRef]
Figure 1.
(a) Scanning Electron Microscope image of the cleaved strip TiO2 waveguide (b1,b2) Corresponding mode profiles at 1640 nm and associated effective index for the first transverse electric (TE) and transverse magnetic (TM) respectively.
Figure 1.
(a) Scanning Electron Microscope image of the cleaved strip TiO2 waveguide (b1,b2) Corresponding mode profiles at 1640 nm and associated effective index for the first transverse electric (TE) and transverse magnetic (TM) respectively.

Figure 2.
(a) Experimental setup involved for generation of supercontinuum in TiO2 waveguides. (b1) Sketch of the waveguide and butt-coupling thanks to lensed fibres and (b2) the corresponding optical microscope image of the taper used for the coupling. (c) Spectrum of the injected soliton pulse centred at 1640 nm compared with the spectrum of a 90 fs sech2 pulse (c).
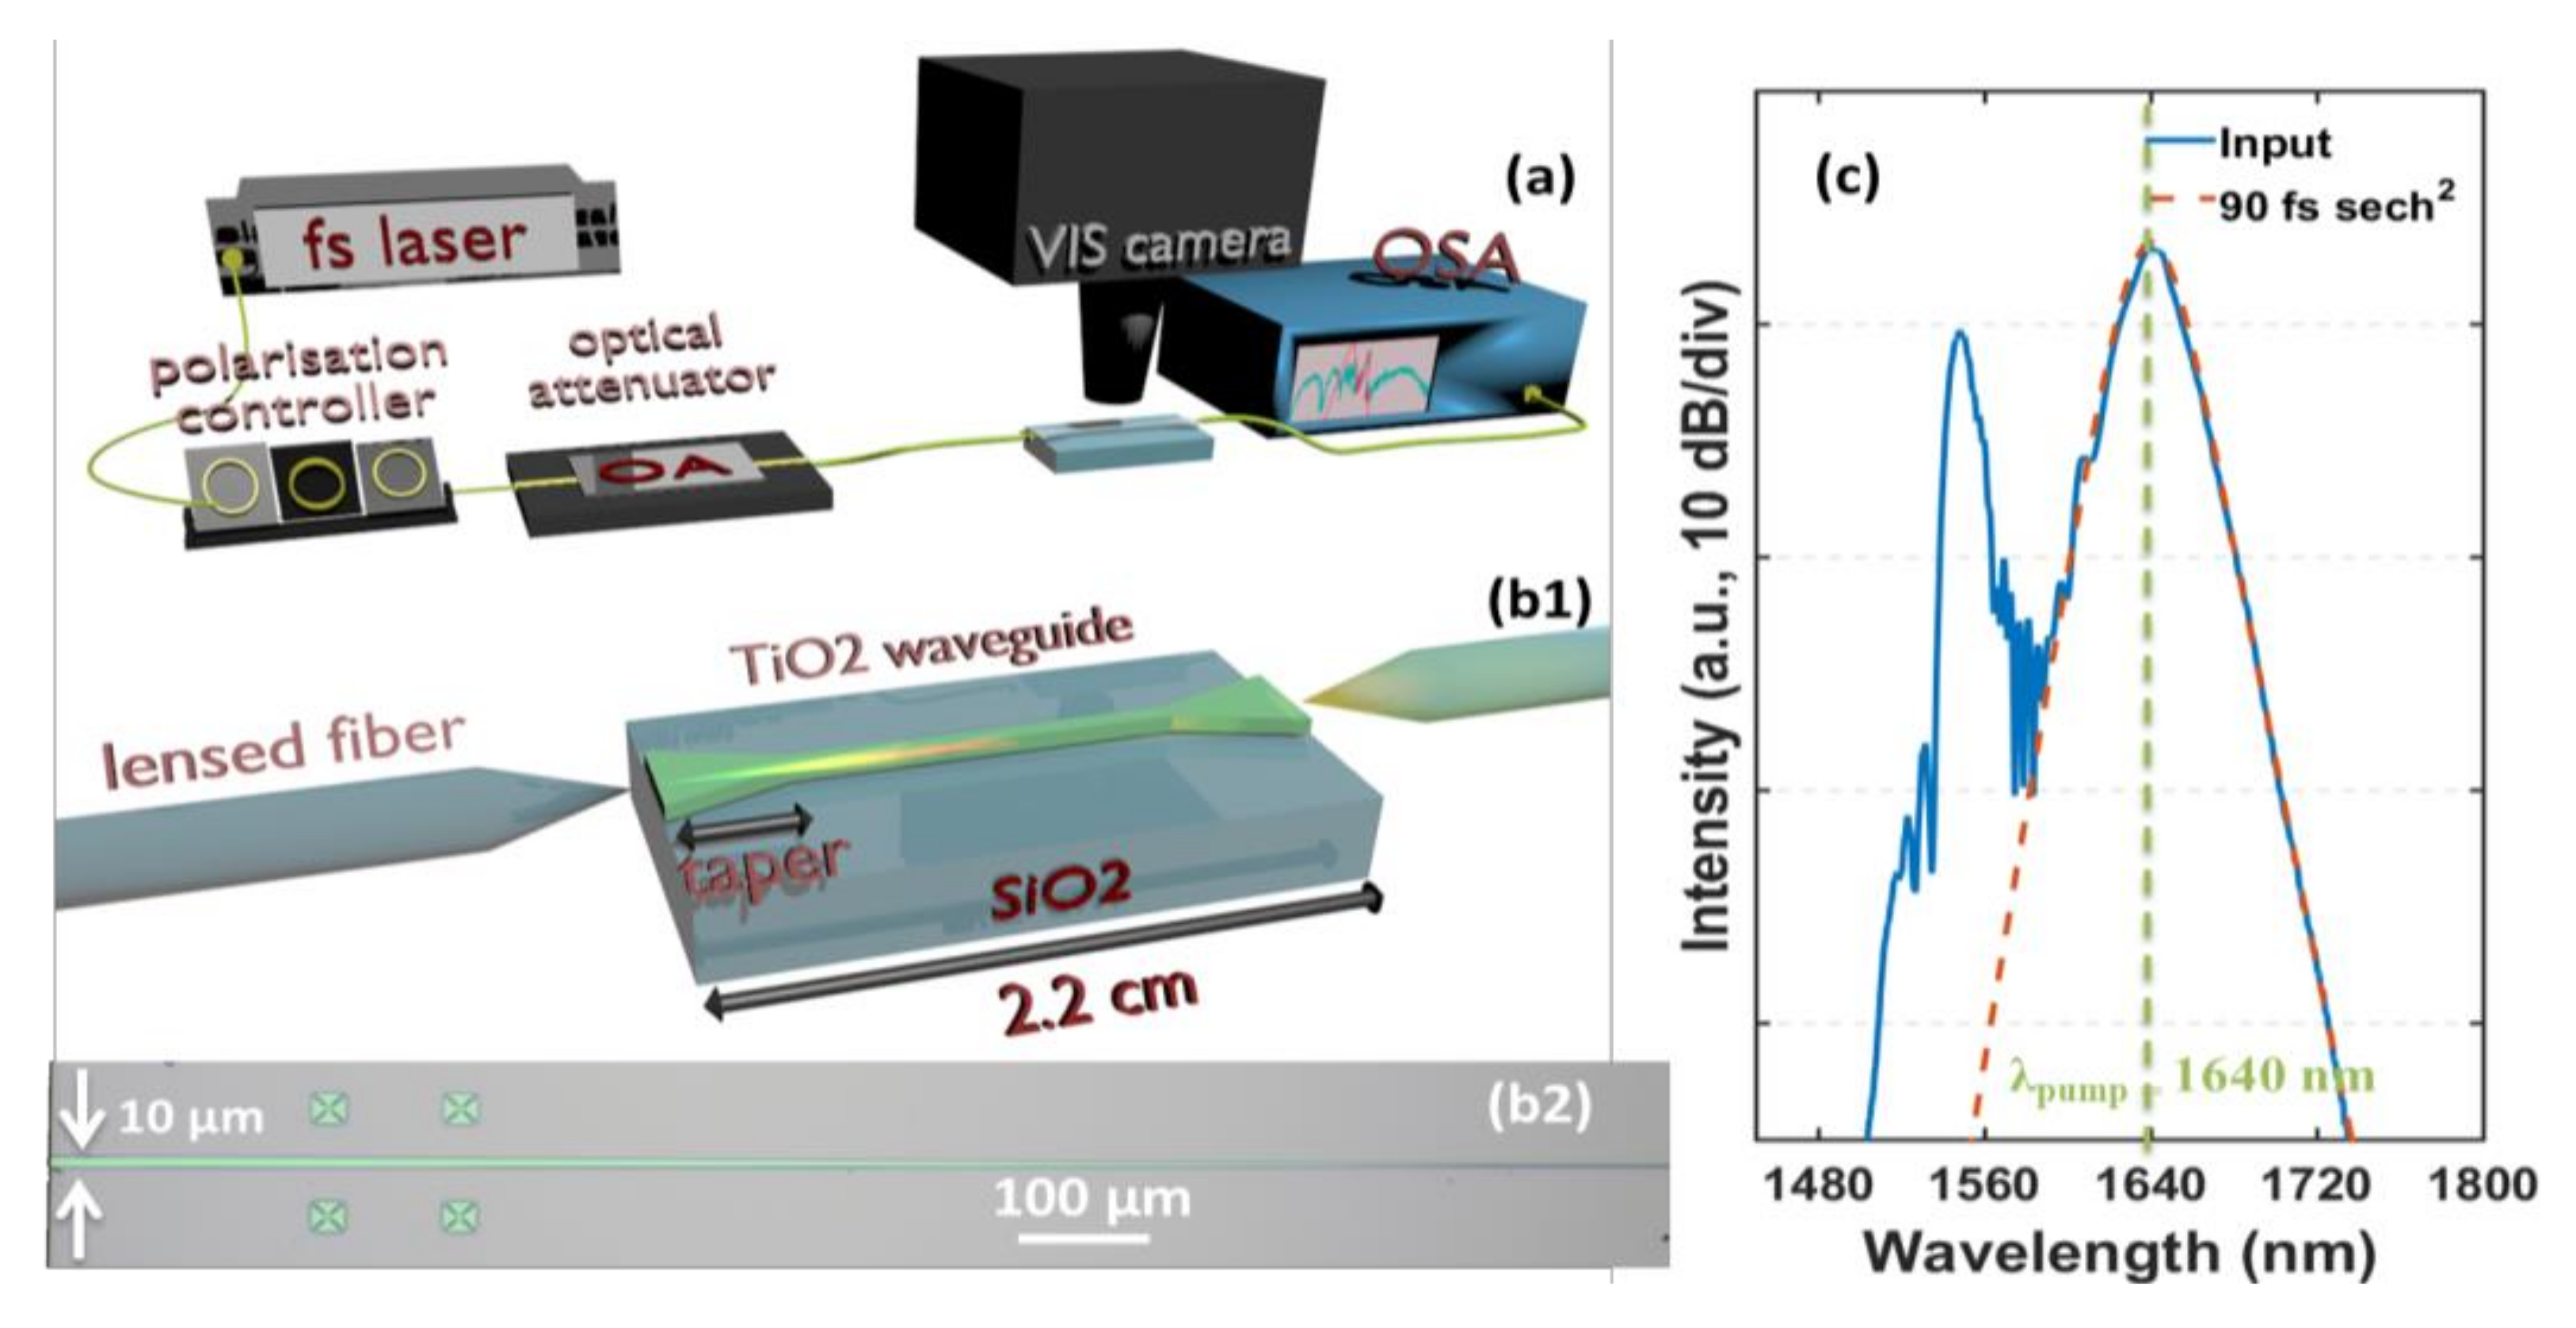
Figure 3.
(a) Optical supercontinuum recorded at the output of the 2.2-cm-long 1.5-µm-wide TiO2 waveguide (blue solid line) compared to the input pulse spectrum (red solid line). The overall spectrum is reconstructed from the overlap of the spectra obtained from both optical spectrum analysers of our setup. (b) Photography of the visible light emitted from the waveguide. (c) Zoom of the emitted visible light.

Figure 4.
(a) Dispersion profiles of the fundamental TE0,0 and TM0,0 modes of the 1.5 µm wide waveguide. The material dispersion is plotted with solid black line. (b) Optical supercontinua measured at the output of the TiO2 waveguide for various coupled energy conditions. For the better reading of the figure, the various spectra were vertically offset. The part of the spectrum ranging from 2200 nm to 2400 nm has been shaded because residual contribution of spurious double-order mode may contribute to the spectrum.

Figure 5.
(a) Phase matching curve for a pump wavelength at 1.64 µm (initial pump) and at 1.82 µm (shifted soliton). (b) Numerical simulations of supercontinuum generation obtained in a 2.2-cm-long 1.5-µm-wide TiO2 waveguides for different input energies of the femtosecond pulses. For the clarity of the figure, the various spectra were vertically offset. The areas corresponding to the phase matched dispersive waves are coloured.
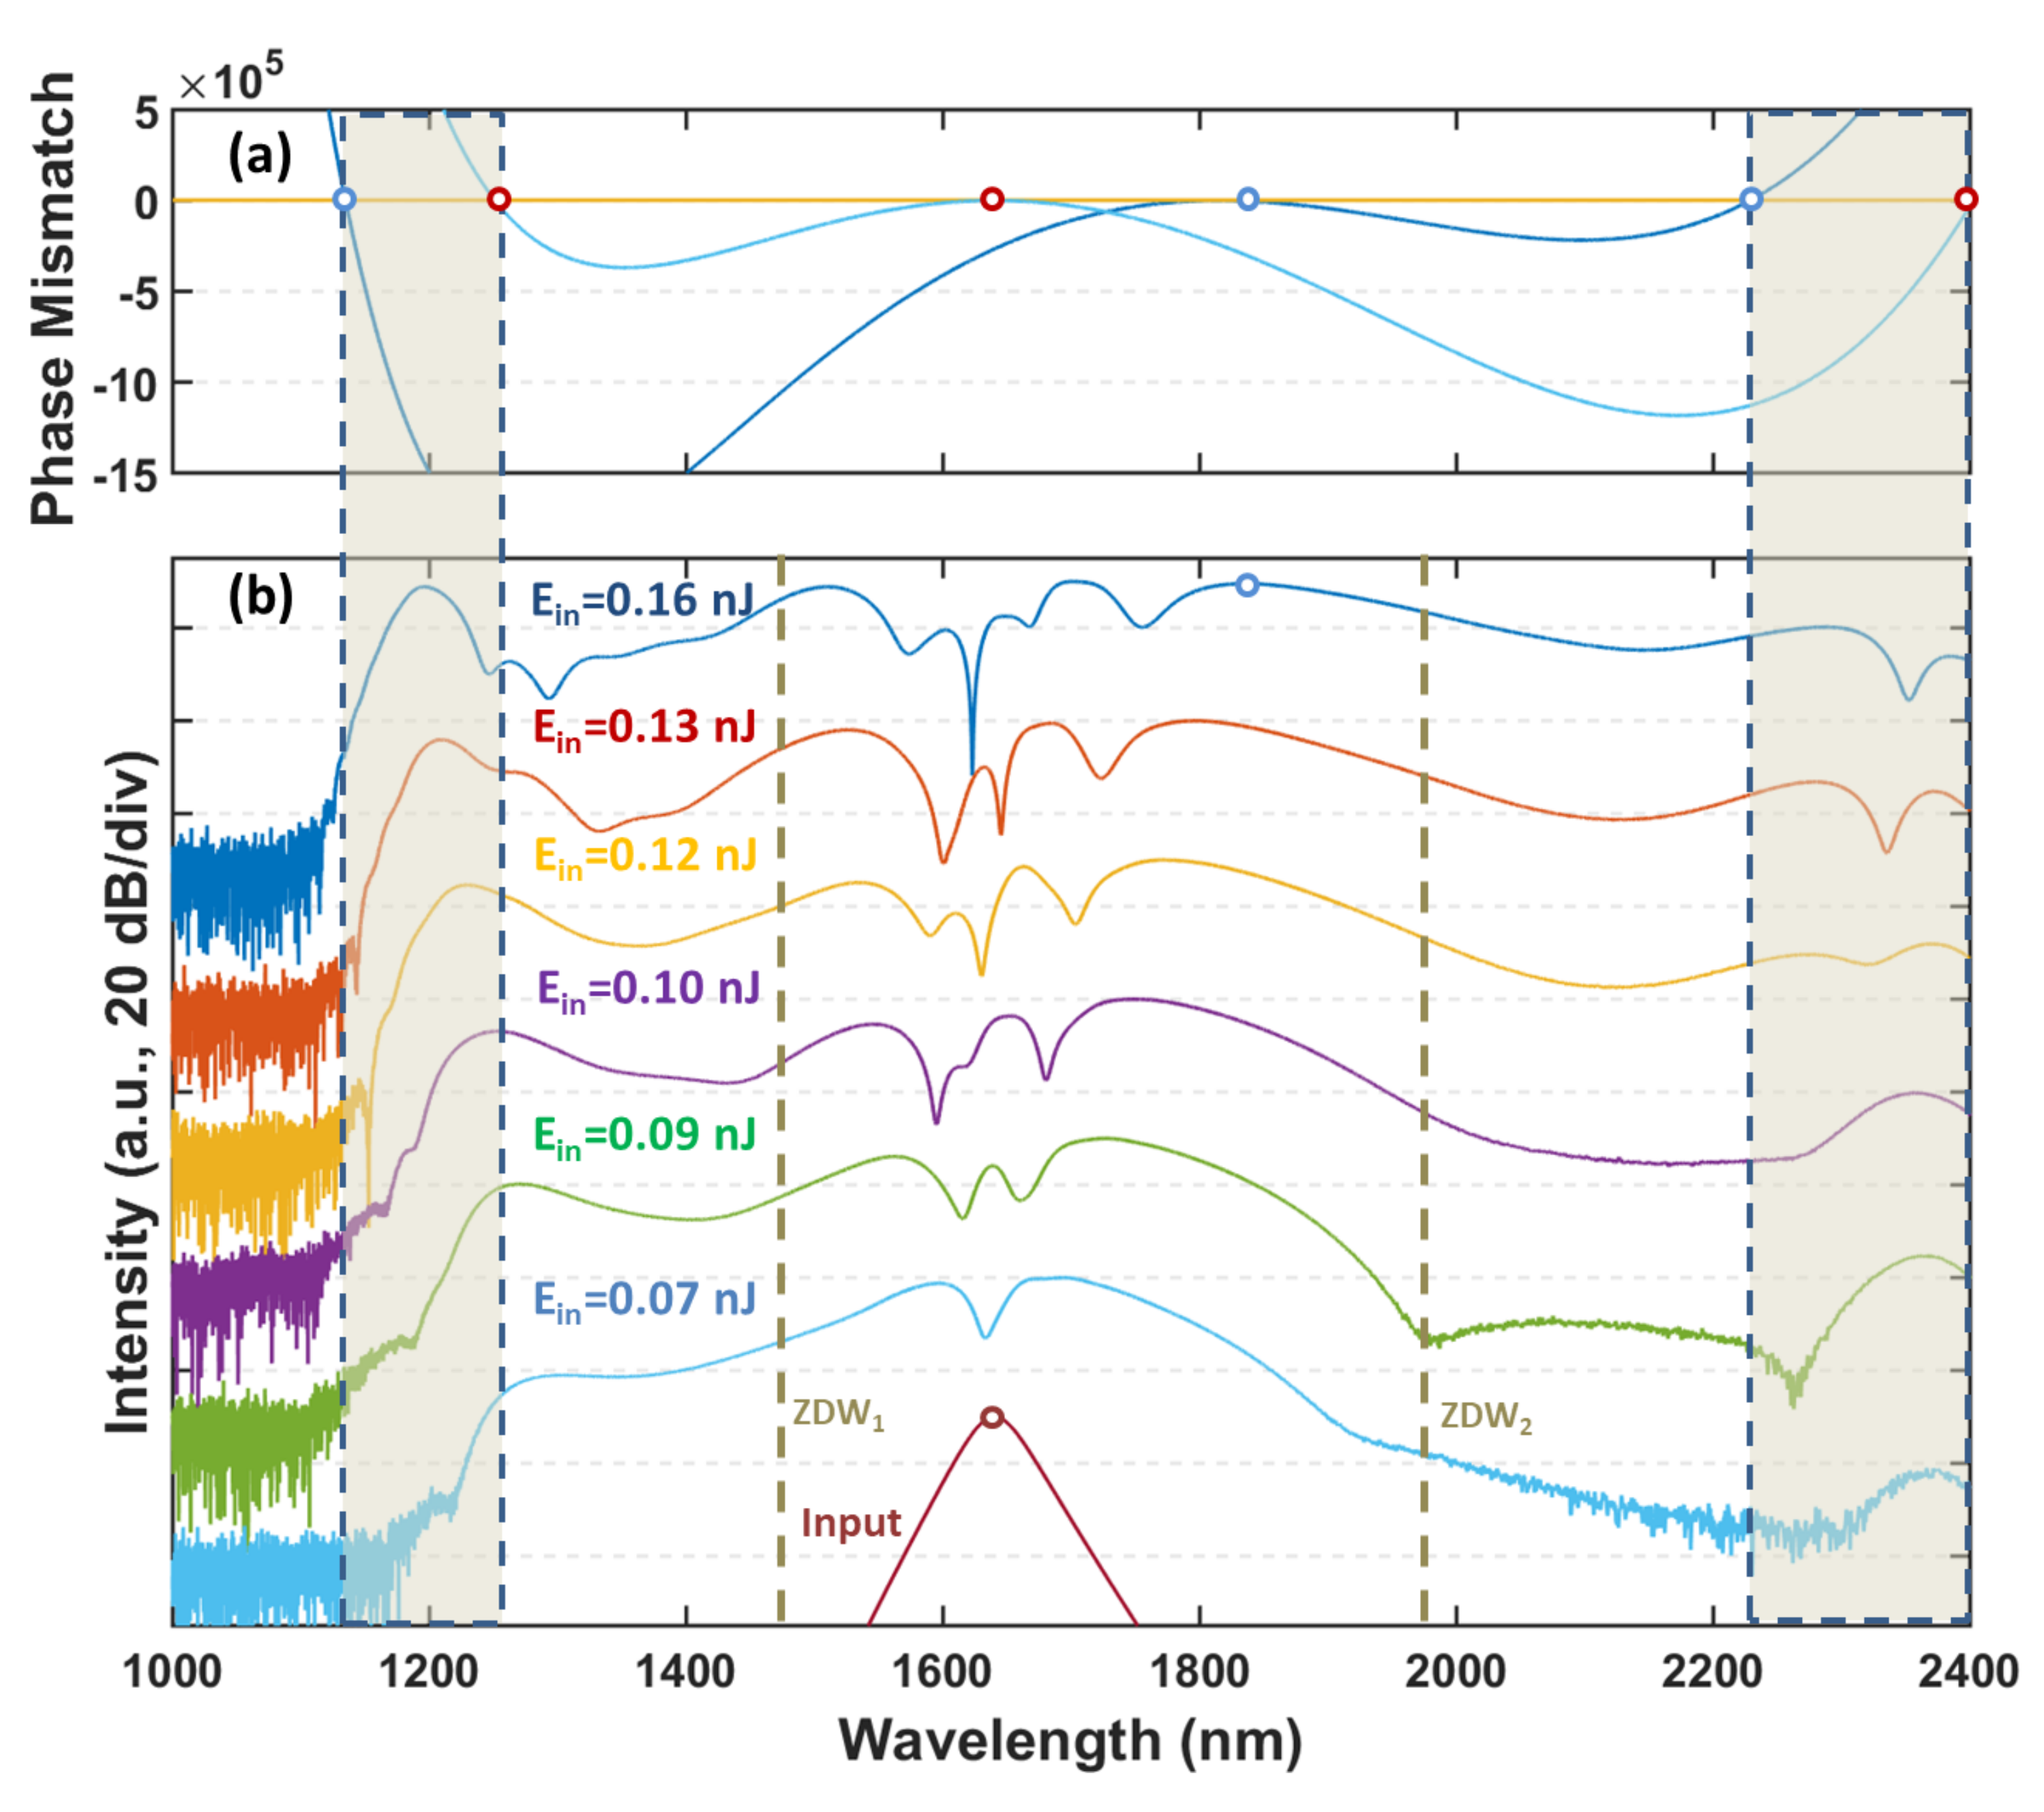
Figure 6.
(a) Dispersion profiles of the fundamental TE0,0 mode of the waveguide for different widths (1.4, 1.5 and 1.8 µm). (b) Experimental spectra (blue lines) and corresponding numerical simulations (red lines) for (b1) 1.4 µm and (b2) 1.8 µm. For the clarity of the figure, the various spectra were vertically offset.
© 2018 by the authors. Licensee MDPI, Basel, Switzerland. This article is an open access article distributed under the terms and conditions of the Creative Commons Attribution (CC BY) license (http://creativecommons.org/licenses/by/4.0/).
Share and Cite
MDPI and ACS Style
Hammani, K.; Markey, L.; Lamy, M.; Kibler, B.; Arocas, J.; Fatome, J.; Dereux, A.; Weeber, J.-C.; Finot, C. Octave Spanning Supercontinuum in Titanium Dioxide Waveguides. Appl. Sci. 2018, 8, 543. https://doi.org/10.3390/app8040543
AMA Style
Hammani K, Markey L, Lamy M, Kibler B, Arocas J, Fatome J, Dereux A, Weeber J-C, Finot C. Octave Spanning Supercontinuum in Titanium Dioxide Waveguides. Applied Sciences. 2018; 8(4):543. https://doi.org/10.3390/app8040543
Chicago/Turabian StyleHammani, Kamal, Laurent Markey, Manon Lamy, Bertrand Kibler, Juan Arocas, Julien Fatome, Alain Dereux, Jean-Claude Weeber, and Christophe Finot. 2018. "Octave Spanning Supercontinuum in Titanium Dioxide Waveguides" Applied Sciences 8, no. 4: 543. https://doi.org/10.3390/app8040543
Note that from the first issue of 2016, this journal uses article numbers instead of page numbers. See further details here.