Chemical and Molecular Variations in Commercial Epoxide Photoresists for X-ray Lithography
by
 , ,
, ,
Vitor Vlnieska
1,2,*, 
Margarita Zakharova
1,
Martin Börner
1,
Klaus Bade
1,
Jürgen Mohr
1 and
Danays Kunka
1 1
Karlsruhe Institute of Technology (KIT), Institute of Microstructure Technology, Hermann-von-Helmholtz-Platz 1, 76344 Eggenstein-Leopoldshafen, Germany
2
Chemistry Department, Federal University of Paraná, Rua Coronel Francisco Heráclito dos Santos, 100, Jardim das Américas, 81531-980 Curitiba, PR, Brazil
*
Author to whom correspondence should be addressed.
Appl. Sci. 2018, 8(4), 528; https://doi.org/10.3390/app8040528
Submission received: 18 December 2017
/
Revised: 1 March 2018
/
Accepted: 28 March 2018
/
Published: 30 March 2018
(This article belongs to the Section Chemical and Molecular Sciences)
Abstract
:Featured Application
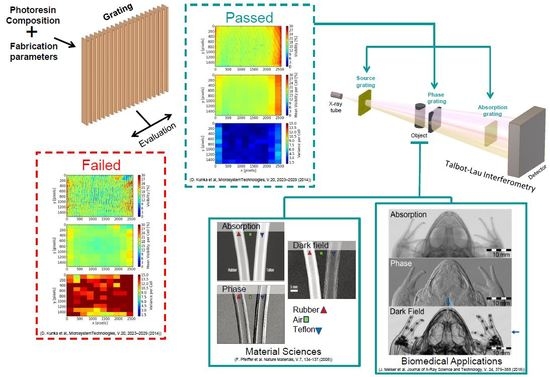
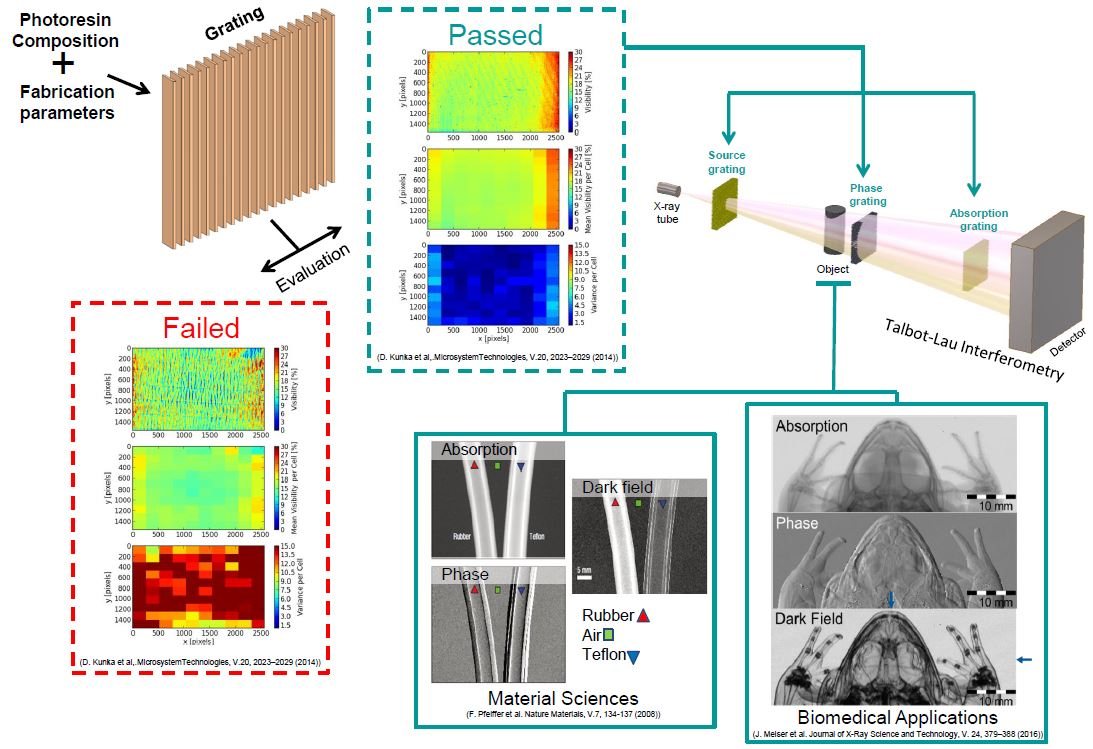
The characterization of negative photoresists before the application on LIGA process can be a key factor to save time, money and enhance the reproducibility of the main optical components fabricated to be used in techniques such as Talbot–Lau Interferometry.
Abstract
The quality of high aspect ratio microstructures fabricated by deep X-ray lithography is highly dependent on the photoresist material used and the process parameters applied. Even with photoresists more suitable to this process, it is common to face defects in the final optical components, such as in case of X-ray gratings. The gratings need to be fabricated with critical dimensions on a sub-micrometer and micrometer scale, with periods of few micrometers and heights of hundreds of micrometers to be used in X-ray imaging techniques such as Talbot–Lau Interferometry. During the fabrication process, these features lead to challenges such as mechanical stability, homogeneity, and defect-free grating patterns. Usually, an epoxy-based negative photoresist is used in X-ray lithography, which needs to account for the shrinkage that takes place during polymer crosslinking in order to avoid defects in the final pattern. Nowadays, photoresist material still lacks certain suitable properties (chemical and mechanical) to fabricate gratings of high quality and with acceptable reproducibility. This work presents the results of TGA, FTIR, and MALDI-TOF analysis made on photoresists commercially available and suitable for X-ray lithography. The photoresists presented different profiles regarding the solvent content and oligomers composition, and in the case of some samples, there were high amounts of non-epoxidized oligomers.
1. Introduction
1.1. Deep X-ray Lithography (DXRL)
Deep X-ray lithography (DXRL), which is the first step of the LIGA (a German acronym for “Lithographie, Galvanoformung, Abformung”) process, is used to manufacture high aspect ratio (HAR) micrometer and sub-micrometer structures out of polymer [1]. Depending on the structural requirements and other boundary conditions (e.g., tolerable exposure time), either a negative or a positive tone photoresist is used. Polymethylmethacrylate (PMMA) is the most suitable positive tone photoresist, delivering the highest structural quality, but it suffers from low sensitivity, resulting in prolonged exposure time especially for several hundred micrometer high structures [2,3]. Chemically amplified negative tone photoresists are much more sensitive but show some structural deficiencies due to shrinkage during polymerization after exposure. It is evident that the quality of the products fabricated by the LIGA process is highly dependent on the raw materials used for patterning, as well as on their chemical behavior during processing. Hence, it is necessary to have strict control of the process parameters [4,5,6,7,8,9,10,11,12]. The photoresist layer to be patterned is fabricated by spin coating a photoresist to the desired thickness in a range from 5.0 µm to several millimeters, depending on the application. The photoresist mixture contains at least a polymer/oligomer with photosensitivity, a catalyst, a solvent, and occasionally some additives [13,14]. Negative photoresist solutions are usually based on epoxy resins, because this resin has mainly been used for microstructure fabrication (MEMS), optical sensors, micro-pieces of watches, radiation sensors, optical fiber components, conductive microstructures, photonic crystals, etc. [15,16,17]. Compared to other materials, this resin is relatively cheap; the microstructures exhibit excellent properties, such as high mechanical resistance, thermal and chemical stability, and excellent transparency [14,17,18,19].
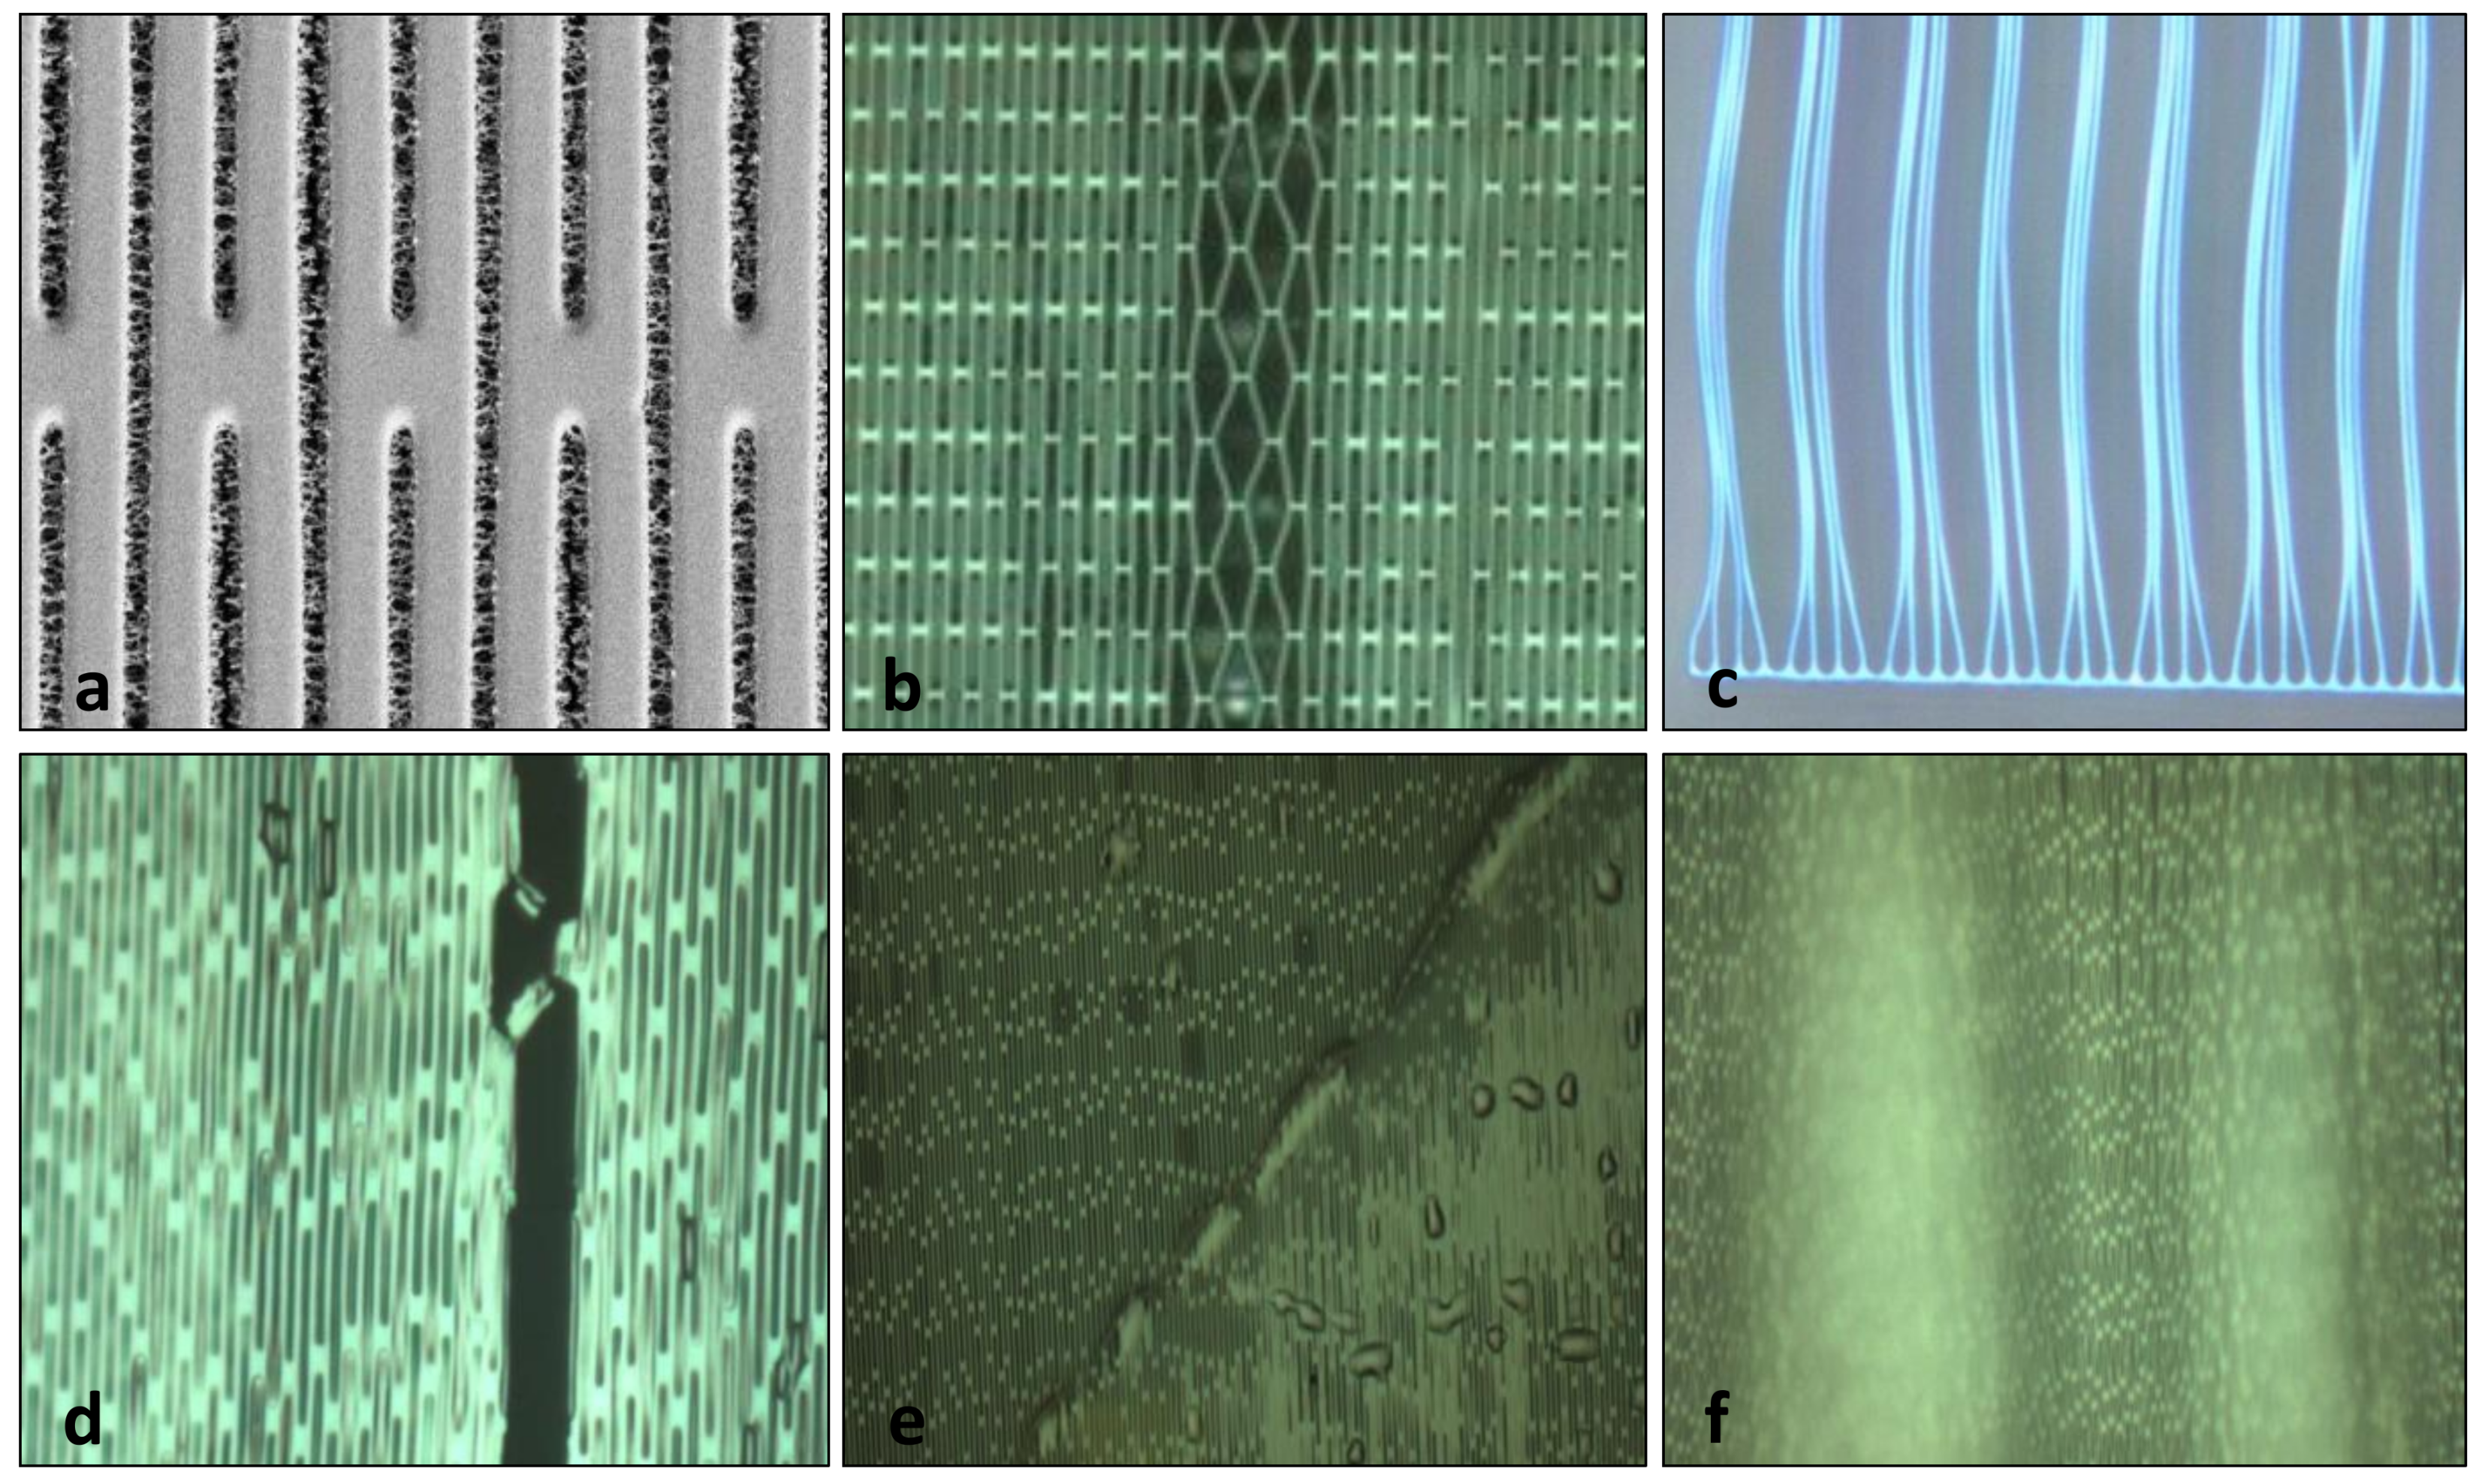
Despite many advances in microstructure fabrication, unknown factors affecting the quality and reproducibility of the HAR microstructures still exist; some of these defects are shown in Figure 1 (all images were made after the development step).
Figure 1a shows, in the region protected from the X-rays (the black area), a crosslinked material abnormality (“cobweb”). This cobweb effect can occur due to the high sensitivity of the photoresist to secondary irradiation (e.g., photo electrons). The lamellae deformation shown in Figure 1b is a direct result of the shrinkage/swelling properties of the photoresist during polymerization. Depending on the mechanical properties of the crosslinked photoresist, this may even result in cracks (Figure 1d). A thermal mismatch of the crosslinked photoresist with the substrate and the lower mechanical stability or capillary forces in the drying process may result in structural collapse (Figure 1c). Bubbles caused during the baking and/or exposure and/or post-exposure bake steps conglomerate in prominent clusters. The residual photoresist will then create a thin layer on top of the structures, which remains solid after the development process, affecting the mechanical stability of the HAR microstructures and blocking the electroforming process (Figure 1e). Figure 1f indicates problems in the adhesion between the photoresist and the substrate.
1.2. Epoxy-Based Photoresists
The negative tone photoresists are based on a resin known as SU-8, where the molecular structure is photosensitive. It was developed initially by IBM, which patented it in 1989; afterward, it was continued to be produced by Shell Chemical (EPON SU-8 epoxy resin) [20,21]. The molecular structure of the resin present in the photoresists (Figure 2) has three main organic groups in the chemical structure: the epoxy groups (responsible for crosslinking), the aryl rings, and the methylene bridges that bind the polymer chain. The polymer has an excellent ability to interact with its own chains; however, when mixed with other polymeric materials, low adhesion and interaction are observed. It displays good adhesion to metallic surfaces, surfaces pretreated with plasma, and with hydroxyl groups (OH-) bonded to the surface. The photoresist exhibits high optic transparency for wavelengths above 360 nm and high sensitivity to ultraviolet (UV) wavelength (350–400 nm); it is inert to several solvents, bases, and acids and presents thermal-stability after curing (crosslinking reaction) [14,22].
The photoresists also contain at least more two components, a solvent and a catalyst to initiate the crosslinking process. The solvent is normally used to tune the viscosity of the polymer; the most applied solvents are cycle ketones or lactones (pentanone or gamma butyrolactone). The catalysts, also known as photo acid generators (PAG),are divided into two groups: ionic and non-ionic. The families of triarylsulfonium and diaryliodonium hexafluoride salts are largely applied to initiate the crosslinking reaction (curing process) of epoxy resins, such as the tris(4-methoxypheny1)sulfonium hexafluoroarsenate [23]. These salts form strong acids to start the crosslinking process, releasing a proton to initiate the reaction in the epoxy groups [23]. The crosslinking reaction can be initiated in acidic or basic conditions; the type of catalyst defines the mechanism. In most cases, the epoxides are polymerized in acidic conditions with the help of high-energy radiation [24], taking as an example the salts mentioned above. The catalysts are present in a range of 1–10% in weight at the composition of the photoresist [25,26].
Although the mechanical properties of photoresists and their processing parameters are very well described in the literature [2,3,6,7,9,11,12,27,28,29,30,31,32], less attention has been given to the chemical structure and the effects caused by the catalysts, additives, and solvents in the photoresists’ mixtures. The investigation of the chemical properties concerning the quality of the final structures fabricated by DXRL can help to improve the quality of the structures. It also helps to establish a method to evaluate the quality of the photoresist before its use and to estimate its structural quality. This work aims to characterize the negative photoresists used in the standard fabrication of microstructures by DXRL and to evaluate their chemical compositions to optimize the quality of the final structures taking into account the process parameters.
In this work, two types of negative tone photoresists were evaluated. The first type was named EPR-S1, of which two lots were evaluated (“a” and “b”). The second negative photoresist used to achieve HAR structures was named EPR-S2, of which eight different lots were evaluated (“a” to “h”).
2. Materials and Methods
To characterize the samples of photoresists (specifically, epoxy-based negative tones of photoresists, customized to X-ray lithography and commercially available), the following techniques were used: Fourier-transform infrared (FTIR) spectroscopy, thermogravimetric analysis (TGA), and matrix assisted laser desorption ionization time of flight (MALDI-TOF) mass spectroscopy. All the reagents and chemicals were acquired through the Sigma-Aldrich (Sigma-Aldrich, Darmstadt, Germany).
2.1. Thermogravimetric Analysis
The tests were done in an oxidative atmosphere (synthetic air) in a NETZSC TG-209 (Erich NETZSCH GmbH & Co. Holding KG, Selb, Germany) using about 30–50 mg of the material. The temperature range of the operation was 25–800 °C with a heating ramp of 10 °C·min−1.
2.2. Fourier-Transform Infra-Red Spectroscopy
The analyses by FTIR spectroscopy were performed using a spectrometer Bomem of Hartmann & Braun, model B-100 (ABB, Zürich, Switzerland). The samples were characterized in the liquid phase (approximately 5 mg of the photo resin solution), where a film was performed under a potassium bromide crystal. The spectral information was obtained in a range between 500 and 4000 cm−1 with a resolution of 4 cm−1 and 32 scans.
2.3. Matrix Assisted Laser Desorption Ionization Time of Flight Mass Spectroscopy
The spectra were recorded on a KRATOS AXIMA Performance MALDI instrument (Shimadzu, Nakagyo-ku, Japan). A nitrogen laser was applied as irradiation source with a wavelength of 337 nm. The analyses were carried out with the following characteristics: positive polarity, flight path-linear, mass-high −20 kV voltage, 100–150 pulses per spectrum. The samples were prepared as follows: a range of 4–6 mg of photoresist was diluted in 1 mL of acetone. The matrix was prepared separately with 10 mg of 2,3-Dihydroxybenzoic acid (DHB) and 4 mg of NaCl; both also solubilized in 1 mL of acetone. Thus, the sample and matrix were mixed, and 1 µmL of this mixture was placed on the MALDI target.
3. Results and Discussion
3.1. FTIR Spectra Evaluation
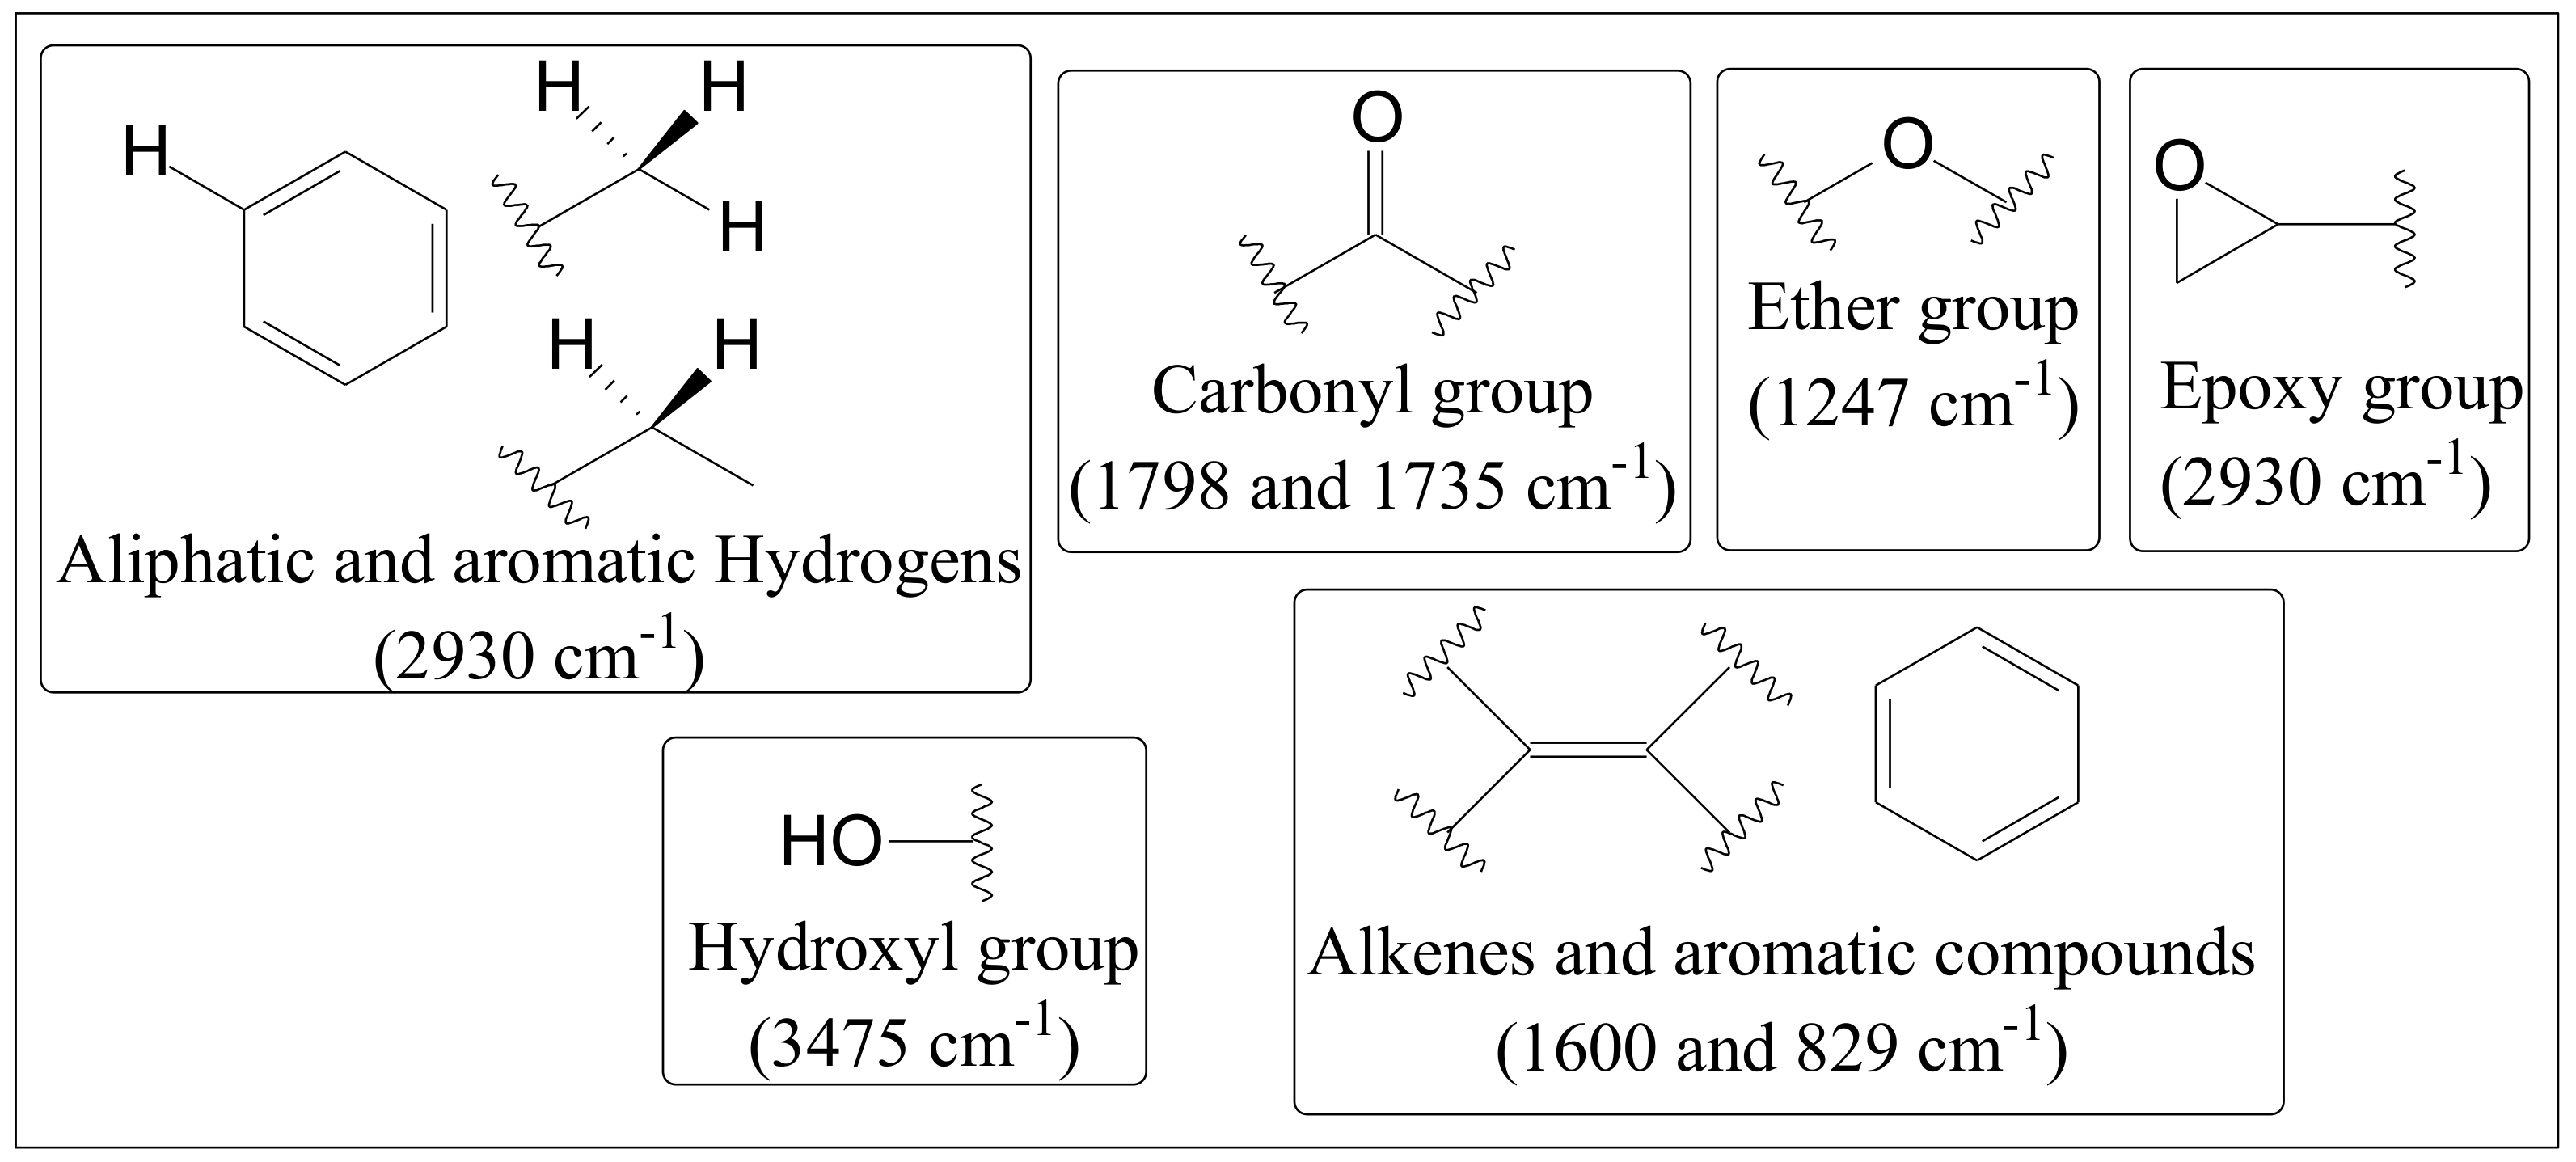
Figure 3 shows an example of the FTIR spectra of the photoresist EPR-S1_b, while the Figure 4 present the main organic groups characterized. All of the other samples were analyzed separately and afterward plotted together (see Figure 5).
There are eight specific important regions in the FTIR spectra (Figure 3). The region in 3475 cm−1 is a vibration typically assigned to hydroxyl groups (OH−), and the region at 2930 cm−1 confirms the presence of methyl, methylene, and aromatic hydrogens in the structure of the sample. The regions in 1798 and 1735 cm−1 are assigned for carbonyl of ketones, acids, esters, and lactones groups. The regions of 1600 and 829 cm−1 are assigned to alkenes, and the region in 1247 cm−1 is assigned to the organic group ether. Figure 4 resumes the organic fractions present in the sample.
The same profile in the FTIR spectra was observed in the other samples (Figure 5). There were only significant differences between the EPR-S1 and EPR-S2 photoresists, where the band for carbonyl (range of 1700–1800 cm−1) was less intense and a second band was observed in the case of the EPR-S1 series. Also, this second band was delocalized for the left side (smaller wavelength).
The organic groups that characterize the polymer are present in all the samples of EPR-S1 or EPR-S2. However, other organic groups were also identified, indicating the presence of other compounds (e.g., solvents, catalysts, etc.). The assignment in 3475 cm−1 (hydroxyl groups) can indicate the non-total reaction in the epoxidation step of the synthesis (see Section 3.3. MALDI-TOF Analysis).
3.2. TGA Analysis
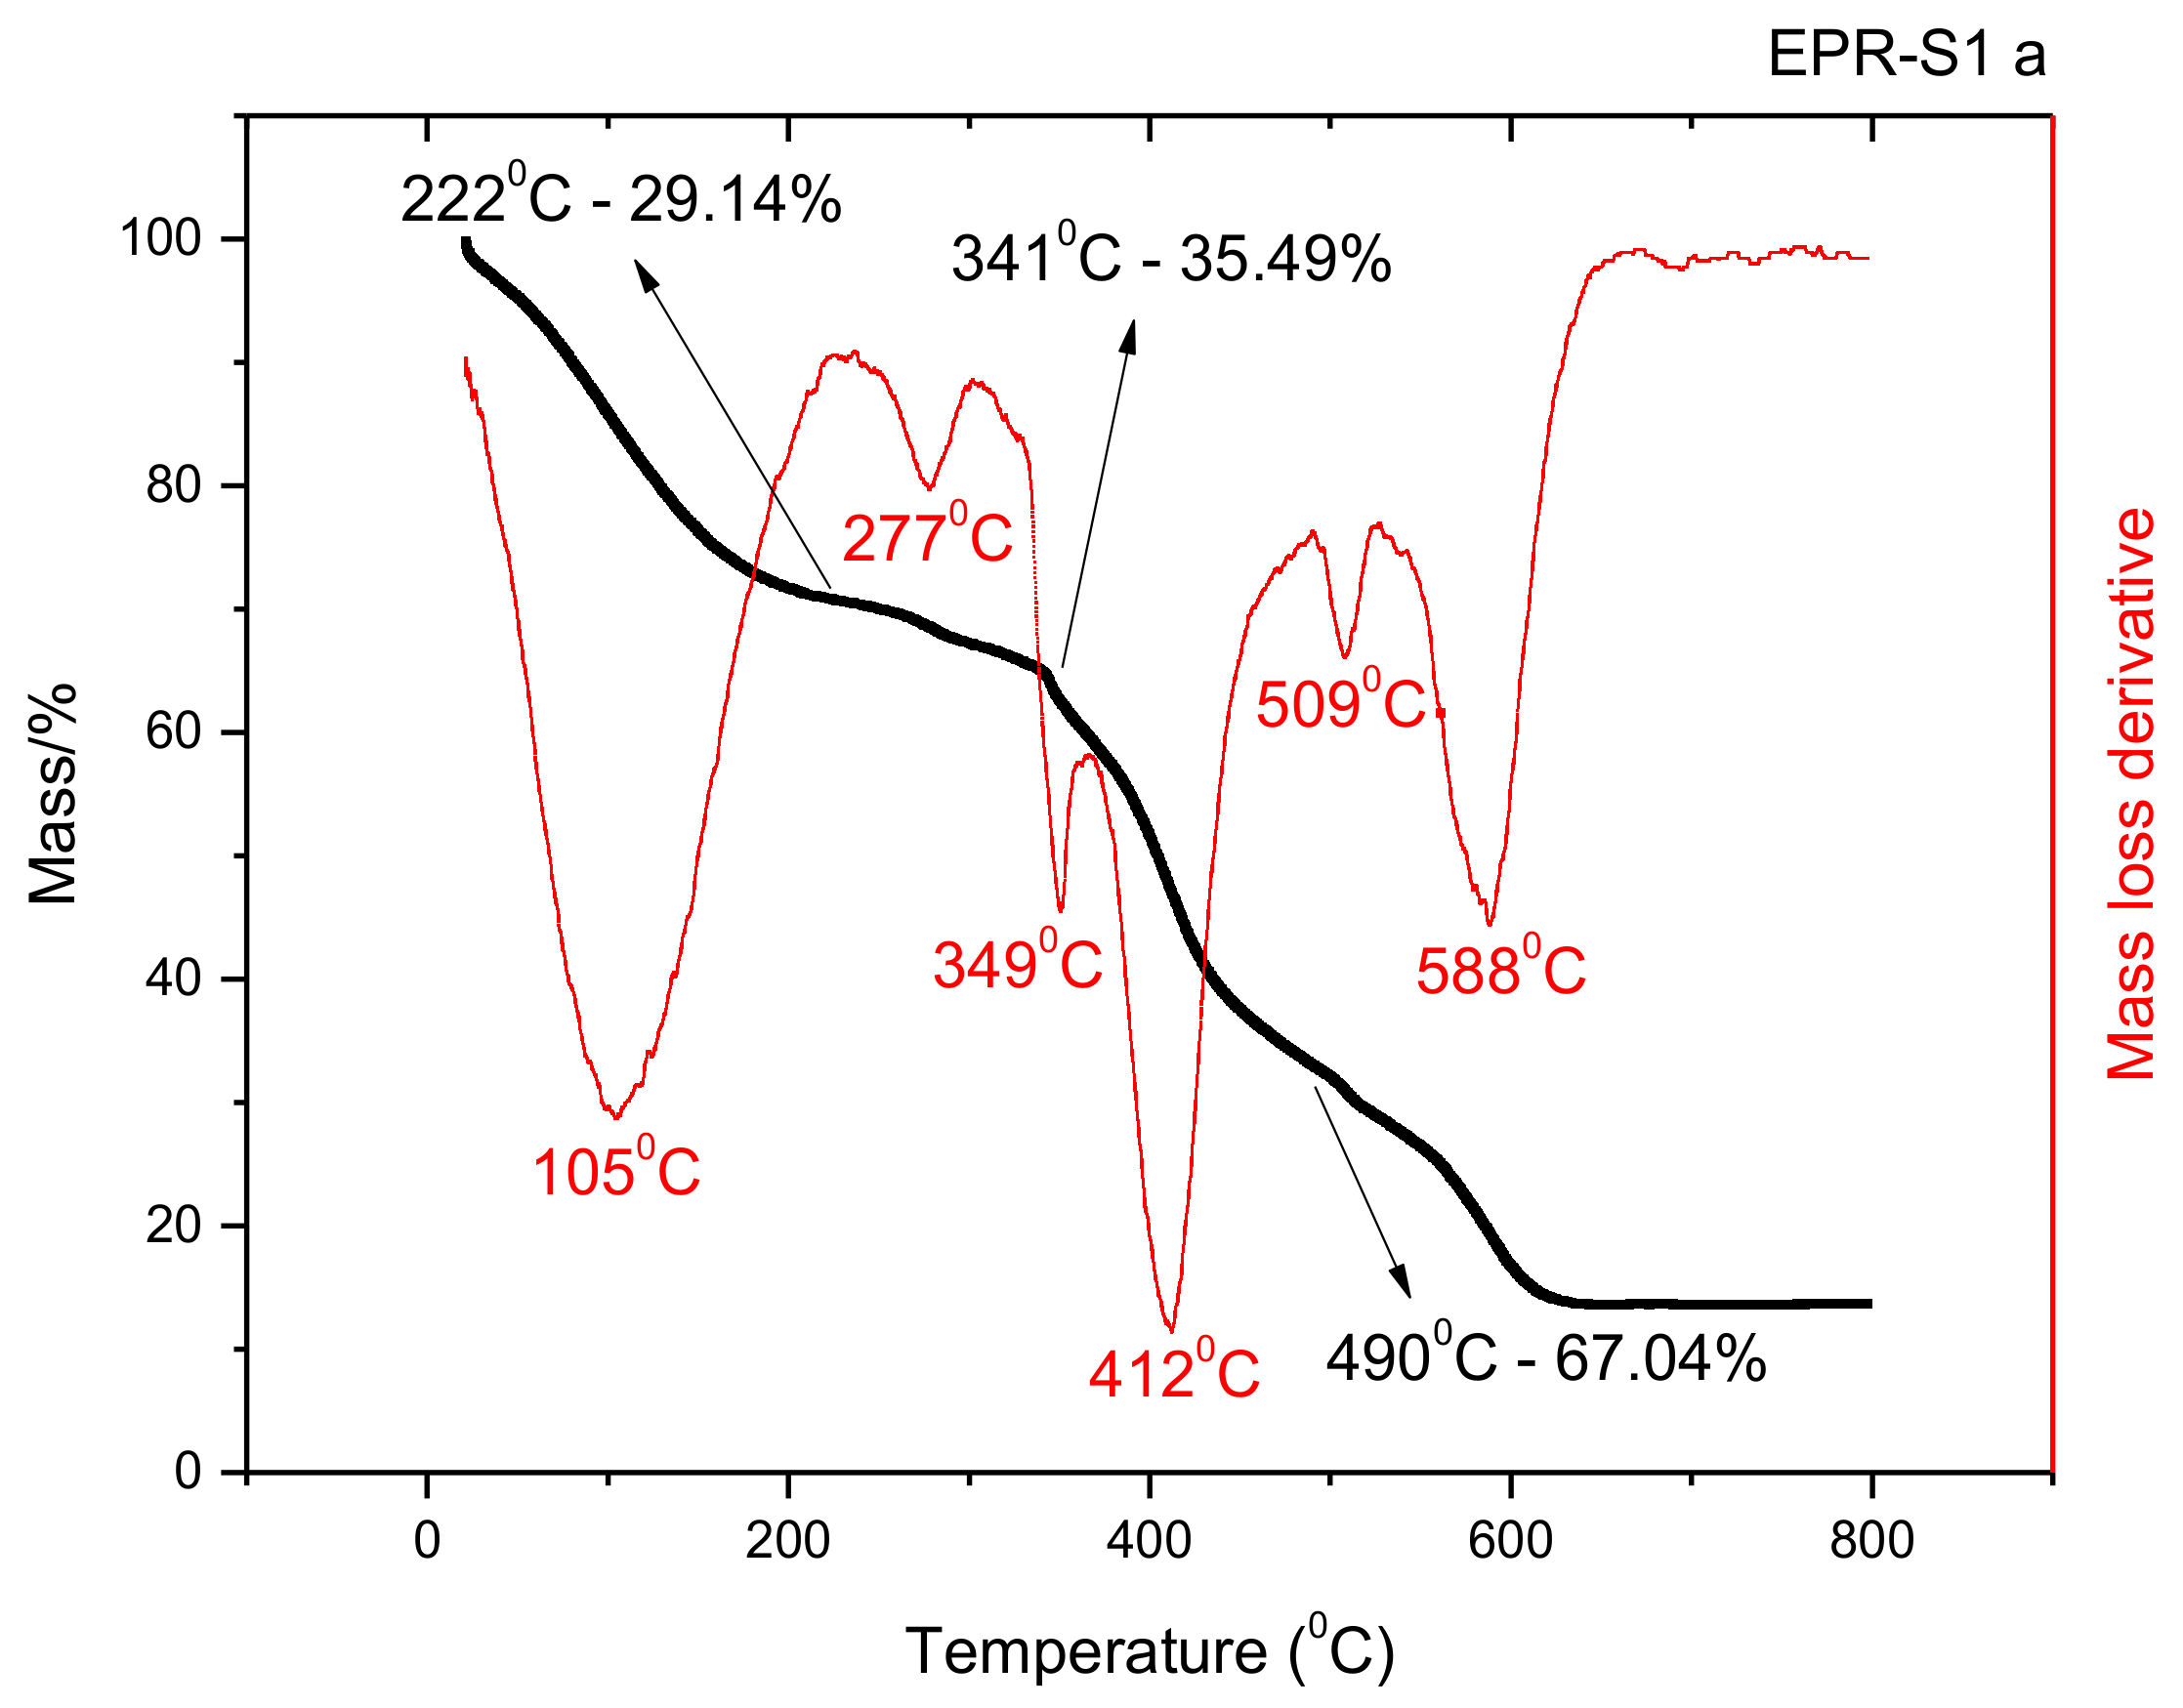
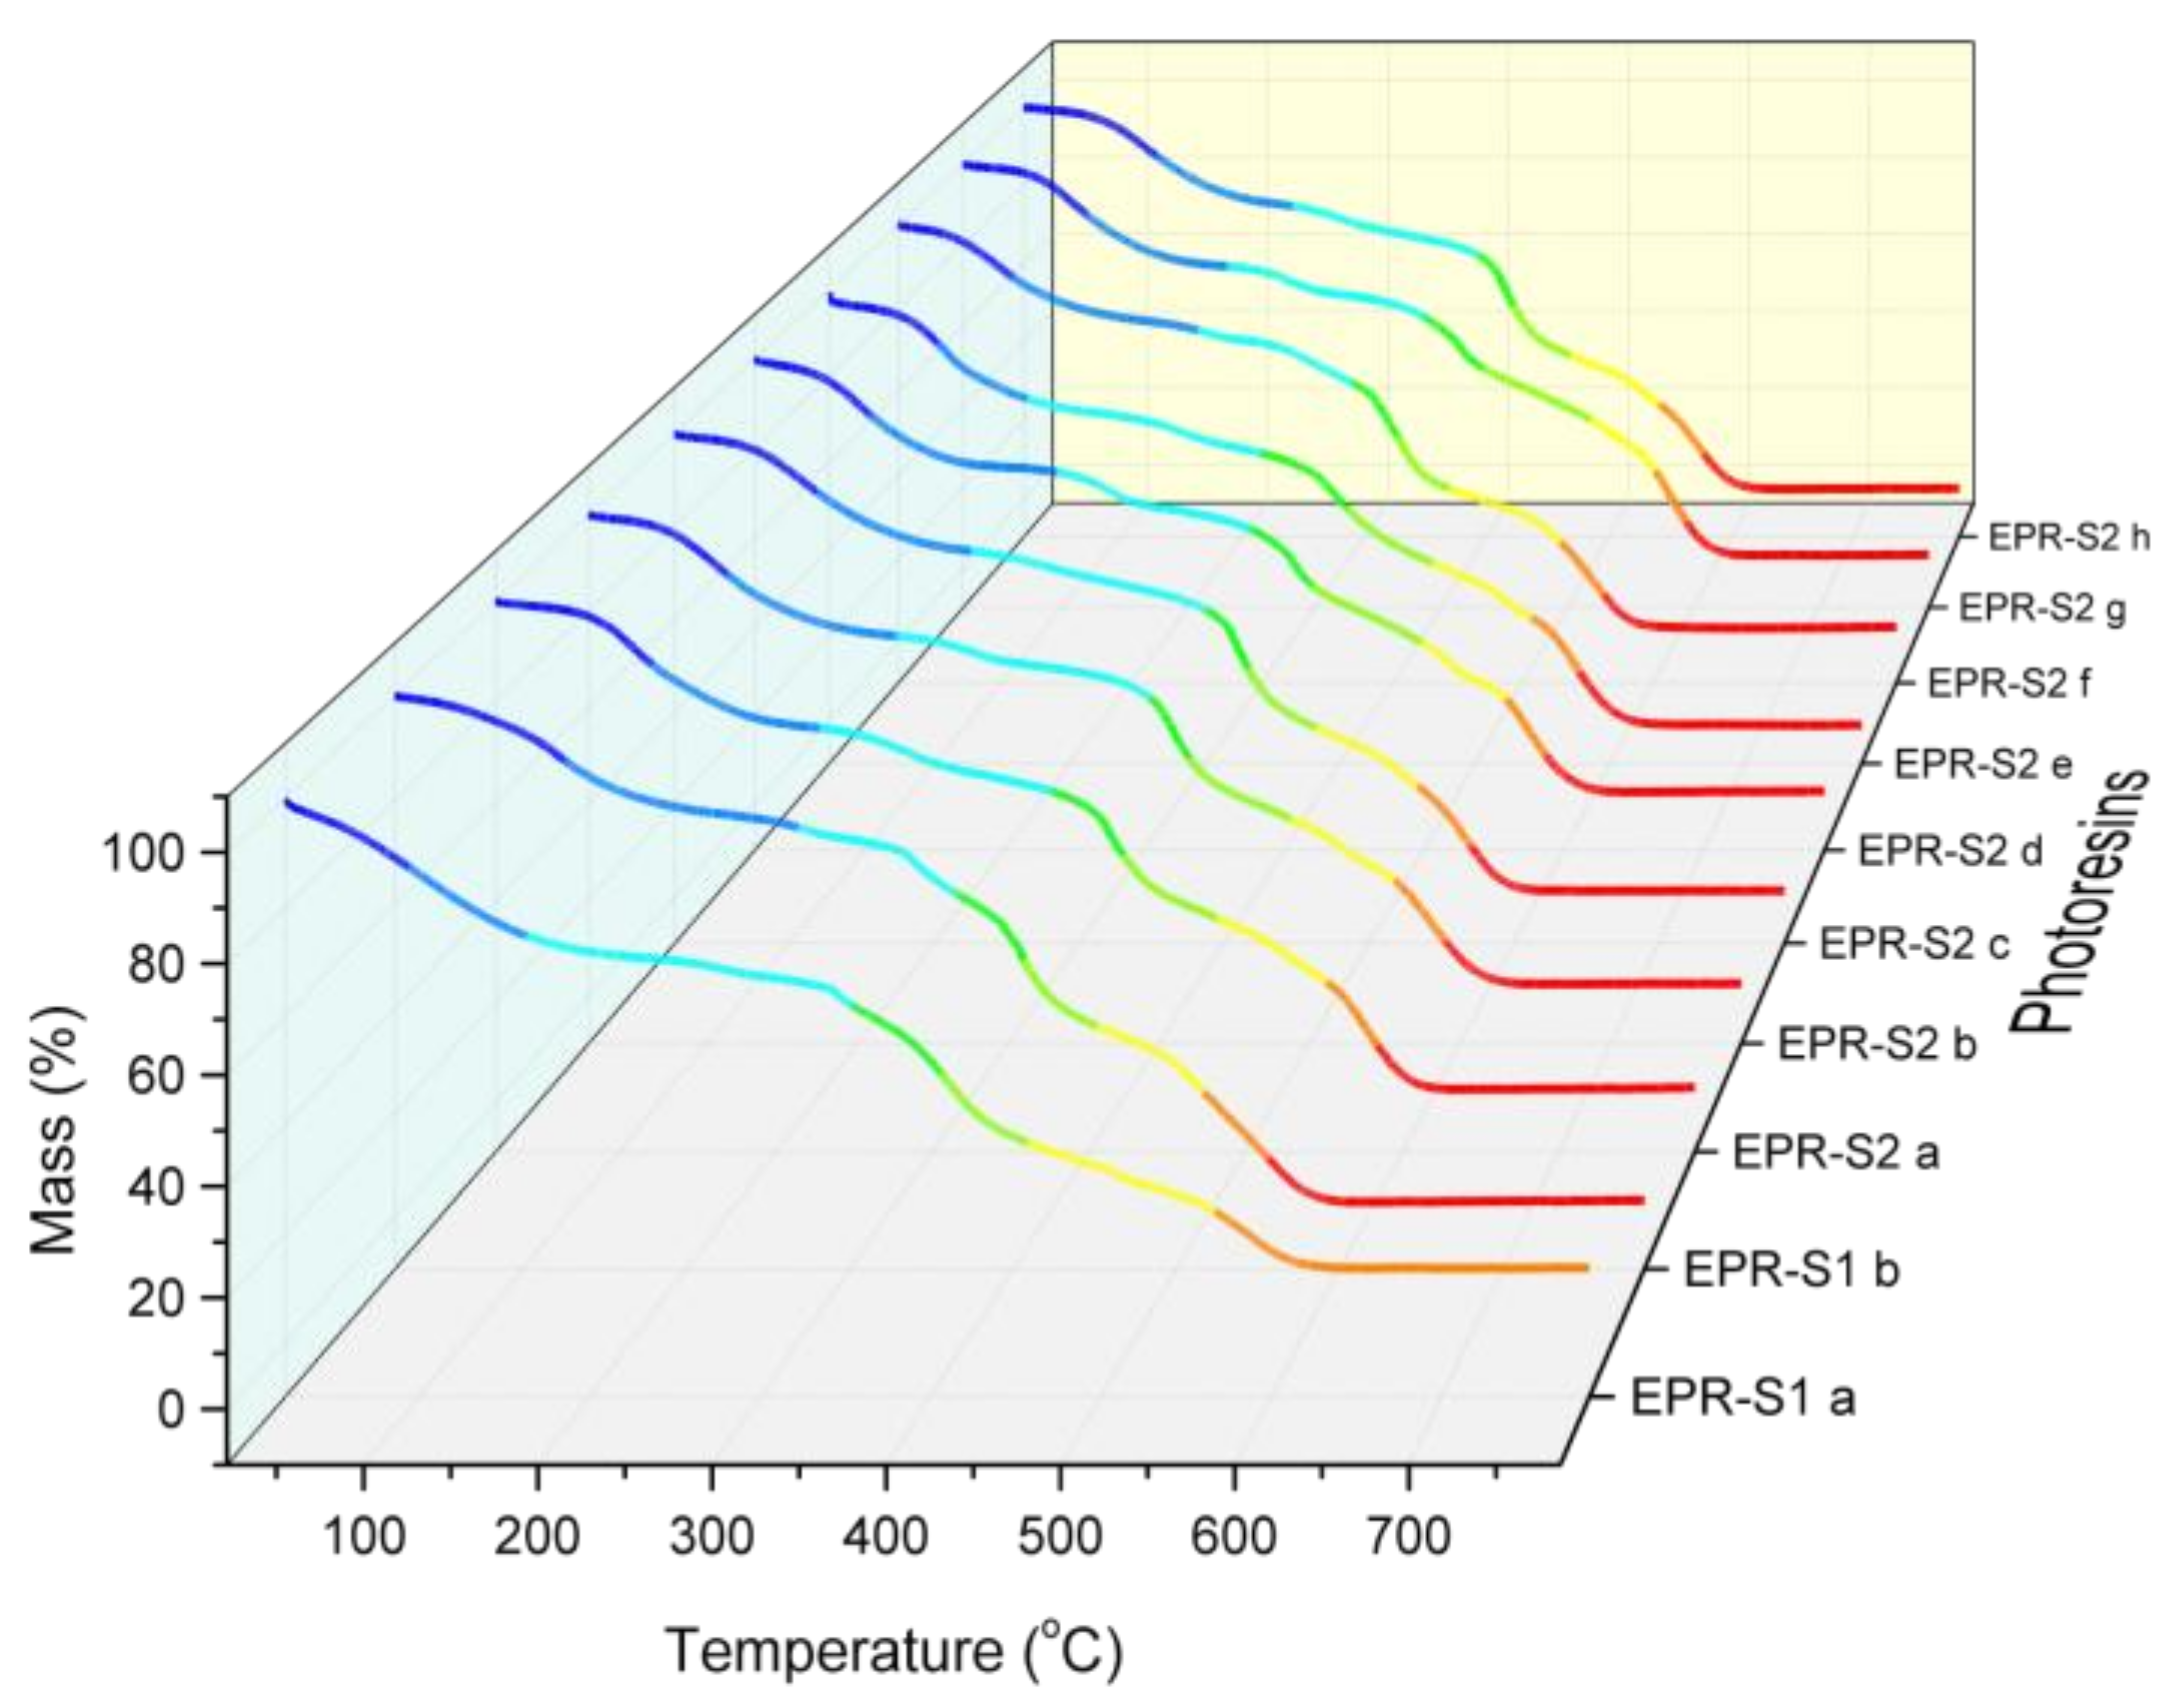
The solvent content of the photoresists was evaluated by TGA, performing the oxidative process of the material until 800 °C. Figure 6 shows the results for the resin EPR-S1 and is used as the example to explain the main changes during the degradation process.
The TGA graph (Figure 6) can be divided into three main parts: the region of solvent evaporation (room temperature until 220 °C), the region of the crosslinking process (220–320 °C), and the region of degradation (320–650 °C) [33]. The derivative curve of mass loss allows us to evaluate the first event of a mass loss in the graphs, which is due to solvent evaporation (blue region in Figure 7).
Figure 7 shows the TGA curves for all of the characterized photoresists. There are differences in the solvent content of up to 5.5% approximately. Usually, the solvent is applied to obtain the same viscosity parameter. As the viscosity is a physical-chemical parameter directly related to the molecular composition [34], this difference can be initially interpreted as evidence of differences in the composition of the photo resin solutions. Thus, a difference in the solvent content in the same type of photoresist means that the molecular structures are slightly different.
For the series EPR-S2, the measurements showed solvent content between 22.66% and 28.15%. The two samples of EPR-S1 series also demonstrated considerable differences in the solvent content. These differences are not critical depending on the final application. However, specifically in the microlithography process, this can be a significant difference between the raw materials that were obtained by the same supplier and theoretically should have the same composition.
3.3. MALDI-TOF Analysis
Although the MALDI is a technique that can be interpreted only in a semi-quantitative approach and the mechanism of ionization is not yet known entirely, the ionization techniques, such as electrospray ionization (ESI) and MALDI, have the advantage of analyzing intact polymer/oligomer molecules, avoiding fragmentation reactions. It is a soft ionization technique and the polymer/oligomer is not influenced by the solution preparation methods. Once the technique is carried out in a solid state (the solvent must be evaporated in the sample preparation), the sample preparation has a short time. It has considerably high sensitivity, and also, MALDI is a suitable technique to characterize factors such as the polydispersion, data of the repeat units, impurities, and additives in synthetic polymers. It can also be applied to a considerable range of polar and non-polar polymers with an extensive range of molecular masses [35,36,37,38,39].
In previous times, before the ionization sources coupled with mass spectroscopy, there were not many techniques able to evaluate mass distribution in polymer samples. The secondary ion mass spectrometry (SIMS) and field desorption (FD) could give information about the mass distribution but with a considerable limitation, in that the polymers must be soluble and with maximum molecular mass near to 10 × 103 Da·mol−1 [40]. NMR spectroscopy and chromatography techniques can provide information about the molecular structures and molecular size, but the distribution concerning chain sizes cannot be fully understood with these methods for a large range of synthetic polymers [41].
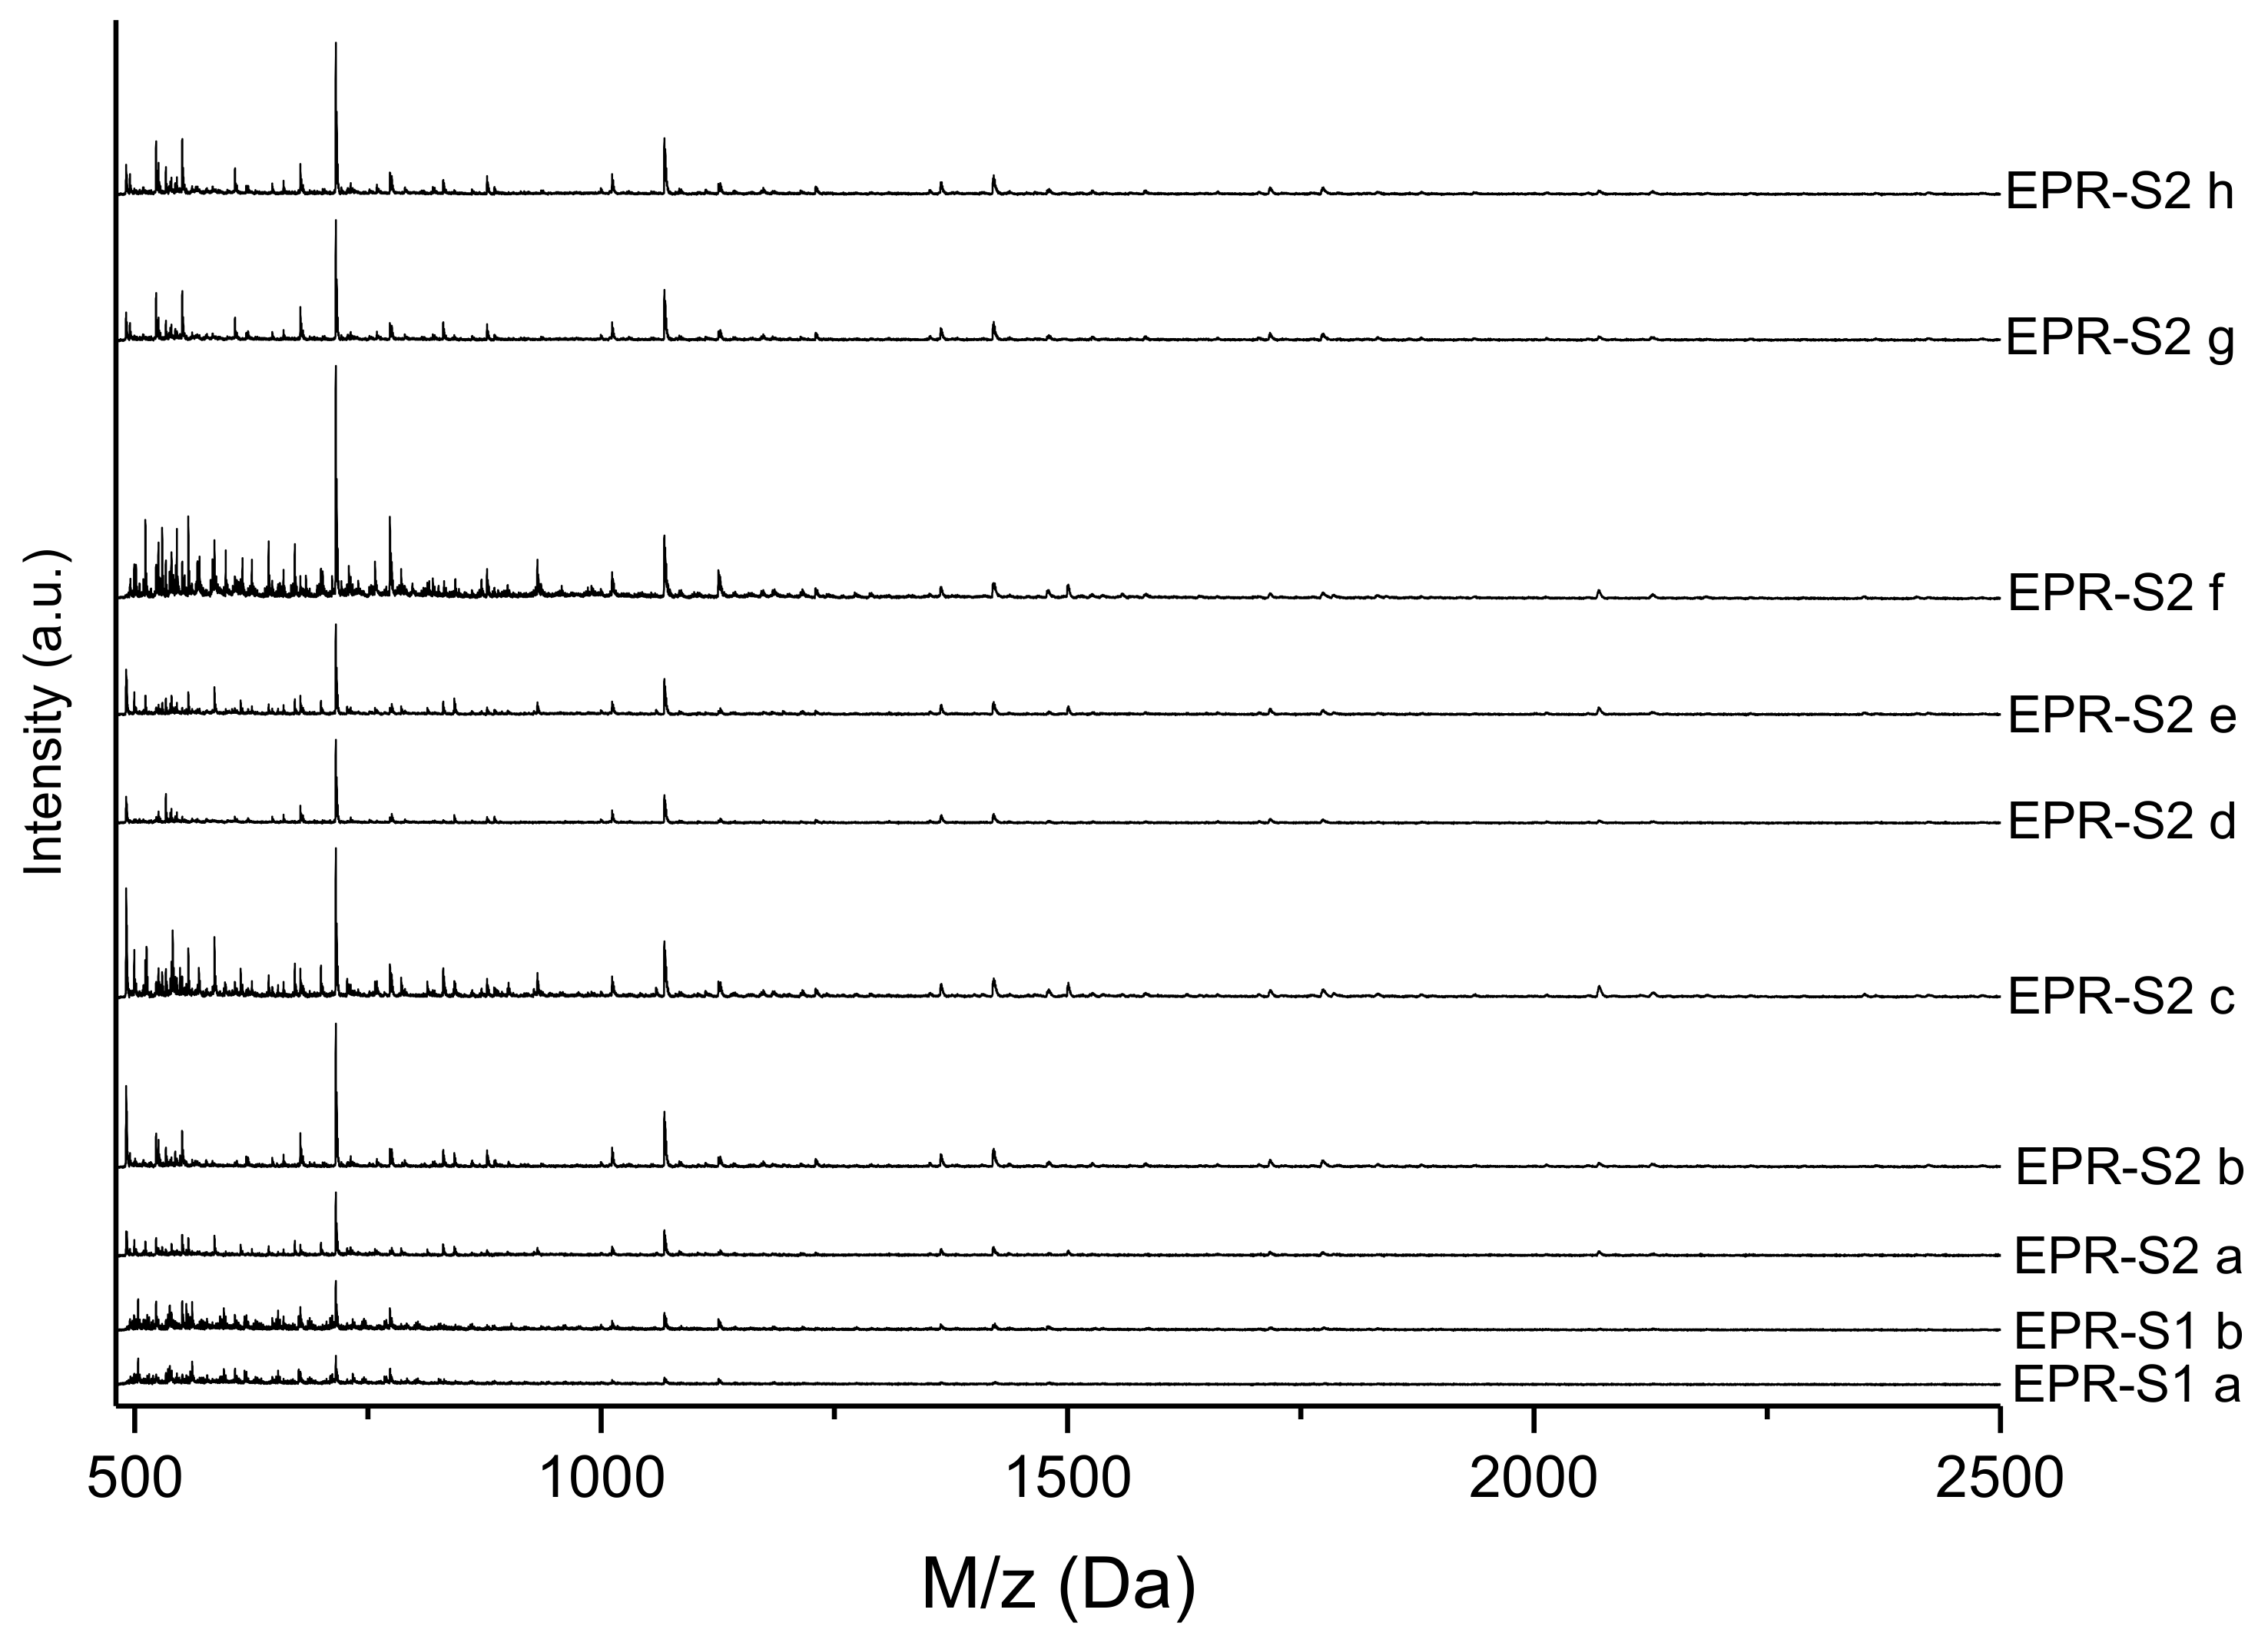
To observe the composition of the resins with respect to molecular size, the photoresists were evaluated by MALDI-TOF in view of their oligomer content. There is no influence of the solvent content and catalyst, the range of molar size of these compounds is low compared to the range applied in this analysis.
The major composition of oligomers present in the samples corresponds to the dimer (region of 715 Da) and trimer (region of 1067 Da) molecules, as Figure 8 shows.
Although the major compounds are the same, there are distinct profiles in the samples (e.g., in the mass profile of sample EPR-S2_f are several mass peaks that are not observed in the spectra of the other samples). These differences are due to the synthesis procedure applied. Observing with more details, the range of low-mass spectra (Figure 9, region between 500 and 800 Da), the samples can be separated into groups: the samples EPR-S2_c and EPR-s2_f; samples EPR-S2_b and EPR-S2_e; samples EPR-S2_a, EPR-S2_g, and EPR-S2_h; the sample EPR-S2_d; and finally, the EPR-S1 series. The samples EPR-S2_c and EPR-S2_f presented several mass peaks in the low-mass region, meaning that the polymer chains vary (high polydispersity) or/and had several secondary products. The samples EPR-S2_b and EPR-S2_e are composed mostly of dimers and trimers of the same size approximately. Also, among the samples EPR-S2_a, EPR-S2_g, and EPR-S2_h, the spectral profile is similar. The compositions of sample EPR-S2_d and the EPR-S1 series consist mostly of dimer molecules. These differences in molecular size distribution might result directly in different physical-chemical properties.
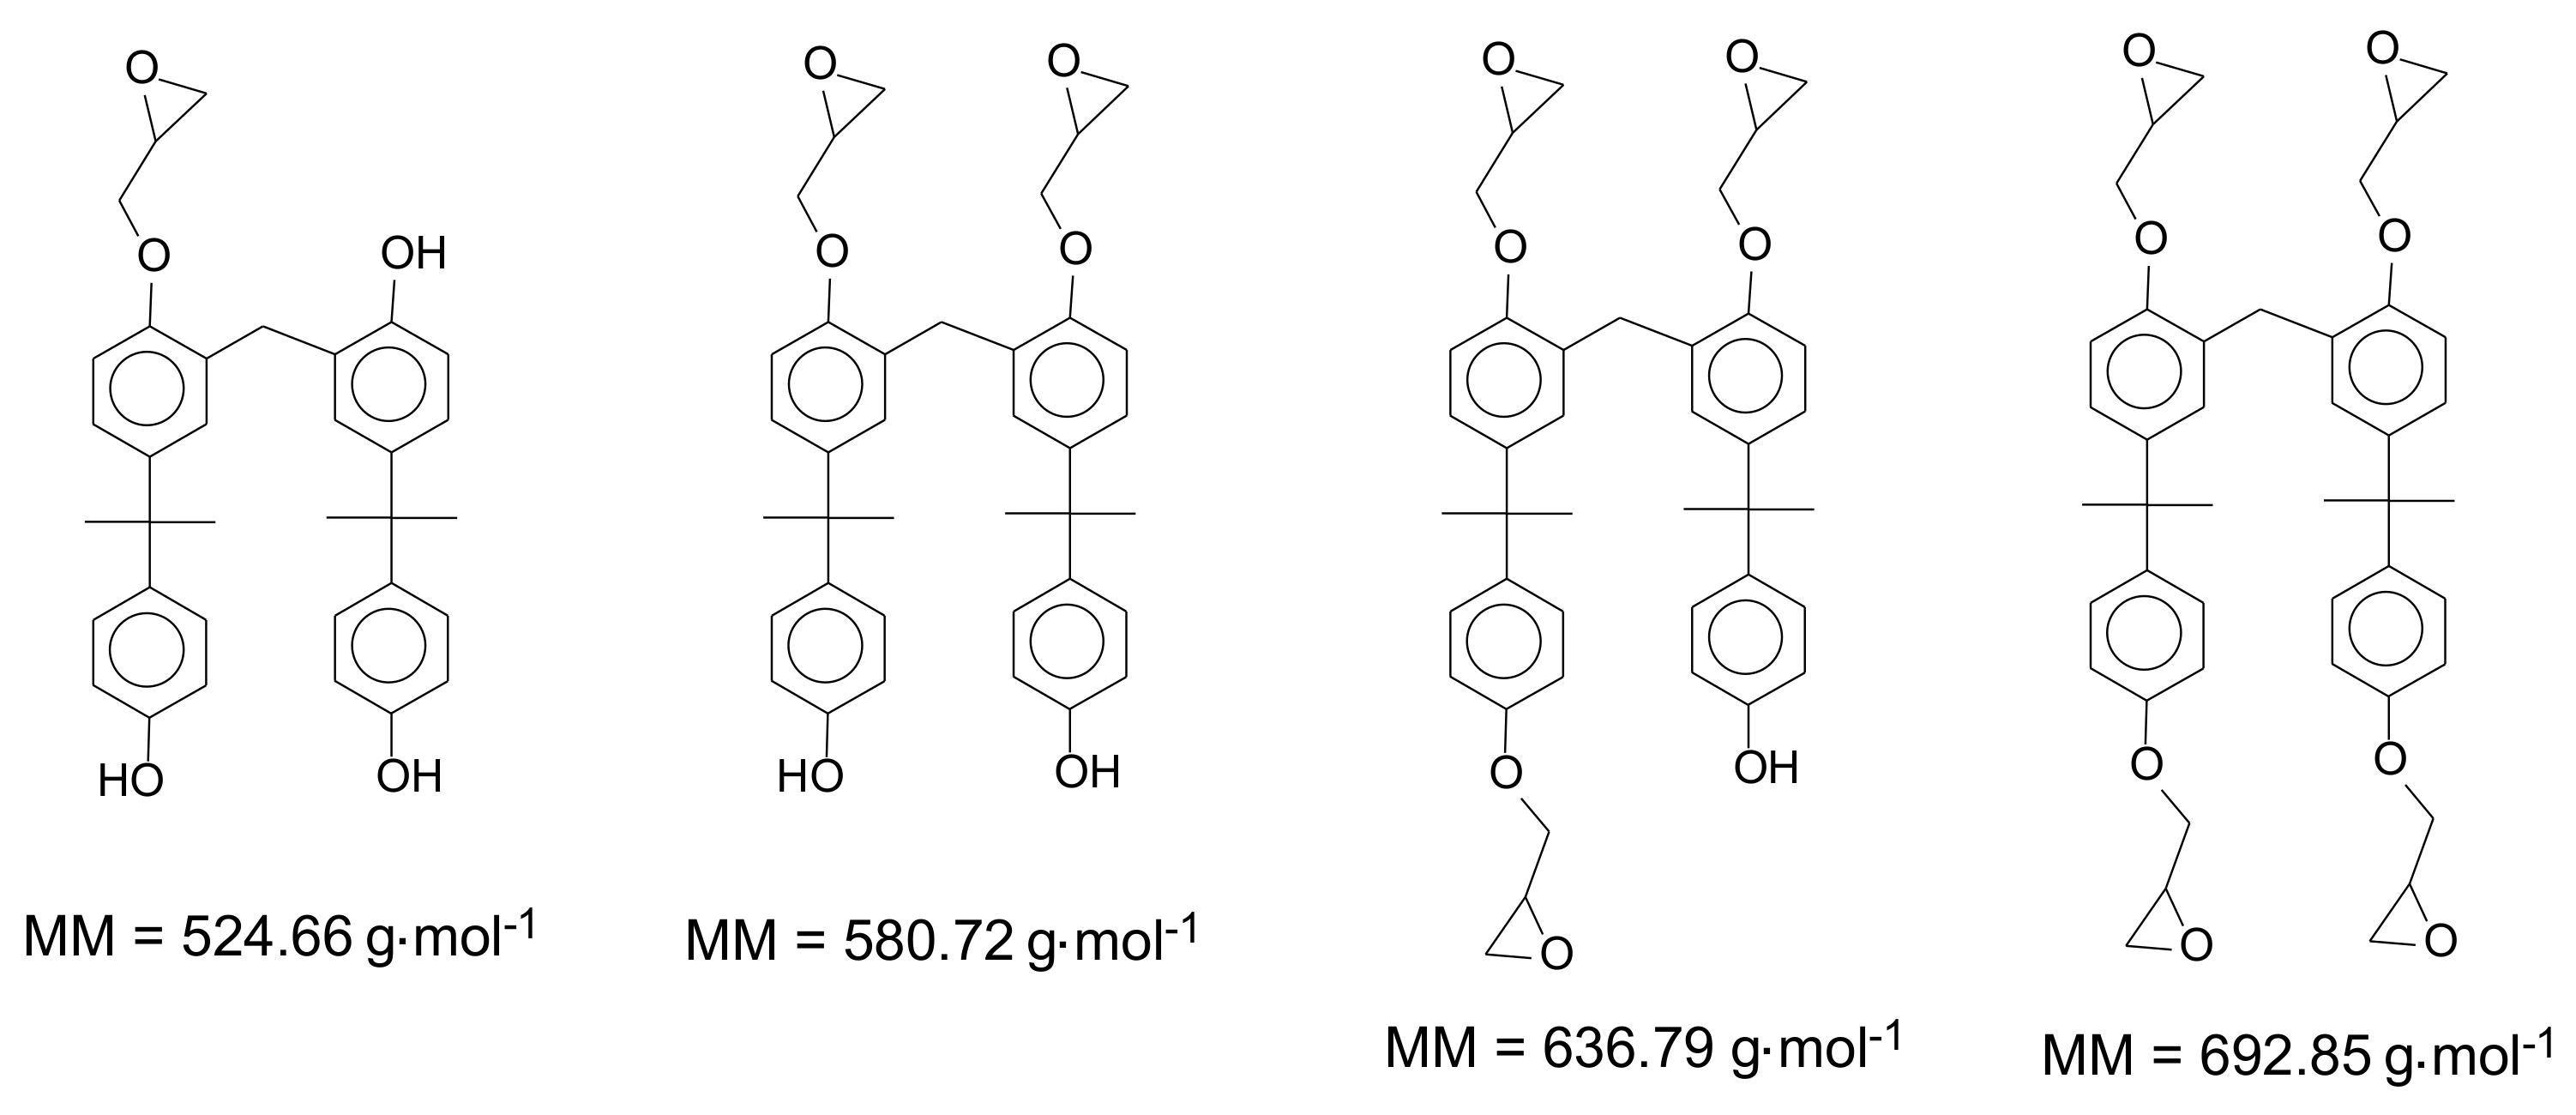
Moreover, in the spectra, it is also possible to observe several peaks that represent the oligomers in different compositions regarding the bonds with the epoxy groups. The theoretical possibilities are monomer two possible peaks; dimer four possible peaks (see Figure 10 using the dimer as an example); trimer six possible peaks; tetramer eight possible peaks; pentamer ten possible peaks; and hexamer twelve possible peaks.
These possibilities do not consider the secondary products that can be generated during the epoxidation step. As a result, the molar mass can vary around 30%. Table 1 shows the mass possibilities as a function of the oligomer´s size in the photo resin composition:
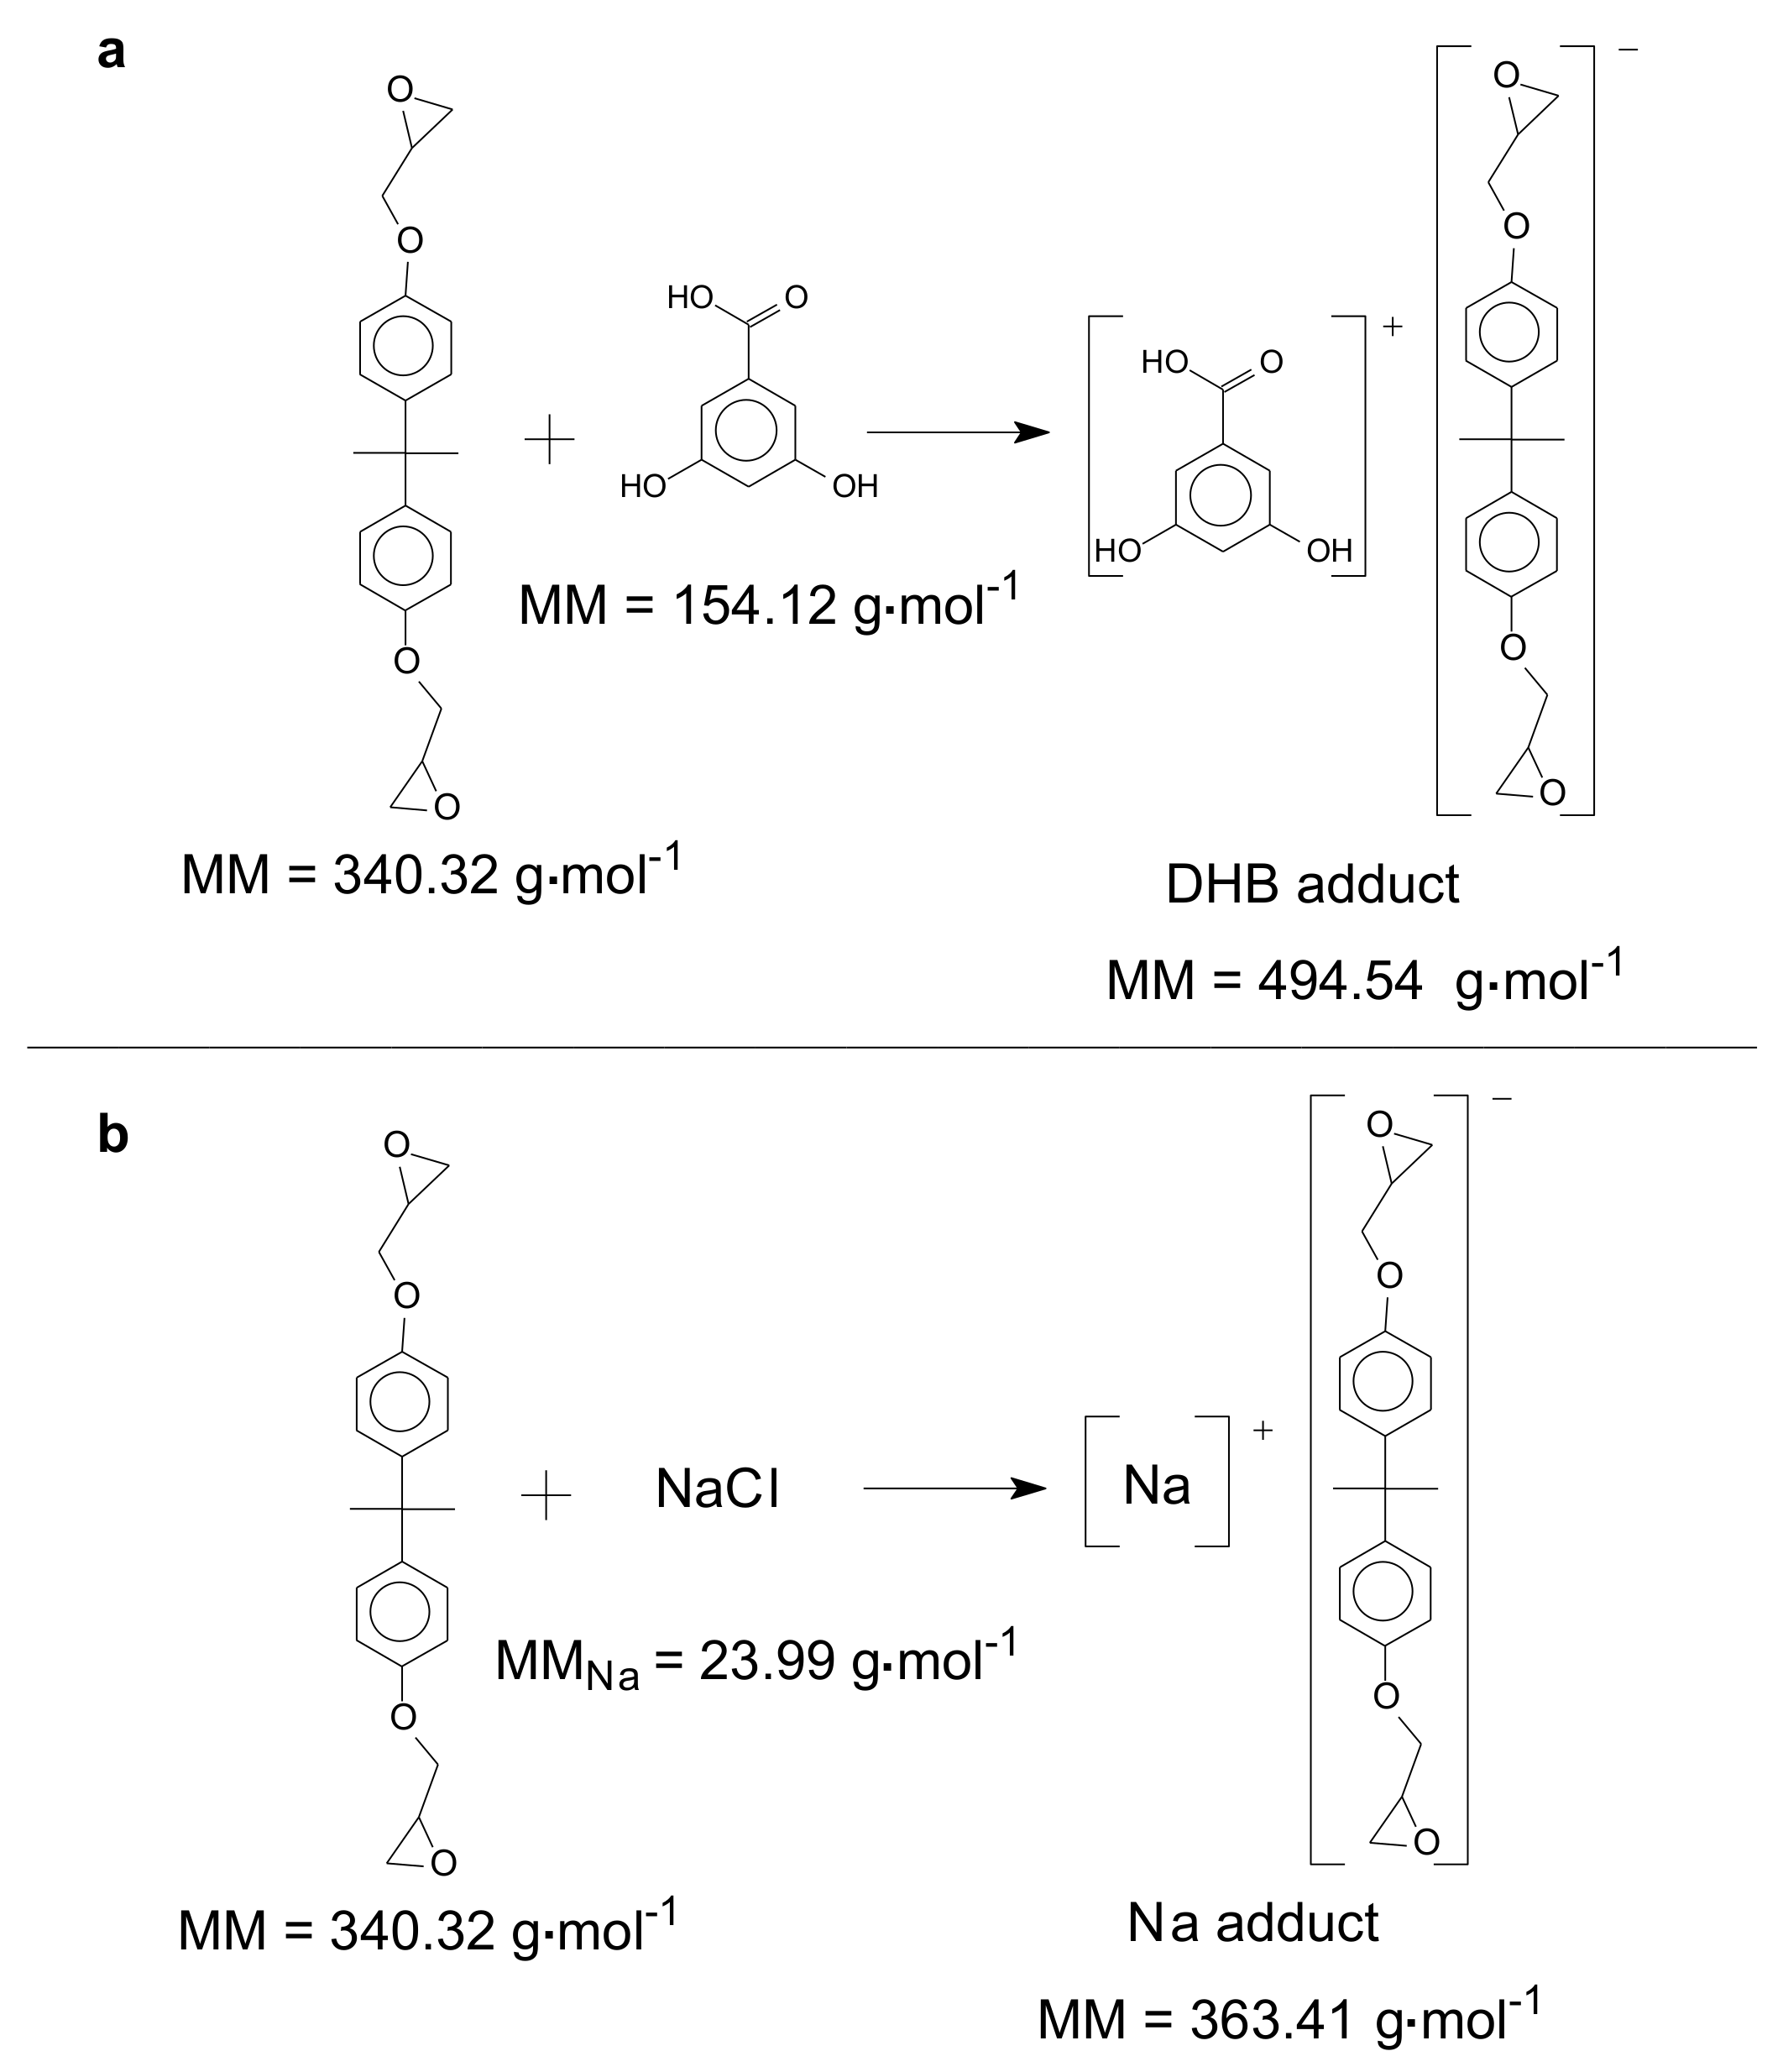
To evaluate the spectra, it is necessary to take into account the influence of the matrix dissociation during the analysis method. The MALDI-TOF has the advantage of avoiding the fragmentation of analyte molecules when a light-absorbing matrix is used. Thus, only intact molecules are observed in the mass spectrometer. For polymer samples, it is possible to identify all the absolute sizes in the distribution after the polymerization step. However, it is common that the matrix has an interaction with the sample, leading to the formation of adducts [35,40,41,42,43,44]. causing some differences in the Dalton values expected. As mentioned in the methods section, in this work DHB and sodium chloride were used as matrices. Therefore, it could be possible that the compounds have increased Dalton values. As an example, the main possible adducts for the monomer are presented in Figure 11.
The adduct formation can occur with all molecules in the photoresist. In the spectra, it will be possible to observe a minimum of three different mass peaks for the same structure (the pure oligomer, the adducts with sodium, and the adducts with DHB). Although adducts with DHB do not occur typically, the mass of these adducts was also calculated. Not all the peaks will always be observed because the interaction with the matrix is a random process. In Table 2, the mass peaks that could be observed in the different monomers are listed. Dimers, trimers, tetramers, pentamers, and hexamers were identified in the samples mainly with the sodium adduct.
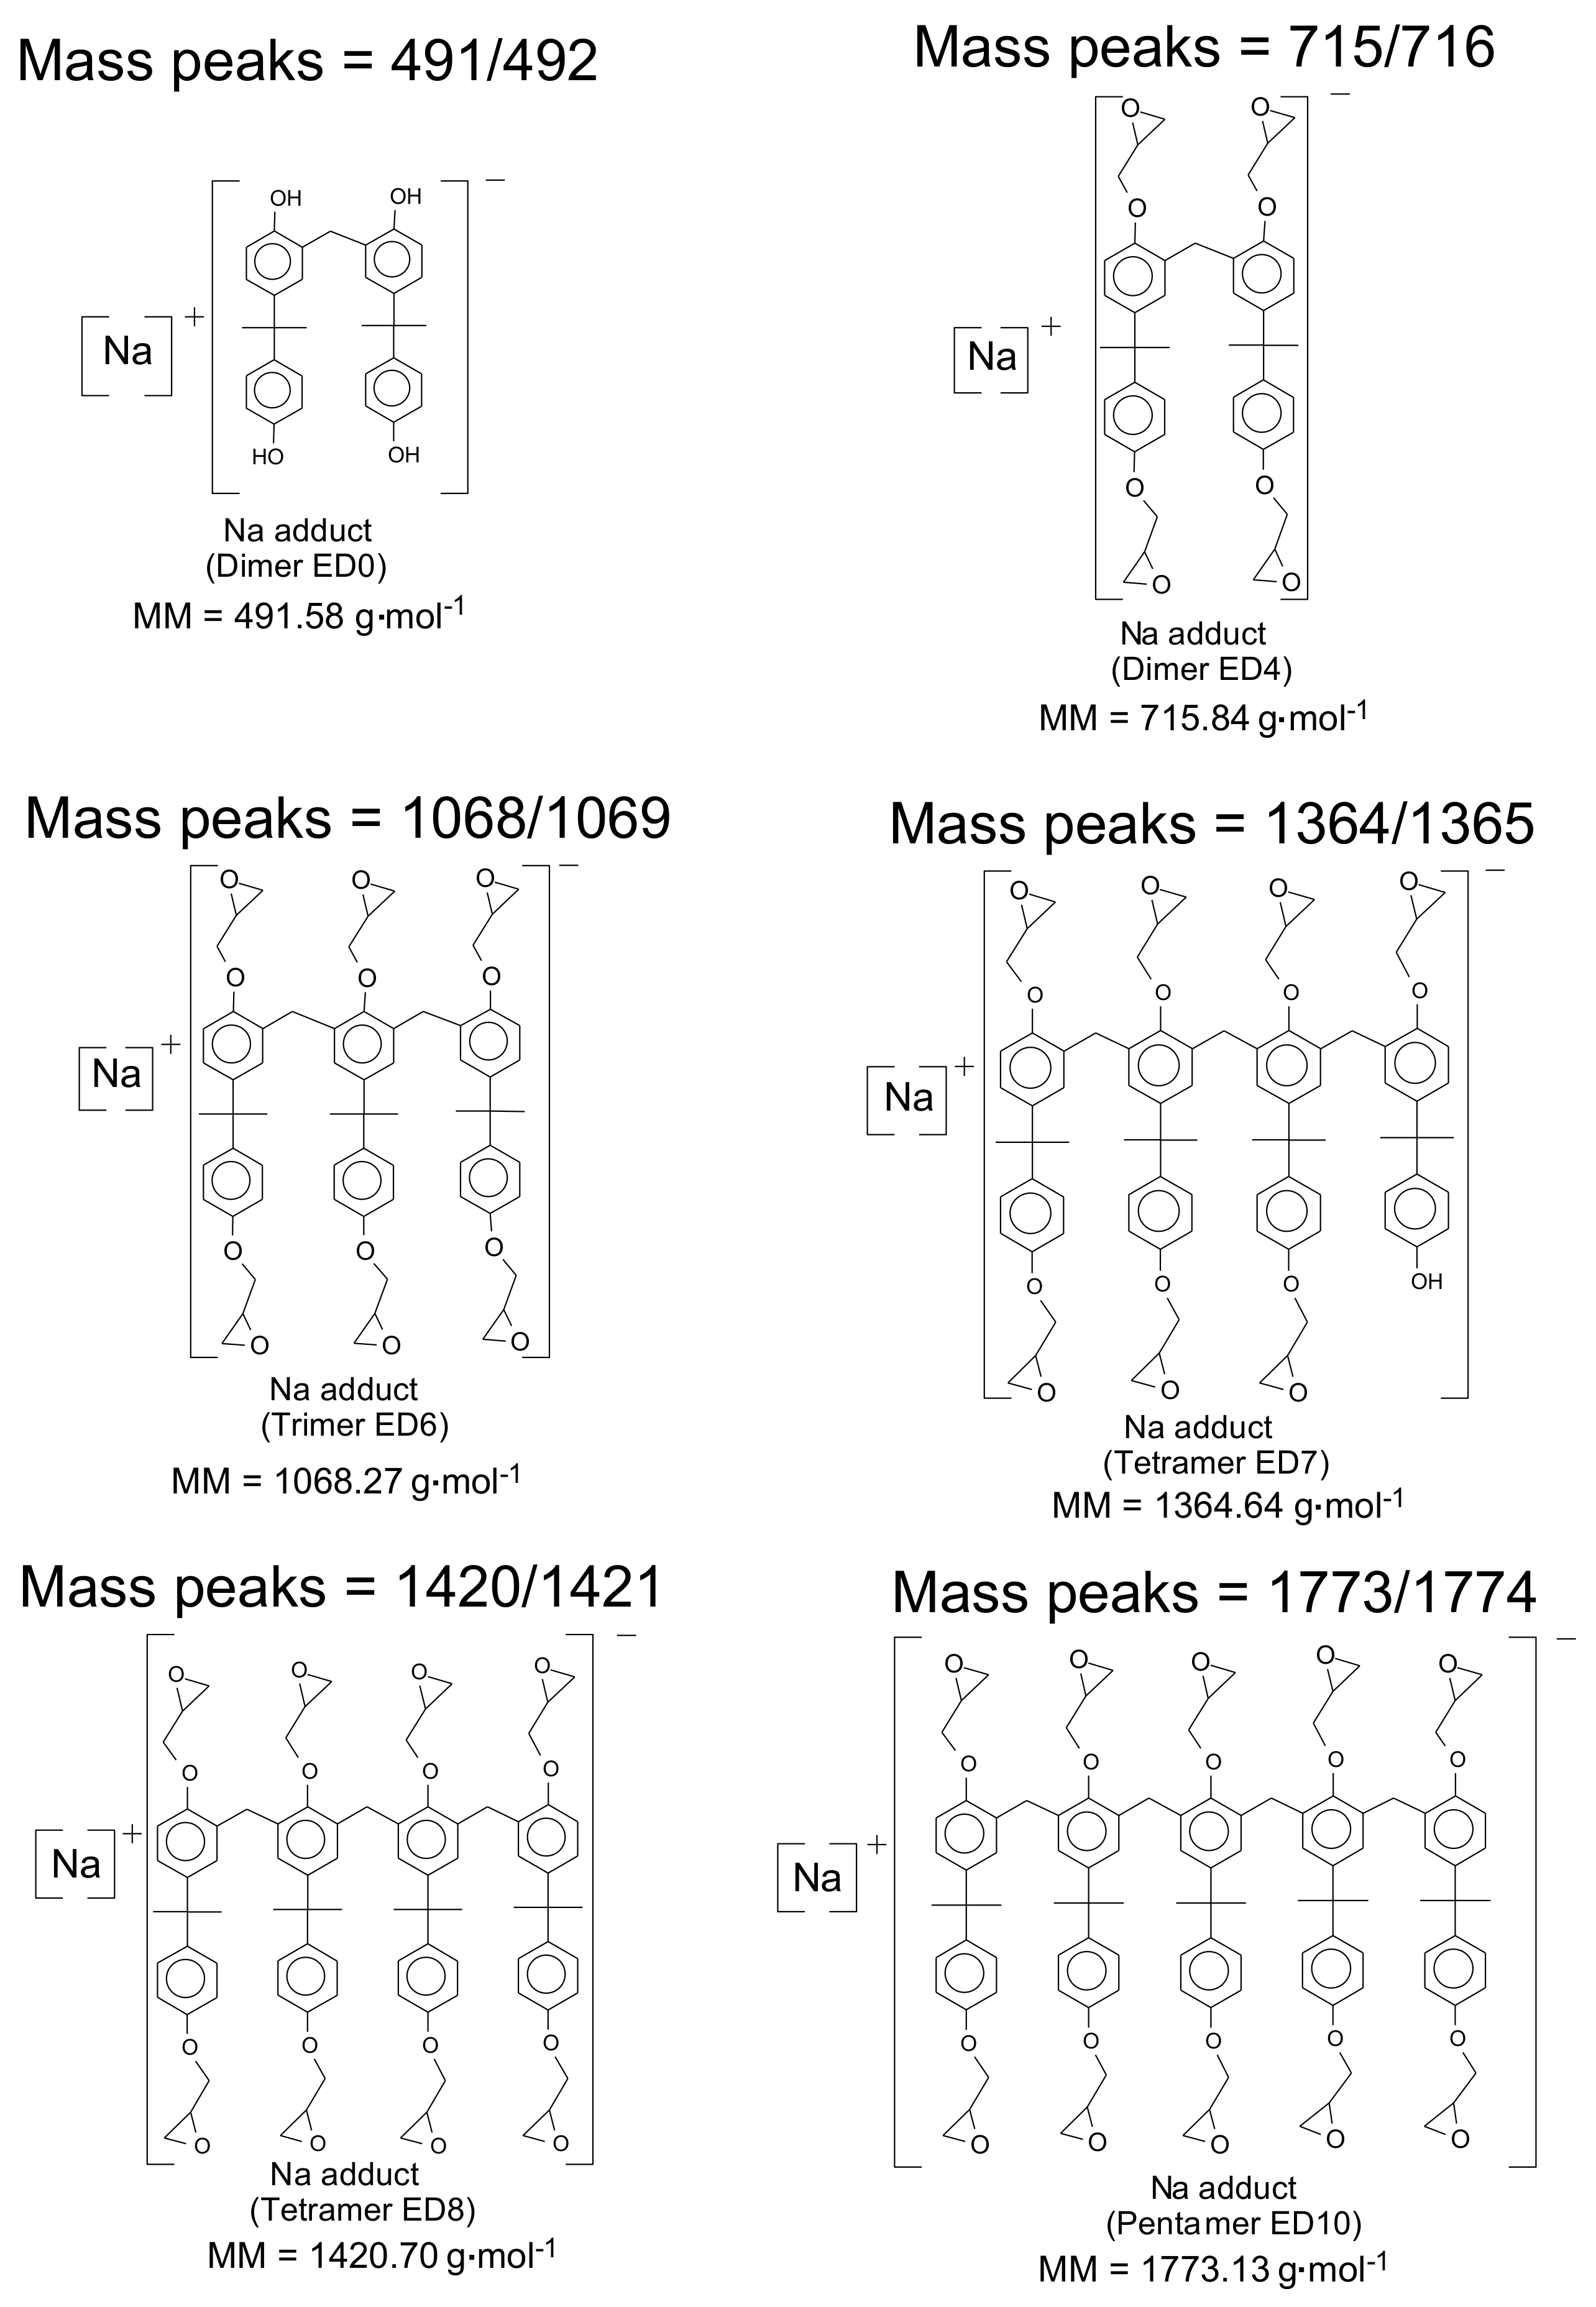
Correlating the data of Table 1 and Table 2, it is possible to identify the main oligomer fractions in the photoresists. The most important mass peaks are 491, 533, 715, 1067, 1364, and 1419 Da, representing sodium adducts coming from the matrix solution, as Figure 12 shows.
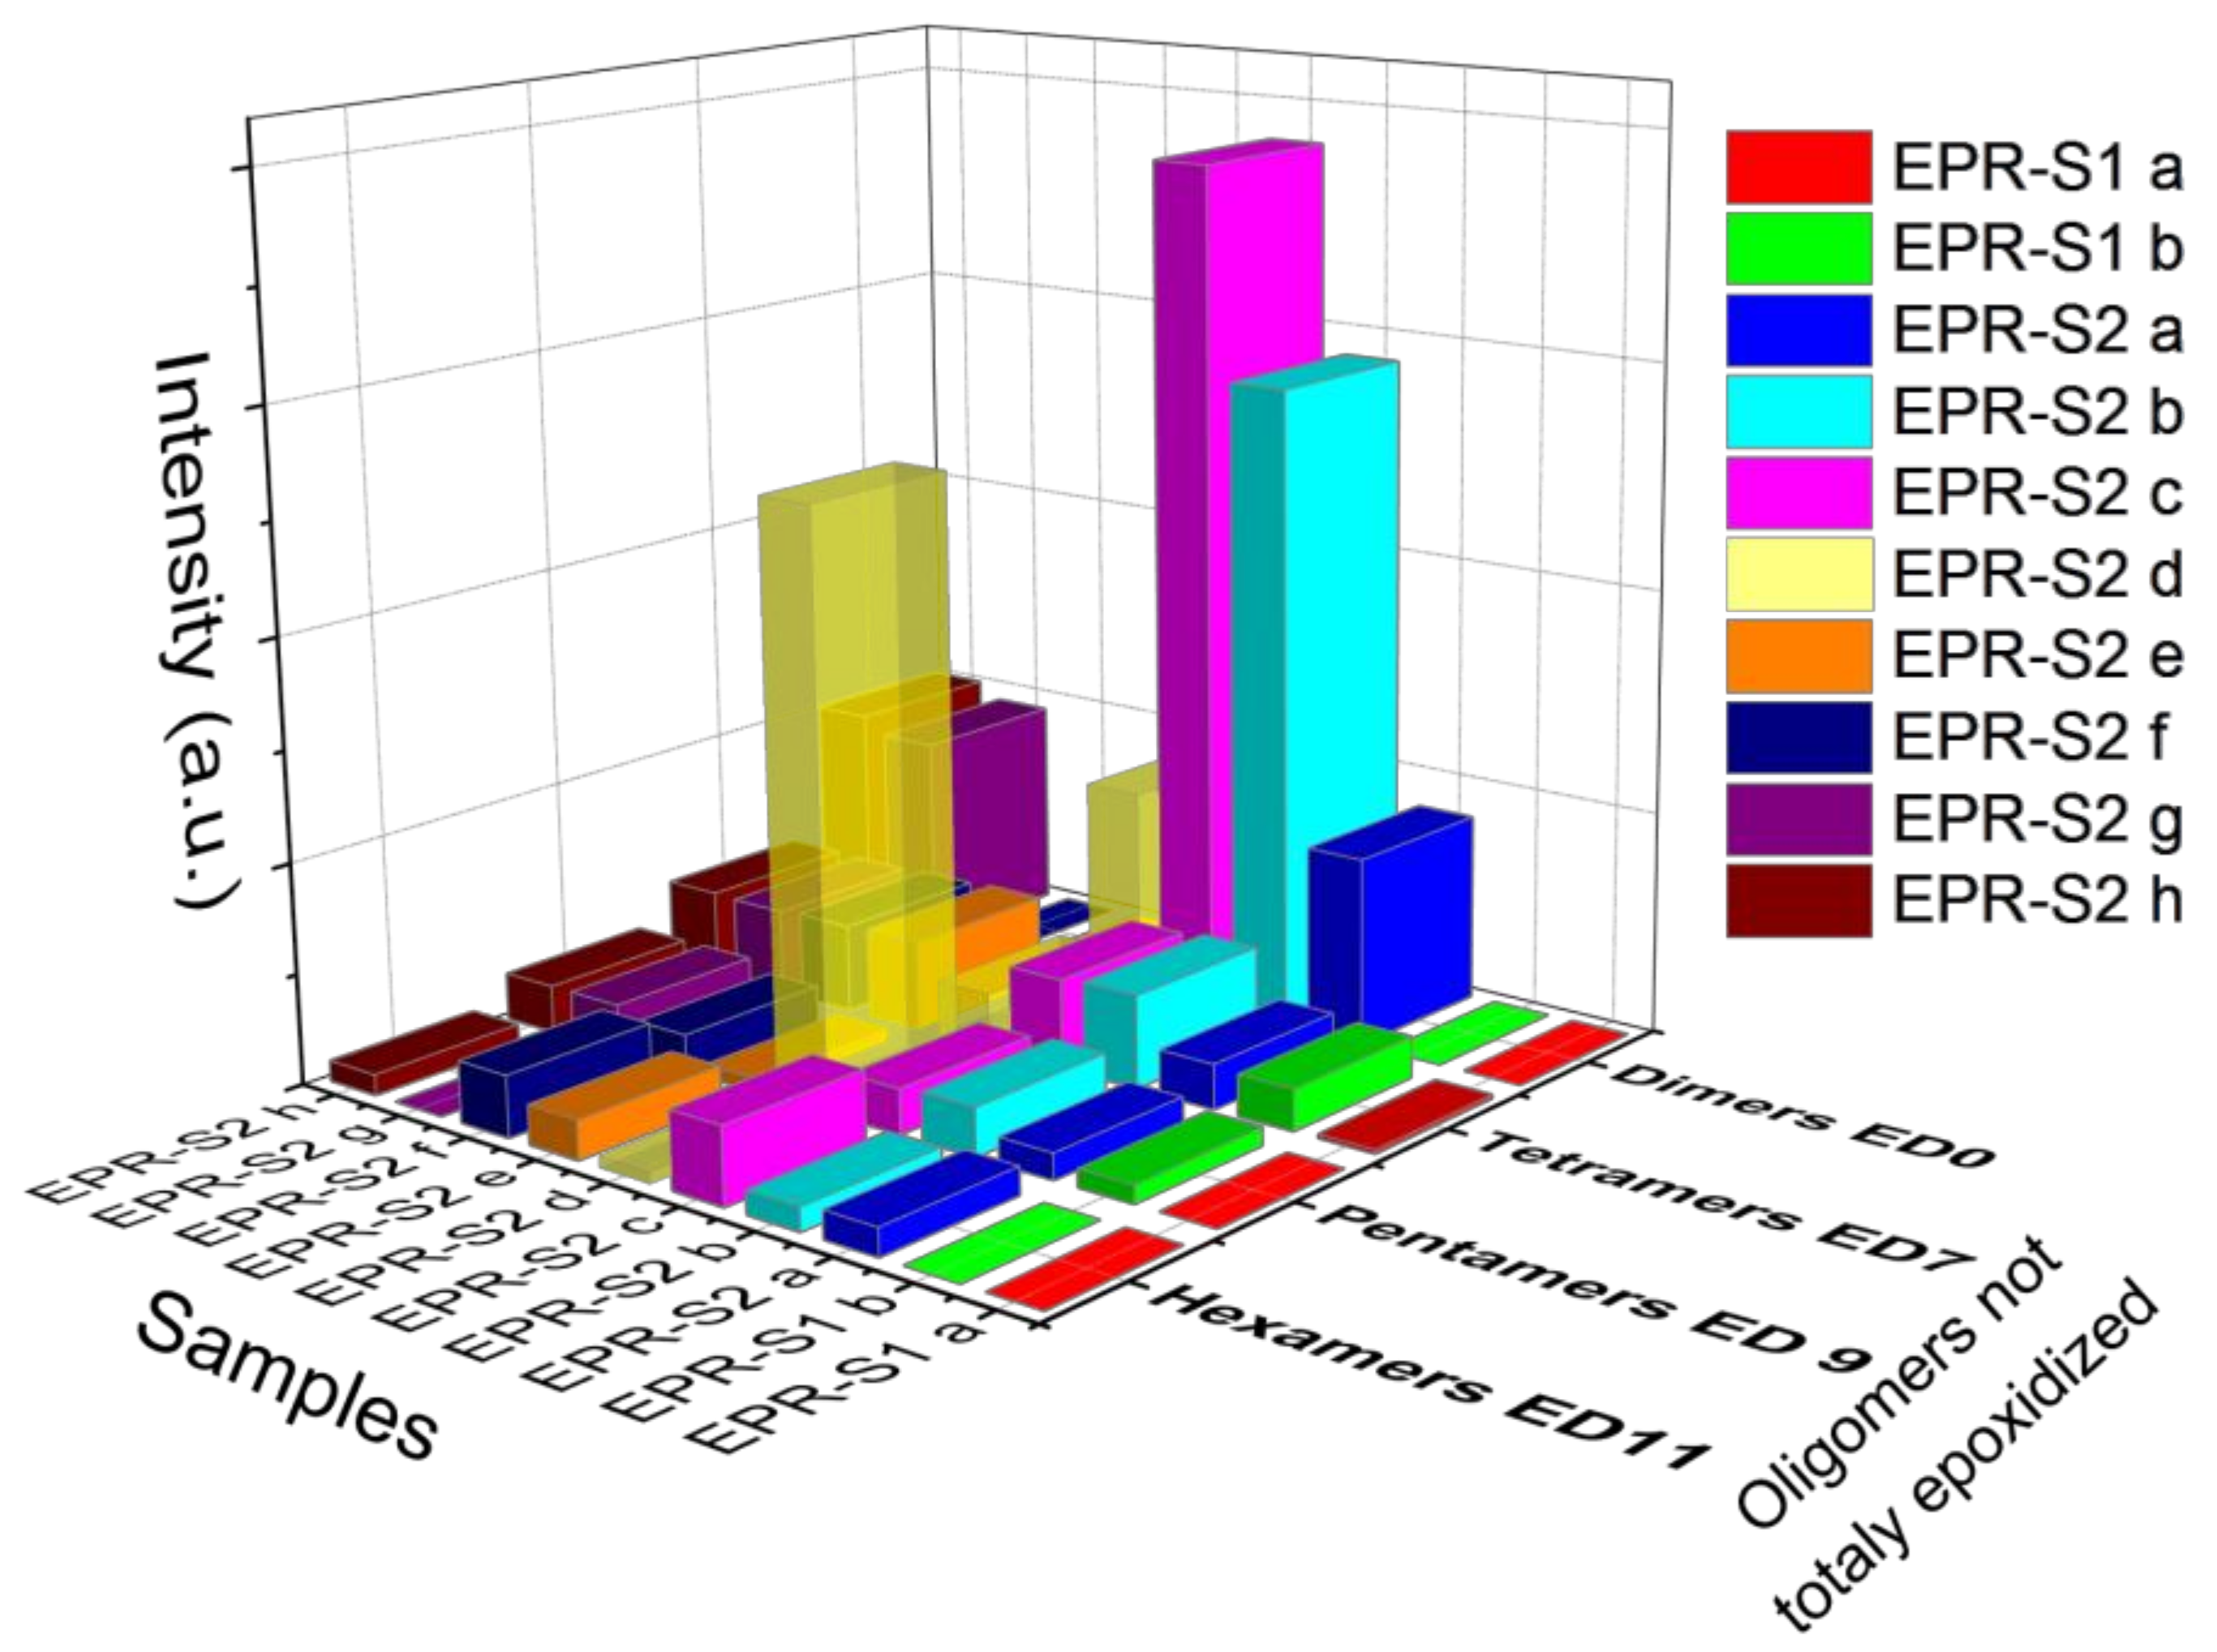
Observing the spectra (Figure 8 and Figure 9), there are significant concentrations of the dimer ED4 (715/716 Da) at all the samples. Some samples showed in their composition, the dimer ED0 (491/492 Da). In this case, it can be considered as a contaminant in the mixture because this structure does not have epoxy groups to support crosslinking. In all samples, considerable concentrations of the trimer ED6 (1068/1069 Da) were present in their composition. Also, all the samples showed traces of the tetramers ED7 (1365/1366 Da) and ED8 (1420/1421 Da). An important characteristic was that the samples EPR-S2_c and EPR-S2_f contained several traces of secondary products (oligomers not epoxidized entirely) in the region of 500–1000 Da, which affects the physical-chemical properties. Thus, although the samples theoretically have the same composition, due to the findings, it is probable that their physical-chemical properties are not the same. Also, a significant characteristic to observe is the influence of the incomplete oligomers in the photoresists. The spectra in Figure 13 and Figure 14 present the amount of the oligomers and the incomplete oligomers for the different samples.
The samples presented different compositions mainly in the dimers and trimers (Figure 13) and in the non-epoxidized dimers (dimers ED0, Figure 14) (e.g., EPR-S2_b and EPR-S2_c are the most concentrated with respect to dimers ED0; the sample EPR-S2_c shows almost four times higher concentration than the other samples). The samples of EPR-S1 contain a small amount of dimer ED0. It is important to mention that the concentration of the dimers ED0 in the samples is comparable to the epoxidized oligomers with respect to the intensity values.
4. Conclusions
Negative photoresists based on epoxy resins and applied in deep X-ray lithography were evaluated by FTIR and presented similar profiles concerning the organic groups in the mixture. However, between the series EPR-S1 and EPR-S2, a small difference in the region of the carbonyl groups was observed. By TGA, different amounts of solvent in the same lot of photoresist were observed. Although this result does not seem to be significantly important for standard applications, this difference can be significant in X-ray microlithography fabrication, where structures with sizes in the micron range and accuracy in the sub-micron range has to be achieved. By MALDI-TOF analyses, it was possible to observe different profiles regarding the oligomer content. Some photoresists (EPR-S2_b and EPR-S2_c) presented significant amounts of non-epoxidized groups. This evaluation can be a key to achieve better quality structures in microfabrication. In the future, it is important to correlate the differences in solvent and oligomer content with the physical-chemical properties of the photoresists and the characteristics of the microstructures.
Acknowledgments
The authors acknowledge the German Academic Exchange Service (DAAD) for its financial support and the Karlsruhe Nano and Micro Facility (KNMF-KIT)—a research infrastructure in the Helmholtz Association—and the Federal University of Paraná for allowing the authors to perform the experiments.
Author Contributions
Vitor Vlnieska and Margarita Zakharova did the sample preparation and the qualitative evaluation at the cleanroom facilities, Martin Börner performed the exposures at the LIGA beamline of the ANKA Synchrotron facilities, Klaus Bade and Jürgen Mohr collaborated to optimize the experimental work methodologies, and Vitor Vlnieska and Danays Kunka proposed the main strategy to evaluate negative tone photoresists. Vitor Vlnieska and Danays Kunka planned the experiments and selected the samples to be used. Vitor Vlnieska performed the experiments and interpretation of data. The manuscript was written by Vitor Vlnieska with support from all of the co-authors.
Conflicts of Interest
The authors declare no conflict of interest.
References
- Kunka, D.; Mohr, J.; Nazmov, V.; Meiser, J.; Meyer, P.; Amberger, M.; Koch, F.; Schulz, J.; Walter, M.; Duttenhofer, T.; et al. Characterization method for new resist formulations for HAR patterns made by X-ray lithography. Microsyst. Technol. 2014, 20, 2023–2029. [Google Scholar] [CrossRef]
- Koukharenko, E.; Kraft, M.; Ensell, G.J.; Hollinshead, N. A comparative study of different thick photoresists for MEMS applications. J. Mater. Sci. Mater. Electron. 2005, 16, 741–747. [Google Scholar] [CrossRef]
- Cheng, C.-M.; Chen, R.-H. Key issues in fabricating microstructures with high aspect ratios by using deep X-ray lithography. Microelectron. Eng. 2004, 71, 335–342. [Google Scholar] [CrossRef]
- Ruilin, Z.; Wei, S.; Xuyuan, C. Characterizing and smoothing of striated sidewall morphology on UV-exposed thick SU-8 structures for micromachining millimeter wave circuits. J. Micromech. Microeng. 2010, 20, 035007. [Google Scholar]
- Seidemann, V.; Bütefisch, S.; Büttgenbach, S. Fabrication and investigation of in-plane compliant SU8 structures for MEMS and their application to micro valves and micro grippers. Sens. Actuators A Phys. 2002, 97–98, 457–461. [Google Scholar] [CrossRef]
- Toshihiko, T.; Mitsuaki, M.; Hiroaki, O.; Taro, O. Freeze-Drying Process to Avoid Resist Pattern Collapse. Jpn. J. Appl. Phys. 1993, 32, 5813. [Google Scholar]
- Toshiyuki, M.; Yoshinori, K.; Masatoshi, I.; Takuya, M.; Takaaki, S.; Fumikazu, O.; Shozo, I.; Takahiro, N. Influences of pretreatment and hard baking on the mechanical reliability of SU-8 microstructures. J. Micromech. Microeng. 2013, 23, 105016. [Google Scholar]
- Hamlett, C.A.E.; McHale, G.; Newton, M.I. Lithographically fabricated SU8 composite structures for wettability control. Surf. Coat. Technol. 2014, 240, 179–183. [Google Scholar] [CrossRef]
- Tanaka, T.; Morigami, M.; Atoda, N. Mechanism of Resist Pattern Collapse during Development Process. Jpn. J. Appl. Phys. 1993, 32, 6059. [Google Scholar] [CrossRef]
- Khan Malek, C.G. SU8 resist for low-cost X-ray patterning of high-resolution, high-aspect-ratio MEMS. Microelectron. J. 2002, 33, 101–105. [Google Scholar] [CrossRef]
- Namatsu, H. Supercritical Drying for Nanostructure Fabrication. J. Photopolym. Sci. Technol. 2002, 15, 381–388. [Google Scholar] [CrossRef]
- Namatsu, H.; Yamazaki, K.; Kurihara, K. Supercritical resist dryer. J. Vac. Sci. Technol. B 2000, 18, 780–784. [Google Scholar] [CrossRef]
- Micro-chem–SU-8 3000–Data Sheet. Available online: http://microchem.com/pdf/SU-8%203000%20Data%20Sheet.pdf (accessed on 17 September 2017).
- Chiamori, H.C.; Brown, J.W.; Adhiprakasha, E.V.; Hantsoo, E.T.; Straalsund, J.B.; Melosh, N.A.; Pruitt, B.L. Suspension of nanoparticles in SU-8: Processing and characterization of nanocomposite polymers. Microelectron. J. 2008, 39, 228–236. [Google Scholar] [CrossRef]
- Jiguet, S.; Judelewicz, M.; Mischler, S.; Hofmann, H.; Bertsch, A.; Renaud, P. SU-8 nanocomposite coatings with improved tribological performance for MEMS. Surf. Coat. Technol. 2006, 201, 2289–2295. [Google Scholar] [CrossRef]
- Ruano-López, J.M.; Aguirregabiria, M.; Tijero, M.; Arroyo, M.T.; Elizalde, J.; Berganzo, J.; Aranburu, I.; Blanco, F.J.; Mayora, K. A new SU-8 process to integrate buried waveguides and sealed microchannels for a Lab-on-a-Chip. Sens. Actuators B Chem. 2006, 114, 542–551. [Google Scholar] [CrossRef]
- Bednorz, M.; Urbańczyk, M.; Pustelny, T.; Piotrowska, A.; Papis, E.; Sidor, Z.; Kamińska, E. Application of SU8 polymer in waveguide interferometer ammonia sensor. Mol. Quantum Acoust. 2006, 27, 31–40. [Google Scholar]
- Gut, K. Bimodal Layers of the Polymer SU8 as Refractometer. Procedia Eng. 2012, 47, 326–329. [Google Scholar] [CrossRef]
- Hill, G.C.; Melamud, R.; Declercq, F.E.; Davenport, A.A.; Chan, I.H.; Hartwell, P.G.; Pruitt, B.L. SU-8 MEMS Fabry-Perot pressure sensor. Sens. Actuators A Phys. 2007, 138, 52–62. [Google Scholar] [CrossRef]
- Brien, J.O.; Hughes, P.J.; Brunet, M.; Neill, B.O.; Alderman, J.; Lane, B.; Riordan, A.O.; Driscoll, C.O. Advanced photoresist technologies for microsystems. J. Micromech. Microeng. 2001, 11, 353. [Google Scholar] [CrossRef]
- Gelorme, J.D.; Cox, R.J.; Gutierrez, S.A. Photoresist Composition and Printed Circuit Boards and Packages Made Therewith. U.S. Patent 4,882,245, 21 November 1989. [Google Scholar]
- Tung, K.K.; Wong, W.H.; Pun, E.Y.B. Polymeric optical waveguides using direct ultraviolet photolithography process. Appl. Phys. A 2005, 80, 621–626. [Google Scholar] [CrossRef]
- Crivello, J.V.; Lam, J.H.W. Triarylsulfonium salts as photoinitiators of free radical and cationic polymerization. J. Polym. Sci. Polym. Lett. Ed. 1979, 17, 759–764. [Google Scholar] [CrossRef]
- Dickson, L.W.; Singh, A. Radiation curing of epoxies. Int. J. Radiat. Appl. Instrum. Part C Radiat. Phys. Chem. 1988, 31, 587–593. [Google Scholar] [CrossRef]
- Rath, S.K.; Boey, F.Y.C.; Abadie, M.J.M. Cationic electron-beam curing of a high-functionality epoxy: Effect of post-curing on glass transition and conversion. Polym. Int. 2004, 53, 857–862. [Google Scholar] [CrossRef]
- Zhang, J.; Tan, K.L.; Hong, G.D.; Yang, L.J.; Gong, H.Q. Polymerization optimization of SU-8 photoresist and its applications in microfluidic systems and MEMS. J. Micromech. Microeng. 2001, 11, 20. [Google Scholar] [CrossRef]
- Zhang, J.; Tan, K.L.; Gong, H.Q. Characterization of the polymerization of SU-8 photoresist and its applications in micro-electro-mechanical systems (MEMS). Polym. Test. 2001, 20, 693–701. [Google Scholar] [CrossRef]
- Jiguet, S.; Judelewicz, M.; Mischler, S.; Bertch, A.; Renaud, P. Effect of filler behavior on nanocomposite SU8 photoresist for moving micro-parts. Microelectron. Eng. 2006, 83, 1273–1276. [Google Scholar] [CrossRef]
- Yeh, W.-M. Pattern Collapse in Lithographic Nanostructures: Quantifying Photoresist Nanostructure Behavior and Novel Methods for Collapse Mitigation. Ph.D. Dissertation, Georgia Institute of Technology, Atlanta, GA, USA, 2013. [Google Scholar]
- Bogunovic, L.; Anselmetti, D.; Regtmeier, J. Photolithographic fabrication of arbitrarily shaped SU-8 microparticles without sacrificial release layers. J. Micromech. Microeng. 2011, 21, 027003. [Google Scholar] [CrossRef]
- Harutaka, M. Relationship between aspect ratio and narrowing of reflowed photoresist structures. Jpn. J. Appl. Phys. 2015, 54, 06FM01. [Google Scholar]
- Huang, Y.T.; Hsu, W. A simulation model on photoresist SU-8 thickness after development under partial exposure with reflection effect. Jpn. J. Appl. Phys. 2014, 53, 036505. [Google Scholar] [CrossRef]
- Xu, M.-J.; Ma, Y.; Hou, M.-J.; Li, B. Synthesis of a cross-linked triazine phosphine polymer and its effect on fire retardancy, thermal degradation and moisture resistance of epoxy resins. Polym. Degrad. Stab. 2015, 119, 14–22. [Google Scholar] [CrossRef]
- Tirta, A.; Baek, E.R.; Chang, S.S.; Kim, J.H. Fabrication of porous material for micro component application by direct X-ray lithography and sintering. Microelectron. Eng. 2012, 98, 297–300. [Google Scholar] [CrossRef]
- Mautjana, N.A.; Pasch, H. Matrix-Assisted Laser Desorption Ionization Mass Spectrometry of Synthetic Polymers. Macromol. Symp. 2012, 313–314, 157–161. [Google Scholar] [CrossRef]
- Puglisi, C.; Samperi, F.; Carroccio, S.; Montaudo, G. MALDI−TOF Investigation of Polymer Degradation. Pyrolysis of Poly(bisphenol A carbonate). Macromolecules 1999, 32, 8821–8828. [Google Scholar] [CrossRef]
- Bahr, U.; Deppe, A.; Karas, M.; Hillenkamp, F.; Giessmann, U. Mass spectrometry of synthetic polymers by UV-matrix-assisted laser desorption/ionization. Anal. Chem. 1992, 64, 2866–2869. [Google Scholar] [CrossRef]
- Esser, E.; Keil, C.; Braun, D.; Montag, P.; Pasch, H. Matrix-assisted laser desorption/ionization mass spectrometry of synthetic polymers. 4. Coupling of size exclusion chromatography and MALDI-TOF using a spray-deposition interface. Polymer 2000, 41, 4039–4046. [Google Scholar] [CrossRef]
- Du, G.; Lei, H.; Pizzi, A.; Pasch, H. Synthesis–structure–performance relationship of cocondensed phenol–urea–formaldehyde resins by MALDI-ToF and 13C NMR. J. Appl. Polym. Sci. 2008, 110, 1182–1194. [Google Scholar] [CrossRef]
- Murgasova, R.; Hercules, D.M. MALDI of synthetic polymers—An update. Int. J. Mass Spectrom. 2003, 226, 151–162. [Google Scholar] [CrossRef]
- Schrod, M.; Rode, K.; Braun, D.; Pasch, H. Matrix-assisted laser desorption/ionization mass spectrometry of synthetic polymers. VI. Analysis of phenol–urea–formaldehyde cocondensates. J. Appl. Polym. Sci. 2003, 90, 2540–2548. [Google Scholar] [CrossRef]
- Belu, A.M.; DeSimone, J.M.; Linton, R.W.; Lange, G.W.; Friedman, R.M. Evaluation of matrix-assisted laser desorption ionization mass spectrometry for polymer characterization. J. Am. Soc. Mass Spectrom. 1996, 7, 11–24. [Google Scholar] [CrossRef]
- Jahanshahi, S.; Pizzi, A.; Abdulkhani, A.; Doosthoseini, K.; Shakeri, A.; Lagel, M.C.; Delmotte, L. MALDI-TOF, 13C NMR and FT-MIR analysis and strength characterization of glycidyl ether tannin epoxy resins. Ind. Crops Prod. 2016, 83, 177–185. [Google Scholar] [CrossRef]
- Hoong, Y.B.; Pizzi, A.; Chuah, L.A.; Harun, J. Phenol–urea–formaldehyde resin co-polymer synthesis and its influence on Elaeis palm trunk plywood mechanical performance evaluated by 13C NMR and MALDI-TOF mass spectrometry. Int. J. Adhes. Adhes. 2015, 63, 117–123. [Google Scholar] [CrossRef]
Figure 1.
Defects during the microfabrication process using LIGA (“Lithographie, Galvanoformung, Abformung”) technology: (a) unwanted cross-links; (b) lamellae deformation; (c) high aspect ratio (HAR) structure collapse; (d) cracks; (e) bubbles; and (f) bad adhesion (identified by non-homogeneity in the focusing imaging at a microscopic level, showing parts of the image blurry).

Figure 2.
Polymer structure for most of the negative tones of photoresists.
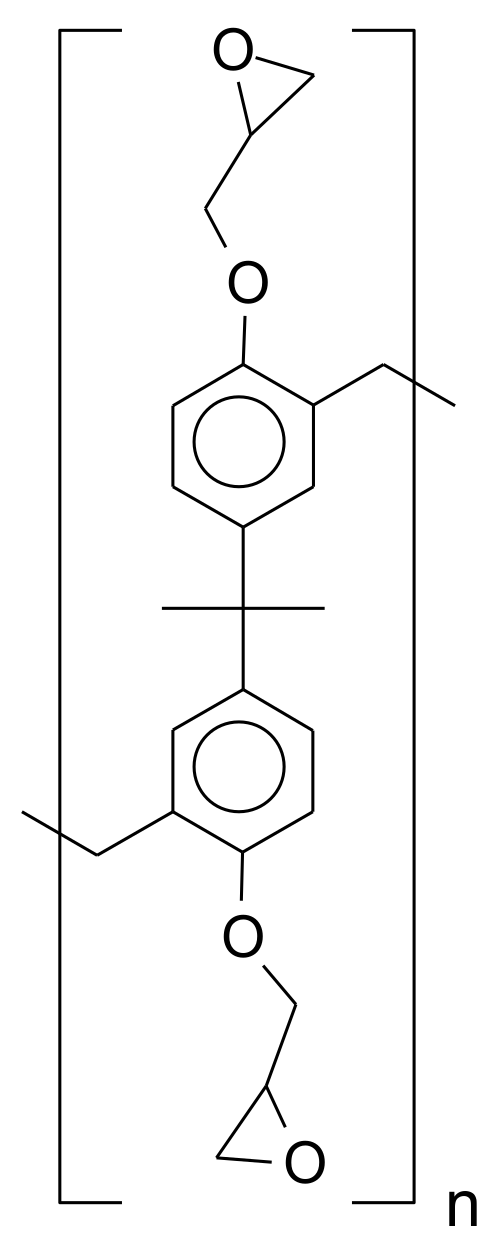
Figure 3.
Fourier-transform infrared (FTIR) spectra of sample EPR-S1_b.
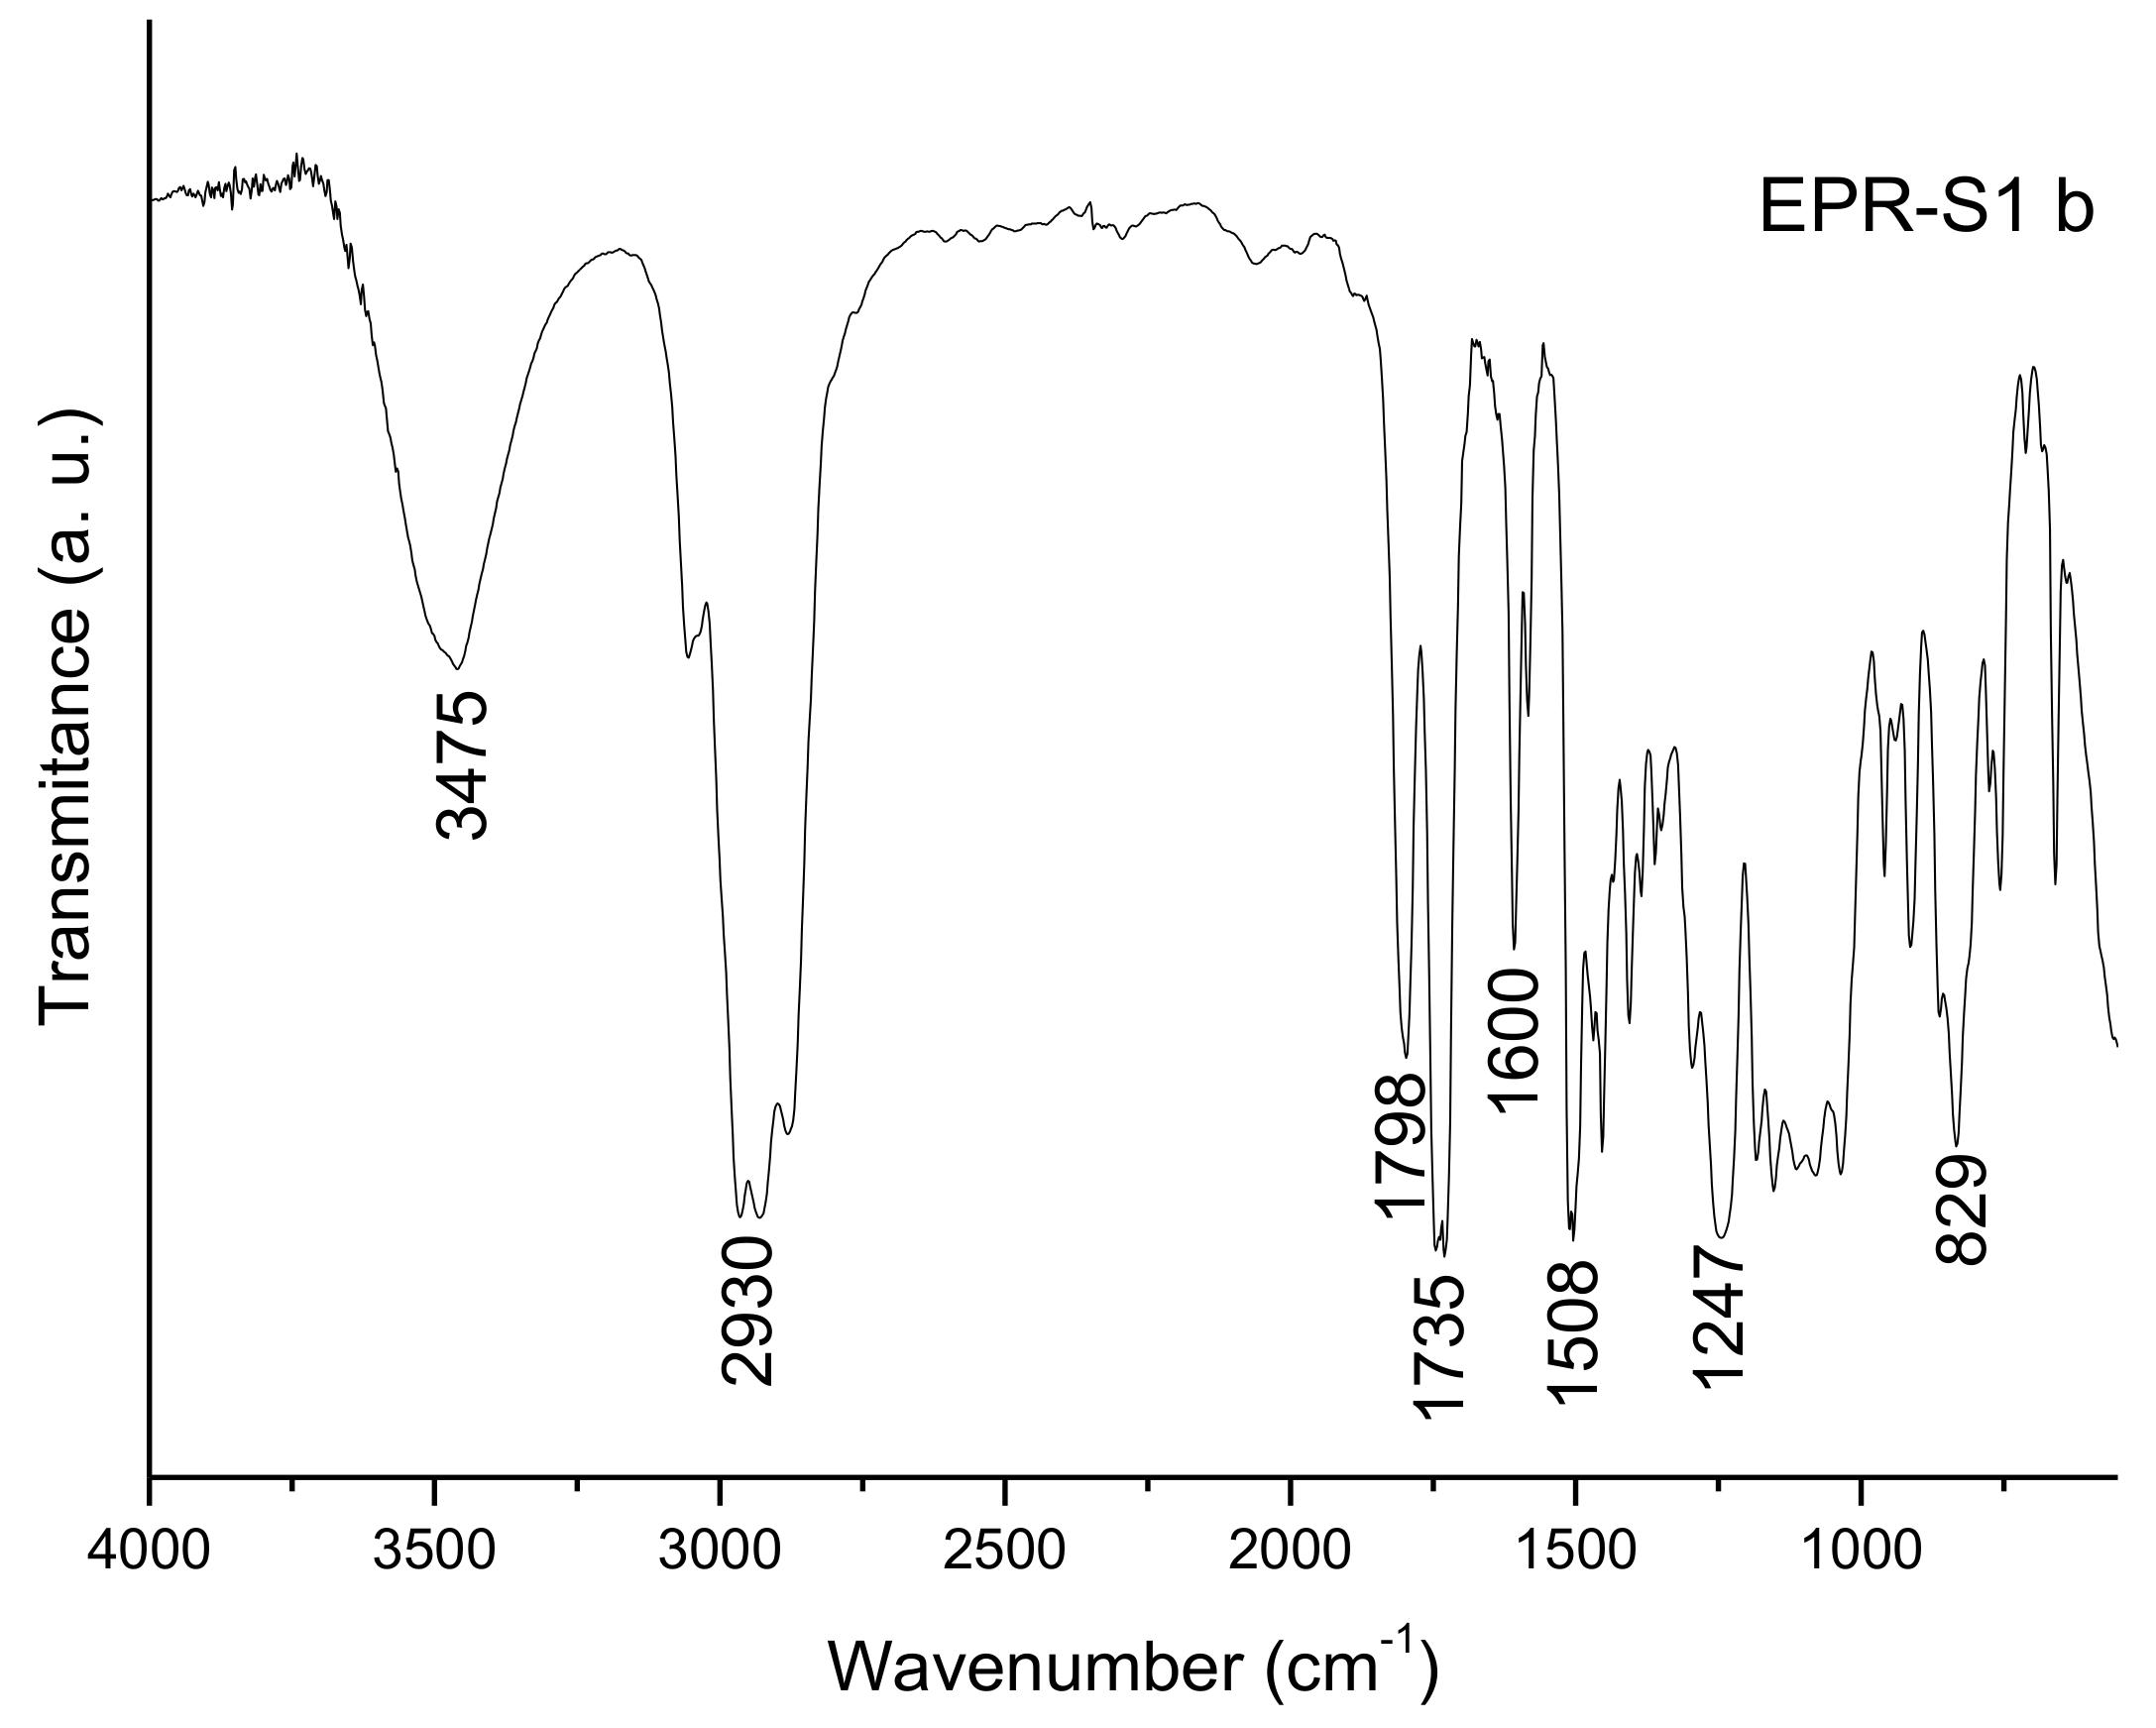
Figure 4.
Organic groups identified in the FTIR spectra analysis.

Figure 5.
FTIR spectra for all the samples.
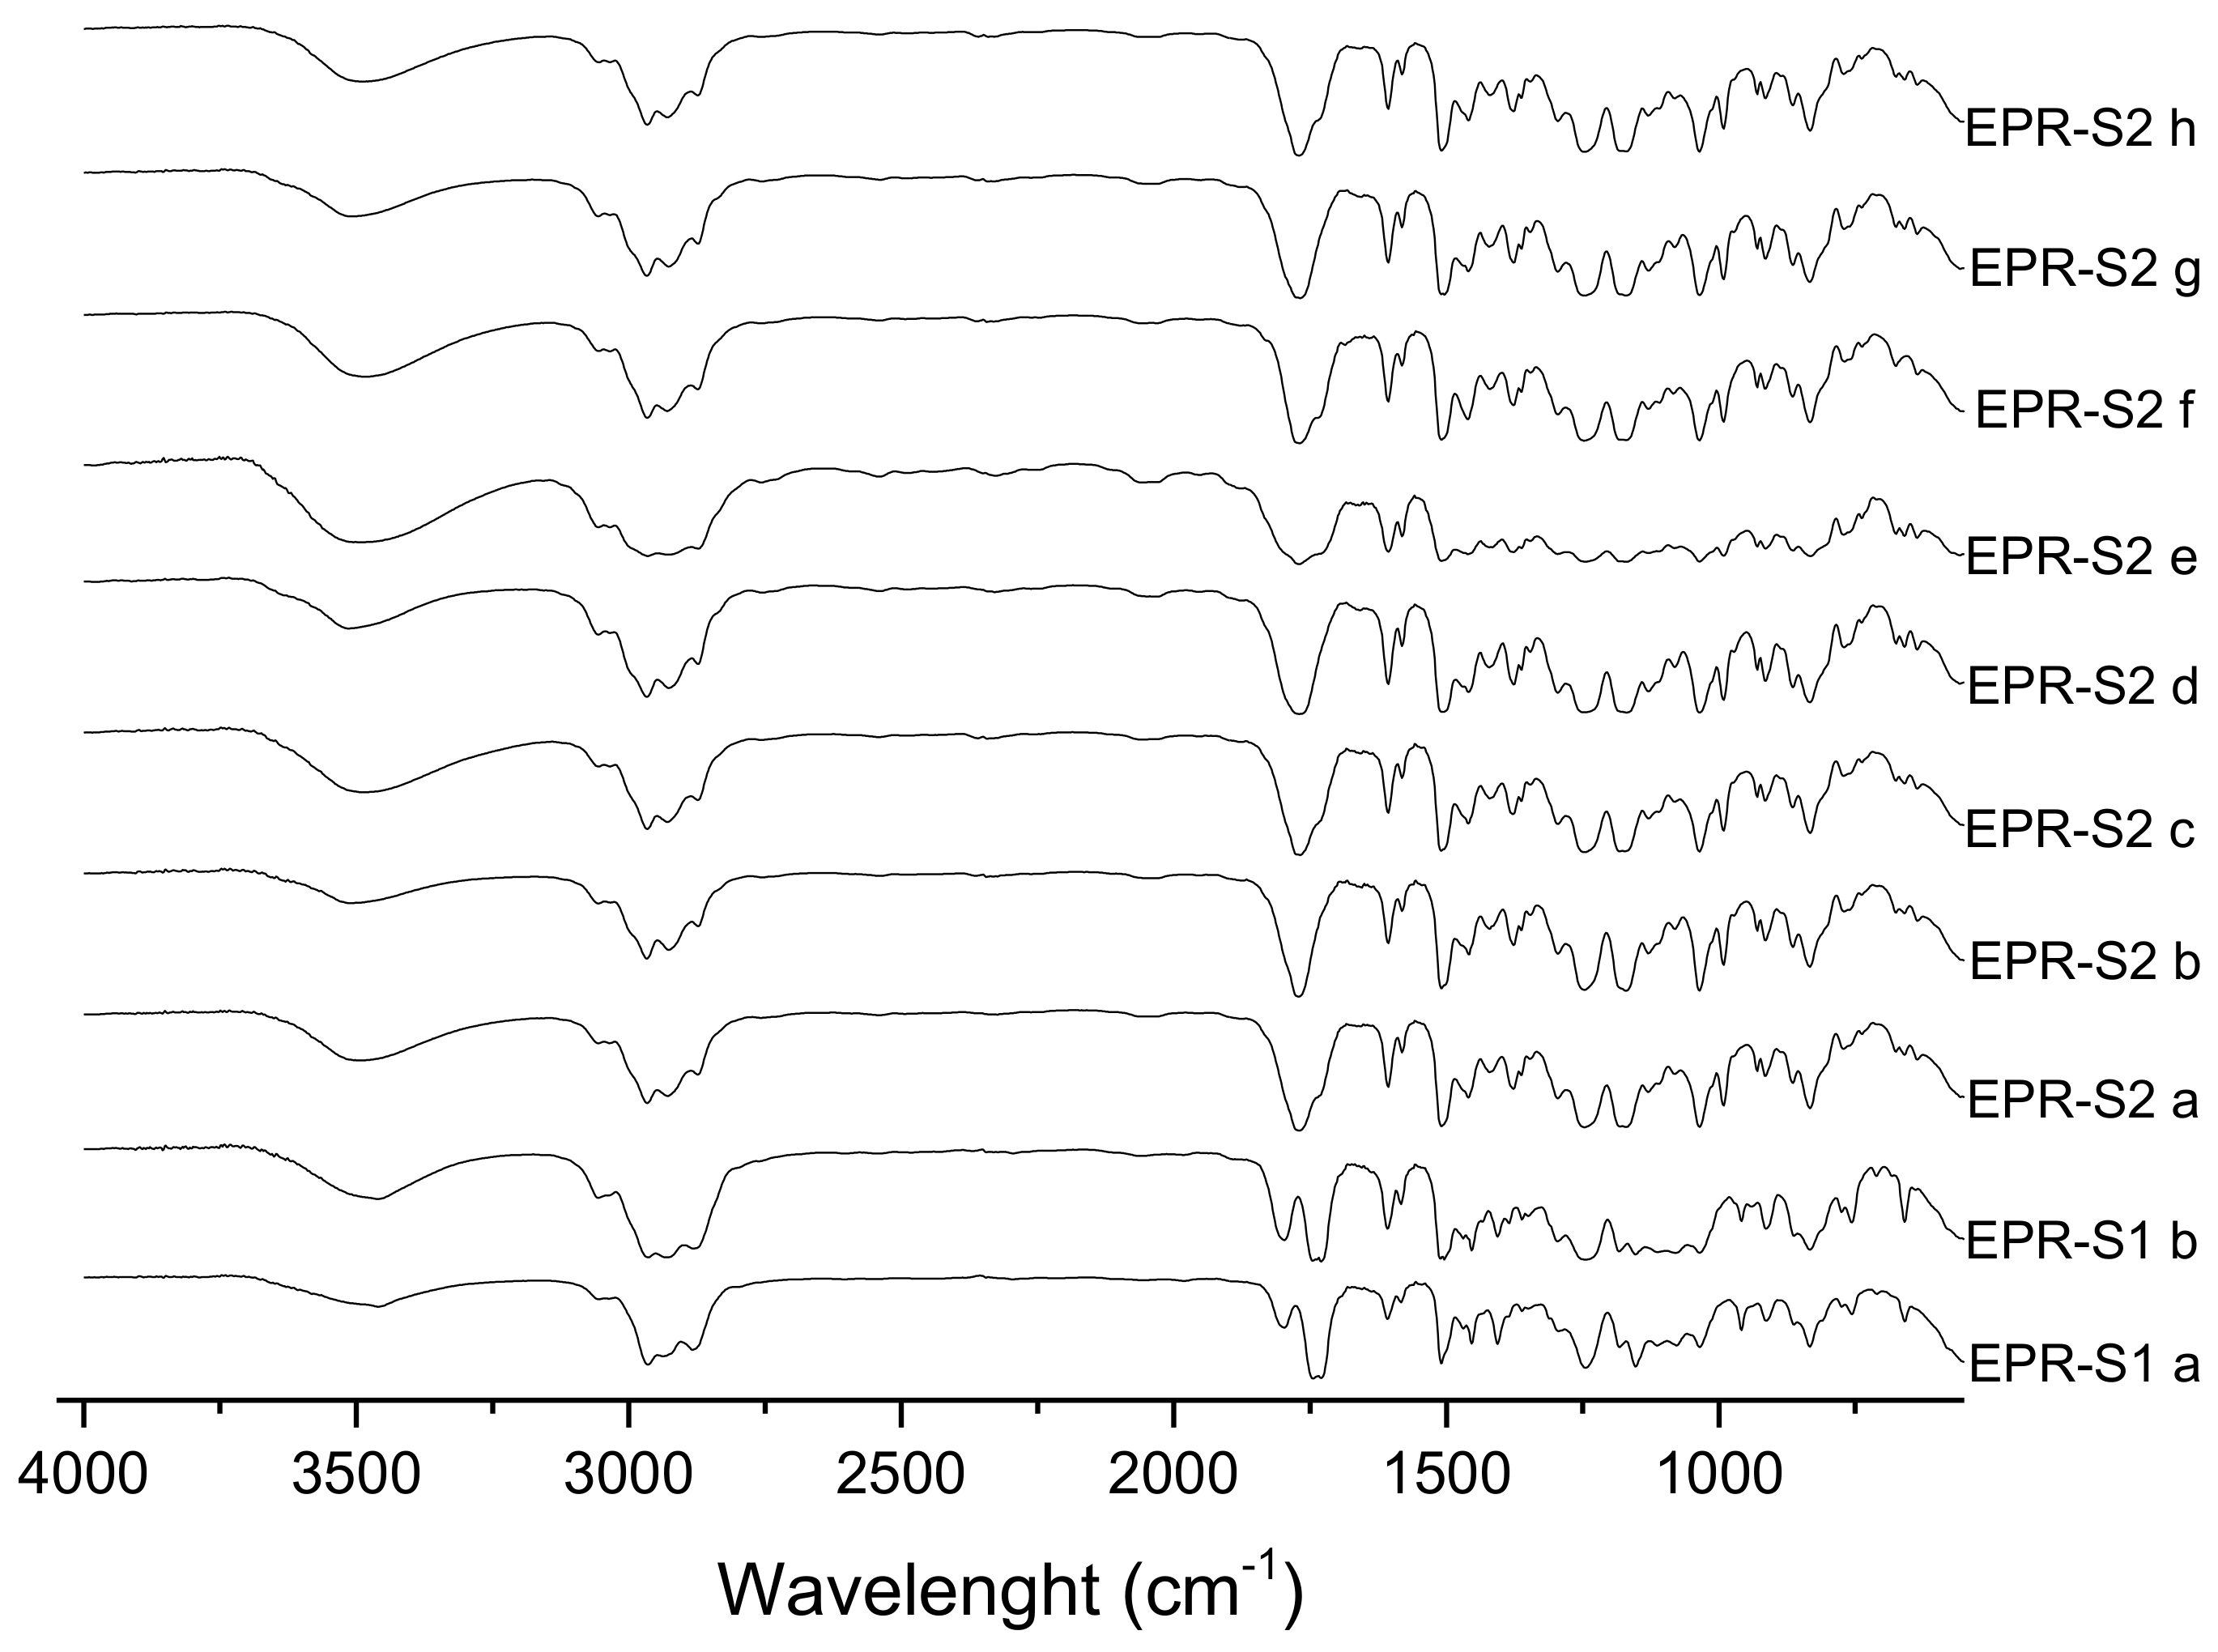
Figure 6.
Thermo gravimetric analysis (TGA) and derivative curve from sample EPR-S1_a.

Figure 7.
TGA of photo resins.

Figure 8.
Matrix assisted laser desorption ionization time of flight (MALDI-TOF) of the photo resin samples.
Figure 8.
Matrix assisted laser desorption ionization time of flight (MALDI-TOF) of the photo resin samples.
Figure 9.
Region of 450–1200 Da in the MALDI-TOF of the photo resin solution samples.
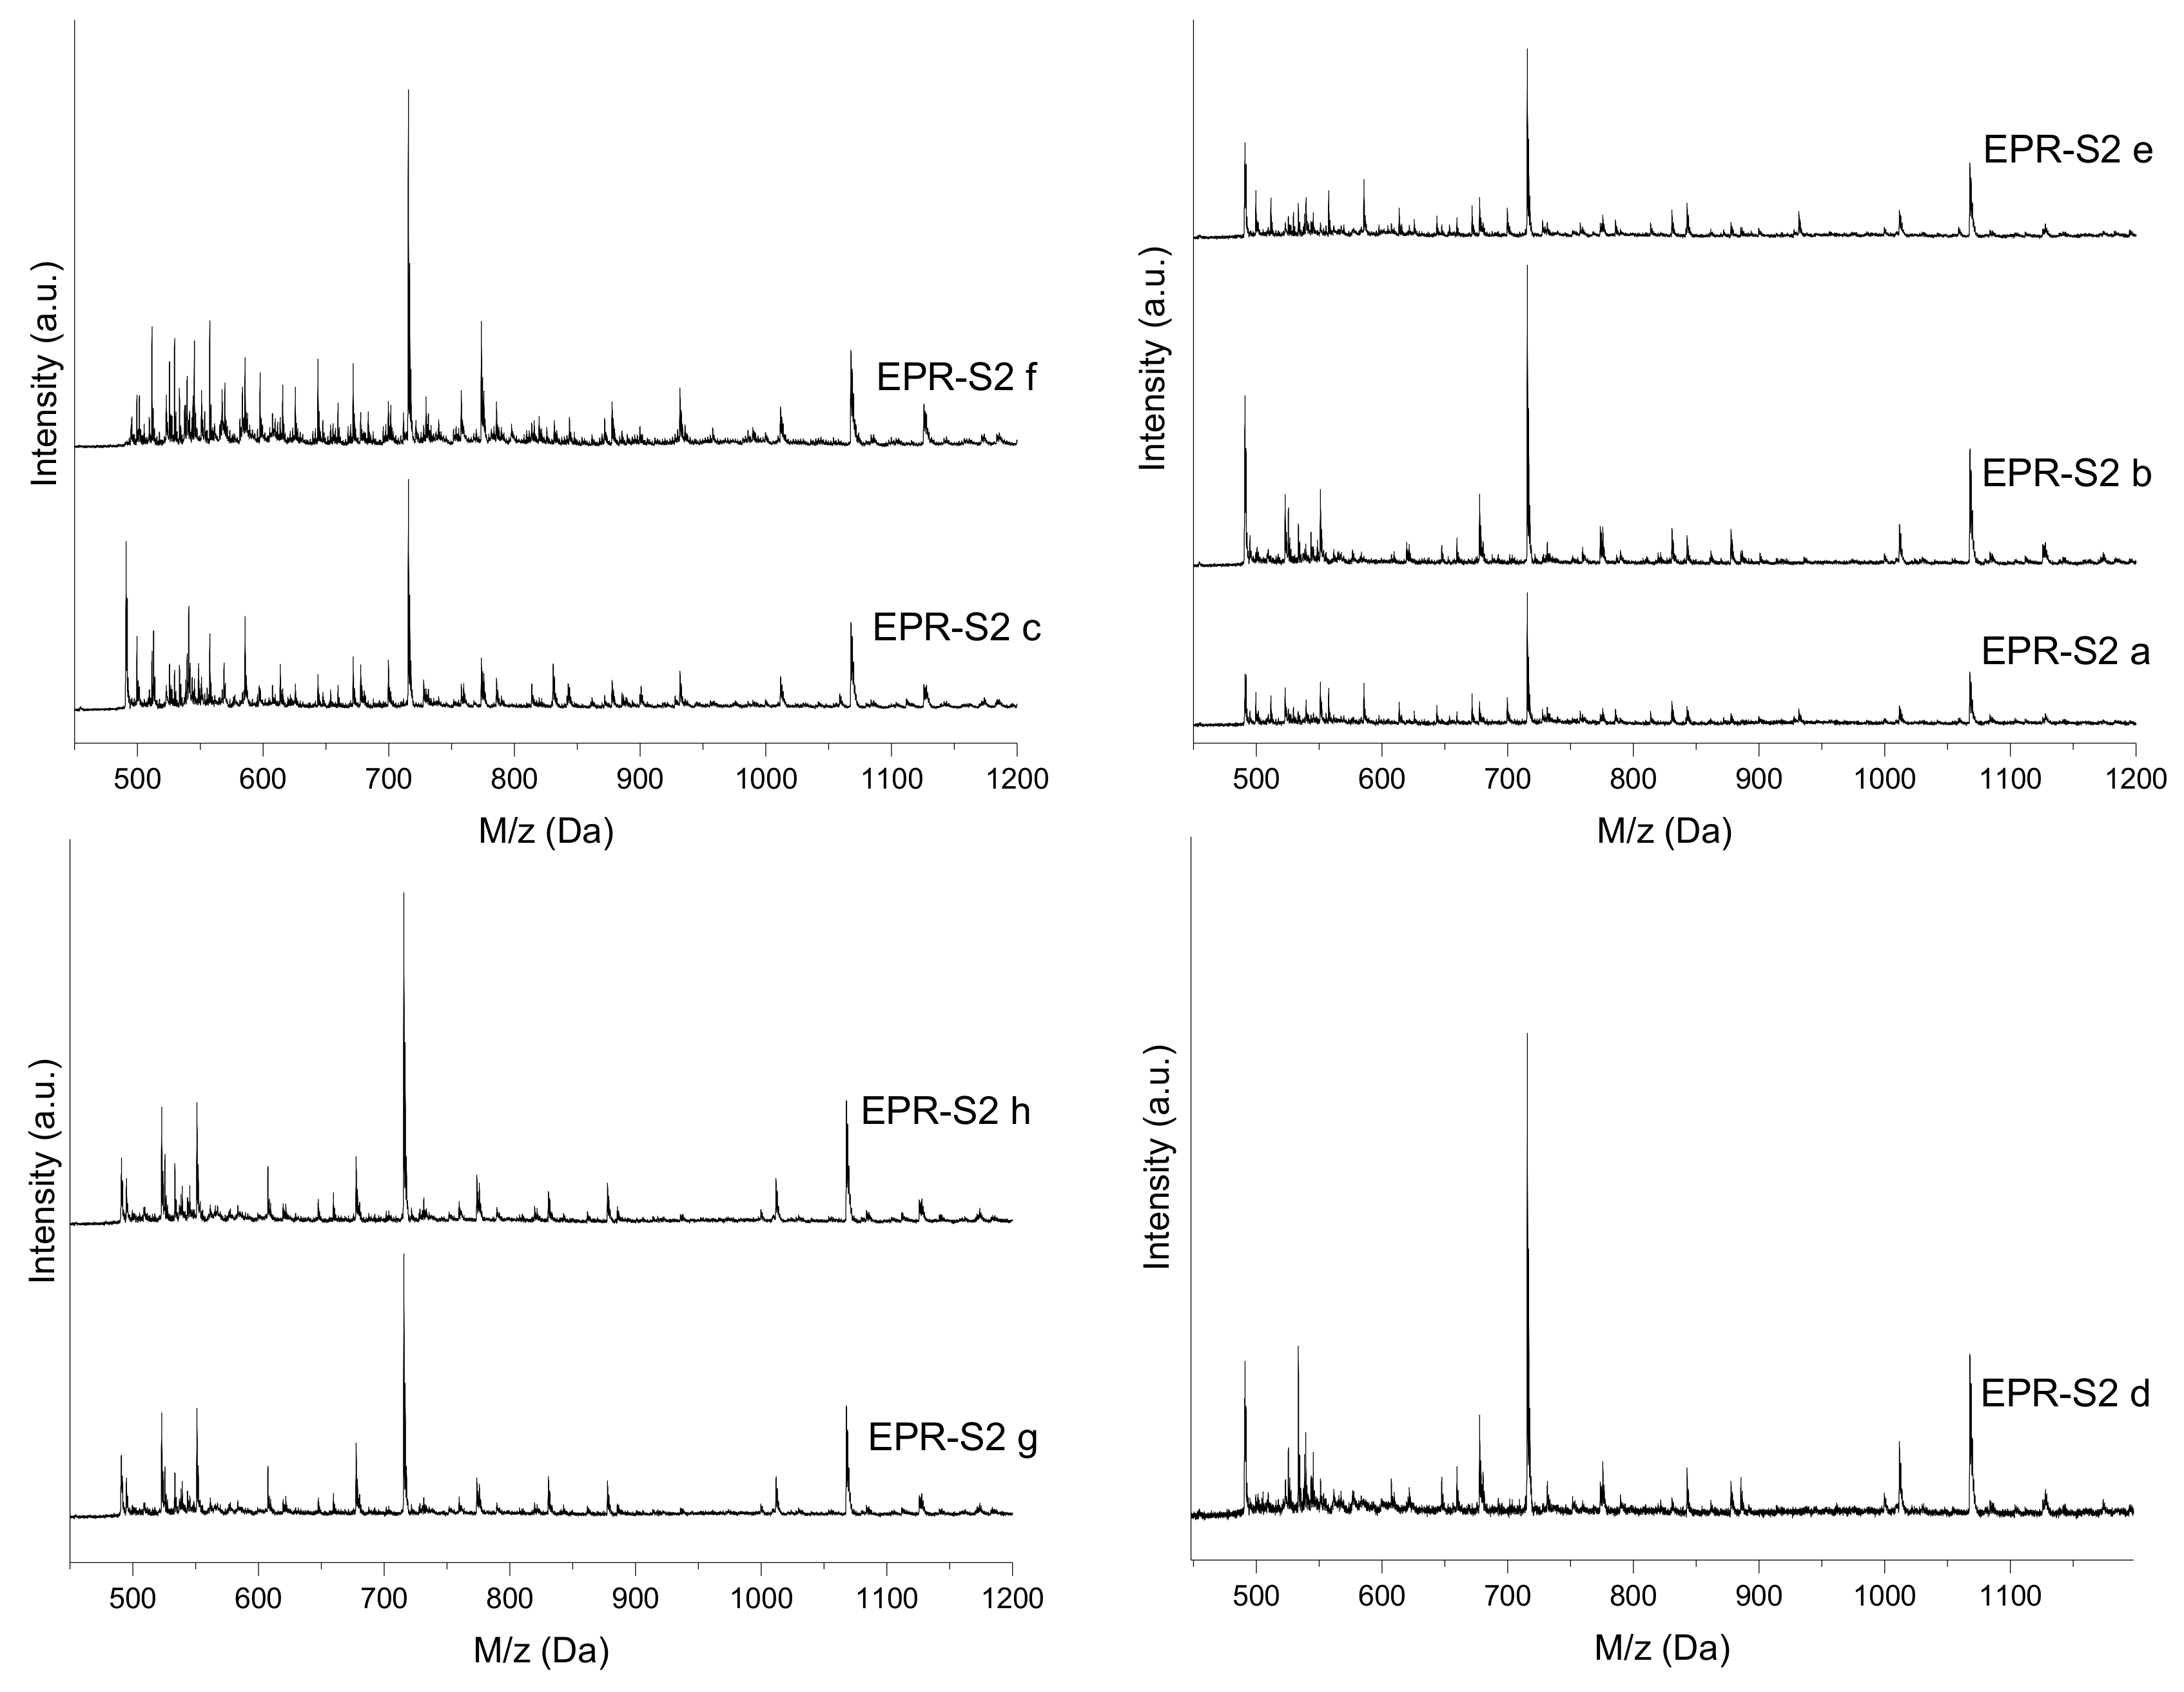
Figure 10.
Mass variation in function of the epoxidation degree.

Figure 11.
(a) Dihydroxybenzoic acid (DHB) adduct with the monomer, (b) Sodium adduct with the monomer.
Figure 11.
(a) Dihydroxybenzoic acid (DHB) adduct with the monomer, (b) Sodium adduct with the monomer.

Figure 12.
Oligomers structures related to the mass peaks at MALDI-TOF analysis.

Figure 13.
Compositions of entirely epoxidized oligomers.
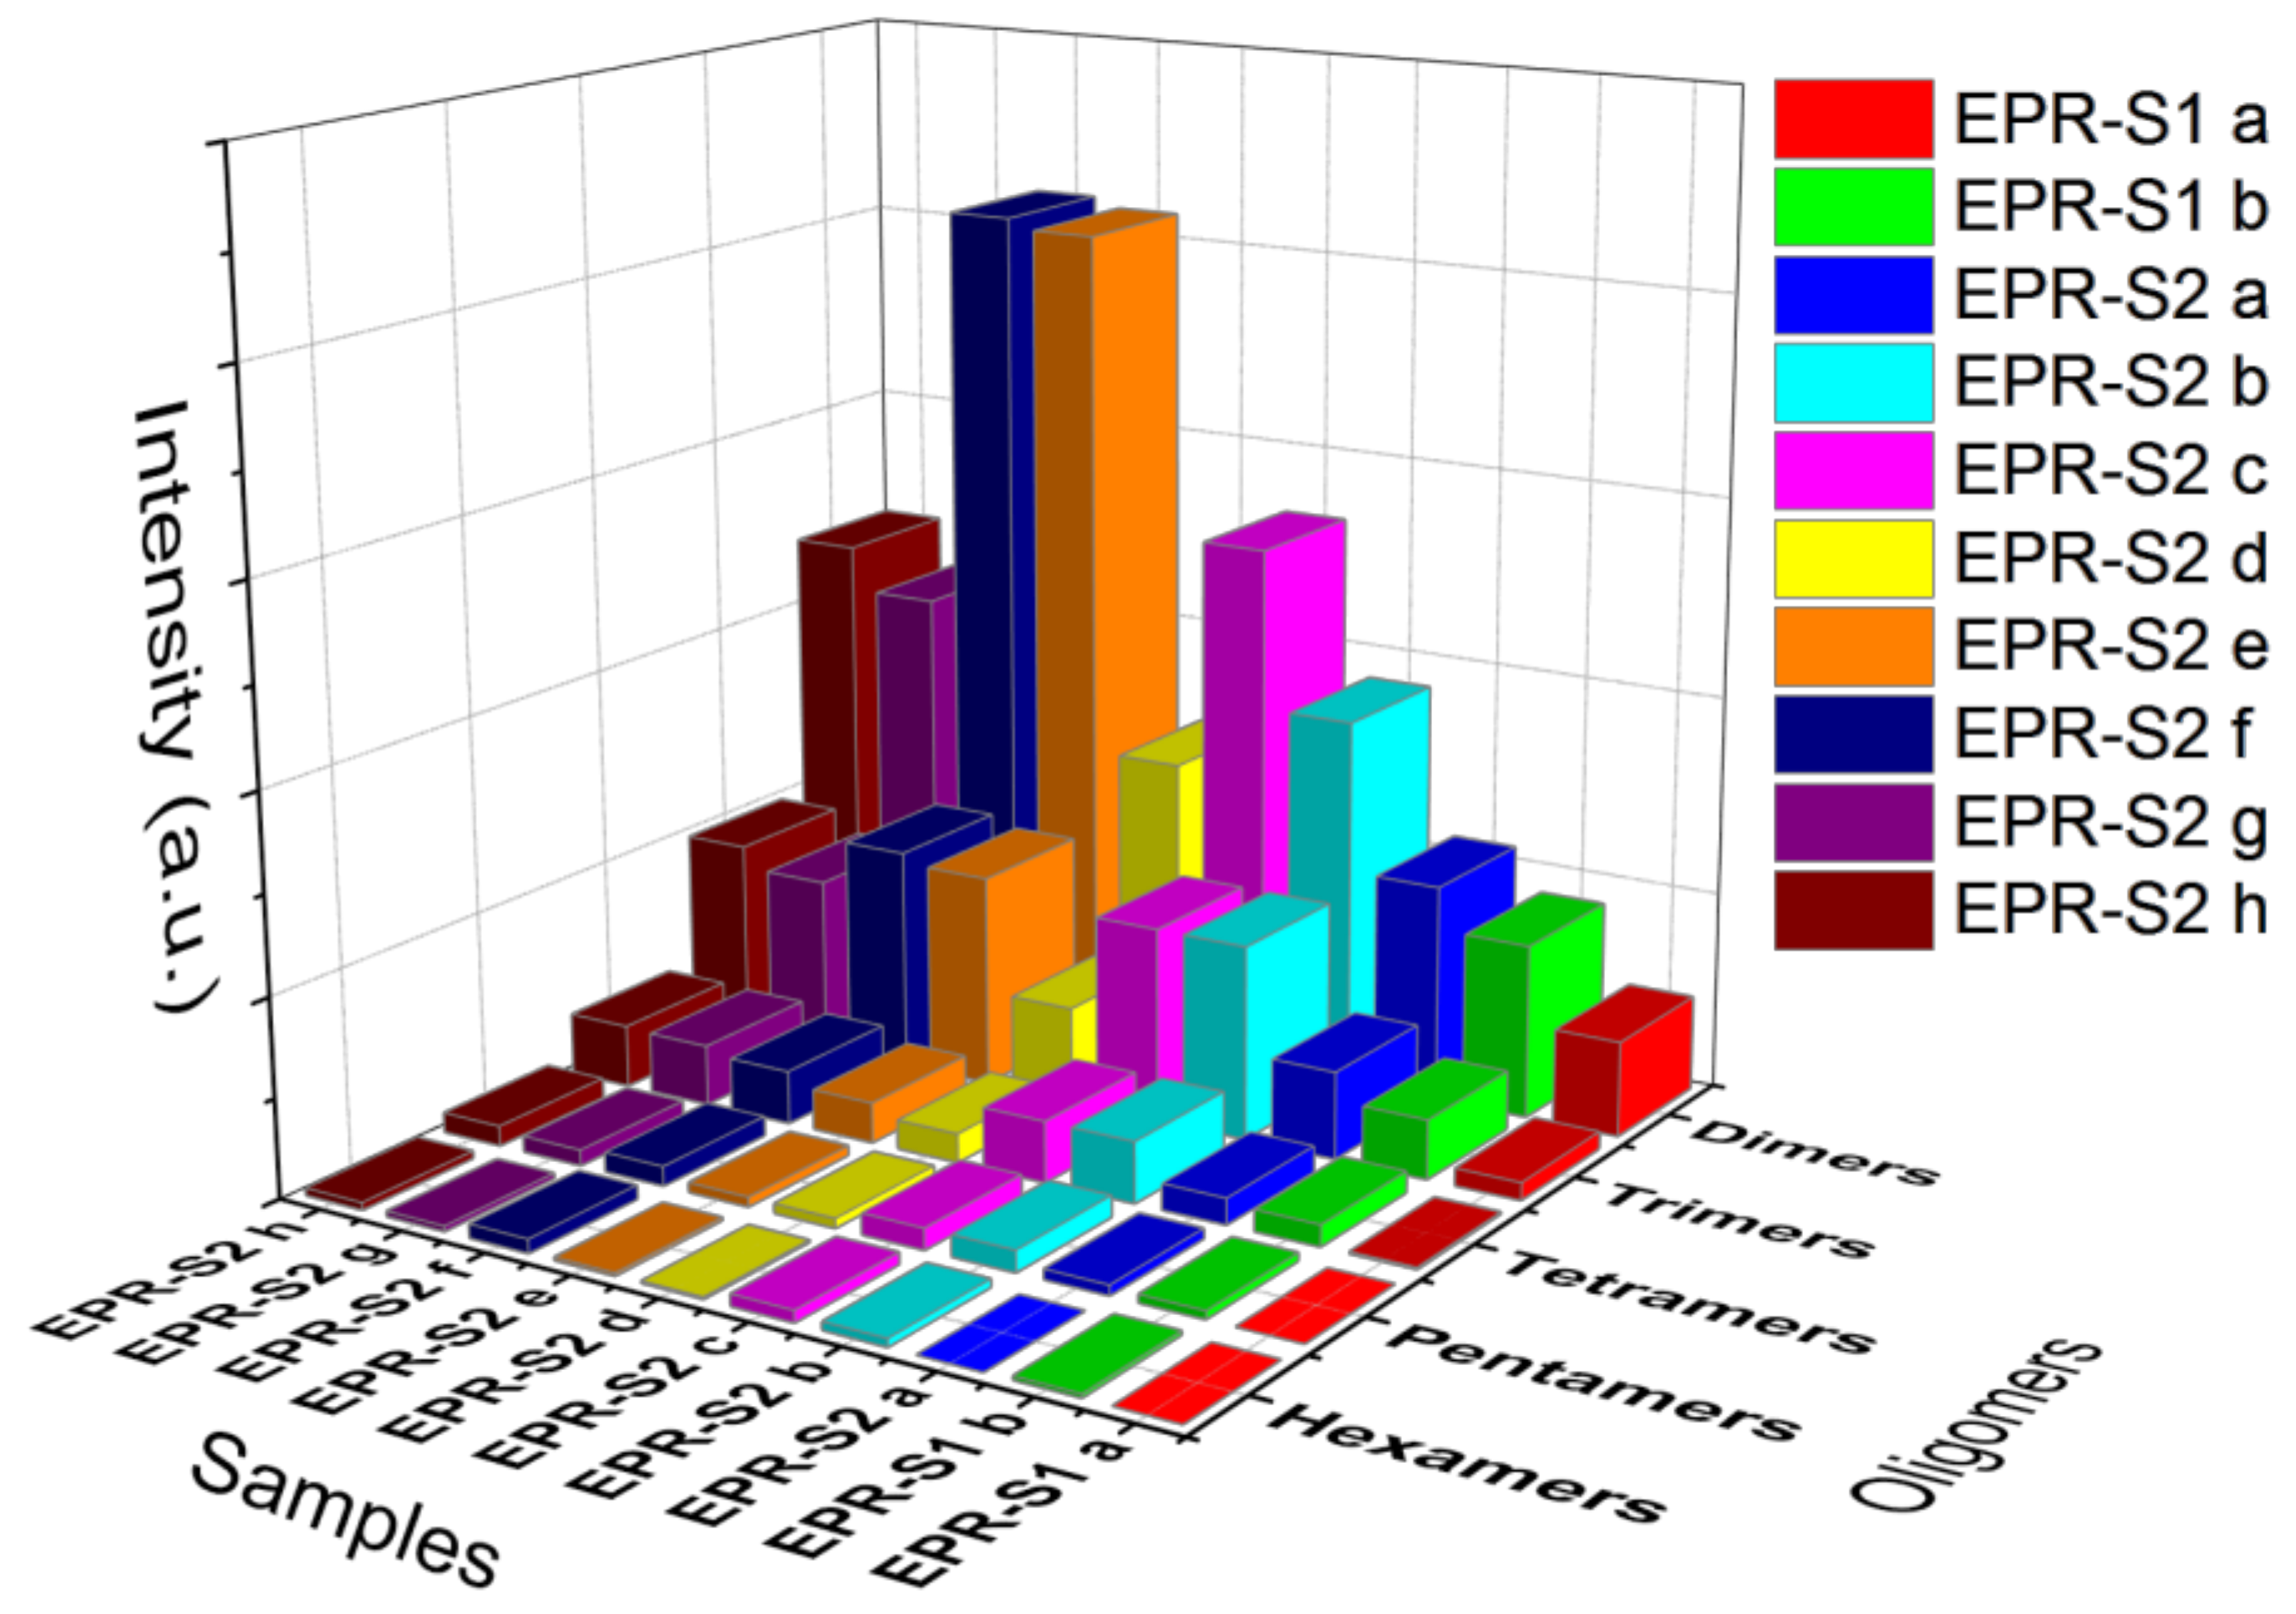
Figure 14.
Compositions of not entirely epoxidized oligomers.

Table 1.
Mass peaks as a function of the oligomer size versus epoxidation degree.
| Oligomer | ED0 | ED1 | ED2 | ED3 | ED4 | ED5 | ED6 | ED7 | ED8 | ED9 | ED10 | ED11 | ED12 |
|---|---|---|---|---|---|---|---|---|---|---|---|---|---|
| Monomer | 228.29 | 284.36 | 340.32 | - | - | - | - | - | - | - | - | - | - |
| Dimer | 468.59 | 524.66 | 580.72 | 636.79 | 692.85 | - | - | - | - | - | - | - | - |
| Trimer | 708.89 | 764.96 | 821.02 | 877.09 | 933.15 | 989.22 | 1045.28 | - | - | - | - | - | - |
| Tetramer | 949.20 | 1005.26 | 1061.32 | 1117.39 | 1173.45 | 1229.52 | 1285.58 | 1341.65 | 1397.71 | - | - | - | - |
| Pentamer | 1213.49 | 1343.62 | 1269.55 | 1399.68 | 1325.62 | 1455.75 | 1381.68 | 1511.81 | 1437.74 | 1567.87 | 1493.81 | - | - |
| Hexamer | 1429.80 | 1485.86 | 1541.93 | 1597.99 | 1654.06 | 1710.12 | 1766.19 | 1822.25 | 1878.31 | 1937.38 | 1988.43 | 2046.51 | 2102.57 |
ED = Epoxidation degree (see Figure 10 as example); Mass peaks unit = Daltons.
Table 2.
Mass peaks as a function of the oligomer size versus adducts with sodium and DHB.
| Epoxidation Degree | ED0 | ED1 | ED2 | ED3 | ED4 | ED5 | ED6 | |||||||
| Oligomer | aNa | aDHB | aNa | aDHB | aNa | aDHB | aNa | aDHB | aNa | aDHB | aNa | aDHB | aNa | aDHB |
| Monomer | 251.28 | 382.41 | 307.35 | 438.48 | 363.31 | 494.44 | - | - | - | - | - | - | - | - |
| Dimer | 491.58 | 622.71 | 547.65 | 678.78 | 603.71 | 734.84 | 659.78 | 790.91 | 715.84 | 846.97 | - | - | - | - |
| Trimer | 731.88 | 863.01 | 787.95 | 919.08 | 844.01 | 975.14 | 900.08 | 1031.21 | 956.14 | 1087.27 | 1012.21 | 1143.34 | 1068.27 | 1199.4 |
| Tetramer | 972.19 | 1103.32 | 1028.25 | 1159.38 | 1084.31 | 1215.44 | 1140.38 | 1271.51 | 1196.44 | 1327.57 | 1252.51 | 1383.64 | 1308.57 | 1439.7 |
| Pentamer | 1212.49 | 1343.62 | 1268.55 | 1399.68 | 1324.62 | 1455.75 | 1380.68 | 1511.81 | 1436.74 | 1567.87 | 1492.81 | 1623.94 | 1548.87 | 1680 |
| Hexamer | 1452.79 | 1583.92 | 1508.85 | 1639.98 | 1564.92 | 1696.05 | 1620.98 | 1752.11 | 1677.05 | 1808.18 | 1733.11 | 1864.24 | 1789.18 | 1920.31 |
| Epoxidation Degree | ED7 | ED8 | ED9 | ED10 | ED11 | ED12 | ||||||||
| Oligomer | aNa | aDHB | aNa | aDHB | aNa | aDHB | aNa | aDHB | aNa | aDHB | aNa | aDHB | ||
| Tetramer | 1364.64 | 1495.77 | 1420.7 | 1551.83 | - | - | - | - | - | - | - | - | ||
| Pentamer | 1604.94 | 1736.07 | 1661 | 1792.13 | 1717.07 | 1848.2 | 1773.13 | 1904.26 | - | - | - | - | ||
| Hexamer | 1845.24 | 1976.37 | 1901.3 | 2032.43 | 1960.37 | 2091.5 | 2011.42 | 2142.55 | 2069.5 | 2200.63 | 2125.56 | 2256.69 | ||
Mass peaks unit = Daltons; aNa = Mass peaks values of sodium adducts; aDHB = Mass peaks values of dihidroxybenzoic acid adducts.
© 2018 by the authors. Licensee MDPI, Basel, Switzerland. This article is an open access article distributed under the terms and conditions of the Creative Commons Attribution (CC BY) license (http://creativecommons.org/licenses/by/4.0/).
Share and Cite
MDPI and ACS Style
Vlnieska, V.; Zakharova, M.; Börner, M.; Bade, K.; Mohr, J.; Kunka, D. Chemical and Molecular Variations in Commercial Epoxide Photoresists for X-ray Lithography. Appl. Sci. 2018, 8, 528. https://doi.org/10.3390/app8040528
AMA Style
Vlnieska V, Zakharova M, Börner M, Bade K, Mohr J, Kunka D. Chemical and Molecular Variations in Commercial Epoxide Photoresists for X-ray Lithography. Applied Sciences. 2018; 8(4):528. https://doi.org/10.3390/app8040528
Chicago/Turabian StyleVlnieska, Vitor, Margarita Zakharova, Martin Börner, Klaus Bade, Jürgen Mohr, and Danays Kunka. 2018. "Chemical and Molecular Variations in Commercial Epoxide Photoresists for X-ray Lithography" Applied Sciences 8, no. 4: 528. https://doi.org/10.3390/app8040528
Note that from the first issue of 2016, this journal uses article numbers instead of page numbers. See further details here.