Selection of Spectral Resolution and Scanning Speed for Detecting Green Jujubes Chilling Injury Based on Hyperspectral Reflectance Imaging


1
Ningbo Institute of Technology, Zhejiang University, Ningbo 315100, China
2
College of Biosystems Engineering and Food Science, Zhejiang University, Hangzhou 310058, China
*
Author to whom correspondence should be addressed.
Appl. Sci. 2018, 8(4), 523; https://doi.org/10.3390/app8040523
Submission received: 13 March 2018
/
Revised: 26 March 2018
/
Accepted: 27 March 2018
/
Published: 29 March 2018
(This article belongs to the Special Issue Hyperspectral Chemical Imaging for Food Authentication)
Abstract
:Featured Application
Hyperspectral imaging for green jujube chilling injury identification.
Abstract
Hyperspectral imaging is a non-destructive method for the detection of chilling injury in fruit. However, the limitation of this technique is the lacking of an appropriate working parameters and a feasible discriminating model for chilling on-line sorting. This research was aimed to select the optimal spectral resolution, scanning speed, and classification model for green jujube chilling injury detection based on hyperspectral reflectance imaging. Criminisi algorithm was firstly carried out to reconstruct the specular reflection region in spectral images before deriving mean spectra, and thus the optimal wavelengths were selected by random frog. Results showed that the Criminisi algorithm presented a desirable ability of spectral image inpainting. The linear discriminant analysis (LDA) achieved overall accuracies of 98.3% and 93.3% for two-class and three-class classification, respectively, at the speed of 20 mm/s with the spectral resolution of 5.03 nm based on selected spectral features. The results demonstrated that 20 mm/s with the spectral resolution of 5.03 nm was more feasible for the detection of green jujube chilling injury in hyperspectral imaging system due to a higher scanning efficiency, but a less data size.
1. Introduction
Green jujube (Zizyphus mauritiana) is becoming a popular fruit with a lot of vitamin C, B complexes, calcium, and carotenoids, and it is admired for its high nutritional value contributing to promoting health [1]. The main limited factor to its growth is temperature. The leaves and fruits will undergo chilling stress when temperature is lower than 4 °C and 0 °C, respectively. Like many other agricultural products, the external and internal quality of green jujube fruit needs to be inspected, such as the shape, size, surface condition, and nutrition content. Chilling stress causes adverse impacts on fruit quality, such as surface blemish and internal defects [2], which makes chilled samples decay quickly and contaminate other fruit during the process of harvest, transport, and storage. Hence, it is evidently essential to identify defective green jujubes with chilling injury and then remove them.
The traditional detection method for fruit internal or external defects is based on manual evaluation, which is time-consuming and labor-intensive. Therefore, a rapid and reliable method is urgently needed for agricultural product quality evaluation. Recently, the optical technique based spectroscopic imaging has aroused interests in agro-product external or internal quality inspection, such as ripeness evaluation of strawberry [3], firmness and soluble solids content inspection of blueberry [4], bruise damage detection on pear [5], internal defect identification on cucumbers [6], and hollowness detection in white radish (Raphanus sativus L.) [7]. Since chilling stress often causes an internal defect in agro-product, such as pulp fester and spongy texture of fruit. Hence, much attention was paid to the nondestructive technology for fruit chilling injury detection [8,9,10]. Hashim et al. (2013) showed the potential ability for backscattering imaging for banana chilling detection [11]. The results have shown relatively low misclassification errors of 6% and 8% for early detection, and 0.67% and 1.33% after chilling symptom development, using images at 660 nm and 785 nm, respectively. Cen et al. (2016) conducted hyperspectral imaging technique by combining the sequential forward selection (SFS) feature selection method and support vector machine (SVM) classifier to distinguish chilled cucumbers from normal ones with the overall accuracy of 100%, and to assess chilling levels with the best overall accuracies of 91.6%, respectively [12]. Additionally, ElMasry et al. (2009) reported the potential of using hyperspectral reflectance imaging for the identification of chilling stress in apples. They claimed that artificial neural network (ANN) model was more feasible for chilling injury detection based on five optimal wavelengths (717 nm, 751 nm, 875 nm, 960 nm, and 980 nm) with an overall classification accuracy of 98.4% [13]. Although reasonable results were achieved from methods mentioned above, it is still challenging to apply this technique to on-line inspection due to the low scanning speed in hyperspectral images. Therefore, a useful method with appropriate working parameters and feasible algorithm was necessary to achieve on-line chilling injury detection in green jujube production.
To our knowledge, little research has been done to investigate the effect of spectral resolution and scanning speed on chilling injury detection of green jujube based on hyperspectral imaging. Therefore, the main objective of this research was to select the optimal spectral resolution, scanning speed for green jujube hyperspectral images. To achieve this goal, the specific objectives were (1). To acquire the hyperspectral images of each sample at different scanning speeds and spectral resolutions; (2). Identify the optimal wavelengths for chilling damage detection; and, (3). Develop a feasible classification model for green jujube chilling injury discrimination based on selected features.
2. Materials and Methods
2.1. Green Jujube Sample Collection
Sample size of 360 fresh and normal green jujubes were collected from a commercial orchard in Zhangzhou city, Fujian province on 10 October 2017. The samples were firstly cleaned with wet cloth to ensure they were uniform in size, color, and without any bruise. The samples were randomly divided into three groups labeled as normal (120 samples), slightly chilling (120 samples), and severely chilling (120 samples), respectively. The normal samples were placed into plastic bags in room temperature, while slightly chilling and severely chilling treatments subjected to chilling stress were kept in 0 ± 0.5 °C for one and two days, respectively. Prior to experiment, the chilled samples were removed from cold storage and stayed in room temperature for 6 h for the development of chilling symptom.
2.2. Hyperspectral Images Acquisition and Processing
To develop a non-destructive and fast method for green jujube chilling injury detection with the aim of extending storage period, a line-scan hyperspectral imaging system was used to acquire the hyperspectral images over the range of 380–1023 nm. The system consisted of a CCD camera (C8484-05G, Hamamatsu (Hamamatsu-shi, Janpan)), an imaging spectrograph (ImSpectorV10, Spectral Imaging Ltd., Oulu, Finland), a 17 mm fixed focal lens (Xenoplan, Schneider Optics, Hauppauge, NY, USA), two line light sources (Fiber-Lite DC950 Illuminator, Dolan Jenner Industries Inc., Boxborough, MA, USA), and a mobile platform. The samples were placed on the mobile platform, and hyperspectral images were collected at the speed of 8 mm/s (no deformation of shape) and 20 mm/s (about 50% deformation of shape) of 35 cm working distance, respectively. After imaging, the surface condition of each sample was inspected to avoid any possible errors. Hyperspectral images were then corrected using a flat-field correction using Equation (1) as
where R, Isample, Idark, and Ireference were the corrected, original, dark current, and reference images, respectively. The dark current was obtained by covering the lens, while the reference images were collected from a white Teflon bar (~99.9% reflectance) (Specim, Spectral Imaging Ltd., Oulu, Finland).
In order to obtained different spectral resolutions of hyperspectral images, four spectral resolutions [2 × 2 (1.25 nm), 2 × 4 (2.51 nm), 2 × 8 (5.03 nm), and 2 × 16 (10.08 nm)] were used for analysis. After that, a mask was generated to remove the background, before each sample was cropped automatically using a minimum enclosing rectangle. Additionally, hyperspectral images with wavelength lower than 430 nm were removed because of low signal-to-noise ratio (SNR). Since the green jujube size was similar to spheroidicity with smooth peel on surface, and was easy to saturate, the inpainting operation on specular reflection region was carried out before deriving mean spectra from each sample. The position of specular reflection region was detected from the spectral image at 680 nm by creating a mask with a selected threshold value. In this study, Criminisi algorithm was executed to reconstruct the lost regions of all the spectral images by iterating the following three steps until all pixels were filled [14]:
- (1)
- Compute patch priorities:where and were the confidence term and data term, respectively, and they were defined as:where , , , , , , and were regarded as square template at point to be filled, the area of , unit vector, normalization factor, the isophotes direction at point , entire image, and the target region, respectively.
- (2)
- Once the patch with the highest priority () was found, the texture and structure were propagated by coping the most best-matching patch () in candidate source region to the position based on sum of squared differences (SSD) as:
- (3)
- Update confidence values and repeat step 1–3 until done. Finally, the peak signal-to-noise ratio (PSNR) between the original and inpainting images was calculated to evaluate the performance of inpainting operation.
Since the chilling injury usually affects the whole surface of the fruit, thus the whole green jujube was considered as the region of interest (ROI) to extract the mean spectral reflectance. Savitsky-Golay (SG) smoothing was finally implemented to reduce the noise of mean spectra of each sample over the region of 430–1023 nm after inpainting operation [15].
2.3. Spectral and Textural Features Selection for Green Jujube Chilling Detection
Hyperspectral imaging provide rich spectral and spatial information and has been widely used for agricultural product quality judgment, while it still poses some challenges to remove redundant information, which could greatly reduce the time of processing the hyperspectral images. In this study, random frog was implemented to select optimum wavelengths for detecting chilling injury. The random frog algorithm started with initializing five tuning parameters with proper values, followed by three key steps [16]: (1) initialize a variable subset V0, including Q variables with random values; (2) propose a candidate variable subset V* based on Q* variables, accept V* with a certain probability as V1, and update V0 using V1. Repeat this step until N loops; and, (3) calculate the selection probability of each variable finally, which can be used as a measure of variable importance.
The chilling damage in green jujubes alters light propagation resulting in spatially heterogeneous pixel intensity in spectral images. Therefore, image texture from spectral images at optimal wavelengths was also extracted to investigate the potential of chilling injury detection. In this study, contrast, homogeneity, energy, and correlation from gray level co-occurrence matrix (GLCM) were calculated for chilling injury detection of green jujubes [17].
2.4. Discriminant Analysis Method Chilling Injury Detection of Green Jujubes
In this study, the linear discriminant analysis (LDA) was conducted for green jujube chilling injury detection. Linear discriminant analysis (LDA) was a supervised recognition method for the assessment of astringent persimmon ripeness [18], pathogen infestation detection in soybean [19], and broken kernels discrimination in bulk wheat [20]. Therefore, LDA was also carried out to discriminate chilled green jujubes from normal ones, as well as to identify the chilling injury levels. LDA explicitly attempts to explain a categorical variable as a linear combination of features that can characterize or separate two or more classes of objects [21]. The performance of green jujube chilling detection was evaluated using the overall classification accuracy for a different combination of working parameters. In two-class of normal and chilling injury classification task, the normal green jujubes were labeled as “1” for 120 normal, and “2” for 240 chilled samples, respectively. While three-class discrimination was carried out by labeling “1” for 120 normal, “2” for 120 slightly, and “3” for 120 severely chilling samples, respectively, according to time of chilling storage. During the schedule of green jujube chilling detection, kennard-stone (KS) algorithm was used to divide the entire data into two groups with 2/3 of entire data for the training set and 1/3 of entire data for the validation set [22]. Data analysis in this research was carried out using MATLAB R2014a (MathWorks, Inc., Natick, MA, USA). The detailed information of chilling injury detection based on hyperspectral imaging is shown in Figure 1.
3. Results and Discussion
3.1. Specular Reflection Region Inpainting in Hyperspectral Images
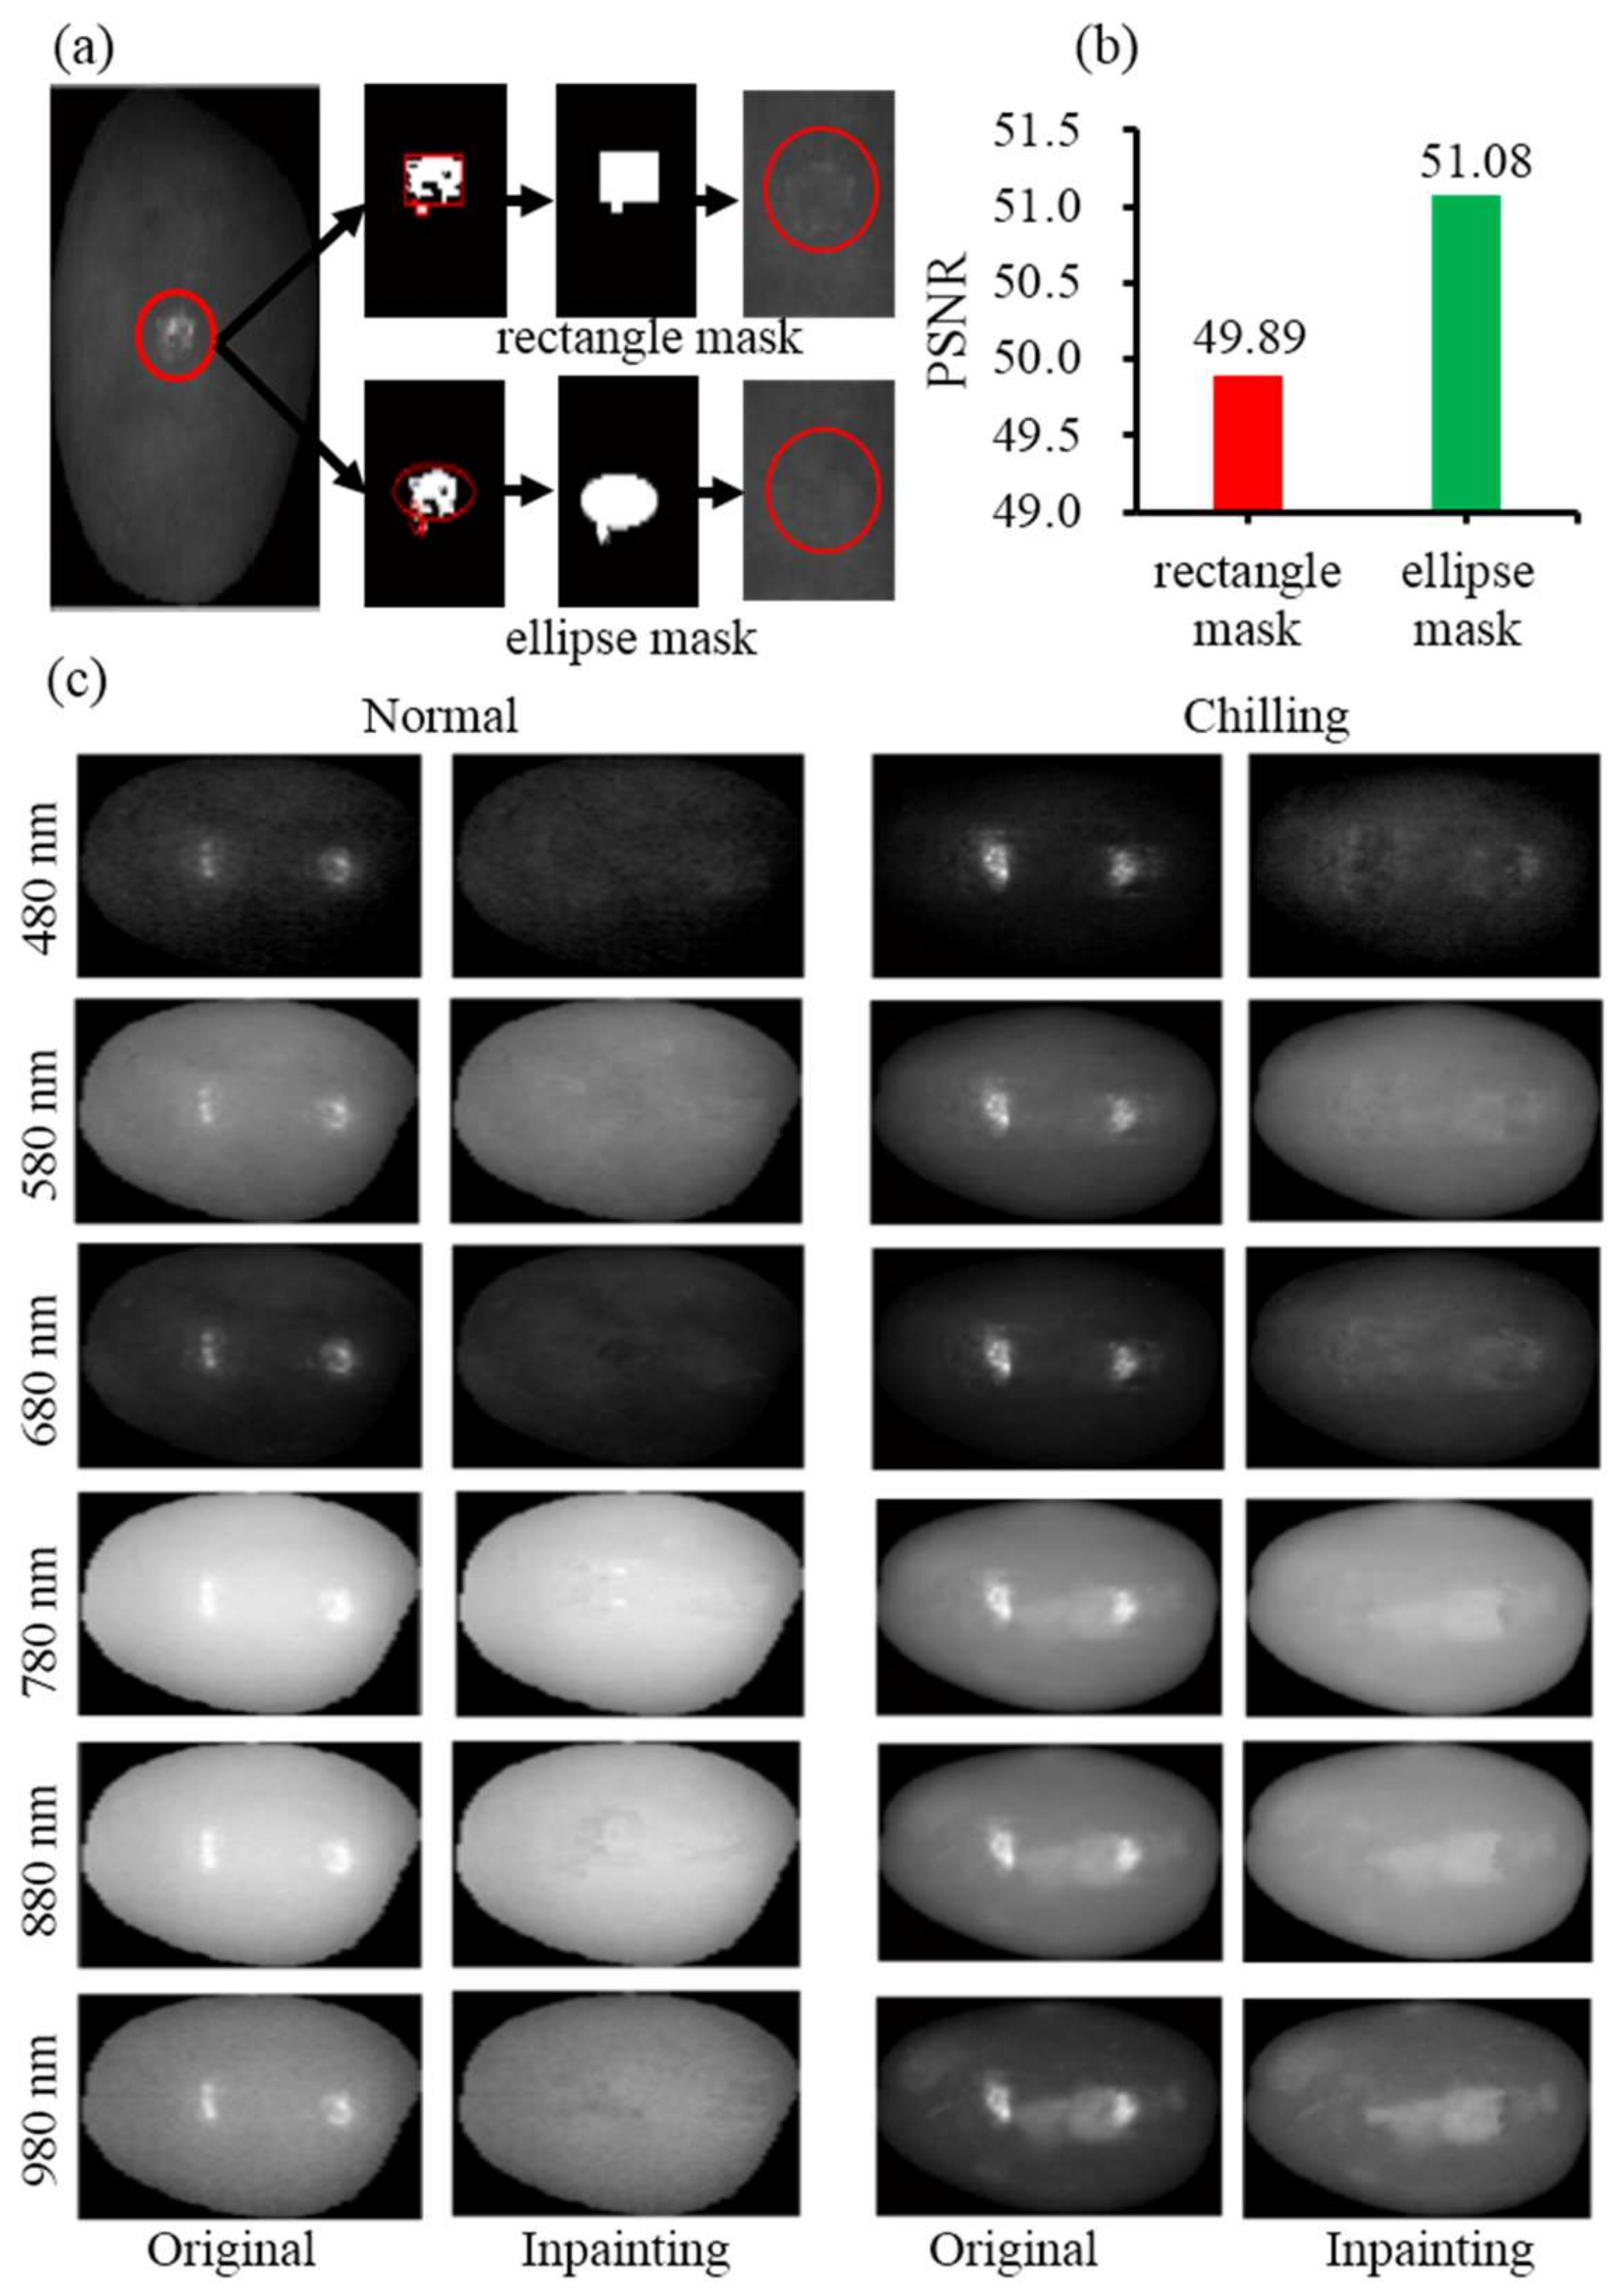
Figure 2a shows the effect of different shapes of specular reflection region mask on inpainting. It was found that rectangle mask did not show a desirable inpainting performance because the pixels that are located along boundary still presented difference of image texture from source region (unaffected region) with sound pixels, which indicated that pixels that are distributing along boundary had influence on image inpainting. However, a more spatially homogeneous texture in target region was synthesized after the application of ellipse mask on account of that more interferential pixels were removed. Apart from visual evaluation, it also displays a highest PSNR value of 51.08 based on ellipse when compared with that of original and rectangle ones (Figure 2b), demonstrating that the ellipse mask was more feasible for spectral image inpainting for green jujube. Figure 2c displays representative spectral images of normal and chilled green jujubes at 480 nm, 580 nm, 680 nm, 780 nm, 880 nm, and 980 nm, respectively, before and after inpainting operation using ellipse mask. The results here indicate that the inpainting operation using Criminisi algorithm could well reconstruct specular reflection region in hyperspectral images both in visible and near-infrared range.
3.2. Mean Spectra of Different Levels of Chilling Injury at Different Scanning Speeds and Spectral Resolutions
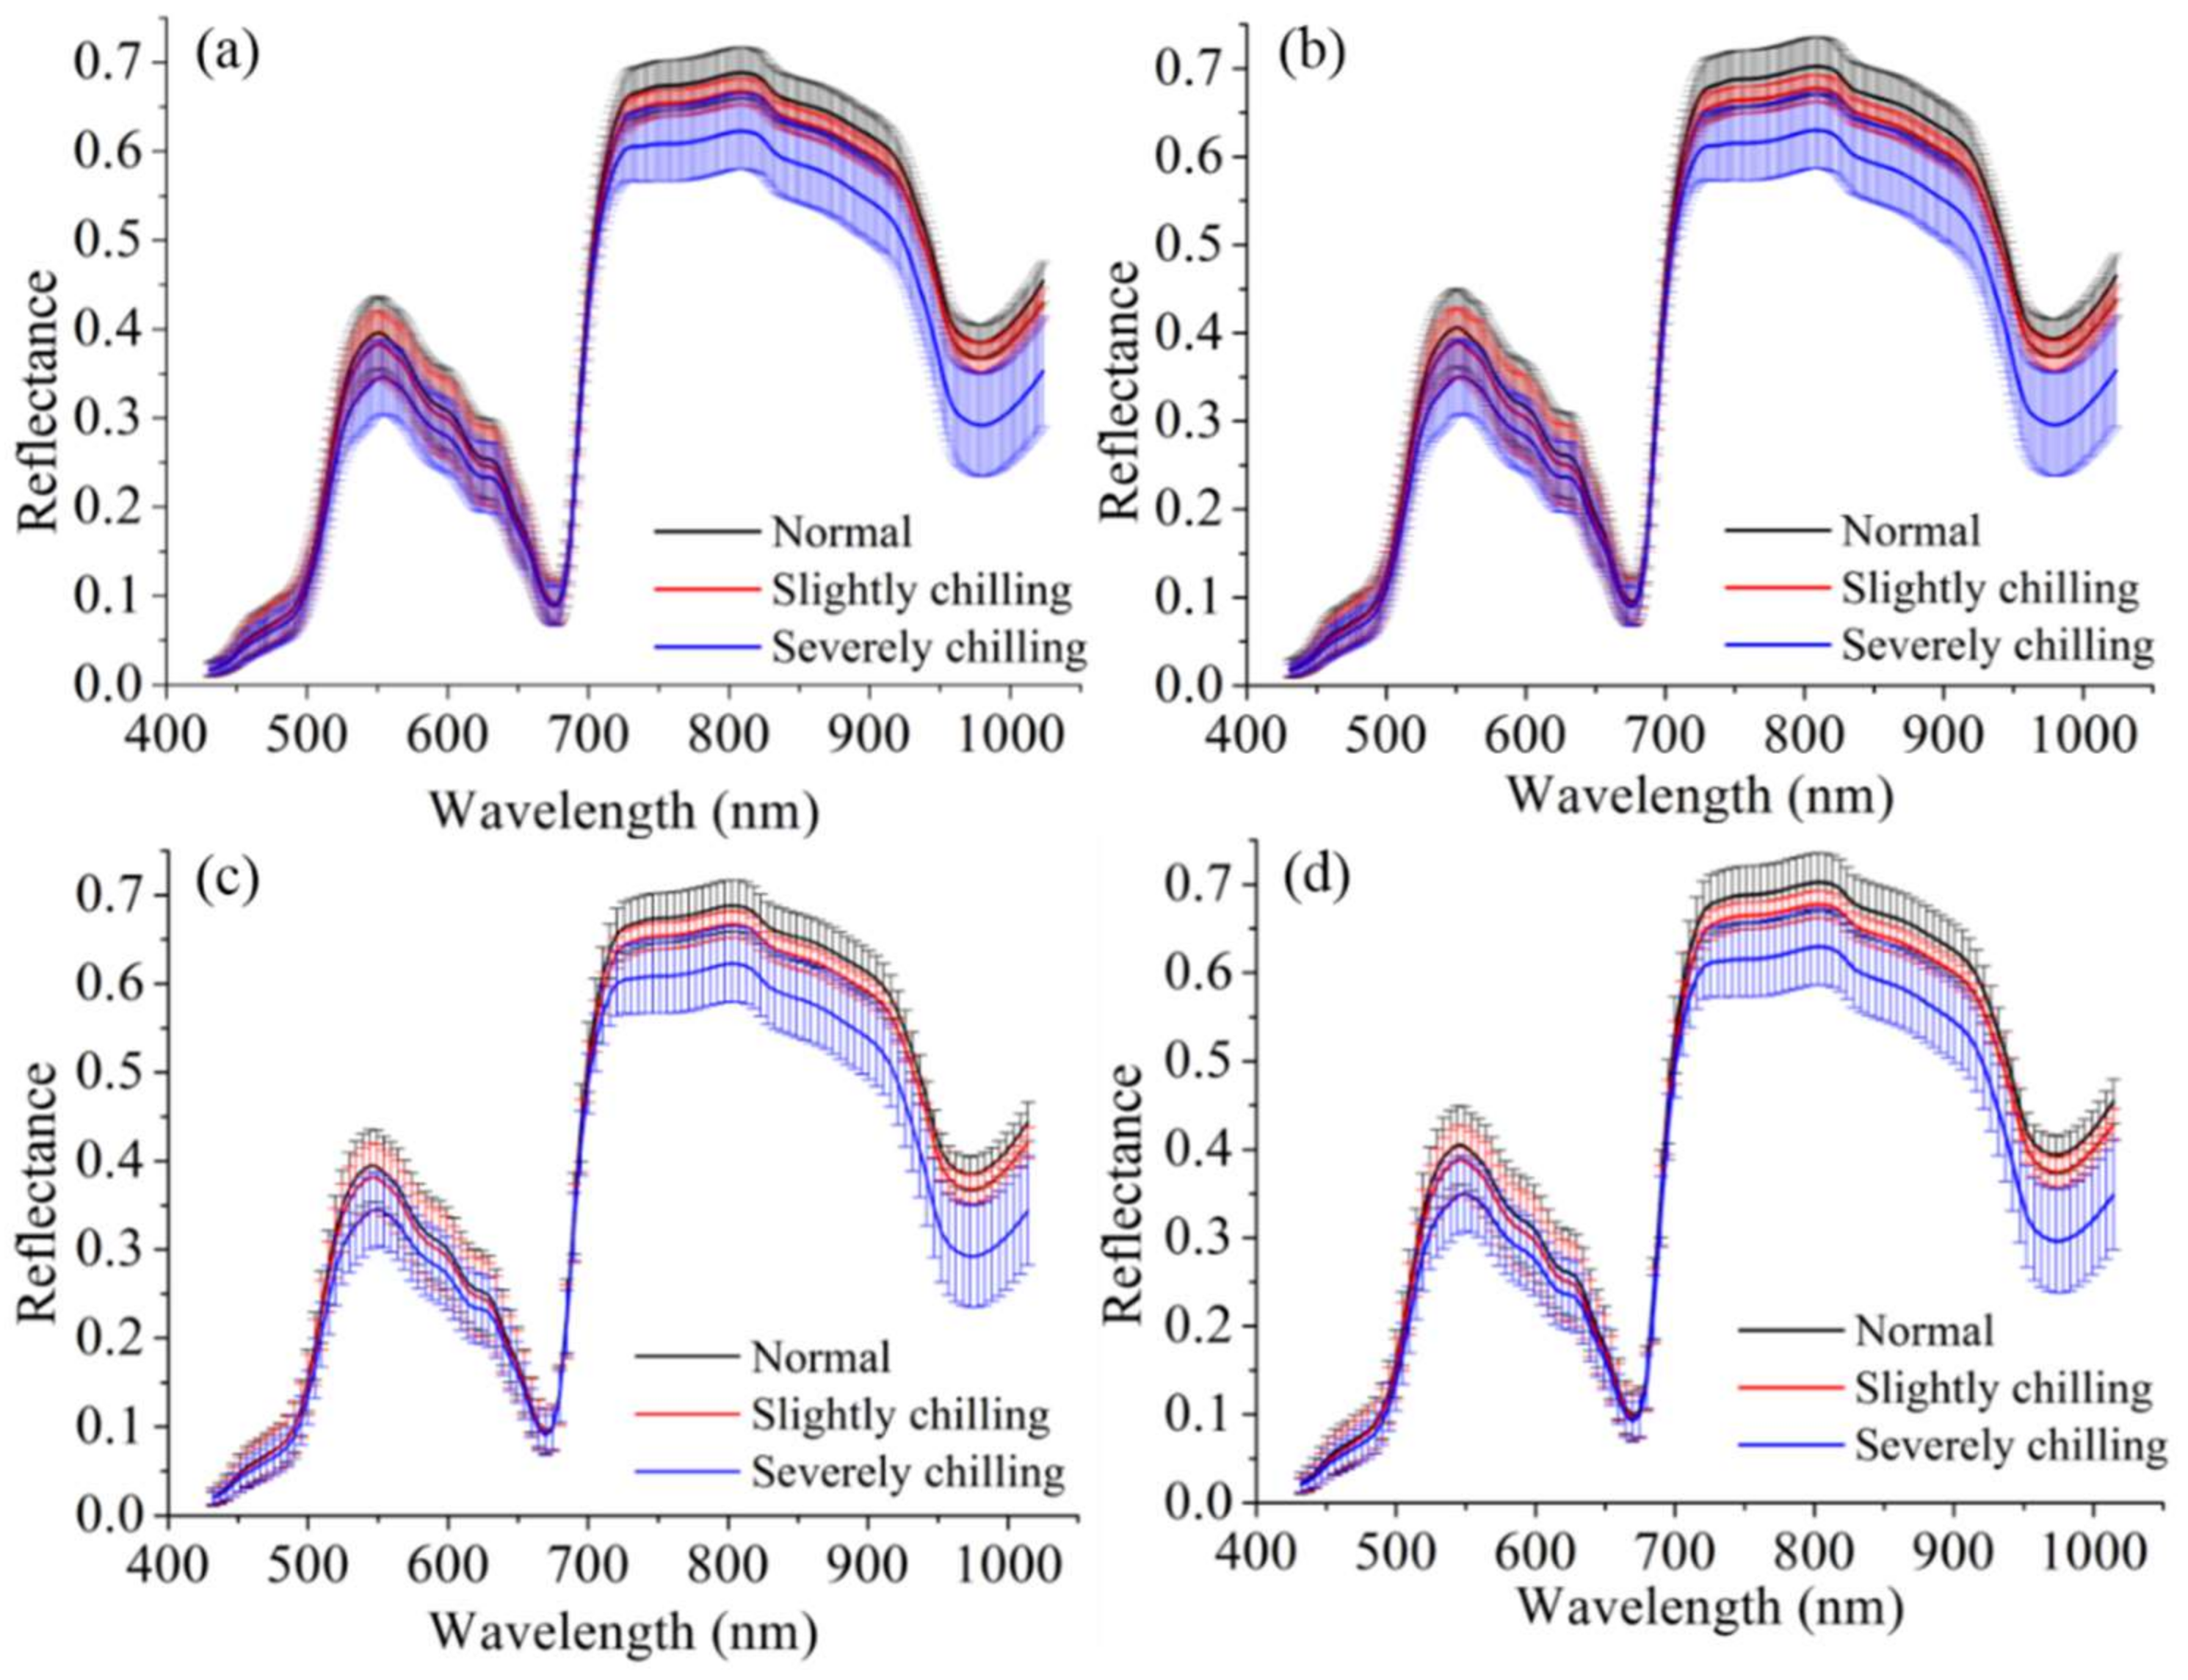
After the removal of wavelengths with low signal-to-noise ratio (SNR) before 430 nm, the remaining wavelengths in the range of 430–1023 nm were used for further analysis. Figure 3 shows the mean spectra of normal, slightly and severely chilling green jujubes under different scanning speeds and spectral resolutions. Local maximum and minimum could be found around 550 nm and 680 nm due to dark green color chlorophyll a absorption. Additionally, the valley around 960 nm was due to water absorption. All of the plots illustrated that a lower reflectance in chilled green jujubes than those of normal ones due to pigment damage and tissue collapse, which resulted in a decreasing of light reflection, thus leading to a lower reflectance in chilled green jujubes than those of normal ones. These different patterns of the reflectance spectra indicated the possibility of identifying normal green jujubes from chilled ones. In addition of that, no notable difference of spectral characteristics over the range of 430–1023 nm could be observed between 8 mm/s and 20 mm/s, implying that a relatively higher scanning speed (20 mm/s) had little impact on the reflectance intensity of green jujubes. When compared with different spectral resolutions, the change pattern of spectral reflectance at two different scanning speeds was similar between them except for spectral resolutions.
3.3. Optimal Wavelengths Selection for Chilling Injury Detection of Green Jujubes
In order to accelerate the processing speed of hypercube images, and ultimately, realize on-line chilling injury detection, the important wavelengths that could retain most information of the original data with fewer feature number by using feature selection method needs to determine. Figure 4 presents the selection probability of each wavelength calculated by random frog at scanning speed of 8 mm/s and 20 mm/s, with different spectral resolutions, respectively. For the data with spectral resolution of 1.25 nm (Figure 4a), a similar pattern of selection probability of each wavelengths over the range of 430–1023 nm could be observed between the two scanning speeds, implying that the contribution of each variable was not significantly influenced by the scanning speed during the chilling injury detection of green jujubes. The selection probabilities of wavelengths in the range of 430–700 nm and 931–1023 nm were relatively lower than those over 701–930 nm. It could also be found that the wavelengths over 701–930 nm from hyperspectral images with spectral resolution of 5.03 nm were also considered as important spectral regions for two speeds (Figure 4b). Figure S1 also shows the selection probability of each wavelength at the scanning speeds of 8 mm/s and 20 mm/s with spectral resolutions of 2.51 nm and 10.08 nm, respectively, which was similar to those of 1.25 nm and 5.03 nm. The selected wavelengths with higher selection probability over 701–930 nm, linking to light scattering information within the pulp tissue might be watery and soft tissues from cell structure breakdown, which might present potential for discriminating chilled jujubes from normal ones.
To determine the optimal feature number for jujube chilling detection, the first ten wavelengths selected by random frog for different scanning speeds and spectral resolutions were used for further analysis (Table 1). Although the selection probability of each wavelength at two scanning speeds was slightly different, the first ten selected wavelengths were quite similar under the same spectral resolution. When compared with different spectral resolutions, the important wavelengths for data with spectral resolution of 5.03 nm distributed dispersedly than those of 1.25 nm on account of that some adjacent wavelengths (i.e., 723 nm, 724 nm, and 726 nm) were considered as important wavelengths for hyperspectral images with 1.25 nm spectral resolution. In addition, most of the selected wavelengths for data with spectral resolution of 5.03 nm were over 800 nm, while it presented a reverse pattern to that of 1.25 nm. Table S1 also presents the first ten selected wavelengths at 8 mm/s and 20 mm/s, with spectral resolutions of 2.51 nm and 10.08 nm, respectively. For 2.51 nm, most selected wavelengths were over 800 nm, which was similar to those of 5.03 nm, but opposite to those of 10.08 nm (Table S1).
Surface blemish and internal defects in chilled samples causes cell structure breakdown, which would result in different light scattering properties, thus leading to different spatial textures between the normal and chilled tissues. Hence, image textures from spectral images at selected wavelengths were extracted for further analysis. Figure 5 displays the images at the first five optimal wavelengths selected by random frog at scanning speed of 8 mm/s and 20 mm/s, respectively, with two spectral resolutions. The reflectance of normal tissue was higher that of damaged regions. A larger area of chilling symptom in severely chilling green jujube was found due to a more serious chilling damage. However, the image textures in the selected spectral image of chilled samples collected at scanning speed of 20 mm/s did not show a significant difference to those of low scanning speed (8 mm/s), except for scanning lines. The difference of image texture in selected images between normal and chilled green jujubes indicated the potential ability of performing classification by extracting the textural features from these images.
3.4. Chilling Injury Detection Based on Spectral Features
The performance of LDA classifier using different numbers of spectral features that were selected by random frog was investigated. Figure 6 displays two-class classification results for chilled and normal green jujubes based on spectral analysis. For different spectral resolutions, the classification performance at low scanning speed (8 mm/s) was better than that of a higher speed (20 mm/s) in general, since low speed leads to more scan lines. The detection accuracy of LDA model was sensitive to the number of selected features, and an increasing tendency of classification accuracy was observed with the increasing number of features. The results demonstrated the importance of feature number for jujube chilling detection. The optimal feature number for hyperspectral images with spectral resolution of 1.25 nm was 7 and 6 at the 8 mm/s and 20 mm/s, respectively, with the best discriminating accuracies of 95.0% and 93.3%, respectively (Figure 6a). When considering the two-class classification performance using 5.03 nm, the LDA classifier provided the best classification accuracy of 99.2% and 98.3% at 8 mm/s and 20 mm/s, respectively, with smallest feature number of 5 (839 nm, 875 nm, 870 nm, 865 nm, and 736 nm for 8 mm/s; 844 nm, 880 nm, 870 nm, 849 nm, and 865 nm for 20 mm/s) (Figure 6b). For two-class classification using data with spectral resolution of 2.51 nm, it reached the highest discriminating accuracies of 99.2% and 98.3% for 8 mm/s and 20 mm/s, with optimal feature number of 7 and 8, respectively (Figure S2a). Compared with 5.03 nm, it obtained the same classification results with two more selected features at 20 mm/s (6 for 5.03 nm). However, the classification performance for data with 10.08 nm spectral resolution was the worst (Figure S2b). Additionally, the classification performance based on 2.51 nm and 5.03 nm spectral resolution was relatively better than that of 1.25 nm and 10.08 nm, which might be because the selected wavelengths over 800 nm might provide more useful information about chilling injury (Table 1).
Additionally, the evaluation of different levels of chilling damage could contribute to the improvement in quality control in jujube production. In this study, three-class chilling damage identification was also carried out based on the selected spectral features. The three-class classification results based on different number of selected features at different scanning speeds and spectral resolutions are presented in Figure 7. In general, the overall accuracies for the three-class chilling damage classification were relatively poorer than those of the two-class classification, as shown in Figure 6, which was due to misclassification between slightly chilling and severely chilling samples. Similar to two-class chilling detection, the LDA model achieved a better performance to discriminate normal, slightly, and severely samples based on data with 5.03 nm spectral resolution with the overall classification accuracies of 95.0% and 93.3% for 8 mm/s and 20 mm/s, respectively, using the optimum feature subsets of 6 (839 nm, 875 nm, 870 nm, 865 nm, 736 nm and 844 nm for 8 mm/s; 844 nm, 880 nm, 870 nm, 849 nm, 865 nm, and 736 nm for 20 mm/s) (Figure 7b). The three-class classification using data with 2.51 nm spectral resolution reached the highest discriminating accuracies of 97.5% and 93.3% for 8 mm/s and 20 mm/s with optimal feature number of 7 and 6, respectively (Figure S3a), which were comparable to the those of 5.03 nm. However, the performance for three-class classification based on 10.08 nm was not as good as the other combinations (Figure S3b).
The detailed classification results of LDA model based on the optimal number of spectral features for different combinations are presented in Table 2. For the spectral resolution of 1.25 nm, misclassification errors could both be observed between the healthy and slightly chilling classes, and slightly and severely chilling classes at two speeds. The accuracy of each class was improved using the spectral resolution of 5.03 nm, which was better than that of 1.25 nm. Although the classification accuracies for the damaged samples at 20 mm/s with the spectral resolution of 5.03 nm were slightly lower than those of 8 mm/s, the data size of hyperspectral images at 20 mm/s reduced about 2.5 times as compared with that of 8 mm/s and the scanning efficiency was improved, which was preferred in designing a multispectral imaging system for jujube chilling injury identification.
3.5. Chilling Injury Detection Based on Image Texture
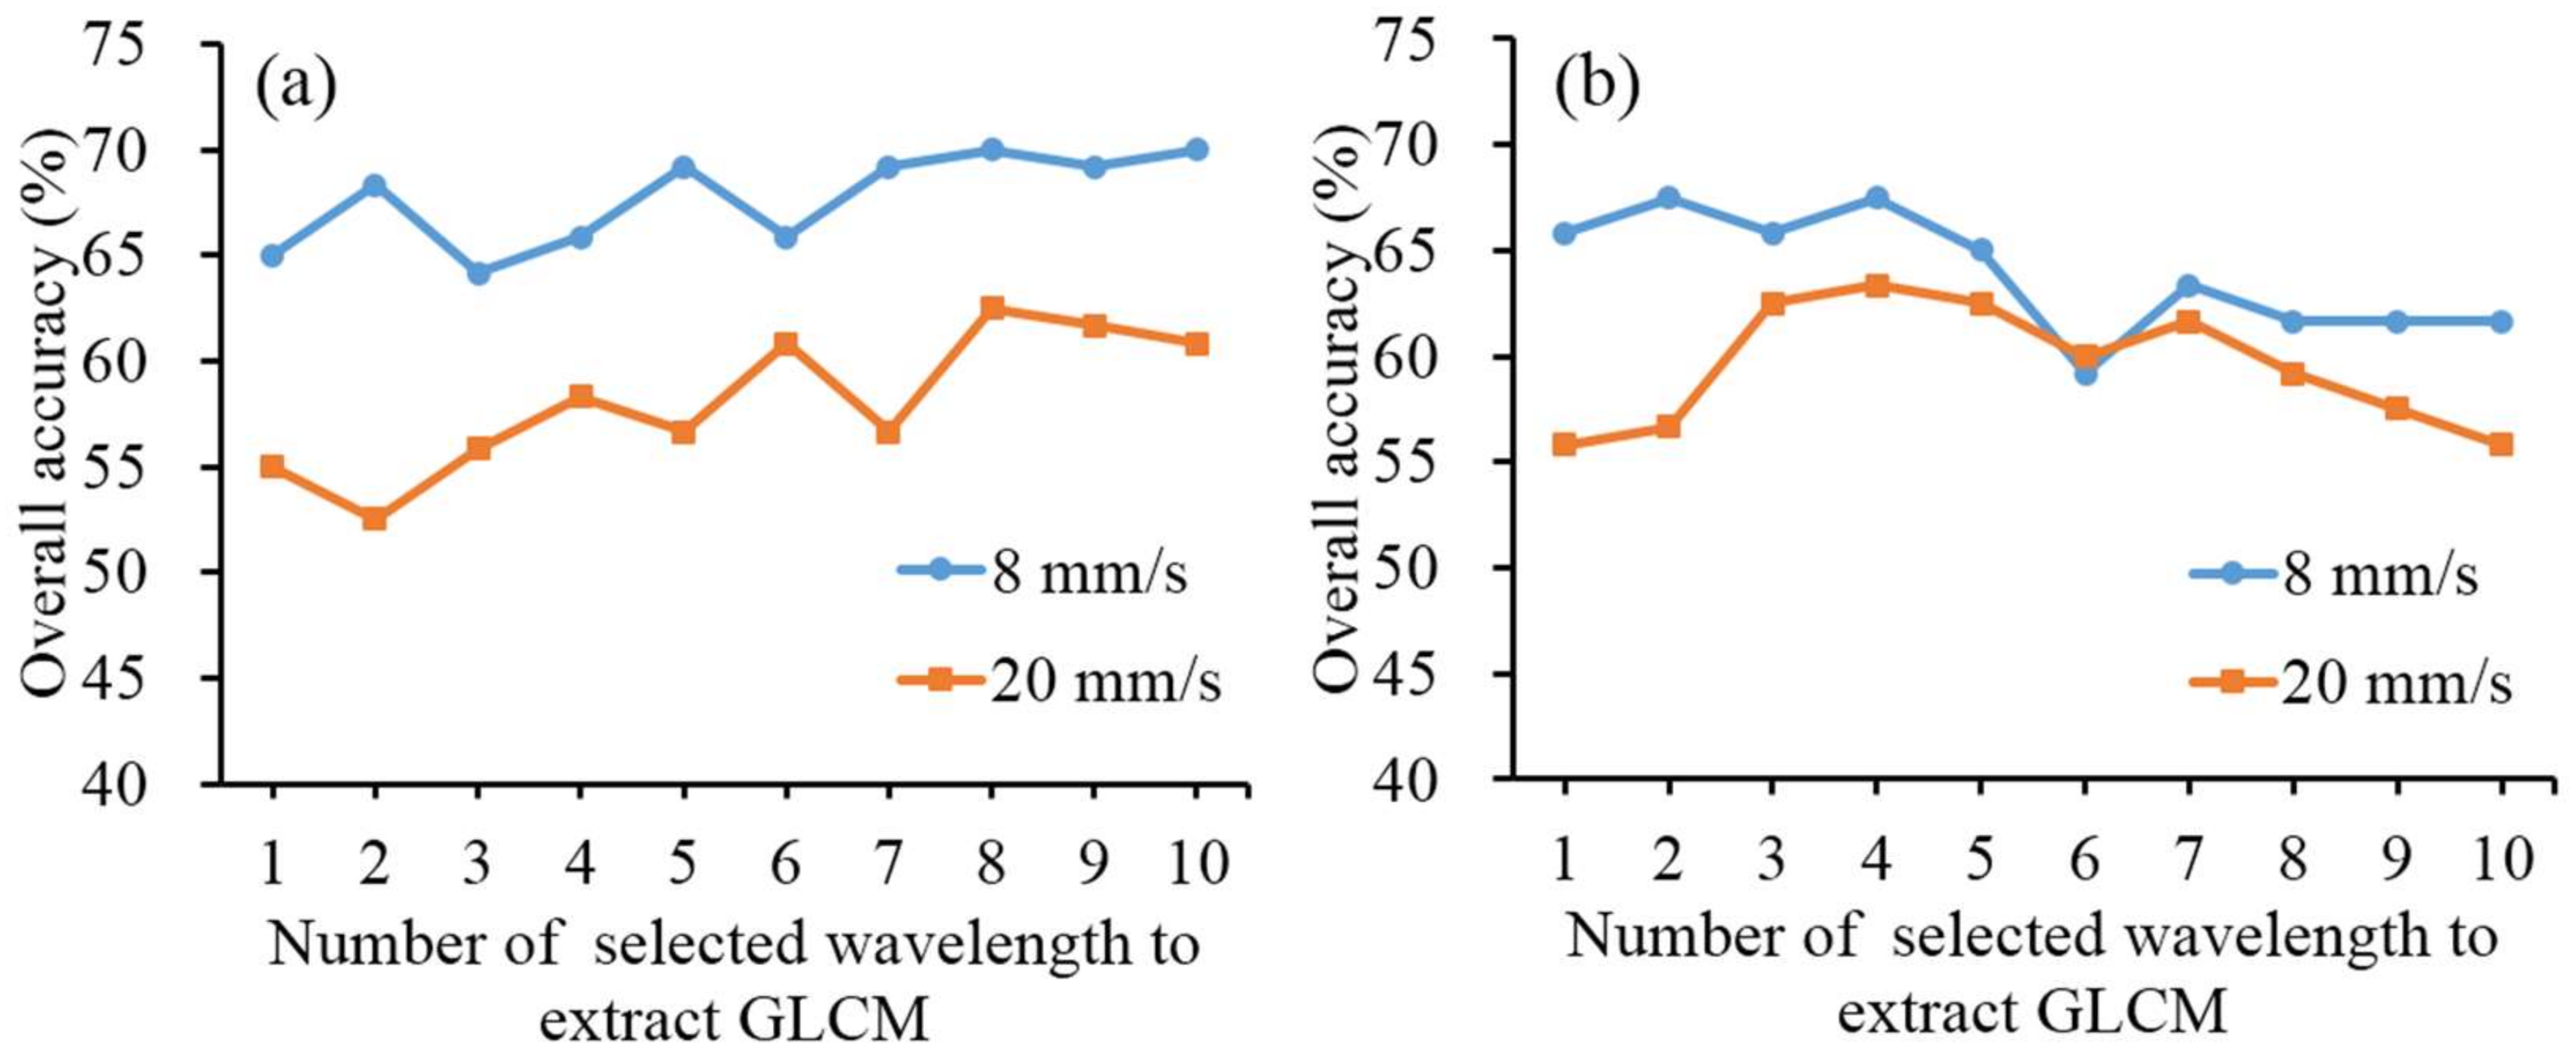
Different light scattering properties in normal and defective pulp tissue would bring about different patterns of spatial textures. The discriminant capability of the image-based features was evaluated by the three-class overall classification accuracy. Among the different combinations of scanning speeds and spectral resolutions, the overall classification accuracies varied from 64.2–70.0%, 52.5–62.5%, 59.2–67.5%, and 55.8–63.3%, respectively, for 8 mm/s and 20 mm/s using data with spectral resolution of 1.25 nm (Figure 8a) and 8 mm/s and 20 mm/s using data with spectral resolution of 5.03 nm (Figure 8b). The classification performance was not significantly improved with the increasing number of image textural features. The low classification results also could be observed in those of 2.51 nm and 10.08 nm (Figure S4). In comparison with spectral-based classification, the three-class performance using image-based features was much poor, indicating that image-based features were not feasible for detecting chilling damage in green jujubes. The high misclassification error had been attributed to the fact that no obvious symptom could be found in slightly chilling samples, resulting in the misclassification between normal and slightly chilling classes.
4. Conclusions
This research has demonstrated the possibility of using hyperspectral imaging for green jujube chilling injury detection. Criminisi algorithm could provide desirable performance to reconstruct the specular reflection region in spectral images. In comparison with different scanning speeds and spectral resolutions, hyperspectral images collected at 20 mm/s with a spectral resolution of 5.03 nm showed the best performance to discriminate chilling injury of green jujube. The LDA model achieved 98.3% and 93.3% overall accuracies for two-class and three-class classification, respectively, based on optimal spectral features. Alternatively, the method that is established in this research could be applied in on-line multispectral imaging system for identifying and grading green jujube chilling injury based on selected working parameters coupled with the method developed.
Supplementary Materials
The following are available online at https://www.mdpi.com/2076-3417/8/4/523/s1, Figure S1: The selection probability of each wavelength calculated by random frog at different scanning speeds and spectral resolutions of 2.51 nm (a) and 10.08 nm (b), respectively, Table S1: The first ten wavelengths selected by random frog at 8 mm/s and 20 mm/s with spectral resolutions of 2.51 nm and 10.08 nm, respectively, Figure S2: Two-class performance comparison based on spectral features at different scanning speeds and spectral resolutions of 2.51 nm (a) and 10.08 nm (b), respectively, Figure S3: There-class performance comparison based on spectral features at different scanning speeds and spectral resolutions of 2.51 nm (a) and 10.08 nm (b), respectively, Figure S4: There-class performance comparison based on image textural features at different scanning speeds and spectral resolutions of 2.51 nm (a) and 10.08 nm (b), respectively.
Acknowledgments
This work is supported by Ningbo Natural Science Foundation (No. 2015A610131), the National Natural Science Foundation (No. 31402352), the Scientific Research project of Zhejiang Education Department (No. Y201432753), the Ningbo Science and Technology Special Project of China (No. 2014B82015) and the Key Laboratory of Equipment and Informatization in Environment Controlled Agriculture, Ministry of Agriculture, China.
Author Contributions
The work presented here was carried out in collaboration between all authors. Huanda Lu conceived the idea. Huanda Lu, Xinjie Yu and Lijuan Zhou co-worked on associated data collection and carried out the experimental work. Huanda Lu drafted the manuscript, Yong He provided suggestions on the experiment design and results and discussion sections.
Conflicts of Interest
The authors declare no conflict of interest.
References
- Li, J.W.; Fan, L.P.; Ding, S.D.; Ding, X.L. Nutritional composition of five cultivars of Chinese jujube. Food Chem. 2007, 103, 454–460. [Google Scholar] [CrossRef]
- Miller, A.R.; Kelley, T.J.; White, B.D. Nondestructive evaluation of pickling cucumbers using visible-infrared light transmission. J. Am. Soc. Hortic. Sci. 1995, 120, 1063–1068. [Google Scholar]
- Zhang, C.; Guo, C.; Liu, F.; Kong, W.; He, Y.; Lou, B. Hyperspectral imaging analysis for ripeness evaluation of strawberry with support vector machine. J. Food Eng. 2013, 179, 11–18. [Google Scholar] [CrossRef]
- Leiva-Valenzuela, G.A.; Lu, R.; Aguilera, J.M. Prediction of firmness and soluble solids content of blueberries using hyperspectral reflectance imaging. J. Food Eng. 2013, 115, 91–98. [Google Scholar] [CrossRef]
- Lee, W.H.; Kim, M.S.; Lee, H.; Delwiche, S.R.; Bae, H.; Kim, D.Y.; Cho, B.K. Hyperspectral near-infrared imaging for the detection of physical damages of pear. J. Food Eng. 2014, 130, 1–7. [Google Scholar] [CrossRef]
- Cen, H.; Lu, R.; Ariana, D.P.; Mendoza, F. Hyperspectral imaging-based classification and wavebands selection for internal defect detection of pickling cucumbers. Food Bioprocess Technol. 2013, 7, 1689–1700. [Google Scholar] [CrossRef]
- Pan, L.; Sun, Y.; Xiao, H.; Gu, X.; Hu, P.; Wei, Y.; Tu, K. Hyperspectral imaging with different illumination patterns for the hollowness classification of white radish. Postharvest Biol. Technol. 2017, 126, 40–49. [Google Scholar] [CrossRef]
- Burdon, J.; Wohlers, M.; Pidakala, P.; Laurie, T.; Punter, M.; Billing, D. The potential for commonly measured at-harvest fruit characteristics to predict chilling susceptibility of ‘Hort16A’ kiwifruit. Postharvest Biol. Technol. 2014, 94, 41–48. [Google Scholar] [CrossRef]
- Sun, Y.; Gu, X.; Sun, K.; Hu, H.; Xu, M.; Wang, Z.; Tu, K.; Pan, L. Hyperspectral reflectance imaging combined with chemometrics and successive projections algorithm for chilling injury classification in peaches. LWT-Food Sci. Technol. 2017, 75, 557–564. [Google Scholar] [CrossRef]
- Lurie, S.; Vanoli, M.; Dagar, A.; Weksler, A.; Lovati, F.; Eccher Zerbini, P.; Spinelli, L.; Torricelli, A.; Feng, J.; Rizzolo, A. Chilling injury in stored nectarines and its detection by time-resolved reflectance spectroscopy. Postharvest Biol. Technol. 2011, 59, 211–218. [Google Scholar] [CrossRef]
- Hashim, N.; Pflanz, M.; Regen, C.; Janius, R.B.; Abdul Rahman, R.; Osman, A.; Shitan, M.; Zude, M. An approach for monitoring the chilling injury appearance in bananas by means of backscattering imaging. J. Food Eng. 2013, 116, 28–36. [Google Scholar] [CrossRef] [Green Version]
- Cen, H.; Lu, R.; Zhu, Q.; Mendoza, F. Nondestructive detection of chilling injury in cucumber fruit using hyperspectral imaging with feature selection and supervised classification. Postharvest Biol. Technol. 2016, 111, 352–361. [Google Scholar] [CrossRef]
- ElMasry, G.; Wang, N.; Vigneault, C. Detecting chilling injury in Red Delicious apple using hyperspectral imaging and neural networks. Postharvest Biol. Technol. 2009, 52, 1–8. [Google Scholar] [CrossRef]
- Criminisi, A.; Pérez, P.; Toyama, K. Region filling and object removal by exemplar-based image inpainting. IEEE Trans. Image Process. 2004, 13, 1200–1212. [Google Scholar] [CrossRef] [PubMed]
- Dai, Q.; Sun, D.; Cheng, J.; Pu, H.; Zeng, X.; Xiong, Z. Recent advances in de-noising methods and their applications in hyperspectral image processing for the food industry. Compr. Rev. Food Sci. Food Saf. 2015, 13, 1207–1218. [Google Scholar] [CrossRef]
- Li, H.D.; Xu, Q.S.; Liang, Y.Z. Random frog: An efficient reversible jump Markov Chain Monte Carlo-like approach for variable selection with applications to gene selection and disease classification. Anal. Chim. Acta 2012, 740, 20–26. [Google Scholar] [CrossRef] [PubMed]
- Haralick, R.M.; Shanmugam, K.; Dinstein, I. Textural features for image classification. IEEE Trans. Syst. Man Cybern. 1973, 3, 610–621. [Google Scholar] [CrossRef]
- Wei, X.; Liu, F.; Qiu, Z.; Shao, Y.; He, Y. Ripeness classification of astringent persimmon using hyperspectral imaging technique. Food Bioprocess Technol. 2013, 7, 1371–1380. [Google Scholar] [CrossRef]
- Chelladurai, V.; Karuppiah, K.; Jayas, D.S.; Fields, P.G.; White, N.D.G. Detection of Callosobruchus maculatus (F.) infestation in soybean using soft X-ray and NIR hyperspectral imaging techniques. J. Stored Prod. Res. 2014, 57, 43–48. [Google Scholar] [CrossRef]
- Ravikanth, L.; Chelladurai, V.; Jayas, D.S.; White, N.D.G. Detection of broken kernels content in bulk wheat samples using near-infrared hyperspectral imaging. Agric. Res. 2016, 5, 285–292. [Google Scholar] [CrossRef]
- Wu, W.; Mallet, Y.; Walczak, B.; Penninckx, W.; Massart, D.L.; Heuerding, S. Comparison of regularized discriminant analysis linear discriminant analysis and quadratic discriminant analysis applied to NIR data. Anal. Chim. Acta 1996, 329, 257–265. [Google Scholar] [CrossRef]
- Bouveresse, E.; Hartmann, C.; Massart, D.L.; Last, I.R. Standardization of near-infrared spectrometric instruments. Anal. Chem. 1996, 68, 982–990. [Google Scholar] [CrossRef]
Figure 1.
The pipeline of green jujube chilling injury detection based on hyperspectral imaging technique.
Figure 1.
The pipeline of green jujube chilling injury detection based on hyperspectral imaging technique.
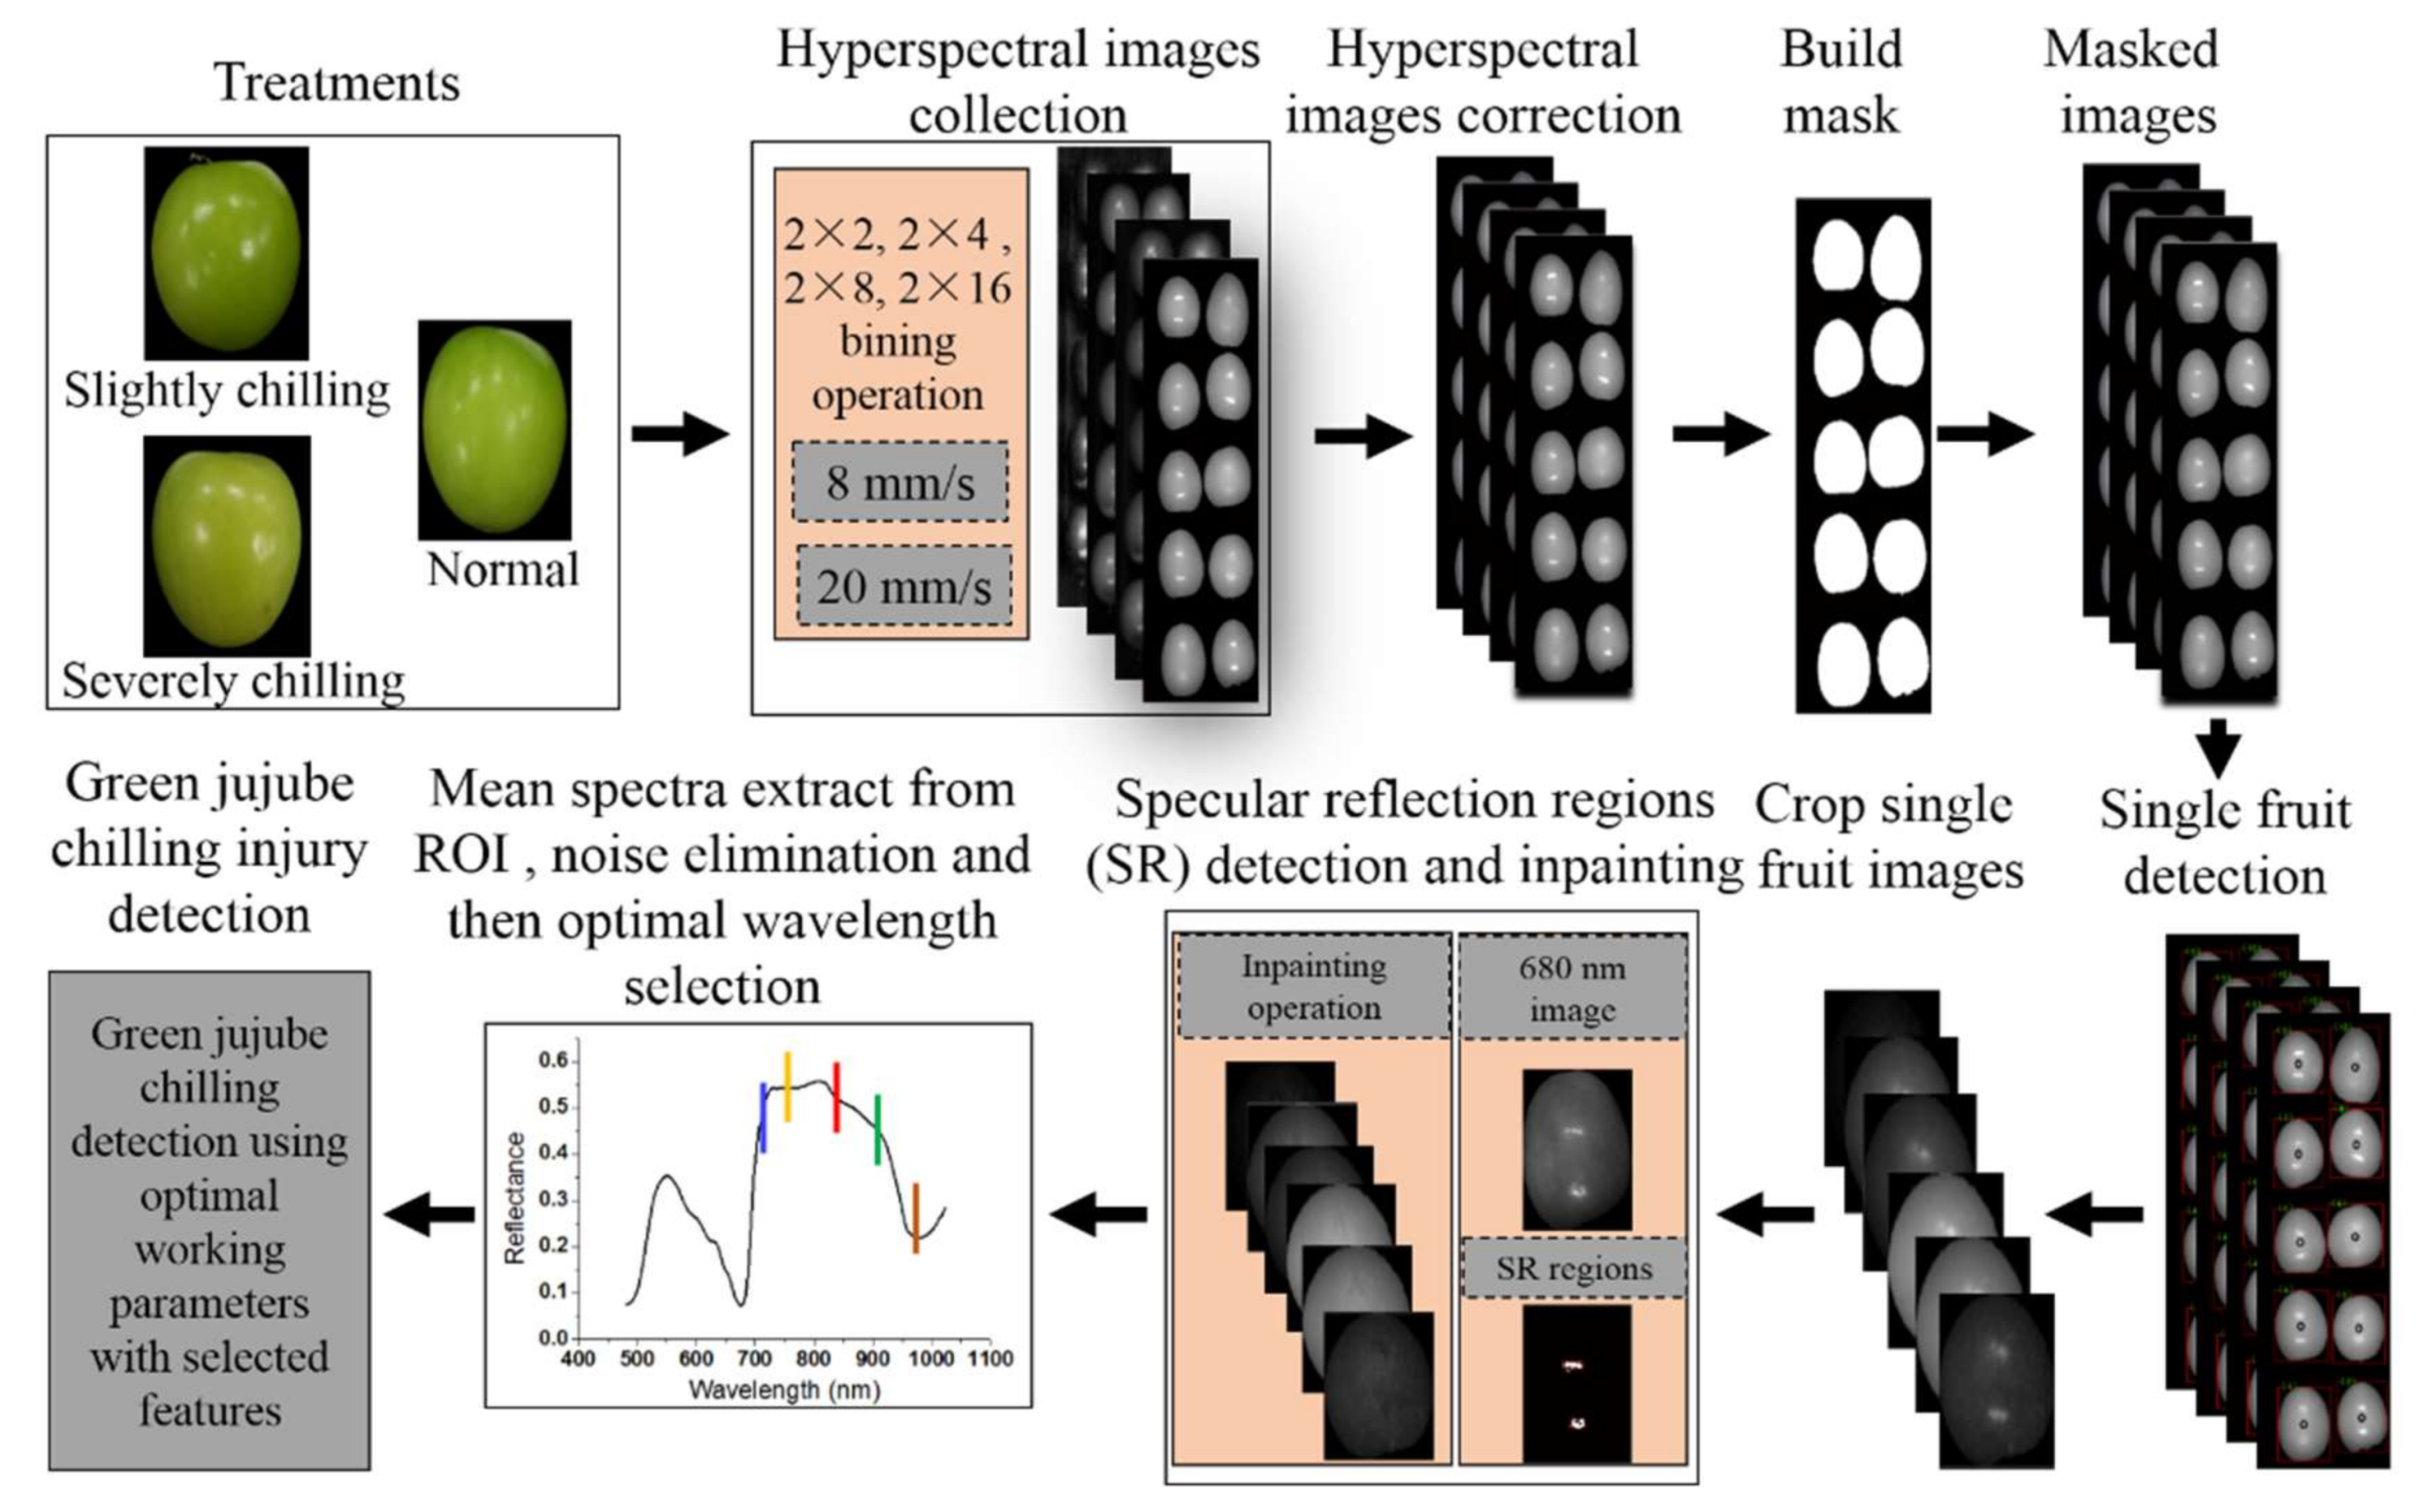
Figure 2.
Effect of different shapes of specular reflection region mask on inpainting performance (a), peak signal-to-noise ratio of different shapes of mask (b) and spectral images at some representative wavelengths of normal and chilled samples before and after inpainting (c) using 2 × 2 binning operation (spectral resolution of 1.25 nm).

Figure 3.
Mean spectra of normal (n = 120), slightly (n = 120) and severely (n = 120) chilling samples at different scanning speeds and spectral resolutions. (a,b) were 8 mm/s and 20 mm/s with spectral resolution of 1.25 nm, respectively. (c,d) were 8 mm/s and 20 mm/s with spectral resolution of 5.03 nm, respectively.

Figure 4.
The selection probability of each wavelength calculated by random frog at scanning speed of 8 mm/s and 20 mm/s using 2 × 2 (a) and 2 × 8 (b) binning operation, respectively.
Figure 4.
The selection probability of each wavelength calculated by random frog at scanning speed of 8 mm/s and 20 mm/s using 2 × 2 (a) and 2 × 8 (b) binning operation, respectively.
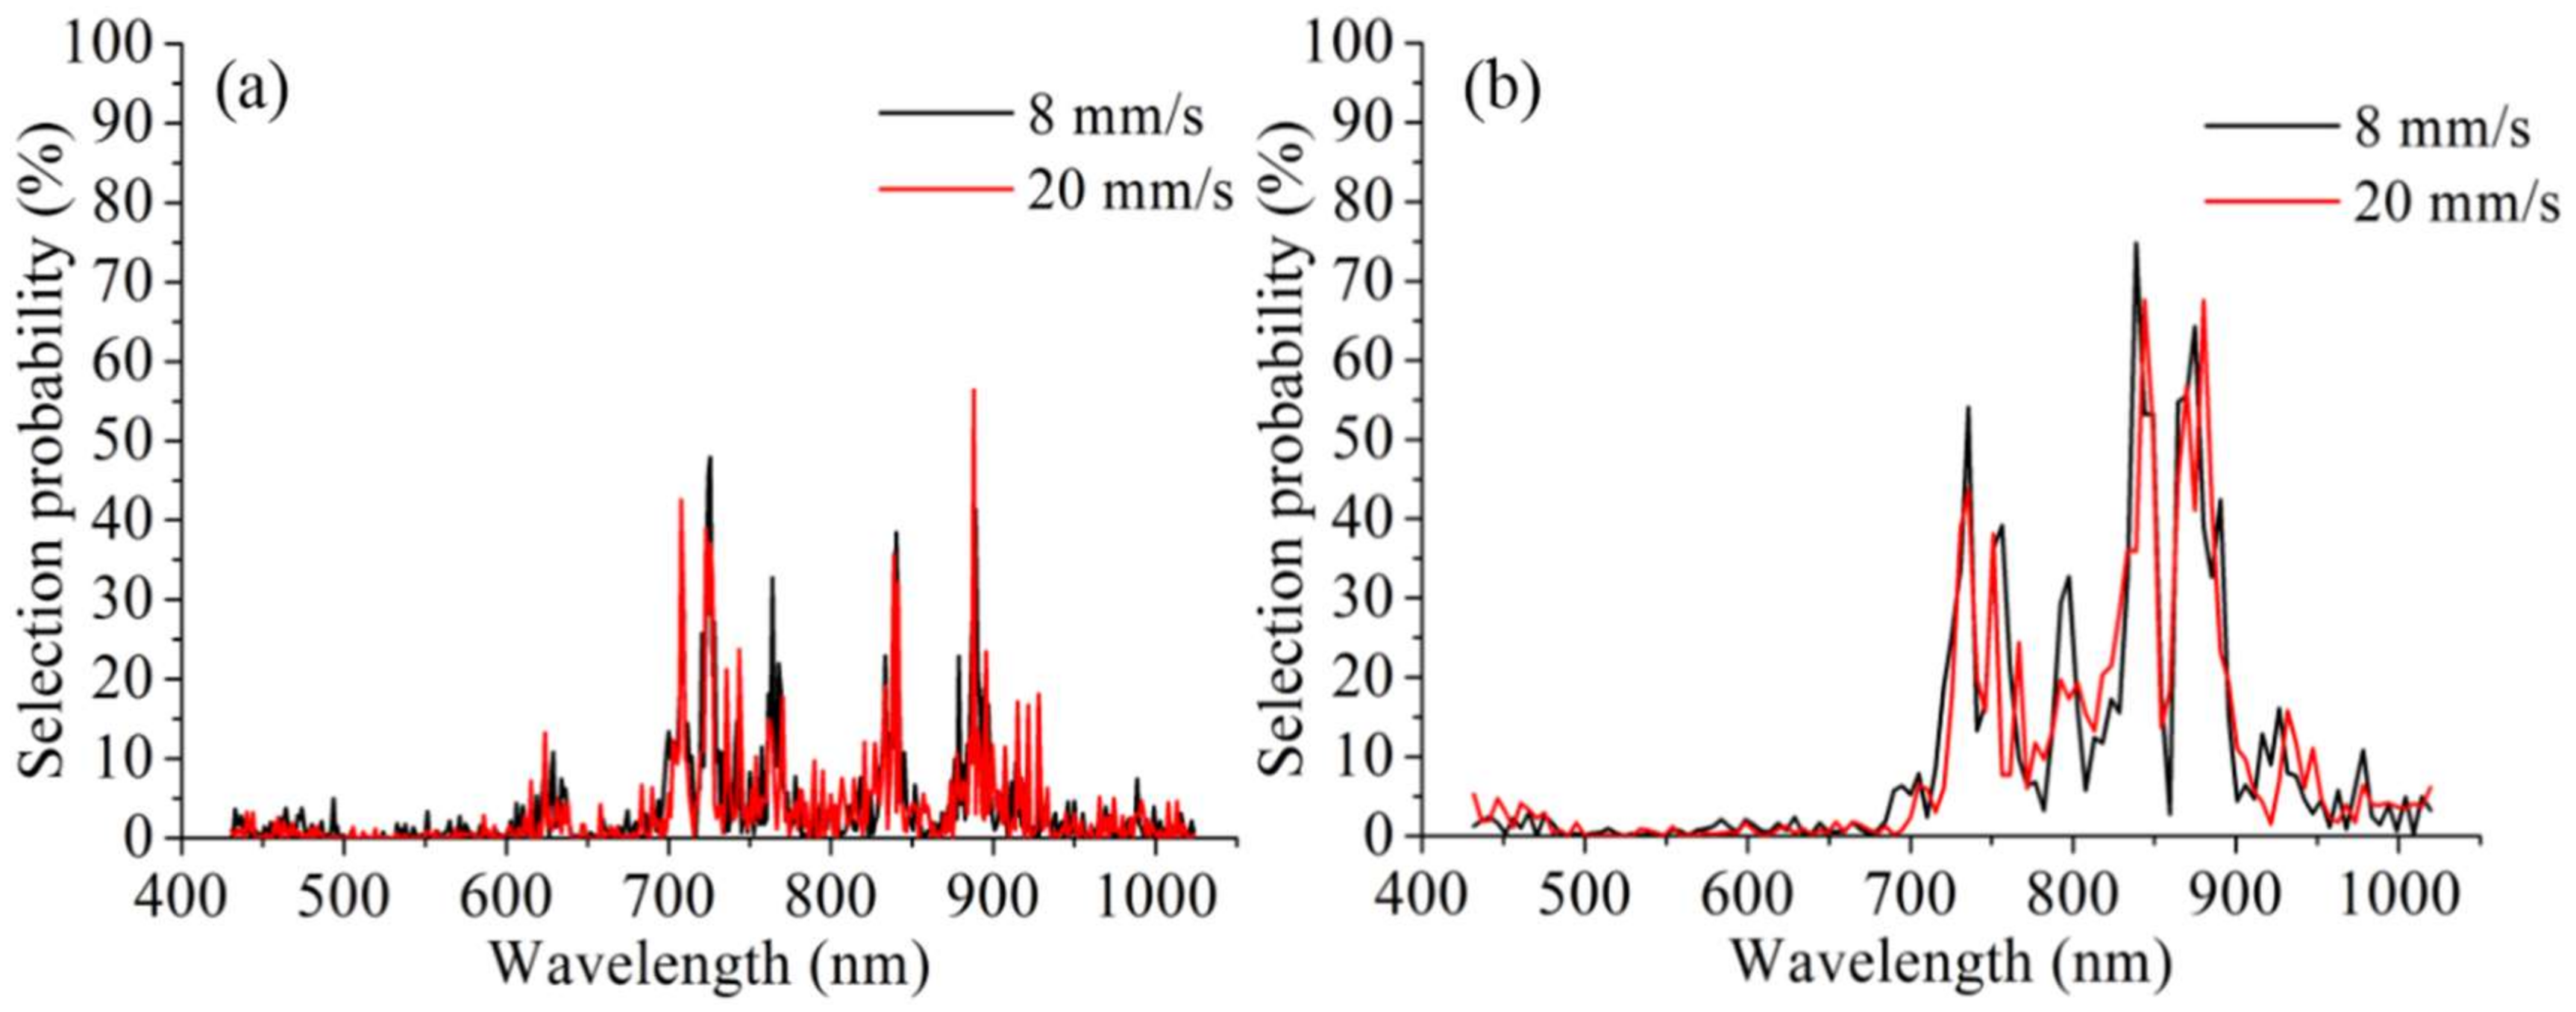
Figure 5.
The first five selected spectral images of representative samples selected by Random frog at different scanning speeds and spectral resolutions.
Figure 5.
The first five selected spectral images of representative samples selected by Random frog at different scanning speeds and spectral resolutions.
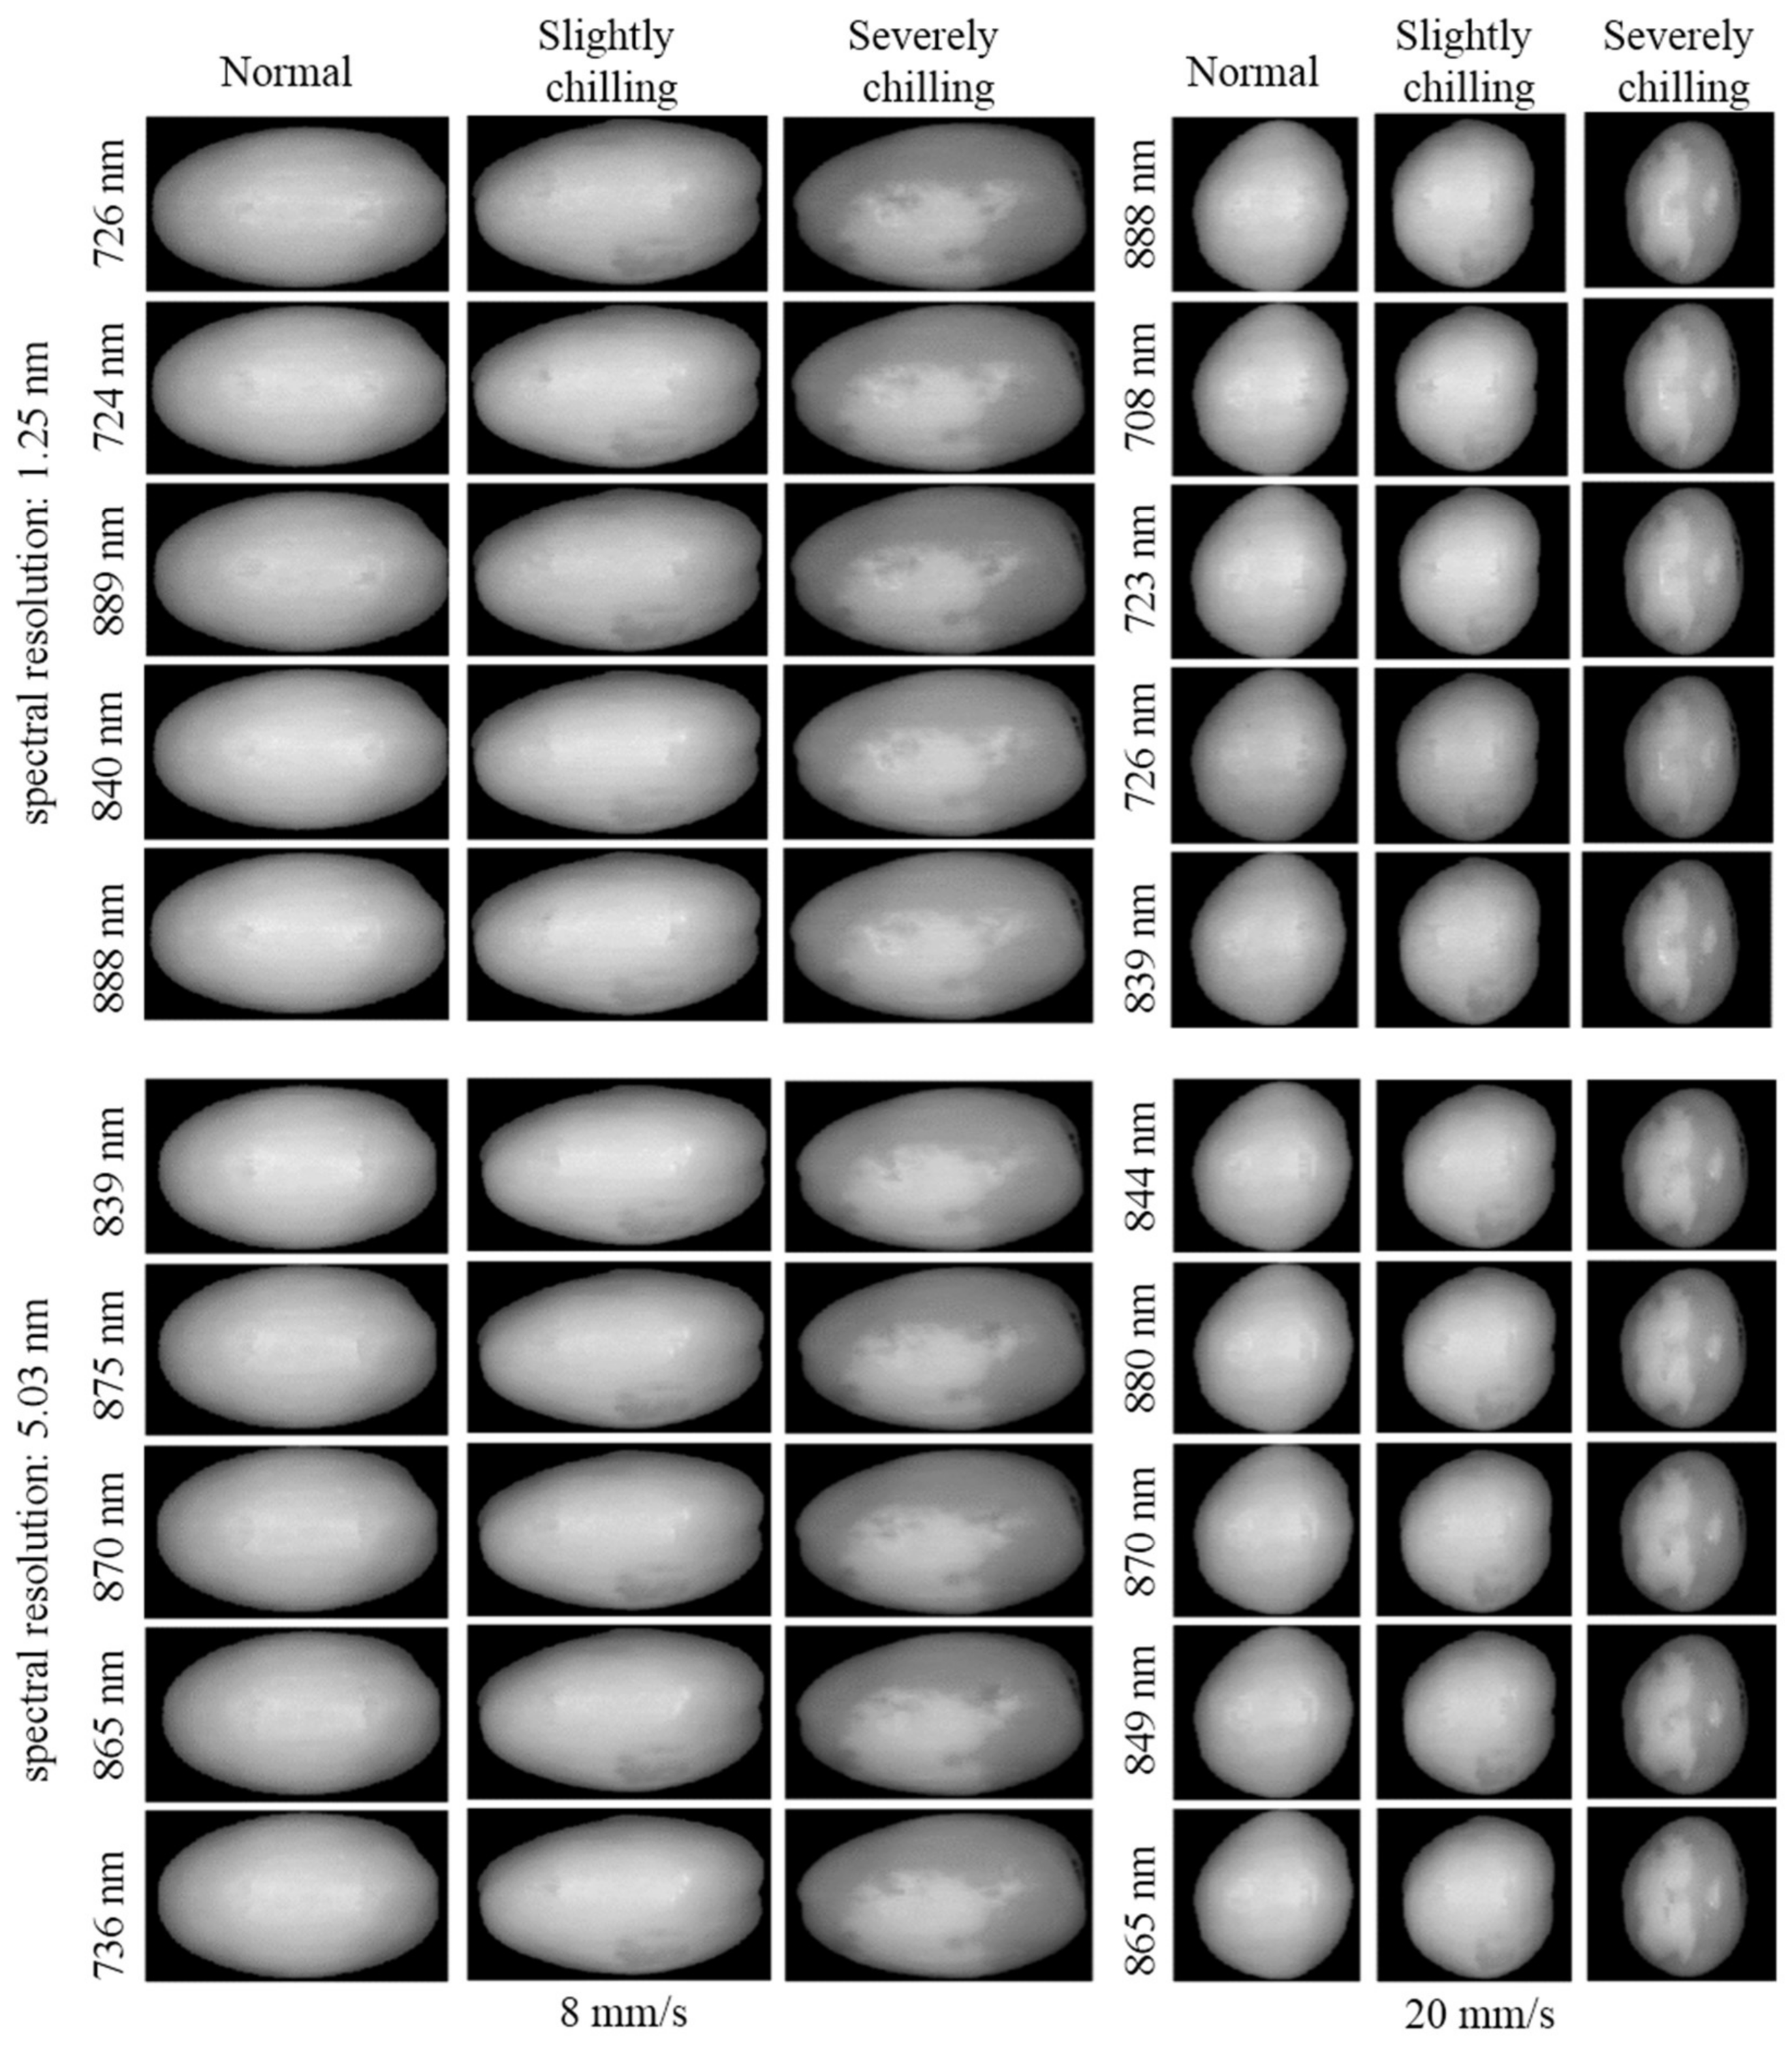
Figure 6.
Two-class performance comparison based on spectral features at different scanning speeds and spectral resolutions of 1.25 nm (a) and 5.03 nm (b), respectively.
Figure 6.
Two-class performance comparison based on spectral features at different scanning speeds and spectral resolutions of 1.25 nm (a) and 5.03 nm (b), respectively.
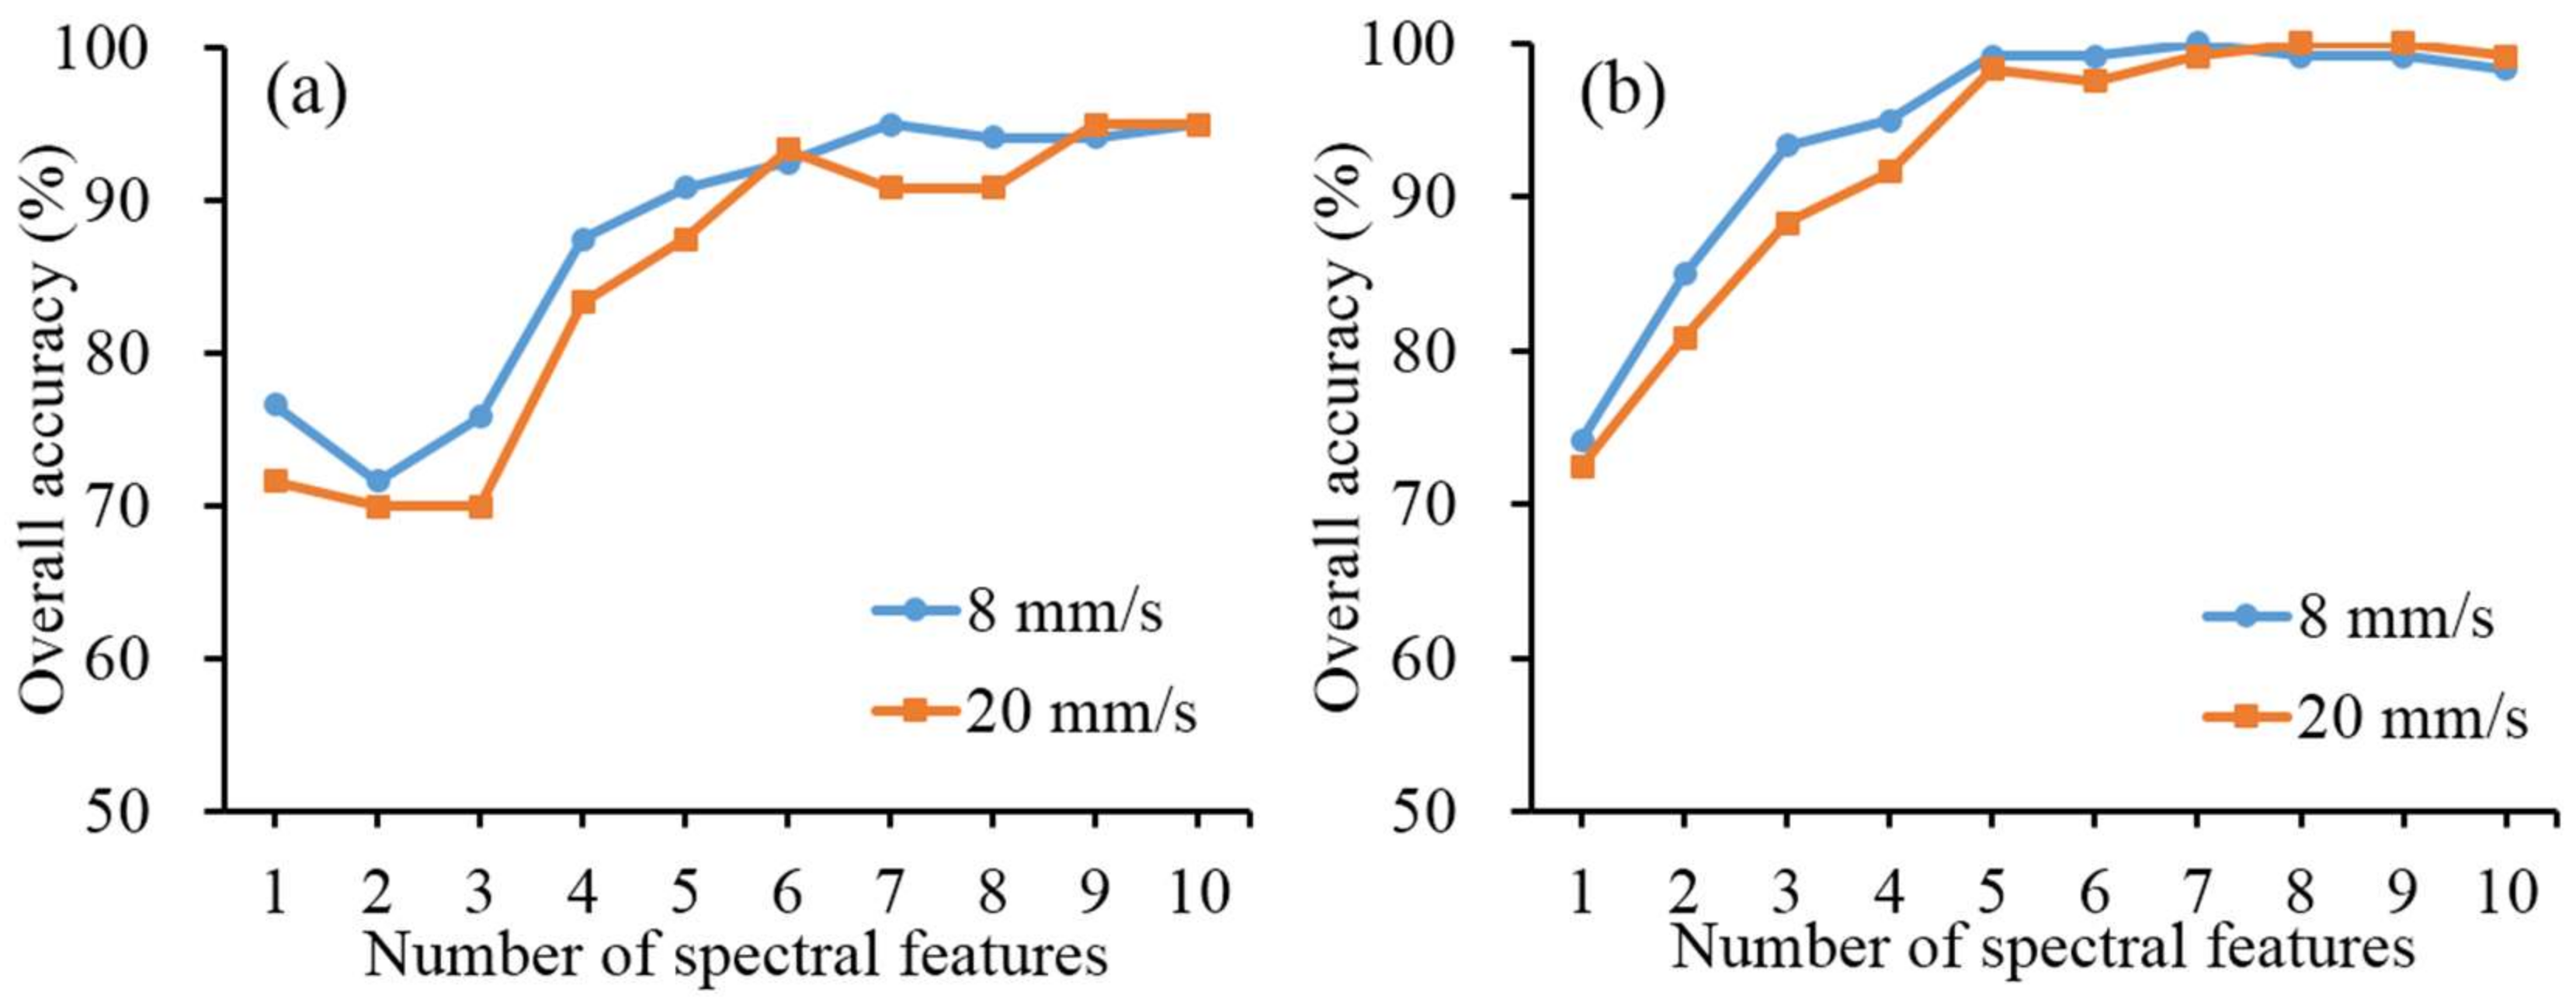
Figure 7.
There-class performance comparison based on spectral features at different scanning speeds and spectral resolutions of 1.25 nm (a) and 5.03 nm (b), respectively.
Figure 7.
There-class performance comparison based on spectral features at different scanning speeds and spectral resolutions of 1.25 nm (a) and 5.03 nm (b), respectively.
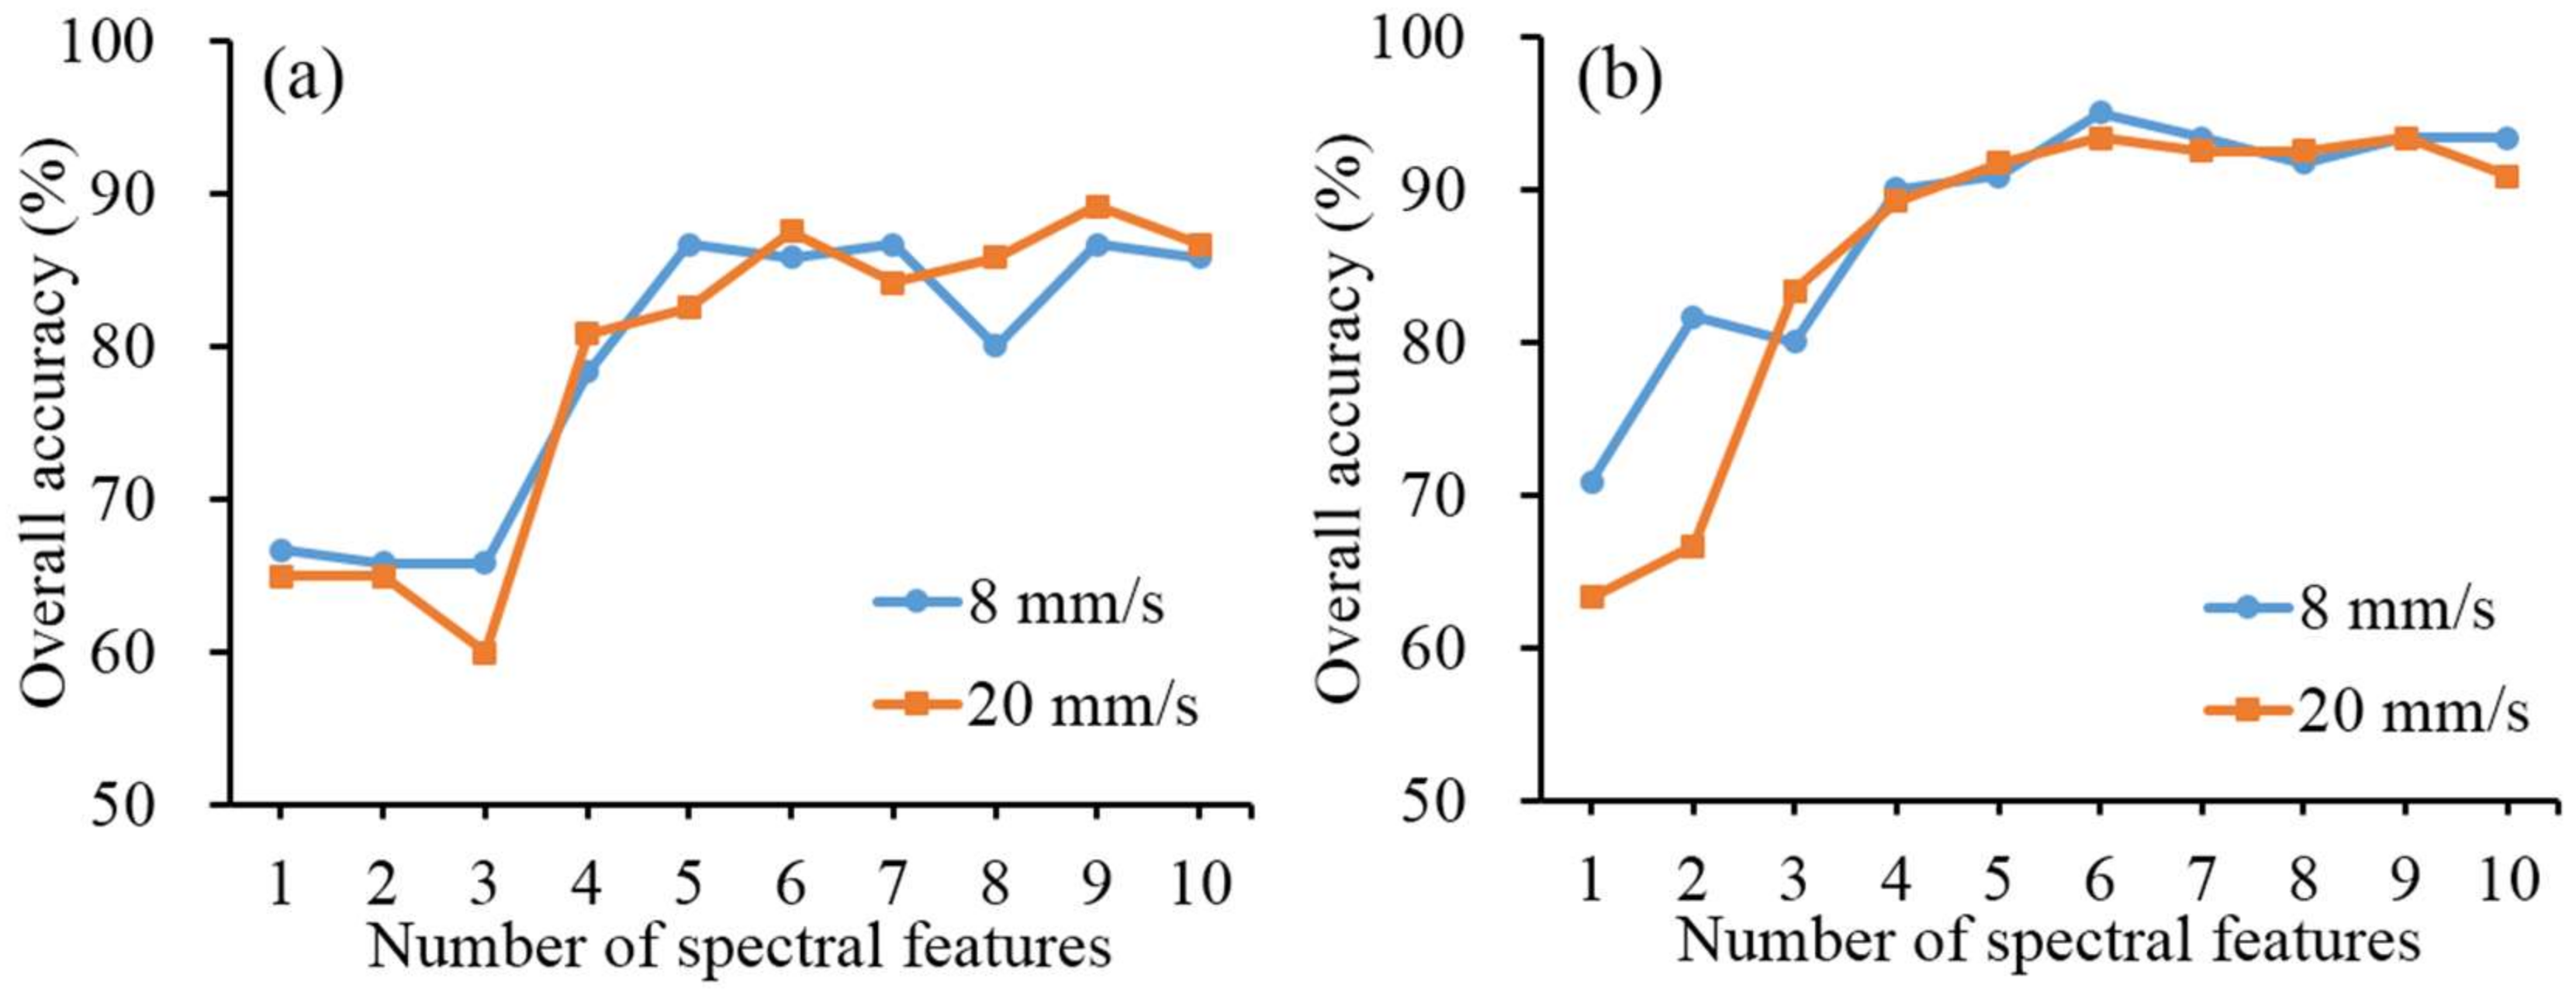
Figure 8.
There-class performance comparison based on image textural features at different scanning speeds and spectral resolutions of 1.25 nm (a) and 5.03 nm (b), respectively.
Figure 8.
There-class performance comparison based on image textural features at different scanning speeds and spectral resolutions of 1.25 nm (a) and 5.03 nm (b), respectively.


Table 1.
The first ten selected wavelengths selected by random frog at different scanning speeds and spectral resolutions for chilling injury identification of green jujube.
Table 1.
The first ten selected wavelengths selected by random frog at different scanning speeds and spectral resolutions for chilling injury identification of green jujube.
| Spectral Resolution (nm) | Speed (mm/s) | Wavelengths (nm) |
|---|---|---|
| 1.25 | 8 | 726, 724, 889, 840, 888, 764, 709, 723, 728, 841 |
| 20 | 888, 708, 723, 726, 839, 727, 841, 709, 724, 743 | |
| 5.03 | 8 | 839, 875, 870, 865, 736, 844, 849, 890, 756, 880 |
| 20 | 844, 880, 870, 849, 865, 736, 885, 875, 731, 751 |
Table 2.
Confusion matrixes of different combinations of scanning speeds and spectral resolutions based on the optimal number of spectral features.
Table 2.
Confusion matrixes of different combinations of scanning speeds and spectral resolutions based on the optimal number of spectral features.
| Prediction | Actual Class | |||||
| 1.25 nm, 8 mm/s a | 1.25 nm, 20 mm/s b | |||||
| Normal | Slightly Chilling | Severely Chilling | Normal | Slightly Chilling | Severely Chilling | |
| Normal | 41 | 2 | 0 | 40 | 2 | 0 |
| Slightly chilling | 3 | 44 | 6 | 3 | 45 | 5 |
| Severely chilling | 0 | 5 | 19 | 0 | 5 | 20 |
| Accuracy (%) | 93.2 | 86.3 | 76.0 | 93.0 | 86.5 | 80.0 |
| Prediction | 5.03 nm, 8 mm/s c | 5.03 nm, 20 mm/s d | ||||
| Normal | Slightly Chilling | Severely Chilling | Normal | Slightly Chilling | Severely Chilling | |
| Normal | 43 | 1 | 0 | 44 | 1 | 0 |
| Slightly chilling | 0 | 49 | 2 | 0 | 50 | 3 |
| Severely chilling | 0 | 3 | 22 | 0 | 4 | 18 |
| Accuracy (%) | 100 | 92.5 | 91.7 | 100 | 90.1 | 85.7 |
Note: the optimal number of spectral features for a, b, c and d were 5, 6, 6 and 6, respectively.
© 2018 by the authors. Licensee MDPI, Basel, Switzerland. This article is an open access article distributed under the terms and conditions of the Creative Commons Attribution (CC BY) license (http://creativecommons.org/licenses/by/4.0/).
Share and Cite
MDPI and ACS Style
Lu, H.; Yu, X.; Zhou, L.; He, Y. Selection of Spectral Resolution and Scanning Speed for Detecting Green Jujubes Chilling Injury Based on Hyperspectral Reflectance Imaging. Appl. Sci. 2018, 8, 523. https://doi.org/10.3390/app8040523
AMA Style
Lu H, Yu X, Zhou L, He Y. Selection of Spectral Resolution and Scanning Speed for Detecting Green Jujubes Chilling Injury Based on Hyperspectral Reflectance Imaging. Applied Sciences. 2018; 8(4):523. https://doi.org/10.3390/app8040523
Chicago/Turabian StyleLu, Huanda, Xinjie Yu, Lijuan Zhou, and Yong He. 2018. "Selection of Spectral Resolution and Scanning Speed for Detecting Green Jujubes Chilling Injury Based on Hyperspectral Reflectance Imaging" Applied Sciences 8, no. 4: 523. https://doi.org/10.3390/app8040523
Note that from the first issue of 2016, this journal uses article numbers instead of page numbers. See further details here.