Silicone-Based Molding Technique for Optical Flow Analysis in Transparent Models of Fluidic Components


Fluid Technology and Microfluidics, University of Rostock, Justus-von-Liebig-Weg 6, 18059 Rostock, Germany
*
Author to whom correspondence should be addressed.
Appl. Sci. 2018, 8(4), 512; https://doi.org/10.3390/app8040512
Submission received: 19 January 2018
/
Revised: 8 March 2018
/
Accepted: 26 March 2018
/
Published: 27 March 2018
(This article belongs to the Section Mechanical Engineering)
Abstract
:Featured Application
A new silicone-based molding technique allows for a non-transparent fluidic component to be replicated as a model with optical accessibility. This, in turn, allows for optical flow analysis, such as particle image velocimetry, to be performed. This technique can be applied in various technical fields, such as mechanical engineering or biomedical engineering.
Abstract
Optical flow analysis methods such as particle image velocimetry can only be performed in fluid systems or components with optical access. Many fluidic components, such as metallic tubes, do not typically feature optical accessibility. A new silicone-based molding technique is presented that makes it possible to replicate non-transparent fluidic components as models with optical accessibility that can be used to perform optical flow analysis. Furthermore, to avoid errors due to refraction, a test fluid is presented whose refractive index matches that of the silicone material of the replication. This new method allows flows to be analyzed in tubes or similar components with diameters in the range of only a few millimeters. An initial test was performed demonstrating the proof of concept and the velocity field of the flow inside a manifold was measured using a micro-particle image velocimetry setup. The study showed that both simple parts like tubes and complex parts such as manifolds can be replicated and investigated.
1. Introduction
Micro-particle image velocimetry (µ-PIV) has been broadly accepted as an optical method to measure flow fields at microscopic scales. The µ-PIV technique was first introduced by Santiago et al. in 1998 [1] and is now widely used in the fields of life science, lab-on-a-chip, micro electro mechanical systems (MEMS) and chemistry. Extensive reviews of µ-PIV techniques and applications have been published by Linkden [2], Wereley [3] and Williams [4].
µ-PIV is a variation of the well-known particle image velocimetry (PIV) technique that is used to measure macroscopic flows [5]. In both µ-PIV and PIV, the velocity is derived from the measured displacement of tracer particles that are suspended in the fluid. The displacement is calculated by cross-correlation of two subsequent images of the particles in the flow. µ-PIV uses dedicated microscopic imaging components in order to investigate regions from a few micrometers up to several millimeters by choosing an appropriate magnification. The light sheet that is applied in PIV is replaced by a volume illumination of the flow in µ-PIV, and the depth of field is determined by the numerical aperture of the objective lens of the microscope [6]. Fluorescent tracer particles are used to overcome the reflection from the nearby surfaces.
In a typical setup, a microfluidic device is placed on the stage of the microscope. The device has to allow optical access to the fluid flow. Many microfluidic MEMS devices made from silicon typically feature an optical access since the silicon substrates are often sealed with glass by anodic bonding [7,8]. PDMS (Polydimethylsiloxane) is also a very popular material for microfluidics, especially in the research community, because it is inexpensive and easy to fabricate by replication of molds made using rapid prototyping or other techniques [8,9]. Microfluidic devices made from PDMS are also optically transparent and can be investigated in a µ-PIV setup.
Although most popular manufacturing techniques offer the possibility to realize transparent windows or sealings, many fluidic devices or components made from silicon or metal do not feature optical access to the fluid flow. In the case of silicon, its transparency in the infrared region can be capitalized upon, so infrared micro-particle image velocimetry can be used to investigate the fluid flow [10,11,12].
A further possibility to achieve optical access was investigated in studies utilizing transparent models of the object to be investigated: coronary stents [13] and a stenosed artery [14], respectively. In the first study, an original stent was mounted on a balloon catheter and inserted into a polyurethane hose. Silicone was poured into the hose and cured. In the second study, a stenosis artery model was manufactured from silicone by casting around a pair of rods whose ends are shaped and slotted together. The silicone replicates were then used for µ-PIV investigations. Although the studies utilized molding techniques, they do not describe a method to replicate complex or irregular inner surface structures of fluidic components such as metallic tubes with weld seams or manifolds.
The aim of the current study is to present a new method to perform optical flow analysis in transparent models of fluidic components. In order to realize an optical access, a new silicone-based molding technique is used to create a transparent replication of the original component. Silicones are very well suited for the molding step because they are dimensionally stable and have a high elongation at break (several 100%), so they can be removed without any damage or permanent deformation. Silicone molding is a widely used technology because the flexible mold can produce parts with extremely complex geometry, intricate detail and tight tolerances [15,16]. In order to allow flow behavior to be analyzed, the new molding technique has to ensure both a detailed representation of the internal geometry of the original component and optical access for the cameras of the µ-PIV system.
For performing flow analysis in a transparent replication of an original part, it is also necessary to use a fluid that has an index of refraction which matches that of the replicate’s material, in order to avoid optical distortions. Previous investigations serve as a basis for the development of suitable refractive index matched fluids [17,18].
2. Materials and Methods
2.1. Molding Technique
The investigations were conducted using stainless steel tubes having an inner diameter of approx. 4 mm. A welded tube and a welded manifold were chosen as test parts.
The molding process is shown in Figure 1. The process starts with a non-transparent sample (e.g., welded tube) (1); Then the silicone is poured into the tube, forming a core with a detailed representation of the internal geometry. This step uses the addition curing silicone Elastosil® M 4601 (Wacker Chemie AG, Munich, Germany). This is an addition curing silicone with an elongation at break of 700%. In order to avoid trapped air, the mold is placed in a vacuum chamber during curing. The core is removed from the tube after 24 h (2); The result is a core with a detailed representation of the internal geometry of the tube (3).
In the next step, this core is fixed in an aluminum square profile (l × w × h: 30 × 25 × 20 mm) by pushing it through two screw connections (4); In order to avoid leaking, the profile is bonded to a glass plate. After this, the aluminum profile is filled up with a transparent silicone (5); The additional curing Elastosil® RT 601 (Wacker Chemie AG, Munich, Germany) is used as the material for the replication. It is important to ensure that the surface of the mold is as smooth as possible and not deformed. Again, it is necessary to place the mold in a vacuum chamber to remove trapped air. After the drying phase of 24 h the core and the glass plate are removed (6). It is important to choose silicones for the core and replication that can be separated from each other well, leaving no streaks or residues remaining in the replication after removal of the core.
2.2. Test Liquid
To perform flow analysis, a suitable fluid has to be chosen. The fluid itself is driven through the sample by a pump. In order to avoid errors due to refraction, an appropriate fluid needs to be found that has an index of refraction which matches that of the material of the replication (Elastosil® RT 601). A list of aqueous solutions suitable for refractive index matching is given by Budwig [7] and is shown in Table 1.
An aqueous glycerol solution was chosen to be the test liquid and various solutions were prepared with varying concentrations of glycerol in the range of 55 to 60 wt % in 0.5 increments. The temperature-dependent refractive index of the solution as well as of the Elastosil® RT 601 is determined for the range of 15 to 25 °C in 1 °C increments. The refractometer Abbemat 300 by Anton Paar (Graz, Austria) is used to determine the refractive index.
2.3. Micro Particle Image Velocimetry (µ-PIV)
In order to demonstrate the proof of concept an initial flow analysis is performed. The velocity field of the flow is determined using a Micro Stereo PIV system (µ-PIV) 3D Stereo Flowmaster PIV/PTV-System (LaVision, Göttingen, Germany) shown in Figure 2. Image processing and uncertainty analysis have been performed using the imaging software DaVis 8.4 (LaVision, Göttingen, Germany). The µ-PIV in combination with a stereo microscope Discovery V20 by Carl Zeiss (b) (Oberkochen, Germany) allows for the analysis of simple and complex flows with high precision. For this, fluorescent particles, which follow the flow and make it visible for the cameras, are added to the test fluid. PMMA (polymethyl methacrylate)-RhB particles (LaVision, Munich, Germany) with a size of 10 microns are used.
The particles are illuminated twice by a Nd:YAG double pulse laser (Litron Lasers, Rugby, UK) with a wavelength of 532 nm and recorded with sCMOS (scientific-grade Complementary Metal Oxide Semiconductor) double-frame cameras (a) Imager sCMOS (LaVision, Göttingen, Germany). The measurement setup (d) is placed under the microscope (b). The velocity vectors are calculated from the displacement of the particle between the two images using cross correlation technique.
A schematic sketch of the measurement setup is depicted in Figure 3. The circuit consists of a micro-annular gear pump mzr®-7245 (HNP Mikrosysteme GmbH, Schwerin, Germany) with a membrane filter located in front and the sample. The membrane filter protects the pump from large agglomerates.
The measurement was started 10 s after activating the pump, in order to ensure a fully developed flow. The experiments are carried out at 4000 rpm, corresponding to a flow rate of 192 mL/min. The pulse interval, which is the time between two laser pulses, is set to 400 µs. In each case, 100 images are recorded and evaluated.
3. Results
3.1. Molding
The cores as well as the replicates of the tube and the manifold were created successfully. The silicone Elastosil® M 4601 has been found suitable for molding the core. With this material, it is possible to guarantee a detailed core reproducing the original internal geometry and being easily removable from the tube. For the second and decisive cast the transparent Elastosil® RT 601 has proved to be particularly good. The two silicones do not bond and can therefore be easily separated from each other. There are also no residues in the replicated part. The results of the experiments are depicted in Figure 4 and Figure 5.
The removal of the silicone core from the welded manifold also proceeded without any problems. Therefore, due to the high elasticity of the silicone this molding technique can also be used for replicating complex fluidic structures like manifolds with different branching angles.
If the diameter of the fluidic components is too small, the silicone core can break when pulled out. If the diameter of the test samples is too big, the removal of the core can also become more troublesome, because it will be more difficult to deform the material.
The surface properties of the silicone replication, like roughness and surface energy, differ from those of the original component. Although this molding technique provides a very accurate reproduction of geometrical surface details that are sufficient for this investigation, it has to be kept in mind that microfluidic effects would increase as the geometries become even smaller (e.g., influence of surface roughness, wall slip, entrance effects) [19]. It would therefore be necessary to closely investigate the respective properties of the original component and its silicone replica: for example, surface roughness and surface energy.
In the present study, the diameter of the tube is in the preferred range of several millimeters and the reproduction of the surface worked very well. The influence of the wall effects is negligibly small. Furthermore, experimental investigations were carried out with only low volume flows and an open fluid pathway, so no deformation of the silicone due to fluidic pressure could be observed.
3.2. Test Liquid
A suitable fluid had to be found that had a refractive index to match that of the silicone material of the replication (Elastosil® RT 601). Aqueous glycerol solutions were prepared and tested. The temperature dependence of the refractive index of silicone and the aqueous glycerol solution were measured using a refractometer. The results are depicted in Figure 6.
The refractive index decreases with increasing temperature for both the silicone and the aqueous glycerol solutions. However, the gradients of decrease for the silicone and the solutions are different. The spread of the refractive index for the tested solutions is nearly constant over the whole temperature range. Refractive index matching solutions can be found for the considered temperature range. Table 2 lists the appropriate concentrations of the aqueous glycerol solution for various temperature subranges.
If other materials such as PMMA are used [2] for the replicate, the fluid has to be adjusted or another fluid has to be chosen accordingly.
This method can also be used to investigate the flow of a particular fluid applying the concept of similitude. The concept of similitude is especially useful when the chosen refractive index matching liquid features a density or viscosity different to the original fluid. Similar flow conditions in channel flow can be established by keeping the Reynolds number constant. Therefore, the velocity in this setup could be adjusted to match the relevant Reynolds number. A second possibility is to adjust the temperature of the setup. Matching refractive indices of silicone and aqueous glycerol solution can be found by varying the glycerol concentration. This also leads to a change in fluid density and viscosity. A third method for adjusting the density and viscosity of the test liquid to the original fluid is to use additives such as thickening agents when preparing the refractive index matching liquid.
3.3. Micro Particle Image Velocimetry (µ-PIV)
An initial test was performed demonstrating the proof of concept. A 58.75% aqueous glycerol solution was chosen according to the ambient temperature of the µ-PIV lab (21 °C). Using µ-PIV the velocity field of the flow inside a manifold could be measured.
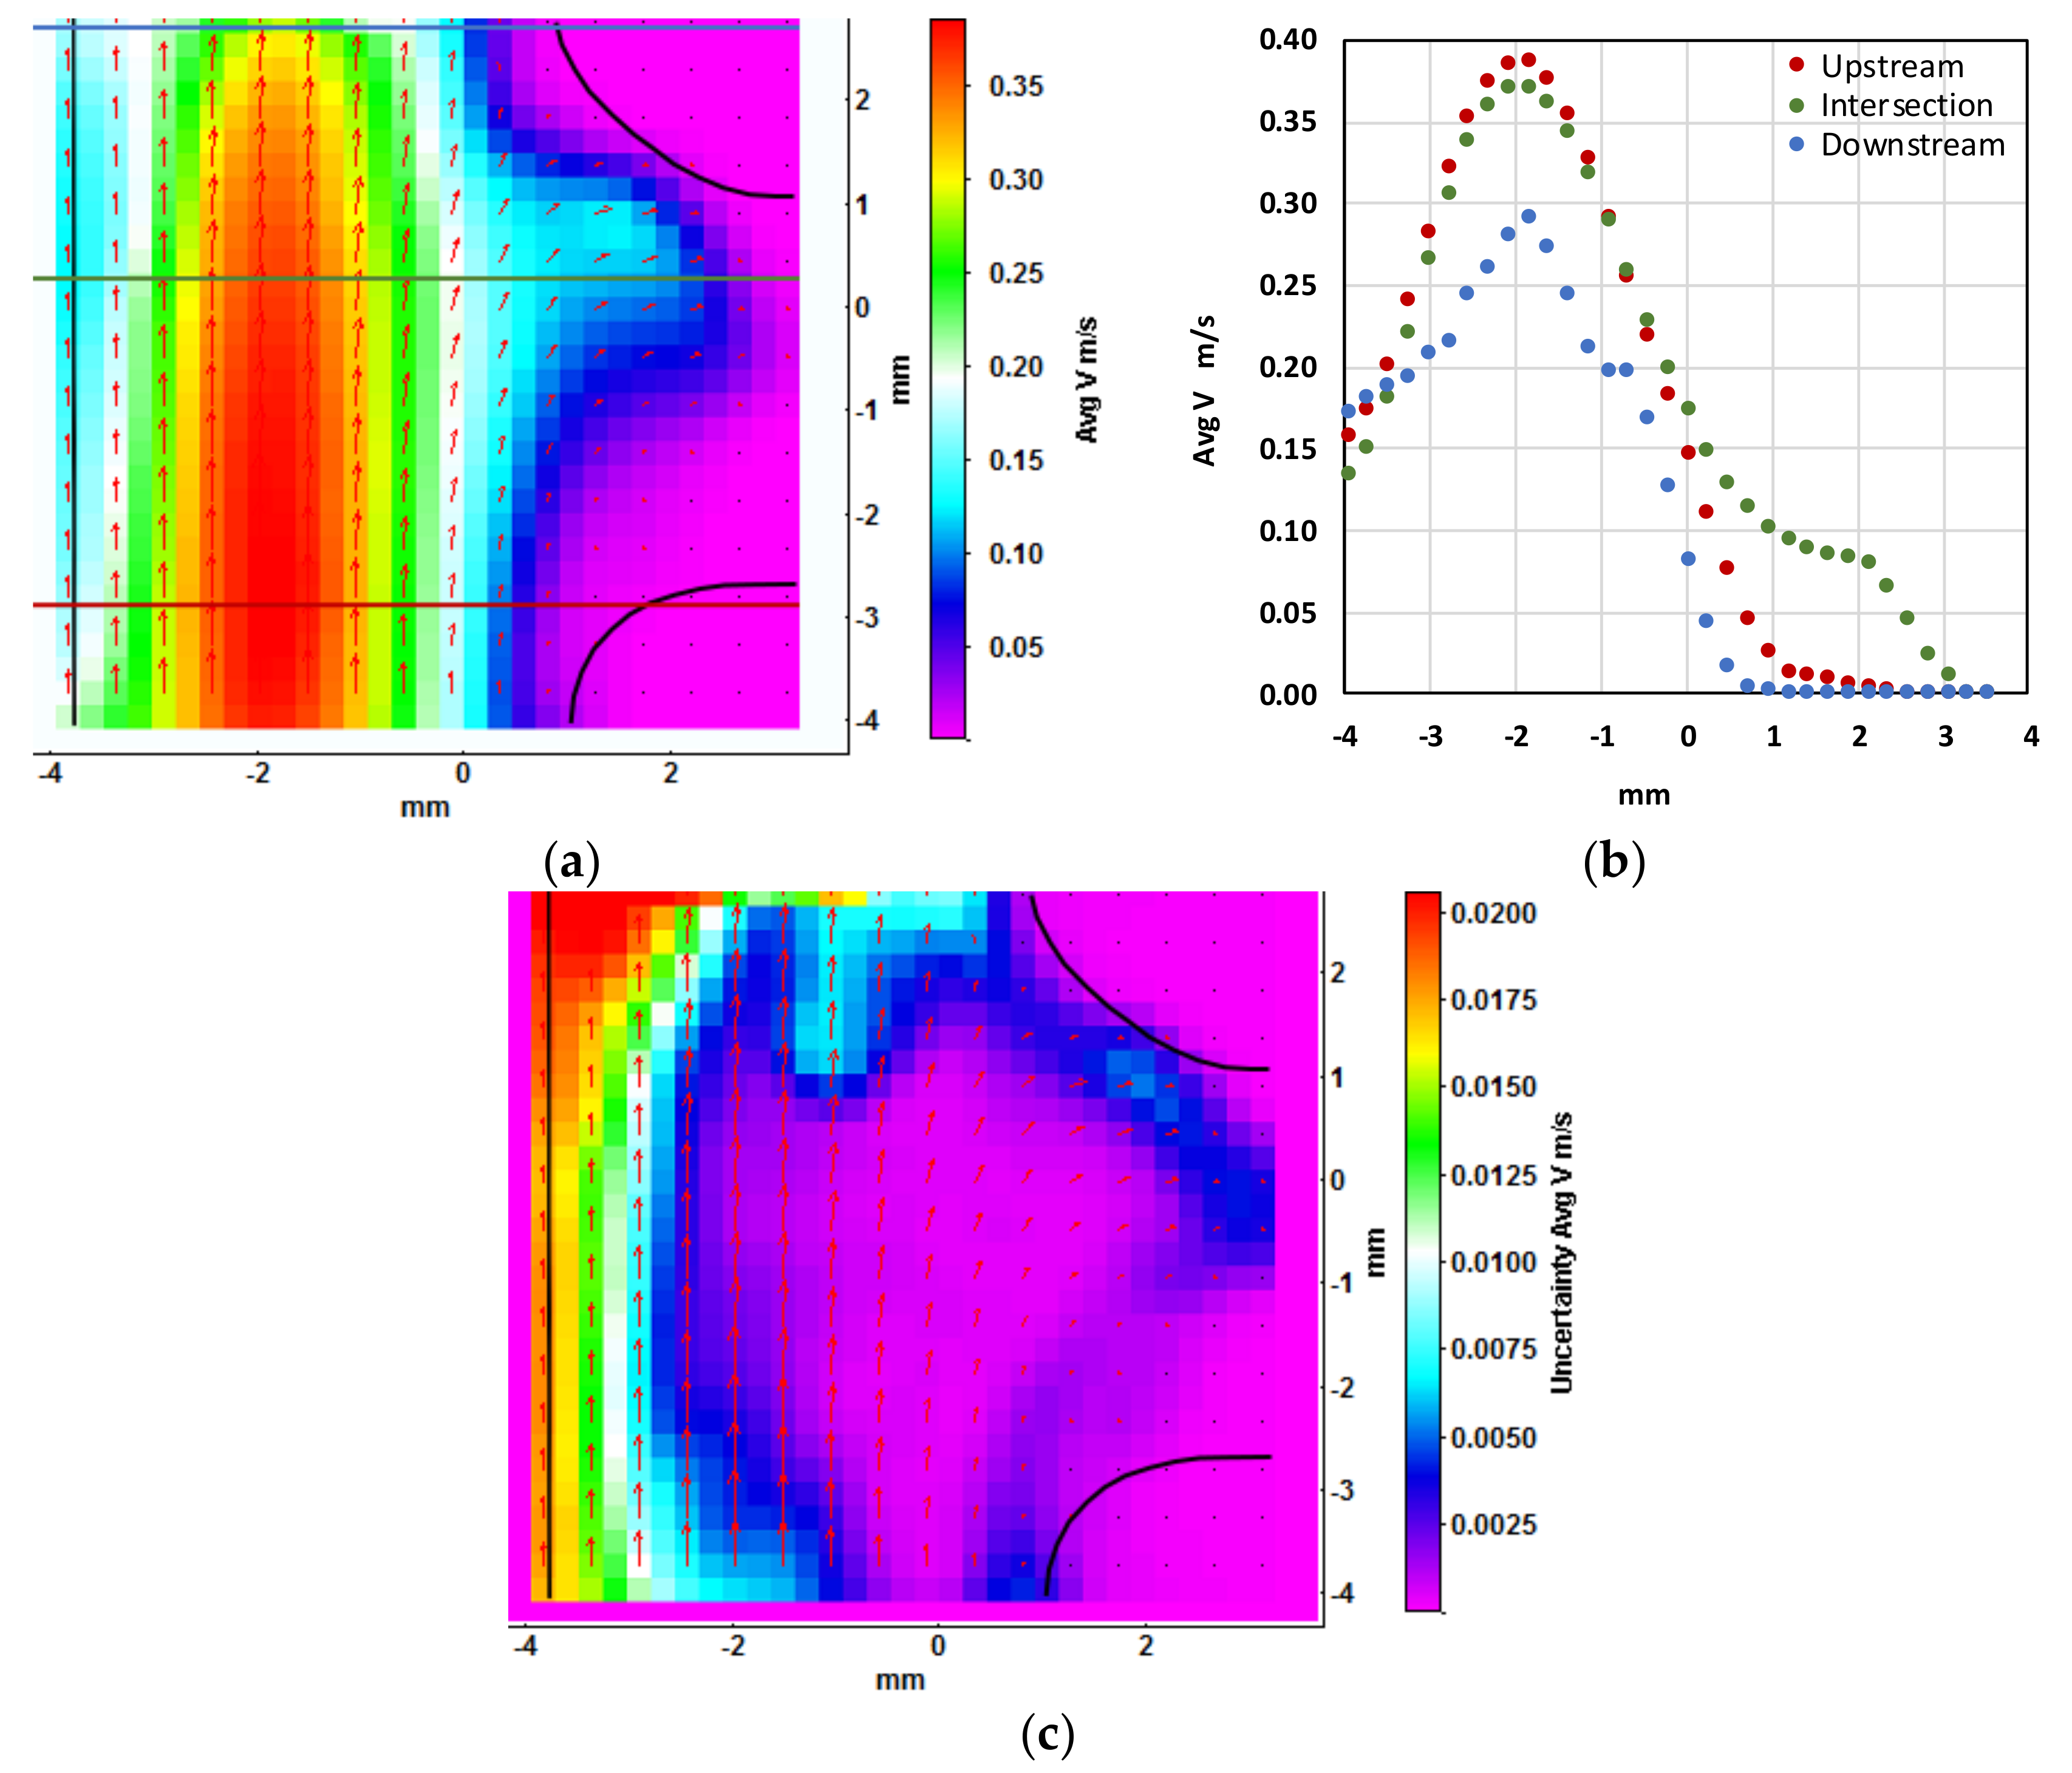
Figure 7a shows a contour plot of velocity magnitude averaged over 50 image sets. The geometry of the manifold is indicated by black marking and the locations of the three velocity probe lines are indicated by red, green, and blue lines.
Most of the fluid flows through the top branch of the manifold, with the maximum velocity in the side branch being about 1/3 of the maximum velocity in the top branch (Figure 7a). Figure 7b shows the velocity profile at the three probe lines upstream (red) and downstream (blue) of the manifold, as well as in the intersection of the manifold (green). The absence of an inviscid core upstream of the manifold indicates fully developed laminar flow. The velocity profile in the manifold and downstream is asymmetric because of the side branch. As expected from mass balance the velocity is highest upstream of the manifold. The velocity vectors close to the left wall are not zero: this does not match the velocity that would be expected from theory. This is due to the fact that the interrogation windows overlap the wall boundary.
Figure 7c shows the contour plot of PIV uncertainty of the averaged velocity magnitude. The method of Wienecke [20] which is based on correlation statistics and is integrated in LaVision Davis 8.4 has been used. At the far left and in the top left corner the uncertainty reaches about 13% of the velocity magnitude. The far left region is already outside of the geometry and the top left region has been illuminated less than the rest of the geometry so fewer particles could be used for cross correlation. In the regions of interest, such as in the mean flow and in the side branch, the uncertainty is mostly less than 3% of the corresponding velocity magnitude.
The optical accessibility to the fluid flow itself was very good. No lens effect could be observed. The described measurement setup is well-suited to perform flow analysis of molded tubes at different flow rates and pulse intervals.
4. Conclusions
In order to analyze the flow in non-transparent fluidic parts, a new method was created, which allows for the original part to be replicated as a model with optical accessibility. Here, silicones have proven to be suitable materials. The study showed that both simple parts, like tubes, and complex parts, like manifolds, can be replicated and investigated. To avoid errors due to refraction, a suitable fluid with matching refractive index was found. Various aqueous glycerol solutions have proved to be appropriate for covering a wide temperature range. The presented technique can be applied in various technical fields, such as mechanical engineering or biomedical engineering. The technique allows for researchers to investigate fluid flow in, for example, tubes with weld seams, nozzles and diffusers, venture tubes, outlets and simple valves, rifled tubes, and fluidic connectors, as well as in stents (especially tube stents like ureteral stents or tympanostomy tubes) or in medical liquid-handling systems such as medical drainage systems or connectors and dosing systems.
Acknowledgments
This project was funded by the Bundesministerium für Bildung und Forschung (grant number: 03WKCC2B; Innovative Regional Growth Cores “Centifluidic Technologies” which is part of the initiative “Entrepreneurial Regions”—“The BMBF Innovation Initiative for the New German Länder”). We acknowledge financial support by Deutsche Forschungsgemeinschaft and Universität Rostock within the funding programme Open Access Publishing.
Author Contributions
Mark Schult and Christoph Drobek conceived and designed the experiments; Mark Schult and Christoph Drobek performed the experiments and analyzed the data; Mark Schult, Christoph Drobek and Hermann Seitz wrote the paper.
Conflicts of Interest
The authors declare no conflict of interest
References
- Santiago, J.G.; Wereley, S.T.; Meinhart, C.D.; Beebe, D.J.; Adrian, R.J. A particle image velocimetry system for microfluidics. Exp. Fluids 1998, 25, 316–319. [Google Scholar] [CrossRef]
- Lindken, R.; Rossi, M.; Große, S.; Westerweel, J. Micro-Particle Image Velocimetry (µPIV): Recent developments, applications, and guidelines. Lab Chip 2009, 9, 2551–2567. [Google Scholar] [CrossRef] [PubMed]
- Wereley, S.T.; Meinhart, C.D. Recent Advances in Micro-Particle Image Velocimetry. Annu. Rev. Fluid Mech. 2010, 42, 557–576. [Google Scholar] [CrossRef]
- Williams, S.J.; Park, C.; Wereley, S.T. Advances and applications on microfluidic velocimetry techniques. Microfluid. Nanofluid. 2010, 8, 709–726. [Google Scholar] [CrossRef]
- Adrian, R.J. Particle-imaging techniques for experimental fluid mechanics. Annu. Rev. Fluid Mech. 1991, 23, 261–304. [Google Scholar] [CrossRef]
- Rosse, M.; Segura, R.; Cierpa, C.; Kähler, C.J. On the effect of particle image intensity and image preprocessing on the depth of correlation in micro-PIV. Exp. Fluids 2012, 52, 1063–1075. [Google Scholar] [CrossRef]
- Kanda, Y.; Matsuda, K.; Murayama, C.; Sugaya, J. The mechanism of field-assisted silicon-glass bonding. Sens. Actuators A Phys. 1990, 23, 939–943. [Google Scholar] [CrossRef]
- Temiz, Y.; Lovchik, R.D.; Kaigala, G.V.; Delamarche, E. Lab-on-a-chip devices: How to close and plug the lab? Microelectron. Eng. 2015, 132, 156–175. [Google Scholar] [CrossRef]
- Byung-Ho, J.; Van Lerberghe, L.M.; Motsegood, K.M.; Beebe, D.J. Three-dimensional micro-channel fabrication in polydimethylsiloxane (PDMS) elastomer. J. Microelectromech. Syst. 2000, 9, 76–81. [Google Scholar] [CrossRef]
- Han, G.; Bird, J.C.; Johan, K.; Westin, A.; Cao, Z.; Breuer, K.S. Infrared diagnostics for measuring fluid and solid motion inside silicon microdevices. Microscale Thermophys. Eng. 2004, 8, 169–182. [Google Scholar] [CrossRef]
- Liu, D.; Garimella, S.V.; Wereley, S. Infrared micro-particle image velocimetry in silicon-based microdevices. Exp. Fluids 2005, 38, 385–392. [Google Scholar] [CrossRef]
- Jones, B.J.; Lee, P.-S.; Garimelly, S.V. Infrared micro-particle image velocimetry measurements and predictions of flow distribution in a microchannel heat sink. Int. J. Heat Mass Transf. 2008, 51, 1877–1887. [Google Scholar] [CrossRef]
- Quosdorf, D.; Brede, M.; Leder, A.; Lootz, D.; Martin, H.; Schmitz, K.-P. Using Micro-Particle-Image-Velocimetry for Measuring Velocities in a Coronary Vessel Treated by a Stent. Tm-Tech. Messen 2011, 78, 239–245. [Google Scholar] [CrossRef]
- Shuib, A.; Hoskins, P.; Easson, W. Experimental investigation of particle distribution in a flow through a stenosed artery. J. Mech. Sci. Technol. 2011, 25, 357–364. [Google Scholar] [CrossRef]
- Smock, D. New formulations, process technology propel silicone molding. Modern Plast. 1998, 4, 64–65. [Google Scholar]
- Shit, S.C.; Shah, P. A Review on Silicone Rubber. Natl. Acad. Sci. Lett. 2013, 36, 355–365. [Google Scholar] [CrossRef]
- Budwig, R. Refractive index matching methods for liquid flow investigations. Exp. Fluids 1994, 17, 350–355. [Google Scholar] [CrossRef]
- Kasarova, S.N.; Sultanova, N.G.; Nikolov, I.D. Temperature dependence of refractive characteristics of optical plastics. J. Phys. Conf. Ser. 2010, 498, 012028. [Google Scholar] [CrossRef]
- Koo, J.; Kleinstreuer, D. Liquid flow in microchannels: Experimental observations and computational analyses of microfluidics effects. J. Micromech. Microeng. 2003, 13, 568–579. [Google Scholar] [CrossRef]
- Wieneke, B. Generic a-posteriori uncertainty quantification for PIV vector fields by correlation statistics. In Proceedings of the 17th International Symposium on Applications of Laser Techniques to Fluid Mechanics, Lisbon, Portugal, 7–10 July 2014. [Google Scholar]
Figure 1.
Molding process of a welded tube in schematic form: (1) welded tube; (2) molding and removing of the silicone core; (3) detailed silicone core; (4) fixing of the core in an aluminum square profile; (5) filling up the aluminum profile with a transparent silicone and removing of the core after curing; (6) final replicate for performing optical flow analysis.
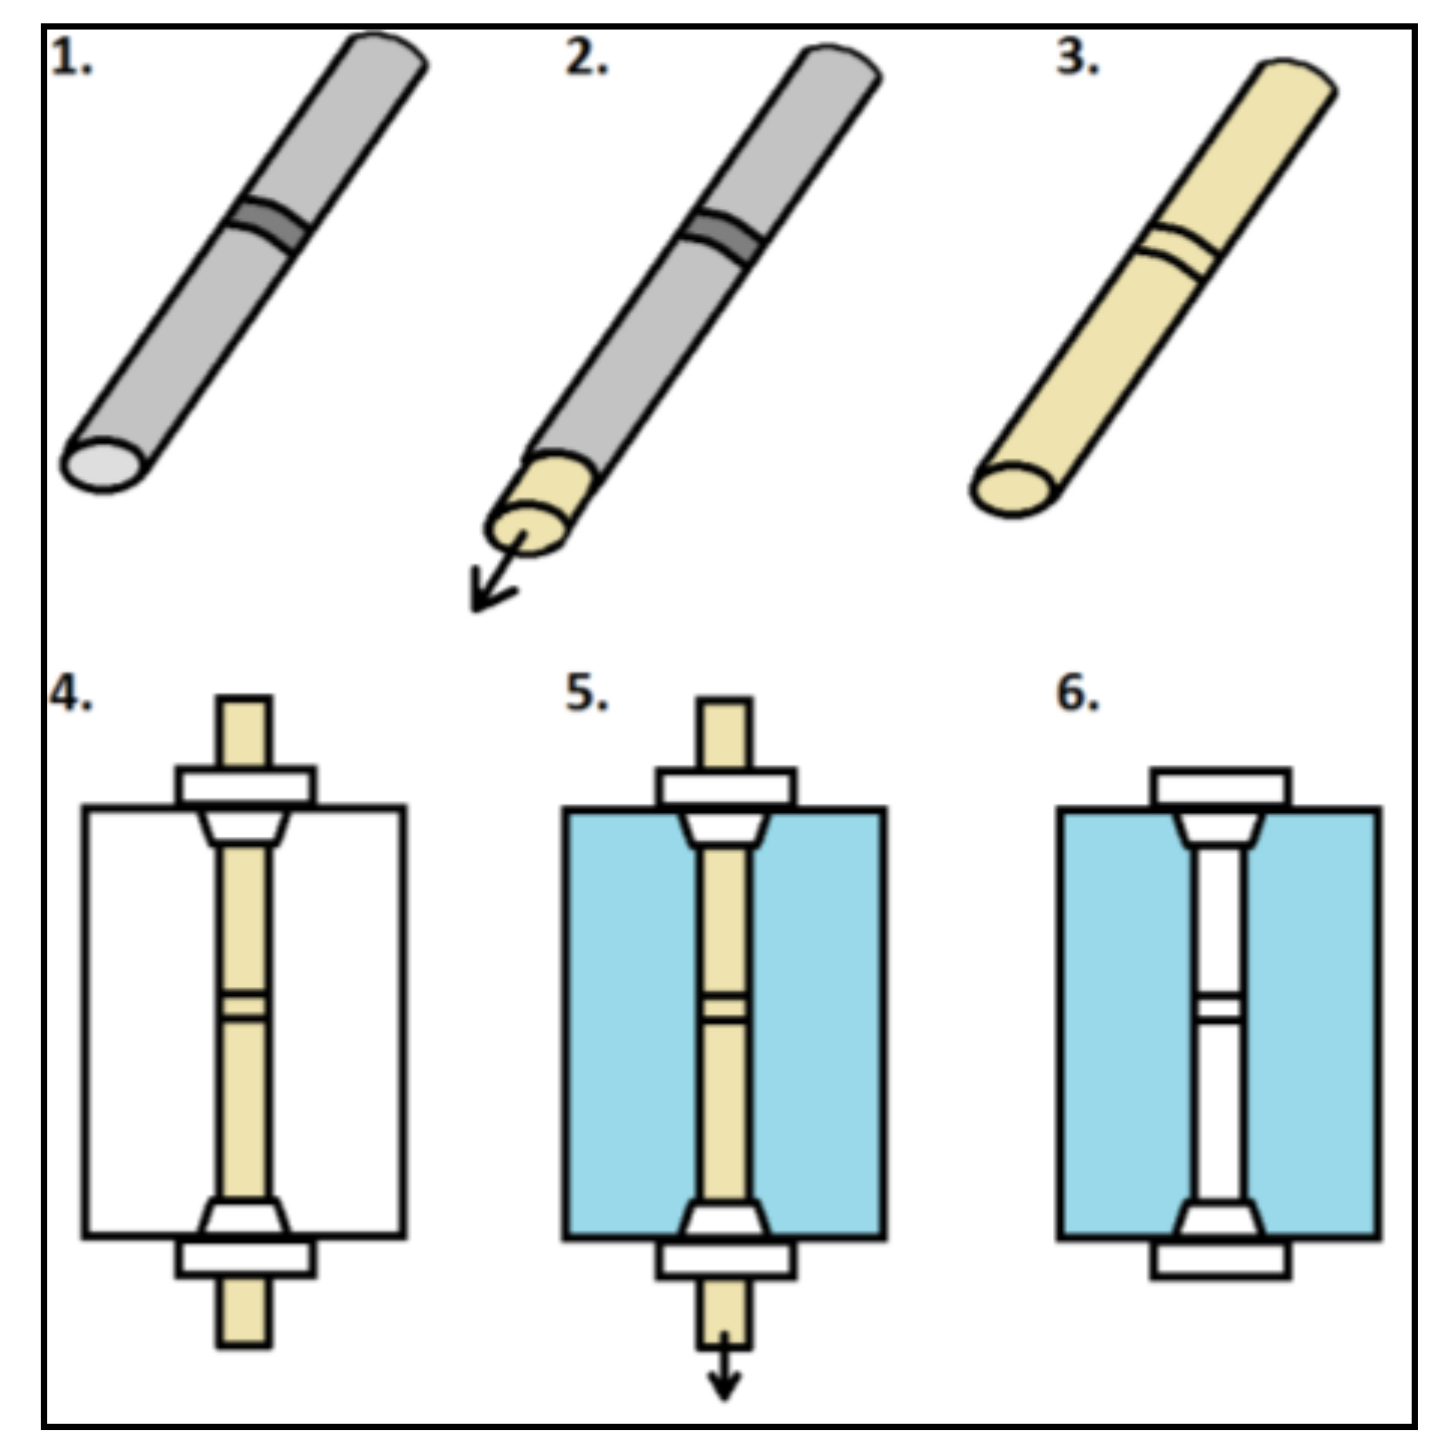
Figure 2.
Left: (a) Micro Stereo particle image velocimetry (PIV) system consisting of double-frame cameras; (b) stereo microscope; (c) laser fiber and (d) measurement setup; Right: Measurement setup consisting of (e) micro-annular gear pump; (f) filter; (g) sample and (h) fluid container.
Figure 2.
Left: (a) Micro Stereo particle image velocimetry (PIV) system consisting of double-frame cameras; (b) stereo microscope; (c) laser fiber and (d) measurement setup; Right: Measurement setup consisting of (e) micro-annular gear pump; (f) filter; (g) sample and (h) fluid container.
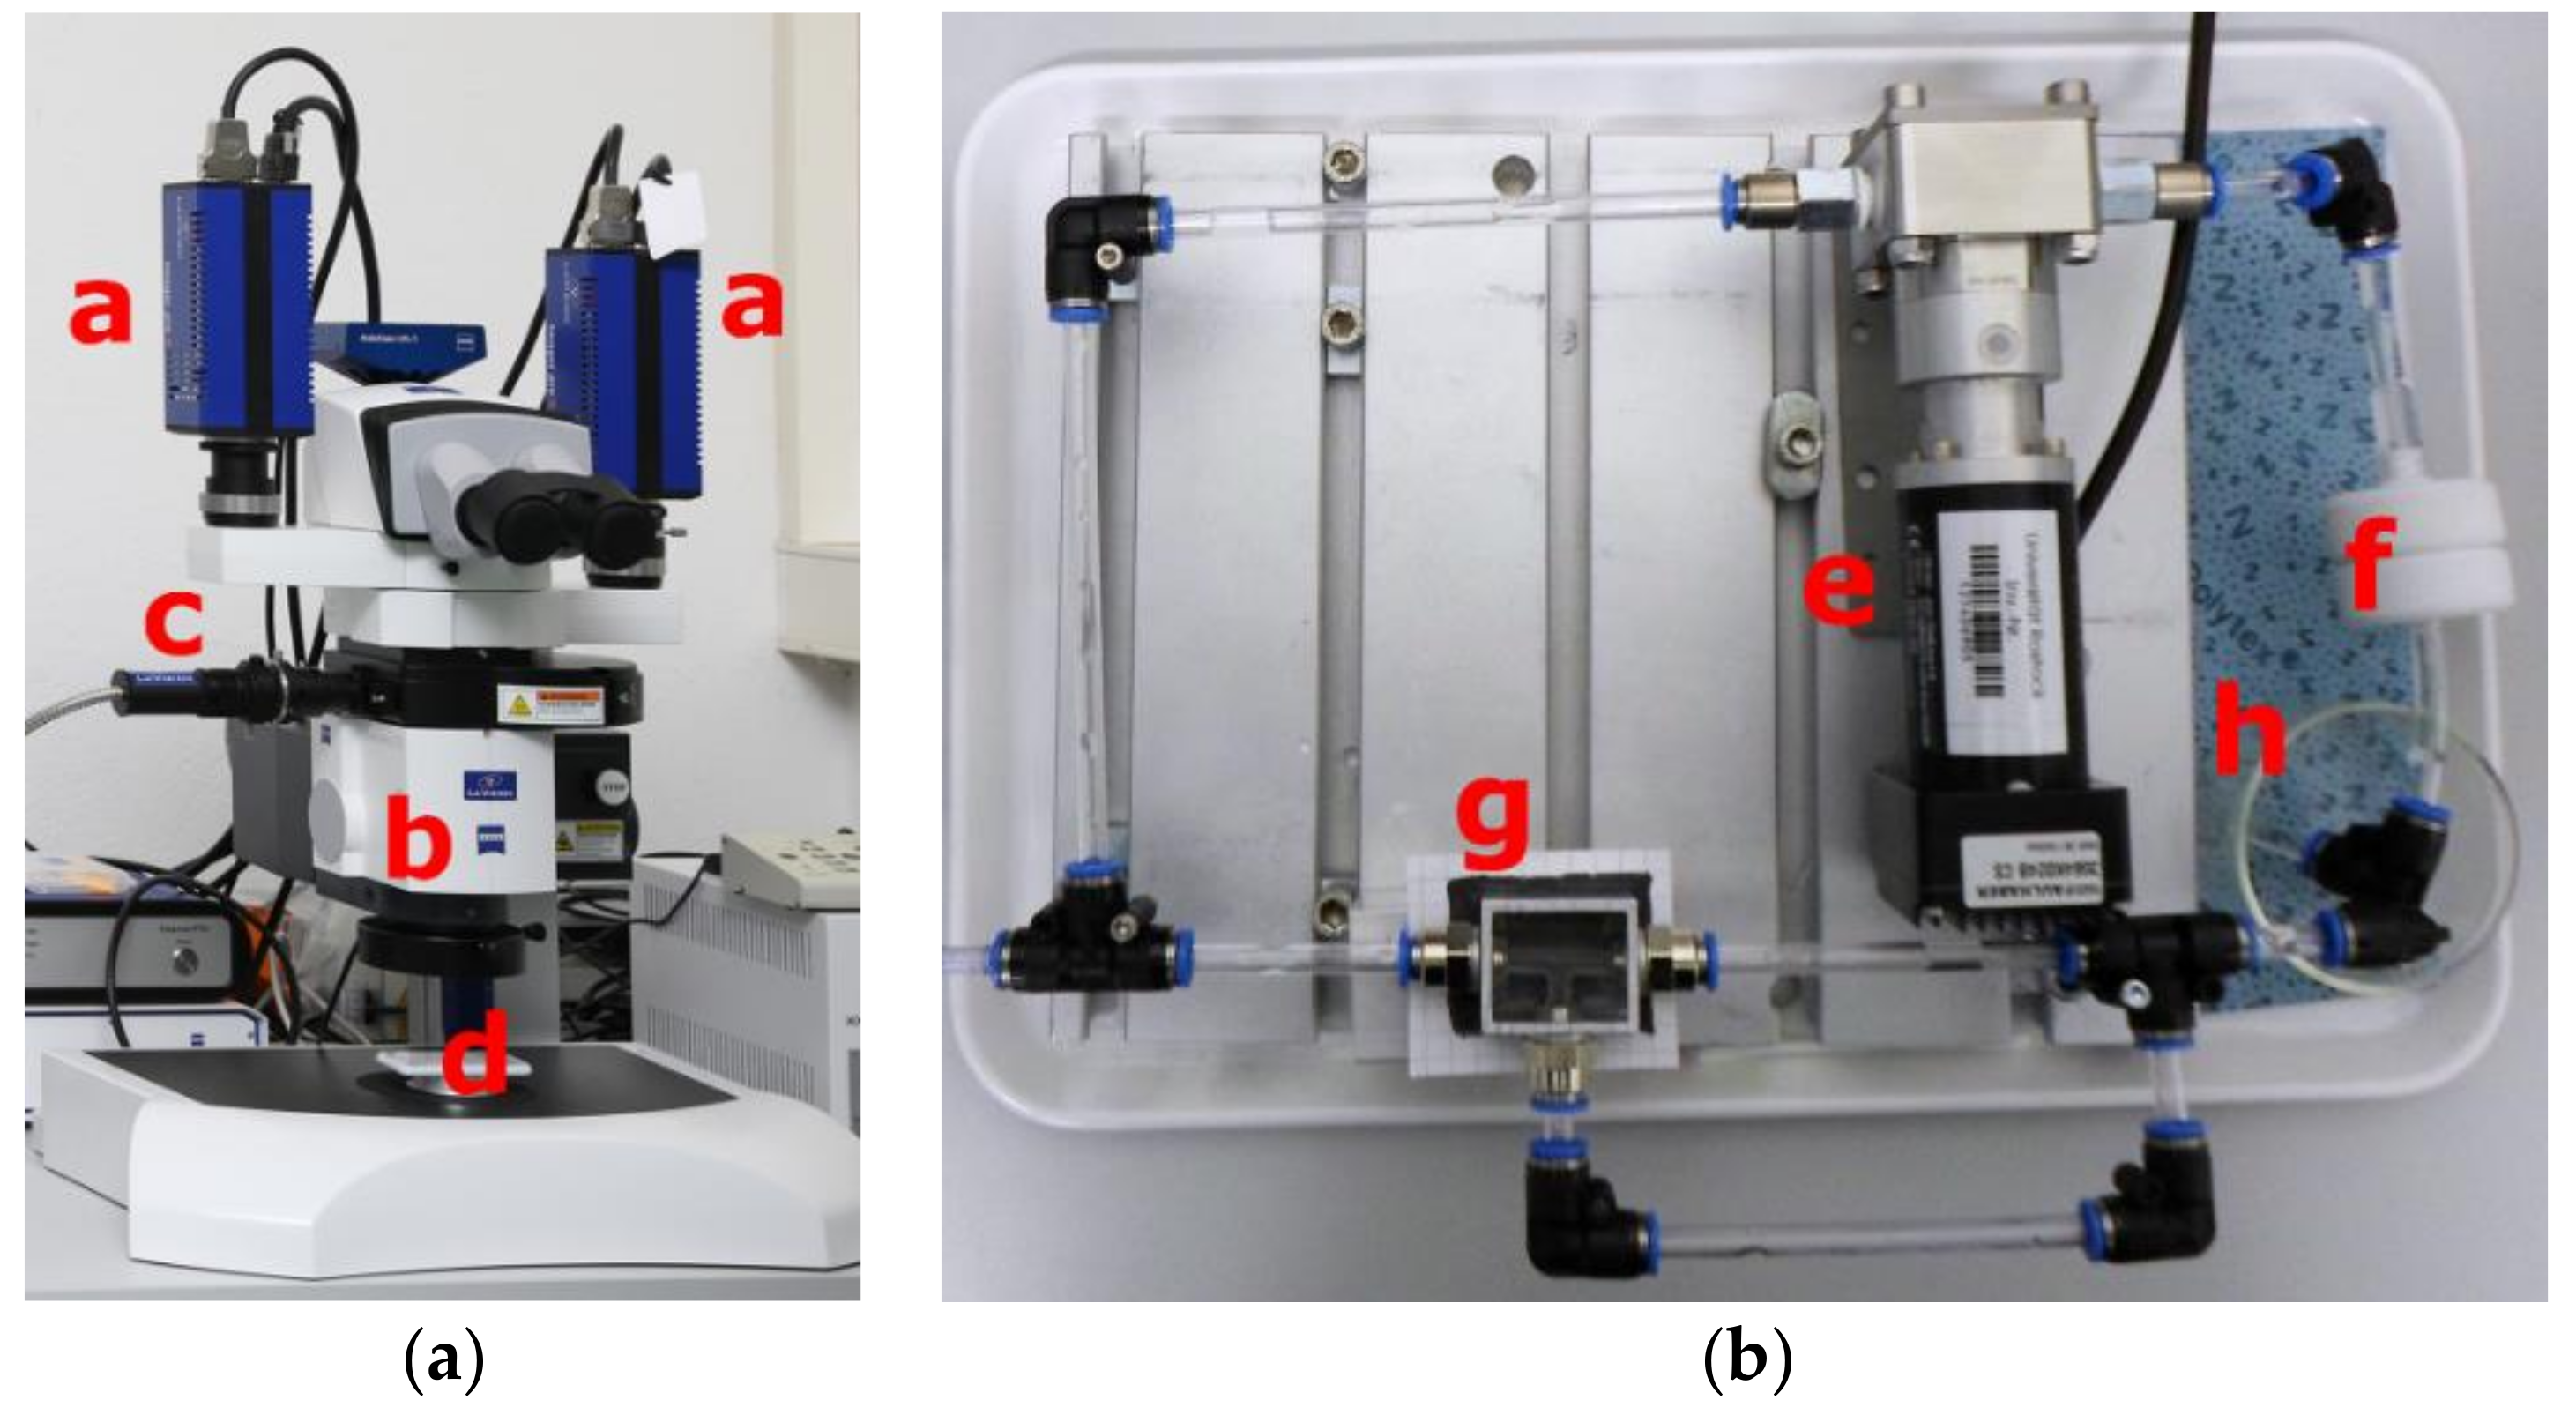
Figure 3.
Schematic sketch of the measurement setup.

Figure 4.
(a) Welded tube and silicone core made of Elastosil® M 4601; (b) silicone replication made of Elastosil® RT 601 inside the aluminum frame with fluidic connections for µ-PIV analysis.
Figure 4.
(a) Welded tube and silicone core made of Elastosil® M 4601; (b) silicone replication made of Elastosil® RT 601 inside the aluminum frame with fluidic connections for µ-PIV analysis.
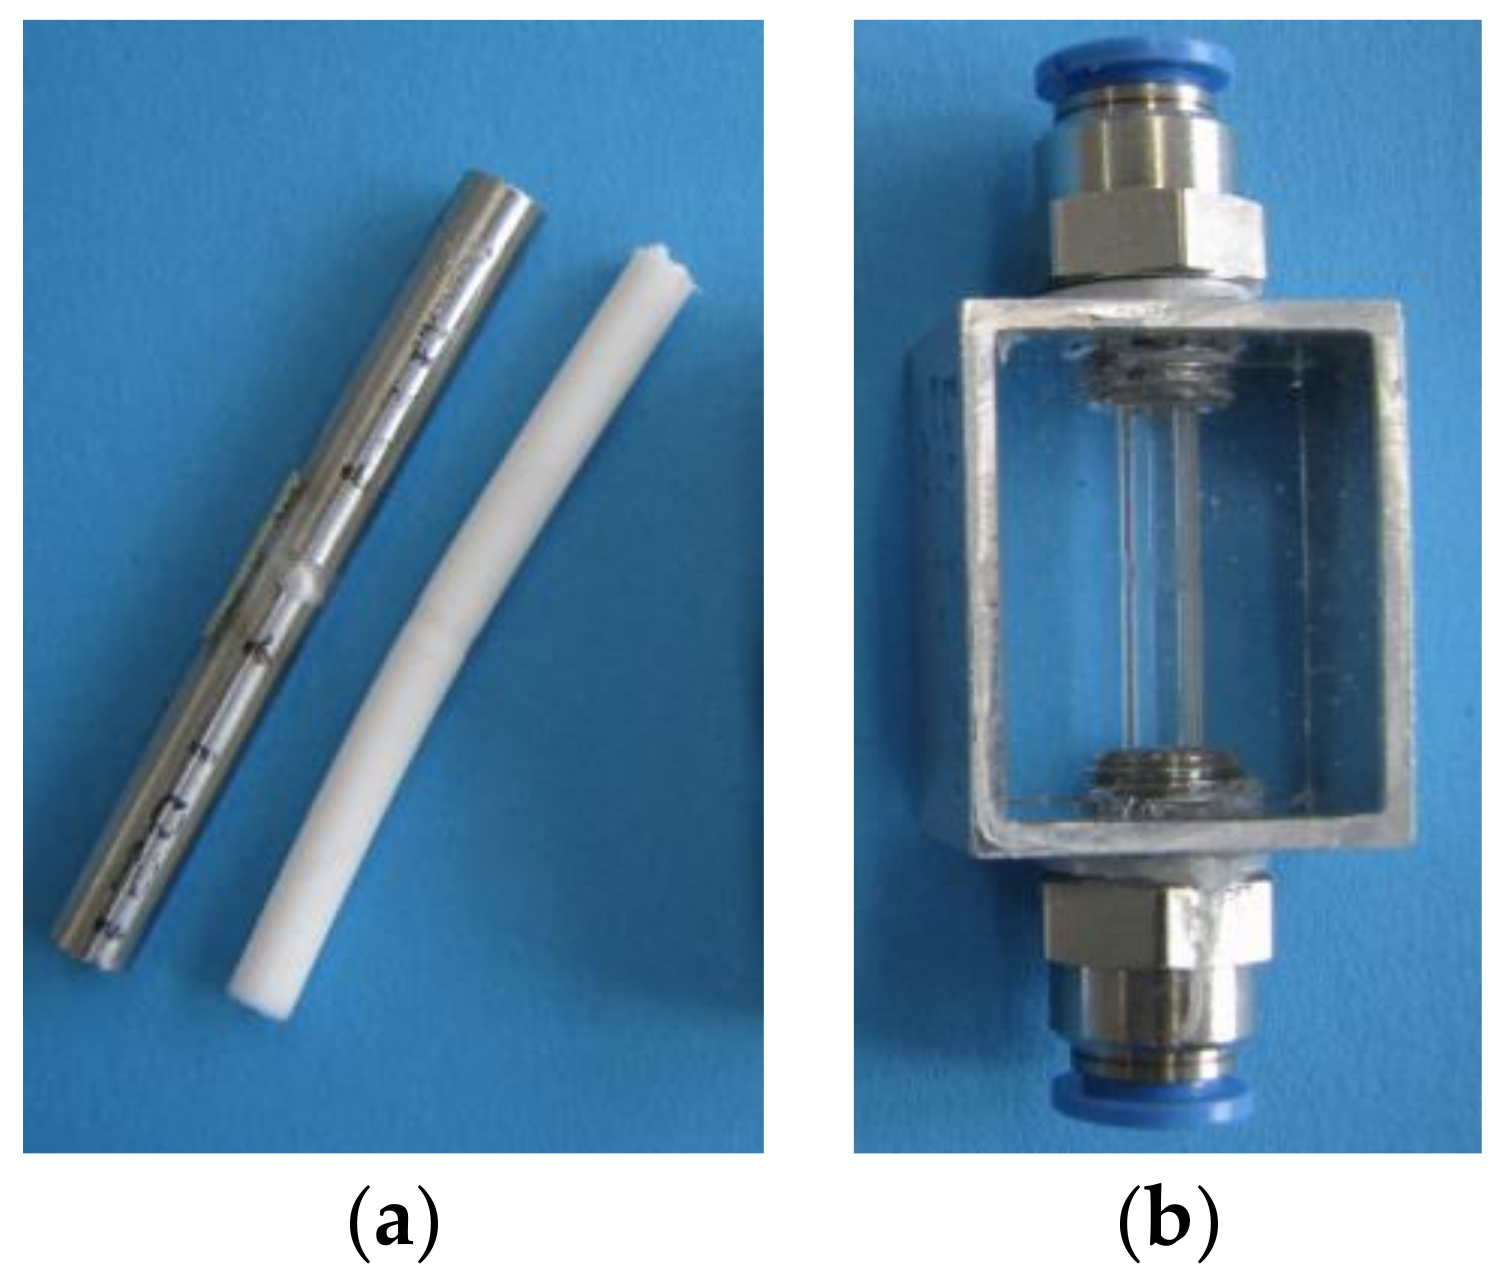
Figure 5.
(a) Welded manifold with 90° angle; (b) silicone core made of Elastosil® M 4601; (c) silicone replicate made of Elastosil® RT 601 inside the aluminum frame with fluidic connections for µ-PIV analysis.
Figure 5.
(a) Welded manifold with 90° angle; (b) silicone core made of Elastosil® M 4601; (c) silicone replicate made of Elastosil® RT 601 inside the aluminum frame with fluidic connections for µ-PIV analysis.
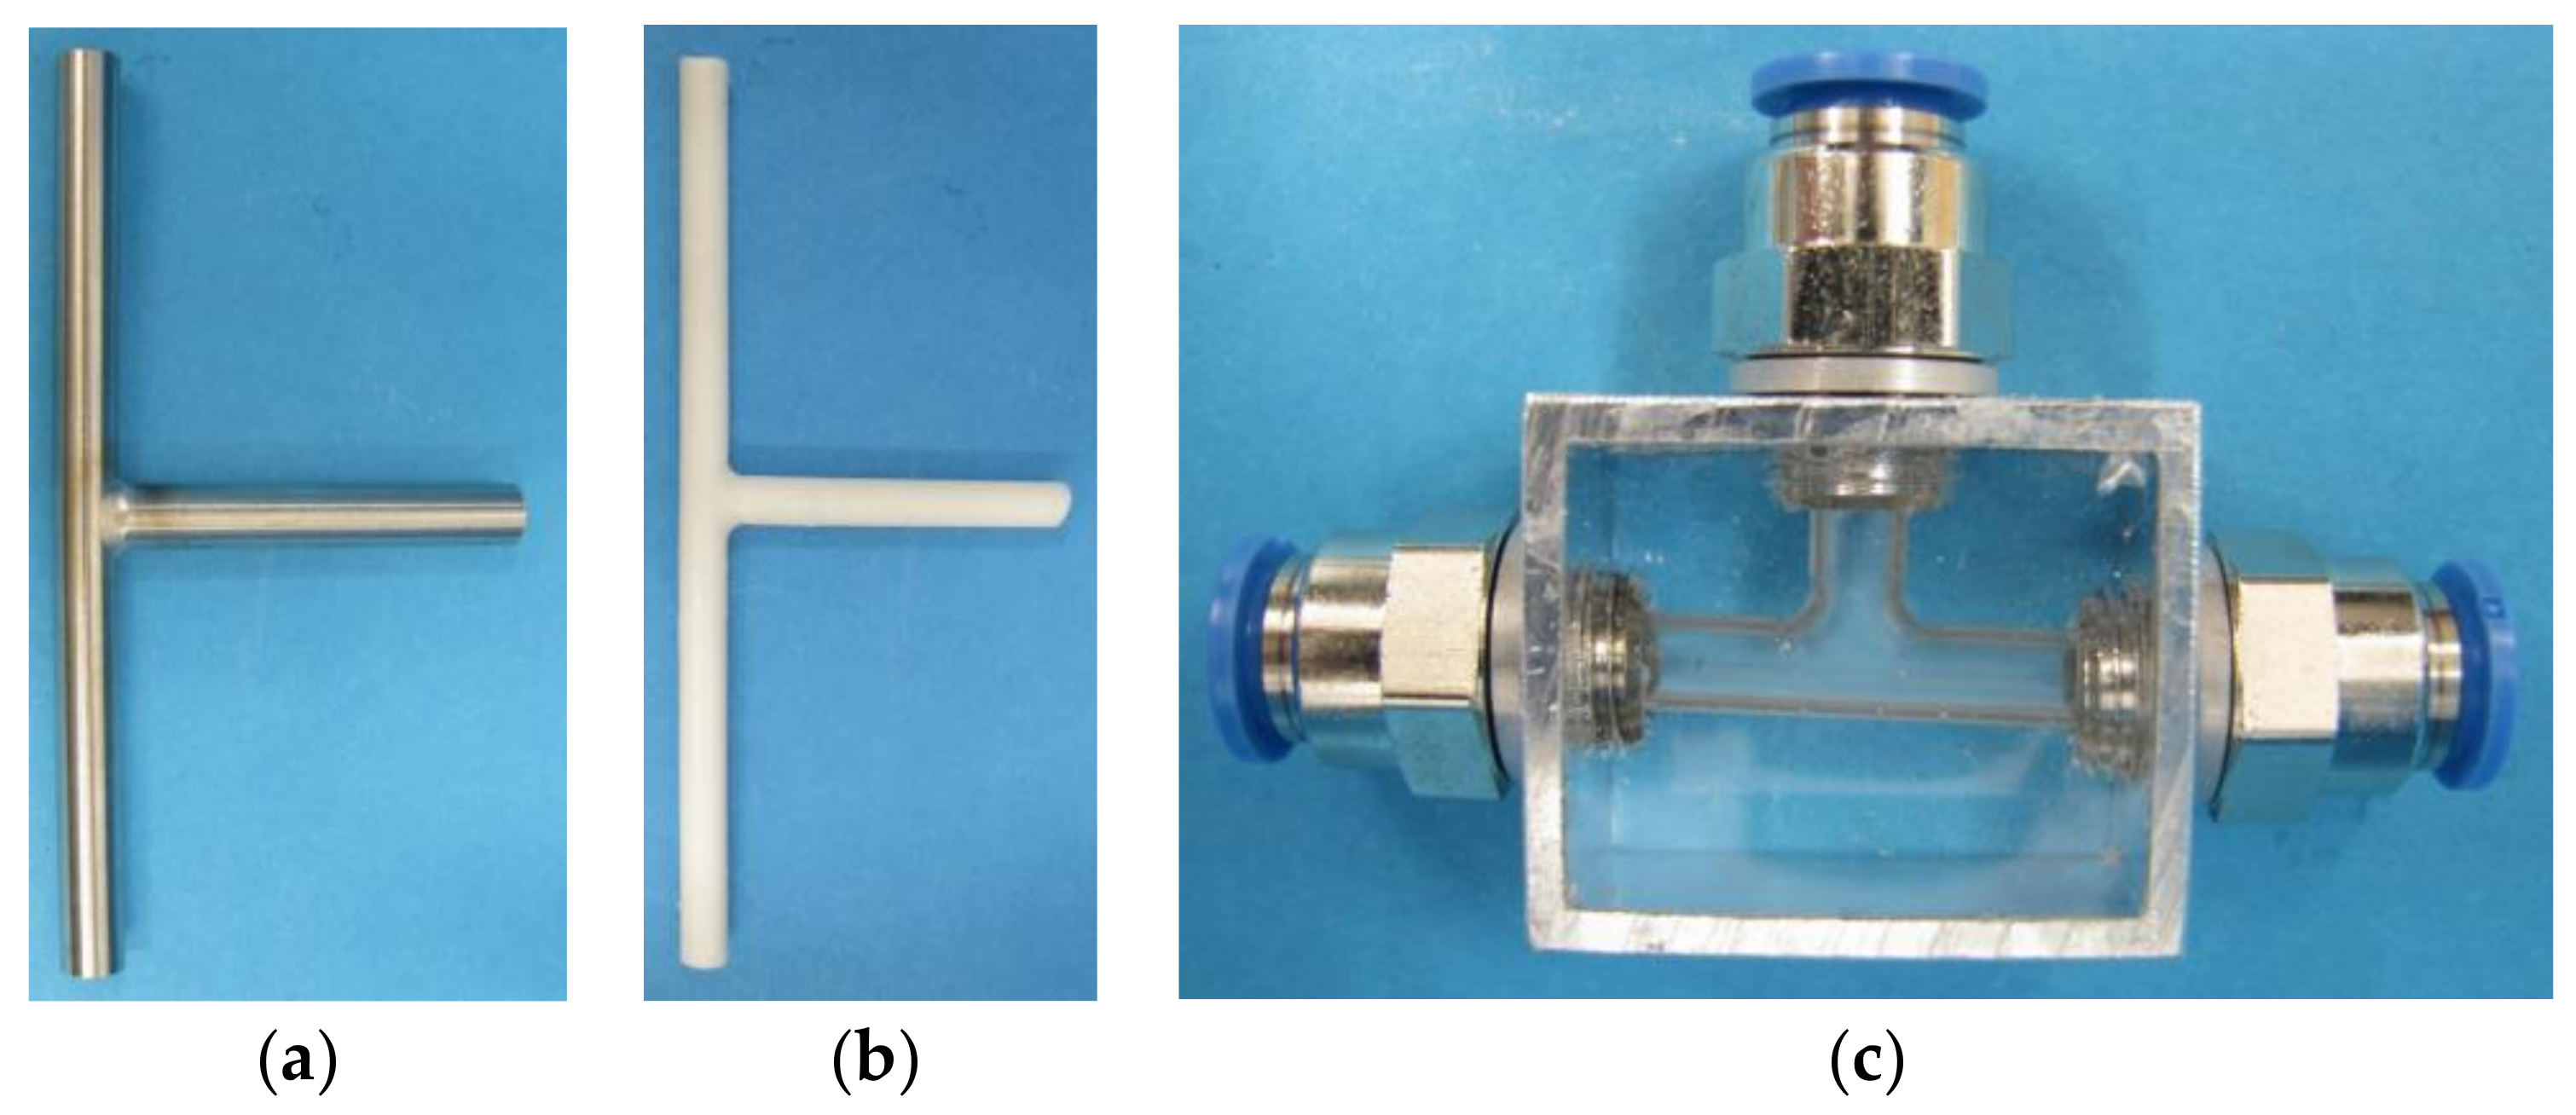
Figure 6.
Refractive indices of aqueous glycerol solution and Elastosil® RT 601 as function of temperature.
Figure 6.
Refractive indices of aqueous glycerol solution and Elastosil® RT 601 as function of temperature.
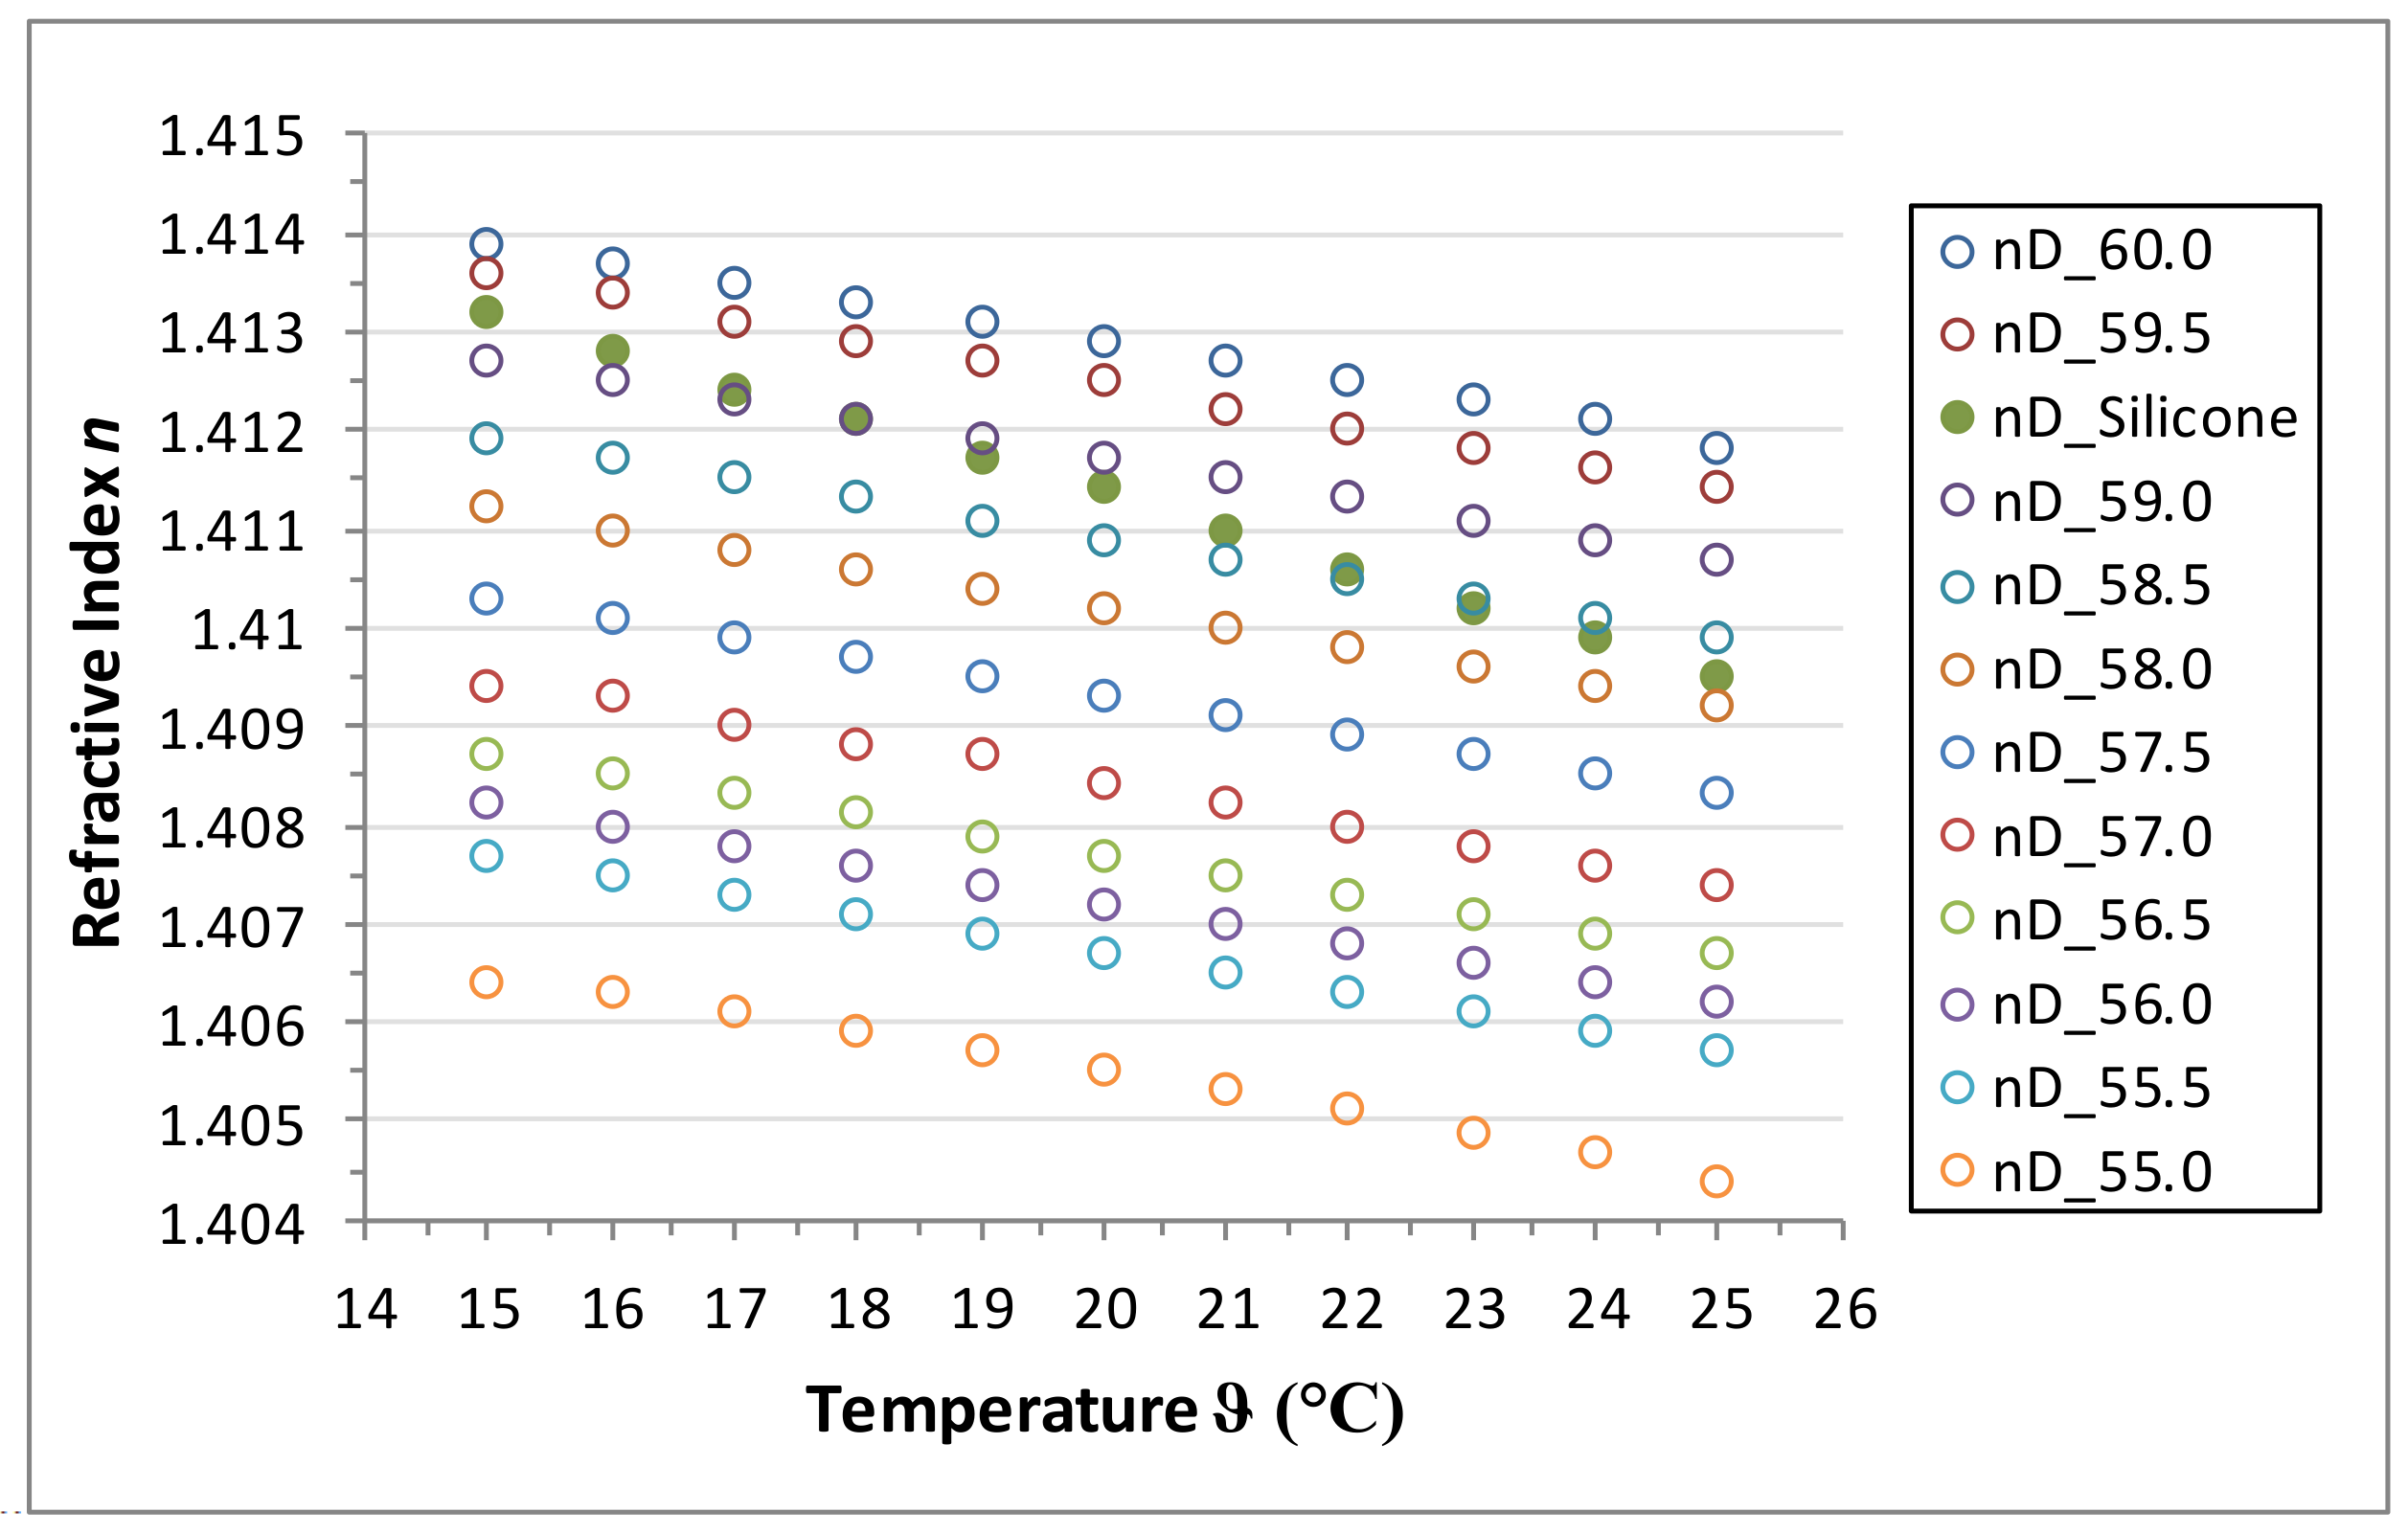
Figure 7.
(a) PIV-velocity field of the flow inside a manifold; (b) velocity profiles over the three probe lines indicated in (a); (c) contour plot of PIV uncertainty of velocity.
Figure 7.
(a) PIV-velocity field of the flow inside a manifold; (b) velocity profiles over the three probe lines indicated in (a); (c) contour plot of PIV uncertainty of velocity.


Table 1.
Refractive index of fluids [7].
Table 1.
Refractive index of fluids [7].
| Aqueous Solutions | n |
|---|---|
| glycerol | 1.33–1.47 |
| zinc iodide | 1.33–1.62 |
| sodium iodide 60% | 1.5 (60% NaI by wt.) |
| potassium thiocyanate | 1.33–1.49 |
| ammonium thiocyanate | 1.33–1.50 |
| sodium thiocyanate | 1.33–1.48 |
Table 2.
Temperature ranges for a refractive index matching of an aqueous glycerol solution and Elastosil® RT 601.
Table 2.
Temperature ranges for a refractive index matching of an aqueous glycerol solution and Elastosil® RT 601.
| Temperature Subrange (°C) | Concentration of the Aqueous Glycerol Solution (wt %) |
|---|---|
| 14–16 | 59.25 |
| 17–19 | 59.00 |
| 19–21 | 58.75 |
| 22–24 | 58.50 |
| 24–26 | 58.25 |
© 2018 by the authors. Licensee MDPI, Basel, Switzerland. This article is an open access article distributed under the terms and conditions of the Creative Commons Attribution (CC BY) license (http://creativecommons.org/licenses/by/4.0/).
Share and Cite
MDPI and ACS Style
Schult, M.; Drobek, C.; Seitz, H. Silicone-Based Molding Technique for Optical Flow Analysis in Transparent Models of Fluidic Components. Appl. Sci. 2018, 8, 512. https://doi.org/10.3390/app8040512
AMA Style
Schult M, Drobek C, Seitz H. Silicone-Based Molding Technique for Optical Flow Analysis in Transparent Models of Fluidic Components. Applied Sciences. 2018; 8(4):512. https://doi.org/10.3390/app8040512
Chicago/Turabian StyleSchult, Mark, Christoph Drobek, and Hermann Seitz. 2018. "Silicone-Based Molding Technique for Optical Flow Analysis in Transparent Models of Fluidic Components" Applied Sciences 8, no. 4: 512. https://doi.org/10.3390/app8040512
Note that from the first issue of 2016, this journal uses article numbers instead of page numbers. See further details here.