Rock Fragmentation Characteristics by TBM Cutting and Efficiency under Bi-Lateral Confinement

1
State Key Laboratory of Hydroscience and Engineering, Tsinghua University, Beijing 100084, China
2
Department of Energy and Mineral Engineering, EMS Energy Institute and G3 Center, Pennsylvania State University, University Park, PA 16802, USA
3
Key Laboratory of Hydraulic and Waterway Engineering of the Ministry of Education, Chongqing Jiaotong University, Chongqing 400074, China
*
Authors to whom correspondence should be addressed.
Appl. Sci. 2018, 8(4), 498; https://doi.org/10.3390/app8040498
Submission received: 12 February 2018
/
Revised: 13 March 2018
/
Accepted: 13 March 2018
/
Published: 26 March 2018
(This article belongs to the Section Mechanical Engineering)
Abstract
:In this study, the mechanisms of rock breakage are assessed using tunnel boring machine (TBM) disc cutters under bi-axial pressure. Sequential indentation tests were conducted on granite specimens using a tri-axial testing platform. The morphology and volume of the fractured surface were measured and analyzed using a three-dimensional surface profilometer. An analysis of rock breaking growth and efficiency was performed as well. When the minor confining pressure (σ1) is constant, the results show that a larger difference in confining pressure leads to a larger volume of fractured surface, thereafter improving the rock-breaking efficiency even though the penetration energy is enlarged. On the other hand, when the major confining pressure (σ2) is constant, the penetration energy increases proportionally with the σ1; however, the volume of fractured surface is decreased, and the breaking efficiency is attenuated as well.
1. Introduction
In recent years, a number of studies have been undertaken on the breaking process and characteristics of the rock fractures between tunnel boring machine (TBM) disc cutters. Based on two rock-breaking mechanisms [1,2], involving shear and tensile stress, some scholars demonstrated that, on the one hand, the horizontal shear stress between adjacent disc cutters is the main reason for the rock-breaking phenomenon. On the other hand, other researchers suggested that the breaking occurs due to the interpenetration of tension cracks caused by neighboring disc cutters. The content of a study regarding the characteristics of rock fragments can be also divided into two subsections: the first concentrates on the interior of the rock (e.g., uniaxial compressive strength, regarding joint, moisture content, and other efficient factors [3,4,5,6,7,8]), and the second focuses on external factors including tool size, shape, and machine operating parameters [9,10,11,12,13,14,15,16].
In addition, geo-stress increases in excavation of deep tunnels. An on-site investigation was performed by Gong et al. [17], and the findings showed that high ground stress could keep rock from breaking and did not produce plate cracking. When a local stress reaches a threshold, cracks are generated in the target rock mass. These cracks amplify the breaking of the rock under TBM disc cutters, leading to a reduction in the excavation index of the rock characteristics, and an improvement in the efficiency of rock breaking. Micro-fractures were observed in the rock on tunnel heading under high ground stress in on-site investigations, which were conducted by Yin et al. [18] and Tarkoy and Marconi [19].
Some scholars have recently studied the influence of confining pressure on the rock-breaking process and characteristics by using indoor experimental tests and numerical simulations. Bilgin et al. [20] studied the cutting efficiency of a boring machine tool under different confining pressures using a fracture analysis code (Franc2D) numerical method and an indoor test with a micro-rock cutting machine for rock. They reported that the penetration force gradually increased with the confining pressure. Innautrato et al. [21] utilized TBM disc cutters for a penetration test, in which the uniaxial compressive strength of a rock specimen reached 234 MPa, and the major confining pressure was 10 MPa. The experimental results showed that the increase of penetration force does not significantly increase confining forces in order to break the rock. Huang et al. [22] employed fast Lagrangian analysis of continua (FLAC) software to numerically simulate and analyze the effect of confining pressure on the crack development and the initiation of tension as well as fracture of the tool. The results demonstrated that a small increase of confining pressure caused the position of the maximum tensile stress to move significantly from the vertical thrust line and increased the crack vertical angle. Cook et al. [23], Liu et al. [24], and Ma et al. [25] reported that cracks tend to develop to the free surface once the confining pressure increases. It is worth mentioning that field investigations, laboratory tests, and numerical simulations can promote perceiving the mechanism of rock breaking of TBM in the presence of various confining pressures. However, most previous studies were undertaken as two-dimensional (2D) [23,24,25], imposing barriers to truly representing the breaking mechanism in three-dimensional (3D) spaces.
The development of a true triaxial test platform facilitates the accurate simulation of the rock-breaking process in different broken rock conditions. Ma et al. [25] studied the impact of different cutter spacings on the excavation’s efficiency using a TBM cutter, in which a series of rock cutting tests were undertaken using five sets of cutter spacing. Balci [26] and Chang et al. [27] used disc cutters to perform a dynamic linear cutting test and analyzed the rock failure mechanism based on different rock conditions, disc cutters’ parameters, loading parameters, and rock failure parameters, which were collected during the cutting process.
However, the bi-directional differential confining pressures were rarely taken into account. In order to investigate the influence of confining pressure on the rock-breaking characteristics of TBM, this paper concentrates on the assessment of the modes of rock breaking, and corresponding efficiency using a developed true triaxial test platform as well as a 3D surface profilometer.
2. Test Methodology
2.1. Equipment
2.1.1. Penetration Platform
The experiments were conducted using a developed true triaxial geophysical apparatus at Chongqing University, Chongqing, China, as shown in Figure 1 [28]. This apparatus is capable of performing mechanical and penetration experiments on samples designated as being under true triaxial stress conditions.
Moreover, loading is controlled by a hydraulic servo system, which can be used to record and save the penetration force through an external computer system. The tensile test machine frame is made of high-rigidity materials to guarantee the accuracy and reliability of the experiments. The system provides the disc cutters’ penetration and required confining pressure as well.
2.1.2. Tunnel Boring Machine Disc Cutters
In order to investigate the characteristics of rock broken by TBM disc cutters under different confining pressures, a cross section of a typical disc cutter with a size of 561 mm, a blade with a width of 13 mm and an angle of 20°, and a transition arc with radius of 3.5 mm is illustrated in Figure 2. The tool was made of highly rigid material and was heat-treated to ensure minimal deformation during the testing.
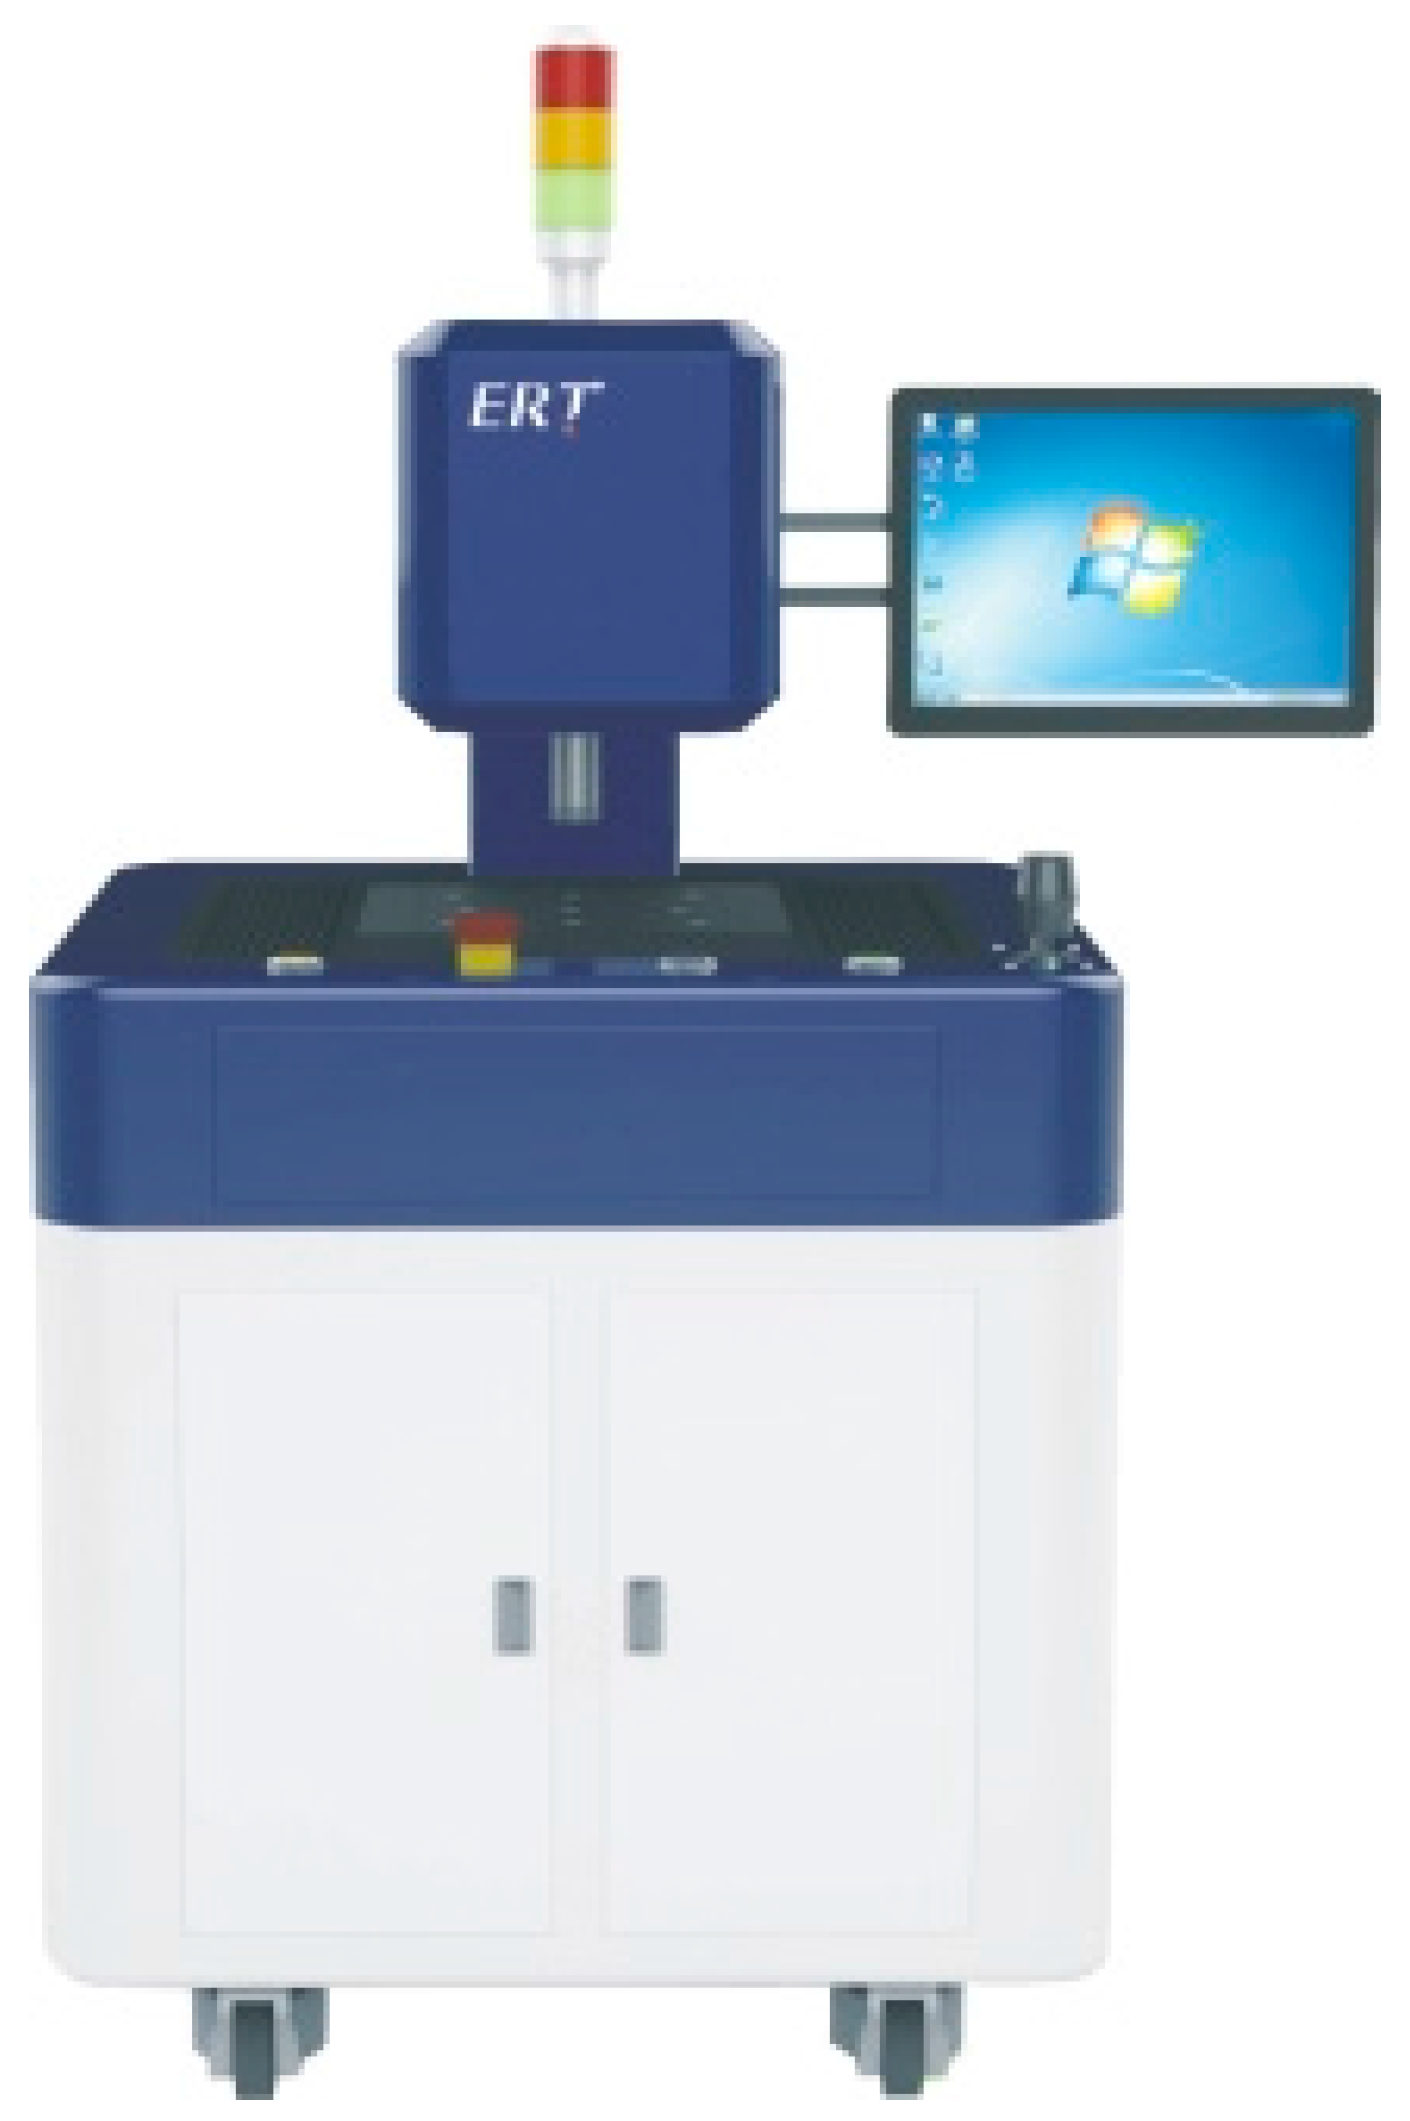
2.1.3. Surface Profilometer
The dimensions of a fractured surface indicate the efficiency of the rock breaking. The rock breaking mode is derived from a morphological analysis. Furthermore, analysis of the size and morphology of a fractured surface is vital. In this study, a fixed-base surface profilometer (ST150) (Nanovea Company, Irvine, USA) was used to analyze the shape and size of a fractured surface between disc cutters in the presence of different mechanical conditions. As displayed in Figure 3, a surface profilometer mainly consists of a control system as well as a scanner, and is able to precisely post-process the scanner’s result, involving the calculation of the volume of the fractured surface and a profile contour analysis. The scanner has a scanning range of 150 mm × 150 mm × 100 mm and a resolution of 0.5 μm, sufficient for surface measurements.
2.2. Specimen Preparation
To investigate the breaking characteristics of rock and the efficiency of TBM disc cutters subjected to various biaxial confining pressures, a number of granite samples were prepared with high uniaxial compressive strength and brittleness. The specimens were prepared from the same rock to ensure that the mechanical properties of each specimen were consistent. The surface of each specimen was polished to eliminate negative effects. According to the standard code recommended by the International Society of Rock Mechanics (ISRM), uniaxial compression, Brazilian cleavage, and direct shear tests were undertaken on the specimens. The values of mechanical parameters were obtained as follows: uniaxial compressive strength σc = 94.8 MPa, tensile strength σt = 7.8 MPa, elastic modulus E = 22.3 MPa, Poisson’s ratio υ = 0.23, internal friction angle = 49.2°, and cohesion c = 23 MPa.
A previous study performed by Yin et al. [29] reported that when the ratio of the radius of the plastic deformation zone to the minimum width of the specimen is less than 1/6, the effect of size is negligible. Therefore, according to the billet cutting model, the relevant parameters are expressed as follows:
where denotes the ratio of plastic deformation zone to penetration depth, Kp represents an expansion coefficient, Kd is a passive coefficient, is a friction coefficient for the crack surface, denotes a lateral pressure coefficient, r* is the radius of plastic deformation zone, t represents the penetration depth, and γ is a constant for characterization of the size and shape of disc cutters.
Taking into account the loading capacity of the profilometer, the size of a granite sample was 250 mm × 200 mm × 100 mm. Moreover, in the experiment the penetration depth was 6 mm. Substituting the mechanical parameters of rock in Equation (1) into Equation (5), the radius of the plastic deformation zone was found to be 1.9 mm, and its ratio to the minimum size of the specimen was far less than 1/6. According to the results achieved by Yin et al. [29], the size of the sample can be determined accordingly.
2.3. Test Design and Procedure
2.3.1. Test Design
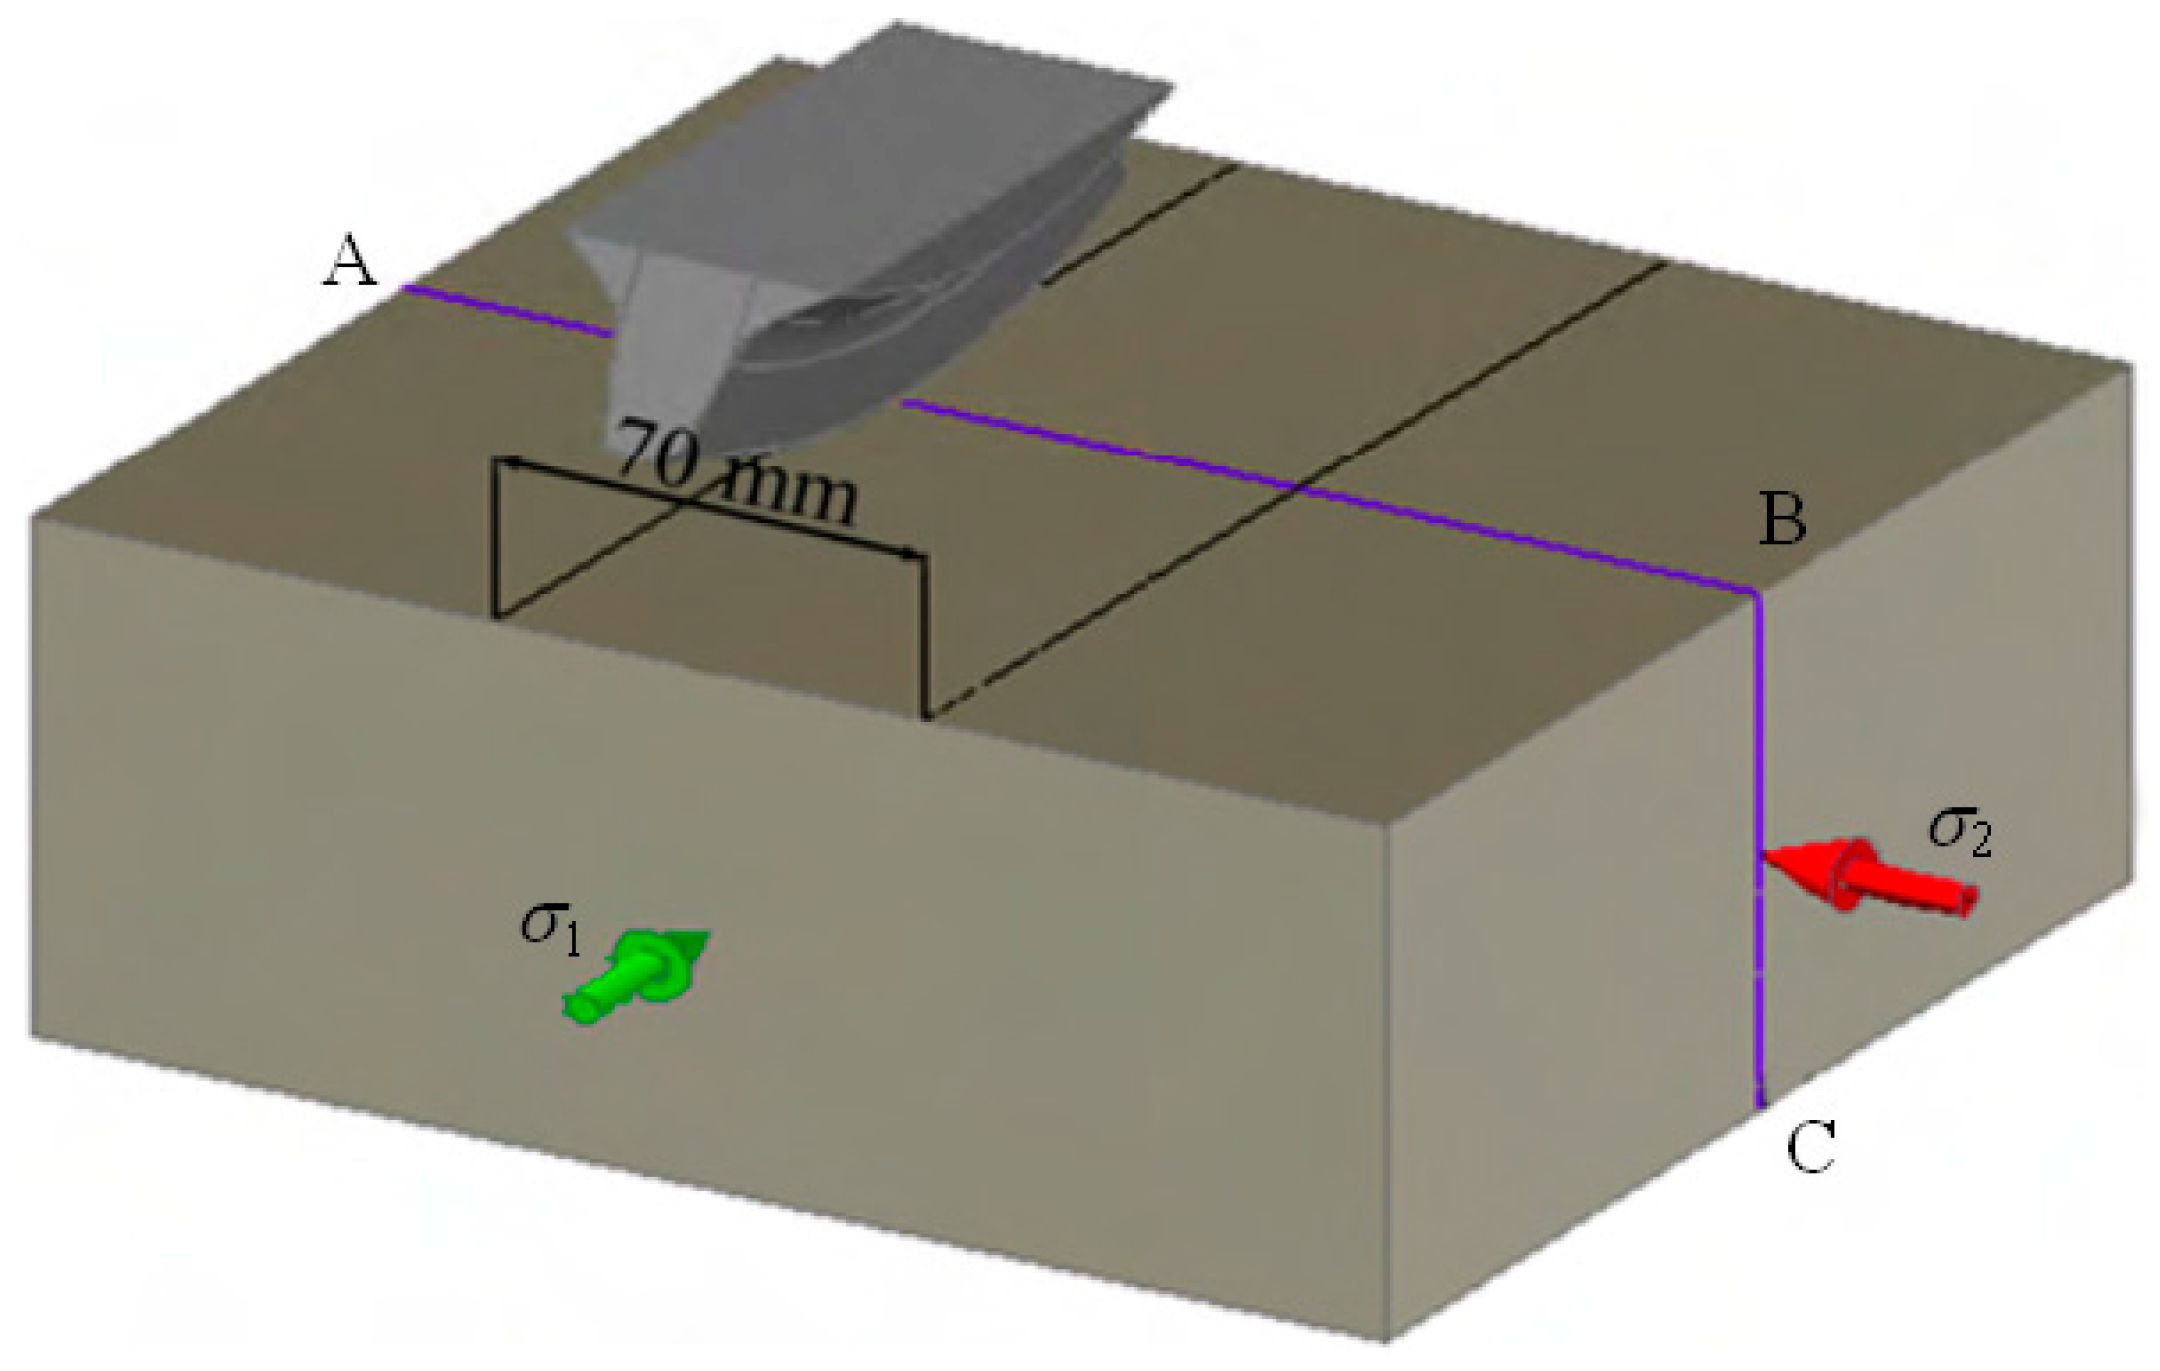
Figure 4 schematically illustrates the penetration test for TBM disc cutters. The confining pressure is provided by a horizontal loading system, the penetration force of disc cutters is generated by a vertical loading system, and the vertical penetration process is controlled by force or displacement. In order to guarantee the safety of the test, the vertical penetration process is controlled by displacement.
As shown in Figure 4, minor confining pressure (σ1) and major confining pressure (σ2) are defined in the longitudinal and transverse directions. According to the different levels of bi-lateral confining pressure, σ1 during penetration into granite is divided into three levels with values of 5.0, 10.0, and 15.0 MPa, respectively, and those values for σ2 are 5.0, 10.0, 15.0, 20.0, and 25.0 MPa. As mentioned in Table 1, a total of 12 groups are tested. Simultaneously, the pressure drop is defined as the absolute difference between σ2 and σ1. Moreover, the distance between the two penetrations is 70 mm and the penetration rate is 0.5 mm/min. Gertsch et al. [30] showed that the penetration depth of the disc cutters during tunneling by TBM is generally 6–7 mm per week. Therefore, herein, the final penetration depth is taken to be 6 mm.
2.3.2. Testing Process
The testing process is divided into three main parts as follows:
- Based on the true triaxial test, five steps are designed as follows:
- 1.1.
- To prevent stress between the pads and specimen surface, the contact surface and pad surface are properly coated before forwarding the specimen into the loading area, as shown in Figure 4.
- 1.2.
- Loads equal to 10 kN are applied in the longitudinal and transverse directions. Confining loadings are proportionally applied to loads σ2 and σ1 to the set value when the previous loading is stabilized.
- 1.3.
- Once the confining pressure is loaded, the stress in the transverse direction is loaded to 100 N using the stress control to ensure that the loading unit in Z-direction is in full contact with the top of the disc cutters. After applying the load (100 N) in the transverse direction, displacement is used to control the penetration rate of the disc cutters while the penetration depth and force variations are recorded. The penetration energy is calculated by integrating the force values.
- 1.4.
- When the penetration depth reaches 6 mm, penetration and recording the data should be stopped, and the stress in the transverse direction is unloaded. Once the unloading in the transverse direction has ended, the load in the longitudinal direction is removed.
- 1.5.
- The specimen is rotated and steps (2) to (5) are repeated for the second penetration test.
- Scanning the fractured surfaceThe specimens, which are assessed by the penetration test, are placed on the tray upon the profilometer, the fractured surface generated after the penetration is scanned, and the built-in software is used to calculate the volume of the fractured surface.
- Using a fully automatic rock cutting machine, the rock specimens are cut along the ABC plane (see Figure 4) to assess the development of internal cracks. In order to decrease the influence of cutting on the crack development, the thickness and speed of the cutting blade are set to 1 mm and 5 cm/min, respectively.
3. Results
3.1. Fractured Surface Morphology Analysis
Taking the fractured surface generated by the cutting of disc cutters of TBM at the confining pressure of 10–20 MPa as an example, a typical fractured surface is shown in Figure 5, in which the direction of the disc cutters’ axis is indicated in the X-direction, the Y-direction is parallel to the grooving direction, and the Z-direction shows the penetration direction. Figure 5 shows the surface depth measured using an uncrushed original surface, which is marked with white and zero depth. In addition, dark blue represents the deep surface, and the maximum depth is 30 mm. It can be seen that the fractured surface is mainly located within a range enclosed by the adjacent grooving and surface of an intact rock. The deepest point of the typical fractured surface is located roughly in the center, while its depth decreases from the middle to the edges. However, the variations in depth lead to the formation of small islands and partial deep pits.
3.1.1. Variations of Fractured Surface with Increase of Major Confining Pressure while Minor Confining Pressure is Constant
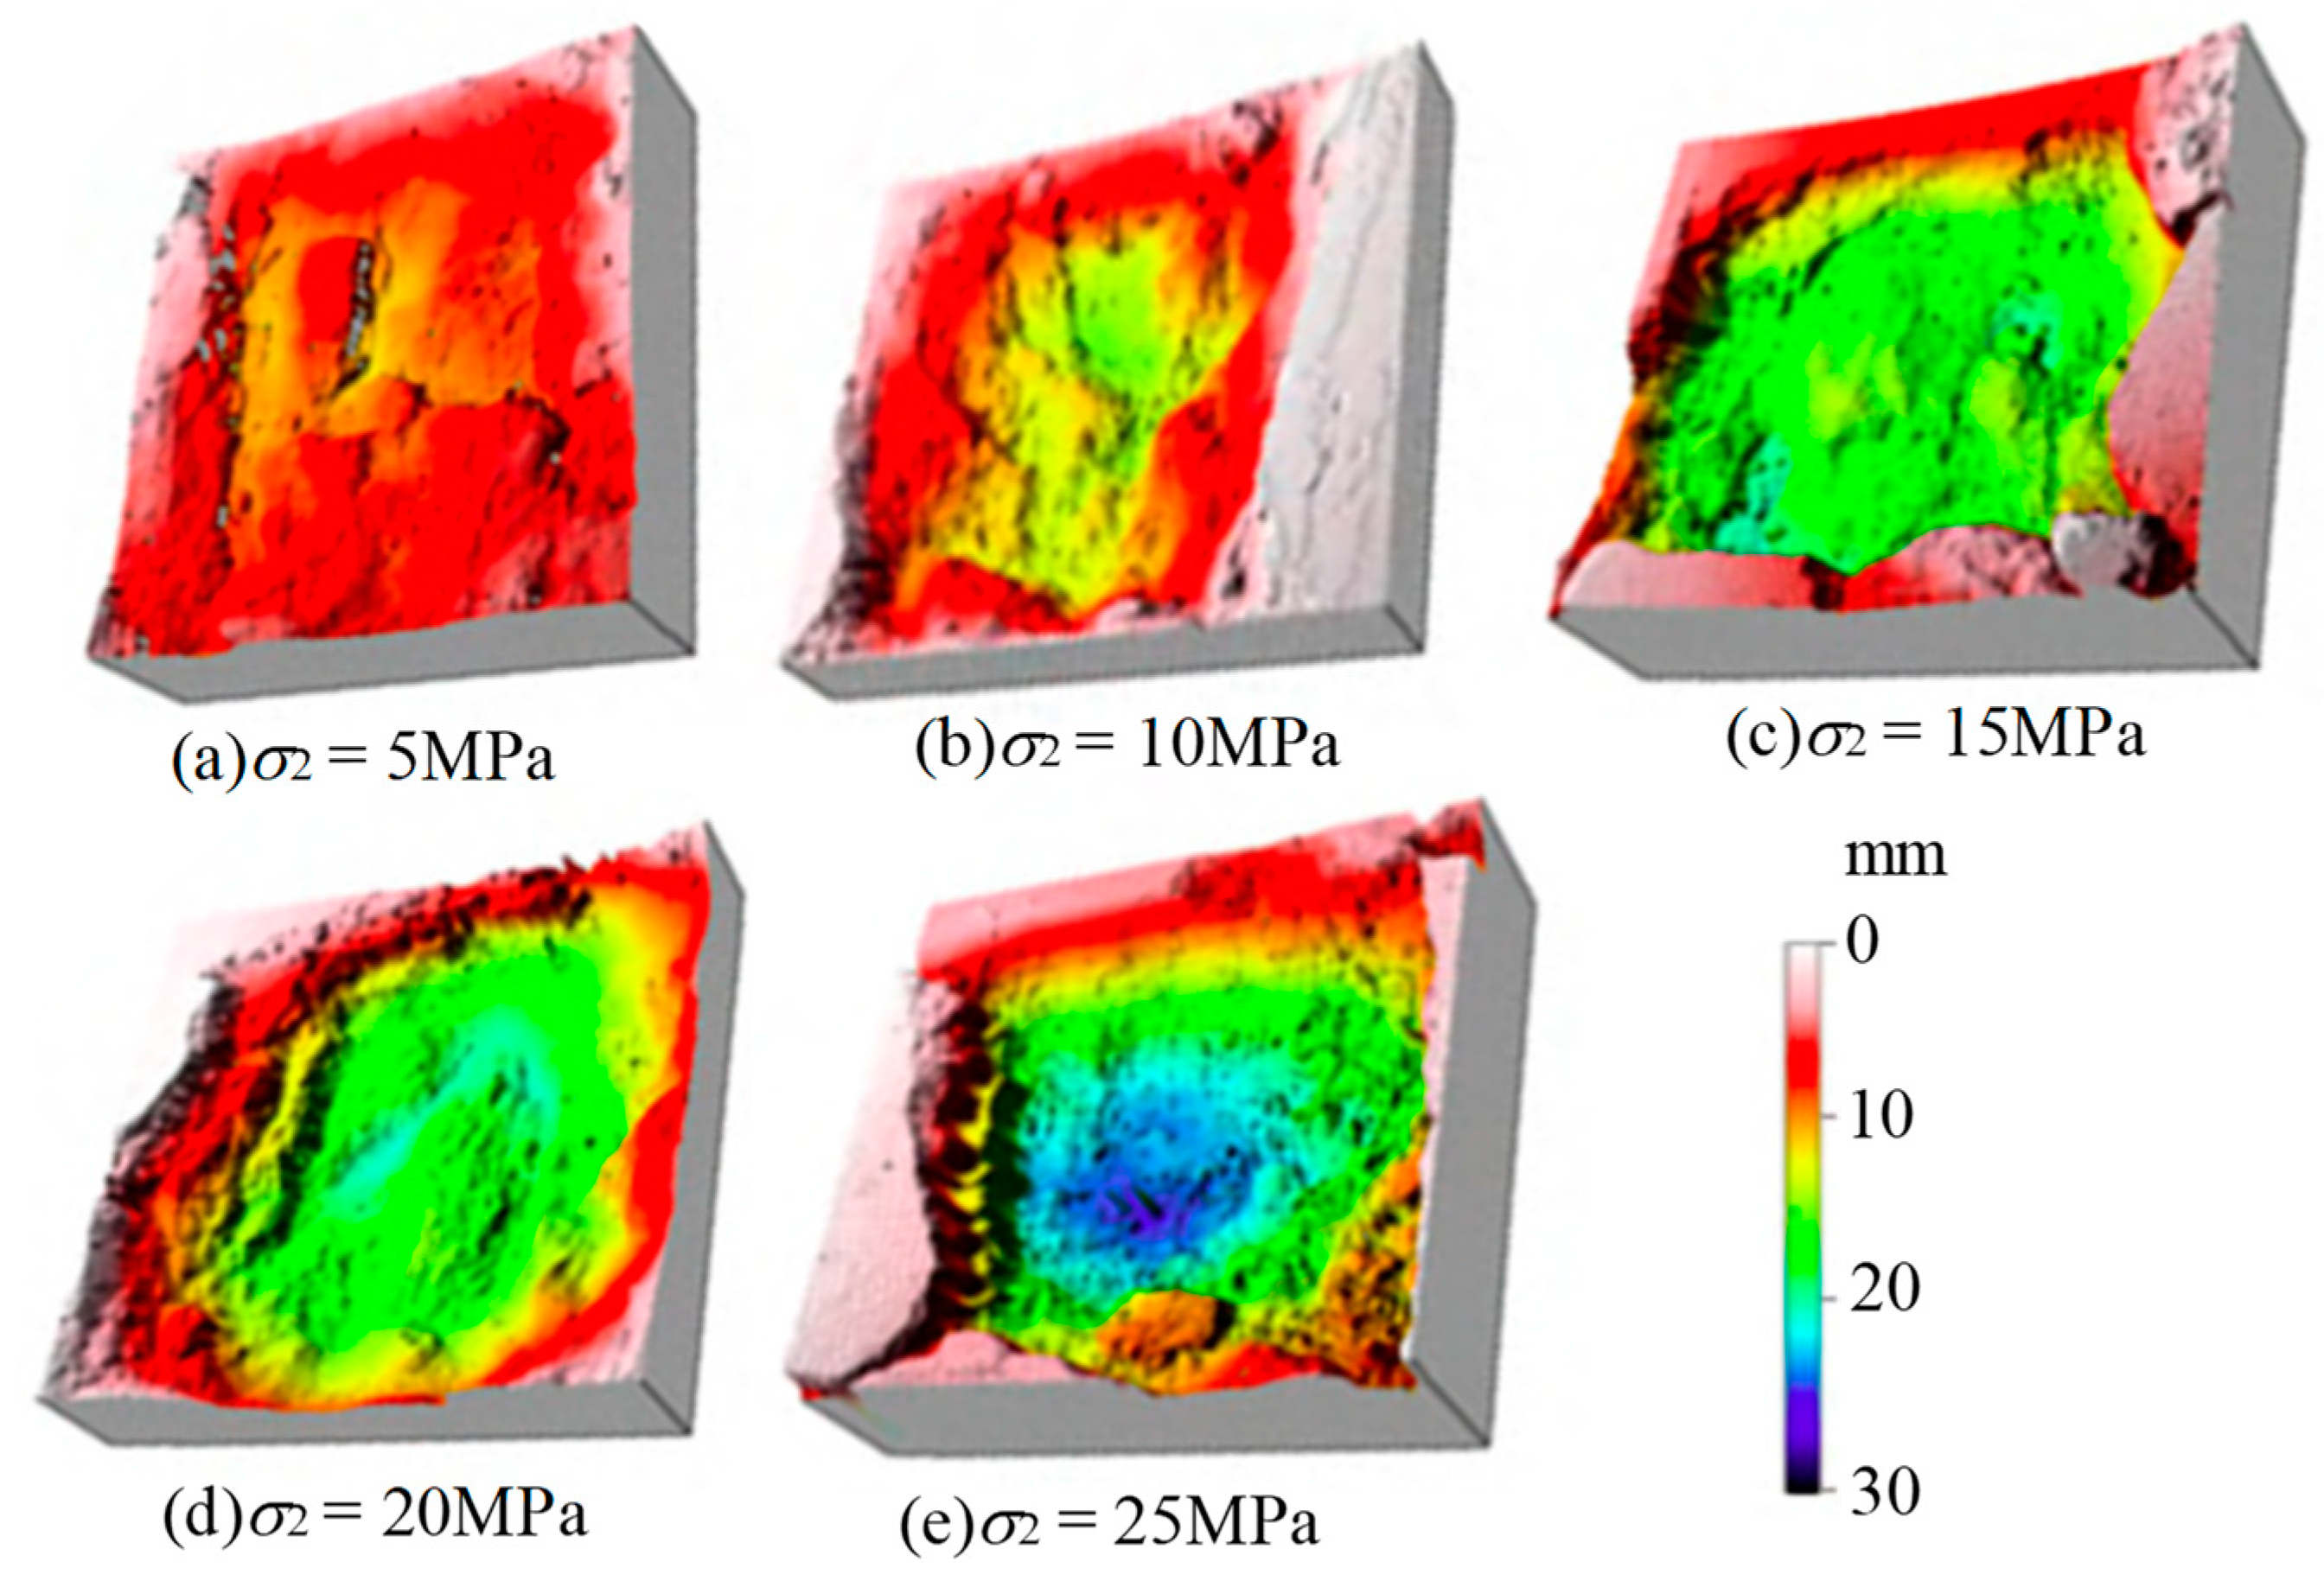
Figure 6 illustrates the typical variation of a fractured surface, which σ2 increases after conducting two penetrations, while σ1 is constant (5 MPa). Figure 6a shows a fractured surface when σ2 is 5 MPa. The deepest point is located in the middle; once the TBM disc cutters are sequentially penetrated, the maximum depth is measured 11.9 mm. Additionally, an island is formed, and the deepest point of the fractured surface is on both sides of the island. The volume of the fractured surface is roughly 25.634 mm3, which is calculated by the built-in software. The fractured surface after two penetrations is small, indicating that the breaking effect under the confining pressure is not remarkable. Furthermore, σ2 increases to 10 MPa. As shown in Figure 6b, the yellow part has a depth in the range of 12 to 16 mm, which has been increased in comparison with Figure 6a. Furthermore, it is revealed that the bottom of the fractured surface contains a high peak and a low pit in the X-direction, in which the maximum depth and volume are about 16.2 mm and 33.682 mm3, respectively. Increases in the maximum depth and volume indicate that the rock breaking tends to grow along the depth direction when σ2 increases from 5 to 10 MPa, and the effect of rock breaking under 10 MPa confining pressure is improved as well.
As σ2 increases to 15 MPa, the size of the fractured surface in the Y-direction increases to 80 mm, as displayed in Figure 6c. An island is formed in the middle of the fractured surface, in which the top of the island has a depth of 15 mm. The maximum depth of the fractured surface reaches 22.1 mm. The bottom of the fractured surface is relatively flat, with a depth of 15 mm. Meanwhile, the volume of the fractured surface increases sharply to 61.370 mm3. This indicates that when σ1 is 5 MPa, the crushing amount of rock mass between disc cutters is increased 1.8 times once σ2 increases from 10 to 15 MPa; when σ2 increases to 20 MPa, the shape of the fractured surface is similar to the counterpart. When σ2 is 15 MPa, the maximum depth is 21.8 mm, and the volume decreases slightly to 58.768 mm3. When σ2 increases to 25 MPa, as depicted in Figure 6e, the fractured surface represents a typical spherical morphology: the middle is low and the depth gradually decreases towards the edges. The maximum depth and volume reach 27.1 mm and 87.031 mm3, respectively. It can be seen that the breaking efficiency of disc cutters of TBM is at the maximum when σ1 and σ2 are 5 and 25 MPa, respectively. Based on the achieved results, with the increase of σ2, the rock is broken more effectively after performing two penetrations.
3.1.2. Variation of Fractured Surface once Minor Confining Pressure Increases, while Major Confining Pressure is Constant
Figure 7 shows the typical variation of a fractured surface when σ1 increases after two penetrations, while σ2 is constant at a value of 5 MPa. As shown in Figure 7a, the maximum depth reaches 27.1 mm when σ1 is 5 MPa. The fractured surface tends to be a basin shape, and the broken range in the Y-direction reaches 80 mm. As a result, the volume of the fractured surface is equal to 87.031 mm3. Once σ1 is increased to 10 MPa, the fractured surface is a typical basin-like shape as well. However, a small island emerged in the lower right corner, and the range of crushing in the Y-direction slightly decreased to 73 mm. The maximum depth of the fractured surface also drops to 24.8 mm, and the corresponding volume decreases to 73.908 mm3 as well; once σ1 increases to a value of 15 MPa, as illustrated in Figure 7c, the breaking in the Y-direction reaches 88 mm, and its maximum depth is equal to 24.5 mm. The fractured surface with a depth greater than 18 mm is small and often found near the center. The formed island is not fully broken, thus the volume of fractured surface is further reduced to 65.388 mm3. In conclusion, the volume of the fracture’s surface tends to gradually decrease with the confining pressure, while σ2 is constant.
3.2. Crack Development between Disc Cutters
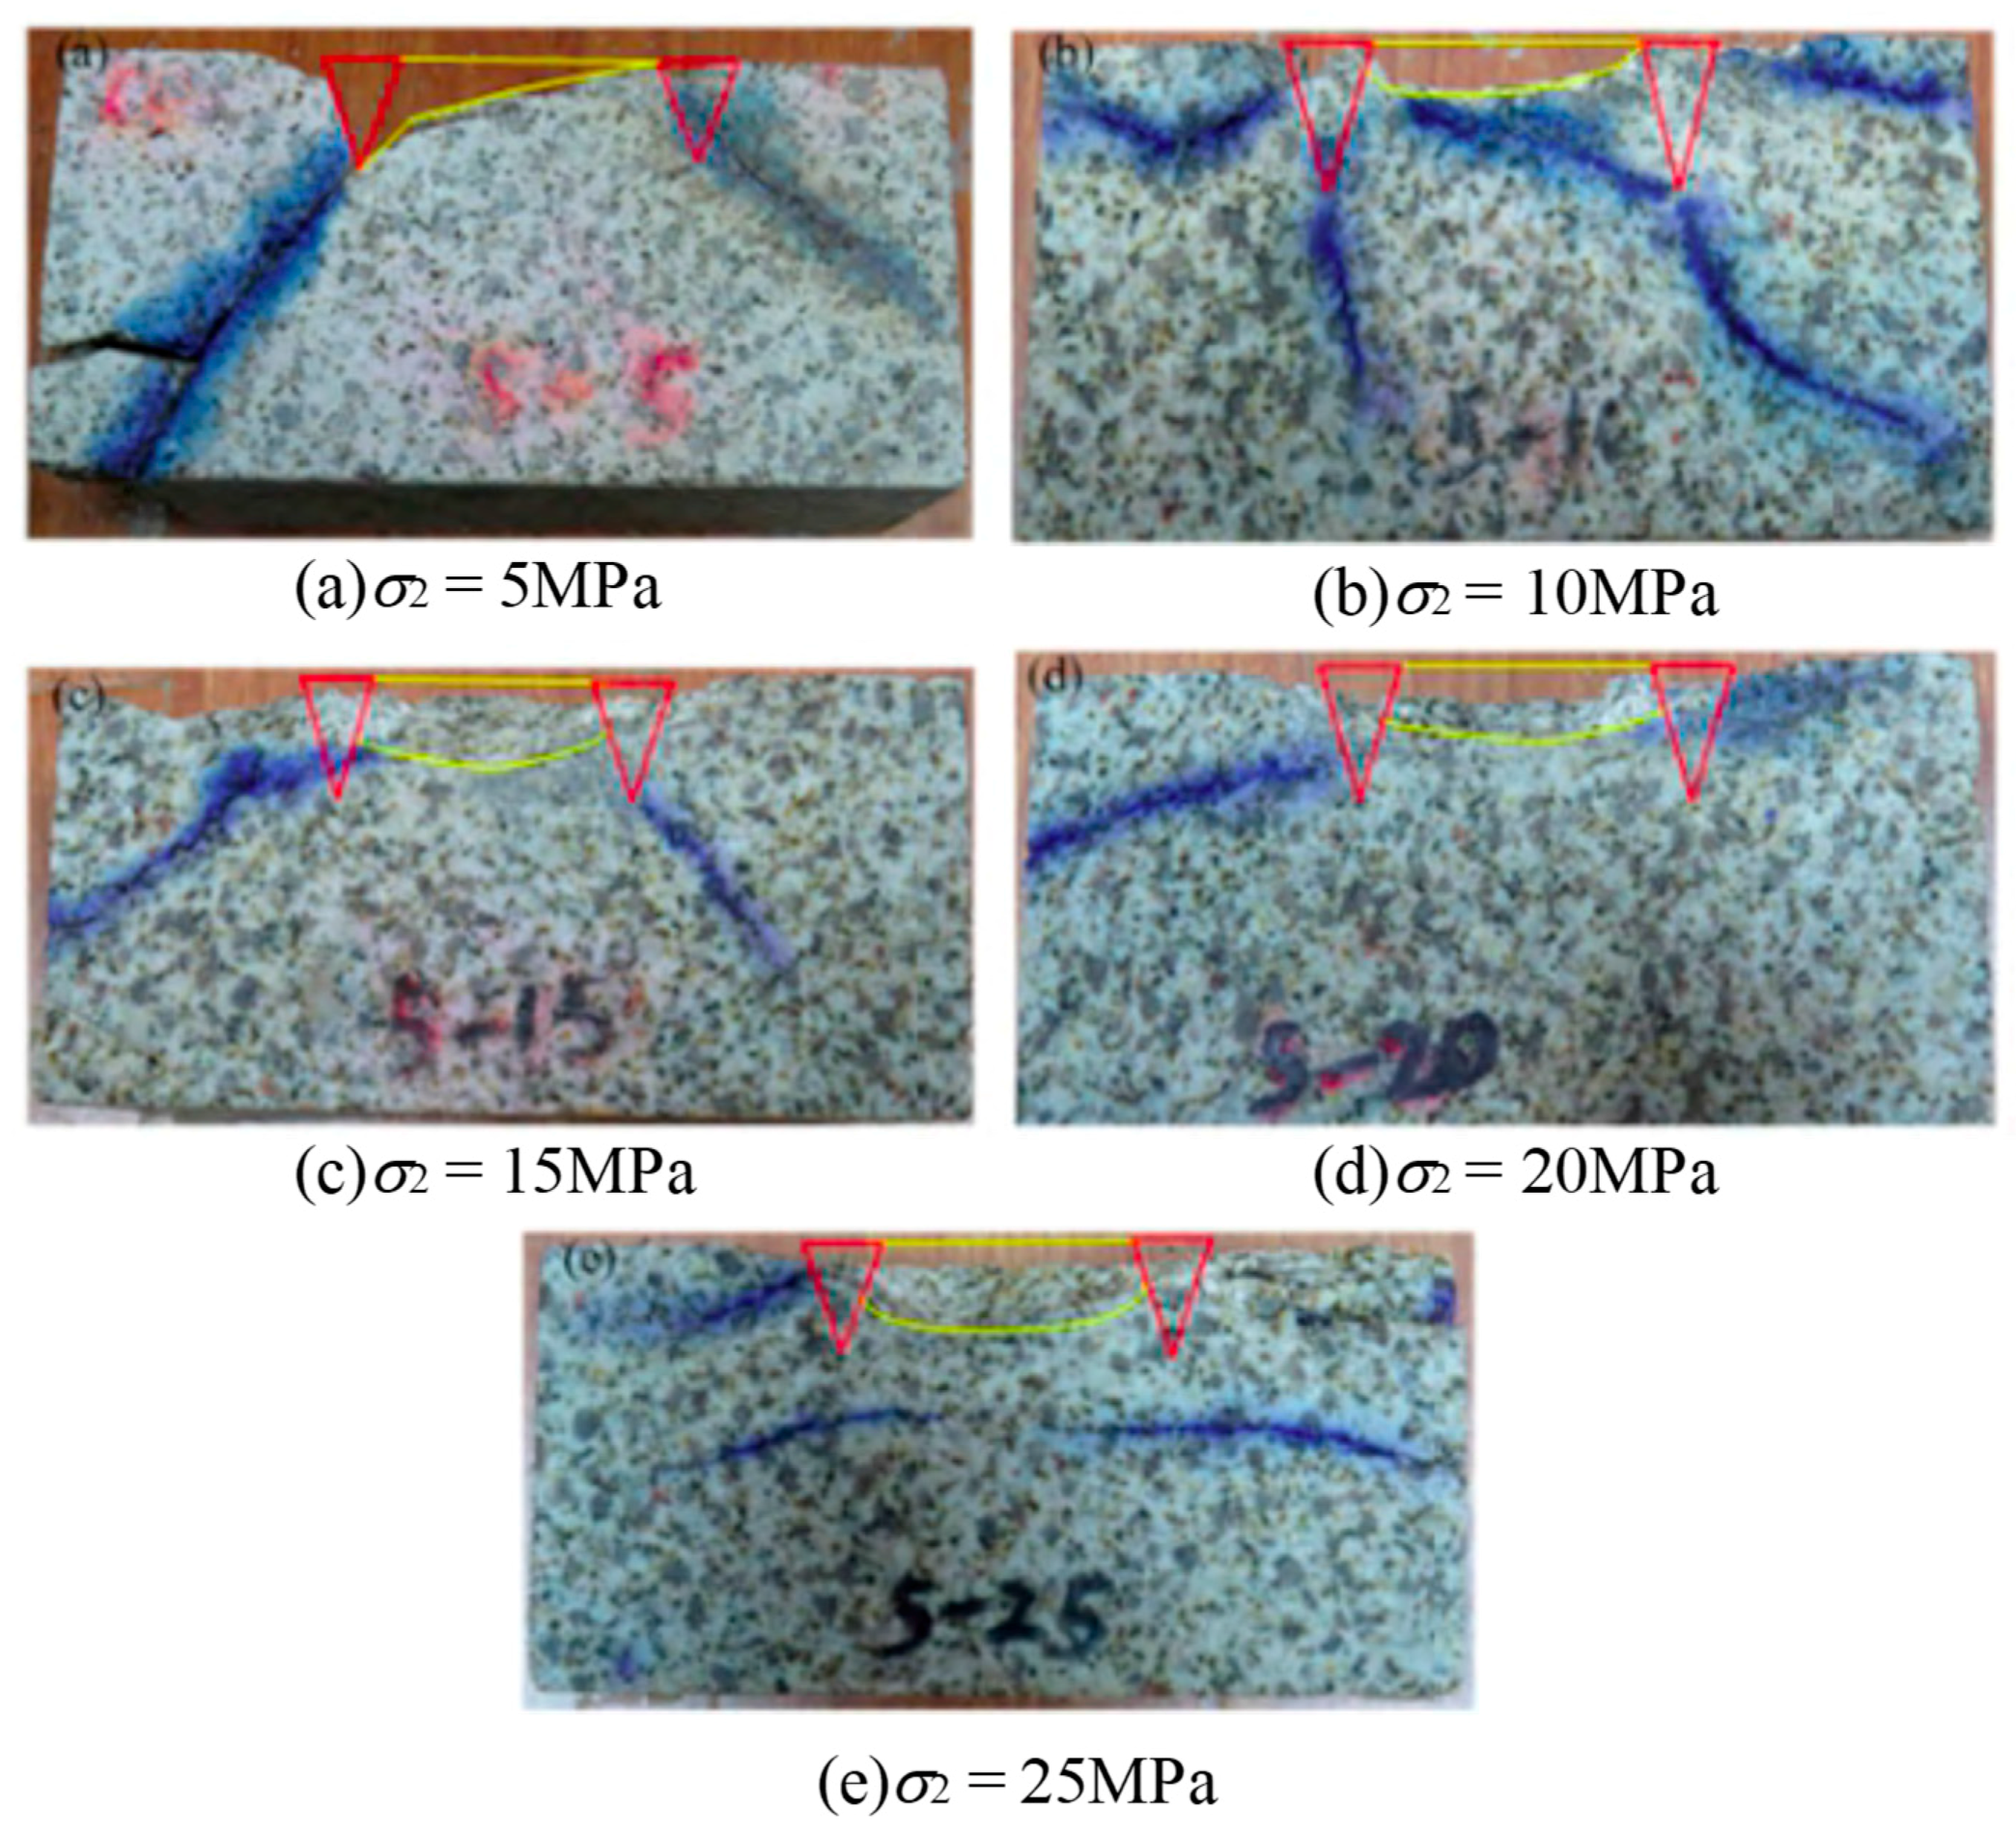
3.2.1. Variations of Crack Development with Increase of Major Confining Pressure while Minor Confining Pressure is Constant
As shown in Figure 8a, there is no obvious crack development in the cross section between two plastic deformation zones when the confining pressure is 5 MPa. The fractured surface contains an approximate triangular shape, and the breaking surface is straight and flat. A crack could develop due to the combined action of shear failure and surface tension. Simultaneously, a crack with a certain deflection angle appears below each plastic deformation zone, and the broken area is relatively small. As σ2 increases to 10 MPa, the shape of the fractured surface varies and becomes nearly semilunar-shaped with an uneven depth, as illustrated in Figure 8b. At the same time, when σ2 is 5 MPa, the pit is slightly deeper. A crack starts to grow in a plastic defamation zone, and then crack propagation forms, leading to an interconnected crack between the two plastic deformation zones. Additionally, when σ2 increases to 15 MPa, the depth of the fractured surface increases slightly, the crack initiation angle decreases somewhat, and the deflection angle increases sharply. Accordingly, breaking is simultaneously made by the internal tensile cracks.
When σ2 increases to 20 MPa, the shape of the fractured surface is similar to the surface when the confining pressure reaches 5–10 MPa, as depicted in Figure 8d. The fractured surface is also likely to be formed by internal tensile cracks. However, the level of crack development is low, and there are only two internal cracks besides the cracks formed between the disc cutters. When σ2 increases to 25 MPa, the shape of the fracture’s surface is similar to the surface created by those two types of confining pressures, as shown in Figure 8e. However, it can be seen that when the depth is large, the crack development in the plastic deformation zone is not clear enough. Moreover, a new type of crack is observed that does not originate with the plastic deformation zone below the disc cutters. The cracks are randomly distributed within the rock with varying lengths. This type of crack has been reported in a previous study performed by Yin et al. [29] as well, and leads to breaks.
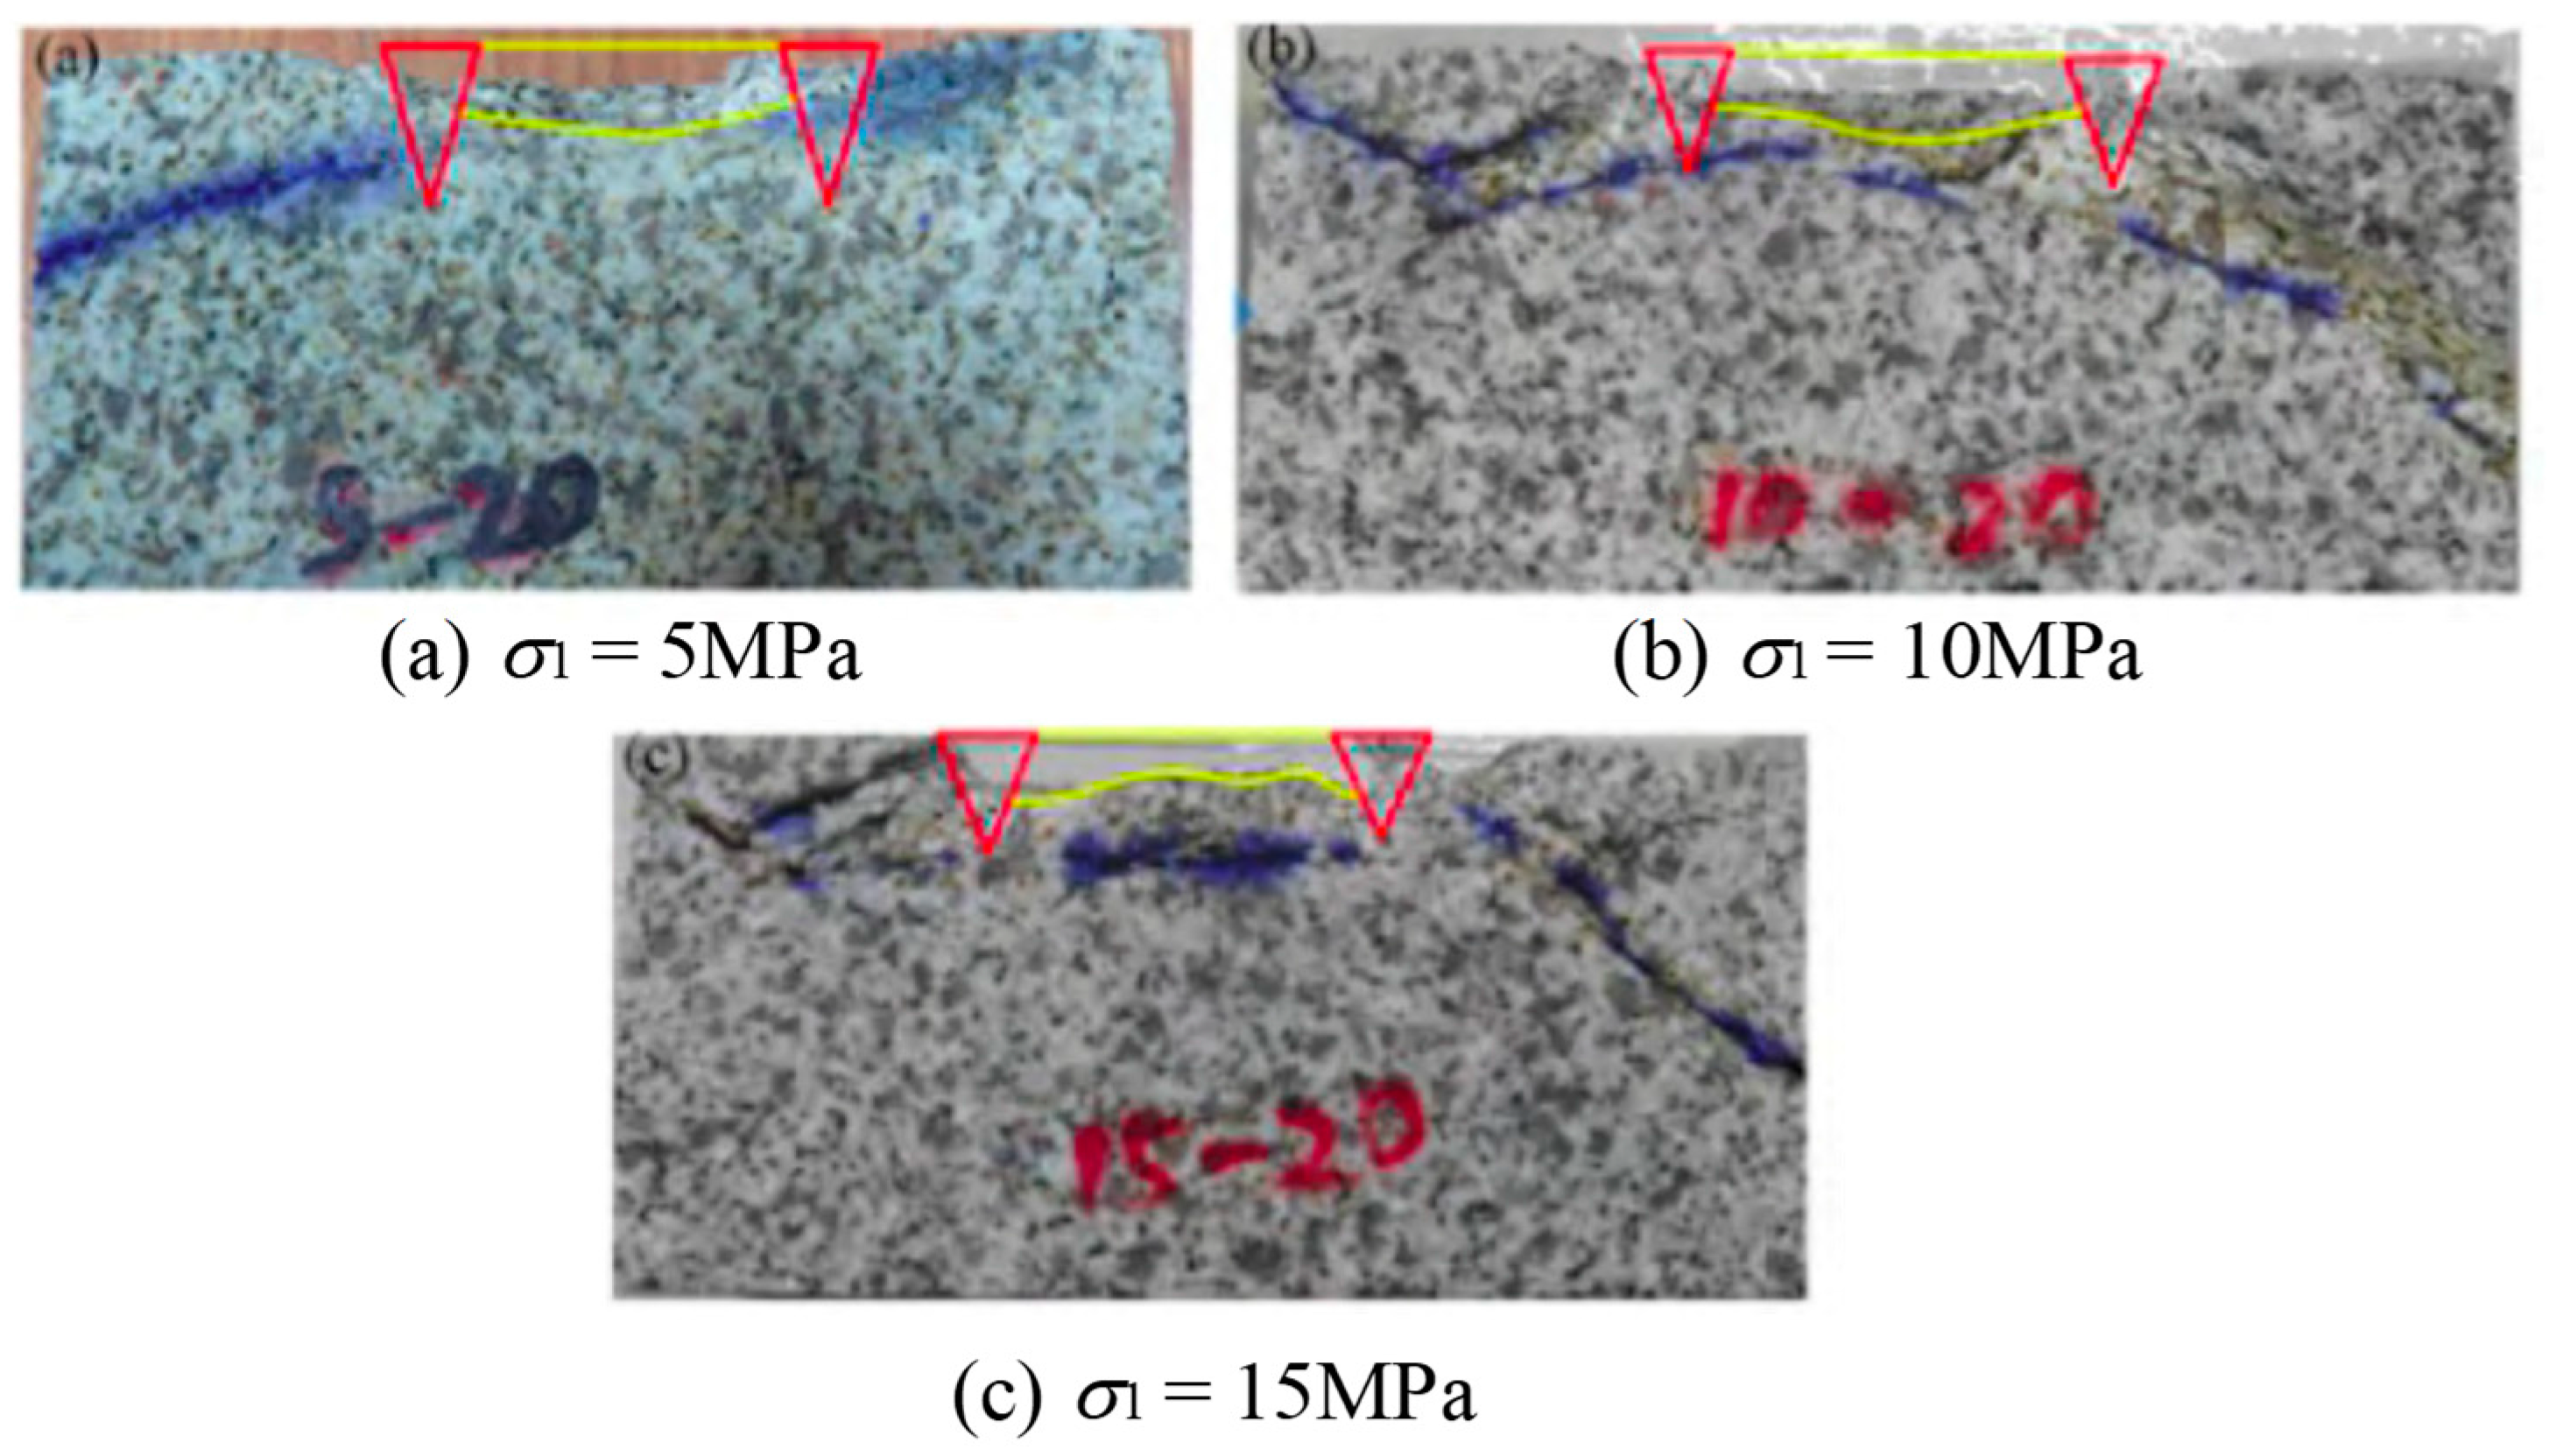
3.2.2. Variation of Crack Development with Increase of Minor Confining Pressure while Major Confining Pressure is Constant
When σ2 is equal to 20 MPa, the variation of the crack growth with the increase of σ1 is displayed in Figure 9. When σ1 is equal to 5 MPa, the profile of the fractured surface is low in the middle and very close to the edges. When σ1 increases to 10 MPa, the shape is roughly similar to when σ1 is only 5 MPa, as shown in Figure 9b. Although the lowest point is deeper than the former situation, the contour is deeper when the confining pressure is 5–20 MPa. Additionally, there is an obvious crack connecting two plastic deformation zones below the fractured surface. Therefore, when the confining pressure is 10–20 MPa, the increase in σ1 leads to a decrease in crushing depth, preventing the propagation of the cracks from the top to the bottom, and resulting in shallow and small fractured surfaces. Figure 9c illustrates that when σ1 increases to 15 MPa, the range of crack development is larger than that of the confining pressure of 10 and 20 MPa. In addition, the fractured surfaces between disc cutters are clearly varied. These showed similar shapes—low in the middle and high towards the edges—and there are obvious internal cracks, directly propagating. Therefore, the increase in σ1 prevents crack development in the depth direction, resulting in a decrease in depth of the fractured surface as well. The increase of σ1 causes the cracking to happen near the shallow surface.
The trend of the variation of cracks with confining pressure has verified the trend of the morphology of fractured surface with the confining pressure. When σ1 is constant, more rocks tend to be broken after two penetrations with the increase of σ2. When σ2 is constant, the size of the fractured surface tends to gradually reduce with the decrease in confining pressure.
4. Discussion
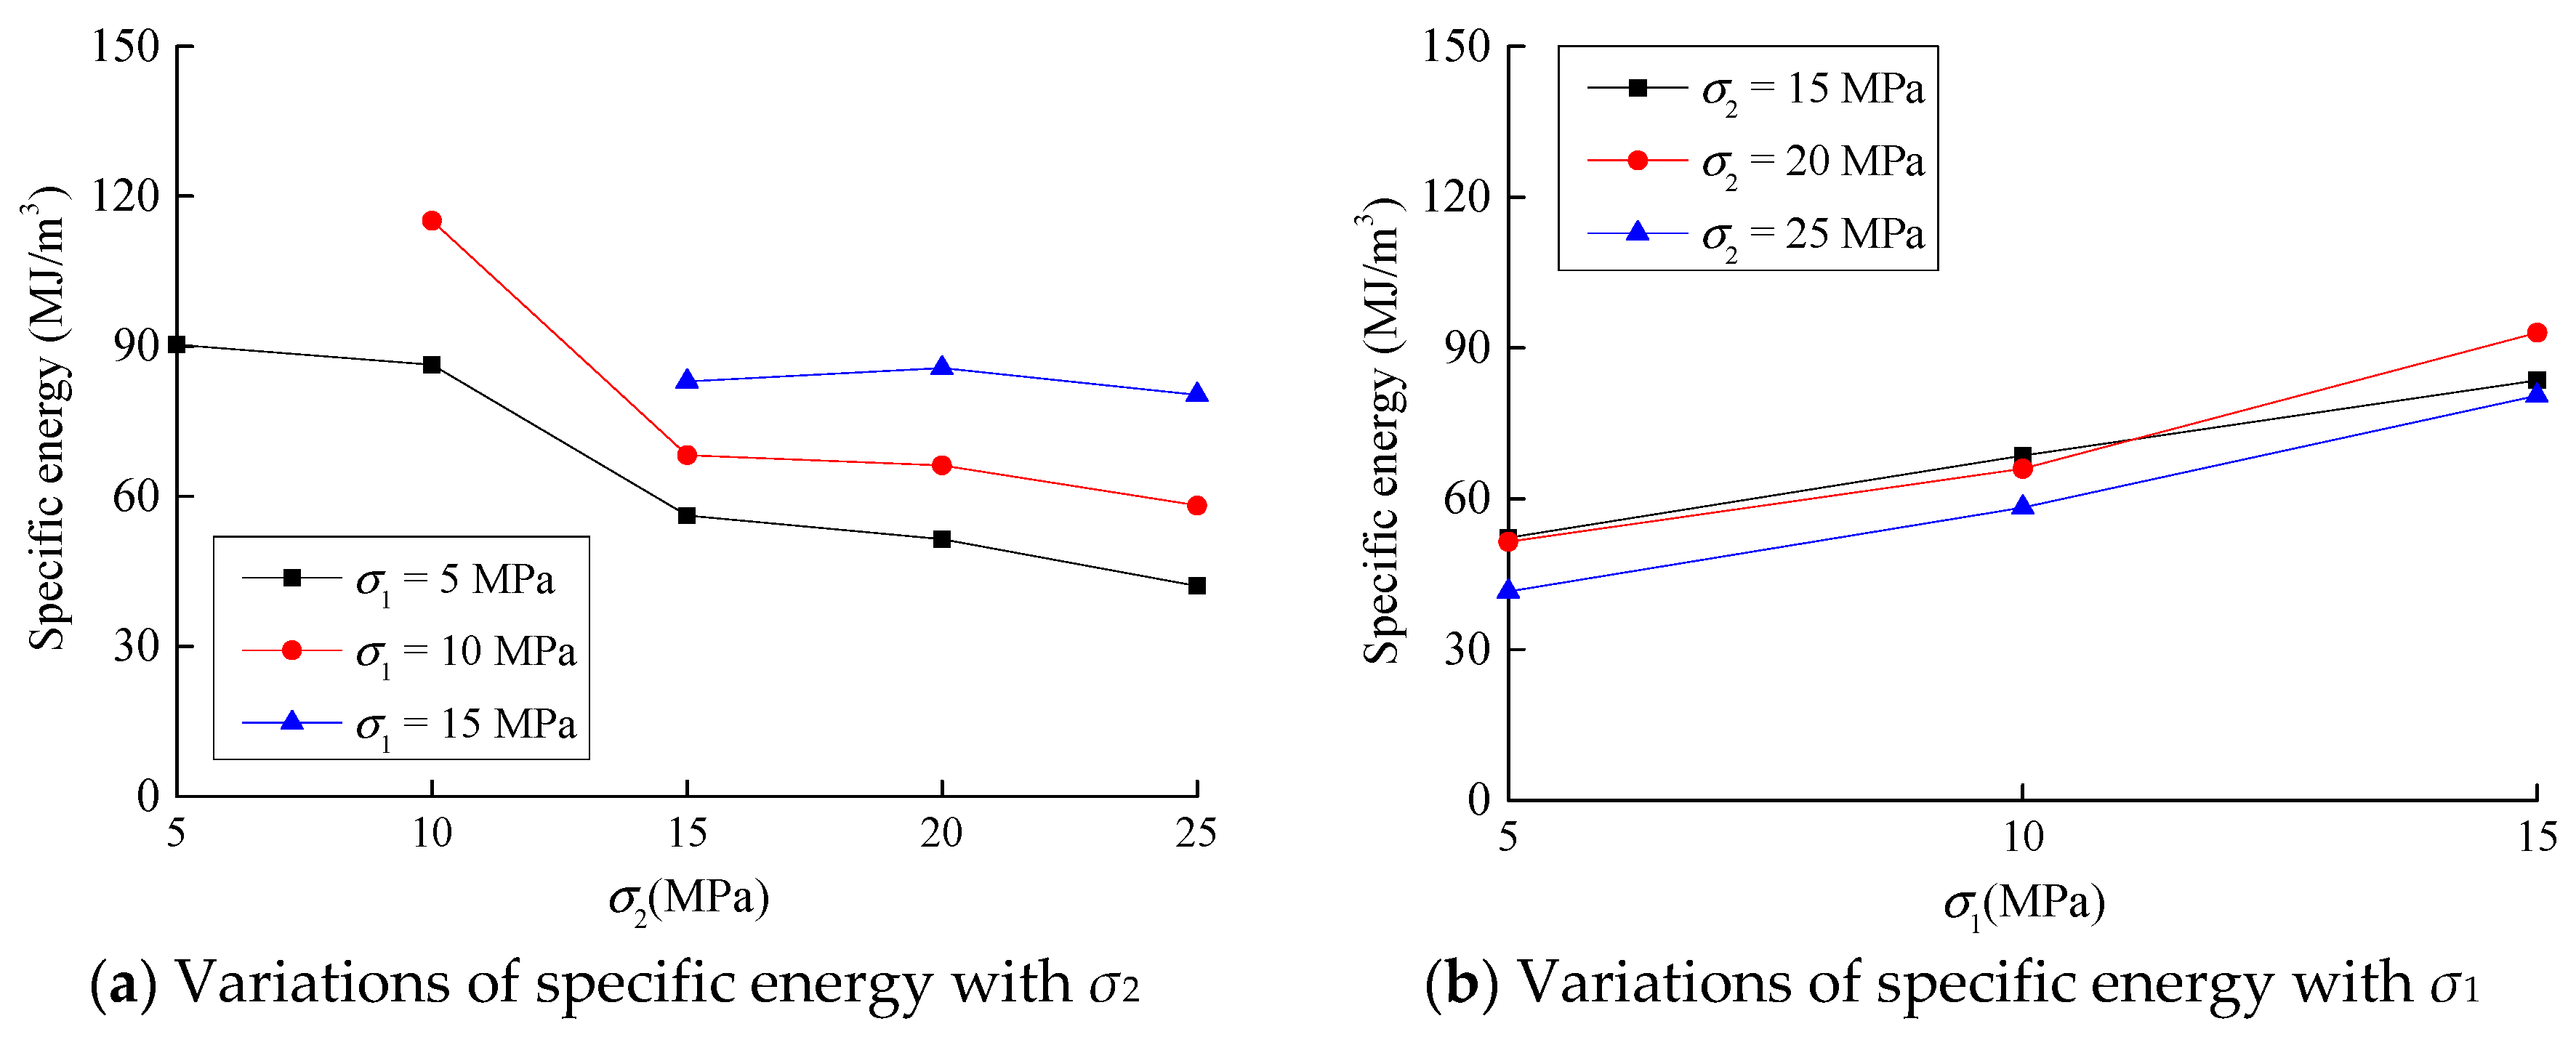
The specific energy for cutting is a key indicator for evaluating the efficiency of rock breaking, which is defined as the energy it takes to crush a volumetric unit of rock, in MJ/m3. Specific energy is calculated via dividing the cutting energy by the volume of breaking rock [31].
The two key indicators describing the efficiency of energy consumption are the cutting energy and broken volume. The relationship between the cutting energy consumption and σ2 and σ1 is analyzed in combination with the penetration energy and volume of fractured surface at different confining pressure levels, as shown in Figure 10 and Figure 11.
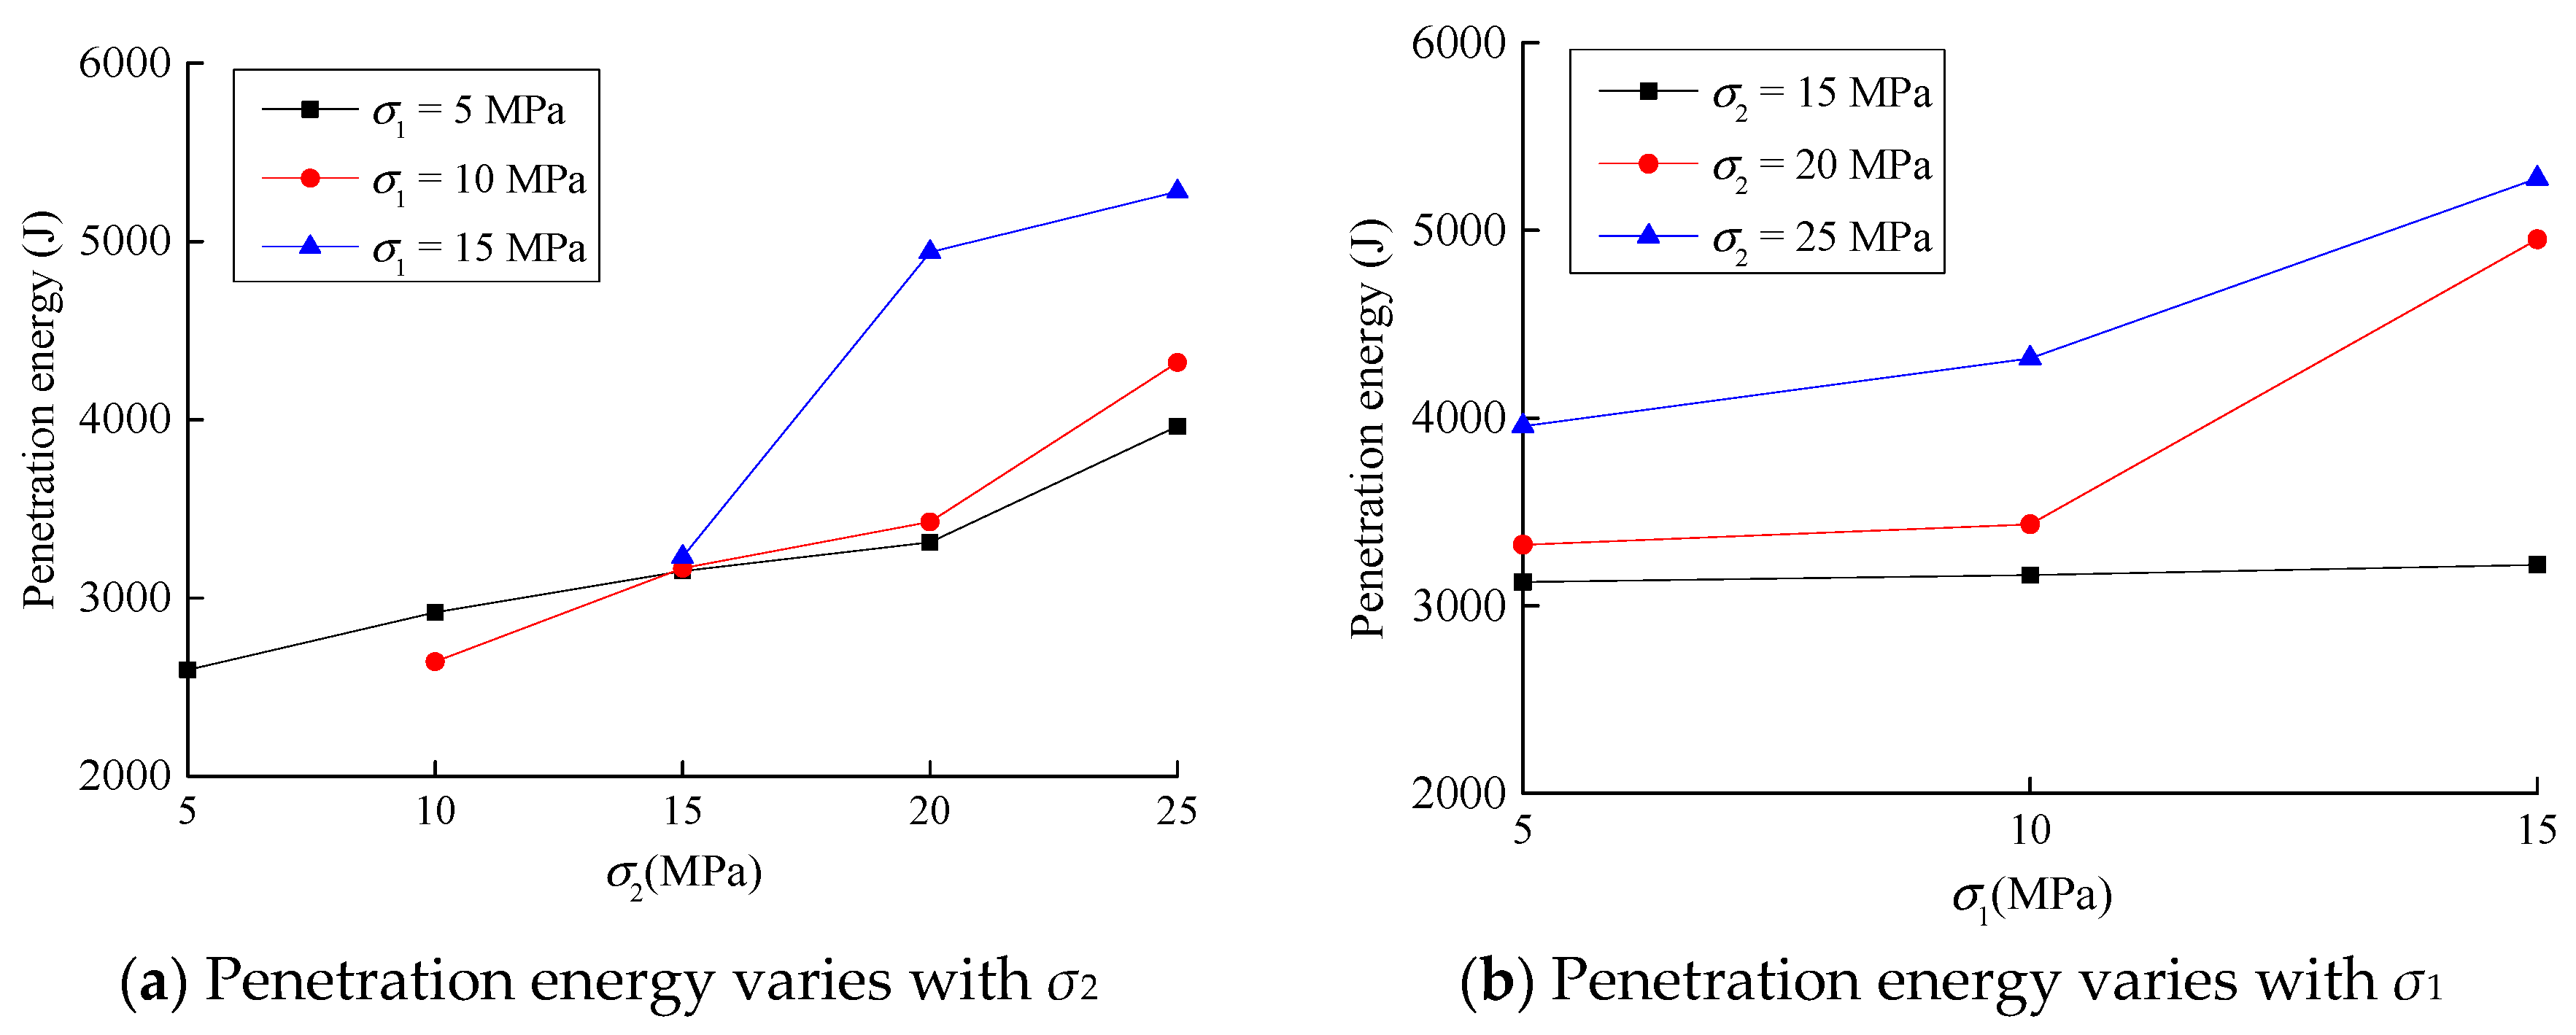
4.1. Penetration Energy under Different Confining Pressures
When σ1 is constant, the total energy consumption during two penetrations of granite samples with the increase of confining pressure is shown in Figure 10a. When the confining pressure is 5 MPa, the penetration energy reaches over 2500 J; when σ2 increases, the energy consumption gradually increases with σ2. When σ1 reaches 10–15 MPa, the overall trend is similar to that of σ1 (equal to 5 MPa). When σ2 is constant, as the discrepancy between confining pressures decreases, the total energy is shown in Figure 10b. It can be seen that the energy consumption in the two penetration processes continuously increases with σ1.
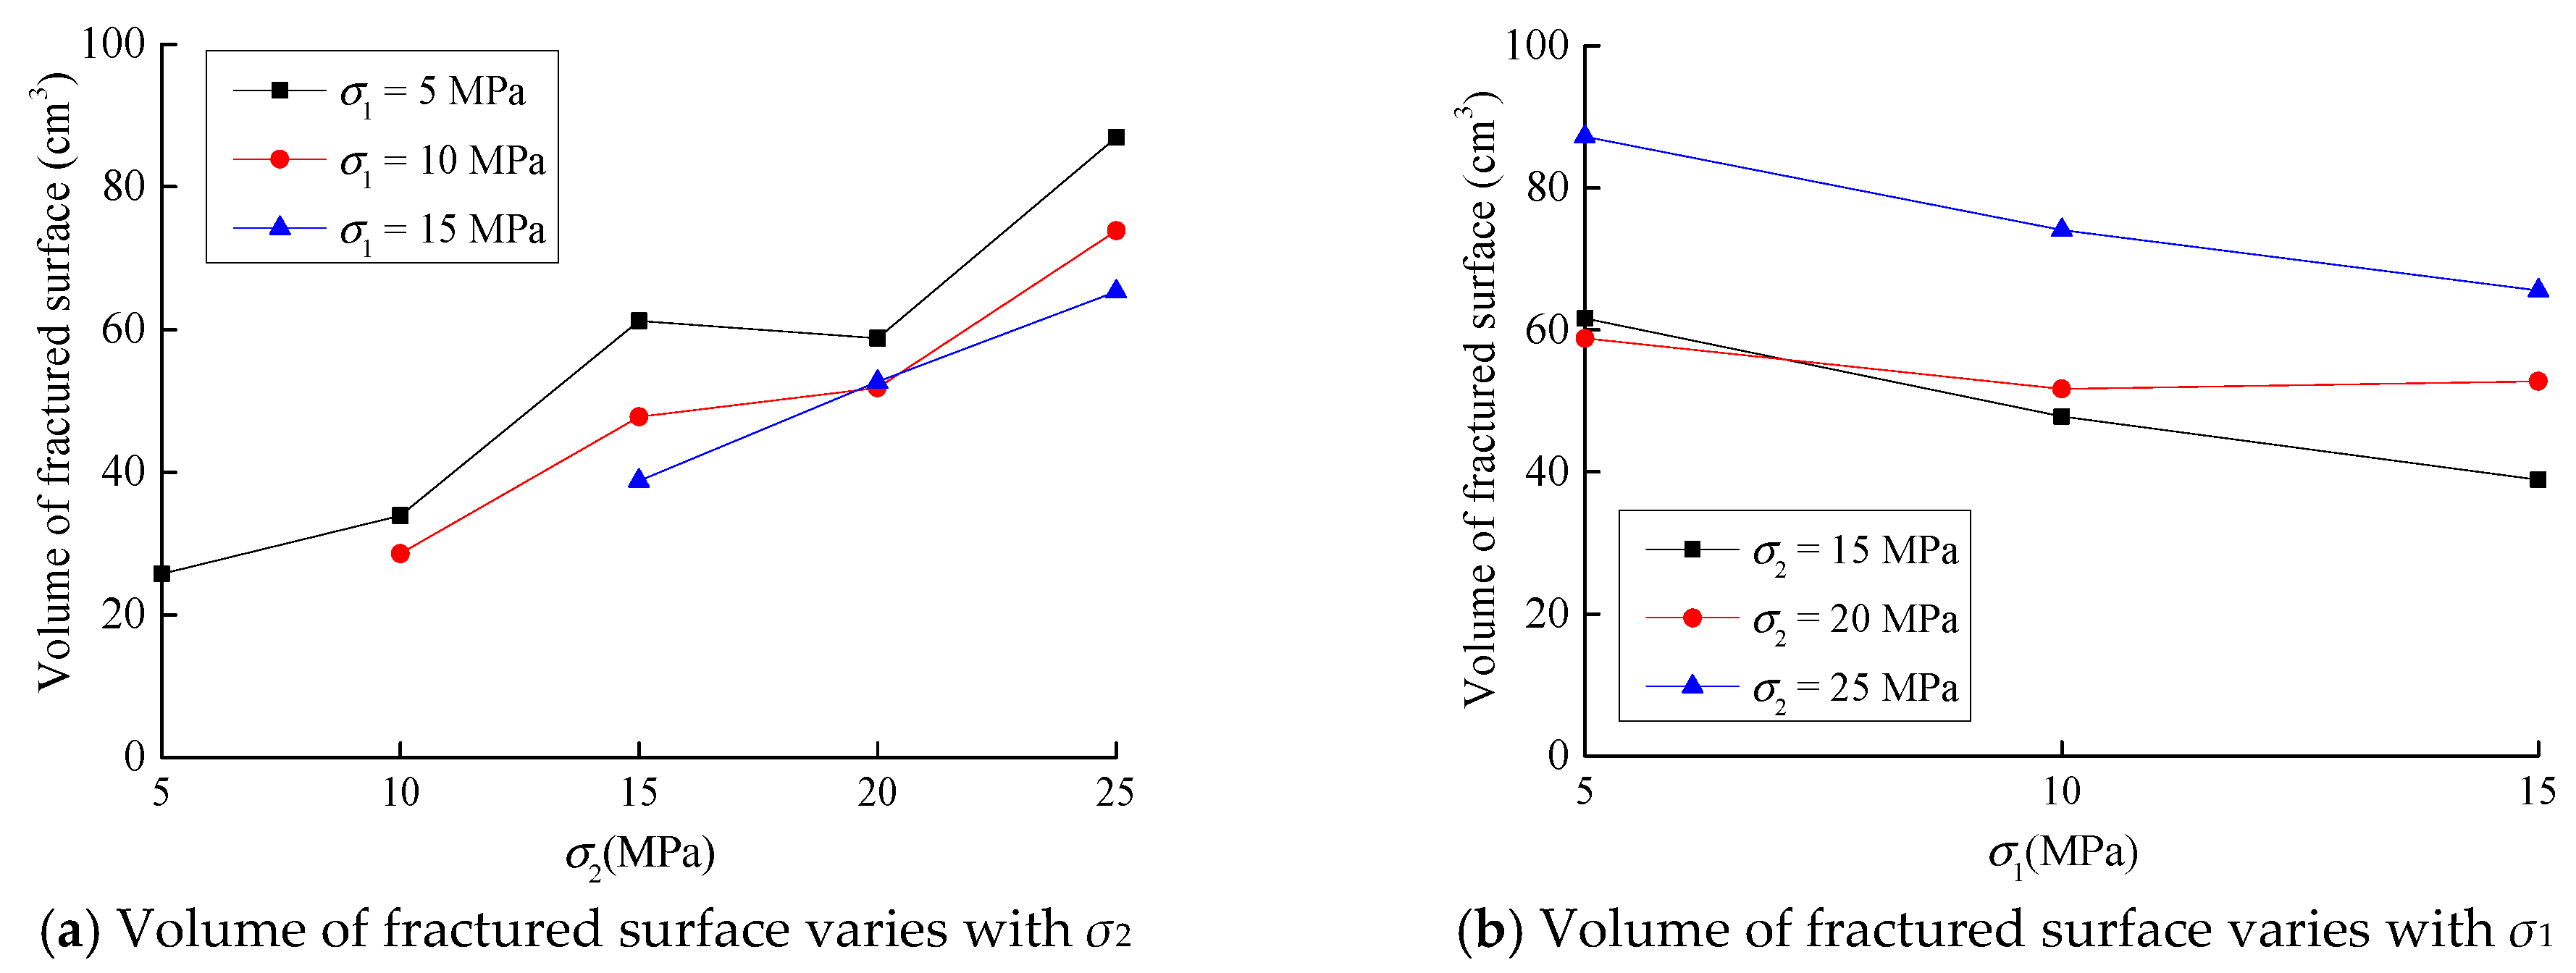
4.2. Volume of the Fractured Surface under Different Confining Pressures
When σ1 is constant, the volume of the fractured surface clearly increases with the increase of σ2, when the depth of penetration and the corresponding distance between disc cutters are constant. Therefore, with the increase in confining pressure, the corresponding rock breaking efficiency improves as well.
With the decrease in confining pressure, the rock between the grooves develops from tension failure in the deep bottom to shear failure near the surface, and the crushing degree decreases with the reduction in confining pressure. In summary, the reduction of the confining pressure may reduce the crushing of the rock mass between the grooves.
4.3. Breaking Efficiency under Different Confining Pressures
The energy consumed during the two penetrations continuously increases with the increase of σ2, and the volume of the fractured surface increases as well. The between describing the variation trend of the specific energy and σ2 is difficult to determine based only on the cutting specific energy. As shown in Figure 12a, the specific energy decreases with the increase in σ2, reflecting that the increase of σ2 tends to increase the rock-breaking efficiency.
However, with the increase of σ1, the cutting energy increases, while the volume of the fractured surface rapidly decreases. Combined with Equation (5), the energy consumed to form the crushed body per unit volume increases due to the increase in σ1. The increase in σ1 causes the TBM disc cutters to have reduced rock-breaking efficiency. As illustrated in Figure 12b, the cutting energy consumption shows an increasing trend with the decrease in confining pressure, and the reduction in confining pressure leads to a decrease in the efficiency of the disc cutters.
5. Conclusions
In order to study the characteristics of rock breaking and corresponding efficiency under different confining pressures, TBM penetration tests under bi-lateral confining pressure were conducted and the volume and morphology of fractured surface were assessed as well. Based on the results the following conclusions are drawn:
- The fractured surface gradually developed when σ1 was constant and σ2 increased. The rock crushing mechanism varied from the shear failure in the shallow surface to the tensile failure in the bottom, and the efficiency of rock breaking gradually increased.
- The depth and volume of the fractured surface gradually decreased, and the failure mode varied from tensile failure to shear failure, resulting in a decrease in rock-breaking efficiency when σ2 was constant and σ1 increased.
- When σ1 was constant, the energy consumption efficiency gradually increased with an increase in σ2. Although some fluctuations were observed, the overall energy consumption increased with the increase in σ2. When σ2 was constant, the energy consumption gradually increased with an increase in σ1.
- Edge effects played a significant role in experimental performance. Large-scale sample tests provided insight into the characteristics of rock breaking. In the present study, whether it affects the experimental results or not is out of our research area. We plan to survey the edge effect in a future study.
Acknowledgments
The authors would like to thank the China Postdoctoral Science Foundation (Grant No. 2017M620048), and the National Natural Science Foundation of China (Grant No. 51604051) for funding this study.
Author Contributions
Y.C. conceived, designed and performed the experiments; C.S. analyzed the data.
Conflicts of Interest
The authors declare no conflict of interest.
References
- Ozdemir, L.; Wang, F.D. Mechanical Tunnel Boring Prediction and Machine Design; Colorado School of Mines: Golden, CO, USA, 1979. [Google Scholar]
- Gertsch, R.E. Rock Toughness and Disc Cutting; University of Missouri: Columbia, MO, USA, 2000. [Google Scholar]
- Eftekhari, M.; Baghbanan, A.; Bagherpour, R. The effect of fracture patterns on penetration rate of TBM in fractured rock mass using probabilistic numerical approach. Arab. J. Geosci. 2013, 7, 5321–5331. [Google Scholar] [CrossRef]
- Bakar, M.Z.A.; Gertsch, L.S.; Rostami, J. Evaluation of fragments from disc cutting of dry and saturated sandstone. Rock Mech. Rock Eng. 2014, 47, 1891–1903. [Google Scholar] [CrossRef]
- Gong, Q.-M.; Zhao, J. Development of a rock mass characteristics model for TBM penetration rate prediction. Int. J. Rock Mech. Min. Sci. 2009, 46, 8–18. [Google Scholar] [CrossRef]
- Yagiz, S. Utilizing rock mass properties for predicting TBM performance in hard rock condition. Tunn. Undergr. Space Technol. 2008, 23, 326–339. [Google Scholar] [CrossRef]
- Gong, Q.-M.; Zhao, J.; Jiao, Y.-Y. Numerical modeling of the effects of joint orientation on rock fragmentation by TBM cutters. Tunn. Undergr. Space Technol. 2005, 20, 183–191. [Google Scholar] [CrossRef]
- Gong, Q.-M.; Zhao, J. Influence of rock brittleness on TBM penetration rate in Singapore granite. Tunn. Undergr. Space Technol. 2007, 22, 317–324. [Google Scholar] [CrossRef]
- Wang, S.Y.; Sloan, S.W.; Liu, H.Y.; Tang, C.A. Numerical simulation of the rock fragmentation process induced by two drill bits subjected to static and dynamic (impact) loading. Int. J. Rock Mech. Min. Sci. 2011, 44, 317–332. [Google Scholar] [CrossRef]
- Goldsmith, W.; Wu, W. Response of rocks to impact loading by bars with pointed ends. Rock Mech. 1981, 13, 157–184. [Google Scholar] [CrossRef]
- Tan, Q.; Xu, Z.-J.; Xia, Y.-M.; Zhang, K. Numerical study on mode of breaking rock by TBM cutter in two cutting orders. J. Cent. South Univ. 2012, 43, 940–946. [Google Scholar]
- Hadi, H.; Mohammad, F.M.; Kourosh, S. Simulating the effects of disc erosion in TBM DISC cutters by a semi-infinite DDM. Arab. J. Geosci. 2014, 6, 3915–3927. [Google Scholar]
- Huo, J.; Hou, N.; Sun, W.; Wang, L.; Dong, J. Analyses of dynamic characteristics and structure optimization of tunnel boring machine cutter system with multi-joint surface. Nonlinear Dyn. 2017, 87, 237–254. [Google Scholar] [CrossRef]
- Huo, J.; Zhu, D.; Hou, N.; Sun, W.; Dong, J. Application of a small-timescale fatigue, crack-growth model to the plane stress/strain transition in predicting the lifetime of a tunnel-boring-machine cutter head. Eng. Fail. Anal. 2016, 71, 11–30. [Google Scholar] [CrossRef]
- Huo, J.; Wu, H.; Sun, W.; Zhang, Z.; Wang, L.; Dong, J. Electromechanical coupling dynamics of TBM main drive system. Nonlinear Dyn. 2017, 90, 2687–2710. [Google Scholar] [CrossRef]
- Huo, J.; Wang, W.; Sun, W.; Ling, J.; Dong, J. The multi-stage rock fragmentation load prediction model of tunnel boring machine cutter group based on dense core theory. Int. J. Adv. Manuf. Technol. 2017, 90, 277–289. [Google Scholar] [CrossRef]
- Gong, Q.M.; She, Q.R.; Hou, Z.S.; Jiang, H.; Peng, Q. Experimental study of TBM penetration in marble rock mass under high geostress. Chin. J. Rock Mech. Eng. 2010, 29, 2522–2532. [Google Scholar]
- Yin, L.J.; Gong, Q.M.; Zhao, J. Study on rock mass boreability by TBM penetration test under different in situ stress conditions. Tunn. Undergr. Space Technol. 2014, 43, 413–425. [Google Scholar] [CrossRef]
- Tarkoy, P.J.; Marconi, M. Difficult rock comminution and associated geological conditions. In Proceedings of the International Symposium: Tunnelling ’91, London, UK, 14–18 April 1991; pp. 195–207. [Google Scholar]
- Bilgin, N.; Tuncdemir, H.; Balci, C.; Copur, H.; Eskikaya, S. A model to predict the performance of tunneling machines under stressed conditions. In Proceedings of the AITES-ITA 2000 World Tunnel Congress, Durban, South Africa, 13–17 May 2000; pp. 47–54. [Google Scholar]
- Innaurato, N.I.; Oggeri, C.; Oreste, P.P.; Vinai, R. Experimental and numerical studies on rock breaking with TBM tools under high stress confinement. Rock Mech. Rock Eng. 2007, 40, 429–451. [Google Scholar] [CrossRef]
- Huang, H.; Damjanal, B.; Detournay, E. Normal wedge indentation in rocks with lateral confinement. Rock Mech. Rock Eng. 1998, 31, 81–94. [Google Scholar] [CrossRef]
- Cook, N.G.; Hood, M.; Tsai, F. Observation of crack growth in hard rock loaded by an indenter. Int. J. Rock Mech. Min. Sci. 1984, 21, 97–107. [Google Scholar] [CrossRef]
- Liu, H.Y.; Kou, S.Q.; Lindqvist, P.A.; Tang, C.A. Numerical simulation of the rock fragmentation process induced by indenters. Int. J. Rock Mech. Min. Sci. 2002, 39, 491–505. [Google Scholar] [CrossRef]
- Ma, H.-S.; Yin, L.-J.; Ji, H.-G. Numerical study of the effect of confining stress on rock fragmentation by TBM cutters. Int. J. Rock Mech. Min. Sci. 2011, 48, 1021–1033. [Google Scholar] [CrossRef]
- Balci, C. Correlation of rock cutting tests with field performance of a TBM in a highly fractured rock formation: A case study in Kozyatagi-Kadikoy metro tunnel, Turkey. Tunn. Undergr. Space Technol. 2009, 24, 423–435. [Google Scholar] [CrossRef]
- Chang, S.H.; Choi, S.W.; Bae, G.J. Performance prediction of TBM disc cutting on granitic rock by the linear cutting test. Tunn. Undergr. Space Technol. 2006, 21, 271. [Google Scholar] [CrossRef]
- Li, M.H.; Yin, G.Z.; Xu, J.; Li, W.; Song, Z.; Jiang, C. A novel true triaxial apparatus to study the geomechanical and fluid flow aspects of energy exploitations in geological formations. Rock Mech. Rock Eng. 2016, 49, 4647–4659. [Google Scholar] [CrossRef]
- Yin, L.J.; Gong, Q.M.; Ma, H.S.; Zhao, J.; Zhao, X.B. Use of indentation tests to study the influence of confining stress on rock fragmentation by a TBM cutter. Int. J. Rock Mech. Min. Sci. 2014, 72, 261–276. [Google Scholar] [CrossRef]
- Gertsch, R.; Gertsch, L.; Rostami, J. DISC cutting tests in Colorado red granite: Implications for TBM performance prediction. Int. J. Rock Mech. Min. Sci. 2007, 44, 238–246. [Google Scholar] [CrossRef]
- Bejari, H.; Hamidi, J.K. Simultaneous effects of joint spacing and orientation on TBM cutting efficiency in jointed rock masses. Rock Mech. Rock Eng. 2013, 46, 897–907. [Google Scholar] [CrossRef]
Figure 1.
A true triaxial geophysical apparatus used in this study.
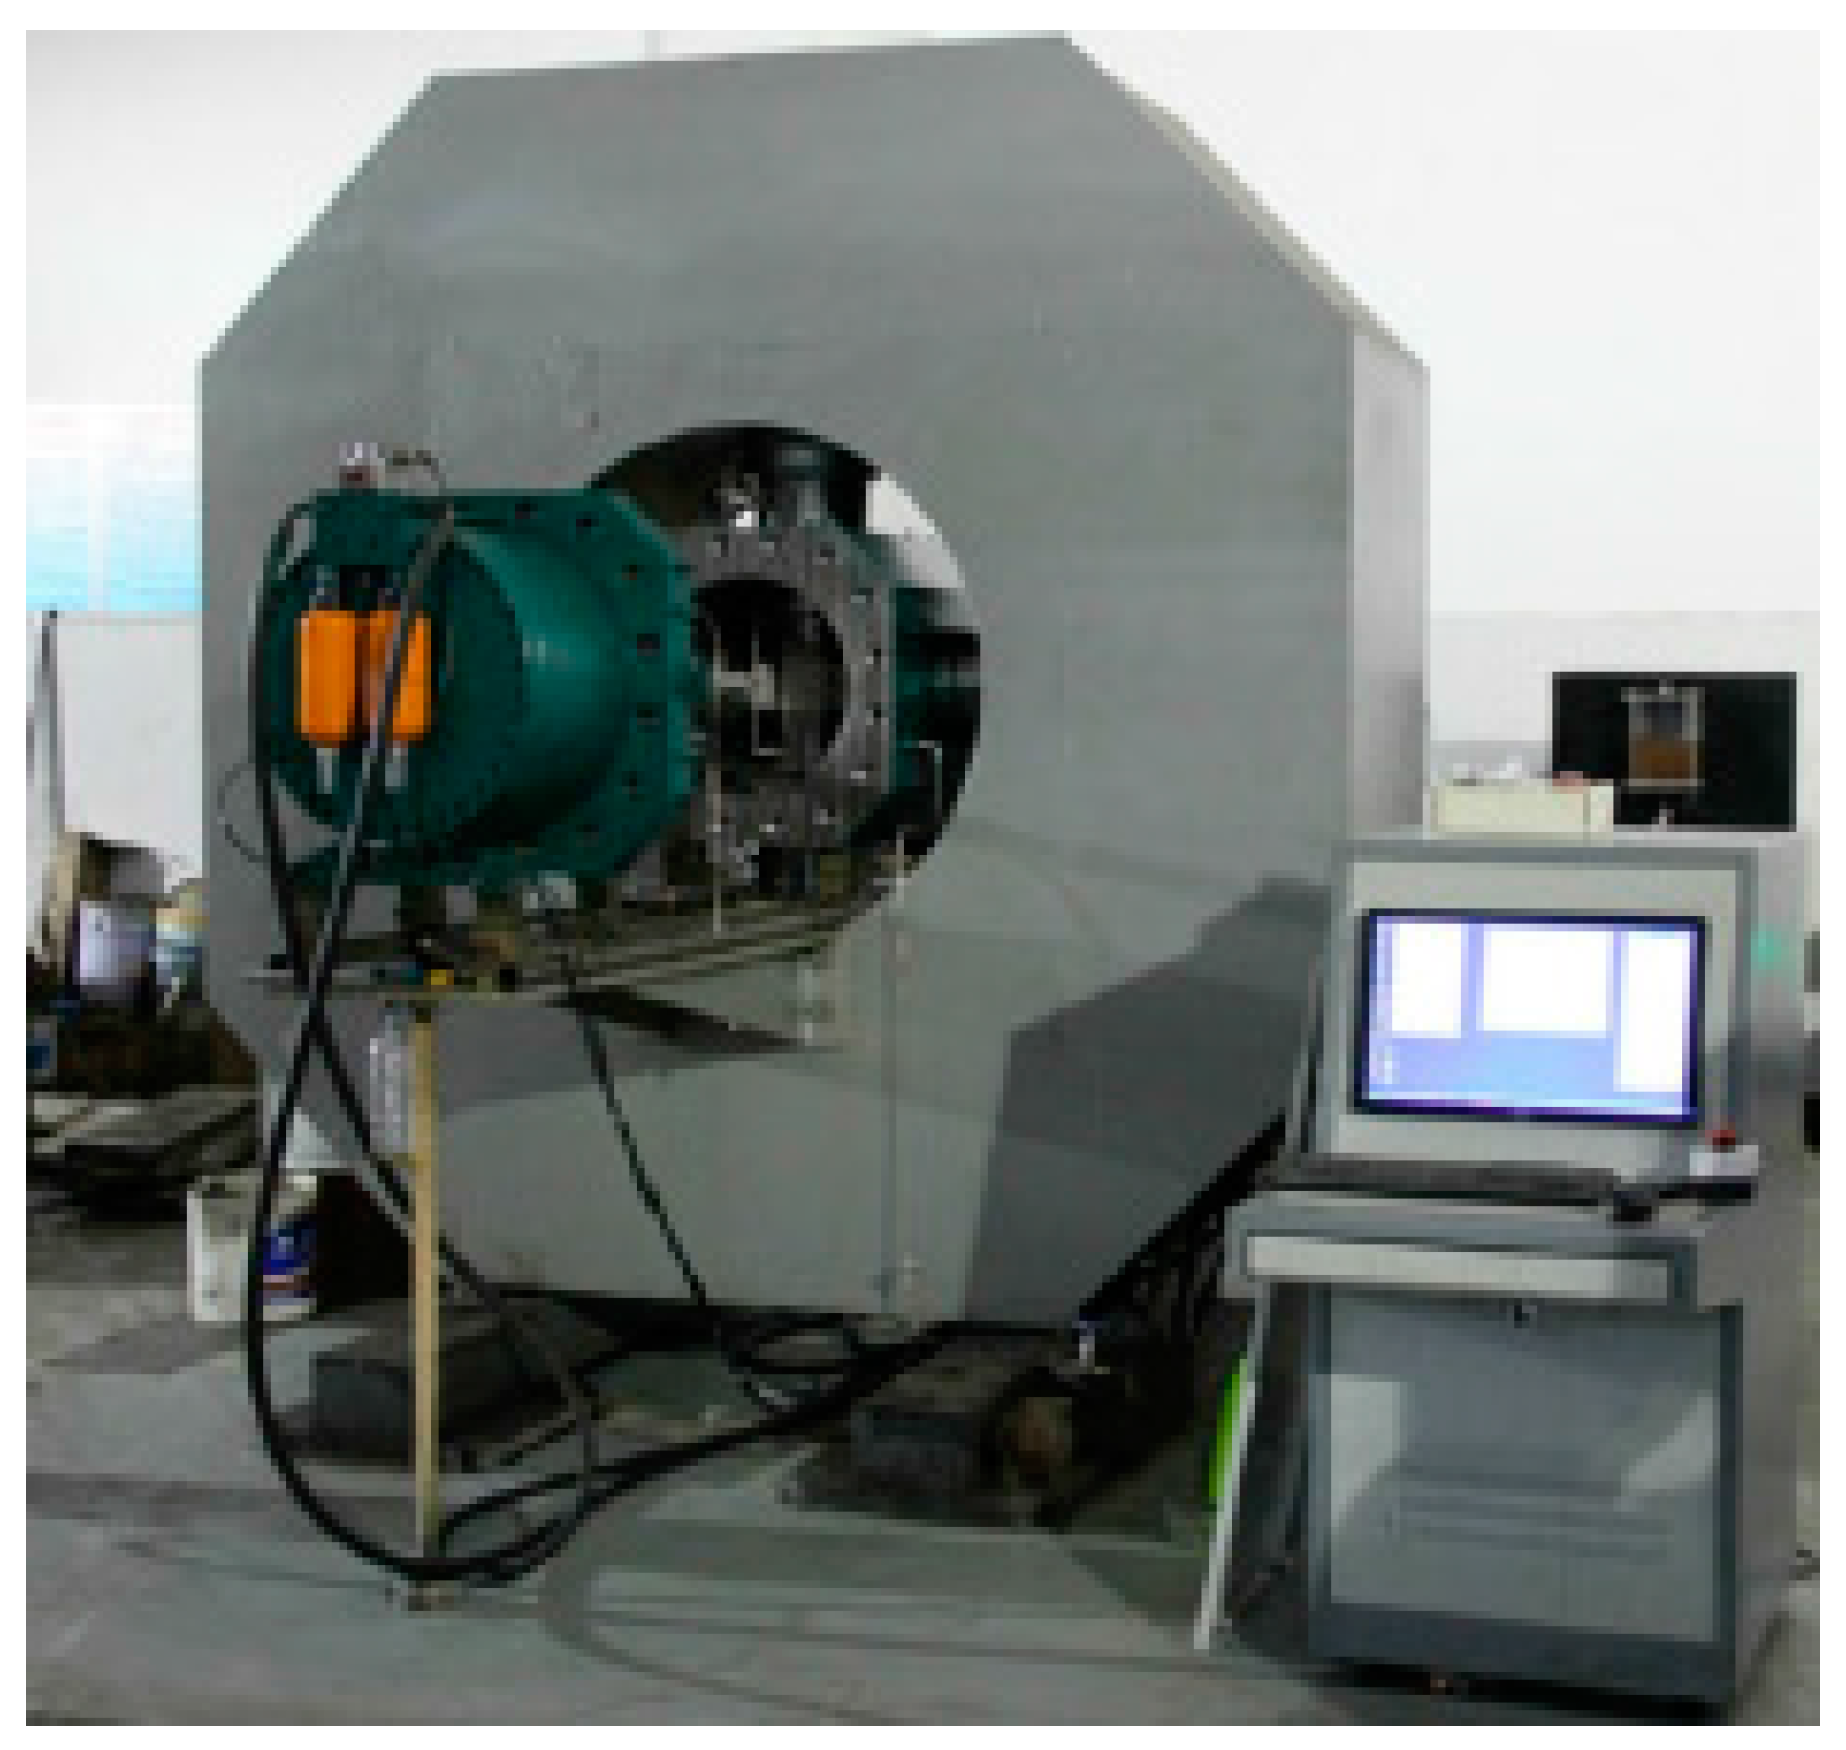
Figure 2.
Dimensions and cross section of tunnel boring machine (TBM) disc cutters (mm).
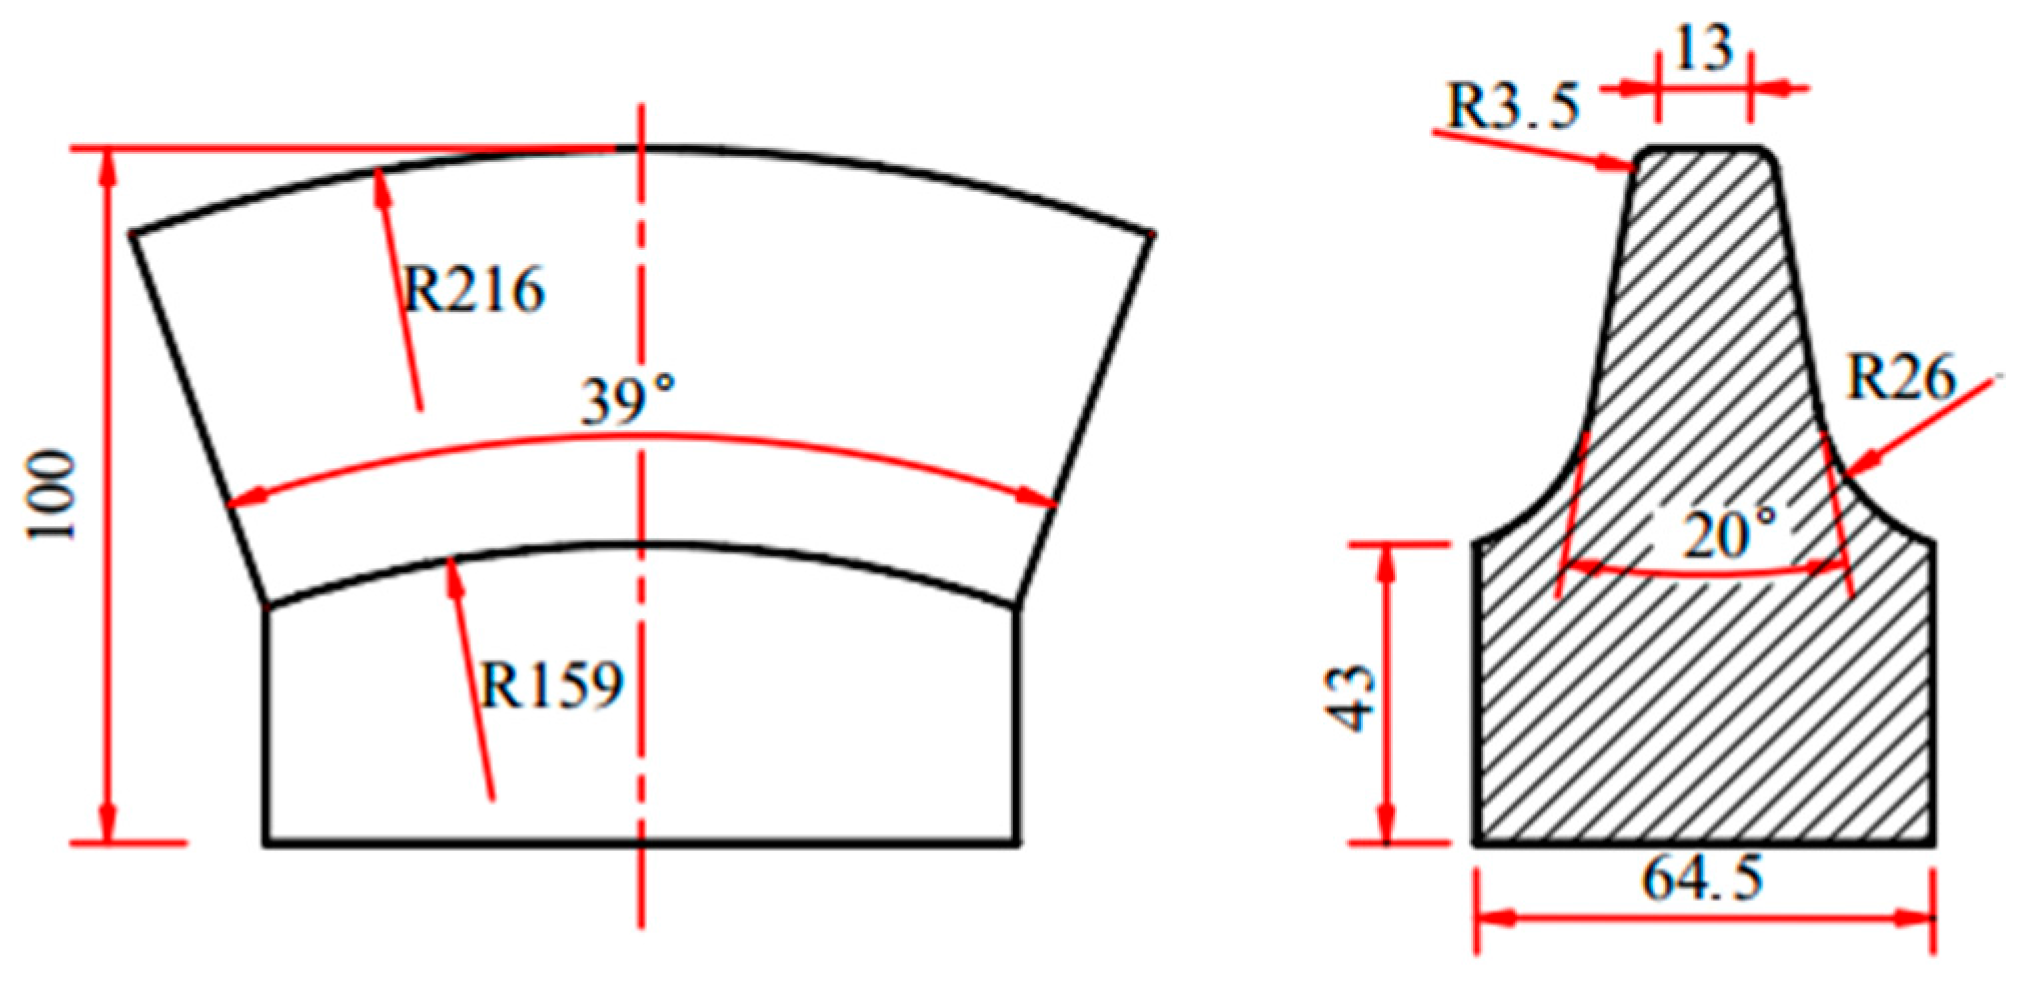
Figure 3.
The fixed-base surface profilometer (ST150) used in this study (Nanovea Company, Irvine, USA).
Figure 3.
The fixed-base surface profilometer (ST150) used in this study (Nanovea Company, Irvine, USA).

Figure 4.
Schematic representation of penetration test for TBM disc cutters.

Figure 5.
A typical fractured surface.
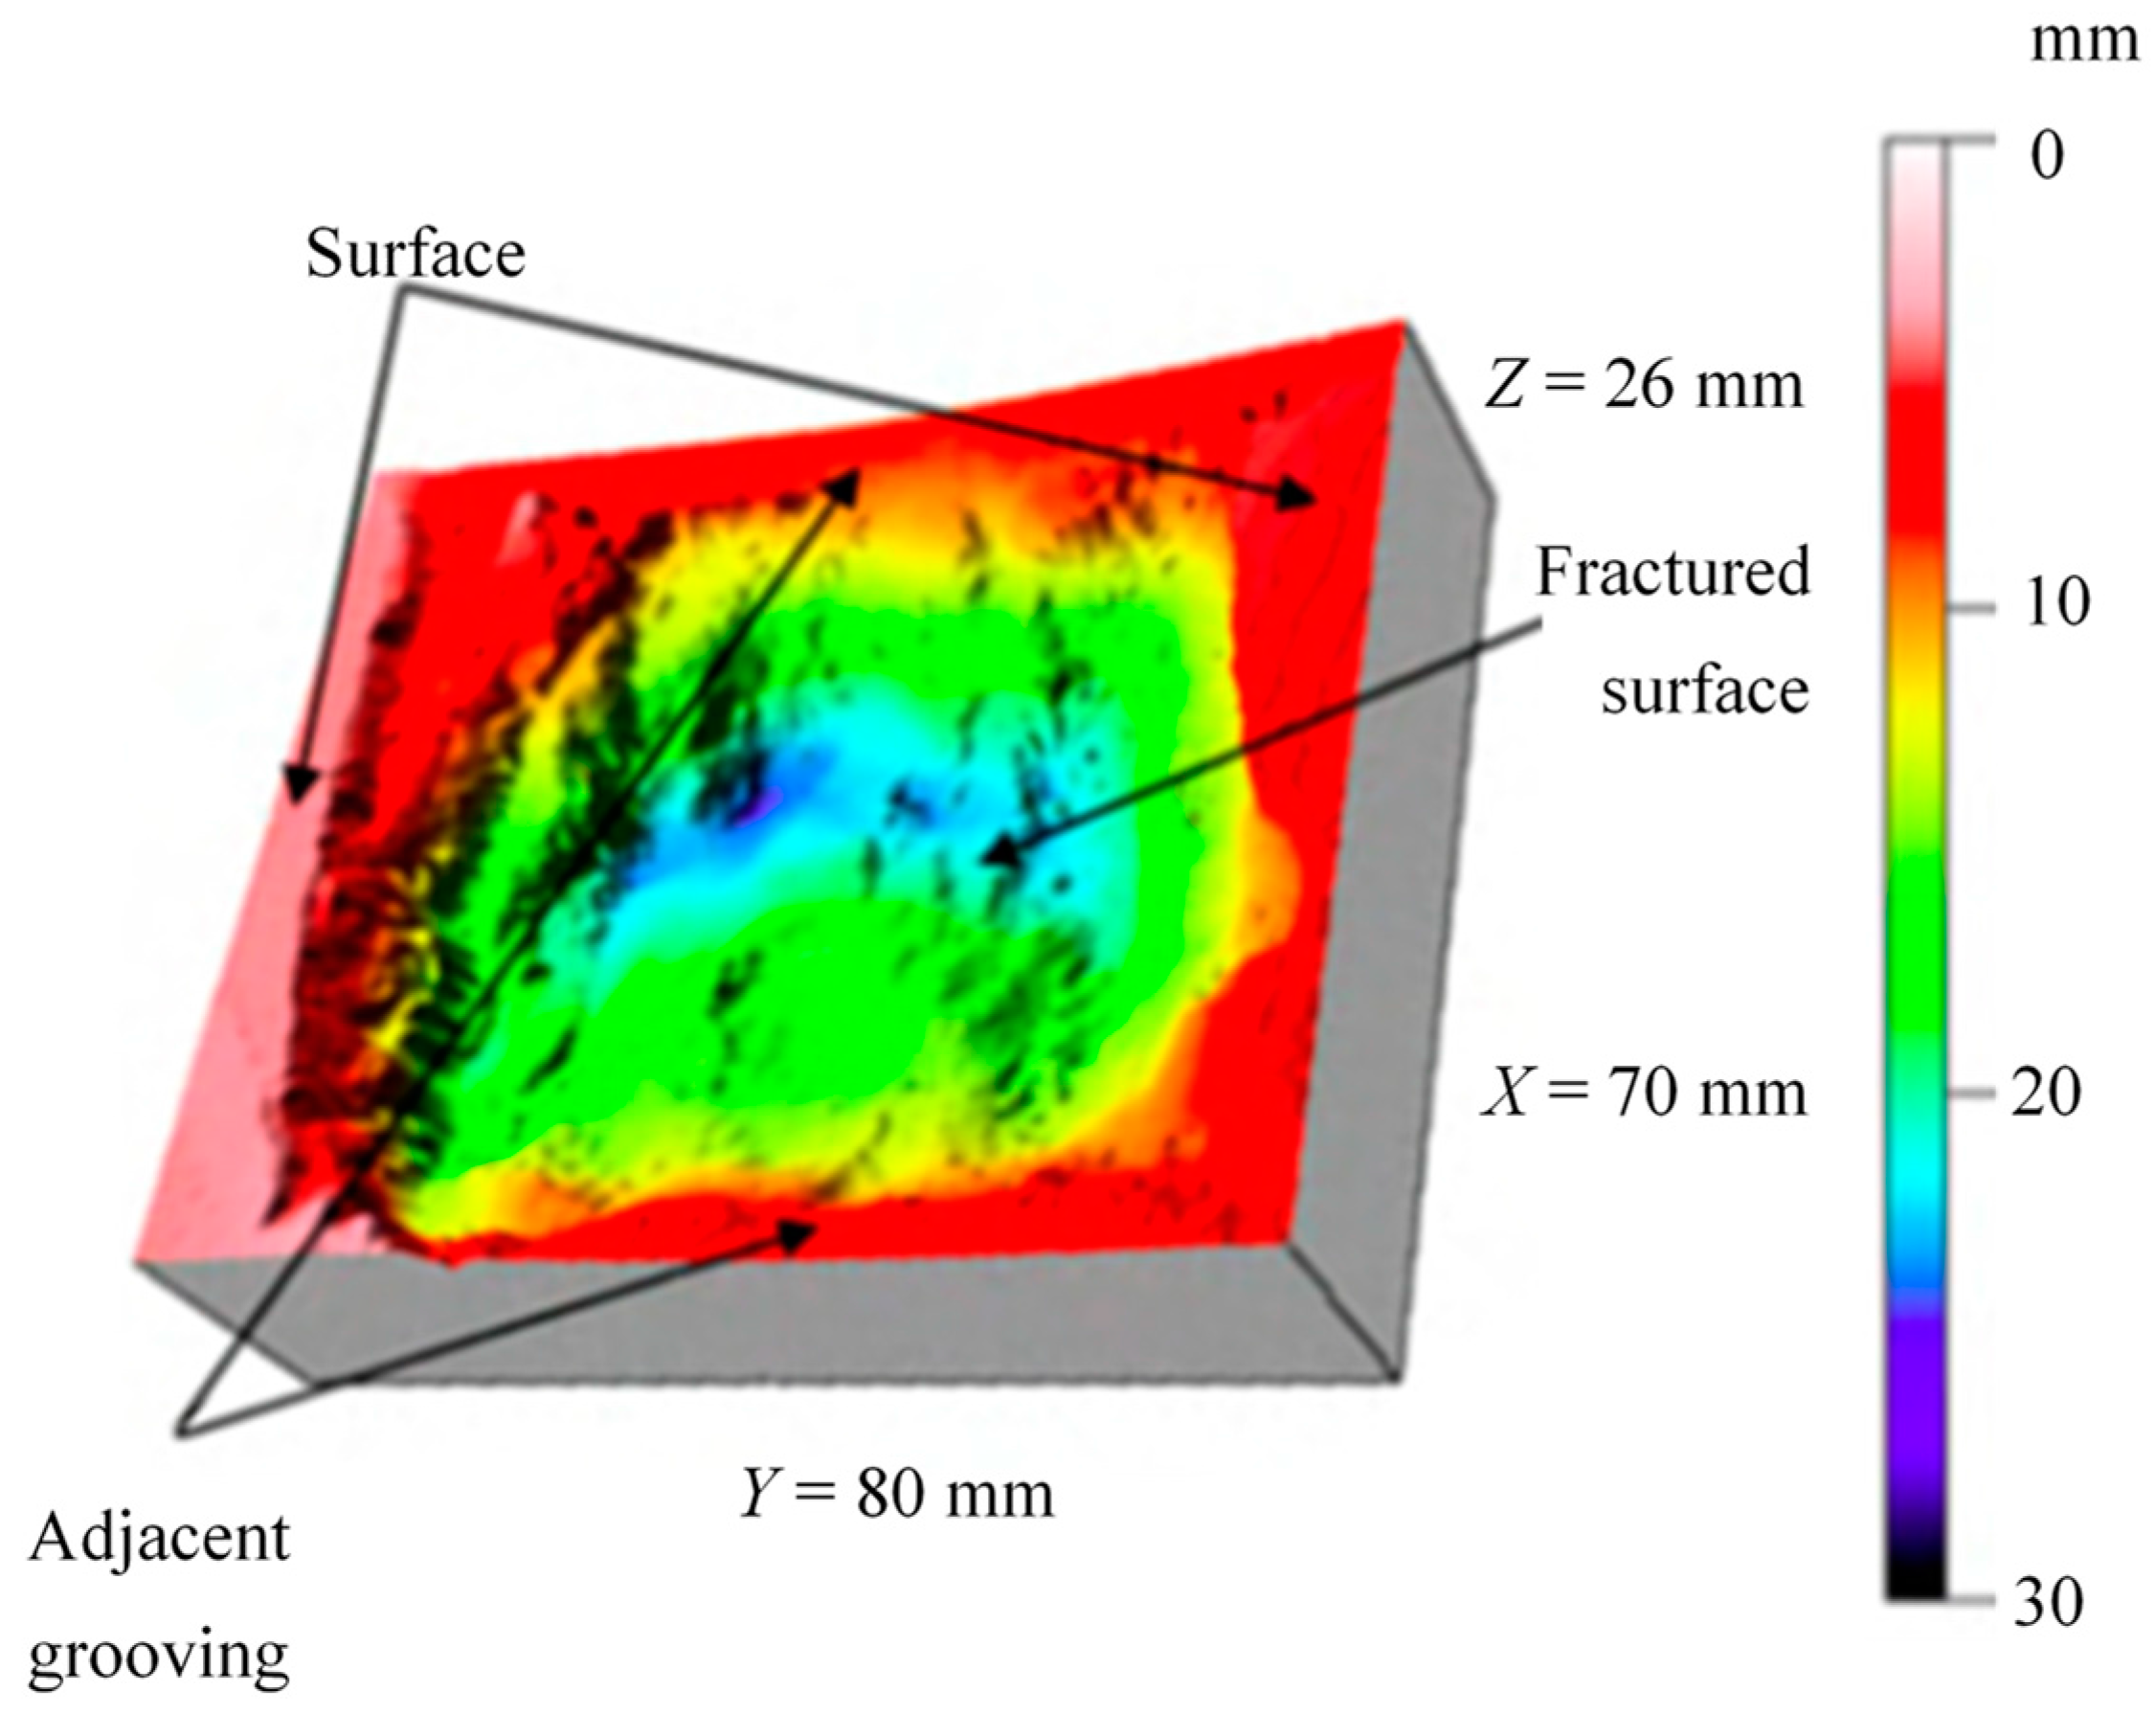
Figure 6.
Variations of fractured surface with increase of major confining pressure (σ2), while minor confining pressure (σ1) is constant at 5 MPa.
Figure 6.
Variations of fractured surface with increase of major confining pressure (σ2), while minor confining pressure (σ1) is constant at 5 MPa.

Figure 7.
Variations of fractured surface with increase of σ1 while σ2 is constant at 25 MPa.
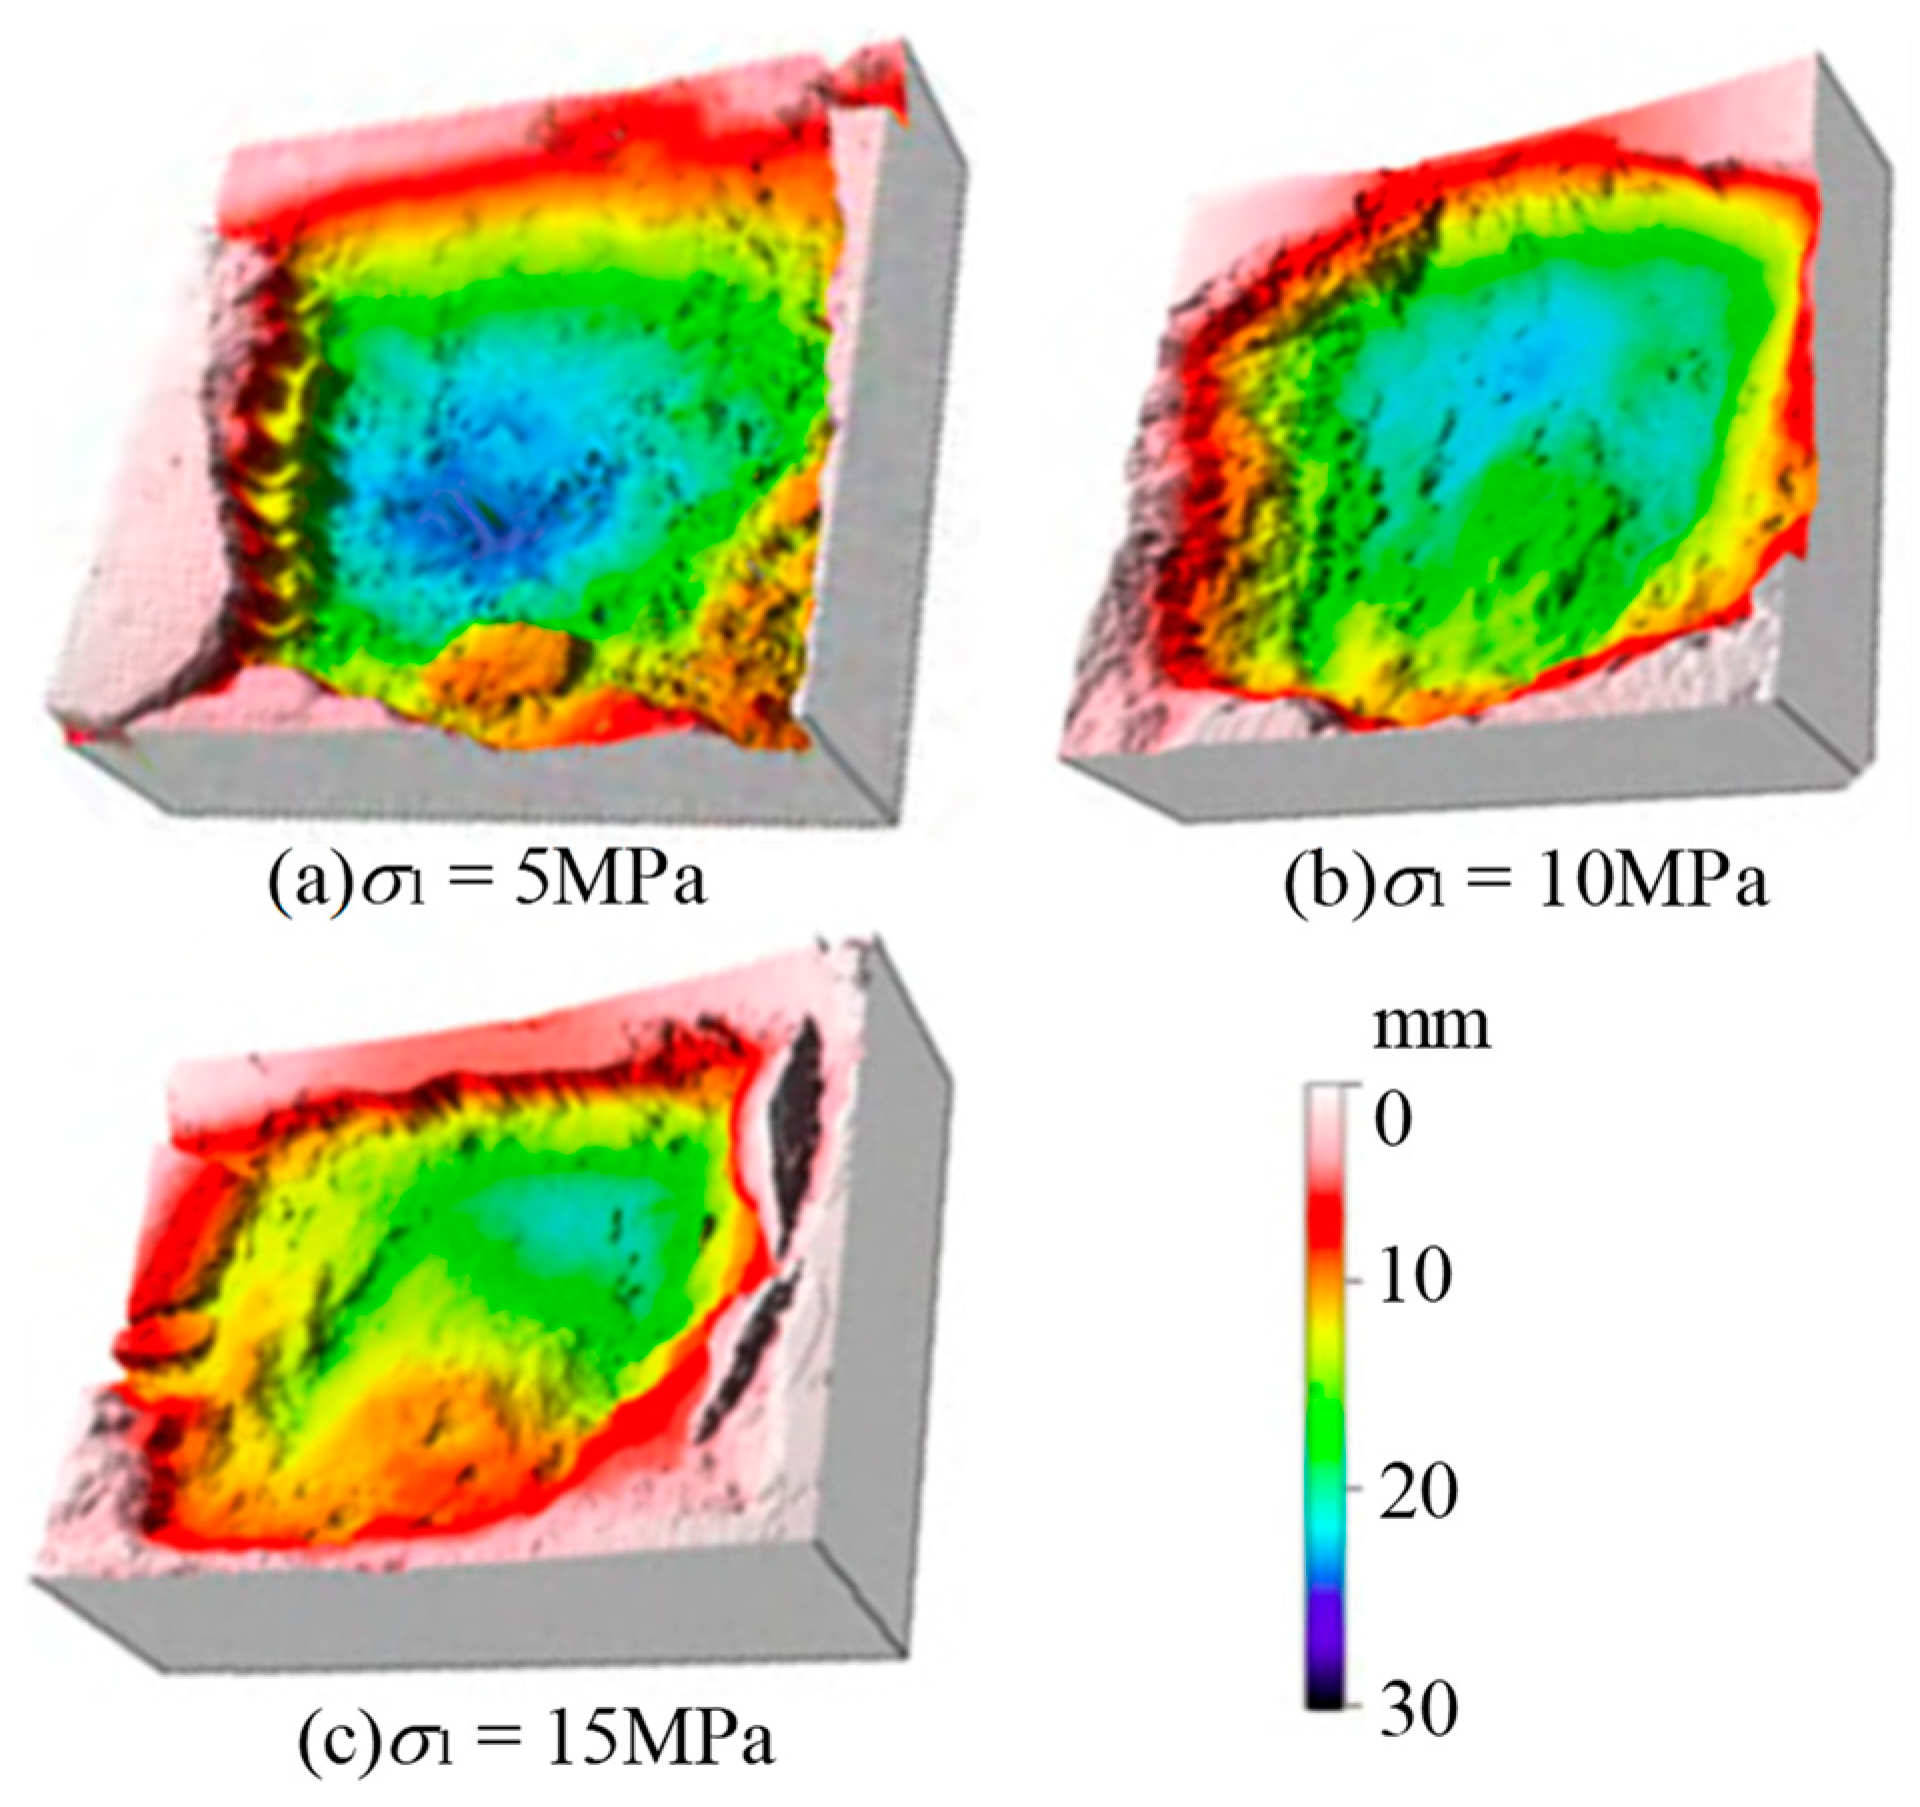
Figure 8.
Crack development in the cross section with increase of σ2, while σ1 is 5 MPa.

Figure 9.
Crack development in the cross section with increase of σ1, while σ2 is 20 MPa.

Figure 10.
Penetration energy under different confining pressure levels.

Figure 11.
Volume of fractured surface under different confining pressures.

Figure 12.
Specific energy efficiency under different confining pressures.

Table 1.
Values of confining pressure for three different groups.
| σ1 (MPa) | σ2 (MPa) |
|---|---|
| 5 | 5, 10, 15, 20, 25 |
| 10 | 10, 15, 20, 25 |
| 15 | 15, 20, 25 |
© 2018 by the authors. Licensee MDPI, Basel, Switzerland. This article is an open access article distributed under the terms and conditions of the Creative Commons Attribution (CC BY) license (http://creativecommons.org/licenses/by/4.0/).
Share and Cite
MDPI and ACS Style
Chen, Y.; Song, C. Rock Fragmentation Characteristics by TBM Cutting and Efficiency under Bi-Lateral Confinement. Appl. Sci. 2018, 8, 498. https://doi.org/10.3390/app8040498
AMA Style
Chen Y, Song C. Rock Fragmentation Characteristics by TBM Cutting and Efficiency under Bi-Lateral Confinement. Applied Sciences. 2018; 8(4):498. https://doi.org/10.3390/app8040498
Chicago/Turabian StyleChen, Yulong, and Chenpeng Song. 2018. "Rock Fragmentation Characteristics by TBM Cutting and Efficiency under Bi-Lateral Confinement" Applied Sciences 8, no. 4: 498. https://doi.org/10.3390/app8040498
Note that from the first issue of 2016, this journal uses article numbers instead of page numbers. See further details here.