Recent Progress on Aberration Compensation and Coherent Noise Suppression in Digital Holography


1
Key Lab of NC Machine Tools and Integrated Manufacturing Equipment of the Education Ministry & Key Lab of Mechanical Manufacturing Equipment of Shaanxi Province, Xi’an University of Technology, Xi’an 710048, China
2
School of Mechanical Engineering, Xi’an Jiaotong University, Xi’an 710049, China
*
Authors to whom correspondence should be addressed.
Appl. Sci. 2018, 8(3), 444; https://doi.org/10.3390/app8030444
Submission received: 30 December 2017
/
Revised: 20 February 2018
/
Accepted: 12 March 2018
/
Published: 15 March 2018
(This article belongs to the Special Issue Holography and 3D Imaging: Tomorrows Ultimate Experience)
Abstract
:Digital holographic microscopy (DHM) is a topographic measurement technique that permits full-field, nondestructive, dynamic, quantitative amplitude, and phase-contrast imaging. The technique may realize the lateral resolution with submicron scale and the longitudinal resolution with subnanometer scale, respectively. Improving imaging quality has always been the research focus in DHM since it has a direct effect on the precise topographic measurement. In this paper, the recent progress on phase aberration compensation and coherent noise suppression is reviewed. Included in this review are the hologram spectrum’s centering judgment methods of side band in tilt phase error compensation, the physical and numerical compensation methods in phase aberration compensation, and the single-shot digital process methods in coherent noise suppression. The summaries and analyses for these approaches can contribute to improving the imaging quality and reducing the measurement error of DHM, which will further promote the wider applications of DHM in the topographic measurement fields, such as biology and micro-electro mechanical systems.
1. Introduction
Digital holographic microscopy (DHM) is a topographic measurement technique, which permits full-field, nondestructive, dynamic, quantitative amplitude, and phase-contrast imaging. The DHM, combining holography with microscopy, enables the information of amplitude and phase of the whole object to be recorded by the imaging sensor. The object wavefront is then retrieved by numerical reconstruction. Thus, the object topography can be obtained. Its lateral and longitudinal resolution may reach submicron and subnanometer scale, respectively. The technique has played an important role in different fields of application, such as micro-electro mechanical systems, microintegrated circuits, and the biomedical sciences. In 1997, Yamaguchi and Zhang [1] applied phase-shifting interferometry to digital holography (DH) and reconstructed an arbitrary cross section of a 3D object, in which the in-line overlapping problem was resolved. In 1998, Zhang et al. [2] introduced the phase-shifting DH to microscopic measurement. In 1999, Takaki et al. [3] and Kim et al. [4] presented the hybrid DHM and wavelength-scanning DH technique, respectively, which extended the measured to microscopic object. At the same time, Cuche’s team [5] realized the DHM configuration by inserting a microscope objective (MO) in the object optical path, thus obtaining an amplified image instead of specimen itself. The adopted off-axis configuration recovered the amplitude and phase information of the resolution chart simultaneously, and its lateral and longitudinal resolution reached submicron and nanometer scale, respectively [5,6].
In recent years, scholars have carried out much research on improving the imaging quality of DHM, which is a key step to reconstructing a topographic image with higher precision [7,8,9,10,11,12,13,14]. In order to suppress the zero-order and the twin-image, the phase-shifting method and frequency filter method provide a notable solution, avoiding the overlapping of the reconstructed image [1,15,16,17,18,19,20,21]. Due to a phase distortion introduced by the MO, physical or numerical compensation methods may be adopted to eliminate the quadratic phase distortion and other phase distortions [22,23,24,25,26,27,28,29,30]. Because the coherent source produces the inherent coherent noise in the reconstructed image, the low-coherent resource, multiplexing holograms methods, and digital processing methods have been studied to improve the imaging quality, respectively [31,32,33,34,35,36,37,38]. The lateral resolution is related with the wavelength and the MO’s numerical aperture. Therefore, the synthetic aperture method [39,40,41,42,43] and structured illumination approach [44,45,46,47] are utilized to enhance the resolution when the wavelength remains unchanged. In addition, when the specimen’s depth change is larger than the optical path of a wavelength, the phase unwrapping algorithms are adopted to obtain the real phase for 2π ambiguity problem [48,49,50], in which multi-wavelength phase unwrapping methods permit larger synthetic wavelengths to unwrap [51,52,53].
In the paper, imaging quality improvement is performed in DHM, aimed at phase aberration compensation and coherent noise suppression. In Section 2, the basic principle of DHM is introduced. In Section 3, the tilt phase error compensation is provided. In Section 4 the phase aberration compensation is summarized. In Section 5, the coherent noise suppression is presented. The progress and problems of the related methods are analyzed and discussed.
2. Basic Principle of DHM
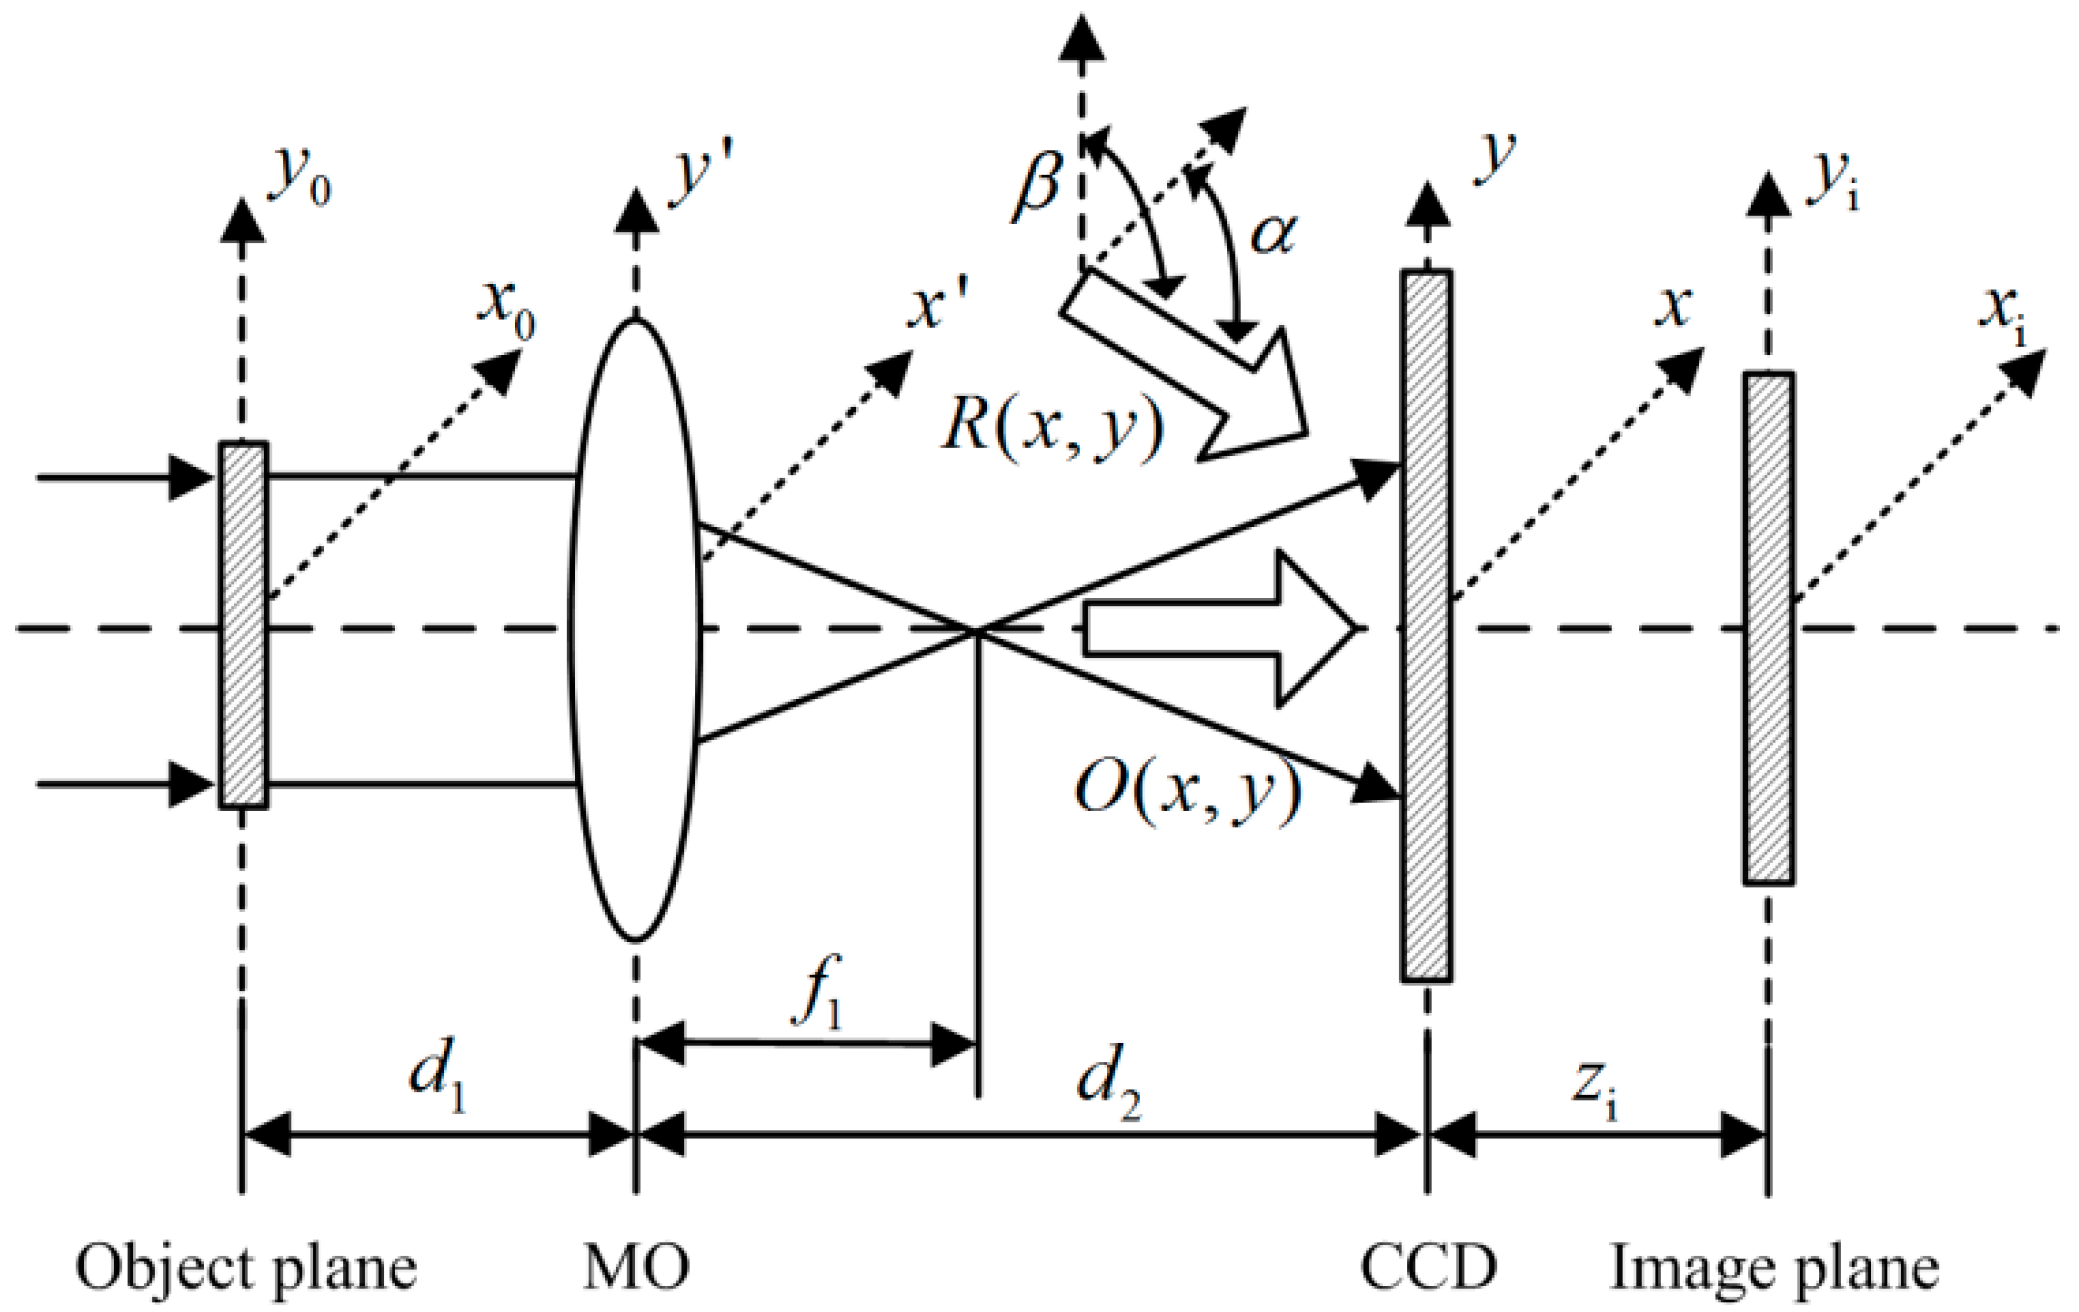
DHM allows for inserting a MO with different magnification in the object branch to enhance the lateral resolution, thus the interference happens between the spherical object wave and the plane reference wave in a pre-amplification configuration. The schematic of off-axis DHM pre-amplification configuration is shown in Figure 1. O(x,y) and R(x,y) represent the object wave and the reference wave, respectively. The object light propagates from the object input plane (x0,y0) to the CCD output plane (x,y), through the MO plane (x’,y’).The quadratic phase factor introduced by MO is expressed as [54]:
where k is the wave number 2π/λ, λ is the wavelength of the laser source, and f1 is the focal length of MO. The wave field propagation process is described based on the Fresnel diffraction. The object field O0(x0,y0) goes through two Fresnel transformations, from input plane to MO over the distance d1, further to the output plane over the distance d2. The output field O(x,y) is derived as [55]:
where
The interferogram produced by the output object wave and the reference wave is captured by CCD. Its intensity is expressed as:
where the asterisk denotes the complex conjugate. The reference wave is written as:
where α and β are the incident angle with respect to the x axis and y axis, respectively. In Equation (4), the first two terms are the intensity terms corresponding to the zero-order image. The third term and the fourth term are object and reference interference terms, respectively, including the amplitude and phase information. The zero-order image and conjugate image may disturb the object image, further influencing adversely on the imaging quality of the reconstructed image. Hence, the frequency filtering only retains the object image. The new hologram is written as:
A digital reference plane wave B is introduced to compensate the reference wave’s conjugate in the new hologram. It requires that B should possess the identical tilt angle with the physical wave R. Equation (6) is transformed as:
It is seen from Equation (7) that it only recovers the CCD output field, instead of the aerial image produced by the MO. The output field in the image plane (xi,yi) should be obtained by Fresnel transform from the CCD plane to the image plane over the distance zi, then it is expressed as:
where A is given as:
and the corresponding Fourier transform frequency is written as:
Finally, the intensity distribution I and the phase distribution φ of the reconstructed image are described as follows:
where Im[.] and Re[.] denote the imaginary and real parts, respectively. This realizes the reconstruction in the DH pre-amplification configuration and obtains the quantitative intensity and phase information.
3. Tilt Phase Error Compensation
The angle between the object and reference wave brings about the tilt phase error, though the off-axis configuration separates the zero-order and twin-images spatially, which will result in the appearance of tilt in the topography of the reconstructed image. In recent years, many scholars have conducted research on the compensation of the tilt phase error to improve the imaging quality. In 1999, Cuche et al. [6] proposed a digital reference wave method. The new hologram IH’ only includes original image information and a reference wave’s conjugate after frequency filtering, and it multiplies by a digital reference wave that is the same as a physical reference wave to eliminate the tilt phase error. The method has been widely applied [5,23,56,57].
Tilt phase error compensation was discussed initially in interferometry. In 1982, Takeda et al. [58] proposed the Fourier transform method, in which the input fringe pattern was represented by:
where a(x,y) was the background intensity, b(x,y) was the visibility of the fringes, fx0 and fy0 were the spatial carrier frequencies in the x and y directions, respectively, φ(x,y) was the modulating phase, and c(x,y) was given as:
The Fourier transform of Equation (11) was given as:
where A(fx,fy), C(fx − fx0,fy − fy0) and C*(fx + fx0,fy + fy0) were the Fourier transforms of a(x,y), c(x,y) and c*(x,y), respectively. Since the spatial variations of a(x,y), b(x,y) and φ(x,y) were slow compared with the spatial carrier frequency fx0 and fy0, the Fourier spectra in Equation (13) were separated by the carrier frequency fx0 and fy0. Either of the two spectra on the carrier was translated by f0 on the frequency axis toward the origin to realize the tilt phase error elimination. After that, Cuche et al. [16] utilized the spectrum translation method around year of 2000. The method corresponds to the multiplication of a plane wave in the digital reference wave method [23,26,59].
In 2003, Ferraro et al. [22] removed the tilt phase error by means of the phase mask. Compared with other methods, the proposed method first found the correcting wave front in the hologram plane, not directly at the reconstructed plane. The reconstructed phases, relating to the recorded hologram and correcting wave front, were subtracted to obtain the compensated contrast-phase image, in which the correcting wave for tilt error compensation was given by the adjustment of the mask’s parameters.
The surface fitting method was presented by Colomb et al. [23,60] in 2006 to compensate phase error. A model of 2D standard or Zernike polynomials was selected to fit a blank region of the reconstructed image, and then a surface fitting could obtain their parameters, thus realizing the phase error compensation. However, the fitted blank region does not include the total phase information, which would result in the residual error.
In 2009, Cho et al. [56] presented a numerical procedure of a tilt phase aberration compensation by interference patterns in in-line configuration. Because the tilt aberration had no effect on the phase of the sample, the parameters of the tilt phase may be extracted from the period of interference patterns in the reconstructed image. The corrected phase was computed and the real phase was recovered. The method uses only one hologram to minimize the tilt aberration in in-line DH. But for the interference fringe with a higher density, the application of this method would be restricted.
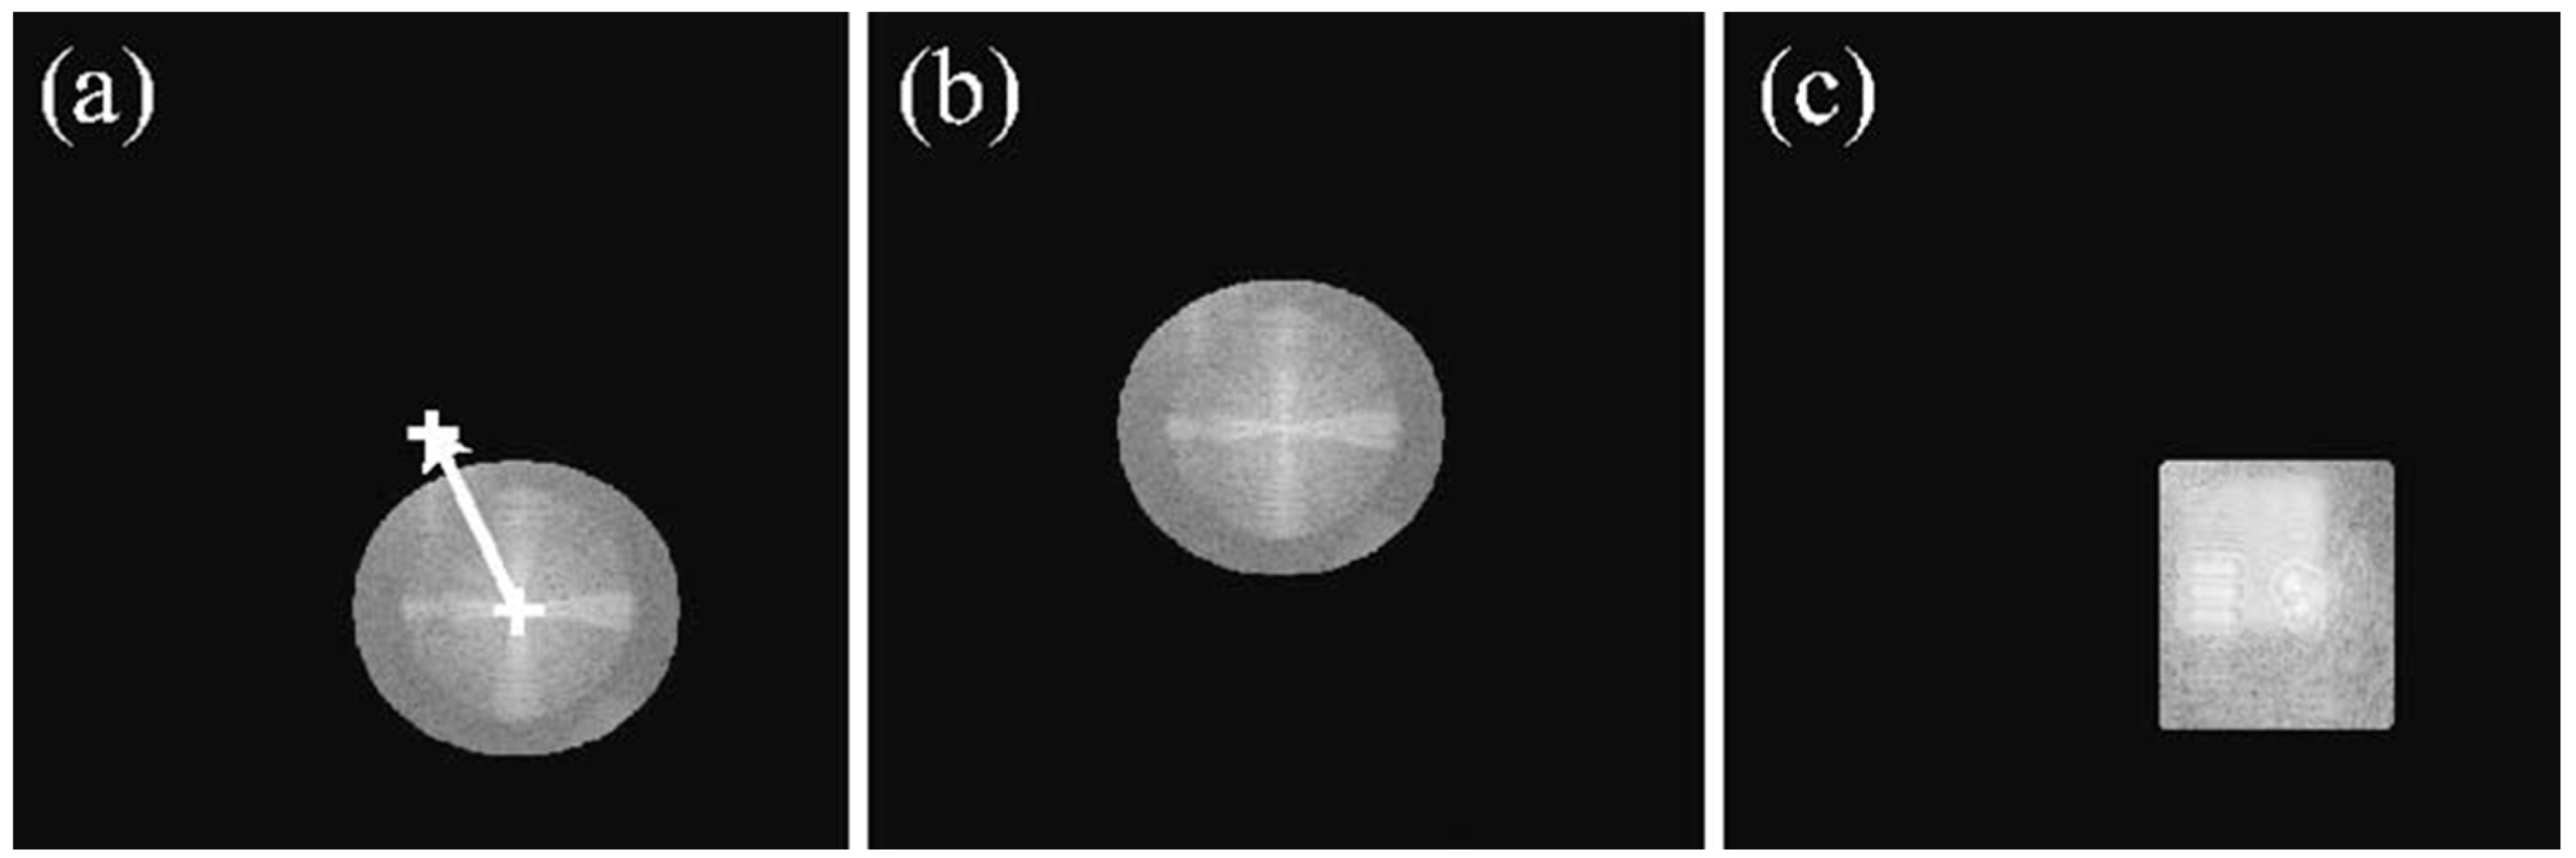
In a word, the digital reference wave method and the spectrum translation method are the two most common approaches to compensate the tilt phase aberration, in which they need not obtain the mathematic model of phase distortion in advance [5,22] and they avoid the problems of inaccurate fitting results due to the surface profile [23,60]. However, the two methods first require the hologram spectrum’s centering judgment of side band. One obtains the tilt parameters by means of spectrum centering, another uses the spectrum centering as the basis for its translation. Hence, the correct hologram spectrum’s centering judgment of side band plays a critical role in the two approaches. Its realization is mainly to select the spectrum’s amplitude maximum [16,23,26,57,59]. In effect, it is difficult to determine the specimen spectrum’s center location of side band simply by the amplitude maximum in the pre-amplification configuration [23,26,59]. Figure 2 gives the procedure of spectrum centering in the spectrum translation method. The correct spectrum centering, labeled by the white cross, was obtained by the filtered spectrum’s amplitude maximum, as shown in Figure 2a. The arrow represents the shift between the amplitude maximum of the frequencies associated with the virtual image and the center of the entire spectrum. The tilt phase error can be suppressed by translating the filtered spectrum in the frequency domain, as shown in Figure 2b. Due to the presence of the quadratic phase aberration induced by the MO, the amplitude distribution of the spectrum appeared to spread, as shown in Figure 2c. The nonpunctual central frequency resulted in the failure to judge the spectrum center, which differed from the judging result in Figure 2a. However, it was pointed out by Colomb et al. [23] that the judgment of the spectrum’s amplitude maximum was adversely affected by the shifting accuracy and the central frequency spreading. They did not provide the solution to obtain the correct spectrum’s centering of side band in pre-amplification configuration.
In order to obtain the correct spectrum centering, some scholars have developed the research on the carrier frequency elimination methods. In 2010, Fan et al. [61] analyzed that if the carrier frequencies were not an integer multiple of the frequency interval, the peak coordinates of C and C* in Equation (13) would not be equal to the carrier frequencies. Aimed at the problem, a carrier frequency judgment method by means of a spectral centroid was presented to suppress the carrier removal error. The method was applied for the case that the carrier frequencies were not an integer multiple of the frequency interval. Yet for the asymmetric spectrum, the spectral centroid judgment shows randomness and instability because the carrier frequencies estimated are affected by the noise distribution in the fringe pattern.
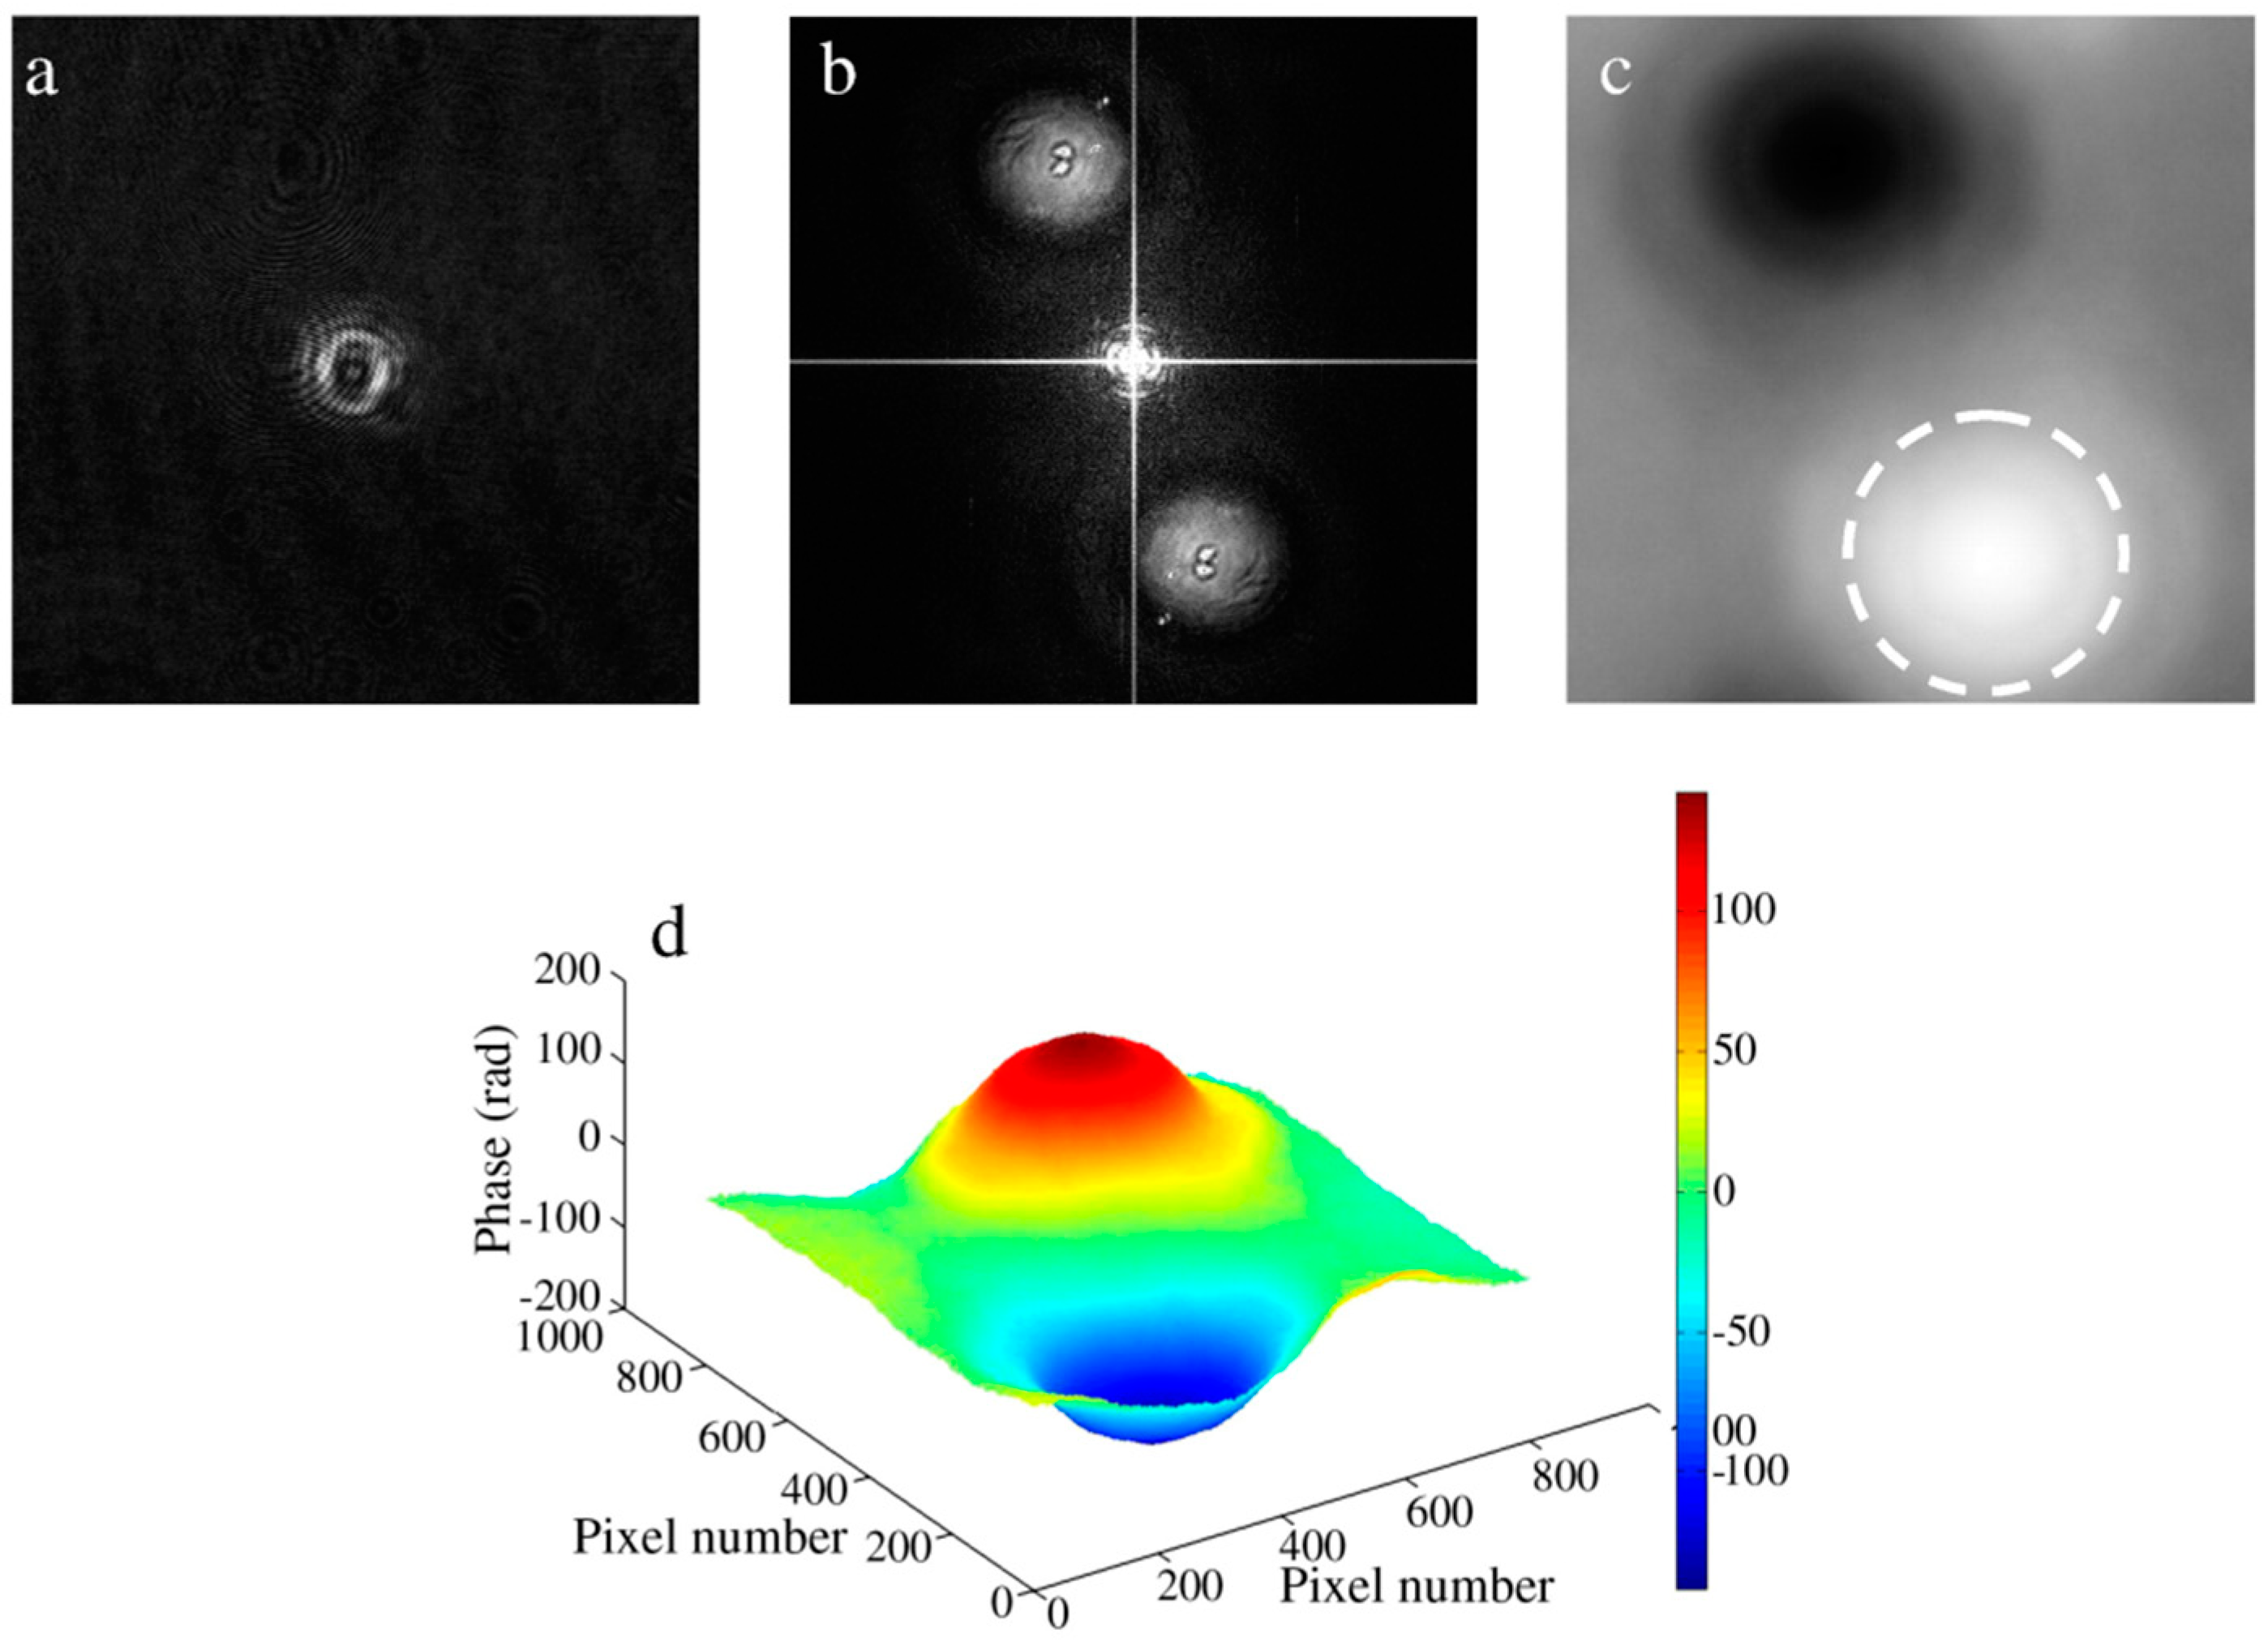
The argument judgment method, proposed by Cui et al. in 2011 [59], selects the argument maximum of the hologram spectrum as the spectrum center to remove the tilt aberration. It was found from the experimental results that the argument maximum corresponded to the carrier frequencies, as shown in Figure 3. Figure 3b–d are the modulus image, argument image, and the three-dimensional argument distribution of the hologram spectrum, respectively. Fortunately, there always existed a maximum on the argument distribution, as shown in Figure 3c,d. Selecting it as the center, the filtered hologram was translated down to the origin of coordinates. The phase contrast imaging of the cervical carcinoma cells demonstrated the method.
In 2014, Du et al. [62] presented a carrier frequency elimination method based on interferogram zero padding and a fast Fourier transform. The zero padding in the spatial domain of the discretization interferogram could achieve up-sampling in the frequency domain, which provided the solution for removing the residual tilt aberration under the condition that the carrier-frequency of carrier interferogram usually were not equal to an integer multiple of the Nyquist basic frequency. It was demonstrated that the carrier-removal error was reduced to 1/k of that in the traditional Fourier transform method, where k was sampling factor. However, the method comes at the expense of the computation due to zero padding.
In 2016, Liu et al. [55] proposed an approach locating the center of the side band based on the unwrapped phase maximum of spectrum to compensate tilt phase aberration in the DH pre-amplification configuration. The filtered Fourier spectrum of the hologram at the image plane was composed of the 2D convolution between a quadratic phase function with translation and the Fourier transform of the sample. Due to the quadratic phase function caused by the MO, the amplitude of the hologram spectrum in the absence of a sample, spread and turned into the rectangle shape from a delta function, which would have a direct effect on the spectrum’s centering judgment. Whereas the Fourier spectrum of the hologram was a complex function, its unwrapped phase distribution always appeared at the extremum corresponding to the carrier frequency. The correct hologram spectrum’s center location of side band can be obtained by judging its unwrapped phase maximum. The experiment selected the microhole array, phase grating, and a pair of concave and convex phase steps as samples. By comparison of the spectrum’s centering judgment results between amplitude maximum and unwrapped phase maximum, the feasibility of the presented method was demonstrated. Compared to the surface fitting approach, the proposed method has the simple and fast performance advantages, immune to the limitation of selecting a blank region in proximity to the sample.
4. Phase Aberration Compensation
According to the basic principle of DHM, the first term in Equation (3) is zero when CCD locates at the image plane. Thus Equation (2) may be simplified as:
where M0 is lateral magnification, i.e.,
and the constant A0 is written as:
Bringing Equations (5) and (14) into Equation (6), the filtered hologram is expressed as:
It is seen that there always exists the two main phase distortions in DHM, which reflects the difference between the reconstructed phase and the measured phase. The first-order phase distortion is caused by the noncoaxis between the object and reference waves in off-axis configuration. It is given as:
The quadratic phase distortion is introduced by MO and its expression is shown as:
The two distortions result in the tilt and curvature that occurred in the reconstructed phase. Therefore, it is essential to apply a compensation approach to remove the phase aberrations. The phase aberration compensation approaches may be divided into two categories that are physical and numerical compensation methods. The physical compensation methods allow the optical configuration to realize the phase distortion elimination, such as the double exposure method [22,63], the two same MOs inserted in the object and reference branches [25,26,29,64], and telecentric arrangement [28,30].
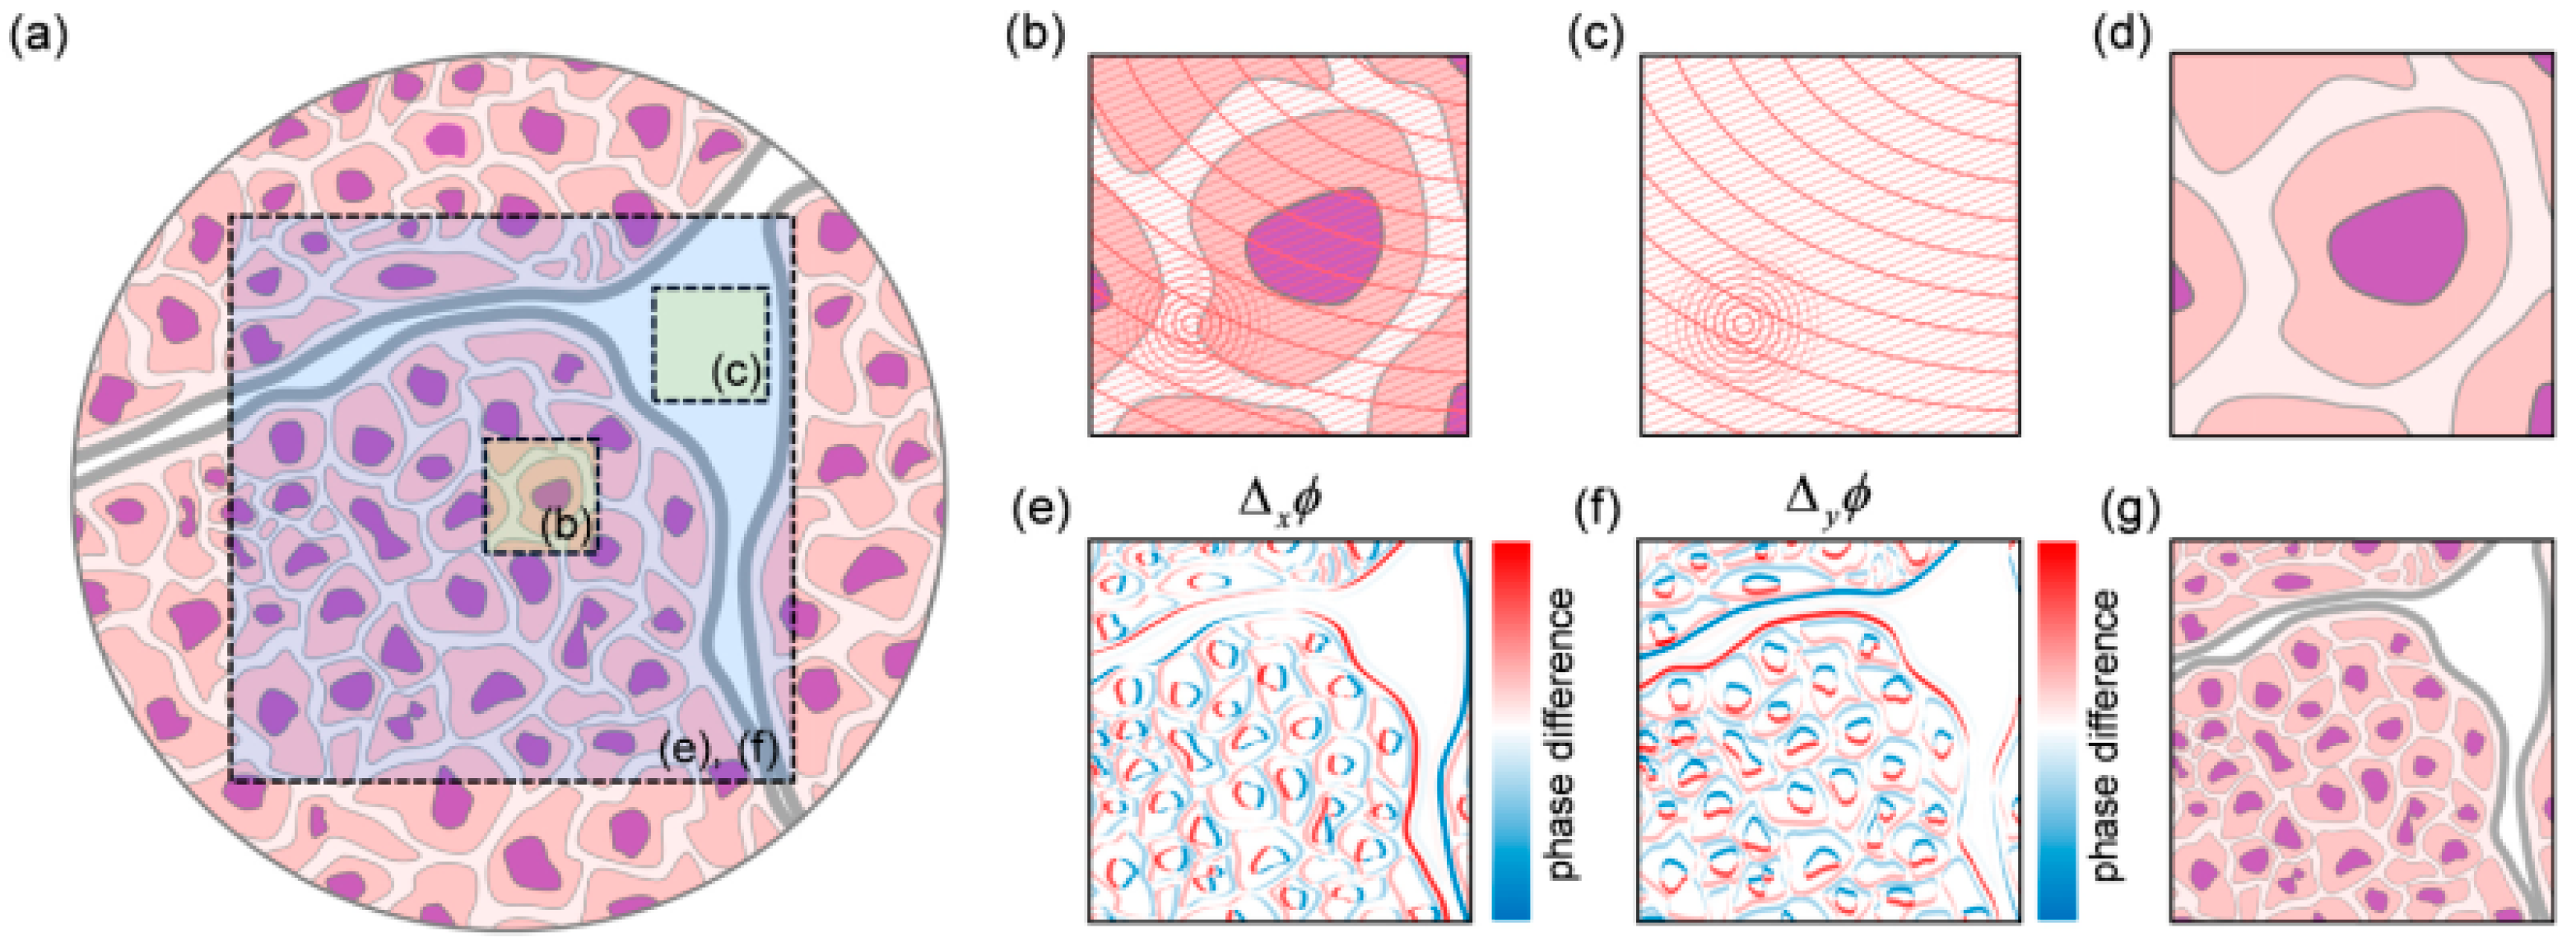
In 2003, Ferraro et al. [22] proposed the double exposure method, which required recording two holograms. One was an object hologram with a sample, another was a reference hologram with a phase distortion in absence of a sample. The two reconstructed phases were subtracted to compensate for the distortions introduced by the optical components. It is ensured that the optical configuration is strictly the same in the two recording processes. Subsequently, the principle analysis and the experimental demonstration were further performed by Zhou et al. in 2009 [63]. The double exposure method by background subtraction is simple and practical. However, the application of the method is restricted for the sample with high-spatial-frequency content since it needs to select a blank region in absence of a sample as the reference. Aiming at the problem, Choi et al. [65] presented an aberration compensation method using lateral shifting and spiral phase integration in 2017. Three holograms were captured by laterally shifting the samples in orthogonal directions. The subtraction of the original phase from the shifted phase images was completed to cancel the aberration out, as shown in Figure 4. Figure 4a shows the region selection results for the conventional background subtraction method and the shift differential method. In the conventional background subtraction method, a sample region in Figure 4b and a background region in Figure 4c are recorded. In the shift differential method, the sample region and its vertical and horizontal shifts are recorded. Figure 4b–d depicts the principle of the conventional background subtraction method, whereas Figure 4e–g provides the principle of shift differential method. It was shown that the presented method may be useful for measuring confluent samples, which was not available in the background subtraction method. But the requirement of the additional holograms restricted its application in dynamic measurement.
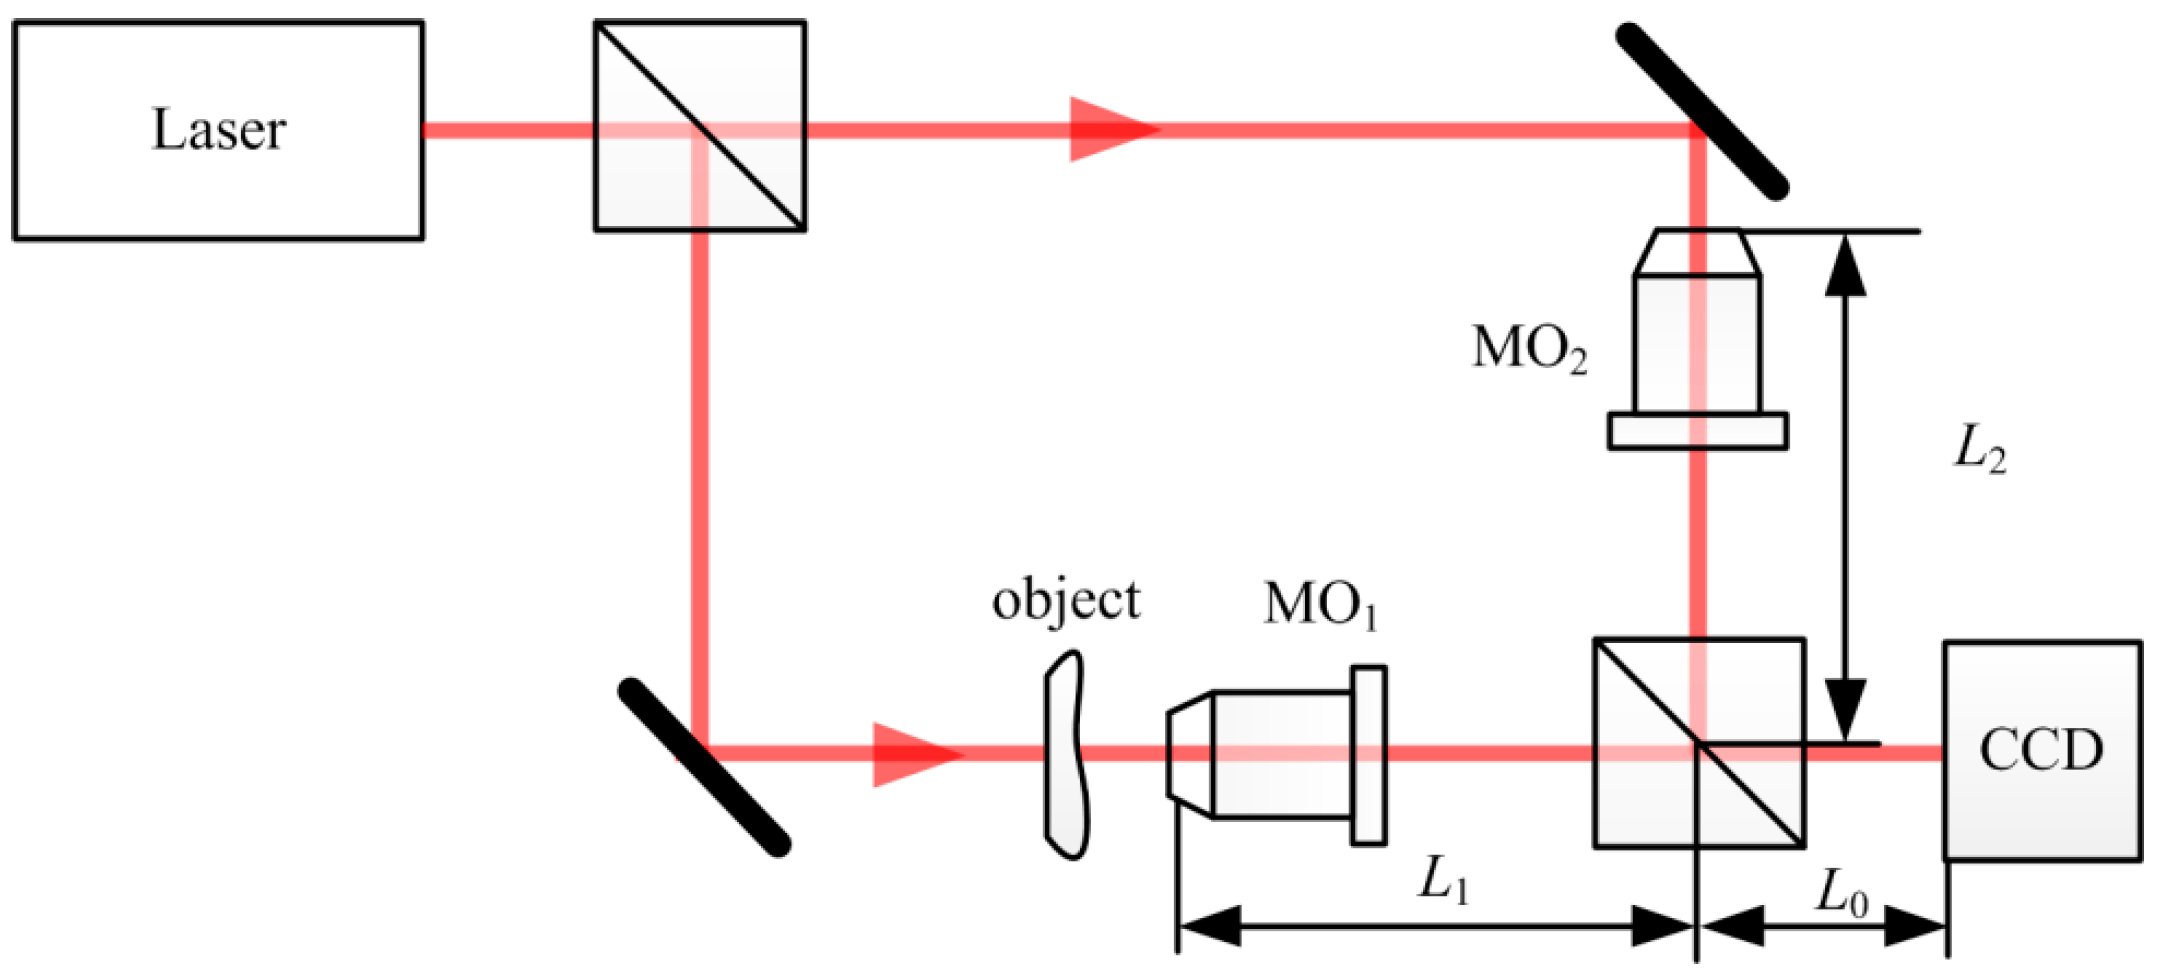
The introduction of the MO enables the output to become the spherical wave in the pre-amplification configuration. When the interference happens between the spherical and plane waves, the hologram pattern is a set of circle fringe. This proved that quadratic phase distortion exists. In order to resolve the problem, Mann et al. [64] inserted the same MO2 in the reference branch as the MO1 in the object branch in 2005, in which the MO2’s location was adjusted to offset the phase curvature in the object branch, as shown in Figure 5. The distance of L0 + L1 was equal to the distance of L0 + L2 as adjustable as possible to ensure the matching of the spherical waves in two branches. In addition, Qu et al. [25,26,29] further carried out the research on the Michelson interference structure. They observed the spectrum distribution of a hologram to judge whether or not to remove the quadratic phase distortion. The method demands that only the distances between the MO and the CCD in the two branches are controlled precisely. The phase curvature can be eliminated.
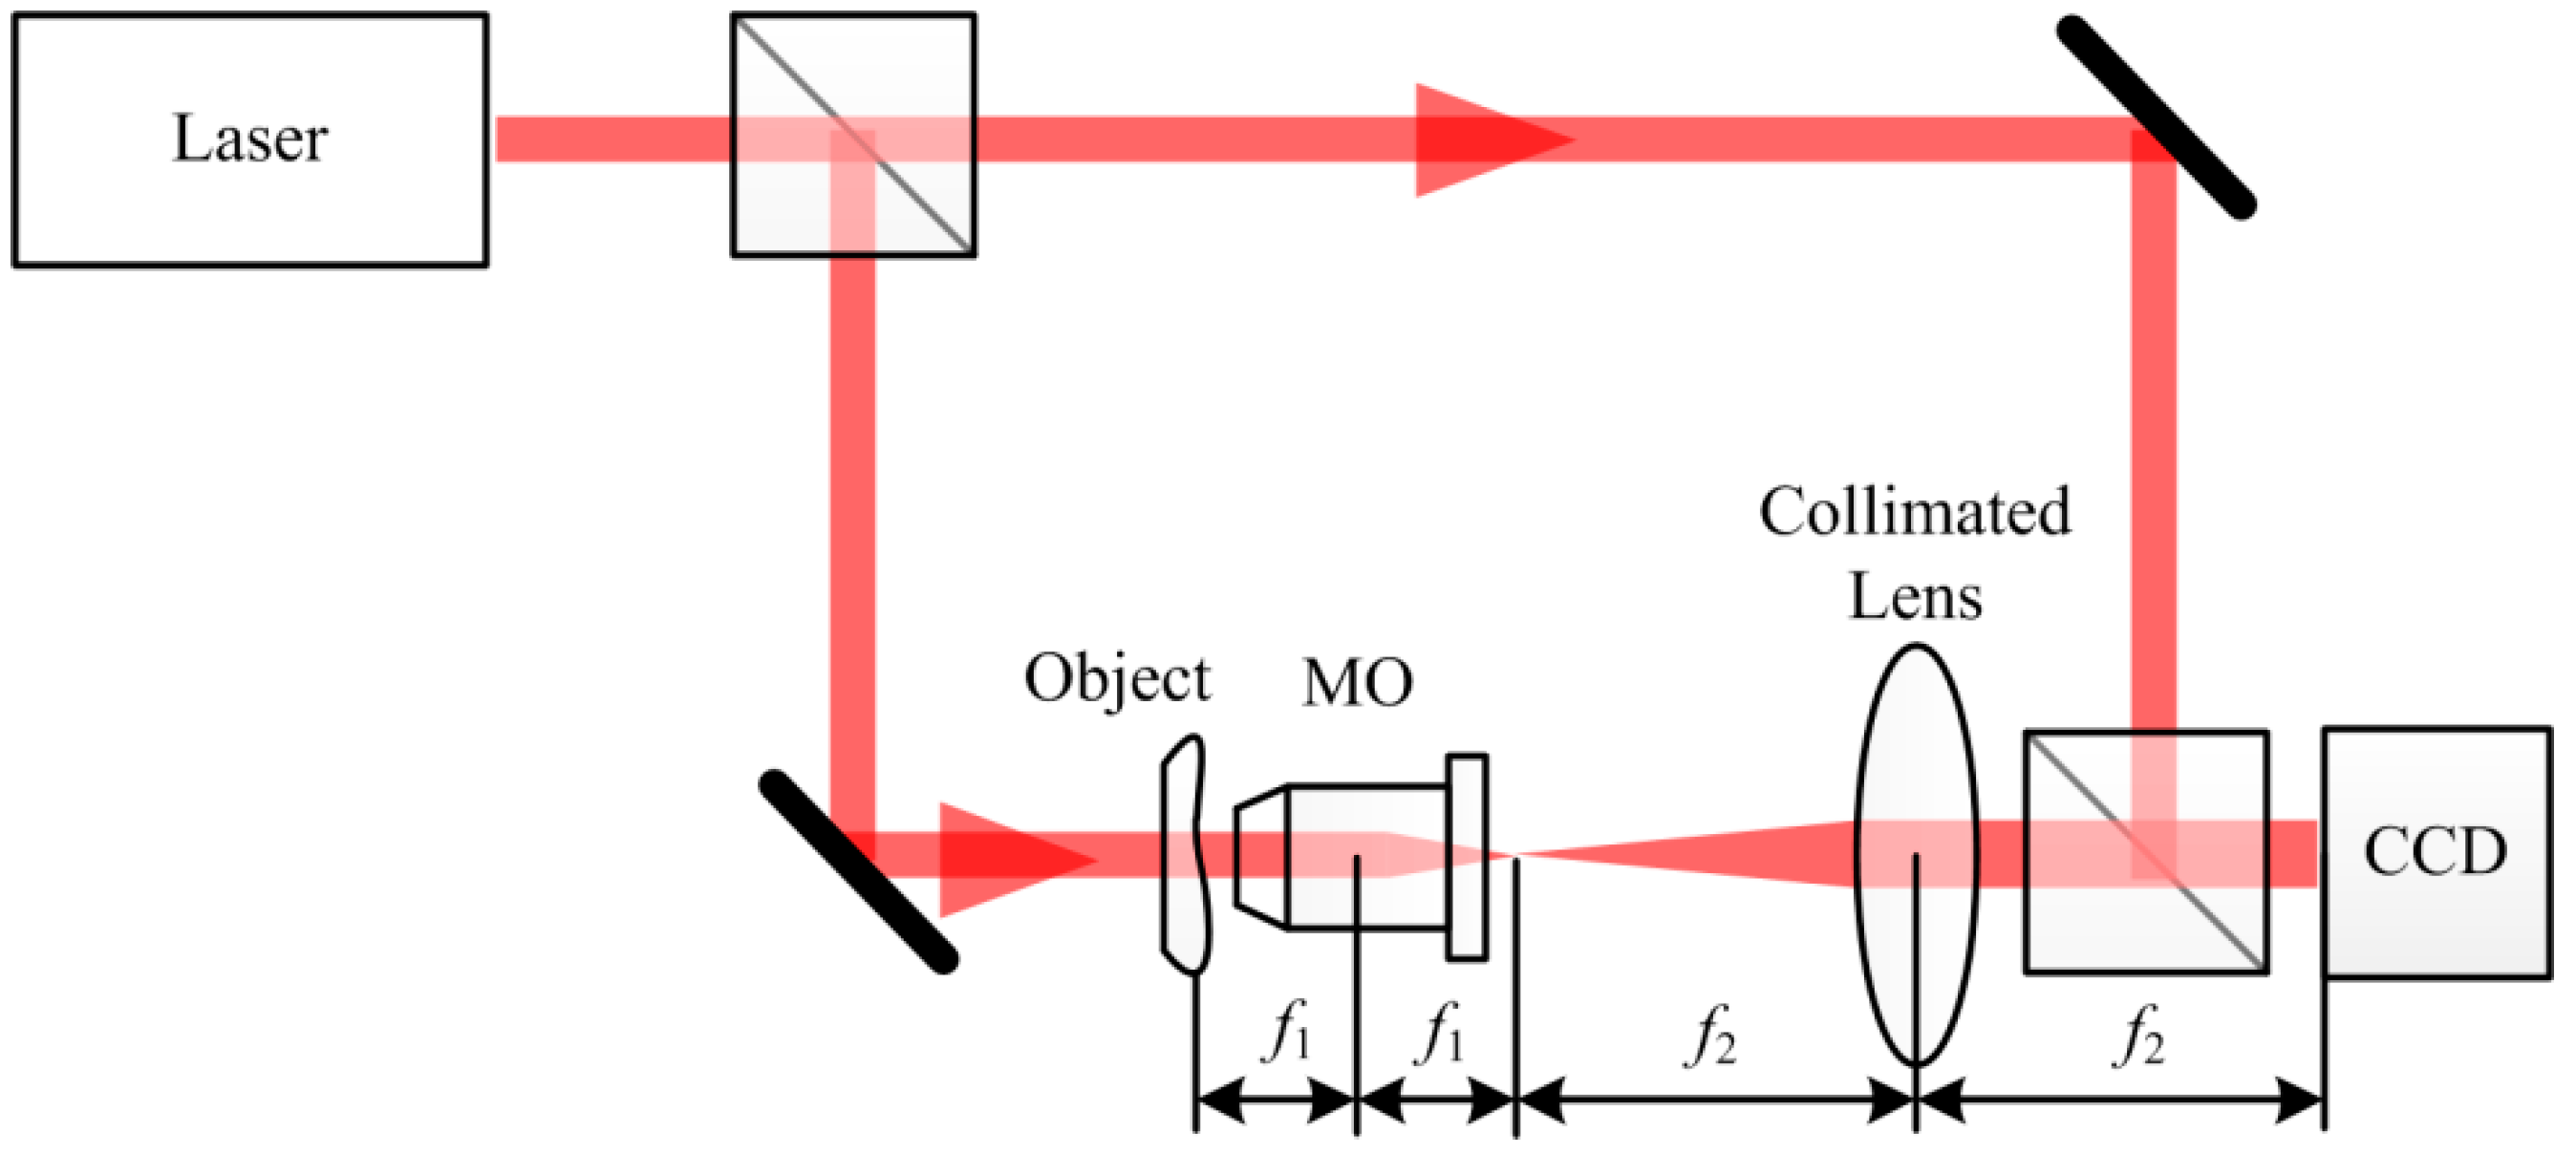
In 2011, Sánchez-Ortiga et al. [28] proposed a telecentric arrangement based on the DH pre-amplification configuration, as shown in Figure 6. The telecentric optical arrangement, composed of the MO and a collimated lens in the object branch, enabled the object wave to be plane from the spherical wave. The collimated lens with a larger focus length f2 and a smaller numerical aperture was located behind the MO. Its front focus plane coincided with the MO’s rear focus plane, resulting in an afocal arrangement. The interference happened between two plane waves, thus compensating the quadratic phase distortion. When the object was located at the MO’s front focus plane, the image would be produced in the rear focus plane of the collimated lens. The lateral magnification was estimated by the ratio of the lens’s focal length f2 to the MO’s focal length f1. The depth of the grooves of the zone plate was measured by the telecentric DHM. It was found that it agreed with the results obtained by profilometer. The method not only compensates the quadratic phase distortion, but enlarges the available region of spatial frequency in the off-axis configuration. In 2013, the same team [30] continued to analyze the telecentric arrangement in-depth. They demonstrated that the afocal arrangement possesses the shift-invariant imaging property, and the optical arrangement can remove the quadratic phase aberration.
The numerical compensation methods mainly include a phase mask [22,26,60], the reference conjugated hologram [66,67,68], and the surface fitting method [23,60,69,70,71]. A phase correcting model at the hologram plane was established by Ferraro et al. [22] in 2003, in which the correcting parameters were found by the flat area in proximity to the sample, but without the sample. The four correcting wave fronts with unitary amplitude but complex phases were given. The first three terms were considered to eliminate the circular fringes and slightly elliptical fringes, and the last term was used to remove the residual tilt. The reconstructed phase-contrast image of the sample and the reconstructed correction phase were obtained by propagation at distance zi, respectively. The two reconstructed phases were subtracted to obtain the sample information.
In 2006, Colomb et al. [60] adopted the phase mask to remove the phase distortion. Compared to the method presented by Ferraro [22], the correcting parameters were estimated by directly fitting the blank region of unwrapped phase. The polynomial formulation at the reconstructed plane was introduced as:
where H and V defined the polynomial orders in the horizontal and vertical directions, respectively; Ph,v defined a set of reconstruction parameters, in which P0,0 represented the constant term, P1,0 and P0,1 represented the first-order term with respect to the different axis, P2,0 represented the quadratic term. The different physical quantities can be evaluated by the different order polynomials if necessary. The reconstructed image which is immune to the phase distortion became:
where U(x,y) was the reconstructed image before compensation. The numerical phase mask method must give the correcting model in advance. Its application is also restricted for the sample with high-spatial-frequency content due to fitting an area in absence of a sample.
The surface fitting can obtain the phase distribution of a reconstructed image by means of a polynomial fitting. The fitted phase is subtracted from the reconstructed phase to eliminate the phase distortion. The approach may be divided into two situations. The first one is to fit a blank area in proximity to the sample, and further obtain the fitted phase distribution of the total reconstructed phase. The method requires that the total phase distortion is identical in a reconstructed plane. As examples, Colomb et al. adopted the high-order mathematical model [60] and Zernike the polynomial fitting [23] in 2006, while Min et al. [70] employed the least square ellipsoidal model in 2012. These fitting methods were all completed under the certain condition of a sample-free area in the reconstruction plane.
The second of the two situations is to fit the total reconstructed phase, in which the thin sample is considered to be a modulation superimposed on the aberration distribution. The fitting of the total unwrapped phase is seen as the fitting for the phase distortion distribution, instead of a sample. It does not require a sample-free region to execute. For example, Miccio et al. [71] applied Zernike polynomials to fit in 2007, and Zhang et al. [69] carried out the surface fitting based on the second-order mathematical model of phase distortion in 2011. However, their fitting results were frequently affected by the sample’s topographic distribution.
The fitted phase distribution ϕfit(x,y) may be obtained according to the methods mentioned above. It is subtracted from the reconstructed phase ϕrec(x,y) to recover the sample phase free of aberration, that is:
In 2014, Liu et al. [72] proposed the total aberrations compensation method based on the Zernike surface fitting in the telecentric arrangement of DHM. In order to compensate the quadratic phase aberration, the telecentric arrangement demanded precise adjustment of the distance between the MO and the collimated lens. The adjustment was realized by way of observation, but the analyses found that observing the interference fringes’ shape [28] or the Fourier spectrum’s distribution of hologram [25,26,27,28] may fail, and results in the residual phase curvature [25,73]. Aiming at the situation, a posteriori numerical compensation based on the Zernike surface fitting was performed. The Zernike fitting results of the total phase reflected the slow distribution of phase distortion for the sample with high-spatial-frequency content. The experimental micro-holes were estimated as high as 550 nm and its corresponding height standard derivation reached 19 nm. The method is immune to topographic distribution due to the application for sample with high-spatial-frequency content. It reduces the difficult of precisely adjusting the distance in the telecentric arrangement and improves the imaging quality in construction.
A reference conjugated hologram approach was presented by Colomb et al. [67] in 2006. The reference conjugated hologram was produced by means of a sample hologram to correct the phase distortion. Subsequently, Kühn et al. [66] in 2008 and Coppola et al. [68] in 2010 carried out the corresponding research, respectively. The method can be applied for dynamic measurement only by one hologram, but it demands that there exists a blank region in proximity to the sample. In 2013, Zuo et al. [74] proposed a numerical phase aberration compensation method based on the principal component analysis (PCA). By means of a singular value decomposition, the phase aberration function Q was determined as:
where lx and ly were the parameters to describe the spherical phase curvature. Its conjugate multiplied with the filtered hologram, leads to a new aberration-free hologram. The experiments of two cells were performed, in which the subcellular features as well as the thin borders of the cells were clearly observed without any curved or tilted background. Despite this, the approach improves the compensation efficiency by transferring 2D phase unwrapping and 2D surface fitting into a 1D procedure on two orthogonal directions. The PCA itself is the time-consuming task due to its processing time. To ensure efficiency, an optimal PCA-based method, proposed by Sun et al. [75] in 2016, only extracted the reduced-sized aberration spectrum to compensate the phase aberration, thus improving the computational efficiency. In 2017, Nguyen et al. [76] proposed an automatic phase aberration compensation method that combines a supervised deep learning technique with a convolutional neural network (CNN) and the Zernike polynomial fitting. The deep learning CNN was implemented to detect the background region automatically, which resolved the problem of aberration and the speckle noise that existed in other segmentation techniques. In addition, the Zernike polynomial was allowed to compute the self-conjugated phase to compensate for most aberrations. The approach can perform the real-time and automatic phase aberration compensation in DHM.
The comparison of the phase aberration compensation methods are shown in Table 1. The advantages and limitations of the physical and digital compensation methods are listed. These methods can compensate for the different phase aberrations. The physical compensation methods are mainly restricted by adjustment or two holograms recording, while the limitations of the numerical compensation methods focus in the fitted region and the fitting model.
5. Coherent Noise Suppression
The laser source, as a coherent illumination, enables the holographic imaging to suffer from the coherent noise, thus reducing the sharpness of the image details and further degrading the imaging quality. The coherent noise or speckle occurs in reconstructed images when there is an incident of coherent light on an object with an optically rough surface. For the reflection, the grain speckle is found when the reflected light irradiates on the sample surface. For a nondiffusing object, such as a transparency, the grain coherent noise is introduced from an undesired diffraction and from multiple reflections, such as the dust particles, scratches, and defects on and in the optical elements. The specimen information affected by the multiplicative coherent noise is expressed as:
where S(x0,y0) and N(x0,y0) represent the complex amplitude of the specimen and coherent noise, respectively; A is the amplitude and φ is the phase.
There have been a number of approaches to reduce the coherent noise. They may be divided into three categories. The first kind consists of reducing the coherent nature of the laser source by the low spatial or temporal coherent source. In 2004, Dubois et al. [77] proposed the method in which a ground glass was placed behind the laser to reduce the spatial coherence of the light source. The method also has been studied by Dubois et al. in 2006 [78]. The synthetic aperture of the Fourier holographic optical microscopy, proposed by Alexandrov et al. [79] in 2006, performed a spatial averaging over illumination with various spatial frequencies to reduce the speckle noise. Later in 2013, Lee et al. [80] discussed the speckle noise reduction based on a synthetic Fourier transform light scattering. As a low spatial coherent source, Choi et al. [81] in 2011 and Farrokhi et al. [82] in 2017, employed the dynamic speckle illumination to suppress the speckle noise in DHM, respectively. At the same time, the low temporal coherent source was also applied as an illumination to reduce the source coherence. For example, the femtosecond pulse laser used by Massatsch et al. [83] in 2005, the Ti-sapphire pulsed laser selected by Shin et al. in 2015 [84], the white light source employed by Ding et al. [85] in 2010, Bhaduri et al. [86] in 2012 and Bhaduri et al. in 2013 [87], the light-emitting diode (LED) adopted by León-Rodríguez et al. [88] in 2012, Garcia-Sucerquia [89] in 2013, and Agour et al. [90] in 2017, respectively, have offered immense contributions. These kinds of methods may reduce focal depth and strictly demand the optical path difference between the object and reference beams, thus increasing the adjustment difficulty of the light configuration. In addition, the incoherent DH has attracted much attention in recent years [91,92,93,94,95,96,97,98,99], allowing a higher signal-to-noise ratio as compared with the laser source. The incoherent DH includes two kinds of techniques, i.e., optical scanning holography (OSH) [91,92,93,94] and Fresnel incoherent correlation holography (FINCH) [95,96,97,98]. OSH is based on scanning imaging, thus it is relatively complicated and slow but has no hard limitation on the recording size and pixel pitch. FINCH is based on the single-path and self-interference interferometer, hence it is simple and suitable for dynamic holograms. However, there is a large bias buildup for complicated objects in FINCH due to the self-interference holographic technique.
The second kind of method is based on temporal integration by multiplexing holograms. The multiple holograms with uncorrelated noise patterns are recorded by different optical approaches. These approaches utilize the averaging effect to reduce the coherent noise. There are many ways of implementation, such as the different illumination angles proposed by Quan et al. [100] in 2007, the different wavelengths presented by Nomura et al. [33] in 2008, the different polarizations adopted by Rong et al. [35] in 2010 and Xiao et al. [101] in 2011, and the moving diffusers presented by Garcia-Sucerquia et al. [102] in 2006 and Kubota et al. [103] in 2010. Moreover, the implementation was also realized by laterally shifting an object, proposed by Pan [104] in 2011. The method of shifting the camera was demonstrated by Baumbach et al. [105] in 2006 and Pan et al. [106] in 2013, respectively. In 2016, Herrera-Ramirez et al. [107] utilized the slight rotation of an object to perform the coherent noise suppression. However, this kind requires a complex optical arrangement, which limits the number of recorded holograms with different noise. In addition, real-time measurement fails as a result of the longer capture time.
The third kind of method is based on digital processing with a single hologram. For instance, Garcia-Sucerquia et al. [31] adopted median and mean filtering in 2005. Sharma et al. [108] employed wavelet transformation process in 2008. Cai et al. [109] reduced the coherent noise by means of the transformation of the multiplicative noise into an additive one in 2010. Despite the fact that typical digital processing methods only record one hologram, the imaging resolution was adversely affected due to the loss of object information. In 2007, Maycock et al. [110] proposed the discrete Fourier filtering method, in which the speckle was suppressed by shifting a bandpass filter of spectrum. The method has advantages over conventional median and mean filtering methods, but it may lose the resolution and in-axis optical arrangement is its constraints. Furthermore, Abolhassani et al. [111] divided a recorded hologram into several sub-holograms in 2012. Each sub-hologram was reconstructed individually, and the speckle-reduced image can be obtained by averaging them. In 2016, Leportier et al. [112] reconstructed an image downsampled randomly by application of the compressive sensing algorithm. By repeating this procedure several times with different random downsamplings, the multiple reconstructed images with different speckle were averaged. It was demonstrated that the speckle noise was reduced drastically. Compared with the first two kinds of speckle reduction methods, the digital processing methods only utilize one hologram to realize the noise suppression, instead of manual operation or recording multiple holograms. However, their image resolution is affected due to loss of sample information.
The methods based on shifting a binary mask have been studied to suppress the coherent noise. In 2007, Maycock et al. [110] applied the discrete analog of the conventional Fourier filtering to DH. The proposed discrete Fourier filtering was to filter the Fourier plane date in the discrete Fourier plane. The filter process was repeated n times by means of shifting a bandpass filter and the resulting intensities were averaged to obtain the speckle-reduced image. Despite only one hologram, the method losses the spatial resolution of the reconstructed image and is suitable for an in-axis optical arrangement.
At the same year, Morimoto et al. [113] presented an effective method using the windowed holograms to reduce the speckle noise, which was a window function with a value of one in a small region of the whole hologram area and a value of zero in the rest. The windowed hologram was obtained by a multiplication of the window function by the complex amplitude of the original hologram. By moving the window, many phase-difference values of the reconstructed images obtained with different windows were averaged with weights. The method using phase-shifting DH provided a very high-resolution displacement measurement, in which the standard deviation of error reached 88 pm. But the speckle-reduced image exhibits a lower spatial resolution.
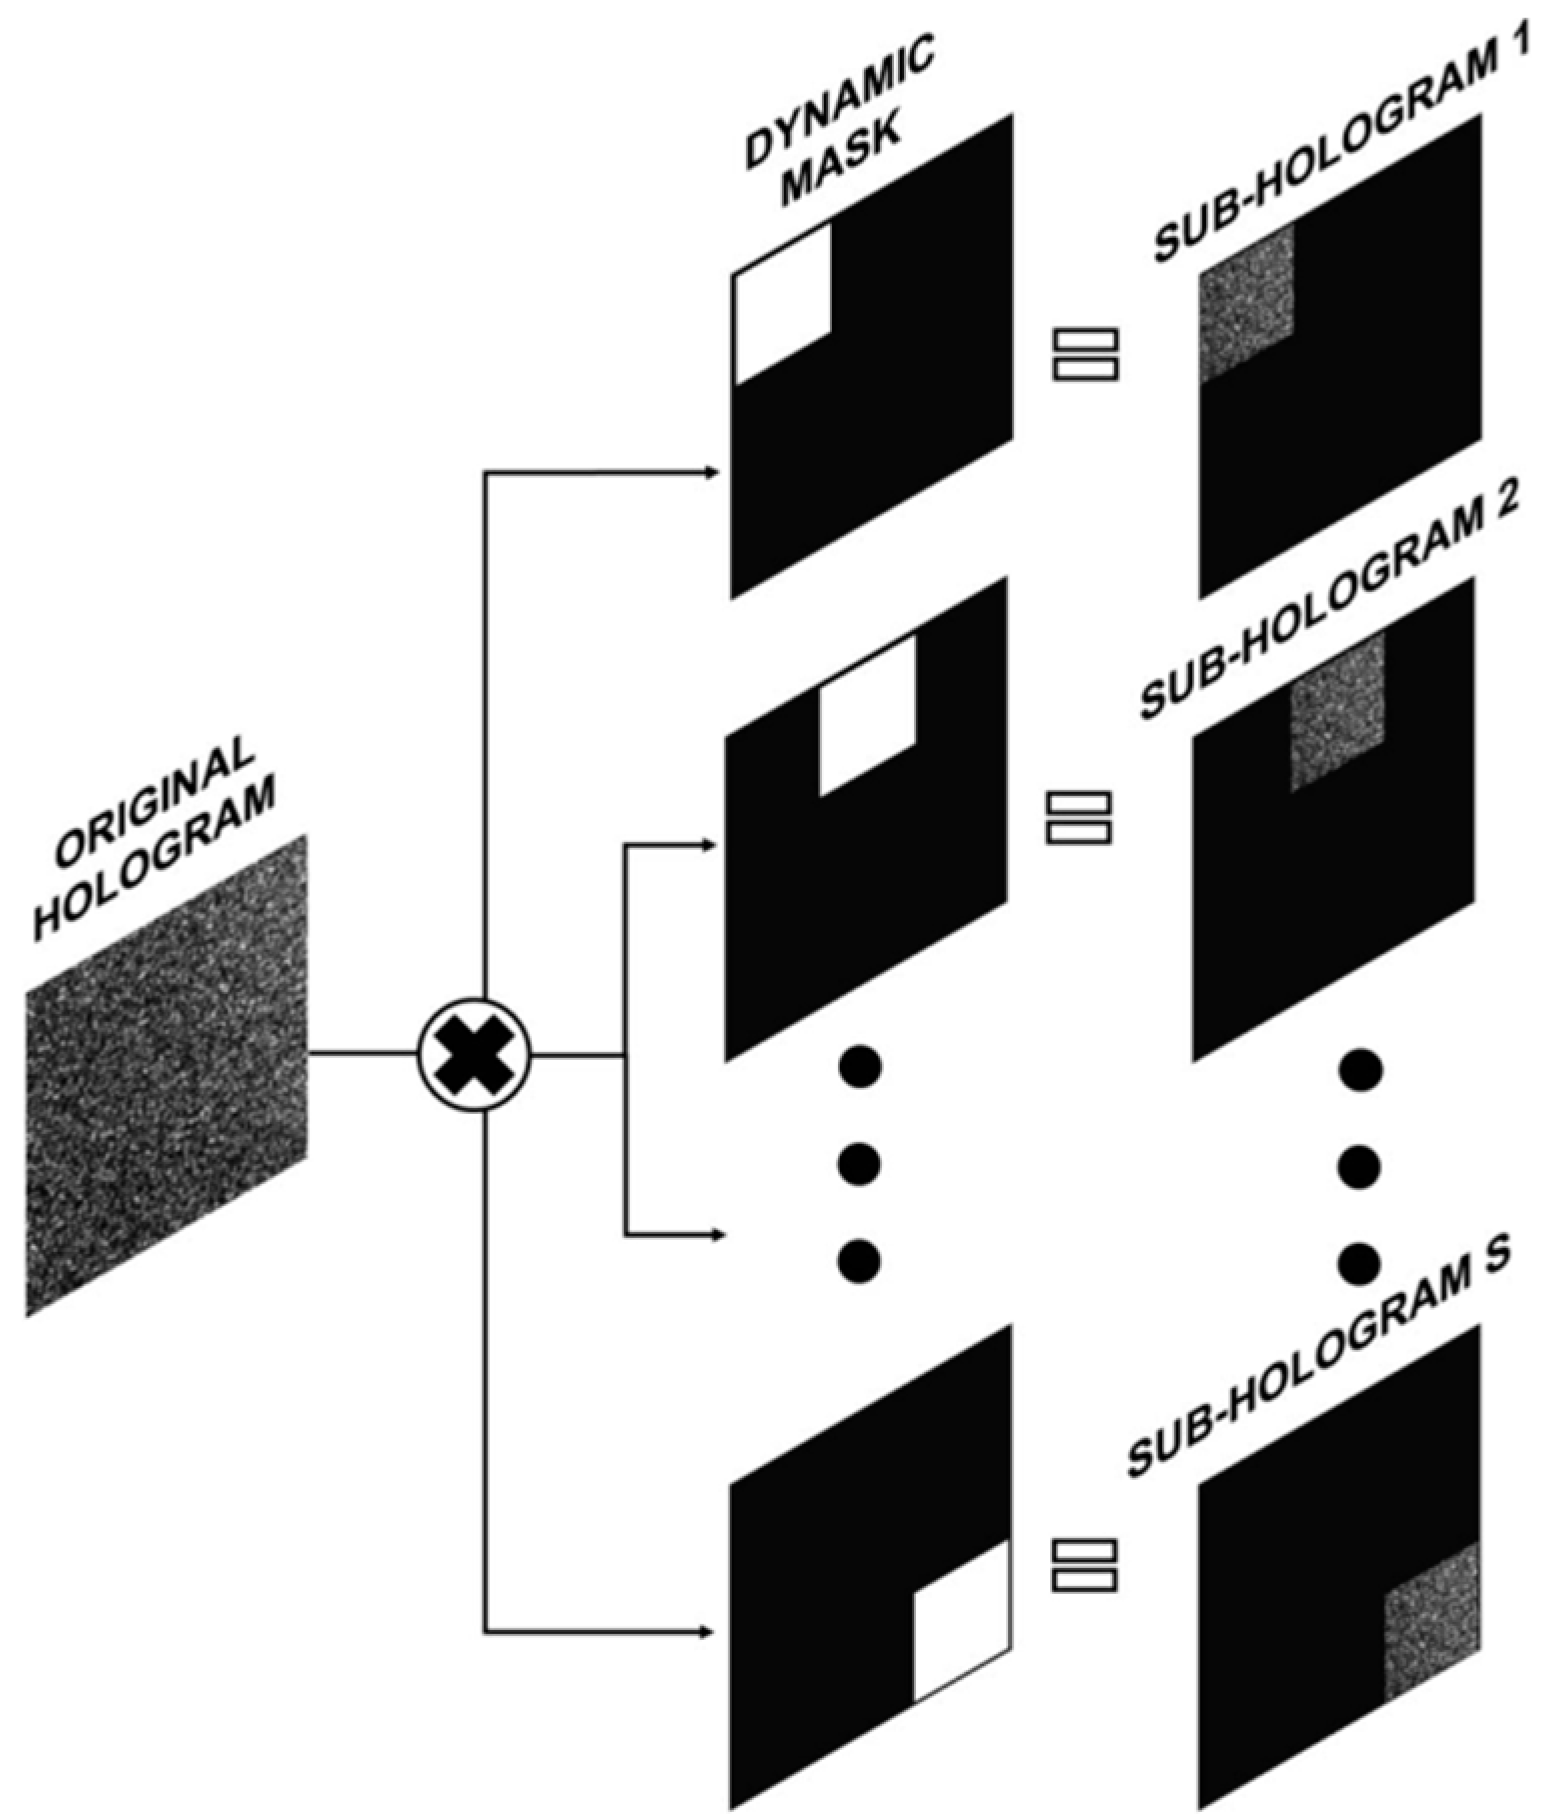
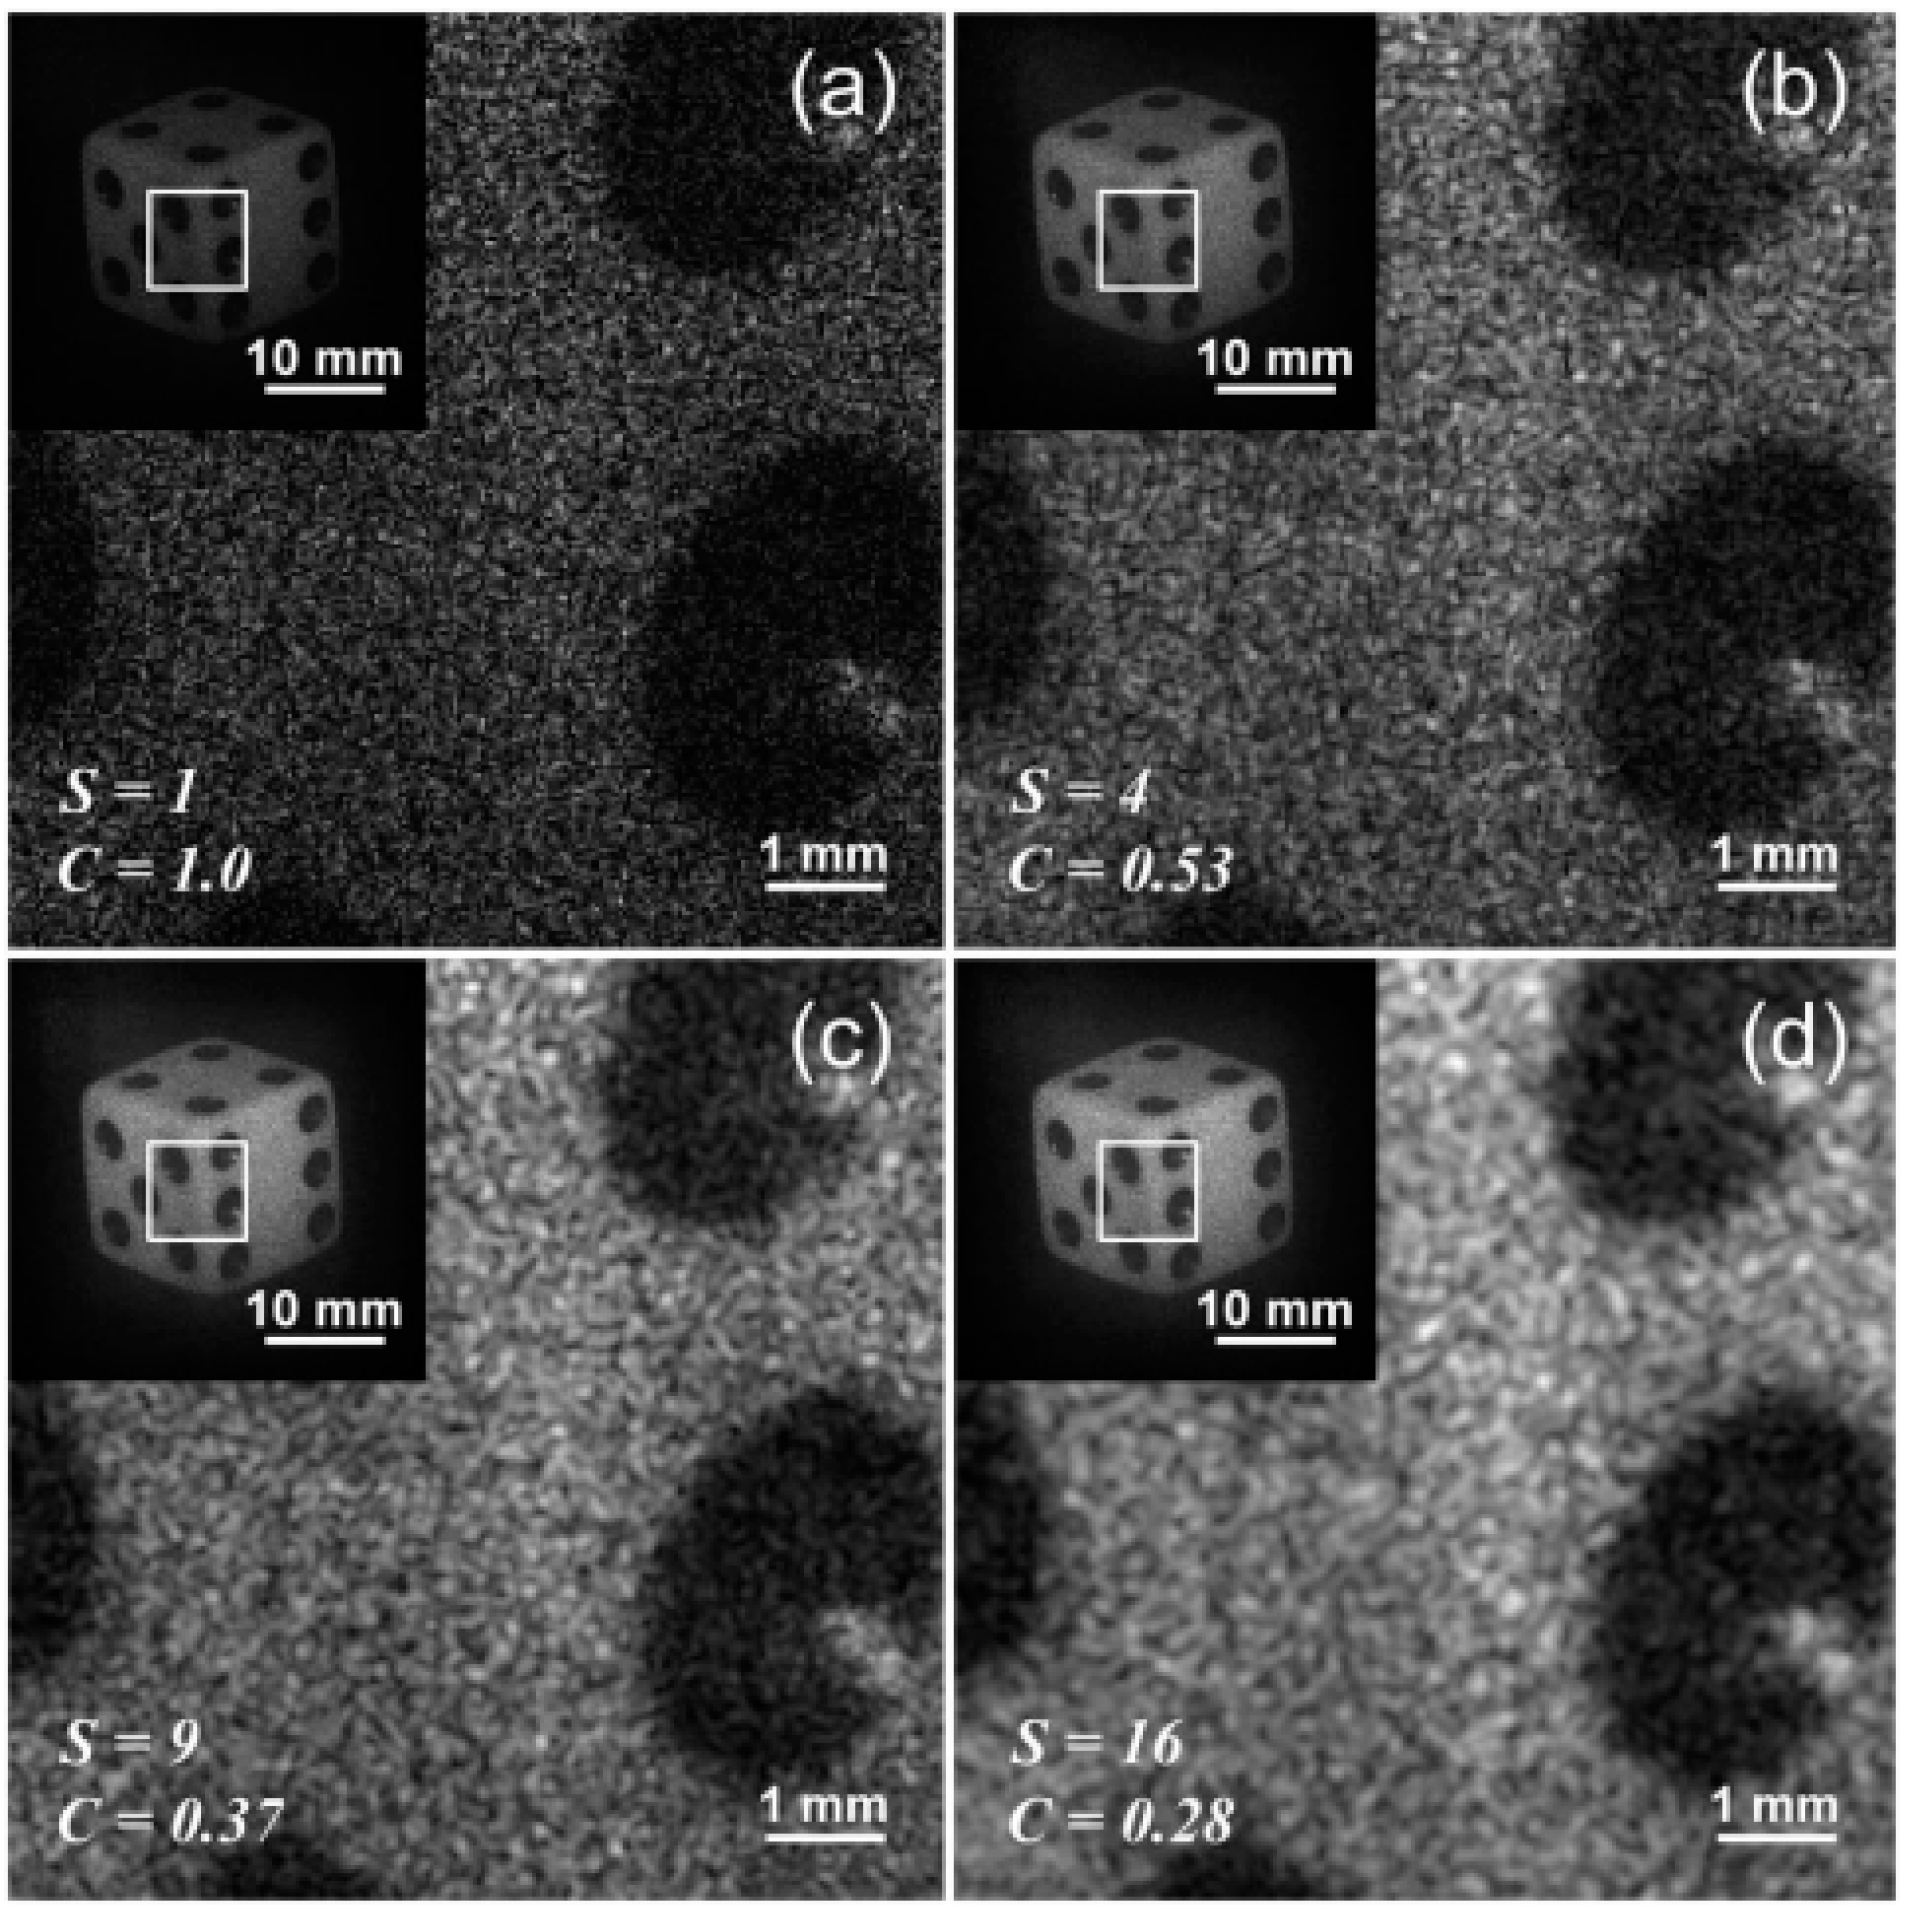
A single-shot speckle reduction approach was proposed by Hincapie et al. [114] in 2015. The principle is identical with that of the method presented by Morimoto [113]. The S = T × T different sub-holograms were the results of the original hologram times a binary dynamic mask containing a movable window, as shown in Figure 7, in which T denoted the sub-hologram number in one dimension. They may be considered as having been recorded by CCD at S different locations. Each sub-hologram yielded a reconstructed image with the same sample information, but with a different speckle pattern. The experimental results of the speckle noise reduction were shown in Figure 8. These results showed a reduction to 0.28 from 1.0 in the contrast C of speckle noise as the value of S increased from 1 to 16, in which C is the ratio between the standard deviation and the mean value of the intensity of the reconstructed image. But the precondition of the approach was that the sub-holograms cannot be overlapped. Therefore, the relationship between the speckle reduction effect and the loss of spatial resolution is a trade-off.
Compared to the approach proposed by Hincapie [114], the speckle reduction by spatial-domain mask, presented by Fukuoka et al. [115] in 2016, permitted the spatial-domain mask to overlap, which released the limit of the available number of the images to be synthesized. A number of reconstructed images were obtained by shifting a digital aperture in the original hologram. Each spatial frequency of the reconstructed image was distributed in the whole area of hologram, thus each spatial frequency of these sub-holograms was uniformly distributed. As a result, the shifting aperture could be overlapped and many different speckle patterns were produced. The average of the amplitudes of multiple reconstructed images meant that the speckle suppression was achieved. The experimental results showed that the image contrast and the spatial resolution were decreased with the smaller aperture size, respectively. Moreover, the larger number of the synthesized images also obtained the improved speckle contrast at the same aperture size. The method may be applied to the dynamic measurement only by one hologram. However, the spatial resolution of the reconstructed images also depended on the aperture size, even if the sub-holograms were allowed to overlap each other.
Based on the above analyses, it is essential to study a digital processing method to reduce the effect of coherent noise without a loss of spatial resolution, which provides a facility for real-time measurement. Liu et al. [116] presented a method of coherent noise reduction using a laterally shifting hologram aperture in 2016. The digital method was similar to a laterally shifting CCD to reduce the coherent noise in the optical arrangement. The hologram with the larger size (compared with the hologram size to be reconstructed) was captured by a camera as the original hologram. The digital aperture was shifted in the original hologram. To suppress the loss of the spatial resolution of the reconstructed image, the aperture size was required to contain the whole specimen to be reconstructed, instead of extracting the specimen’s part information. Each sub-hologram sampled at a different position was reconstructed. The average effect was employed for different reconstructed images to reduce the coherent noise. The experimental results of the microhole array showed that the proposed method decreased the phase standard deviation and distribution range of the reconstructed phase. At the same time, the reconstruction of the resolution chart demonstrated that the spatial resolution was immune to the average effect in speckle reduction. Since each sub-hologram remains the total specimen, the method with a single hologram can realize the coherent noise reduction without a loss of spatial resolution.
Table 2 shows several kinds of coherent noise suppression methods. The low coherent source, incoherent DH, and digital processing methods all record one hologram. Thus they may be suitable for dynamic measurement. But these methods have respective limitations. The multiplexing holograms method requires capturing multiple holograms and utilizing the average effect to reduce the coherent noise, which results in a longer capture time and is not applied in the rapid dynamic measurement.
6. Conclusions
Aimed at improving the imaging quality in DHM, research was carried out on the tilt phase error compensation, phase aberration compensation, and coherent noise reduction, respectively. Recent research progress was reviewed from different aspects, such as principle, category, advantage, and applicability. In the tilt phase error compensation, the hologram spectrum’s centering judgment of side band, as a precondition for the digital reference wave method and spectrum translation method, was discussed. It can be demonstrated that correctly judging the hologram spectrum’s centering is of importance for tilt phase error elimination. In phase aberration compensation, the physical and numerical compensation methods were summarized, and their advantages and limitations analyzed, respectively. In coherent noise reduction, the comparisons among coherent noise reduction methods only by one hologram were conducted. At the same time, the influence of coherent noise suppression on the spatial resolution loss of a reconstructed image was also analyzed. In conclusion, the phase aberration compensation and coherent noise suppression are two critical research fields in improving DHM’s imaging quality, in which a number of research approaches and achievements have also emerged. The research on the automatic imaging quality improvement method with real-time and non-intervention characteristics, applied in a dynamic measurement such as cell migration, should be a critical development trend in the future.
Acknowledgments
This work was supported by the National Natural Science Foundation of China under (Grant No. 61605156), the Scientific Instrument Research Funds of State Key Laboratory for Manufacturing Systems Engineering, and a Key Laboratory Project of the Shaanxi Provincial Department of Education (entitled “Research on imaging quality improvement method of 3D morphology measurement in DHM”).
Author Contributions
All authors contributed to the research work. Y.L. wrote the paper, Z.W. revised the paper.
Conflicts of Interest
The authors declare no conflict of interest.
References
- Yamaguchi, I.; Zhang, T. Phase-shifting digital holography. Opt. Lett. 1997, 22, 1268–1270. [Google Scholar] [CrossRef] [PubMed]
- Zhang, T.; Yamaguchi, I. Three-dimensional microscopy with phase-shifting digital holography. Opt. Lett. 1998, 23, 1221–1223. [Google Scholar] [CrossRef] [PubMed]
- Takaki, Y.; Kawai, H.; Ohzu, H. Hybrid holographic microscopy free of conjugate and zero-order images. Appl. Opt. 1999, 38, 4990–4996. [Google Scholar] [CrossRef] [PubMed]
- Kim, M.K. Wavelength-scanning digital interference holography for optical section imaging. Opt. Lett. 1999, 24, 1693–1695. [Google Scholar] [CrossRef] [PubMed]
- Cuche, E.; Marquet, P.; Depeursinge, C. Simultaneous amplitude-contrast and quantitative phase-contrast microscopy by numerical reconstruction of Fresnel off-axis holograms. Appl. Opt. 1999, 38, 467–494. [Google Scholar] [CrossRef]
- Cuche, E.; Bevilacqua, F.; Depeursinge, C. Digital holography for quantitative phase-contrast imaging. Opt. Lett. 1999, 24, 291–293. [Google Scholar] [CrossRef] [PubMed]
- Schnars, U.; Jüptner, W.P.O. Digital recording and numerical reconstruction of holograms. Meas. Sci. Technol. 2002, 13, R85–R101. [Google Scholar] [CrossRef]
- Schnars, U.; Jüptner, W. Direct recording of holograms by a CCD target and numerical reconstruction. Appl. Opt. 1994, 33, 179–181. [Google Scholar] [CrossRef] [PubMed]
- Schnars, U.; Kreis, T.M.; Jueptner, W.P. Digital recording and numerical reconstruction of holograms: Reduction of the spatial frequency spectrum. Opt. Eng. 1996, 35, 977–982. [Google Scholar] [CrossRef]
- Yamaguchi, I.; Kato, J.-I.; Ohta, S.; Mizuno, J. Image formation in phase-shifting digital holography and applications to microscopy. Appl. Opt. 2001, 40, 6177–6186. [Google Scholar] [CrossRef] [PubMed]
- Nicola, S.D.; Finizio, A.; Pierattini, G.; Ferraro, P.; Alfieri, D. Angular spectrum method with correction of anamorphism for numerical reconstruction of digital holograms on tilted planes. Opt. Express 2005, 13, 9935–9940. [Google Scholar] [CrossRef] [PubMed]
- Weng, J.W.; Zhong, J.G.; Hu, C.Y. Digital reconstruction of fresnel hologram with a ridge of gabor wavelet transform. Acta Opt. Sin. 2009, 29, 2109–2114. [Google Scholar] [CrossRef]
- Smith, D.R.; Winters, D.G.; Schlup, P.; Bartels, R.A. Hilbert reconstruction of phase-shifted second-harmonic holographic images. Opt. Lett. 2012, 37, 2052–2054. [Google Scholar] [CrossRef] [PubMed]
- Chaab, O.; Bouamama, L.; Simoens, S. An adaptive anisotropic magnification algorithm of numerical reconstructed holographic image via a cascaded fresnel transform. Opt. Commun. 2013, 291, 61–69. [Google Scholar] [CrossRef]
- Kreis, T.M.; Jueptner, W.P.O. Suppression of the dc term in digital holography. Opt. Eng. 1997, 36, 2357–2360. [Google Scholar] [CrossRef]
- Cuche, E.; Marquet, P.; Depeursinge, C. Spatial filtering for zero-order and twin-image elimination in digital off-axis holography. Appl. Opt. 2000, 39, 4070–4075. [Google Scholar] [CrossRef] [PubMed]
- Pavillon, N.; Seelamantula, C.S.; Kühn, J.; Unser, M.; Depeursinge, C. Suppression of the zero-order term in off-axis digital holography through nonlinear filtering. Appl. Opt. 2009, 48, 186–195. [Google Scholar] [CrossRef] [PubMed]
- Chen, G.-L.; Lin, C.-Y.; Kuo, M.-K.; Chang, C.-C. Numerical suppression of zero-order image in digital holography. Opt. Express 2007, 15, 8851–8856. [Google Scholar] [CrossRef] [PubMed]
- Weng, J.W.; Zhong, J.G.; Hu, C.Y. Automatic spatial filtering to obtain the virtual image term in digital holographic microscopy. Appl. Opt. 2010, 49, 189–195. [Google Scholar] [CrossRef] [PubMed]
- Pavillon, N.; Arfire, C.; Bergoënd, I.; Depeursinge, C. Iterative method for zero-order suppression in off-axis digital holography. Opt. Express 2010, 18, 15318–15331. [Google Scholar] [CrossRef] [PubMed]
- Ma, Z.; Deng, L.; Yang, Y.; Zhai, H.; Ge, Q. Numerical iterative approach for zero-order term elimination in off-axis digital holography. Opt. Express 2013, 21, 28314–28324. [Google Scholar] [CrossRef] [PubMed]
- Ferraro, P.; Nicola, S.D.; Finizio, A.; Coppola, G.; Grilli, S.; Magro, C.; Pierattini, G. Compensation of the inherent wave front curvature in digital holographic coherent microscopy for quantitative phase-contrast imaging. Appl. Opt. 2003, 42, 1938–1946. [Google Scholar] [CrossRef] [PubMed]
- Colomb, T.; Montfort, F.; Kühn, J.; Aspert, N.; Chche, E.; Marian, A.; Charrière, F.; Bourquin, S.; Marquet, P.; Depeursinge, C. Numerical parametric lens for shifting, magnification, and complete aberration compensation in digital holographic microscopy. J. Opt. Soc. Am. A 2006, 23, 3177–3190. [Google Scholar] [CrossRef]
- Di, J.L.; Zhao, J.L.; Sun, W.W.; Jiang, H.Z.; Yan, X.B. Phase aberration compensation of digital holographic microscopy based on least squares surface fitting. Opt. Commun. 2009, 282, 3873–3877. [Google Scholar] [CrossRef]
- Qu, W.J.; Choo, C.O.; Singh, V.R.; Yu, Y.J.; Asundi, A. Quasi-physical phase compensation in digital holographic microscopy. J. Opt. Soc. Am. A 2009, 26, 2005–2011. [Google Scholar] [CrossRef]
- Qu, W.J.; Choo, C.O.; Yu, Y.J.; Asundi, A. Microlens characterization by digital holographic microscopy with physical spherical phase compensation. Appl. Opt. 2010, 49, 6448–6454. [Google Scholar]
- Qu, W.J.; Choo, C.O.; Yu, Y.J.; Singh, V.R.; Asundi, A. Physical phase compensation in digital holographic microscopy. In Proceedings of the Fourth International Conference on Experimental Mechanics, Singapore, 18–20 November 2009; SPIE: Bellingham, WA, USA, 2010. [Google Scholar]
- Sánchez-Ortiga, E.; Ferraro, P.; Martínez-Corral, M.; Saavedra, G.; Doblas, A. Digital holographic microscopy with pure-optical spherical phase compensation. J. Opt. Soc. Am. A 2011, 28, 1410–1417. [Google Scholar] [CrossRef] [PubMed]
- Qu, W.J.; Choo, C.O.; Lewis, T.R. Physical spherical phase compensation in reflection digital holographic microscopy. Opt. Lasers Eng. 2012, 50, 563–567. [Google Scholar]
- Doblas, A.; Sánchez-Ortiga, E.; Martínez-Corral, M.; Saavedra, G.; Andrés, P.; Garcia-Sucerquia, J. Shift-variant digital holographic microscopy: Inaccuracies in quantitative phase imaging. Opt. Lett. 2013, 38, 1352–1354. [Google Scholar] [CrossRef] [PubMed]
- Garcia-Sucerquia, J. Reduction of speckle noise in digital holography by using digital image processing. Optik 2005, 116, 44–48. [Google Scholar] [CrossRef]
- Guo, R.L.; Yao, B.L.; Gao, P.; Min, J.W.; Zhou, M.L.; Han, J.; Yu, X.; Yu, X.H.; Lei, M.; Yan, S.H.; et al. Off-axis digital holographic microscopy with LED illumination based on polarization filtering. Appl. Opt. 2013, 52, 8233–8238. [Google Scholar] [CrossRef] [PubMed]
- Nomura, T.; Okamura, M.; Nitanai, E.; Numata, T. Image quality improvement of digital holography by superposition of reconstructed images obtained by multiple wavelengths. Appl. Opt. 2008, 47, 38–43. [Google Scholar] [CrossRef]
- Park, Y.; Choi, W.; Yaqoob, Z.; Dasari, R.; Badizadegan, K.; Feld, M.S. Speckle-field digital holographic microscopy. Opt. Express 2009, 17, 12285–12292. [Google Scholar] [CrossRef] [PubMed]
- Rong, L.; Xiao, W.; Pan, F.; Liu, S.; Li, R. Speckle noise reduction in digital holography by use of multiple polarization holograms. Chin. Opt. Lett. 2010, 8, 653–655. [Google Scholar] [CrossRef]
- Abdelsalam, D.G.; Kim, D. Coherent noise suppression in digital holography based on flat fielding with apodized apertures. Opt. Express 2011, 19, 17951–17959. [Google Scholar] [CrossRef] [PubMed]
- Wang, Y.; Meng, P.; Wang, D.; Rong, L.; Panezai, S. Speckle noise suppression in digital holography by angular diversity with phase-only spatial light modulator. Opt. Express 2013, 21, 19568–19578. [Google Scholar] [CrossRef] [PubMed]
- Uzan, A.; Rivenson, Y.; Stern, A. Speckle denoising in digital holography by nonlocal means filtering. Appl. Opt. 2013, 52, 195–200. [Google Scholar] [CrossRef] [PubMed]
- Di, J.L.; Zhao, J.L.; Jiang, H.Z.; Zhang, P.; Fan, Q.; Sun, W.W. High resolution digital holographic microscopy with a wide field of view based on a synthetic aperture technique and use of linear CCD scanning. Appl. Opt. 2008, 47, 5654–5659. [Google Scholar] [CrossRef] [PubMed]
- Paturzo, M.; Ferraro, P. Correct self-assembling of spatial frequencies in super-resolution synthetic aperture digital holography. Opt. Lett. 2009, 34, 3650–3652. [Google Scholar] [CrossRef] [PubMed]
- Claus, D. High resolution digital holographic synthetic aperture applied to deformation measurement and extended depth of field method. Appl. Opt. 2010, 49, 3187–3198. [Google Scholar] [CrossRef] [PubMed]
- Jiang, H.Z.; Zhao, J.L.; Di, J.L. Numerical correction of splicing dislocation between sub-holograms in synthetic aperture digital holography using convolution approach. Chin. Opt. Lett. 2012, 10, 22–24. [Google Scholar]
- Thurman, S.T.; Bratcher, A. Multiplexed synthetic-aperture digital holography. Appl. Opt. 2015, 54, 559–568. [Google Scholar] [CrossRef]
- Ma, J.; Yuan, C.J.; Situ, G.H. Resolution enhancement in digital holographic microscopy with structured illumination. Chin. Opt. Lett. 2013, 11, 28–32. [Google Scholar]
- Gao, P.; Pedrini, G.; Osten, W. Structured illumination for resolution enhancement and autofocusing in digital holographic microscopy. Opt. Lett. 2013, 38, 1328–1330. [Google Scholar] [CrossRef] [PubMed]
- Sánchezortiga, E.; Martínezcorral, M.; Saavedra, G.; Garciasucerquia, J. Enhancing spatial resolution in digital holographic microscopy by biprism structured illumination. Opt. Lett. 2014, 39, 2086–2089. [Google Scholar] [CrossRef] [PubMed]
- Yuan, C.J.; Feng, S.T.; Nie, S.P. Digital holographic microscopy by using structured illumination. Chin. Opt. Lett. 2016, 43, 0609003. [Google Scholar] [CrossRef]
- Ghiglia, D.C.; Romero, L.A. Robust two-dimensional weighted and unweighted phase unwrapping that uses fast transforms and iterative methods. J. Opt. Soc. Am. A 1994, 11, 107–117. [Google Scholar] [CrossRef]
- Kerr, D.; Kaufmann, G.H.; Galizzi, G.E. Unwrapping of interferometric phase-fringe maps by the discrete cosine transform. Appl. Opt. 1996, 35, 810–816. [Google Scholar] [CrossRef] [PubMed]
- Liu, S.; Xiao, W.; Pan, F.; Wang, F.; Cong, L. Complex-amplitude-based phase unwrapping method for digital holographic microscopy. Opt. Lasers Eng. 2012, 50, 322–327. [Google Scholar] [CrossRef]
- Nicola, S.D.; Finizio, A.; Pierattini, G.; Alfieri, D.; Grilli, S.; Sansone, L.; Ferraro, P. Recovering correct phase information in multiwavelength digital holographic microscopy by compensation for chromatic aberrations. Opt. Lett. 2005, 30, 2706–2708. [Google Scholar] [CrossRef] [PubMed]
- Mann, C.J.; Bingham, P.R.; Paquit, V.C.; Tobin, K.W. Quantitative phase imaging by three-wavelength digital holography. Opt. Express 2008, 16, 9753–9764. [Google Scholar] [CrossRef] [PubMed]
- Upputuri, P.K.; Mohan, N.K.; Kothiyal, M.P. Measurement of discontinuous surfaces using multiple-wavelength interferometry. Opt. Eng. 2009, 48, 705–709. [Google Scholar] [CrossRef]
- Goodman, J.W. Introduction to Fourier Optics, 3rd ed.; Chinese Edition; Publishing House of Electronics Industry: Beijing, China, 2011; p. 72. ISBN 978-7-121-13279-7. [Google Scholar]
- Liu, Y.; Wang, Z.; Li, J.S.; Gao, J.M.; Huang, J.H. Phase based method for location of the centers of side bands in spatial frequency domain in off-axis digital holographic microcopy. Opt. Lasers Eng. 2016, 86, 115–124. [Google Scholar] [CrossRef]
- Cho, H.-J.; Kim, D.-C.; Yu, Y.-H.; Shin, S.; Jung, W. Tilt aberration compensation using interference patterns in digital holography. J. Opt. Soc. Korea 2009, 13, 451–455. [Google Scholar] [CrossRef]
- Takeda, M. Fourier fringe analysis and its application to metrology of extreme physical phenomena: A review. Appl. Opt. 2013, 52, 20–29. [Google Scholar] [CrossRef] [PubMed]
- Takeda, M.; Ina, H.; Kobayashi, S. Fourier-transform method of fringe-pattern analysis for computer-basedtopography and interferometry. J. Opt. Soc. Am. 1982, 72, 156–160. [Google Scholar] [CrossRef]
- Cui, H.K.; Wang, D.Y.; Wang, Y.X.; Zhao, J.; Zhang, Y.Z. Phase aberration compensation by spectrum centering in digital holographic microscopy. Opt. Commun. 2011, 284, 4152–4155. [Google Scholar] [CrossRef]
- Colomb, T.; Cuche, E.; Charrière, F.; Kühn, J.; Aspert, N.; Montfort, F.; Marquet, P.; Depeursinge, C. Automatic procedure for aberration compensation in digital holographic microscopy and applications to specimen shape compensation. Appl. Opt. 2006, 45, 851–863. [Google Scholar] [CrossRef] [PubMed]
- Fan, Q.; Yang, H.R.; Li, G.P.; Zhao, J.L. Suppressing carrier removal error in the Fourier transform method for interferogram analysis. J. Opt. 2010, 12, 115401. [Google Scholar] [CrossRef]
- Du, Y.Z.; Feng, G.Y.; Li, H.R.; Zhou, S.H. Accurate carrier-removal technique based on zero padding in fourier transform method for carrier interferogram analysis. Optik 2014, 125, 1056–1061. [Google Scholar] [CrossRef]
- Zhou, W.J.; Yu, Y.J.; Asundi, A. Study on aberration suppressing methods in digital micro-holography. Opt. Lasers Eng. 2009, 47, 264–270. [Google Scholar] [CrossRef]
- Mann, C.J.; Yu, L.F.; Lo, C.-M.; Kim, M.K. High-resolution quantitative phase-contrast microscopy by digital holography. Opt. Express 2005, 13, 8693–8698. [Google Scholar] [CrossRef] [PubMed]
- Choi, I.; Lee, K.; Park, Y. Compensation of aberration in quantitative phase imaging using lateral shifting and spiral phase integration. Opt. Express 2017, 25, 30771–30779. [Google Scholar] [CrossRef] [PubMed]
- Kühn, J.; Charrière, F.; Colomb, T.; Cuche, E.; Montfort, F.; Emery, Y.; Marquet, P.; Depeursinge, C. Axial sub-nanometer accuracy in digital holographic microscopy. Meas. Sci. Technol. 2008, 19, 184–187. [Google Scholar] [CrossRef]
- Colomb, T.; Kühn, J.; Charrière, F.; Depeursinge, C.; Marquet, P.; Aspert, N. Total aberrations compensation in digital holographic microscopy with a reference conjugated hologram. Opt. Express 2006, 14, 4300–4306. [Google Scholar] [CrossRef] [PubMed]
- Coppola, G.; Caprio, G.D.; Gioffré, M.; Puglisi, R.; Balduzzi, D.; Galli, A.; Miccio, L.; Paturzo, M.; Grilli, S.; Finizio, A.; et al. Digital self-referencing quantitative phase microscopy by wavefront folding in holographic image reconstruction. Opt. Lett. 2010, 35, 3390–3392. [Google Scholar] [CrossRef] [PubMed]
- Zhang, Y.Z.; Wang, D.Y.; Wang, Y.X.; Tao, S.Q. Automatic compensation of total phase aberrations in digital holographic biological imaging. Chin. Opt. Lett. 2011, 28, 114209. [Google Scholar] [CrossRef]
- Min, J.W.; Yao, B.L.; Gao, P.; Ma, B.H.; Yan, S.H.; Peng, F.; Zheng, J.J.; Ye, T.; Rupp, R. Wave-front curvature compensation of polarization phase-shifting digital holography. Optik 2012, 123, 1525–1529. [Google Scholar] [CrossRef]
- Miccio, L.; Alfieri, D.; Grilli, S.; Ferraro, P. Direct full compensation of the aberrations in quantitative phase microscopy of thin objects by a single digital hologram. Appl. Phys. Lett. 2007, 90, 041104. [Google Scholar] [CrossRef]
- Liu, Y.; Wang, Z.; Li, J.S.; Gao, J.M.; Huang, J.H. Total aberrations compensation for misalignment of telecentric arrangement in digital holographic microscopy. Opt. Eng. 2014, 53, 112307. [Google Scholar] [CrossRef]
- Seo, K.W.; Choi, Y.S.; Seo, E.S.; Lee, S.J. Aberration compensation for objective phase curvature in phase holographic microscopy. Opt. Lett. 2012, 37, 4976–4978. [Google Scholar] [CrossRef] [PubMed]
- Zuo, C.; Chen, Q.; Qu, W.J.; Asundi, A. Phase aberration compensation in digital holographic microscopy based on principal component analysis. Opt. Lett. 2013, 38, 1724–1726. [Google Scholar] [CrossRef] [PubMed]
- Sun, J.S.; Chen, Q.; Zhang, Y.Z.; Zuo, C. Optimal principal component analysis-based numerical phase aberration compensation method for digital holography. Opt. Lett. 2016, 41, 1293–1296. [Google Scholar] [CrossRef] [PubMed]
- Nguyen, T.; Bui, V.; Lam, V.; Raub, C.B.; Chang, L.-C.; Nehmetallah, G. Automatic phase aberration compensation for digital holographic microscopy based on deep learning background detection. Opt. Express 2017, 25, 15043–15057. [Google Scholar] [CrossRef] [PubMed]
- Dubois, F.; Requena, M.L.; Minetti, C.; Monnom, O.; Lstasse, E. Partial spatial coherence effects in digital holographic microscopy with a laser source. Appl. Opt. 2004, 43, 1131–1139. [Google Scholar] [CrossRef] [PubMed]
- Dubois, F.; Callens, N.; Yourassowsky, C.; Hoyos, M.; Kurowski, P.; Monnom, O. Digital holographic microscopy with reduced spatial coherence for three-dimensional particle flow analysis. Appl. Opt. 2006, 45, 864–871. [Google Scholar] [CrossRef] [PubMed]
- Alexandrov, S.A.; Hillman, T.R.; Gutzler, T.; Sampson, D.D. Synthetic Aperture Fourier Holographic Optical Microscopy. Phys. Rev. Lett. 2006, 97, 168102. [Google Scholar] [CrossRef] [PubMed]
- Lee, K.; Kim, H.-D.; Kim, K.; Kim, Y.; Hillman, T.R.; Min, B.; Park, Y. Synthetic Fourier transform light scattering. Opt. Express 2013, 21, 22453–22463. [Google Scholar] [CrossRef] [PubMed]
- Choi, Y.; Yang, T.D.; Lee, K.J.; Choi, W. Full-field and single-shot quantitative phase microscopy using dynamic speckle illumination. Opt. Lett. 2011, 36, 2465–2467. [Google Scholar] [CrossRef] [PubMed]
- Farrokhi, H.; Boonruangkan, J.; Chun, B.J.; Rohith, T.M.; Mishra, A.; Toh, H.T.; Yoon, H.S.; Kim, Y.-J. Speckle reduction in quantitative phase imaging by generating spatially incoherent laser field at electroactive optical diffusers. Opt. Express 2017, 25, 10791–10800. [Google Scholar] [CrossRef] [PubMed]
- Massatsch, P.; Charrière, F.; Cuche, E.; Marquet, P.; Depeursinge, C.D. Time-domain optical coherence tomography with digital holographic microscopy. Appl. Opt. 2005, 44, 1806–1812. [Google Scholar] [CrossRef] [PubMed]
- Shin, S.; Kim, Y.; Lee, K.; Kim, K.; Kim, Y.-J.; Park, H.; Park, Y. Common-path diffraction optical tomography with a low-coherence illumination for reducing speckle noise. In Proceedings of the Quantitative Phase Imaging, San Francisco, CA, USA, 7–12 February 2015; Volume 9336. [Google Scholar]
- Ding, H.; Popescu, G. Instantaneous spatial light interference microscopy. Opt. Express 2010, 18, 1569–1575. [Google Scholar] [CrossRef] [PubMed]
- Bhaduri, B.; Pham, H.; Mir, M.; Popescu, G. Diffraction phase microscopy with white light. Opt. Lett. 2012, 37, 1094–1096. [Google Scholar] [CrossRef] [PubMed]
- Bhaduri, B.; Tangella, K.; Popescu, G. Fourier phase microscopy with white light. Biomed. Opt Express 2013, 4, 1434–1441. [Google Scholar] [CrossRef] [PubMed]
- León-Rodríguez, M.; Rodríguez-Vera, R.; Rayas, J.A.; Calixto, S. High topographical accuracy by optical shot noise reduction in digital holographic microscopy. J. Opt. Soc. Am. A 2012, 29, 498–506. [Google Scholar] [CrossRef] [PubMed]
- Garcia-Sucerquia, J. Noise reduction in digital lensless holographic microscopy by engineering the light from a light-emitting diode. Appl. Opt. 2013, 52, 232–239. [Google Scholar] [CrossRef] [PubMed]
- Agour, M.; Klattenhoff, R.; Falldorf, C.; Bergmann, R.B. Speckle noise reduction in single-shot holographic two-wavelength contouring. In Proceedings of the Holography: Advances and Modern Trends V, Prague, Czech Republic, 24–27 April 2017; Volume 10233. [Google Scholar]
- Poon, T.-C.; Korpel, A. Optical transfer function of an acousto-optic heterodyning image processor. Opt. Lett. 1979, 4, 317–319. [Google Scholar] [CrossRef] [PubMed]
- Ou, H.; Poon, T.-C.; Wong, K.K.Y.; Lam, E.Y. Enhanced depth resolution in optical scanning holography using a configurable pupil. Photonics Res. 2014, 2, 64–70. [Google Scholar] [CrossRef]
- Liu, J.-P.; Luo, D.-Z.; Lu, S.-H. Spatial-temporal demodulation technique for heterodyne optical scanning holography. Opt. Lasers Eng. 2015, 68, 42–49. [Google Scholar] [CrossRef]
- Chen, N.; Ren, Z.; Ou, H.; Lam, E.Y. Resolution enhancement of optical scanning holography with a spiral modulated point spread function. Photonics Res. 2016, 4, 1–6. [Google Scholar] [CrossRef]
- Rosen, J.; Brooker, G. Digital spatially incoherent Fresnel holography. Opt. Lett. 2007, 32, 912–914. [Google Scholar] [CrossRef] [PubMed]
- Bouchal, P.; Kapitán, J.; Chmelík, R.; Bouchal, Z. Point spread function and two-point resolution in Fresnel incoherent correlation holography. Opt. Express 2011, 19, 15603–15620. [Google Scholar] [CrossRef] [PubMed]
- Kelner, R.; Rosen, J.; Brooker, G. Enhanced resolution in Fourier incoherent single channel holography (FISCH) with reduced optical path difference. Opt. Express 2013, 21, 20131–20144. [Google Scholar] [CrossRef] [PubMed]
- Vijayakumar, A.; Kashter, Y.; Kelner, R.; Rosen, J. Coded aperture correlation holography—A new type of incoherent digital holograms. Opt. Express 2016, 24, 12430–12441. [Google Scholar] [CrossRef] [PubMed]
- Liu, J.-P.; Tahara, T.; Hayasaki, Y.; Poon, T.-C. Incoherent digital holography: A review. Appl. Sci. 2018, 8, 143. [Google Scholar] [CrossRef]
- Quan, C.; Tay, C.J. Speckle noise reduction in digital holography by multiple holograms. Opt. Eng. 2007, 46, 115801. [Google Scholar] [CrossRef]
- Xiao, W.; Zhang, J.; Rong, L.; Pan, F.; Liu, S.; Wang, F.J.; He, A.X. Improvement of speckle noise suppression in digital holography by rotating linear polarization state. Chin. Opt. Lett. 2011, 9, 36–38. [Google Scholar]
- Garcia-Sucerquia, J.; Ramírez, J.H.; Castaneda, R. Incoherent recovering of the spatial resolution in digital holography. Opt. Commun. 2006, 260, 62–67. [Google Scholar] [CrossRef]
- Kubota, S.; Goodman, J.W. Very efficient speckle contrast reduction realized by moving diffuser device. Appl. Opt. 2010, 49, 4385–4391. [Google Scholar] [CrossRef] [PubMed]
- Pan, F.; Xiao, W.; Liu, S.; Wang, F.J.; Rong, L.; Li, R. Coherent noise reduction in digital holographic phase contrast microscopy by slightly shifting object. Opt. Express 2011, 19, 3862–3869. [Google Scholar] [CrossRef] [PubMed]
- Baumbach, T.; Kolenovic, E.; Kebbel, V.; Jüptner, W. Improvement of accuracy in digital holography by use of multiple holograms. Appl. Opt. 2006, 45, 6077–6085. [Google Scholar] [CrossRef] [PubMed]
- Pan, F.; Xiao, W.; Liu, S.; Rong, L. Coherent noise reduction in digital holographic microscopy by laterally shifting camera. Opt. Commun. 2013, 292, 68–72. [Google Scholar] [CrossRef]
- Herrera-Ramirez, J.; Hincapie-Zuluaga, D.A.; Garcia-Sucerquia, J. Speckle noise reduction in digital holography by slightly rotating the object. Opt. Eng. 2016, 55, 121714. [Google Scholar] [CrossRef]
- Sharma, A.; Sheoran, G.; Jaffery, Z.A.; Moinuddin. Improvement of signal-to-noise ratio in digital holography using wavelet transform. Opt. Lasers Eng. 2008, 46, 42–47. [Google Scholar] [CrossRef]
- Cai, X.O. Reduction of speckle noise in the reconstructed image of digital holography. Optik 2010, 121, 394–399. [Google Scholar] [CrossRef]
- Maycock, J.; Hennelly, B.M.; Mcdonald, J.B.; Frauel, Y.; Castro, A.; Javidi, B.; Naughton, T.J. Reduction of speckle in digital holography by discrete fourier filtering. J. Opt. Soc. Am. A 2007, 24, 1617–1622. [Google Scholar] [CrossRef]
- Abolhassani, M.; Rostami, Y. Speckle noise reduction by division and digital processing of a hologram. Optik 2012, 123, 937–939. [Google Scholar] [CrossRef]
- Leportier, T.; Park, M.-C. Filter for speckle noise reduction based on compressive sensing. Opt. Eng. 2016, 55, 121724. [Google Scholar] [CrossRef]
- Morimoto, Y.; Matui, T.; Fujigaki, M.; Kawagishi, N. Subnanometer displacement measurement by averaging of phase difference in windowed digital holographic interferometry. Opt. Eng. 2007, 46, 025603. [Google Scholar] [CrossRef]
- Hincapie, D.; Herrera-Ramírez, J.; Garcia-Sucerquia, J. Single-shot speckle reduction in numerical reconstruction of digitally recorded holograms. Opt. Lett. 2015, 40, 1623–1626. [Google Scholar] [CrossRef] [PubMed]
- Fukuoka, T.; Mori, Y.; Nomura, T. Speckle reduction by spatial-domain mask in digital holography. J. Disp. Technol. 2016, 12, 315–322. [Google Scholar] [CrossRef]
- Liu, Y.; Wang, Z.; Huang, J.H.; Gao, J.M.; Li, J.S.; Zhang, Y.; Li, X.M. Coherent noise reduction of reconstruction of digital holographic microscopy using a laterally shifting hologram aperture. Opt. Eng. 2016, 55, 121725. [Google Scholar] [CrossRef]
Figure 1.
Schematic of digital holography (DH) pre-amplification configuration.

Figure 2.
Procedure of spectrum centering in the spectrum translation method. (a) Initial filtered spectrum; (b) Spectrum centered; (c) Spectrum of a hologram for which the curvatures of the reference and object waves were different, inducing a nonpunctual central frequency in the spectrum. (Reproduced with permission from [23], Copyright OSA publishing, 2006).

Figure 3.
Principle of argument judgment method. (a) Hologram of the cervical carcinoma cells; (b) Modulus image; (c) Argument image;(d) Three-dimensional argument distribution of the hologram spectra. (Reproduced with permission from [59], Copyright Elsevier publishing, 2011).
Figure 3.
Principle of argument judgment method. (a) Hologram of the cervical carcinoma cells; (b) Modulus image; (c) Argument image;(d) Three-dimensional argument distribution of the hologram spectra. (Reproduced with permission from [59], Copyright Elsevier publishing, 2011).

Figure 4.
Principles of the shift differential method. (a) Region selection for conventional background subtraction method and shift differential method; (b) Phase image of a sample region; (c) Aberration image obtained from the background phase image; (d) Improved phase image, which is the subtraction of the aberration image from the phase image; (e) Horizontal shift differential phase image; (f) Vertical shift differential phase image; (g) Phase image retrieved from the spiral phase integration of differential phase images. (Reproduced with permission from [65], Copyright OSA publishing, 2017).

Figure 5.
Schematic of the Digital holographic microscopy (DHM) configuration where the same microscope objectives (MOs) are inserted in two branches.
Figure 5.
Schematic of the Digital holographic microscopy (DHM) configuration where the same microscope objectives (MOs) are inserted in two branches.

Figure 6.
Schematic of the DHM telecentric arrangement.

Figure 7.
Schematic of the generation of sub-holograms in the single-shot speckle reduction approach. (Reproduced with permission from [114], Copyright OSA publishing, 2015).
Figure 7.
Schematic of the generation of sub-holograms in the single-shot speckle reduction approach. (Reproduced with permission from [114], Copyright OSA publishing, 2015).

Figure 8.
Results of the single-shot speckle reduction approach. (a) S = 1 sub-hologram; (b) S = 4 sub-holograms; (c) S = 9 sub-holograms; (d) S = 16 sub-holograms. (Reproduced with permission from [114], Copyright OSA publishing, 2015).
Figure 8.
Results of the single-shot speckle reduction approach. (a) S = 1 sub-hologram; (b) S = 4 sub-holograms; (c) S = 9 sub-holograms; (d) S = 16 sub-holograms. (Reproduced with permission from [114], Copyright OSA publishing, 2015).


Table 1.
Comparison of phase aberration compensation methods.
| Method | Advantage | Limitation |
|---|---|---|
| Double exposure method [22,63,65] | Compensating aberrations in optical components | Recording two holograms |
| Two MOs compensation method in two branches [25,26,29,64] | Compensating quadratic phase aberration | Precisely adjusting the distance between MO and CCD |
| Compensation method in telecentric arrangement [28,30] | Compensating quadratic phase aberration | precise adjustment of the distance between MO and collimated lens |
| Phase mask method [22,26,60] | Compensating aberrations set by mask | Requiring the sample-free blank region |
| Surface fitting method for a blank area [23,60,70] | Compensating aberrations set by polynomials | Requiring identical distortion in the total phase |
| Surface fitting method for a total reconstructed phase [69,71,72] | Compensating aberrations set by polynomials | Affection by sample’s topographic distribution |
| Reference conjugated hologram method [66,67,68] | Compensating aberrations set by polynomials | Requiring the sample-free blank region |
Table 2.
Comparison of coherent noise suppression methods.
| Method | Advantage | Limitation |
|---|---|---|
| Low spatial or temporal coherent source method [77,78,79,80,81,82,83,84,85,86,87,88,89,90] | Recording one hologram | Increasing the adjustment difficulty of light configuration |
| OSH method [91,92,93,94] | Higher signal-to-noise ratio | Complicated setup and slower recording speed |
| FINCH method [95,96,97,98] | Higher signal-to-noise ratio and dynamic measurement | Larger bias buildup for complicated objects |
| Multiplexing holograms method [33,35,100,101,102,103,104,105,106,107] | Uncorrelated holograms obtained by different ways | Recording multiple holograms |
| Digital processing method [31,108,109,110,111,112,113,114,115,116] | Recording one hologram | Loss of spatial resolution |
© 2018 by the authors. Licensee MDPI, Basel, Switzerland. This article is an open access article distributed under the terms and conditions of the Creative Commons Attribution (CC BY) license (http://creativecommons.org/licenses/by/4.0/).
Share and Cite
MDPI and ACS Style
Liu, Y.; Wang, Z.; Huang, J. Recent Progress on Aberration Compensation and Coherent Noise Suppression in Digital Holography. Appl. Sci. 2018, 8, 444. https://doi.org/10.3390/app8030444
AMA Style
Liu Y, Wang Z, Huang J. Recent Progress on Aberration Compensation and Coherent Noise Suppression in Digital Holography. Applied Sciences. 2018; 8(3):444. https://doi.org/10.3390/app8030444
Chicago/Turabian StyleLiu, Yun, Zhao Wang, and Junhui Huang. 2018. "Recent Progress on Aberration Compensation and Coherent Noise Suppression in Digital Holography" Applied Sciences 8, no. 3: 444. https://doi.org/10.3390/app8030444
Note that from the first issue of 2016, this journal uses article numbers instead of page numbers. See further details here.